Green Preparation of Nanoporous Pyrrhotite by Thermal Treatment of Pyrite as an Effective Hg(Ⅱ) Adsorbent: Performance and Mechanism

Abstract
1. Introduction
2. Experimental Procedure
2.1. Sample Preparation
2.2. Characterization
2.3. Batch Experiments
3. Results and Discussion
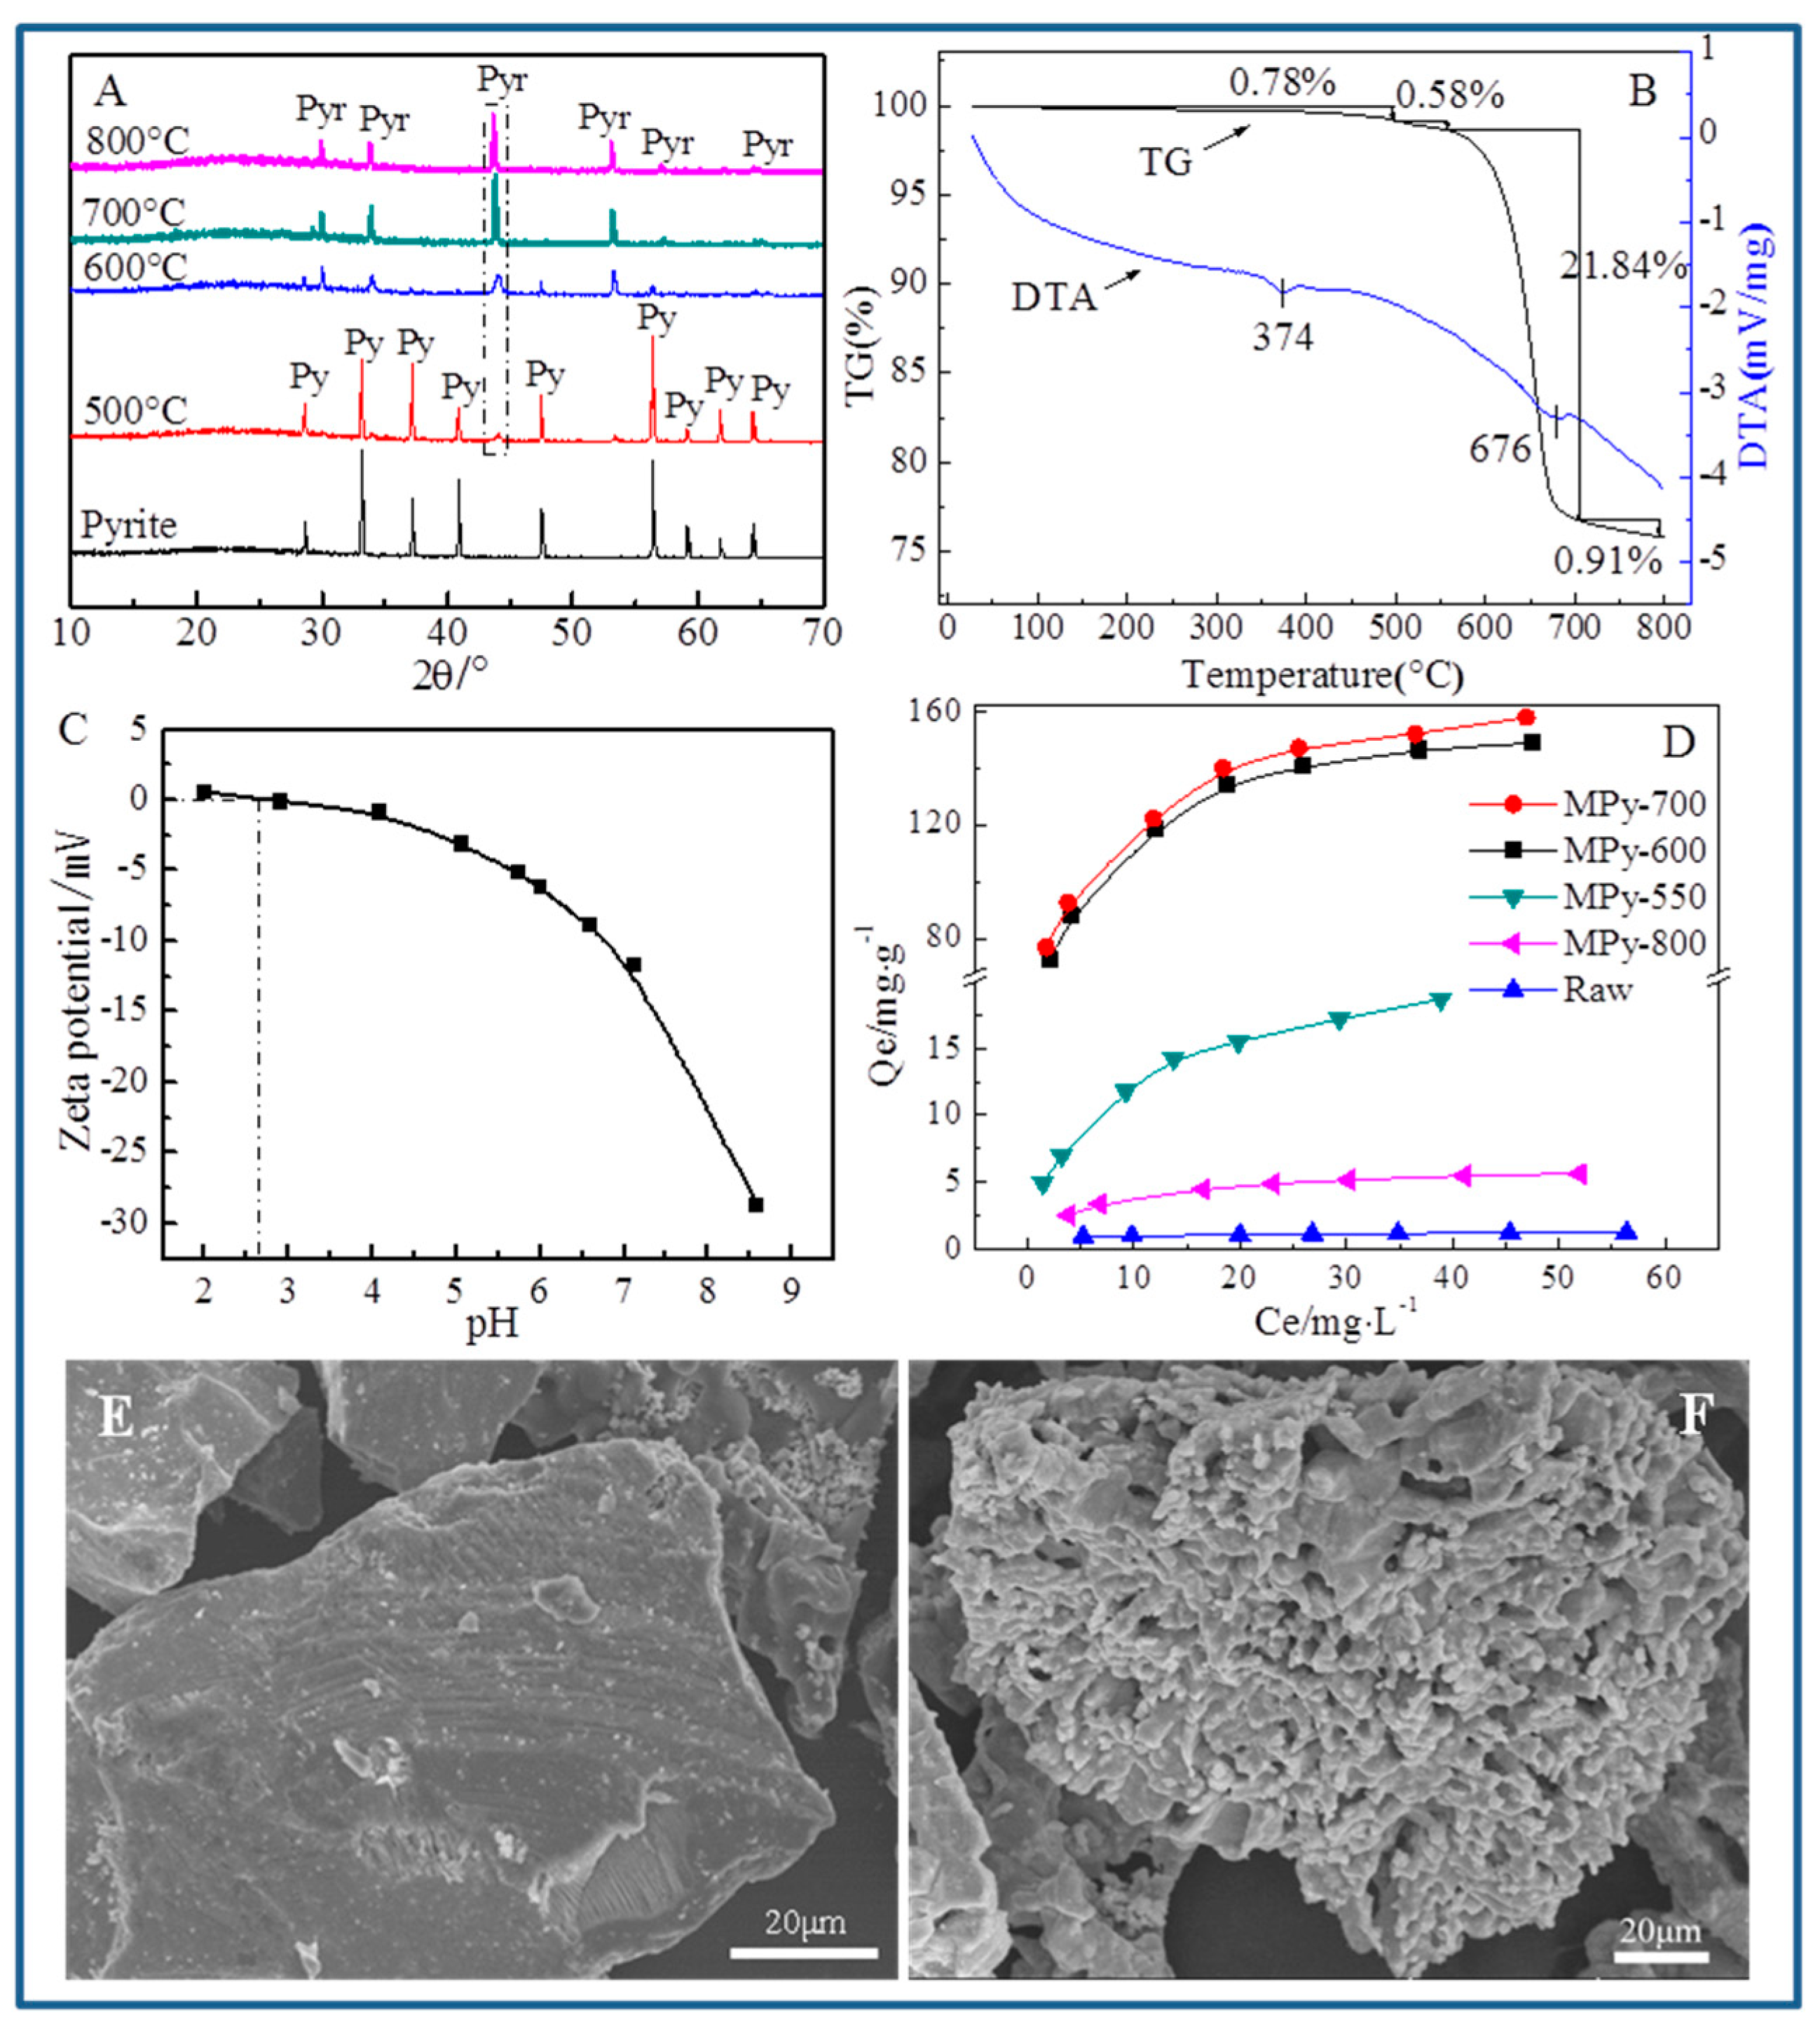
3.1. Characterization of Naturally Derived Pyrrhotite
3.2. Adsorption Isotherms
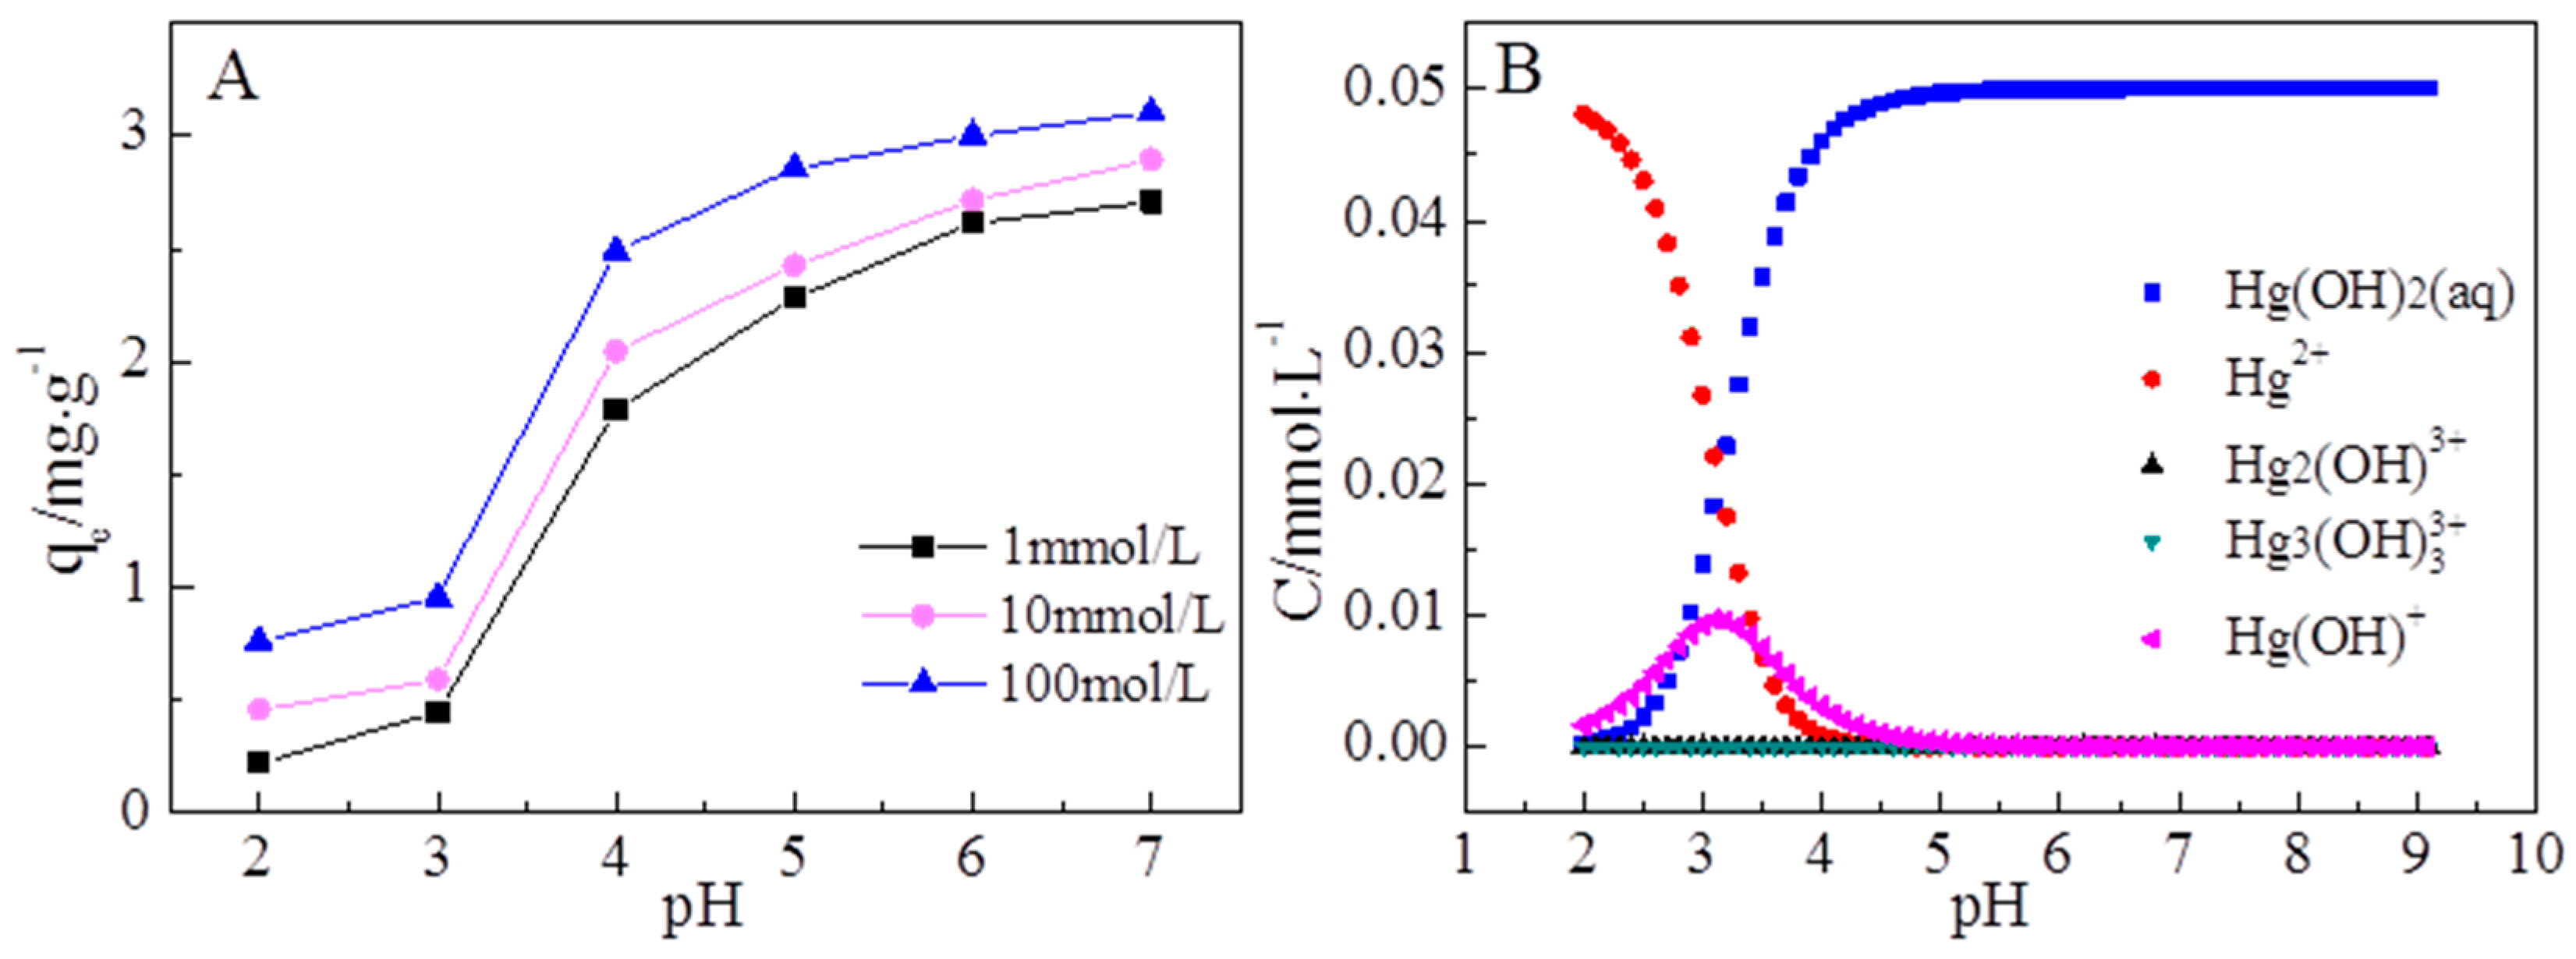
3.3. The Effects of pH and Ionic Strength
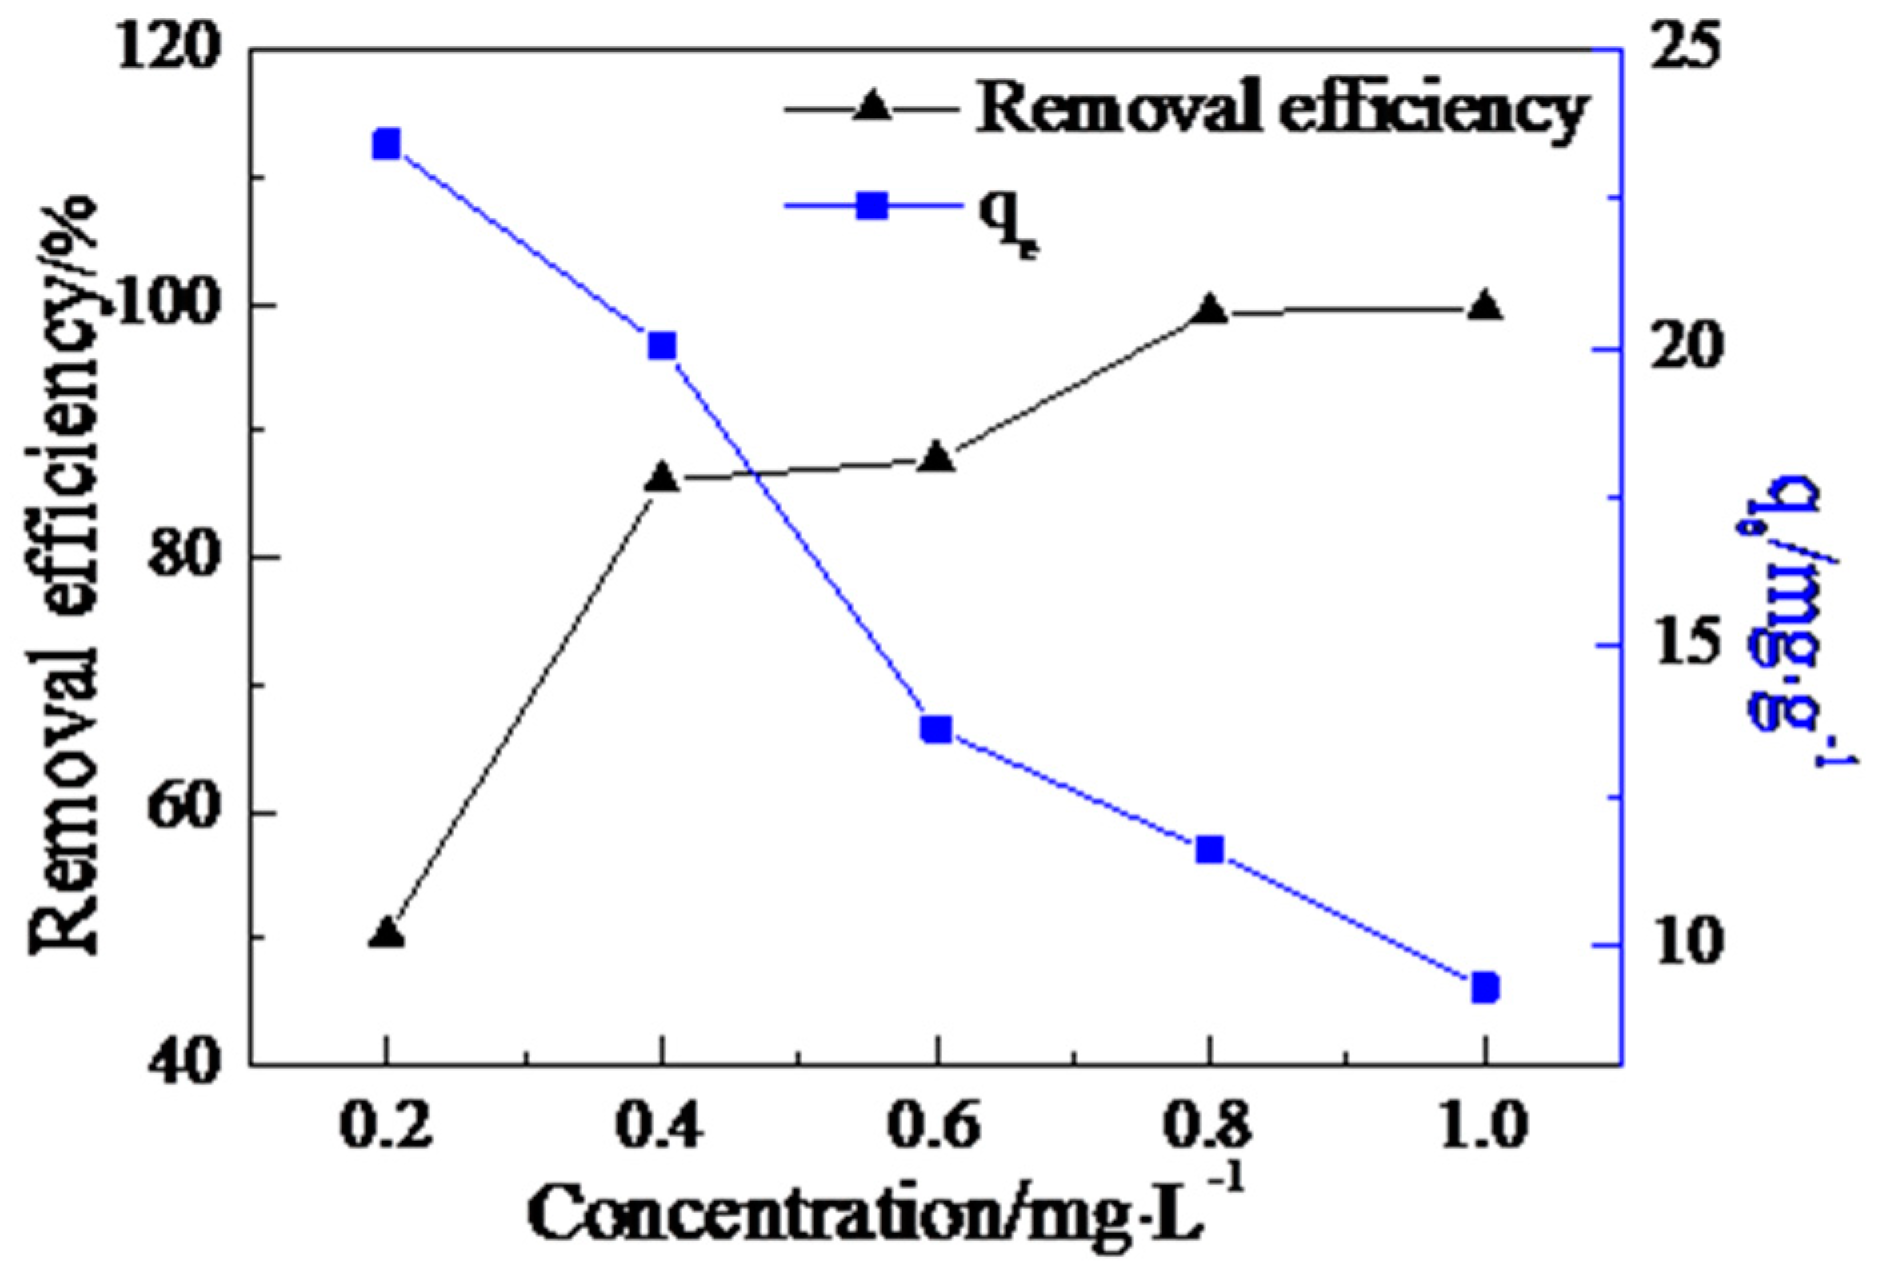
3.4. The Effect of the AdsorbentDose
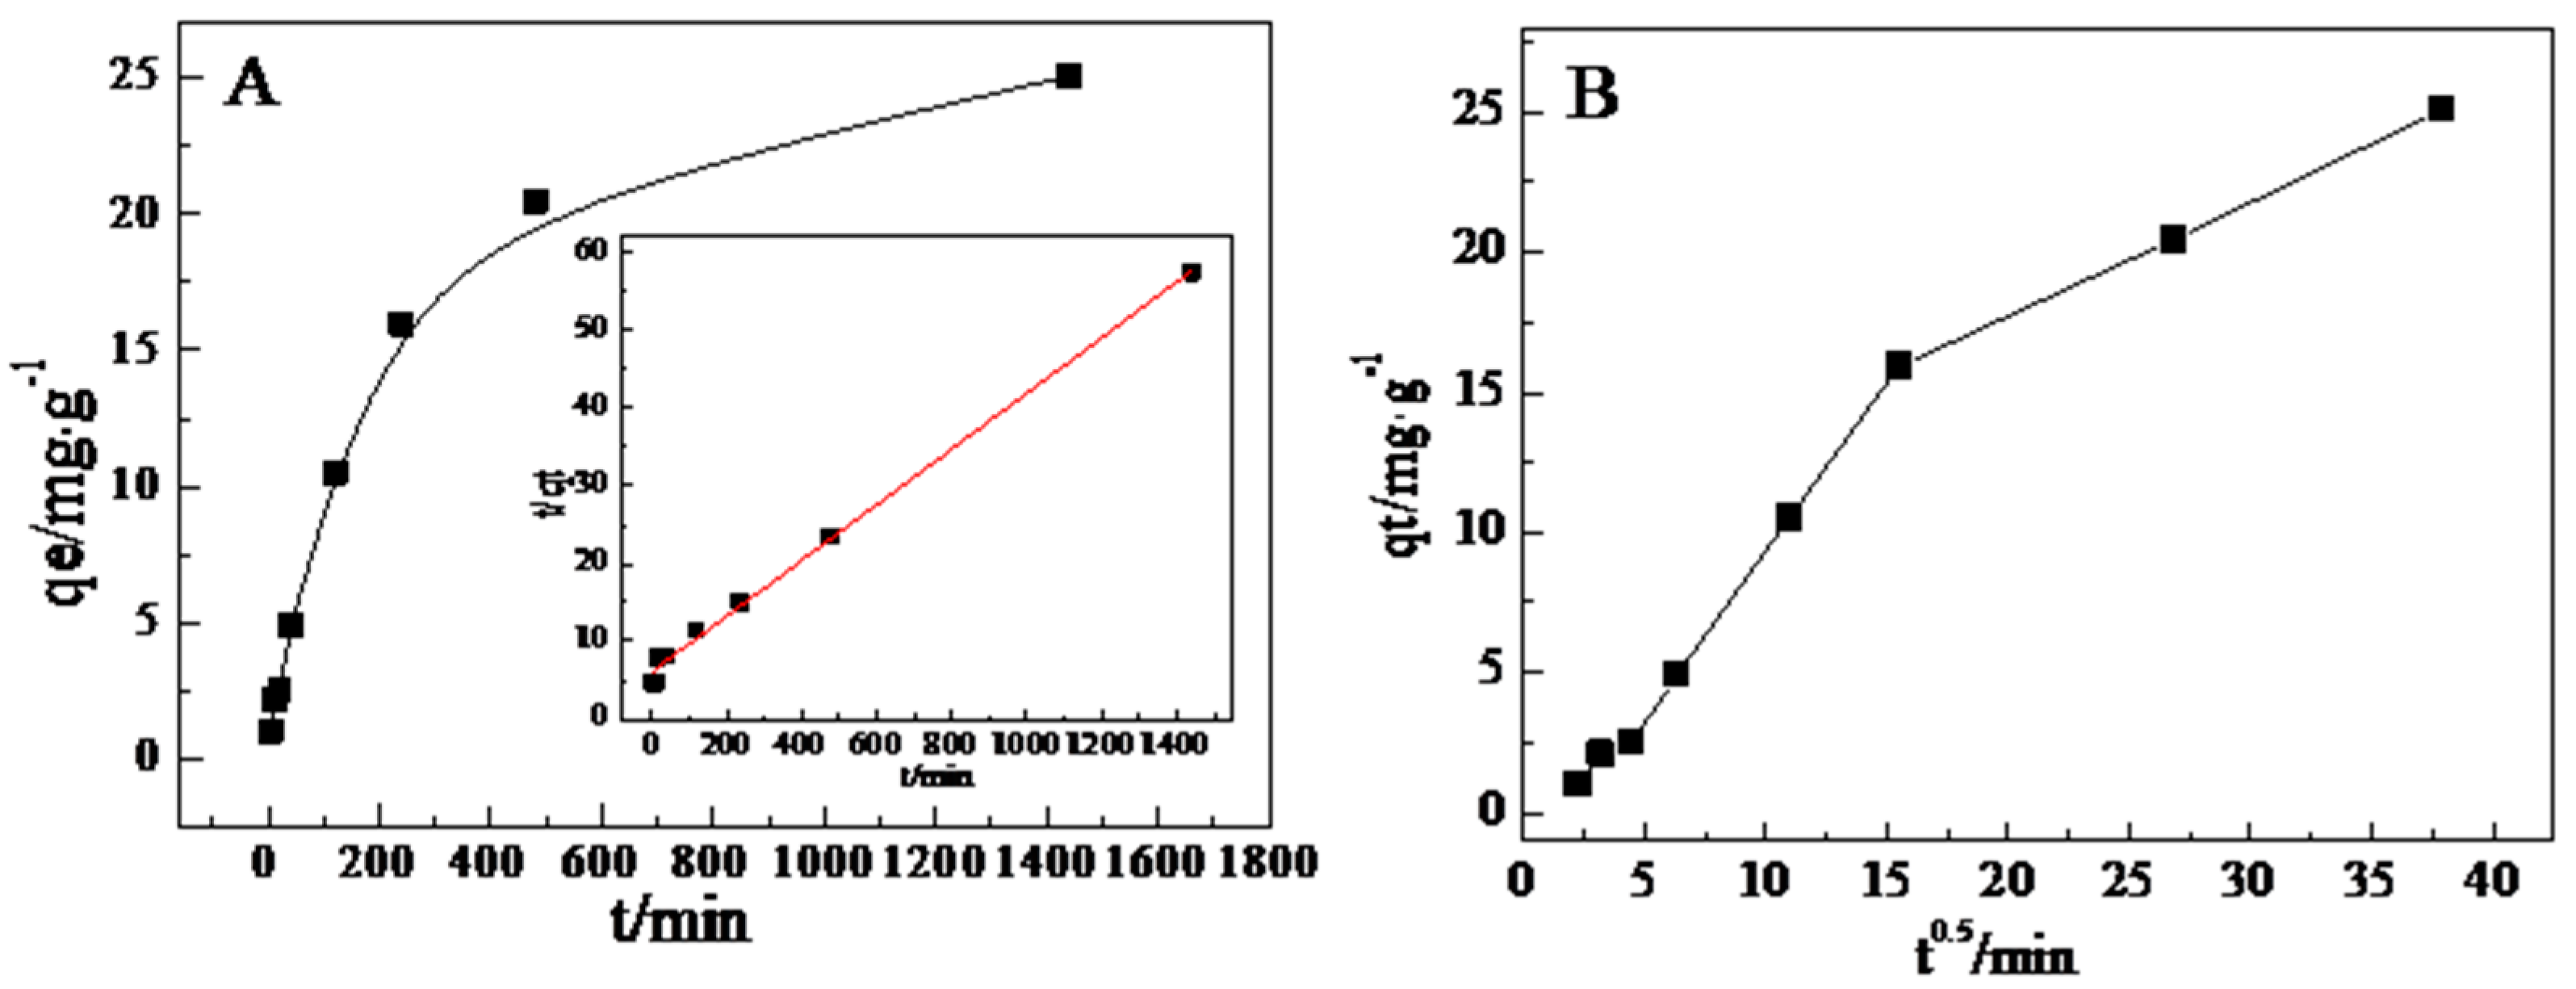
3.5. Adsorption Kinetics
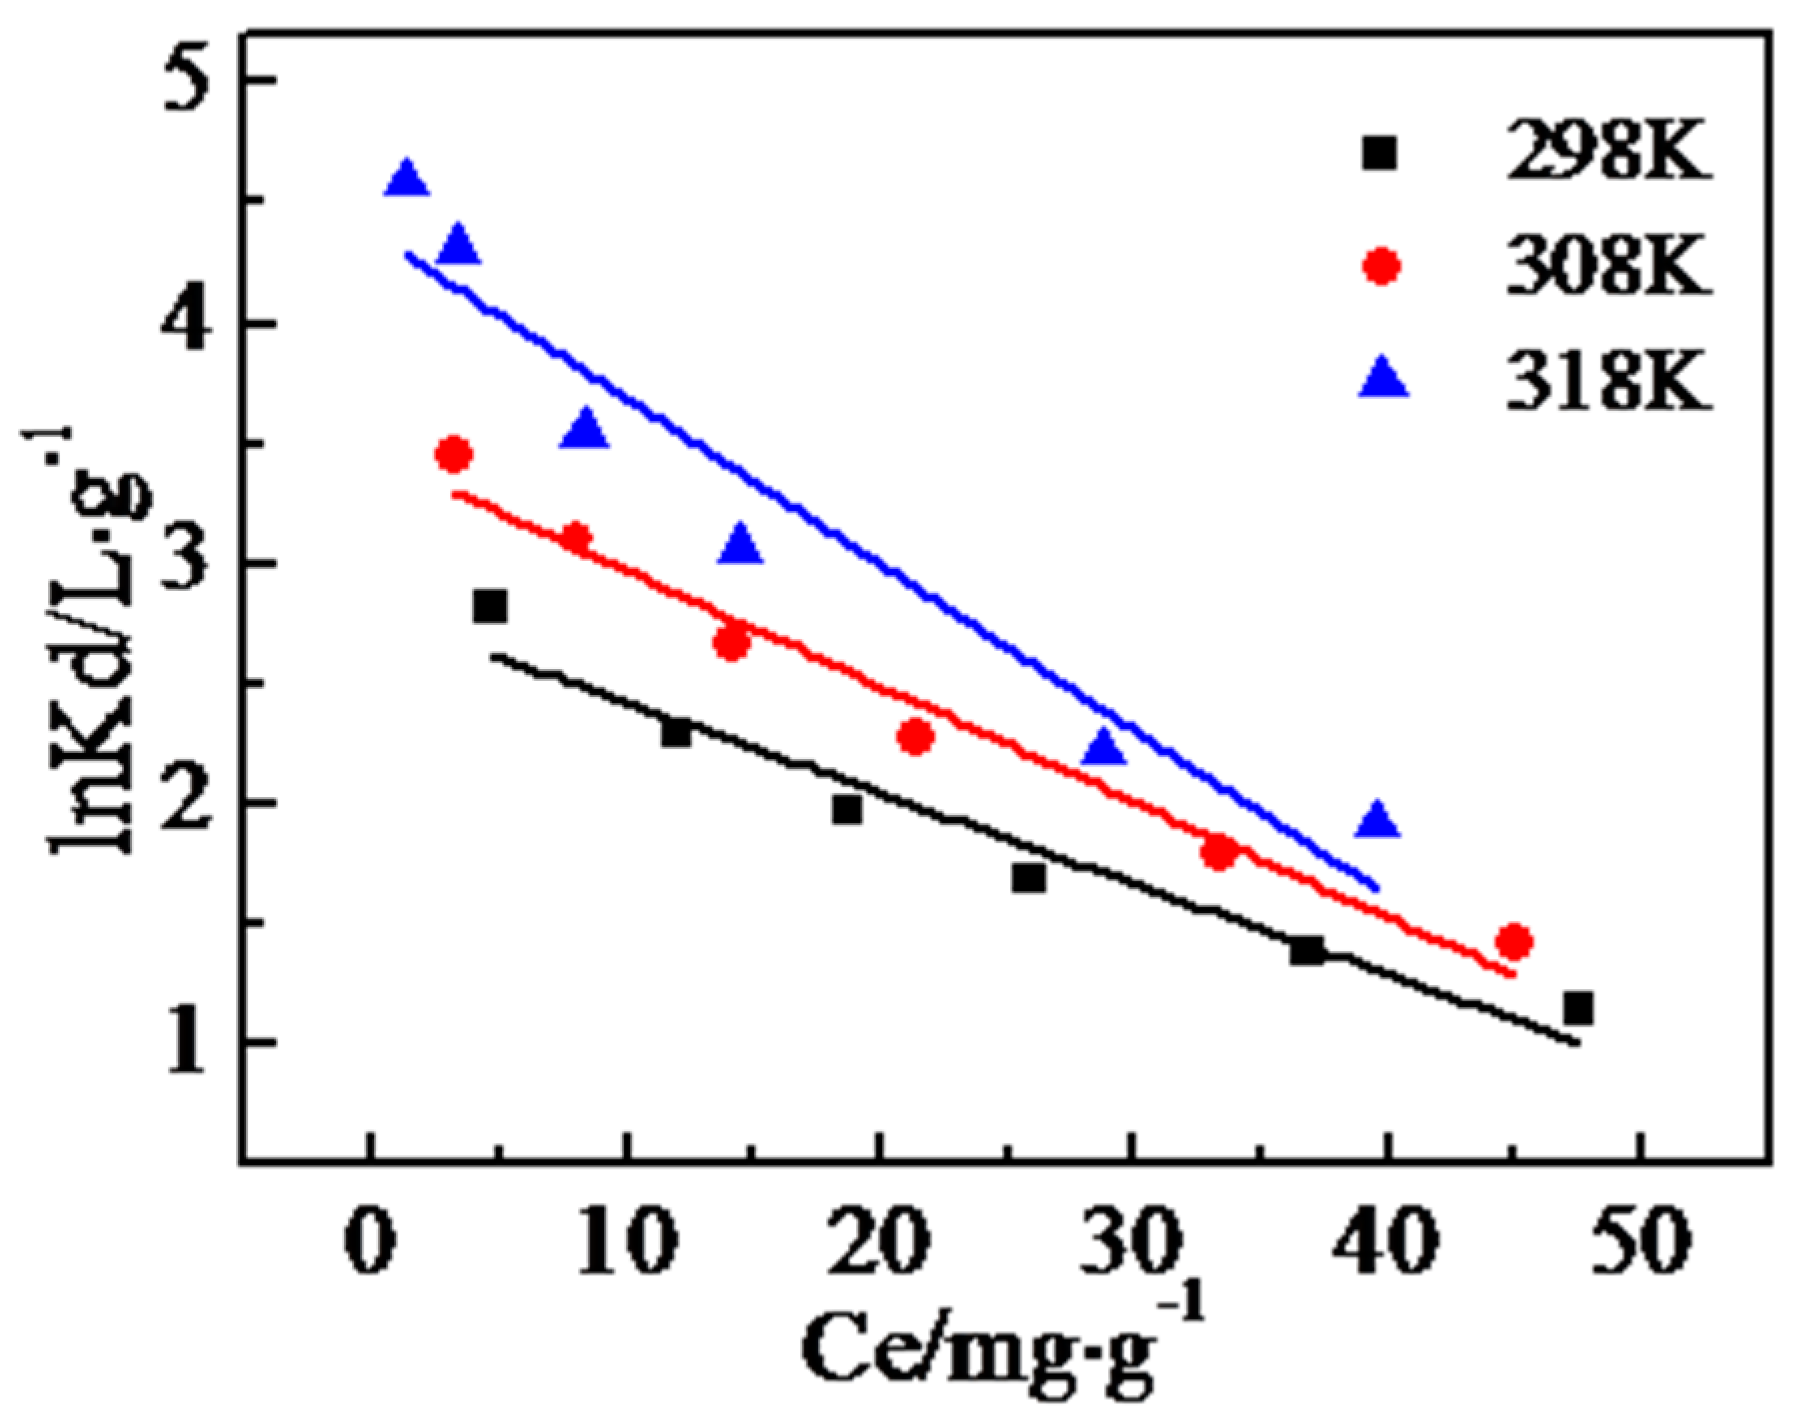
3.6. Thermodynamics
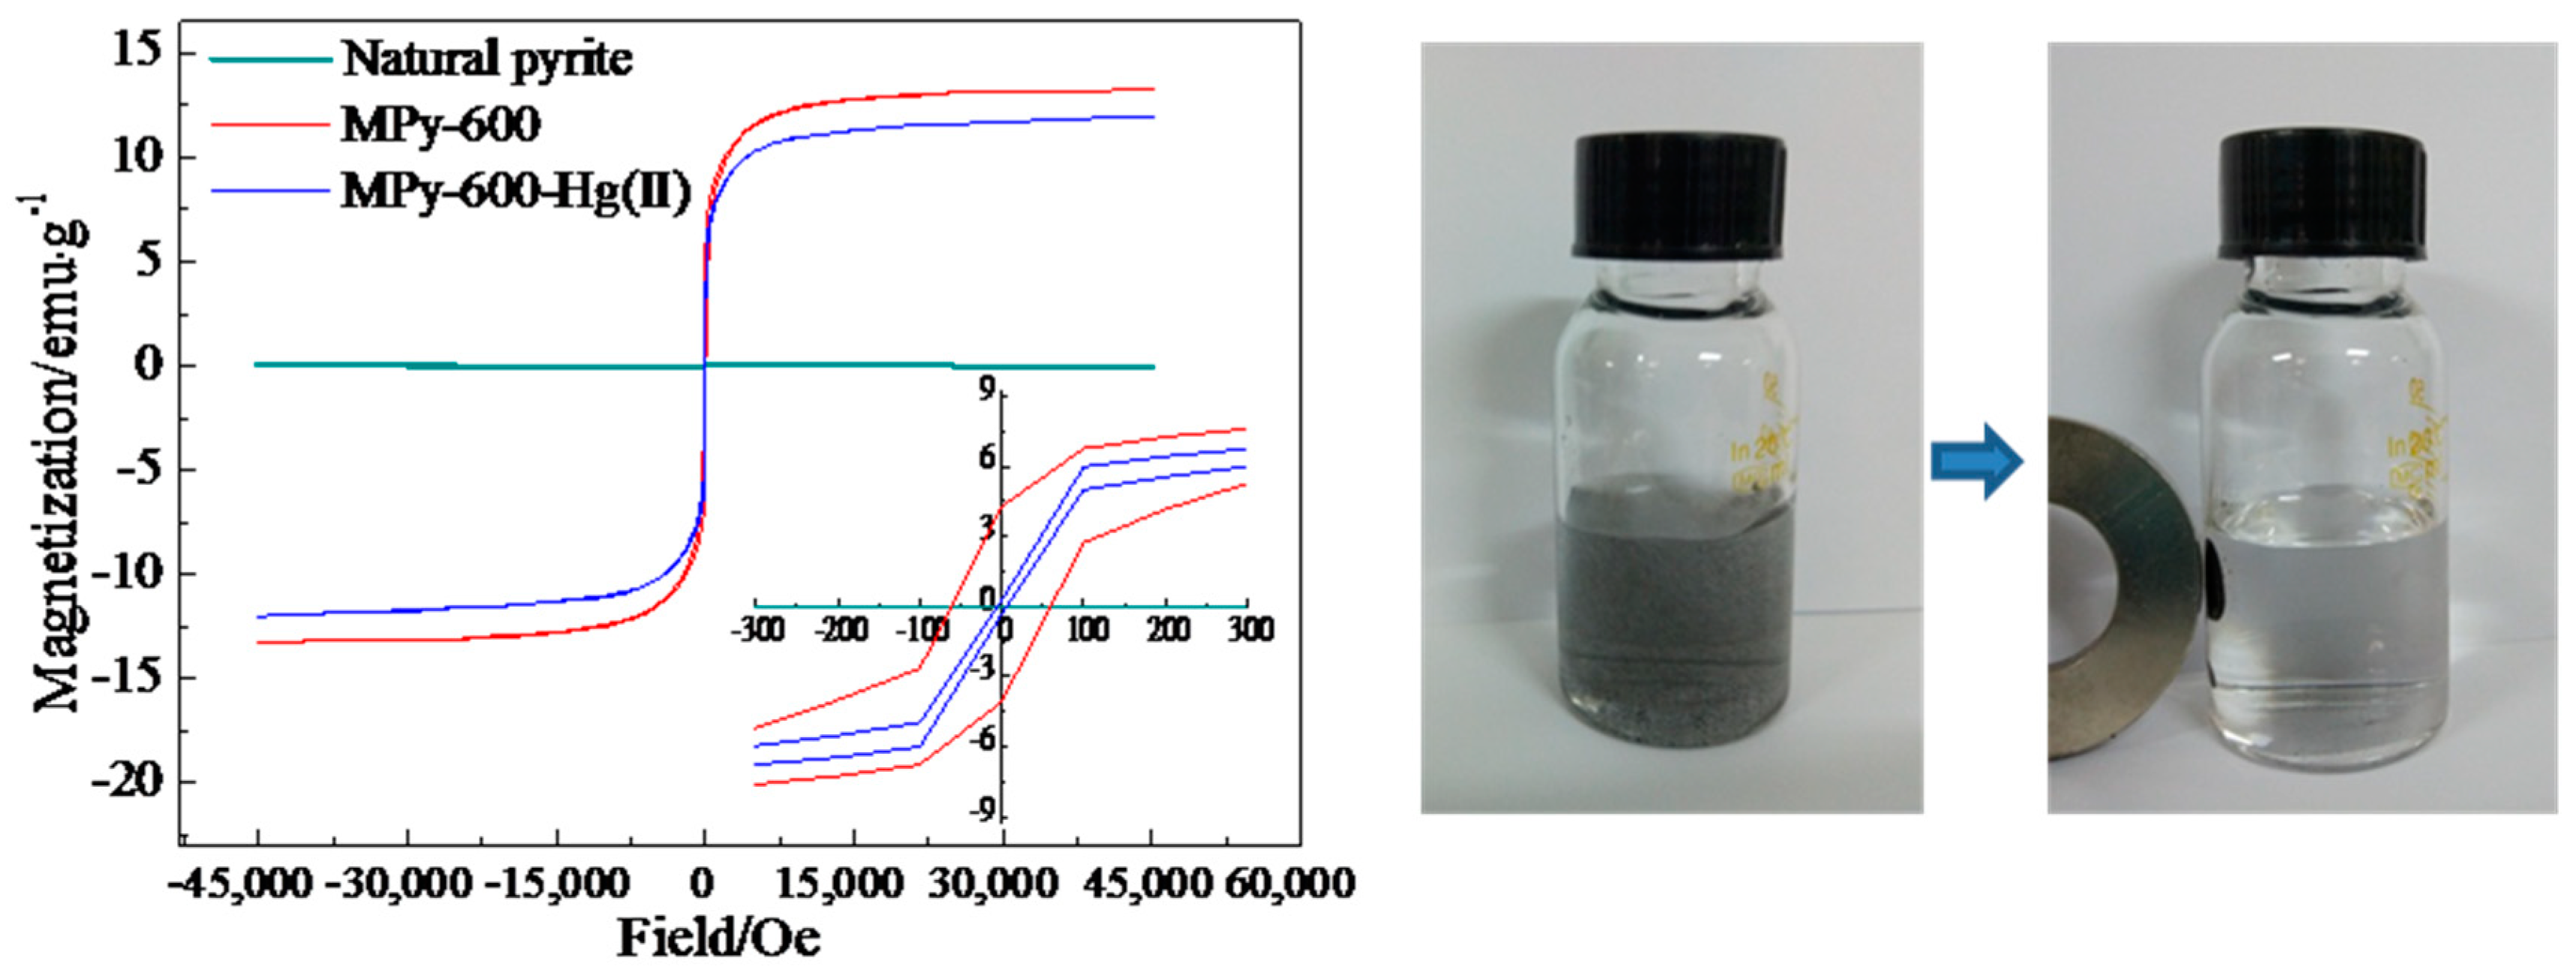
3.7. Magnetization
3.8. Adsorption Mechanism
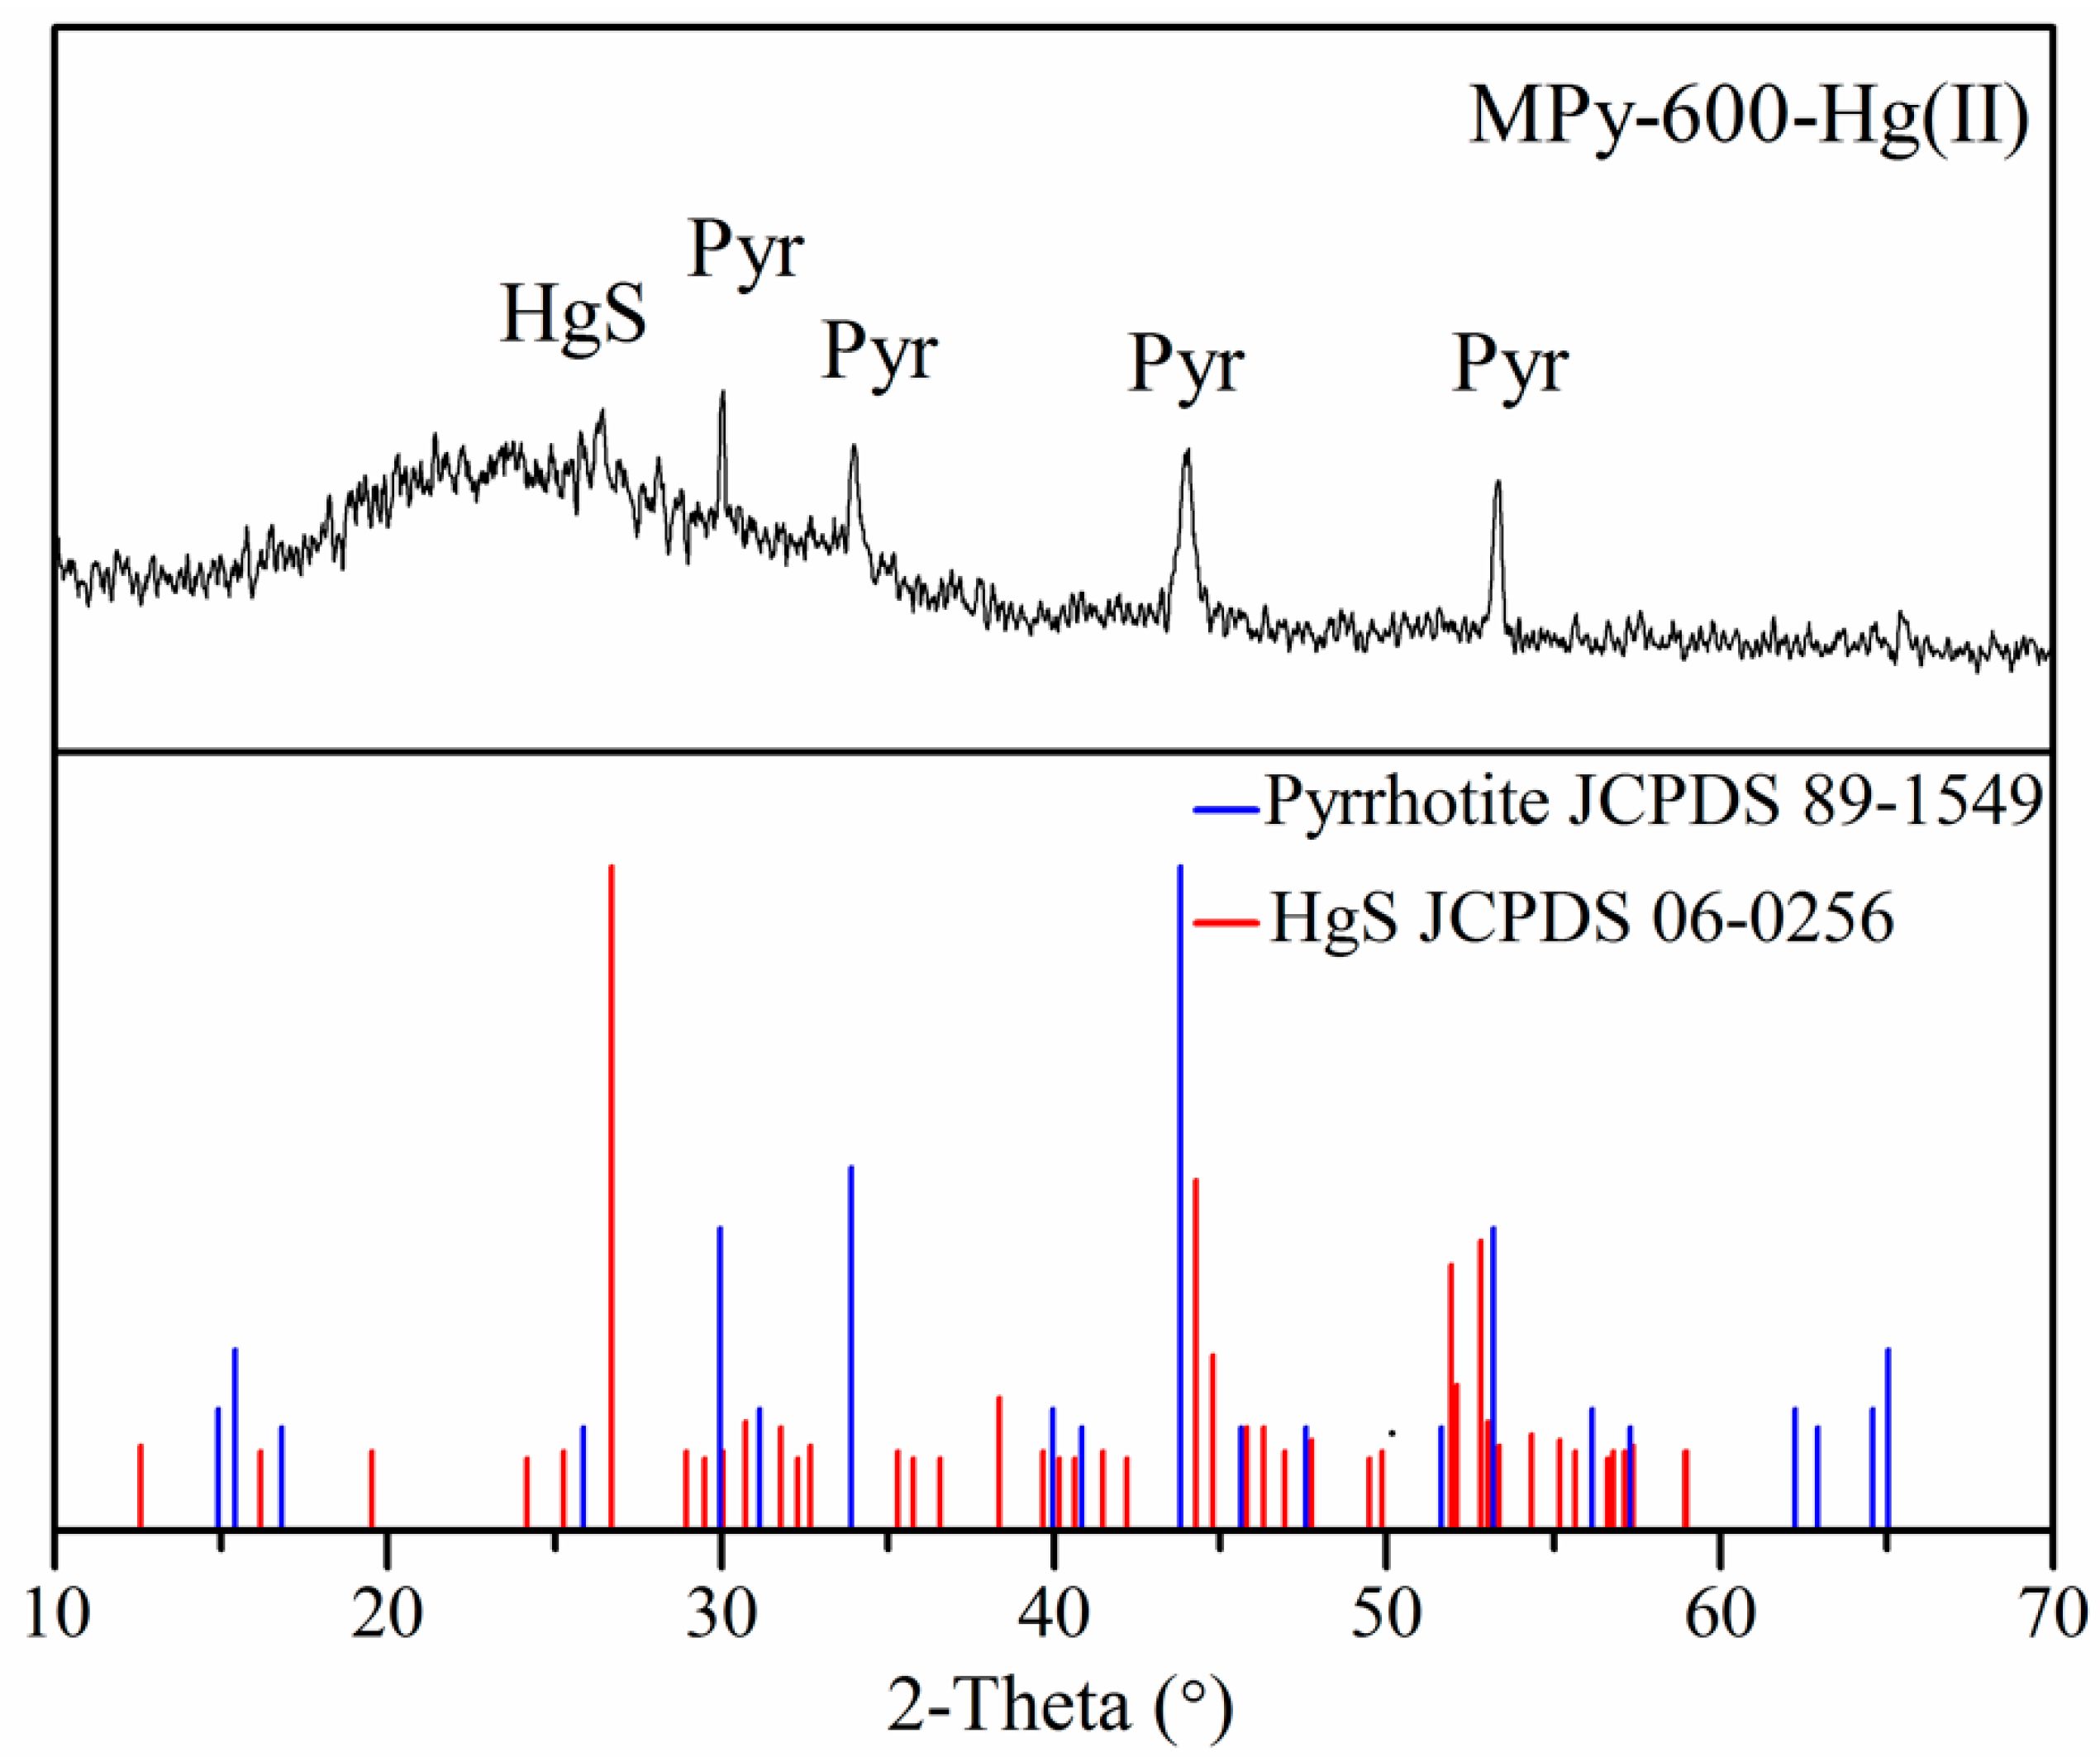
3.8.1. XRD Analyses
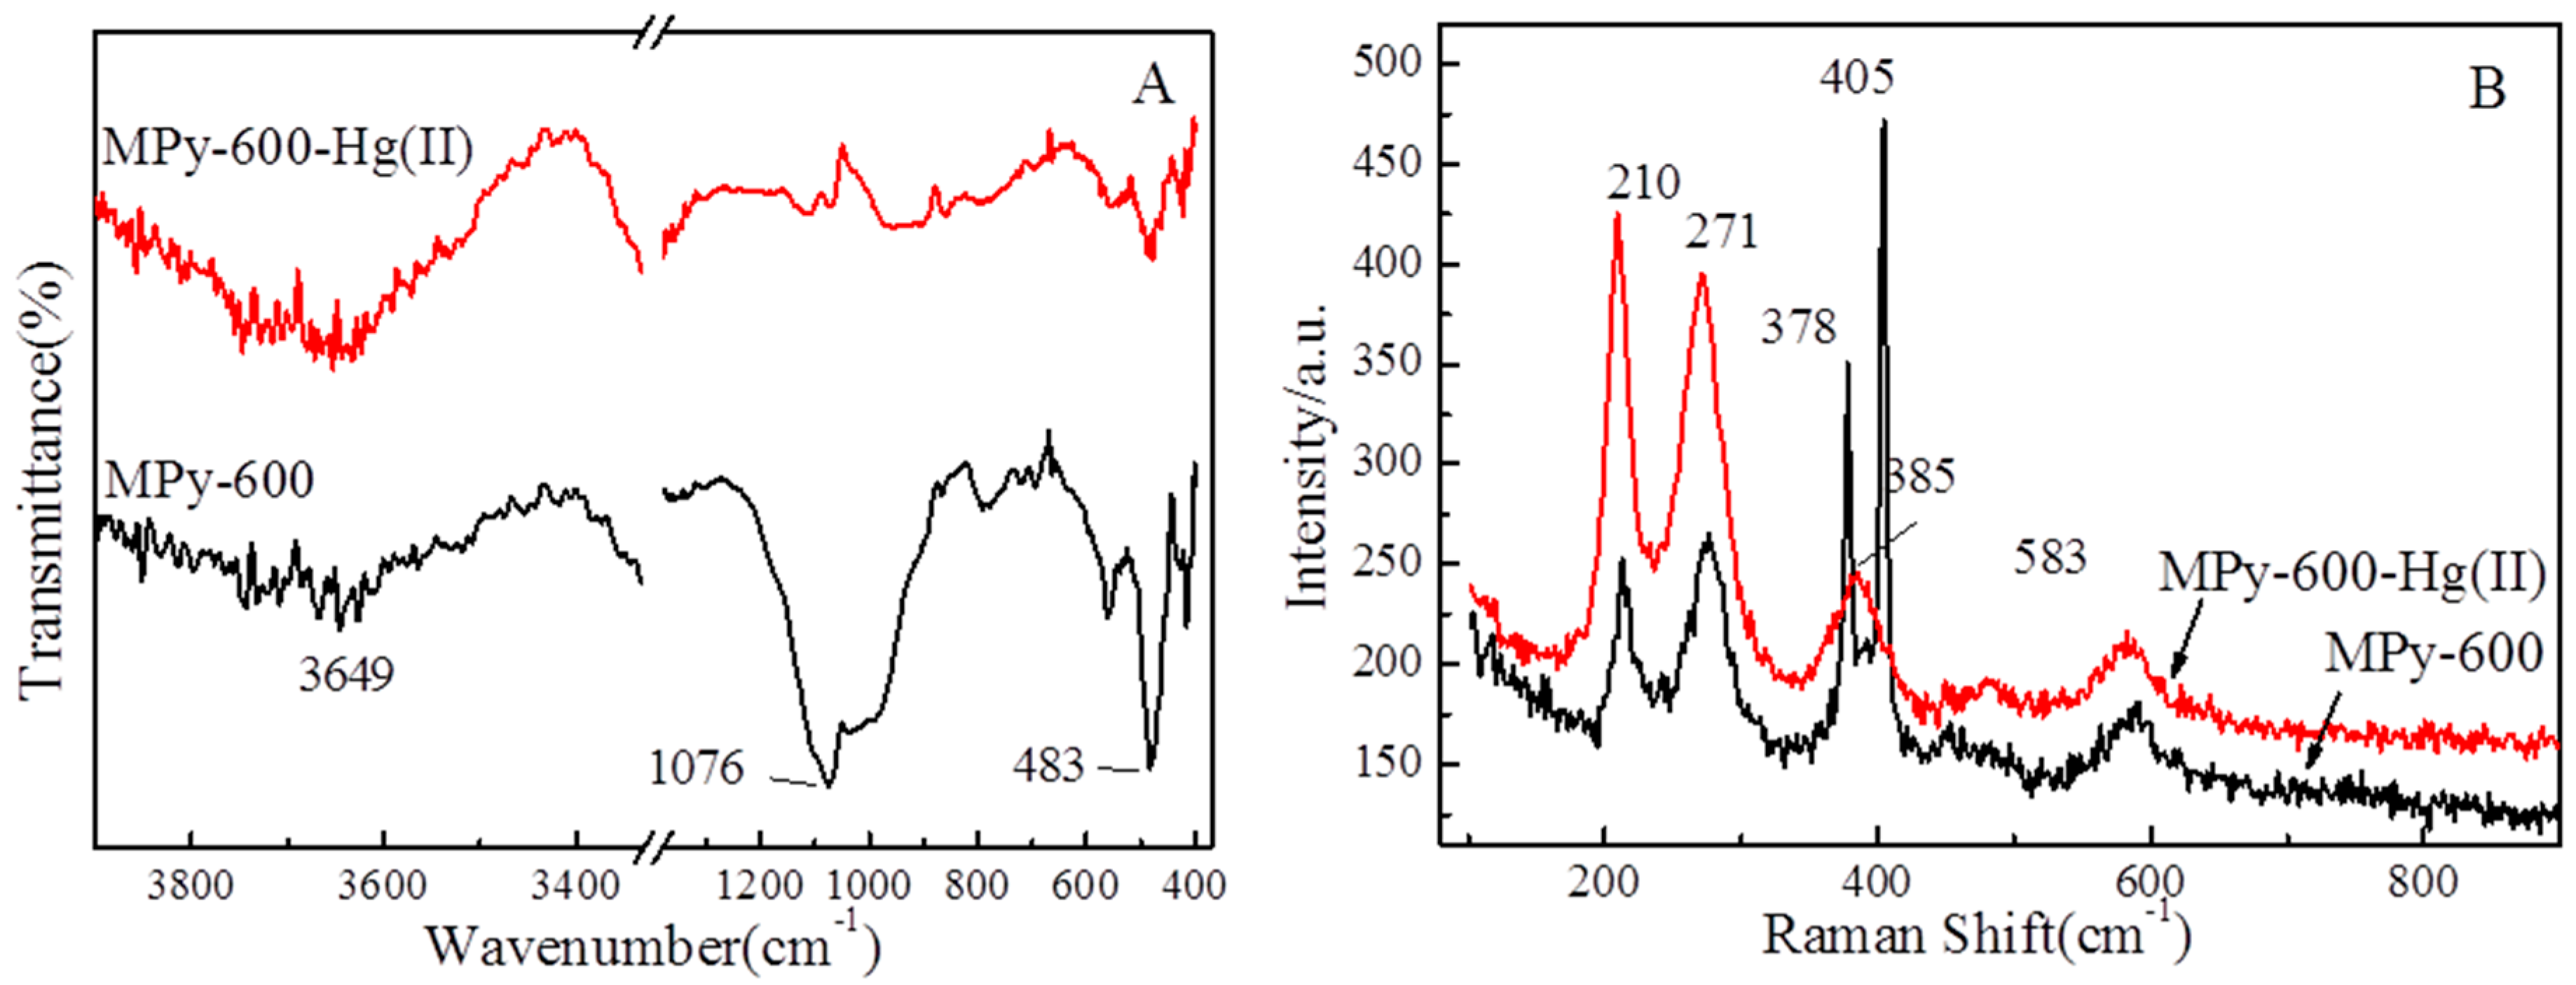
3.8.2. The FTIR and Raman Spectra
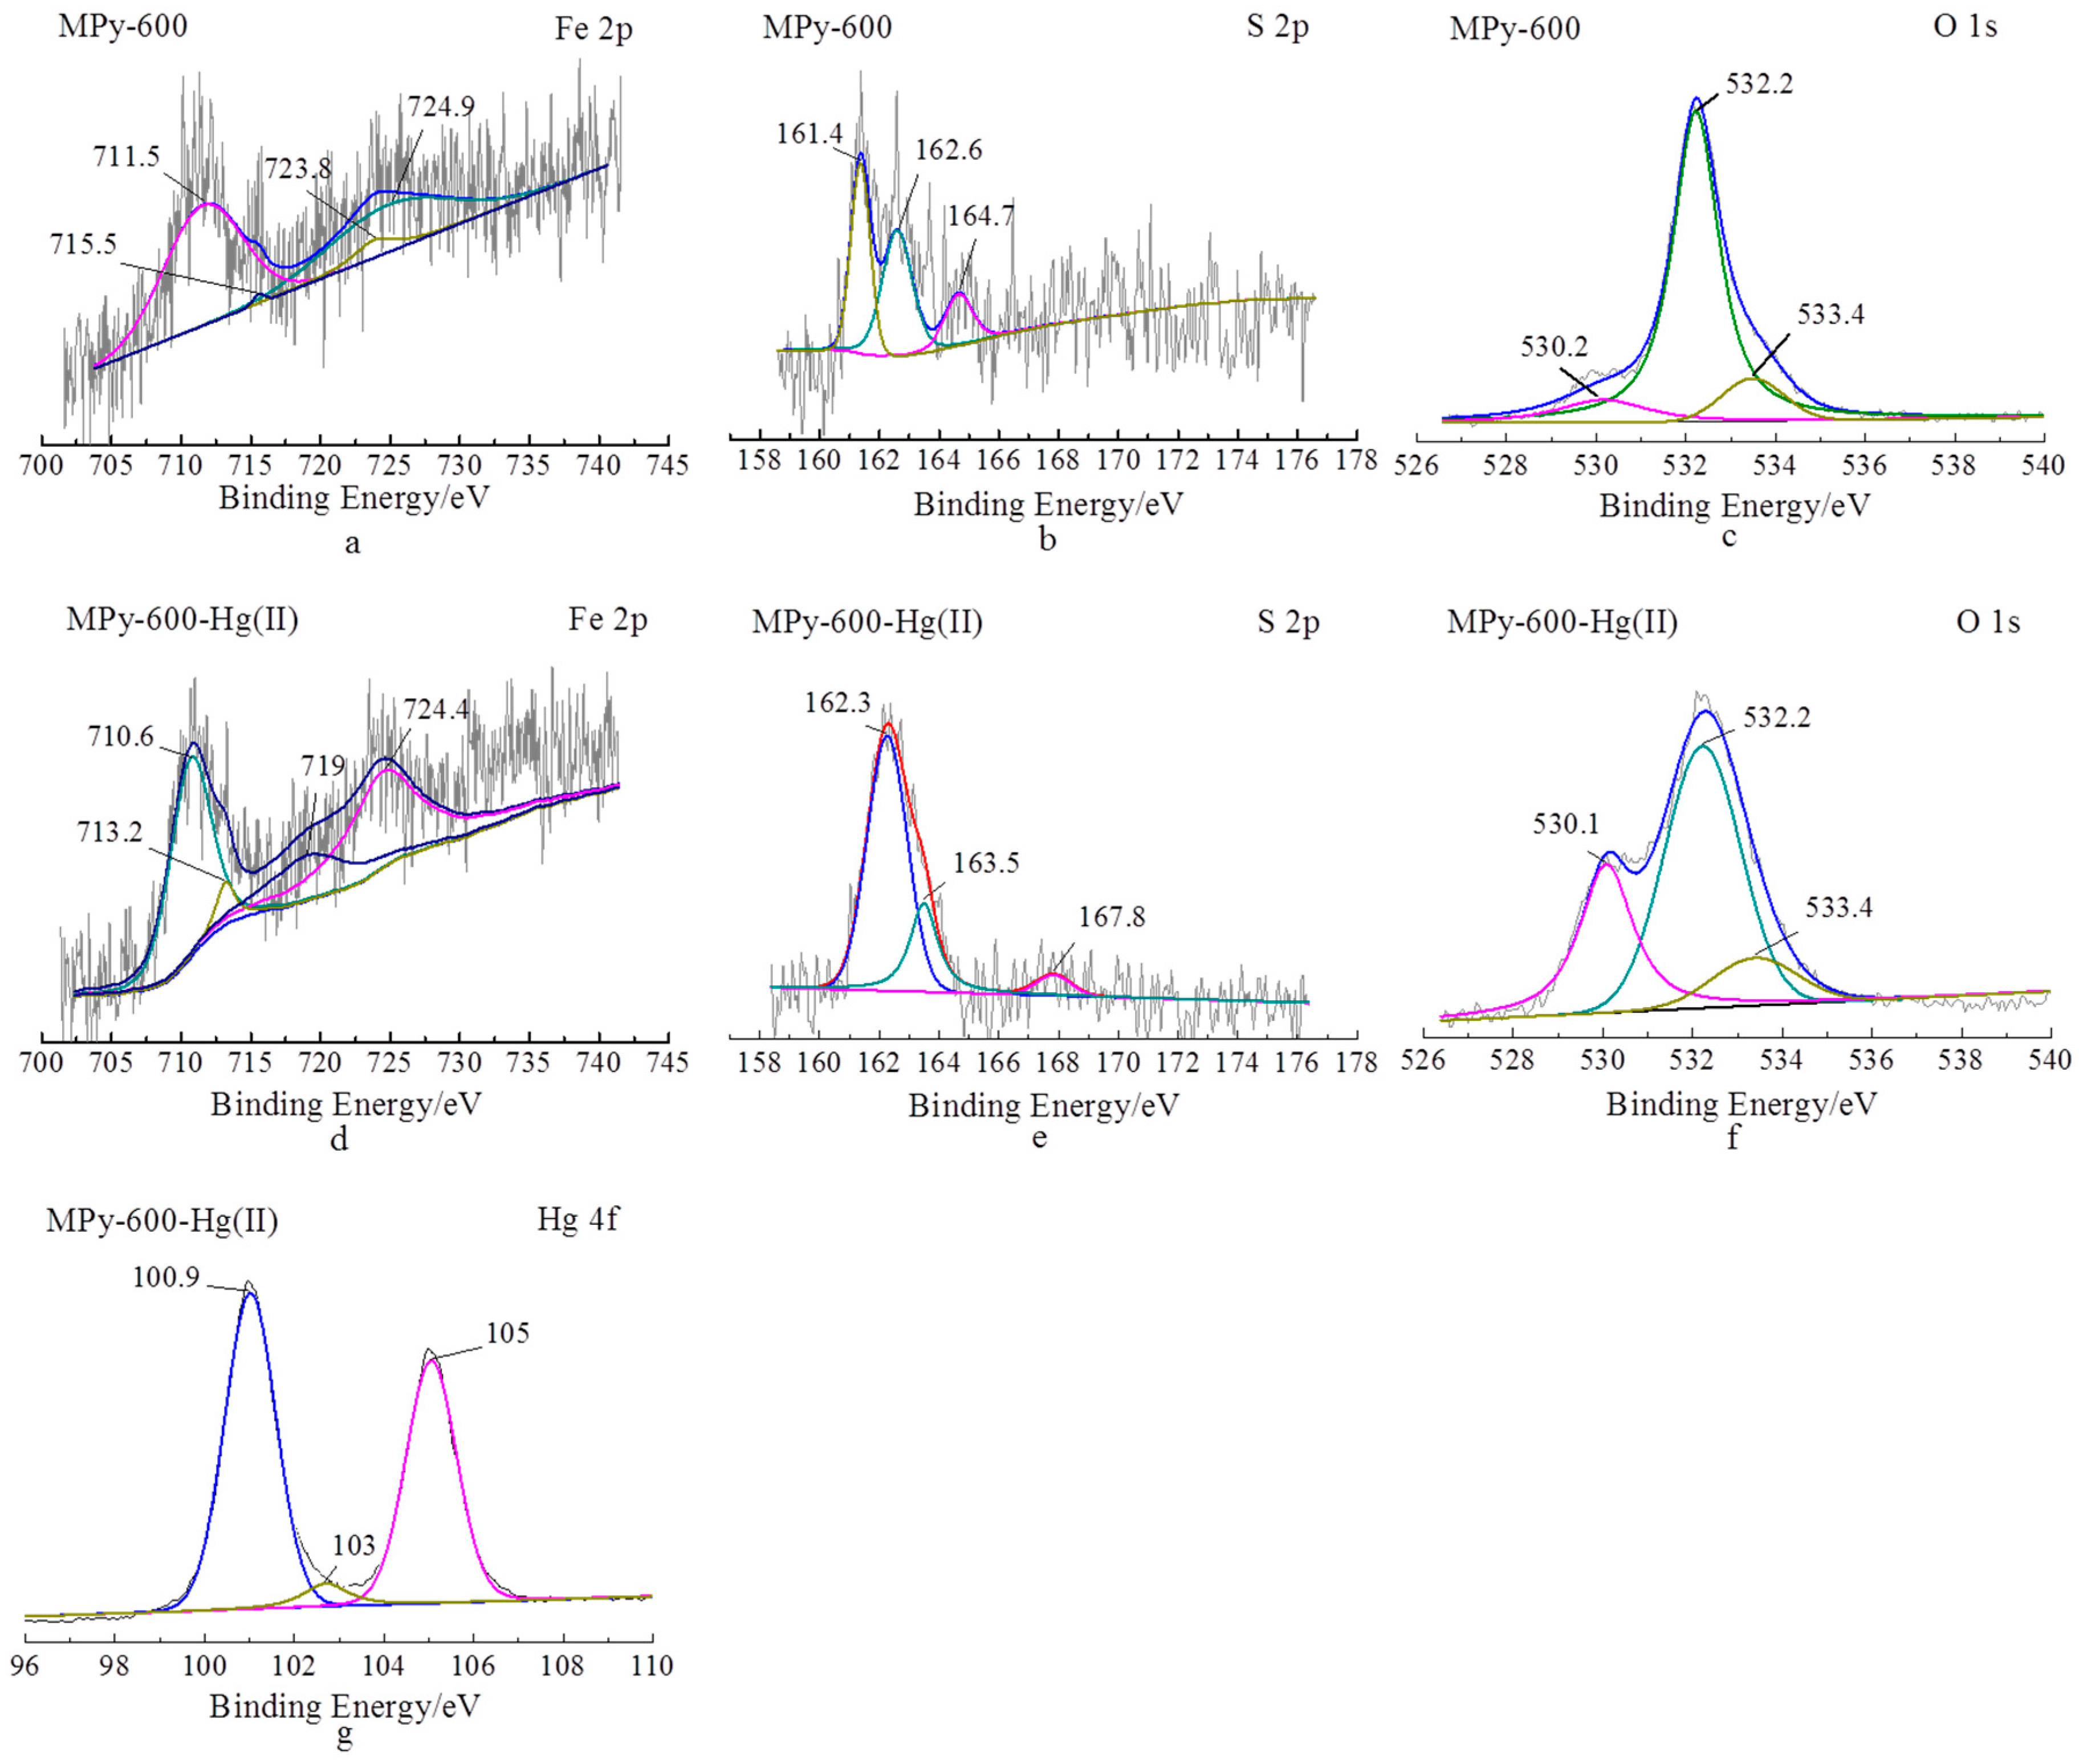
3.8.3. XPS Analyses
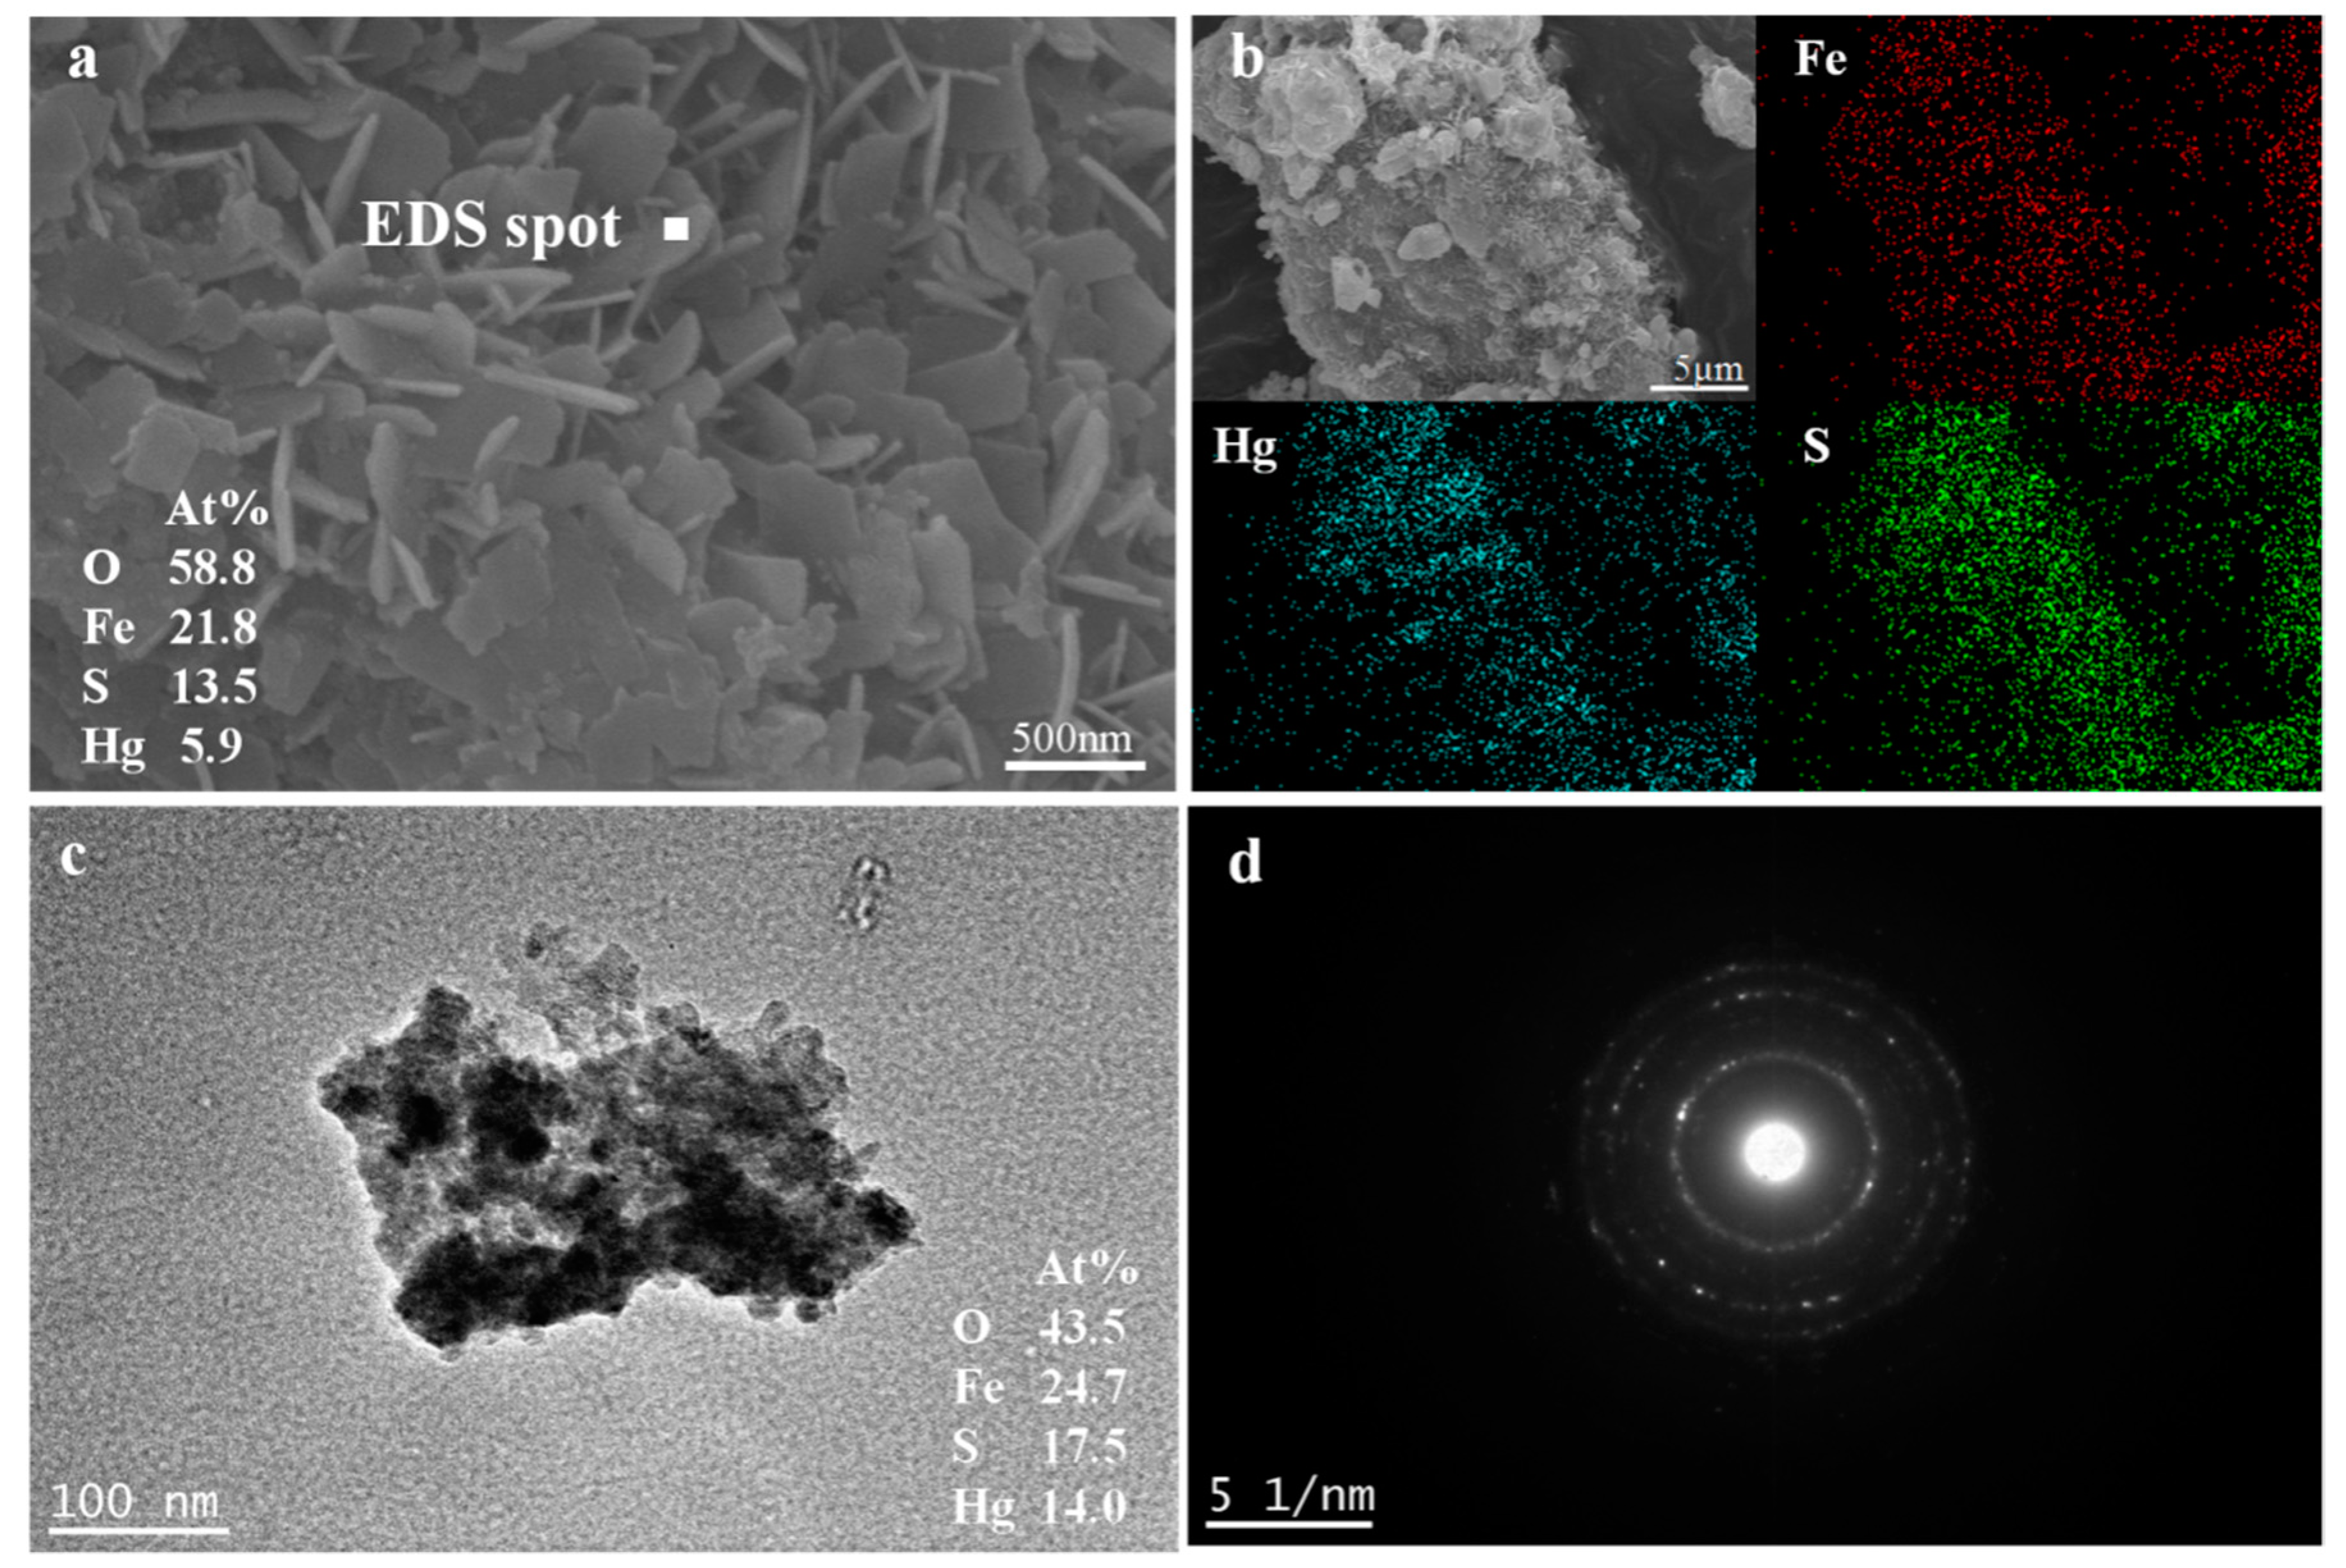
3.8.4. SEM and TEM Analyses
3.8.5. Product Analyses
4. Conclusions
Author Contributions
Funding
Conflicts of Interest
References
- Huang, J.; Wu, Z.; Chen, L.; Sun, Y. The sorption of Cd(II) and U(VI) on sepiolite: A combined experimental and modeling studies. J. Mol. Liq. 2015, 209, 706–712. [Google Scholar] [CrossRef]
- Liu, T.; Xue, L.; Guo, X.; Liu, J.; Huang, Y.; Zheng, C. Mechanisms of Elemental Mercury Transformation on alpha-Fe2O3(001) Surface from Experimental and Theoretical Study: Influences of HCl, O2, and SO2. Environ. Sci. Technol. 2016, 50, 13585–13591. [Google Scholar] [CrossRef] [PubMed]
- Huang, S.; Ma, C.; Liao, Y.; Min, C.; Du, P.; Jiang, Y. Removal of Mercury(II) from Aqueous Solutions by Adsorption on Poly(1-amino-5-chloroanthraquinone) Nanofibrils: Equilibrium, Kinetics, and Mechanism Studies. J. Nanomater. 2016, 2016, 1–11. [Google Scholar] [CrossRef]
- Wajima, T.; Sugawara, K. Adsorption behaviors of mercury from aqueous solution using sulfur-impregnated adsorbent developed from coal. Fuel Process. Technol. 2011, 92, 1322–1327. [Google Scholar] [CrossRef]
- Dash, S.; Chaudhuri, H.; Gupta, R.; Nair, U.G.; Sarkar, A. Fabrication and Application of Low-Cost Thiol Functionalized Coal Fly Ash for Selective Adsorption of Heavy Toxic Metal Ions from Water. Ind. Eng. Chem. Res. 2017, 56, 1461–1470. [Google Scholar] [CrossRef]
- Wang, J.; Deng, B.; Chen, H.; Wang, X.; Zheng, J. Removal of Aqueous Hg(II) by Polyaniline: Sorption Characteristics and Mechanisms. Environ. Sci. Technol. 2009, 43, 5223–5228. [Google Scholar] [CrossRef]
- Zhang, F.S.; Nriagu, J.O.; Itoh, H. Mercury removal from water using activated carbons derived from organic sewage sludge. Water Res. 2005, 39, 389. [Google Scholar] [CrossRef]
- Cui, H.; Qian, Y.; Li, Q.; Wei, Z.; Zhai, J. Fast removal of Hg(II) ions from aqueous solution by amine-modified attapulgite. Appl. Clay Sci. 2013, 72, 84–90. [Google Scholar] [CrossRef]
- Kadirvelu, K.; Kavipriya, M.; Karthika, C.; Vennilamani, N.; Pattabhi, S. Mercury (II) adsorption by activated carbon made from sago waste. Carbon 2004, 42, 745–752. [Google Scholar] [CrossRef]
- Kadirvelu, K.; Kanmani, P.; Senthilkumar, P.; Subburam, V. Separation of Mercury(II) from Aqueous Solution by Adsorption onto an Activated Carbon Prepared from Eichhornia crassipes. Adsorpt. Sci. Technol. 2004, 22, 207–222. [Google Scholar] [CrossRef]
- Tuzen, M.; Sari, A.; Mendil, D.; Soylak, M. Biosorptive removal of mercury(II) from aqueous solution using lichen (Xanthoparmelia conspersa) biomass: Kinetic and equilibrium studies. J. Hazard. Mater. 2009, 169, 263–270. [Google Scholar] [CrossRef] [PubMed]
- Wang, X.; Lv, P.; Zou, H.; Li, Y.; Li, X.; Liao, Y. Synthesis of Poly(2-aminothiazole) for Selective Removal of Hg(II) in Aqueous Solutions. Ind. Eng. Chem. Res. 2016, 55, 4911–4918. [Google Scholar] [CrossRef]
- Couture, R.M.; Rose, J.; Kumar, N.; Mitchell, K.; Wallschlager, D.; van Cappellen, P. Sorption of arsenite, arsenate, and thioarsenates to iron oxides and iron sulfides: A kinetic and spectroscopic investigation. Environ. Sci. Technol. 2013, 47, 5652–5659. [Google Scholar] [CrossRef] [PubMed]
- Ma, B.; Kang, M.; Zheng, Z.; Chen, F.; Xie, J.; Charlet, L.; Liu, C. The reductive immobilization of aqueous Se(IV) by natural pyrrhotite. J. Hazard. Mater. 2014, 276, 422–432. [Google Scholar] [CrossRef] [PubMed]
- Chen, T.; Yang, Y.; Li, P.; Liu, H.; Xie, J.; Xie, Q.; Zhan, X. Performance and characterization of calcined colloidal pyrite used for copper removal from aqueous solutions in a fixed bed column. Int. J. Miner. Process. 2014, 130, 82–87. [Google Scholar] [CrossRef]
- Yang, Y.; Chen, T.; Li, P.; Liu, H.; Xie, J.; Xie, Q.; Zhan, X. Removal and Recovery of Cu and Pb from Single-Metal and Cu–Pb–Cd–Zn Multimetal Solutions by Modified Pyrite: Fixed-Bed Columns. Ind. Eng. Chem. Res. 2014, 53, 18180–18188. [Google Scholar] [CrossRef]
- Chen, T.; Shi, Y.; Liu, H.; Chen, D.; Li, P.; Yang, Y.; Zhu, X. A novel way to prepare pyrrhotite and its performance on removal of phosphate from aqueous solution. Desalin. Water Treat. 2016, 57, 23864–23872. [Google Scholar] [CrossRef]
- Chen, T.H.; Wang, J.Z.; Wang, J.; Xie, J.J.; Zhu, C.Z.; Zhan, X.M. Phosphorus removal from aqueous solutions containing low concentration of phosphate using pyrite calcinate sorbent. Int. J. Environ. Sci. Technol. 2014, 12, 885–892. [Google Scholar] [CrossRef]
- Liu, H.; Zhu, Y.; Xu, B.; Li, P.; Sun, Y.; Chen, T. Mechanical investigation of U(VI) on pyrrhotite by batch, EXAFS and modeling techniques. J. Hazard. Mater. 2017, 322, 488–498. [Google Scholar] [CrossRef]
- Liao, Y.; Chen, D.; Zou, S.; Xiong, S.; Xiao, X.; Dang, H.; Chen, T.; Yang, S. Recyclable Naturally Derived Magnetic Pyrrhotite for Elemental Mercury Recovery from Flue Gas. Environ. Sci. Technol. 2016, 50, 10562–10569. [Google Scholar] [CrossRef]
- Li, R.; Kelly, C.; Keegan, R.; Xiao, L.; Morrison, L.; Zhan, X. Phosphorus removal from wastewater using natural pyrrhotite. Colloids Surf. A Physicochem. Eng. Asp. 2013, 427, 13–18. [Google Scholar] [CrossRef]
- Janzen, M.P.; Nicholson, R.V.; Scharer, J.M. Pyrrhotite reaction kinetics: Reaction rates for oxidation by oxygen, ferric iron, and for nonoxidative dissolution. Geochim. Et Cosmochim. Acta 2000, 64, 1511–1522. [Google Scholar] [CrossRef]
- Hu, G.; Dam-Johansen, K.; Wedel, S.; Hansen, J.P. Decomposition and oxidation of pyrite. Prog. Energy Combust. Sci. 2006, 32, 295–314. [Google Scholar] [CrossRef]
- Sanhueza, V.; Kelm, U.; Cid, R. Synthesis of molecular sieves from Chilean kaolinites: 1. Synthesis of NaA type zeolites. J. Chem. Technol. Biotechnol. 1999, 74, 358–363. [Google Scholar] [CrossRef]
- Widler, A.M.; Seward, T.M. The adsorption of gold(I) hydrosulphide complexes by iron sulphide surfaces. Geochim. Et Cosmochim. Acta 2002, 66, 383–402. [Google Scholar] [CrossRef]
- Duan, S.; Liu, X.; Wang, Y.; Shao, D.; Alharbi, N.S.; Alsaedi, A.; Li, J. Highly efficient entrapment of U(VI) by using porous magnetic Ni0.6Fe2.4O4 micro-particles as the adsorbent. J. Taiwan Inst. Chem. Eng. 2016, 65, 367–377. [Google Scholar] [CrossRef]
- Liu, P.; Yuan, N.; Xiong, W.; Wu, H.; Pan, D.; Wu, W. Removal of Nickel(II) from Aqueous Solutions Using Synthesized β-Zeolite and Its Ethylenediamine Derivative. Ind. Eng. Chem. Res. 2017, 56, 3067–3076. [Google Scholar] [CrossRef]
- Sun, Y.; Lou, Z.; Yu, J.; Zhou, X.; Lv, D.; Zhou, J. Immobilization of mercury (II) from aqueous solution using Al2O3-supported nanoscale FeS. Chem. Eng. J. 2017, 323, 483–491. [Google Scholar] [CrossRef]
- Jin, Z.; Wang, X.; Sun, Y.; Ai, Y.; Wang, X. Adsorption of 4-n-Nonylphenol and Bisphenol-A on Magnetic Reduced Graphene Oxides: A Combined Experimental and Theoretical Studies. Environ. Sci. Technol. 2015, 49, 9168–9175. [Google Scholar] [CrossRef]
- Weng, C.H.; Pan, Y.-F. Adsorption characteristics of methylene blue from aqueous solution by sludge ash. Colloids Surf. A Physicochem. Eng. Asp. 2006, 274, 154–162. [Google Scholar] [CrossRef]
- Liu, N.; Charrua, A.B.; Weng, C.H.; Yuan, X.L.; Ding, F. Characterization of biochars derived from agriculture wastes and their adsorptive removal of atrazine from aqueous solution: A comparative study. Bioresour. Technol. 2015, 198, 55. [Google Scholar] [CrossRef] [PubMed]
- Xu, Y.; Zeng, X.; Zhang, B.; Zhu, X.; Zhou, M.; Zou, R.; Sun, P.; Luo, G.; Yao, H. Experiment and Kinetic Study of Elemental Mercury Adsorption over a Novel Chlorinated Sorbent Derived from Coal and Waste Polyvinyl Chloride. Energy Fuels 2016, 30, 10635–10642. [Google Scholar] [CrossRef]
- Deze, E.G.; Papageorgiou, S.K.; Favvas, E.P.; Katsaros, F.K. Porous alginate aerogel beads for effective and rapid heavy metal sorption from aqueous solutions: Effect of porosity in Cu2+ and Cd2+ ion sorption. Chem. Eng. J. 2012, 209, 537–546. [Google Scholar] [CrossRef]
- Yang, S.; Yan, N.; Guo, Y.; Wu, D.; He, H.; Qu, Z.; Li, J.; Zhou, Q.; Jia, J. Gaseous elemental mercury capture from flue gas using magnetic nanosized (Fe3-xMnx)1-deltaO4. Environ. Sci. Technol. 2011, 45, 1540–1546. [Google Scholar] [CrossRef] [PubMed]
- Andac, M.; Mirel, S.; Senel, S.; Say, R.; Ersoz, A.; Denizli, A. Ion-imprinted beads for molecular recognition based mercury removal from human serum. Int. J. Biol. Macromol. 2007, 40, 159–166. [Google Scholar] [CrossRef] [PubMed]
- Zhu, Y.; Chen, T.; Liu, H.; Xu, B.; Xie, J. Kinetics and thermodynamics of Eu(III) and U(VI) adsorption onto palygorskite. J. Mol. Liq. 2016, 219, 272–278. [Google Scholar] [CrossRef]
- Gong, Y.; Liu, Y.; Xiong, Z.; Zhao, D. Immobilization of mercury by carboxymethyl cellulose stabilized iron sulfide nanoparticles: Reaction mechanisms and effects of stabilizer and water chemistry. Environ. Sci. Technol. 2014, 48, 3986–3994. [Google Scholar] [CrossRef] [PubMed]
- Wang, A.; Jolliff, B.L.; Haskin, L.A. Raman spectroscopic characterization of a Martian SNC meteorite: Zagami. J. Geophys. Res. Planets 1999, 104, 8509–8519. [Google Scholar] [CrossRef]
- Frost, R.L.; Martens, W.N.; Kloprogge, J.T. Raman spectroscopic study of cinnabar (HgS), realgar (As4S4), and orpiment (As2S3) at 298 and 77K. Neues Jahrb. Für Miner. Mon. 2002, 2002, 469–480. [Google Scholar] [CrossRef]
- Szuskiewicz, B.W.W. Raman spectroscopy of cubic HgS Fe. Acta Phys. Pol. A 1995, 87, 416–418. [Google Scholar]
- Sun, Y.; Yang, S.; Chen, Y.; Ding, C.; Cheng, W.; Wang, X. Tuning the chemistry of graphene oxides by a sonochemical approach: Application of adsorption properties. Environ. Sci. Technol. 2015, 49, 4255–4262. [Google Scholar] [CrossRef] [PubMed]
- Bone, S.E.; Bargar, J.R.; Sposito, G. Mackinawite (FeS) reduces mercury(II) under sulfidic conditions. Environ. Sci. Technol. 2014, 48, 10681–10689. [Google Scholar] [CrossRef] [PubMed]
- Pratt, A.R.; Muir, I.J.; Nesbitt, H.W. X-ray photoelectron and Auger electron spectroscopic studies of pyrrhotite and mechanism of air oxidation. Geochim. Et Cosmochim. Acta 1994, 58, 827–841. [Google Scholar] [CrossRef]
- Knipe, S.W.; Mycroft, J.R.; Pratt, A.R.; Nesbitt, H.W.; Bancroff, G.M. X-ray photoelectron spectroscopic study of water adsorption on iron sulphide minerals. Geochim. Et Cosmochim. Acta 1995, 59, 1079–1090. [Google Scholar] [CrossRef]
- Philippe, B.; Pascale, B.G.; Marc, A.; Renaud, R.; Jean, J.E. XPS and XAS Study of the Sorption of Hg(II) onto Pyrite. Langmuir 2001, 17, 3970–3979. [Google Scholar]
- Bootharaju, M.S.; Pradeep, T. Uptake of Toxic Metal Ions from Water by Naked and Monolayer Protected Silver Nanoparticles: An X-ray Photoelectron Spectroscopic Investigation. J. Phys. Chem. C 2010, 114, 8328–8336. [Google Scholar] [CrossRef]
- Temgire, M.K.; Joshi, S.S. Optical and structural studies of silver nanoparticles. Radiat. Phys. Chem. 2004, 71, 1039–1044. [Google Scholar] [CrossRef]


| Models | Parameters | |||
|---|---|---|---|---|
| Langmuir | Qm (mg/g) | KL (L/mg) | R2 | |
| 166.67 | 0.30 | 0.9991 | ||
| Freundlich | kF ((mg/g)/(mg L)−n) | 1/n | R2 | |
| 63.06 | 0.22 | 0.9724 | ||
| D-R | β (mol2/kJ2) | qm (mg/g) | E (kJ/mol) | R2 |
| 6.06 × 10⁻⁶ | 149.66 | 287 | 0.9879 | |
| Material | Experimental Conditions | Qmax (mg/g) | References |
|---|---|---|---|
| Lichens | pH 6.0, 293 K | 82.5 | [11] |
| Activated carbon made from sago waste | pH 5.0, 303 K | 55.6 | [9] |
| MPy-600 | pH 6.0, 303 K | 166.7 | this work |
| Activated carbon derived from (AEC) | pH 5.0, 303 K | 28.4 | [10] |
| Amine-modified attapulgite | pH 6.0, 298 K | 93.2 | [8] |
| Synthesis of poly (2-aminothiazole) | pH 6.5, 288 K | 291.5 | [12] |
| Al2O3-supported nanoscale FeS | pH 6.0, 303 K | 142.7 | [28] |
| C0 (mg/L) | Pseudo-First-Order | Pseudo-Second-Order | ||||
|---|---|---|---|---|---|---|
| qe (mg/g) | k1 | R2 | qe (mg/g) | k2 | R2 | |
| 10 | 34.411 | 0.0038 | 0.952 | 27.925 | 0.0002 | 0.996 |
| Sample | Parameters | R2 | |
|---|---|---|---|
| MPy-600 | K1 = 1.78 | C1 = −4.20 | 0.9997 |
| K2 = 0.60 | C2 = 14.12 | 0.9997 | |
| T (K) | ΔG (kJ/mol) | ΔH (kJ/mol) | ΔS (J/(mol·K)) |
|---|---|---|---|
| 298 | −0.6930 | 62.0557 | 0.2310 |
| 308 | −0.8843 | ||
| 318 | −1.1569 |
© 2019 by the authors. Licensee MDPI, Basel, Switzerland. This article is an open access article distributed under the terms and conditions of the Creative Commons Attribution (CC BY) license (http://creativecommons.org/licenses/by/4.0/).
Share and Cite
Lu, P.; Chen, T.; Liu, H.; Li, P.; Peng, S.; Yang, Y. Green Preparation of Nanoporous Pyrrhotite by Thermal Treatment of Pyrite as an Effective Hg(Ⅱ) Adsorbent: Performance and Mechanism. Minerals 2019, 9, 74. https://doi.org/10.3390/min9020074
Lu P, Chen T, Liu H, Li P, Peng S, Yang Y. Green Preparation of Nanoporous Pyrrhotite by Thermal Treatment of Pyrite as an Effective Hg(Ⅱ) Adsorbent: Performance and Mechanism. Minerals. 2019; 9(2):74. https://doi.org/10.3390/min9020074
Chicago/Turabian StyleLu, Ping, Tianhu Chen, Haibo Liu, Ping Li, Shuchuan Peng, and Yan Yang. 2019. "Green Preparation of Nanoporous Pyrrhotite by Thermal Treatment of Pyrite as an Effective Hg(Ⅱ) Adsorbent: Performance and Mechanism" Minerals 9, no. 2: 74. https://doi.org/10.3390/min9020074
APA StyleLu, P., Chen, T., Liu, H., Li, P., Peng, S., & Yang, Y. (2019). Green Preparation of Nanoporous Pyrrhotite by Thermal Treatment of Pyrite as an Effective Hg(Ⅱ) Adsorbent: Performance and Mechanism. Minerals, 9(2), 74. https://doi.org/10.3390/min9020074