Abstract
Fluorine is a species commonly present in many minerals in the Earth’s interior, with a concentration ranging from a few ppm to more than 10 wt. %. Recent experimental studies on fluorine-bearing silicate minerals have proposed that fluorine might be an important charge carrier for electrical conduction of Earth materials at elevated conditions, but the results are somewhat ambiguous. In this investigation, the electrical conductivity of gem-quality natural single crystal fluorite, a simple bi-elemental (Ca and F) mineral, has been determined at 1 GPa and 200–650 °C in two replication runs, by a Solartron-1260 Impedance/Gain Phase analyzer in an end-loaded piston-cylinder apparatus. The sample composition remained unchanged after the runs. The conductivity data are reproducible between different runs and between heating-cooling cycles of each run. The conductivity (σ) increases with increasing temperature, and can be described by the Arrhenius law, σ = 10^(5.34 ± 0.07)·exp[−(130 ± 1, kJ/mol)/(RT)], where R is the gas constant and T is the temperature. According to the equation, the conductivity reaches ~0.01 S/m at 650 °C. This elevated conductivity is strong evidence that fluorine is important in charge transport. The simple construction of this mineral indicates that the electrical conduction is dominated by fluoride (F−). Therefore, fluorine is potentially an important charge carrier in influencing the electrical property of Fluorine-bearing Earth materials.
1. Introduction
The electrical conduction of Earth materials, especially silicate minerals—the main constituents of the crust and mantle, is usually attributed to the transfer of the following charged species: (1) ions, such as Na+ occupying crystallographic sites [1,2]; (2) protons, which can be regarded as ions but are linked to point defects, especially in nominally anhydrous minerals [2,3,4,5,6,7,8,9,10,11,12,13]; (3) small polarons, due to the hopping of electron holes between ferrous (Fe2+) and ferric (Fe3+) sites in the lattice framework [2,7,12,13,14]; and (4) oxygen vacancies, which is related to the transfer of point defects [15]. In general, these species are characterized by small radius and high mobility, so that they move quickly in the mineral crystal structure. Fluorine is a trace element commonly observed in many silicate minerals, ranging in concentration from a few ppm to >10 wt. % [16,17,18]. Fluorine occurs as fluoride (F−) in minerals, and is of small radius (~1.2 Å, comparable to Na+) and high mobility at elevated temperatures and pressures [19]. Therefore, fluorine may be an important charge charrier for electrical conduction. Recent experimental studies have demonstrated high electrical conductivity of fluorine-rich phlogopite, which is ascribed to fluorine conduction [17,20]. If true, this offers a potentially novel explanation for the geophysically resolved electrical properties of the Earth’s interior [17,20]. However, the results from fluorine-bearing phlogopite may be complicated by the composition of multiple species (such as Na+, K+, H+, F−, Fe2+, Mg2+, Al3+ and Si4+) present in that mineral. In principle, material with a simple composition (in particular for fluorine) would be ideal for documenting fluorine conduction.
Fluorite is the mineral form of calcium fluoride (CaF2) and is an important host of fluorine. The rather simple constituents of fluorite, dominated by Ca and F, make it an excellent candidate for addressing the electrical behavior of fluorine. In this study, we have experimentally determined the electrical conductivity of a gem-quality natural fluorite single crystal at simulated high-pressure and temperature conditions. We found that the electrical conductivity of fluorite is very high at moderate temperature only. The results provide direct evidence that fluorine could be an important species for electrical conduction.
2. Experiments and Analytical Methods
2.1. Sample Preparation
The starting material was a gem-quality colorless fluorite (octahedral) single crystal from southeast China. Cylindrical cores of ~3 mm in diameter and 1.8 mm in length were prepared by drilling perpendicular to the (011) plane. Fluorite is a cubic mineral, and thus the drilling direction of the sample does not affect the general results. Two cylinders were produced for analysis replication, each was fine-polished and ultrasonically cleaned prior to conductivity measurement.
2.2. Sample Characterization
The abundances of major- and minor-elements in the fluorite was determined using a JEOL JXA-8100 electron microprobe (EMP, Shimadzu, Kyoto, Japan). The operating conditions were as follows: 15 kV accelerating voltage, 20 nA beam current, <5 μm beam diameter, and a counting time of 10 and 5 s for the peak and background, respectively. A program based on the ZAF (atomic number, absorption and fluorescence) correction procedure was used for data reduction. The fluorite was also examined by Fourier-transform infrared (FTIR) analyses for the content of structural water (hydroxyl groups) with a Bruker Vertex 70v FTIR spectrometer coupled with a Bruker Hyperion 2000 microscope (Bruker, Karlsruhe, Germany). The analyses were carried out using unpolarized radiation, and for each spectrum, a total of 128 scans was accumulated by an MCT (mercury–cadmium-telluride) detector with a globar source and a KBr beam-splitter (aperture size 60 × 60 μm and resolution 4 cm−1). The starting crystal was homogeneous in composition (Table 1).

Table 1.
Composition of fluorite before and after runs (wt. %) 1.
2.3. Impedance Measurements
Earth materials usually exhibit semi-conductor behavior at elevated temperatures, and their electrical conductivities is best measured with impedance spectroscopy by sweeping over a wide range of frequencies [21]. The impedance was measured at 1 GPa and 200–650 °C using an end-loaded piston-cylinder apparatus and a Solartron 1260 Impedance/Gain Phase Analyzer (Ametek, Hampshire, UK), with the frequency range of 106-1 Hz at 0.5 V applied voltage. Figure 1 illustrates the experimental assembly design, resembling that in our previous work [2,11,12,13,17,20,22]. A hexagonal, soft and highly resistive boron nitride (BN) capsule and a U-shaped Ni capsule were used enclosing the sample, together with two Pt electrodes, Ni–NiO oxygen buffer pairs and an S-type thermocouple for measuring temperature. The double-capsule design helps to minimize the distortion of sample geometry at elevated conditions, to control oxygen fugacity in the sample chamber and to prevent carbon (furnace) diffusion through pressure media and into the sample. With this approach, sample resistance to the magnitude of 108 Ω can be accurately measured and sample Fe3+/Fe2+ ratio, if involved, can be well controlled in the runs [2,12,13].
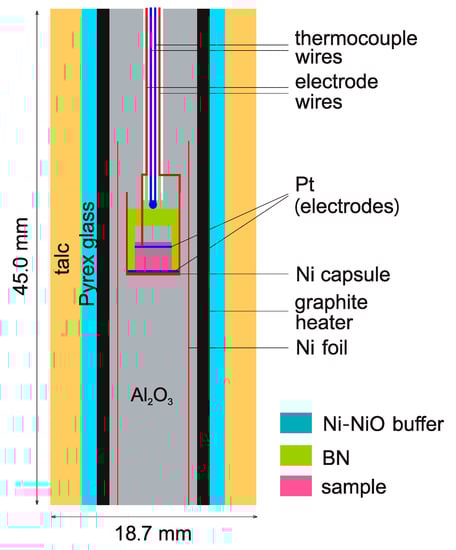
Figure 1.
Sample assembly for electrical conductivity measurements.
Prior to sample assembly, the Al2O3 pressure media were heated at 1000 °C for ~4 h to remove absorbed moisture. The assembling used no glue or cement to immobilize the various parts to avoid the release of volatiles upon heating. After the assembly was finished, it was heated at 136 °C in an oven for ~24 h. After the assembly was loaded into the apparatus and the target pressure was reached, it was heated again at 200 °C for several hours. Impedance spectra were recorded at various temperatures in the subsequent heating-cooling cycles. The temperature ramp rate was 50 °C/min, and the highest temperature was 650 °C to avoid the loss of fluorine.
After each run, the recovered sample was sectioned and polished for optical examination and EMP analyses. No other phases were observed, the Ni-NiO pairs were still present and sample geometric distortions were negligible, although the absolute dimensions of recovered samples changed slightly (Figure 2). The dimensions of the recovered samples were used to calculate the conductivity (σ) by σ = L/AR, where L and A are the sample length and cross-section area (by considering the effective contact between the sample and electrodes), respectively, and R is the resistance obtained by fitting the high frequency arc of the complex spectra (as discussed below). The uncertainty of temperature, arising mainly from thermal gradient along the length of the capsule, is <20 °C, and the uncertainty of conductivity, due mainly to sample dimensions and impedance arc fitting, is mostly <10% [2,11,12,13].
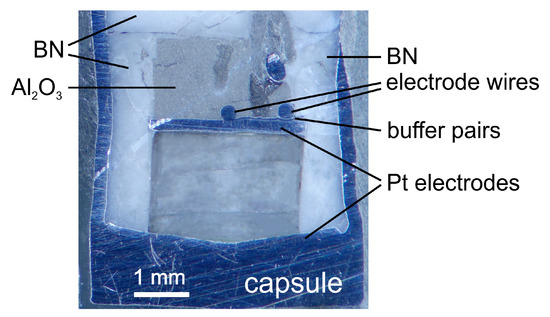
Figure 2.
Representative image of a recovered sample (B168). The grey and light colors of the crystal were due to light patterns under the optical microscope. Fractures were produced mainly during the final quenching and/or decompression of the conductivity run.
3. Results
The fluorite was nearly ideal regarding the calcium and fluorine components, with negligible abundance for other species (Table 1). The chemical composition of the samples was essentially the same before and after the conductivity runs.
Representative impedance spectra are shown in Figure 3. Usually, the spectra show an arc in the high frequency range and a short tail in the low frequency range, although the tail is sometimes not obvious at low temperatures. The arc is a product of lattice conduction, and the tail could be related to electrode effects due to sample-electrode reactions [23].
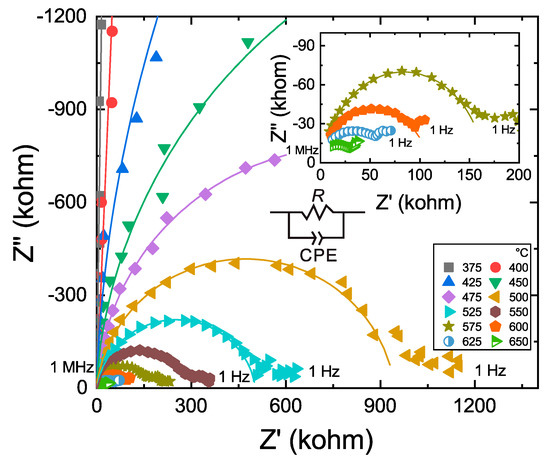
Figure 3.
Representative complex spectra of sample B173. Z’ and Z’’ represent the real and imaginary parts of the complex impedance, respectively. Frequency decreases from left (1 × 10⁶ Hz) to right (1 Hz) along the Z′-axis. An equivalent circuit, including a single R-CPE circuit element, a resistor (R) and a constant phase element (CPE) in parallel, was used to fit the impedance arc in the high frequency region. Inset shows the spectra at 575–650 °C.
Electrical conductivity (σ) of Earth materials as a function of temperature can be described by the Arrhenius relation:
where A0 is a pre-exponential factor, and ΔH is the activation enthalpy. In the first heating cycle, the conductivity measurements were affected by residual moisture and/or equilibrium issue in the system, producing data not fits by Equation (1) and deviating from the trend of data in subsequent heating-cooling cycles, as shown in Figure 4 and observed in similar studies [17,20,22]. The affected data were excluded from the analyses. The measured data and their fits are given in Figure 4, and the parameters obtained by fitting the data to Equation (1) are listed in Table 2. The data are reproducible between different cooling/heating cycles of the same run and between the duplicate runs, suggesting the absence of system hysteresis. The conductivity increases with increasing temperature, reaching ~0.01 S/m at 650 °C, and the determined activation enthalpy is ~130 kJ/mol.
σ = A0·exp[−ΔH/(RT)]
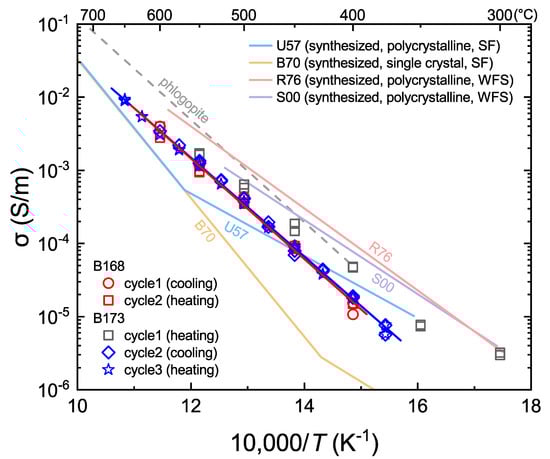
Figure 4.
Electrical conductivity of fluorite. Conductivity data from the first heating cycle of run B173 were shown for comparison with subsequent cycles. The red and blue lines are the linear fittings to the data from the two duplicate runs, respectively (note that data from the first heating cycle were not included). Compiled data of synthesized fluorite (labeled by light-color solid lines): U57 [24]; B70 [25]; R76 [26]; S00 [27]. Dashed line shows the determined conductivity of a phlogopite single crystal perpendicular to the (110) plane [20]. SF: single frequency; WFS: wide frequency sweeping by impedance spectroscopy. See the main text for more details.
Table 2.
Summary of samples and fitting parameters.
4. Discussions
4.1. Comparisom with Available Studies
The electrical property of fluorite has been widely investigated by researchers from materials science, wholly or partly due to its commercial potential as a laser material when doped with rare Earth impurities, uranium and/or other elements [24,25,26,27,28,29,30,31,32]. Typically, nearly all available studies were carried out on synthesized fluorite, in either polycrystalline or single crystal forms. For comparison, the conductivity data from some previous reports were compiled in Figure 4.
In general, the data trends of the conductivities determined for synthesized [24,25,26,27,28,29,30,31,32] and natural (this study) fluorite resemble each other, although the exact conductivity values vary by a factor of ~2 to 10 depending on temperature (Figure 4). Furthermore, the activation enthalpies of electrical conduction in synthesized fluorite are usually ~80–100 kJ/mol or ~180–190 kJ/mol at low to moderate temperatures (e.g., ~400–650 °C) [24,25,26,27,28,29,30,31,32], which are remarkably different from the measured value of ~130 kJ/mol for natural fluorite (this study). In particular, some previous reports for synthesized fluorite demonstrate apparent kinks of conductivity data in their Arrhenius plots between 400 and 600 °C, which is not observed by our measurements for natural fluorite (Figure 4).
Fluorite samples in available reports were usually pure CaF2 grown in laboratory, with minor impurities from the reagent materials [24,25,26,27,28,29,30,31,32], and our fluorite was nearly ideal in CaF2 composition, with negligible amounts of other elements (Table 1). The differences in electrical property between synthesized fluorite and natural fluorite (Figure 4) may thus be accounted for by one or a few of the following possibilities: (1) different forms of fluorite, i.e., polycrystalline vs. single crystal. It is known that adsorbed water on grain boundaries increases conductivity, and that surface space charge of micro-sized samples enhances conduction [27,32]. As a result, the conductivity analyses of some polycrystalline fluorite samples may have been subjected to this issue, in particular at relatively low temperatures. (2) different techniques for conductivity measurements. In previous work, the electrical conductivity of synthesized fluorite was measured usually by direct current (DC) method or single frequency alternate current (AC) method––the data may not reflect true sample conductivity if not determined by impedance spectroscopy in the wide frequency sweeping mode, due to the significant capacity and polarization effects as documented extensively elsewhere [21]. (3) different pressure in the runs, e.g., ambient pressure in previous work vs. 1 GPa in this study. For electrical conduction in solid-state materials, the effect of pressure is usually not significant [14]. However, the materials expand upon heating and higher pressure would be helpful to maintain the effective contact between the sample and electrodes (the L/A dimension factor: Section 2.3), which is key for determining sample conductivity. This is a factor that has so far received little attention but could be sometimes important in producing different conductivity data between room pressure and elevated pressure.
In general, the determined activation enthalpy, or the slope in the Arrhenius plots (Figure 4), of polycrystalline fluorite in previous reports, especially at low temperatures, is similar to that of our data in the first heating cycle, which were excluded because of the influence of residual moisture in the system as noted before. It appears therefore that the early work may have been largely subjected to the technical issue of grain boundary water, in the context of the possibility (1) above. In summary, our conductivity data are probably more meaningful for evaluating the electrical behavior of fluorite at elevated temperatures.
4.2. Fluorine Conduction and Implications
It has been proposed in available reports that the electrical conduction in (synthesized) fluorite is controlled by anti-Frenkel defects involving negative vacancies and interstitials [24,29], thermal stress or oxygen introduced in the growth of fluorite [28,31]. Also, it has been argued that different conduction mechanisms are active at different temperatures, e.g., extrinsic vacancy conduction at low temperature and intrinsic vacancy conduction at relatively high temperatures, with a transition at ~450–600 °C [25,28,30,32,33]. Moreover, it has been suggested that minor impurities such as Na+ and Y3+ may contribute to the electrical conduction of fluorite [24,25,29,30,33].
Our data demonstrate clearly that the electrical conduction of fluorite is dominated by a single mechanism from ~350 to 650 °C (Figure 4). Hydrogen enhances greatly the electrical conductivity of nominally anhydrous minerals [2,3,4,5,6,7,8,9,10,11,12,13], but could not be an important charge carrier in our fluorite because of its negligible amount (<0.1 ppm, Table 1). The fluorite consists of calcium and fluorine in near-stoichiometric composition, with negligible abundances of Na+, K+, Fe2+ and O2− which might be important in charge transport (Table 1). Ca is a sluggish element, with very slow diffusivity in solid minerals (e.g., lower by more than 6 orders of magnitudes than F diffusivity) [34]. This makes it unlikely that Ca contributes significantly to the electrical conductivity of the fluorite, especially at relatively low temperatures. We suggest that the electrical property is dominated by fluorine conduction, due to the transfer of fluoride (F−) which is characterized by high mobility [19,34]. This can easily explain the high conductivity of fluorite, up to ~0.01 S/m at ~650 °C (Figure 4).
The activation enthalpy of fluorine conduction in fluorite, ~130 kJ/mol (Table 2), is remarkably different from that of fluorine self-diffusion in fluorite, ~193 kJ/mol [35]. Therefore, the mobility of fluorine differs between conduction and diffusion experiments. Similar arguments have also been proposed for other species such as H and Na in silicate minerals between these transport processes [2,11,12,13]. This would mean that experimentally obtained diffusion coefficients of elements cannot be simply used to model their conductivity by the Nernst-Einstein relation. The activation enthalpy of fluorine conduction in fluorite resembles that of fluorine conduction in phlogopite perpendicular to the (110) plane, 134 kJ/mol, but is much smaller than that along other orientations, ~180–200 kJ/mol [17,20]. This may be accounted for by the electrical anisotropy of phlogopite [20] and/or by the different fluorine contents between these minerals. The fluorine content is about 48.7 wt. % in fluorite, in sharp contrast to the value of ~0.2–7.6 wt. % in the phlogopite of Li et al. [17,20]. It is possible that, at very F-enriched conditions, the activation enthalpy might be lower for fluorine conduction. This may be comparable to the observation that the activation enthalpy is reduced for small polaron conduction in pyroxenes with increasing Fe content [2,10,12,13] and for Na+ conduction in feldspars with increasing Na content [2]. Li et al. [17,20] determined that the activation enthalpy is nearly independent of phlogopite fluorine content. However, the small range of fluorine concentration variation in phlogopite (e.g., <7.6 wt. %) may be inadequate to observe an influence on activation enthalpy.
Therefore, the potential of fluorine as an important charged species in the electrical conduction of Earth materials (in particular silicate minerals) must be considered. This is because: (1) fluorine may be stored in appreciable amounts of a few hundred to several thousand ppm in many minerals in the deep mantle such as olivine, garnet, pyroxenes, wadsleyite and ringwoodite [36,37,38], (2) fluorine-abundant phases such as phlogopite could be regionally enriched in the deep crust and upper mantle, leading to very high electrical conductivity in regional areas [17,20], and (3) the sensitivity of conductivity to fluorine may be comparable to H in nominally anhydrous minerals [17], and at higher temperature, the effect of fluorine on enhancing the conductivity of the host minerals exceeds that of H (protons) and thus dominates bulk conductivity, due to the much larger activation enthalpy of fluorine conduction (e.g., 130–220 kJ/mol) relative to proton conduction, ~70–90 kJ/mol [2,3,4,5,6,7,8,9,10,11,12,13] (Figure 5). This would shed fundamental insight into the electrical structure of the deep Earth, although further experimental studies on other minerals are necessary.
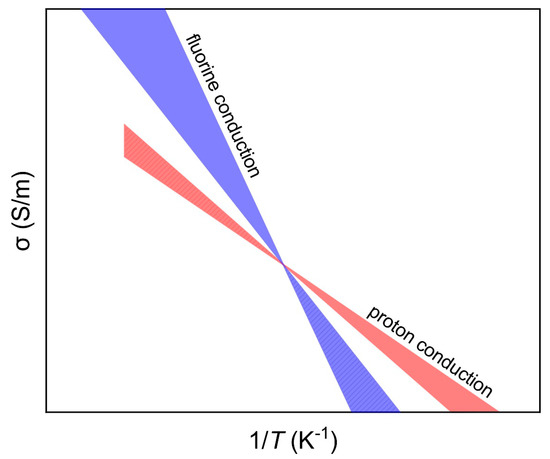
Figure 5.
Schematic plots for fluorine and proton conduction. The zones were made by considering ΔH of ~130–220 kJ/mol for fluorine conduction and of ~70–90 kJ/mol for proton conduction (see text). The exact conductivity and the tradeoff between these mechanisms are dependent on minerals and contents of fluorine/hydrogen, but the general data trends are reliable: at high T, the role of fluorine conduction is more significant, while at low T, the role of proton conduction is more significant (the dashed regions denote overlaid conductivity).
5. Conclusions
In this study, we have determined the in situ electrical conductivity of a gem-quality natural fluorite at elevated pressure and temperature. We show that the electrical property is dominated by a single conduction mechanism from ~350 to 650 °C: the conductivity is very high, reaching ~0.01 S/m at 650 °C, and the activation enthalpy is ~130 kJ/mol. We suggest that the conduction is controlled by the transfer of fluoride, and that fluorine conduction may be an important mechanism for the electrical conductivity of Earth materials in the deep crust and mantle.
Author Contributions
Conceptualization, X.Y.; Investigation, H.L. and Q.Z.; Writing—original draft preparation, X.Y. and H.L.; Writing—review and editing, X.Y.; Project administration, X.Y.; Funding acquisition, X.Y.
Funding
This research was funded by National Science Foundation of China, grant number 41725008, and National Basic Research Program of China, grant number 2014CB845904.
Acknowledgments
The authors thank Wenlan Zhang and Yong Xiong for technical assistance with electron microprobe analyses. Comments by two anonymous reviewers helped to improve the manuscript.
Conflicts of Interest
The authors declare no conflict of interest.
References
- Hu, H.; Li, H.; Dai, L.; Shan, S.; Zhu, C. Electrical conductivity of albite at high temperatures and high pressures. Am. Mineral. 2011, 96, 1821–1827. [Google Scholar] [CrossRef]
- Yang, X.; Keppler, H.; McCammon, C.; Ni, H. Electrical conductivity of orthopyroxene and plagioclase in the lower crust. Contrib. Mineral. Petrol. 2012, 163, 33–48. [Google Scholar] [CrossRef]
- Karato, S.I. The role of hydrogen in the electrical conductivity of the upper mantle. Nature 1990, 347, 272–273. [Google Scholar] [CrossRef]
- Wang, D.; Mookherjee, M.; Xu, Y.; Karato, S.I. The effect of water on the electrical conductivity of olivine. Nature 2006, 443, 977–980. [Google Scholar] [CrossRef] [PubMed]
- Yoshino, T.; Matsuzaki, T.; Yamashita, S.; Katsura, T. Hydrous olivine unable to account for conductivity anomaly at the top of the asthenosphere. Nature 2006, 443, 973–976. [Google Scholar] [CrossRef] [PubMed]
- Yoshino, T.; Manthilake, G.; Matsuzaki, T.; Katsura, T. Dry mantle transition zone inferred from the conductivity of wadsleyite and ringwoodite. Nature 2008, 451, 326–329. [Google Scholar] [CrossRef]
- Poe, B.T.; Romano, C.; Nestola, F.; Smyth, J.R. Electrical conductivity anisotropy of dry and hydrous olivine at 8 GPa. Phys. Earth Planet. Inter. 2010, 181, 103–111. [Google Scholar] [CrossRef]
- Dai, L.; Karato, S.I. High and highly anisotropic electrical conductivity of the asthenosphere due to hydrogen diffusion in olivine. Earth Planet. Sci. Lett. 2014, 408, 79–86. [Google Scholar] [CrossRef]
- Yoshino, T.; Katsura, T. Effect of iron content on electrical conductivity of ringwoodite, with implications for electrical structure in the transition zone. Phys. Earth Planet. Inter. 2009, 174, 3–9. [Google Scholar] [CrossRef]
- Zhao, C.; Yoshino, T. Electrical conductivity of mantle clinopyroxene as a function of water content and its implication on electrical structure of uppermost mantle. Earth Planet. Sci. Lett. 2016, 447, 1–9. [Google Scholar] [CrossRef]
- Yang, X. Orientation-related electrical conductivity of hydrous olivine, clinopyroxene and plagioclase and implications for the structure of the lower continental crust and uppermost mantle. Earth Planet. Sci. Lett. 2012, 317, 241–250. [Google Scholar] [CrossRef]
- Yang, X.; McCammon, C. Fe3+-rich augite and high electrical conductivity in the deep lithosphere. Geology 2012, 40, 131–134. [Google Scholar] [CrossRef]
- Yang, X.; Keppler, H.; McCammon, C.; Ni, H.; Xia, Q.; Fan, Q. Effect of water on the electrical conductivity of lower crustal clinopyroxene. J. Geophys. Res. 2011, 116, B04208. [Google Scholar] [CrossRef]
- Xu, Y.; Shankland, T.J.; Duba, A.G. Pressure effect on electrical conductivity of mantle olivine. Phys. Earth Planet. Inter. 2000, 118, 149–161. [Google Scholar] [CrossRef]
- Schock, R.N.; Duba, A.G.; Shankland, T.J. Electrical conduction in olivine. J. Geophys. Res. 1989, 94, 5829–5839. [Google Scholar] [CrossRef]
- Mosenfelder, J.L.; Rossman, G.R. Analysis of hydrogen and fluorine in pyroxenes: II. Clinopyroxene. Am. Mineral. 2013, 98, 1042–1054. [Google Scholar] [CrossRef]
- Li, Y.; Jiang, H.; Yang, X. Fluorine follows water: Effect on electrical conductivity of silicate minerals by experimental constraints from phlogopite. Geochim. Cosmoch. Acta 2017, 217, 16–27. [Google Scholar] [CrossRef]
- Grützner, T.; Kohn, S.C.; Bromiley, D.W.; Rohrbach, A.; Berndt, J.; Klemme, S. The storage capacity of fluorine in olivine and pyroxene under upper mantle conditions. Geochim. Cosmoch. Acta 2017, 208, 160–170. [Google Scholar] [CrossRef]
- Zhang, Y.; Cherniak, D.J. Diffusion in Minerals and Melts; Mineralogical Society of America: Chantilly, VA, USA, 2010; ISBN 978-0-939950-86-7. [Google Scholar]
- Li, Y.; Yang, X.; Yu, J.-H.; Cai, Y.-F. Unusually high electrical conductivity of phlogopite: The possible role of fluorine and geophysical implications. Contrib. Mineral. Petrol. 2016, 171, 37. [Google Scholar] [CrossRef]
- Barsoukov, E.; Macdonald, J.R. Impedance Spectroscopy: Theory, Experiment, and Applications; John Wiley & Sons: Hoboken, NJ, USA, 2005; ISBN 0-471-64749-7. [Google Scholar]
- Yang, X.; Heidelbach, F. Grain size effect on the electrical conductivity of clinopyroxene. Contrib. Mineral. Petrol. 2012, 163, 939–947. [Google Scholar] [CrossRef]
- Huebner, J.S.; Dillenburg, R.G. Impedance spectra of hot, dry silicate minerals and rock: Qualitative interpretation of spectra. Am. Mineral. 1995, 80, 46–64. [Google Scholar] [CrossRef]
- Ure Jr, R.W. Ionic conductivity of calcium fluoride crystals. J. Chem. Phys. 1957, 26, 1363–1373. [Google Scholar] [CrossRef]
- Bollmann, W.; Görlich, P.; Hauk, W.; Mothes, H. Ionic conduction of pure and doped CaF2 and SrF2 crystals. Physica Status Solidi (A) 1970, 2, 157–170. [Google Scholar] [CrossRef]
- Réau, J.M.; Lucat, C.; Campet, G.; Portier, J.; Hammou, A. Application du tracé des diagrammes d’impédance complexe à la détermination de la conductivité ionique des solutions solides Ca1−xYxF2+x: Corrélations entre propriétés electriques et structurales. J. Solid State Chem. 1976, 17, 123–129. [Google Scholar] [CrossRef]
- Sata, N.; Eberman, K.; Eberl, K.; Maier, J. Mesoscopic fast ion conduction in nanometre-scale planar heterostructures. Nature 2000, 408, 946–949. [Google Scholar] [CrossRef] [PubMed]
- Champion, J.A. The electrical conductivity of synthetic fluorite. Br. J. Appl. Phys. 1965, 16, 805–809. [Google Scholar] [CrossRef]
- Barsis, E.; Taylor, A. Lattice Disorder in Some CaF2-Type Crystals. J. Chem. Phys. 1966, 45, 1154–1162. [Google Scholar] [CrossRef]
- Bollmann, W.; Henniger, H. Concentration and mobility of fluorine ion vacancies in CaF2. Physica Status Solidi (A) 1972, 11, 367–371. [Google Scholar] [CrossRef]
- Švantner, M.; Mariani, E. Influence of oxygen on electrical properties of CaF2 crystals. Kristall und Technik 1978, 13, 1431–1434. [Google Scholar] [CrossRef]
- Saito, Y.; Maier, J. Ionic conductivity enhancement of the fluoride conductor CaF2 by grain boundary activation using Lewis acids. J. Electrochem. Soc. 1995, 142, 3078–3083. [Google Scholar] [CrossRef]
- Oberschmidt, J.; Lazarus, D. Ionic conductivity, activation volumes, and frequency-dependent conductivity in crystals with the fluorite structure. Phys. Rev. B 1980, 21, 5823–5834. [Google Scholar] [CrossRef]
- Cherniak, D.J. Diffusion in carbonates, fluorite, sulfide minerals, and diamond. Rev. Mineral. Geochem. 2010, 72, 871–897. [Google Scholar] [CrossRef]
- Matzke, H. Fluorine self-diffusion in CaF2 and BaF2. J. Material. Sci. 1970, 5, 831–836. [Google Scholar] [CrossRef]
- Beyer, C.; Klemme, S.; Wiedenbeck, M.; Stracke, A.; Vollmer, C. Fluorine in nominally fluorine-free mantle minerals: Experimental partitioning of F between olivine, orthopyroxene and silicate melts with implications for magmatic processes. Earth Planet. Sci. Lett. 2012, 337, 1–9. [Google Scholar] [CrossRef]
- Bernini, D.; Wiedenbeck, M.; Dolejš, D.; Keppler, H. Partitioning of halogens between mantle minerals and aqueous fluids: Implications for the fluid flow regime in subduction zones. Contrib. Mineral. Petrol. 2013, 165, 117–128. [Google Scholar] [CrossRef]
- Roberge, M.; Bureau, H.; Bolfan-Casanova, N.; Frost, D.J.; Raepsaet, C.; Surble, S.; Khodja, H.; Auzende, A.-L.; Fiquet, G. Is the transition zone a deep reservoir for fluorine? Earth Planet. Sci. Lett. 2015, 429, 25–32. [Google Scholar] [CrossRef]
© 2019 by the authors. Licensee MDPI, Basel, Switzerland. This article is an open access article distributed under the terms and conditions of the Creative Commons Attribution (CC BY) license (http://creativecommons.org/licenses/by/4.0/).