Article

Grinding Optimization of Cassiterite-Polymetallic Sulfide Ore

1
College of Resources, Environment and Materials, Guangxi University, Nanning 530004, China
2
Guangxi Key Laboratory of Processing for Nonferrous Metallic and Featured Materials, Guangxi University, Nanning 530004, China
3
College of Resources and Civil Engineering, Northeastern University, Shenyang 110819, China
*
Author to whom correspondence should be addressed.
Minerals 2019, 9(2), 134; https://doi.org/10.3390/min9020134
Submission received: 27 November 2018 / Revised: 27 January 2019 / Accepted: 3 February 2019 / Published: 25 February 2019

Abstract

:
Due to the differences in beneficiation methods and mineral properties between cassiterite ore and polymetallic sulfide ore, there is an inherent contradiction between cassiterite overgrinding and sulfide ore undergrinding. A method to optimize and characterize the grinding performance is presented in this paper. In this method, the grinding characteristics are defined by the qualified particle size range index under unit energy consumption. By changing the grinding time, grinding concentration, and filling ratio, the optimized grinding conditions were evaluated, and they were predicted and verified by the response surface method. The results corroborate that when the grinding time of cassiterite is 4 min and the grinding time of sulfide ore is 8 min, the grinding qualified size range index under unit energy consumption is the largest. Cassiterite is brittle and easy to grind due to low hardness, while sulfide is difficult to grind due to high hardness. Hence, the time to beneficiate tin ore is when the grinding time is 4 min, and that to beneficiate sulfide ore is when the regrinding time is approximately 4 min. In this way, the contradiction between overgrinding cassiterite and undergrinding sulfide ore can be alleviated on the basis of the most effective utilization of grinding energy. The optimal grinding concentration and filling ratio are 65% and 37%, respectively. The response surface prediction and test results are almost identical, with an error of ±2%. Thus, the effectiveness of grinding characterization method is verified.

1. Introduction

The Dachang ore field in Guangxi China is an important resource base with tin, lead, antimony, zinc. The main resource is cassiterite polymetallic sulfide ore. The primary useful minerals of cassiterite polymetallic sulfide ore are cassiterite, pyrite, pyrrhotite, arsenopyrite, sphalerite, jamesonite, and small amounts of sphalerite, tetrahedrite tin, galena, and chalcopyrite. Gangue minerals are mainly quartz and calcite [1]. This type of tin ore must be comprehensively utilized because of its many associated mineral components and complex occurrence of elements. A tin concentrator should consider not only the enrichment and separation of main minerals, but also the comprehensive recovery of minor minerals and dispersed elements. There are many mineral products and many ore dressing methods, and the ore dressing process is complex. Therefore, it is difficult to regulate and manage the production of a tin concentrator for this type of ore, among which the adjustment and control of grinding operation are the most complex [2].
It is well known that the particle size characteristics of grinding products have a significant impact on the efficiency of subsequent separation operations. Optimal operation of grinding and particle size control of grinding products are key technologies that need to be solved urgently in the field of mineral processing and powder engineering. However, for different ores, the importance and difficulty of grinding optimization operation and grinding product size control are different. Production practice shows that the most important but also the most difficult problems for tin concentrators dealing with cassiterite polymetallic sulphide ores are the optimal operation of grinding operations and the particle size control of grinding products. The reasons are as follows: (1) cassiterite and sulfide minerals have great differences in physical and mechanical properties, and selective fragmentation is obvious. Compared with sulphide minerals, cassiterite is brittle and fragile, with high density and is easy to settle and enrich in grinders and classifications. Therefore, cassiterite is often preferentially broken and repeatedly broken in grinders, which makes cassiterite easy to enrich in fine grains of grinding products and increases the difficulty of recovery. (2) Different processing methods exist between cassiterite and sulfide minerals. The required grinding size is also different. Sulfide minerals are usually enriched and separated from each other by flotation. They are suitable for feeding materials ranging approximately −0.15 + 0.010 mm, so the ore needs to be finely ground. The main method of enriching and recovering cassiterite is gravity separation, and the optimal particle size range is approximately −0.25 + 0.075 mm, hence requiring coarsely ground ore [3,4,5,6,7,8]. It is difficult to satisfy both the requirements of rough grinding of cassiterite and fine grinding of sulfide, and this finally results in a large amount of cassiterite that is ground to a fine level, with a high loss rate of tin tailings that is difficult to recover.
It is not adequate to make the grinding particle size coarse so as to reduce the generation of fine cassiterite, which will lead to inadequate dissociation of sulfide ore; moreover, the quality of the flotation concentrate is poor, and the metal mutual loss is serious [3]. Therefore, there is an inherent contradiction between cassiterite overgrinding and sulfide ore undergrinding, which leads to low-grade sulfide concentrate, a serious loss of cassiterite and a waste of mineral resources. In order to tackle this issue, many studies have been conducted on the optimization of grinding media, grinding circuits and grinding models [9,10,11,12,13]. However, there is little research on the optimization method of grinding process. Thus, research on a characterization method for grinding process control of the cassiterite polymetallic sulfide ore grinding effect is urgently needed.
Through grinding optimization, target particle size and the dissociation of useful minerals can be judged. Therefore, under the premise of achieving the target size and high grinding energy efficiency, the innovation of this paper is to make the distribution of useful mineral metals accumulate as much as possible in the target particle size range. Therefore, this paper proposes a grinding optimization characterization method, namely, the unit-energy consumption of metal-grade accumulation of qualified particle size, to characterize the grinding characteristics of the required particle size. The optimum conditions of cassiterite polymetallic sulfide ore were studied. In addition, the response surface method was used to predict and verify the optimization conditions by changing the three grinding operation factors, i.e., the grinding time, grinding concentration, and filling ratio.

2. Materials, Equipment and Methods

2.1. Materials and Equipment

Experimental materials of cassiterite polymetallic sulfide ore were obtained from the Dachang ore field in Guangxi, China. The main useful minerals of cassiterite polymetallic sulfide ore were marmatite, cassiterite, pyrite, pyrrhotite, jamesonite, arsenopyrite, and marcasite. The main gangue minerals were quartz and calcite. All samples were broken into −1.7 mm particles after cleaning, drying, crushing, mixing and reduction processes. The test equipment mainly included a laboratory jaw crusher, conical ball mill, Bond power index ball mill, vibration screen and oven.

2.2. Methods

Grinding is the process of first grinding a material into a particle size (such as a) and then specifying a particle size (such as b) that was over-grinded. Accordingly, the particle size between a and b was the required particle size. The grinding technical efficiency can be used to evaluate the efficiency of the required granularity [1]. The grinding technical efficiency is defined as the grinding efficiency of particle size a minus the grinding efficiency of particle size b, with the mathematical expression of grinding efficiency shown in Equation (1).
E = ( γ γ 1 100 γ 1 γ 3 γ 2 100 γ 2 )
where E represents the grinding technical efficiency (%); γ represents the yield of the grinding product, which is less than particle size a (%); γ1 represents the yield of the grinding feed, which is less than particle size a (%); γ2 represents the yield of the grinding feed, which less than particle size b, %; and γ3 represents the yield of the grinding product, which is less than particle size b (%). The higher the grinding efficiency, the higher the particle size requirements, and the better the grinding effect produced.
Grinding technical efficiency can be used to characterize the cumulative effect of the qualified particle size. Moreover, the metal distribution rate can characterize the metal grade ratio of the qualified particle size. These two products can represent the cumulative effect of the metal grade on the qualified particle size. The larger the product, the greater the metal grade accumulation in the qualified particle size, and the better the grinding effect produced. The two relations are shown in Equation (2).
W = E D
Here, W can be expressed as a mathematical quantity related to the accumulation of the qualified particle size metal grade. The concept of the qualified particle size index of the grinding can be used to characterize it (%)2, and D is the metal distribution rate (%).
As mentioned in the previous article, different minerals have different particle sizes suitable for separation, and the separation method is also inconsistent. Sulfide minerals are usually enriched and separated from each other by flotation, and the optimal feeding particle size range is approximately −0.15 + 0.010 mm. The main method of enriching and recovering cassiterite is gravity separation, and the optimal feeding particle size range is approximately −0.25 + 0.075 mm. To fulfill the requirements of the actual concentrator and provide more precise test data, −0.23 + 0.075 mm was chosen as the requirement grade for cassiterite in cassiterite-polymetallic sulfide ore, i.e., the grinding particle size a of cassiterite was 0.23 mm and the grinding particle size b was 0.075 mm. In addition, −0.15 + 0.038 mm was chosen as the requirement grade for sulfide ore in cassiterite-polymetallic sulfide ore, with grinding particle size a of sulfide ore at 0.23 mm and grinding particle size b at 0.075 mm.
An example can be given to illustrate the calculation process when the grinding time is 2 min, as shown Table 1 and Table 2.
For calculating the cumulative effect of the metal grade on the qualified particle size of cassiterite and sulfide ore, the first step is to calculate the yield of each particle size by grinding and sieving. The second step is to confirm the target particle size of grinding technology efficiency. The target grade of cassiterite is −0.23 mm + 0.075 mm and that of sulfide ore is −0.15 + 0.038 mm, and the grinding technology efficiency is calculated by Equation (1). The third step is to confirm the metal distribution rate and analyze the metal distribution rate of the target particle size through laboratory analysis. The fourth step is to calculate the metal accumulation in qualified particle size. The metal accumulation in each particle size can be obtained by multiplying the grinding technical efficiency and the metal distribution rate by Equation (2), which is the W value.
Based on the concept of qualified grinding particle size index, the Equation of grinding energy consumption is put forward. The relation between grinding characteristic formula and the grinding energy consumption of the ball mill is discussed and the ratio between the grinding qualified particle size index and the energy consumption of grinding is compared. The ratio is signified by symbolic M, as shown in Equation (3) to represent the optimization effect of grinding; the M value can be called grinding optimization degree.
M = W W C
The energy consumption of grinding can be solved by the Bond work index, and its expression is shown as follows:
W C = 10 W I B P 10 W I B F
where WC is the work consumed by crushing materials, kw∙h; and WIB is the work index, kw·h·t1. P and F respectively represent 80% generation particle size and the ore feeding particle size through the mesh size (µm).
As for how to determine the ball work index, the Bond ball work index formula uses a 305 mm × 305 mm ball mill, as shown in Equation (5).
W I B = 4.904 P i 0.23 G r p 0.82 ( P 0.5 F 0.5 )
Here, WIB is the work index, kw∙h∙t1; and Pi is the sieve size of the test (µm). The ball mill produces a new material smaller than Pi per lap, g∙R1. P and F respectively represent 80% generation particle size and the ore feeding particle size through the mesh size (µm).
The grinding energy consumption under each grinding condition can be calculated by Equation (4) and Equation (5) as shown in Table 3. WIB can be calculated by the Bond ball mill test [14]. P and F can be calculated by the undersized yield in grinding tests.

3. Grinding Tests

The bond ball mill work index test for the cassiterite polymetallic-sulfide ore milling bond work index is WIB = 15.10. The grinding energy consumption can be obtained under the condition of arbitrary grinding.

3.1. Effect of Grinding Time

The grinding test conditions were listed as follows: grinding time was set at 2 min, 4 min, 6 min, 8 min and 10 min; the grinding concentration at 65%; the filling ratio at 32%; the grinding particle size at −1.7 mm and the rotational speed ratio at 80%. The effect of grinding time on grinding optimization degree of the cassiterite sulfide ore is shown in Table 4, Table 5 and Table 6, and Figure 1 and Figure 2. Sn is the metal element in the mineral cassiterite, Pb and Zn are the metal elements in sulfide minerals.
Through the analysis of Table 4, Table 5 and Table 6 and Figure 1 and Figure 2, the grinding optimization degree of the cassiterite and sulfide ore are the greatest when the grinding time is set at 4 min and 8 min, respectively. This finding indicates that the cassiterite ore possesses good brittleness, low hardness and is easy to grind, while the sulfide ore has high hardness and is difficult to grind. Accordingly, the grinding optimization method can be proposed, that is, after the sequencing of tin grinding for 4 Min, another 4 min grinding is conducted to sort the sulfide ore. This process can alleviate the conflict of cassiterite overgrinding and sulfide ore undergrinding, and the grinding energy can also be utilized most efficiently.

3.2. Effect of Grinding Concentration

Grinding concentration refers to the percentage of minerals in the total pulp quality. The grinding concentration directly affects the grinding efficiency. The grinding test conditions were as follows. The grinding concentration was set at 35%, 45%, 55%, 65%, 75% and 85%, the grinding time at 6 min, the filling ratio at 32%, the grinding particle size at −1.7 mm, and the rotational speed rate at 80%. The effect of the grinding concentration on the grinding optimization degree of the cassiterite sulfide ore is shown in Table 7, Table 8 and Table 9 and Figure 3 and Figure 4.
If the grinding concentration is too high, the coarse and fine particles will not flow, and the steel ball will not play its role; if the grinding concentration is too low, the flow speed of the ore particles in the grinder will be high, and the chance of being impacted by the steel ball will be reduced. Therefore, suitable grinding concentration is very important for grinding efficiency. According to the analysis of Table 7, Table 8 and Table 9 and Figure 3 and Figure 4, the grinding optimization degree of the cassiterite sulfide ore is the highest when the grinding concentration is 65%.

3.3. Effect of the Grinding Filling Ratio

The grinding test conditions were as follows. The grinding filling ratio was set at 22%, 27%, 32%, 37% and 42%, the grinding time at 6 min, the grinding concentration at 65%, the filling ratio at 32%, the grinding particle size at −1.7 mm and the rotational speed rate at 80%. The effect of the grinding filling ratio on the grinding optimization degree of the cassiterite sulfide ore is shown in Table 10, Table 11 and Table 12 and Figure 5 and Figure 6.
When other factors remain unchanged, the grinding efficiency can be improved by properly increasing the filling ratio. If the filling ratio is too large, the probability of medium throwing motion is greatly reduced, and the liner wear is serious, which is not conducive to grinding. Through the analysis of Table 10, Table 11 and Table 12 and Figure 5 and Figure 6, the grinding optimization degree is the highest when the grinding filling ratio is 37%.

4. Prediction and Verification of Optimization Conditions

The prediction and verification of optimization conditions are based on a response surface method. The principle of this method is regression design, which involves finding the quantitative relationship between variables and independent variables. By analyzing the regression equation, the optimal process parameters were found, and the multivariable statistical method was solved by experimental analysis. According to the optimum grinding conditions, the prediction and verification experiments were carried out. The response surface method can be used to determine the optimum conditions for grinding time, grinding concentration, and filling ratio of the medium.

4.1. Prediction Test of Grinding Parameters

In this experiment, three parameters—grinding time, grinding concentration, and filling ratio, expressed by X1, X2 and X3, respectively—were selected to analyze the response surface. The grinding optimization degree of Sn, Pb, and Zn was selected as the evaluation index of the response surface optimization in cassiterite polymetallic sulfide ore. These were called face values, with surface test values and surface predictive values included. Cassiterite mineral was represented by Sn, and the sulfide minerals were represented by Pb and Zn, and M1, M2 and M3 were used to represent the predicted values of Sn, Pb, Zn.
Based on the selected grinding parameters, 17 test combinations of three factors and three levels were designed from the Box–Behnken model. The test sequence was randomly generated by Design Expert 8.0.7 software, and the experimental value ranges of Sn, Pb and Zn were 1.87–5.78, 3.50–4.93, and 3.86–5.77. The analysis shows that the correction coefficient and complex correlation coefficient of three metals in Sn, Pb and Zn are the highest. These two models can be used as the regression equation between the surface test value and the grinding parameter. Through the Design Expert 8.0.7 software analysis and calculation, the fitting equations for Sn, Pb and Zn between the surface test value and the grinding parameter are shown in Equations (6), (7) and (8), with X1, X2, and X3 representing encoded values.
M 1 = 5.76 0.32 X 1 0.58 X 2 0.21 X 3 0.43 X 1 X 2 0.33 X 1 X 3 0.76 X 2 X 3 1.12 X 1 2 1.08 X 2 2 0.59 X 3 2
M 2 = 4.89 + 0.03 X 1 + ( 7.500 E 003 ) X 2 + 0.018 X 3 ( 7.500 E 003 ) X 1 X 2 0.21 X 1 X 3 + 0.083 X 2 X 3 0.46 X 1 2 0.87 X 2 2 0.30 X 3 2
M 3 = 5.71 + 0.016 X 1 ( 2.500 E 003 ) X 2 + 0.029 X 3 0.02 X 1 X 2 0.18 X 1 X 3 0.11 X 2 X 3 0.73 X 1 2 1.01 X 2 2 0.48 X 3 2
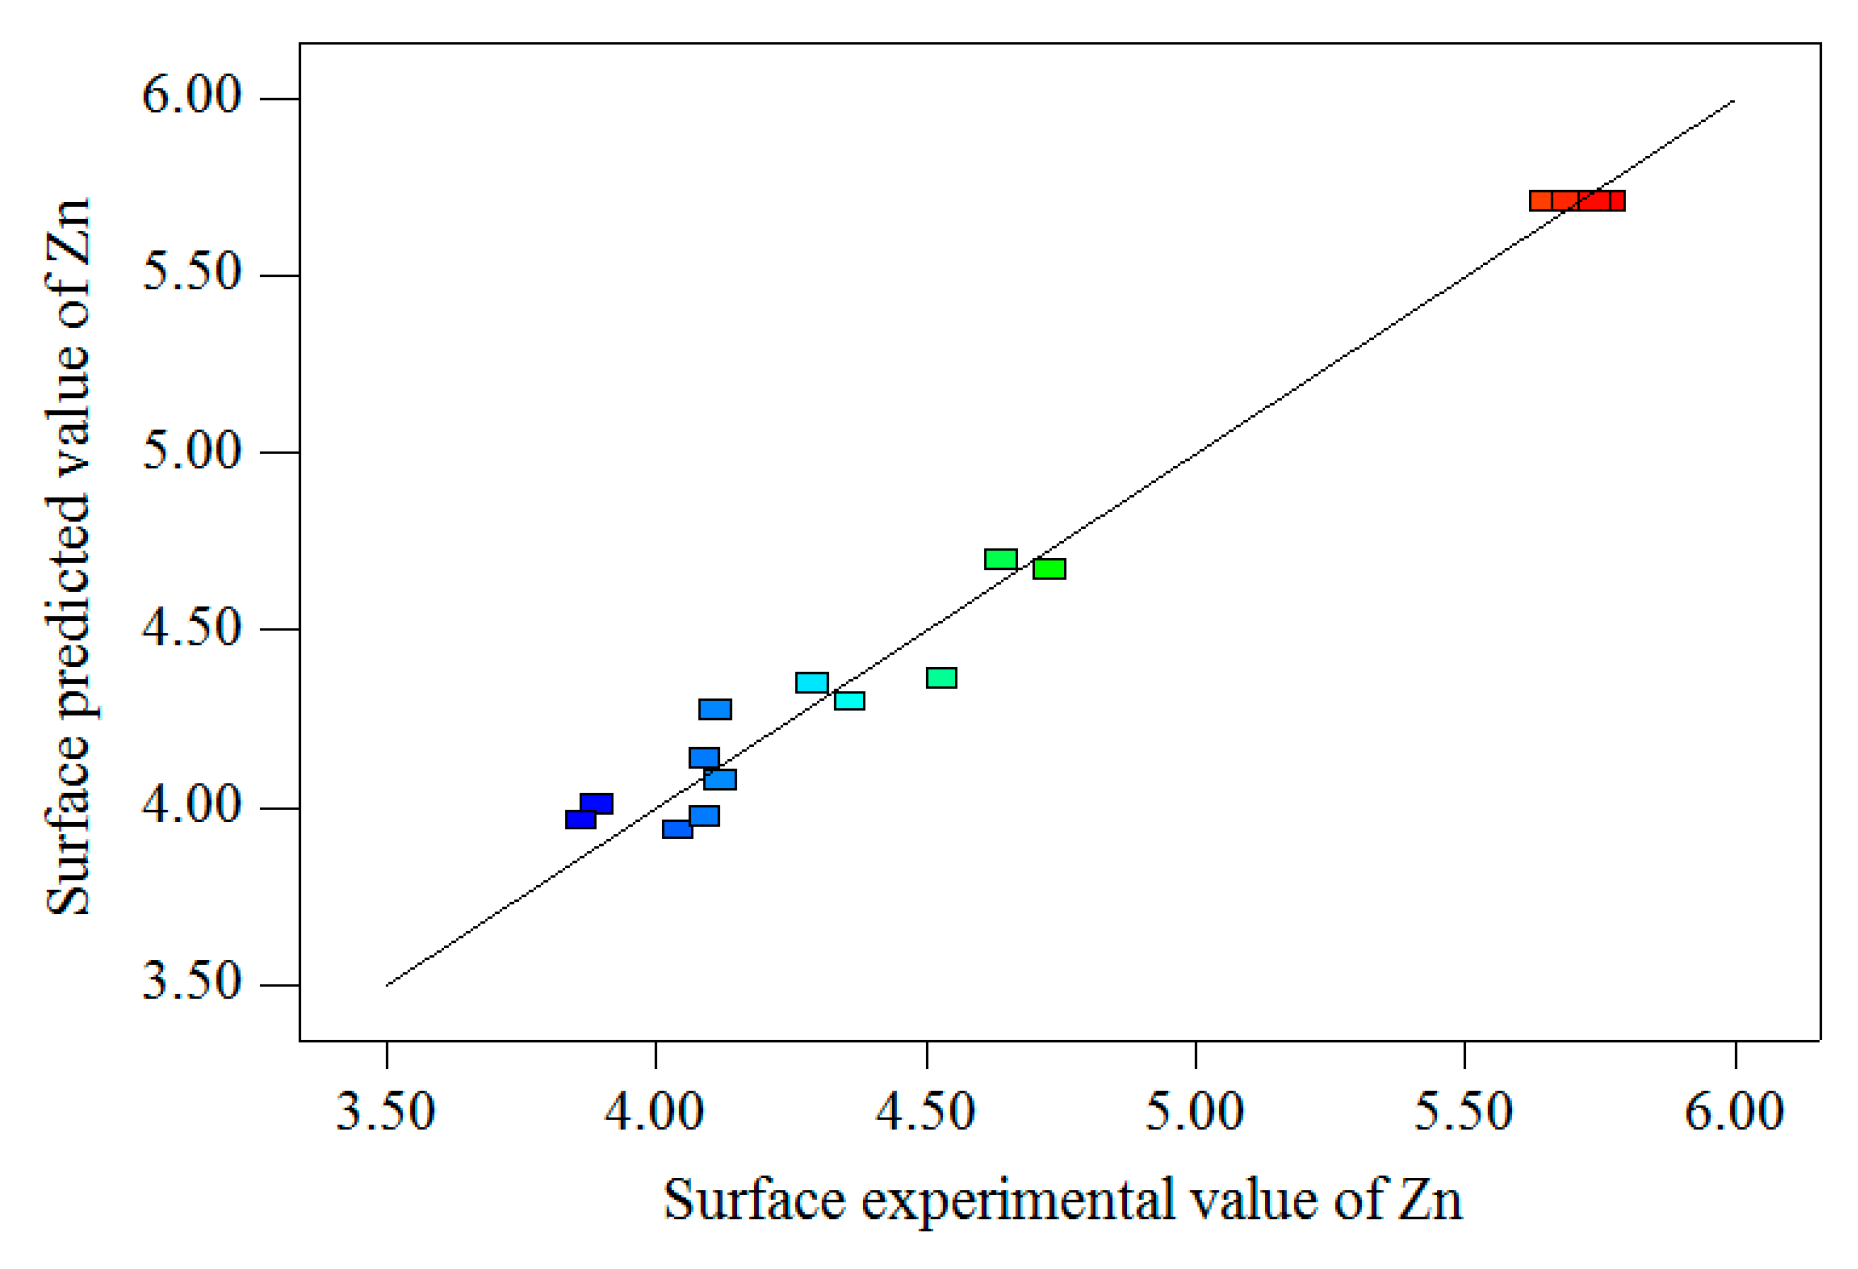
The surface test values, model predictive values and residuals of Sn, Pb and Zn metal elements are shown in Figure 7 and Figure 8, respectively. As shown in Figure 7 and Figure 8, the experimental values and predicted values have a high fitting degree, indicating that the fitting of Equations (6), (7), and (8) can well describe the relationship between the surface test values and grinding parameters.
Figure 9, Figure 10, Figure 11, Figure 12, Figure 13, Figure 14, Figure 15, Figure 16 and Figure 17 is a three-dimensional (3D) response surface map and a contour map for Sn, Pb, and Zn in response to a par value. The influence of two variables on the dependent variable can be more intuitively observed by the 3D response surface map. The contour map is a projection of the response surface graph.
As shown in Figure 9, Figure 10 and 
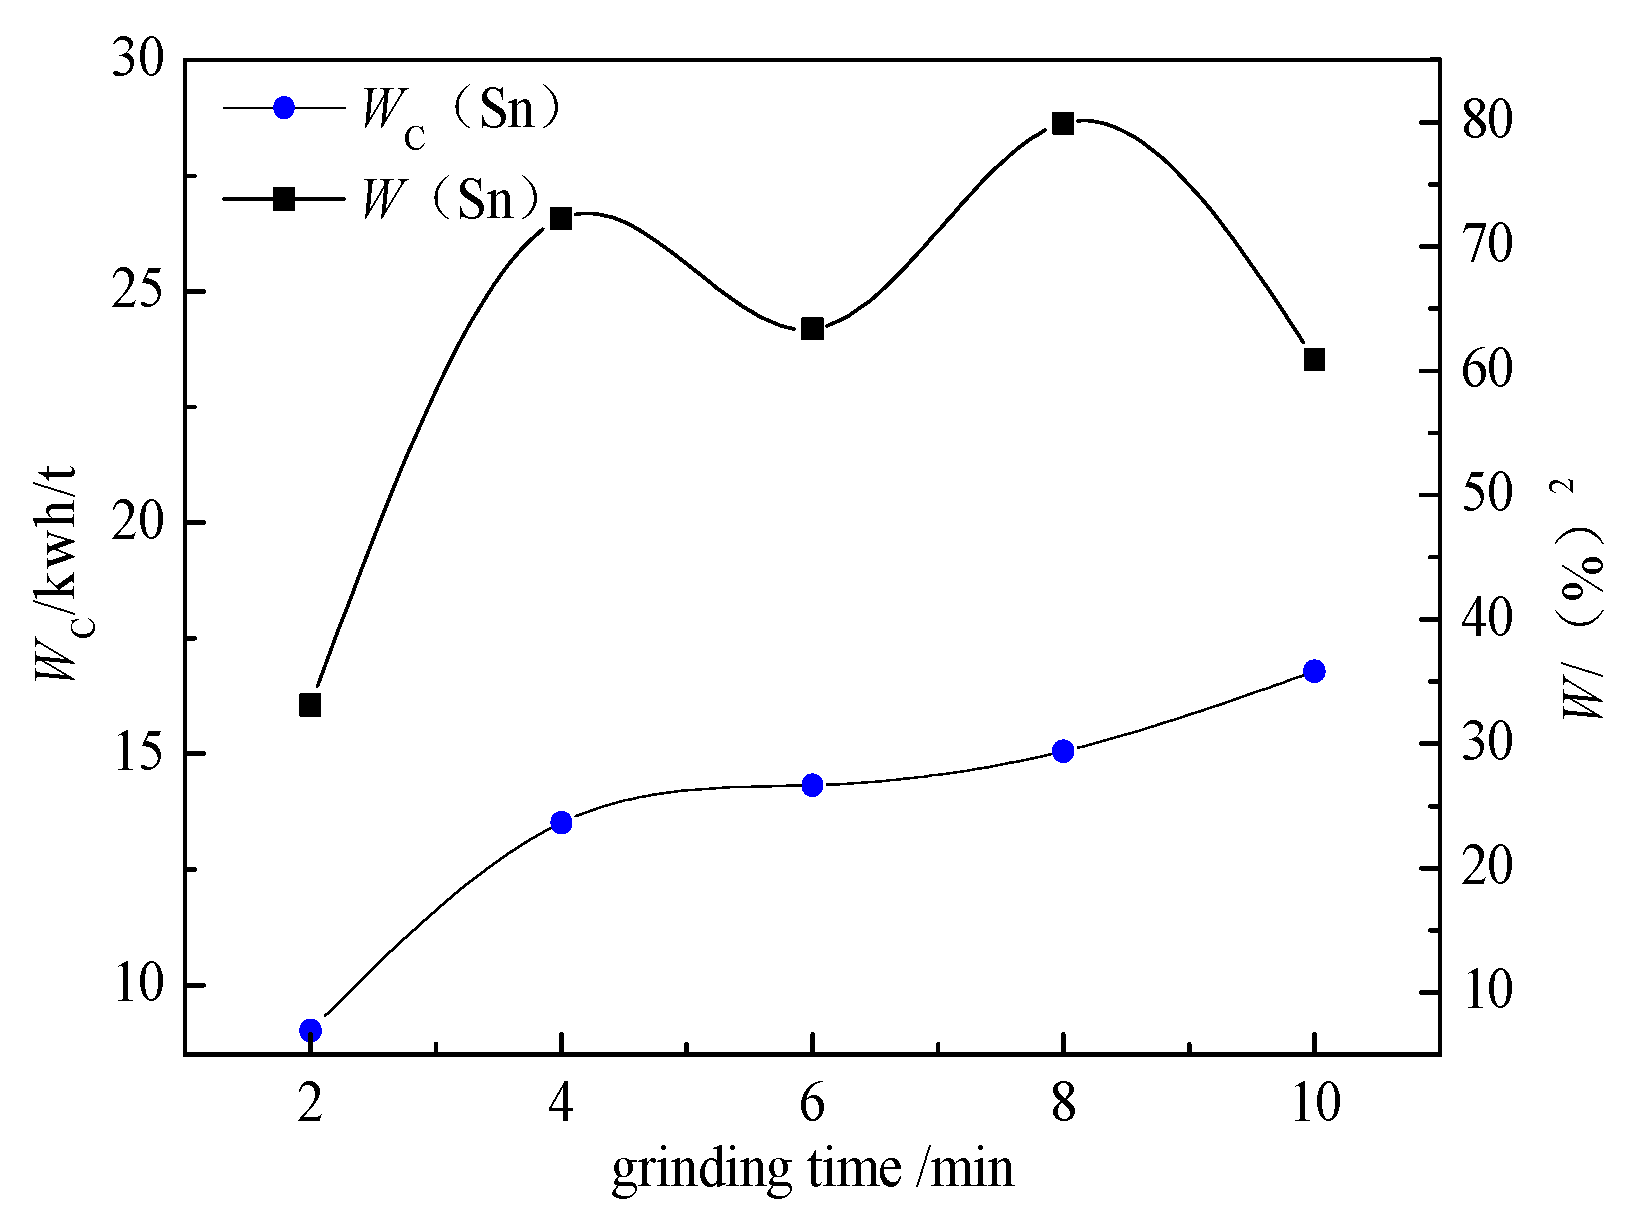
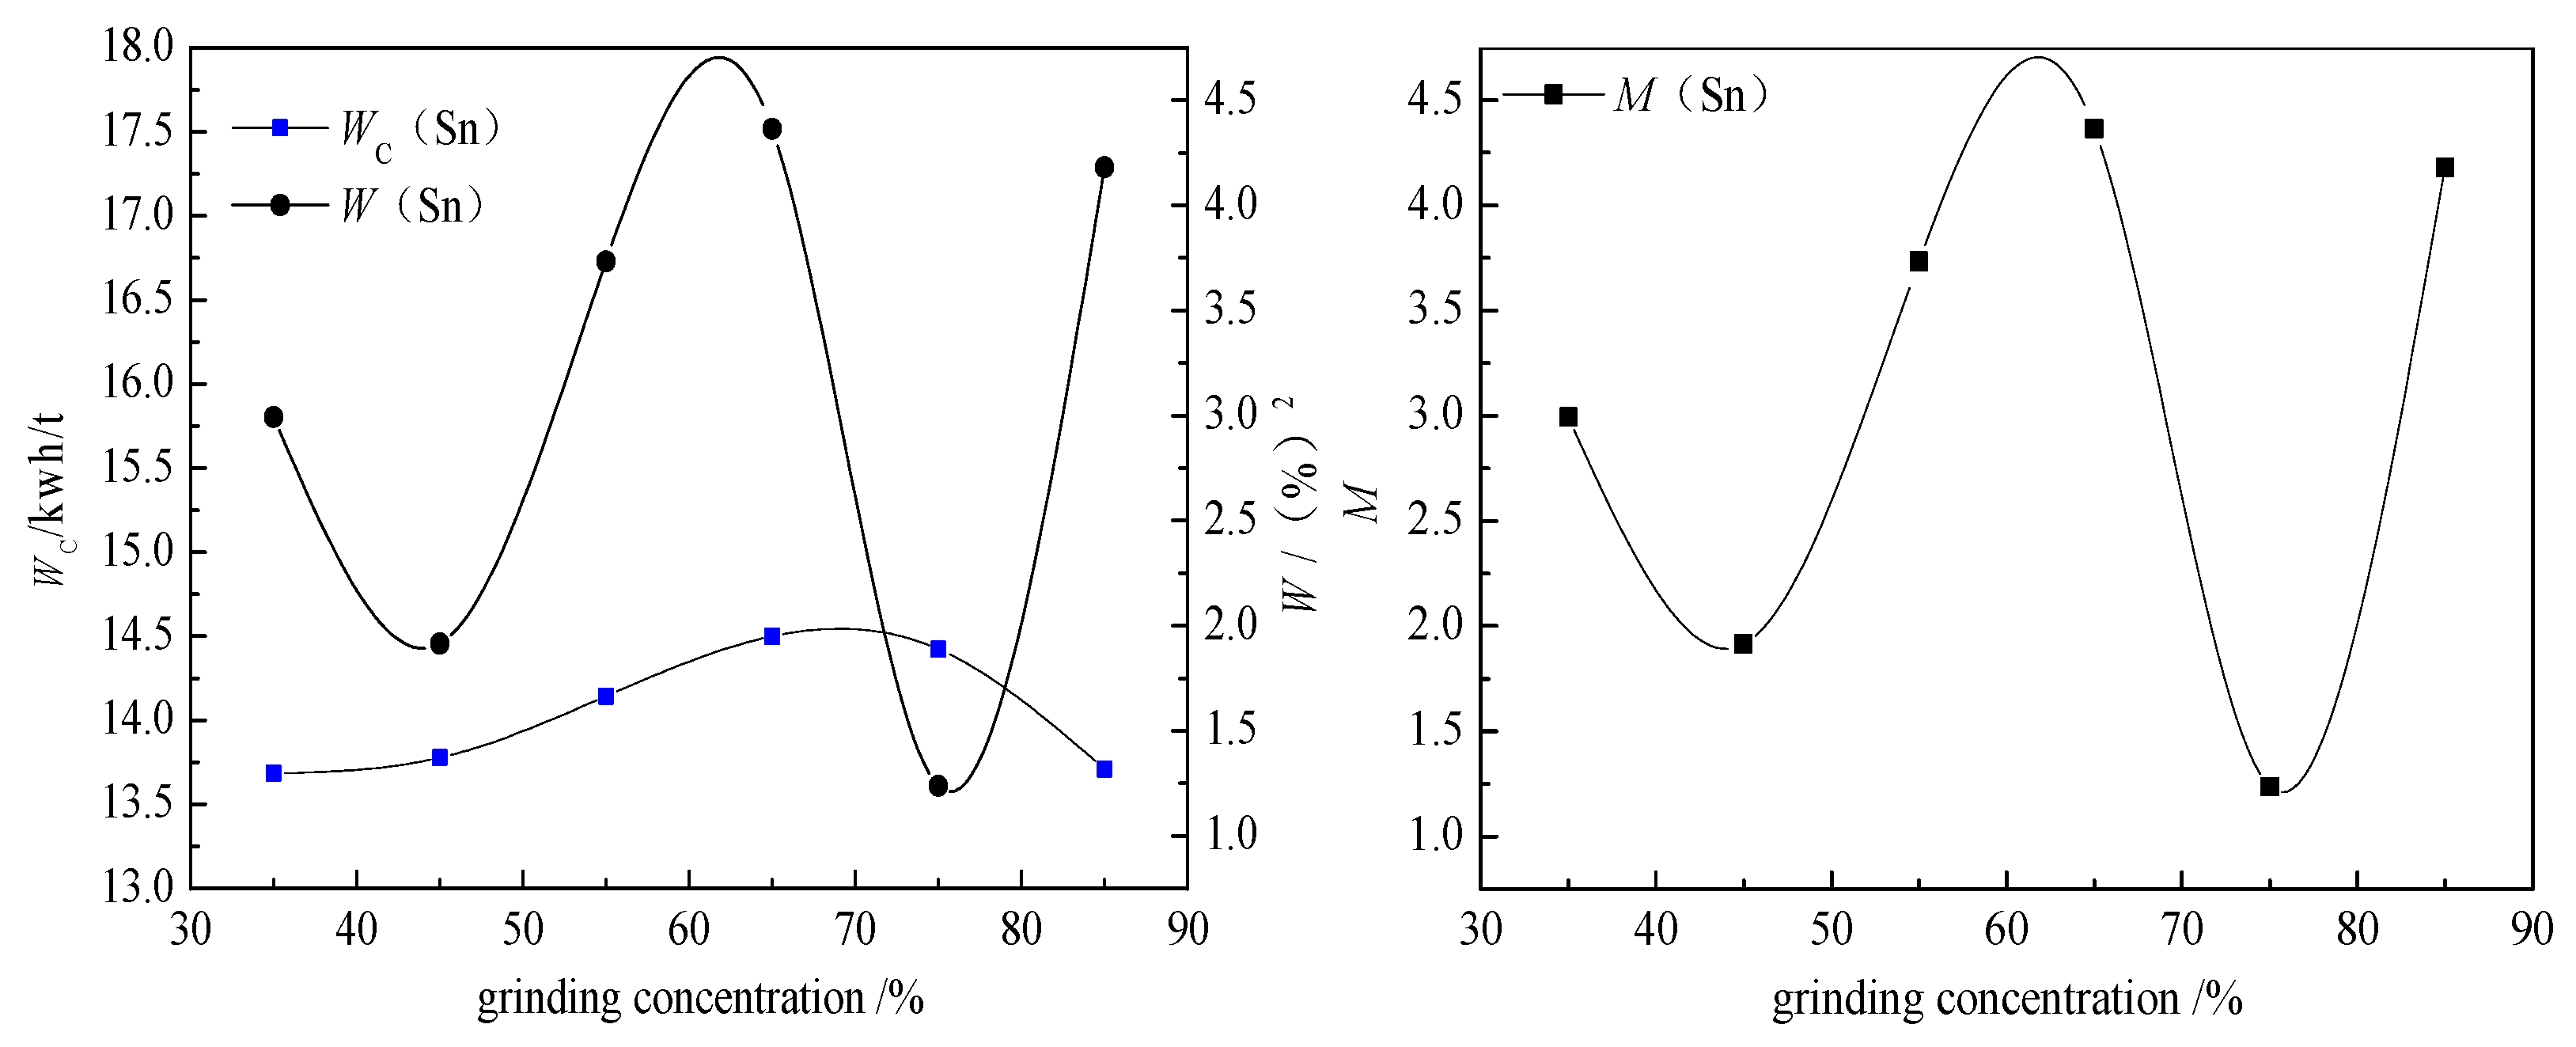
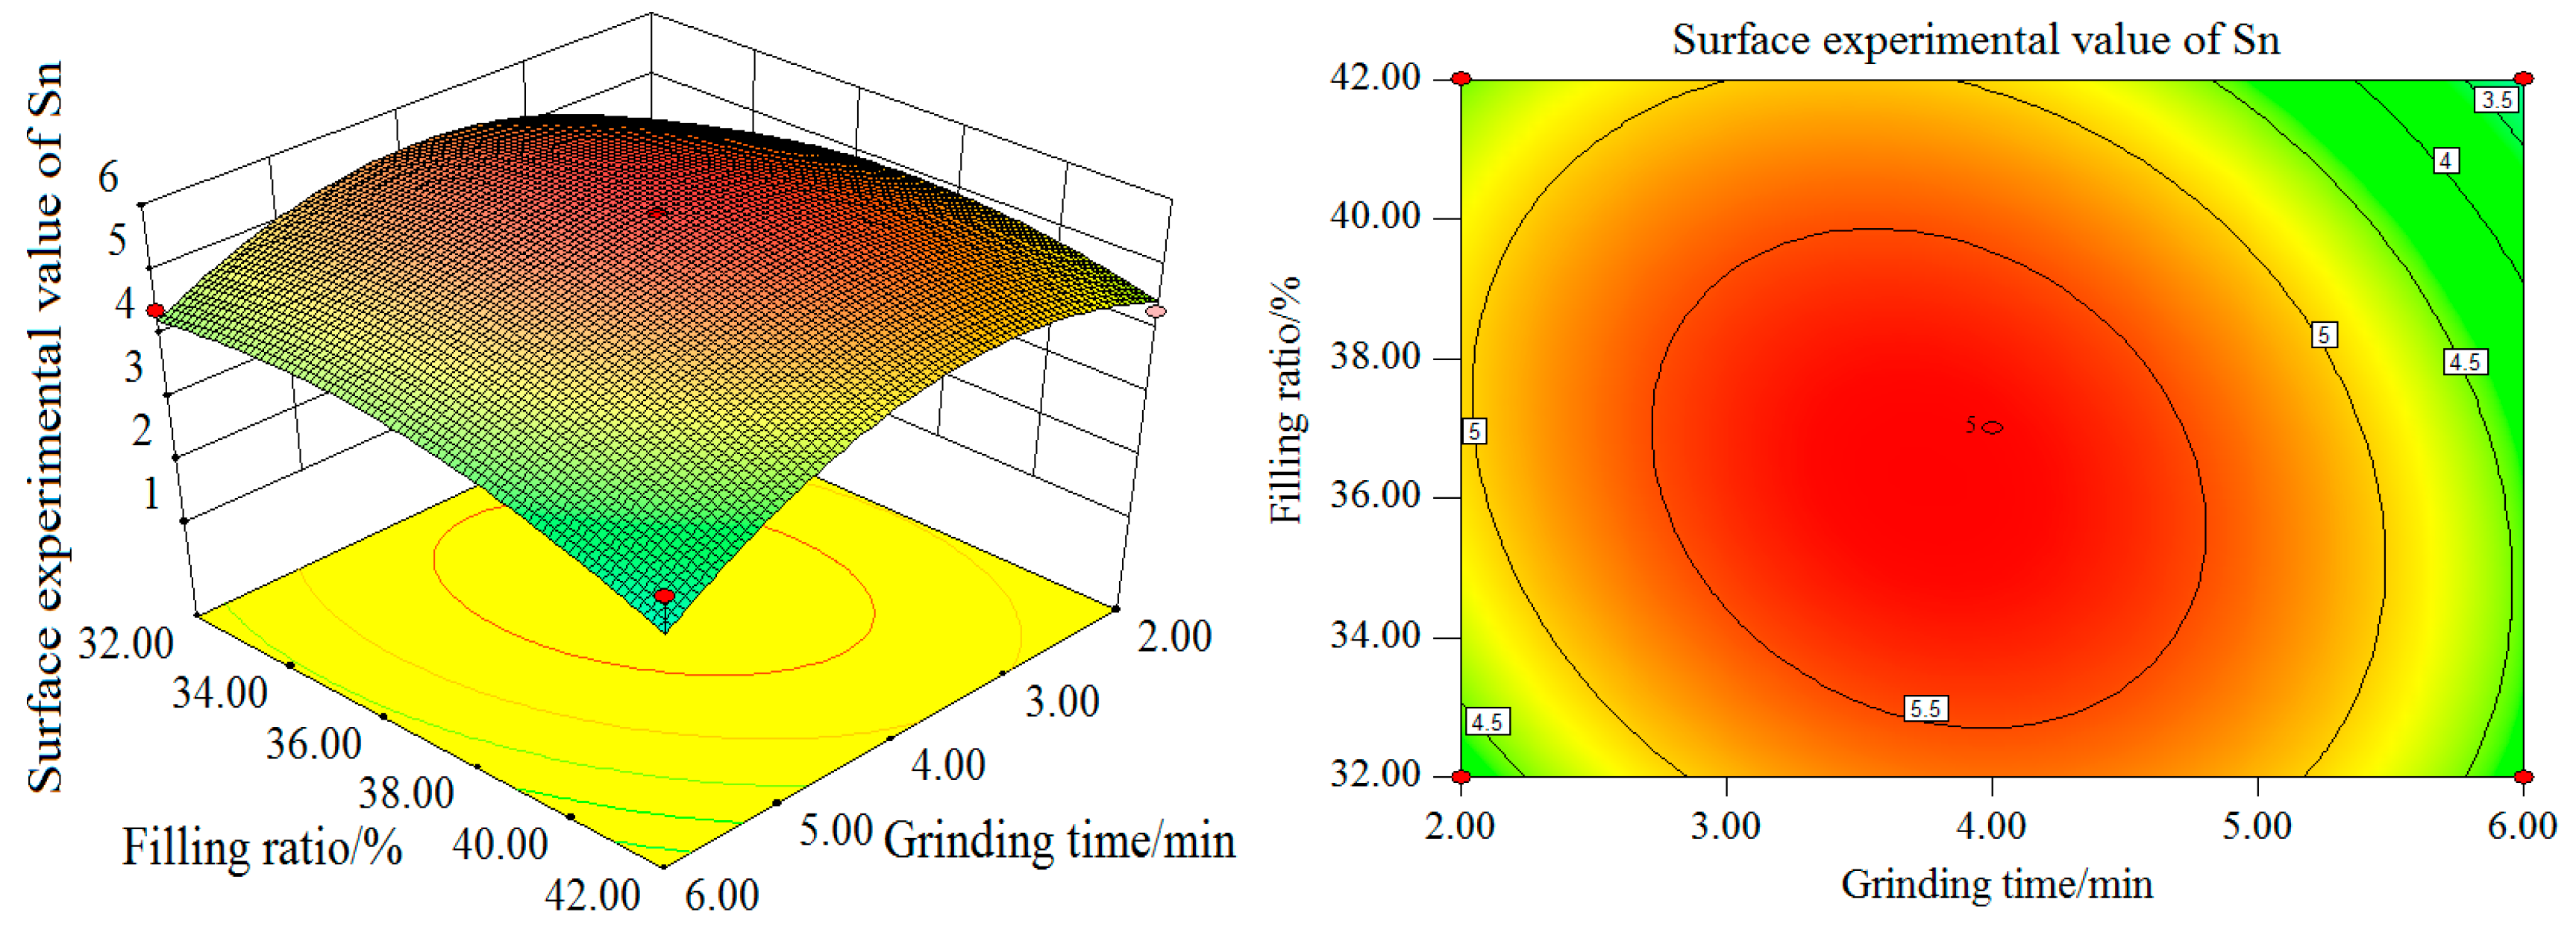
Figure 11, with the increase of grinding time and grinding concentration, the Sn surface test value firstly increases and then decreases, with the value reaching its maximum at grinding time of 4 min and grinding concentration of 65%. In terms of the single factor, the grinding time and grinding concentration have a significant influence on the experimental value of the Sn curved surface. As can be seen from the contour map, the interaction between grinding time and grinding concentration is more significant. The influence curve between the filling ratio and grinding time on the experimental value of the Sn curved surface also shows a trend of increasing first and then decreasing. When the grinding time is 4 min and the filling ratio is about 37%, the maximum Sn surface test value can be obtained. In terms of the single factor, the influence of grinding time on the experimental value of the Sn surface is greater than that of the filling ratio.
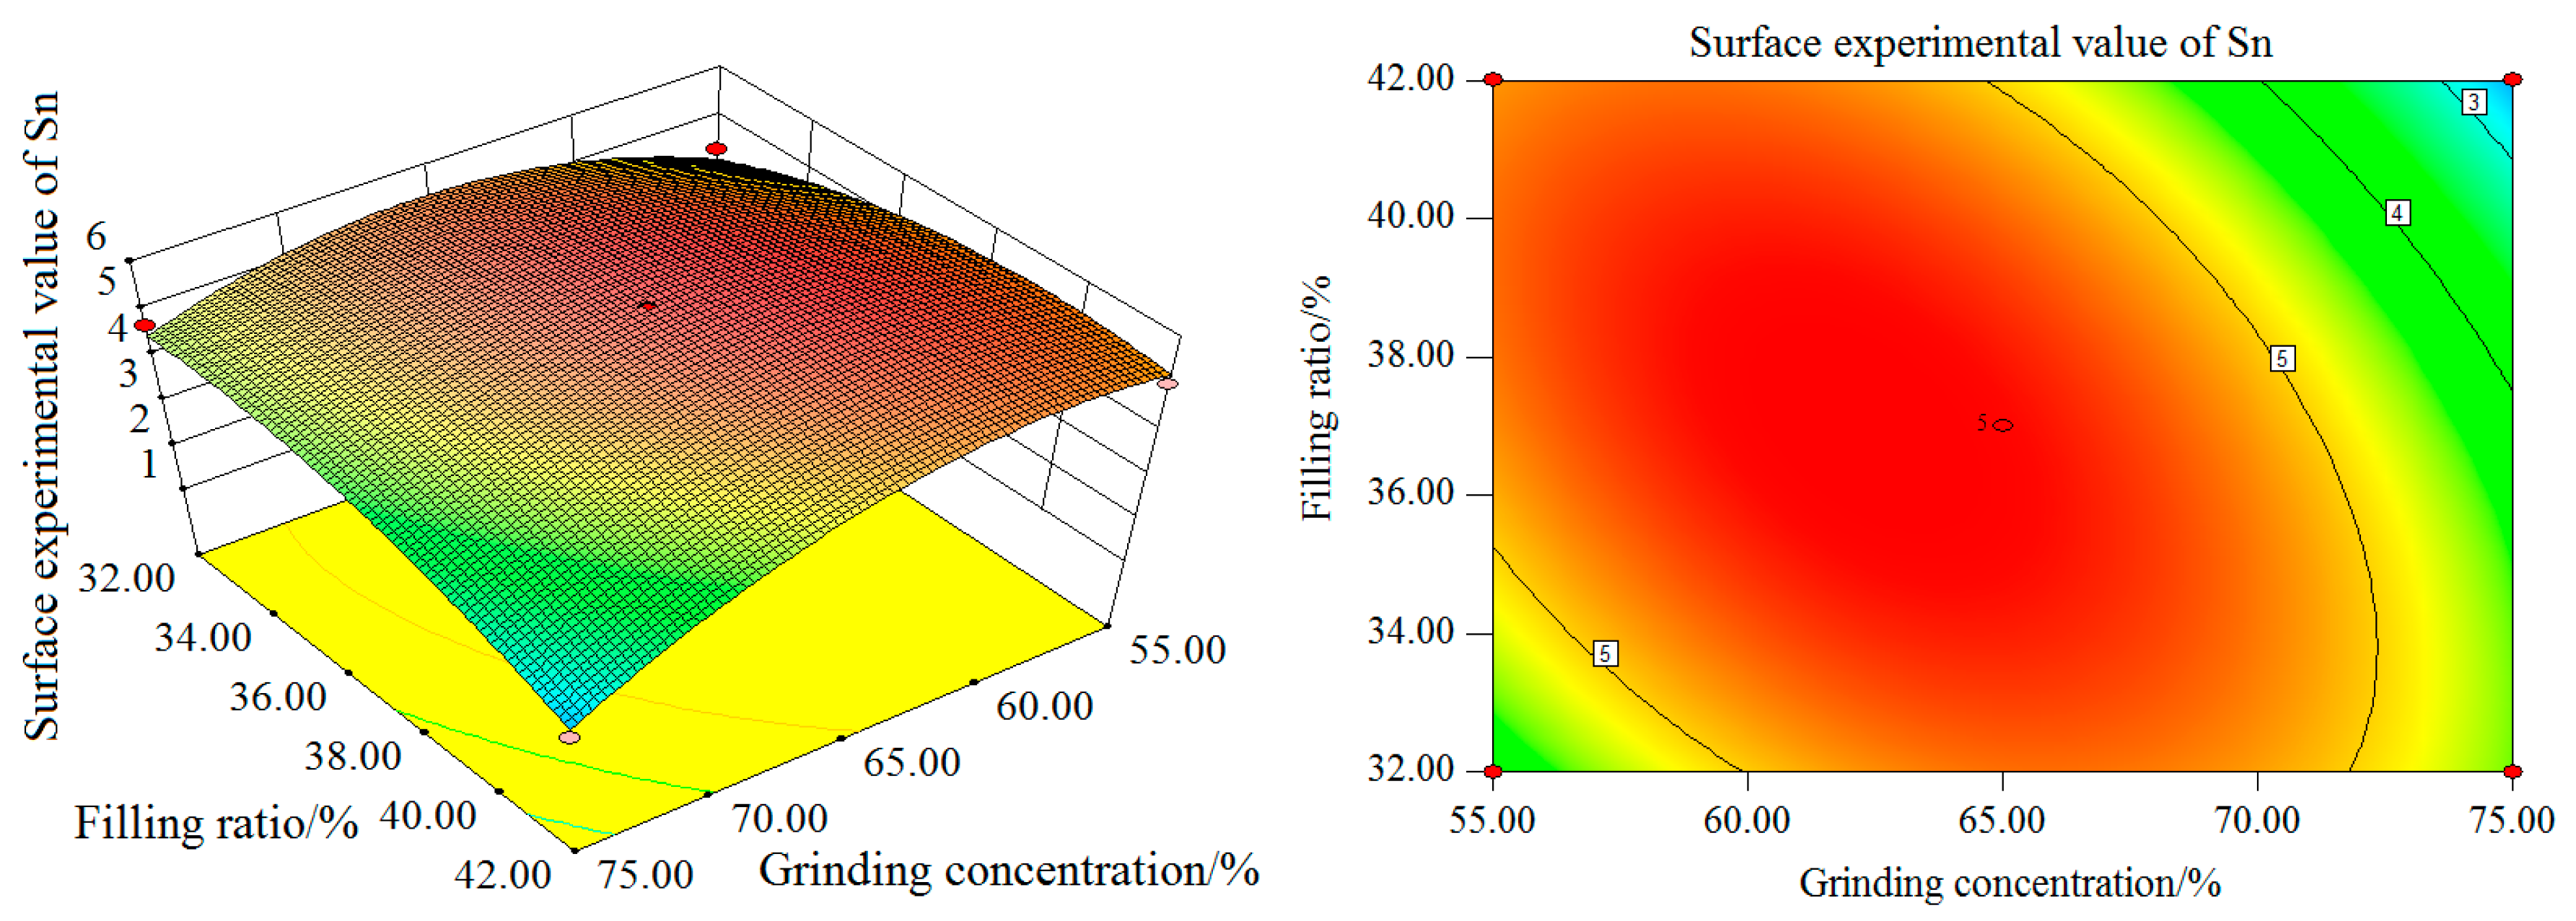
As can be seen from the contour map, the interaction between grinding time and the filling ratio is more significant. With the increase of the grinding concentration and filling ratio, the Sn surface test value increases first and then decreases. The maximum value is reached when the grinding concentration is 65% and the filling ratio about 37%. In terms of the single factor, the influence of the grinding concentration on the experimental value of the Sn surface is greater than that of the filling ratio.
The contour map shows that the interaction between the grinding concentration and filling ratio is not significant. In summary, the order of influence degree on Sn surface test value from high to low is as follows: grinding time, grinding concentration, and filling ratio. The interaction between the grinding concentration and filling ratio is weak, while the interaction between the grinding time and grinding concentration and between the grinding time and filling ratio, is stronger.
As shown in Figure 12, Figure 13 and 
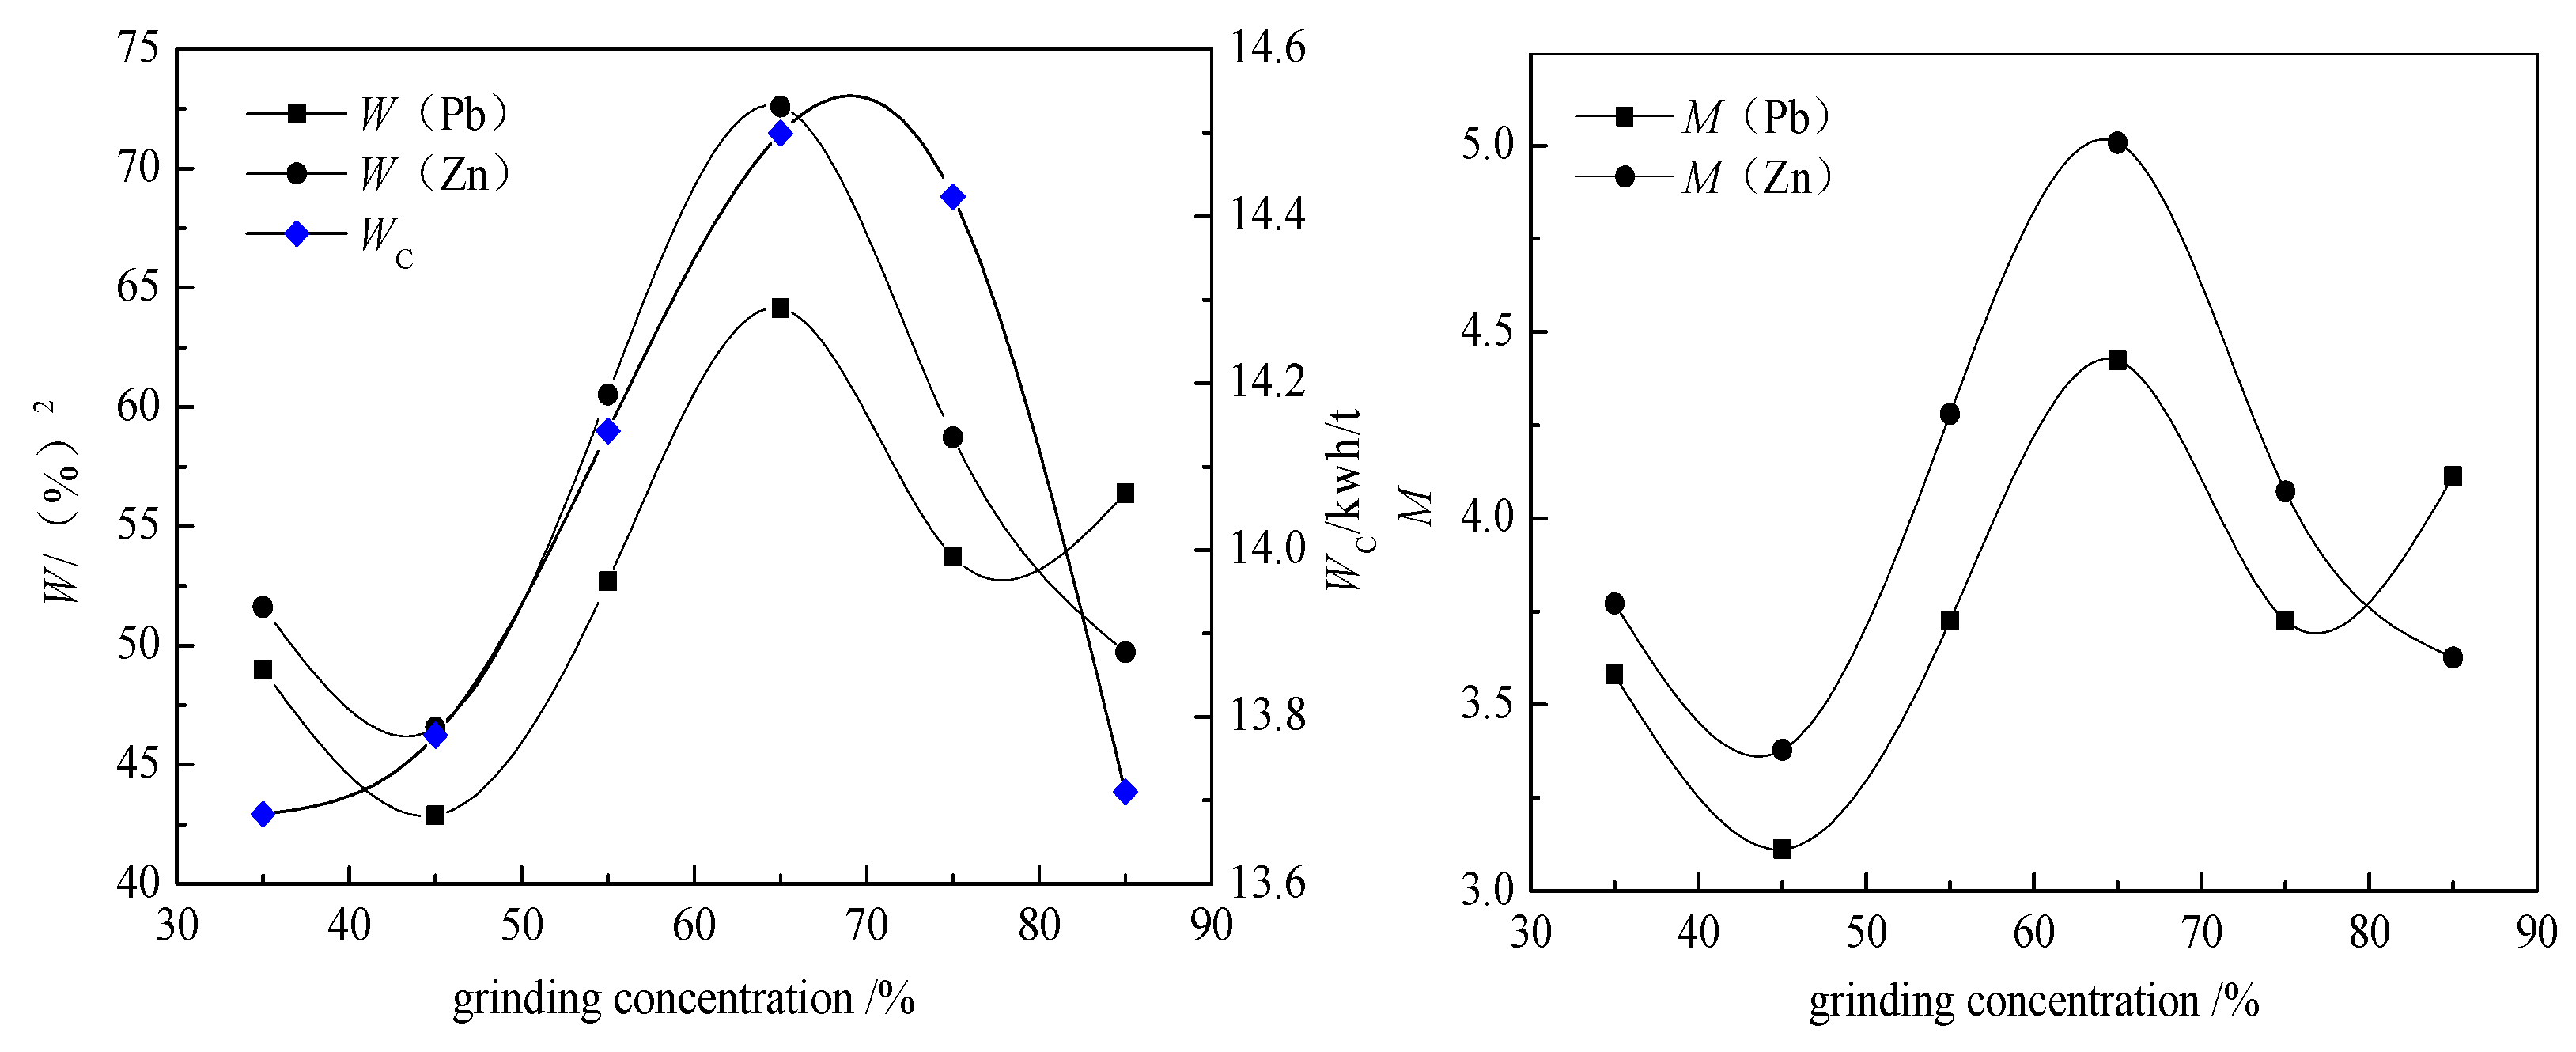
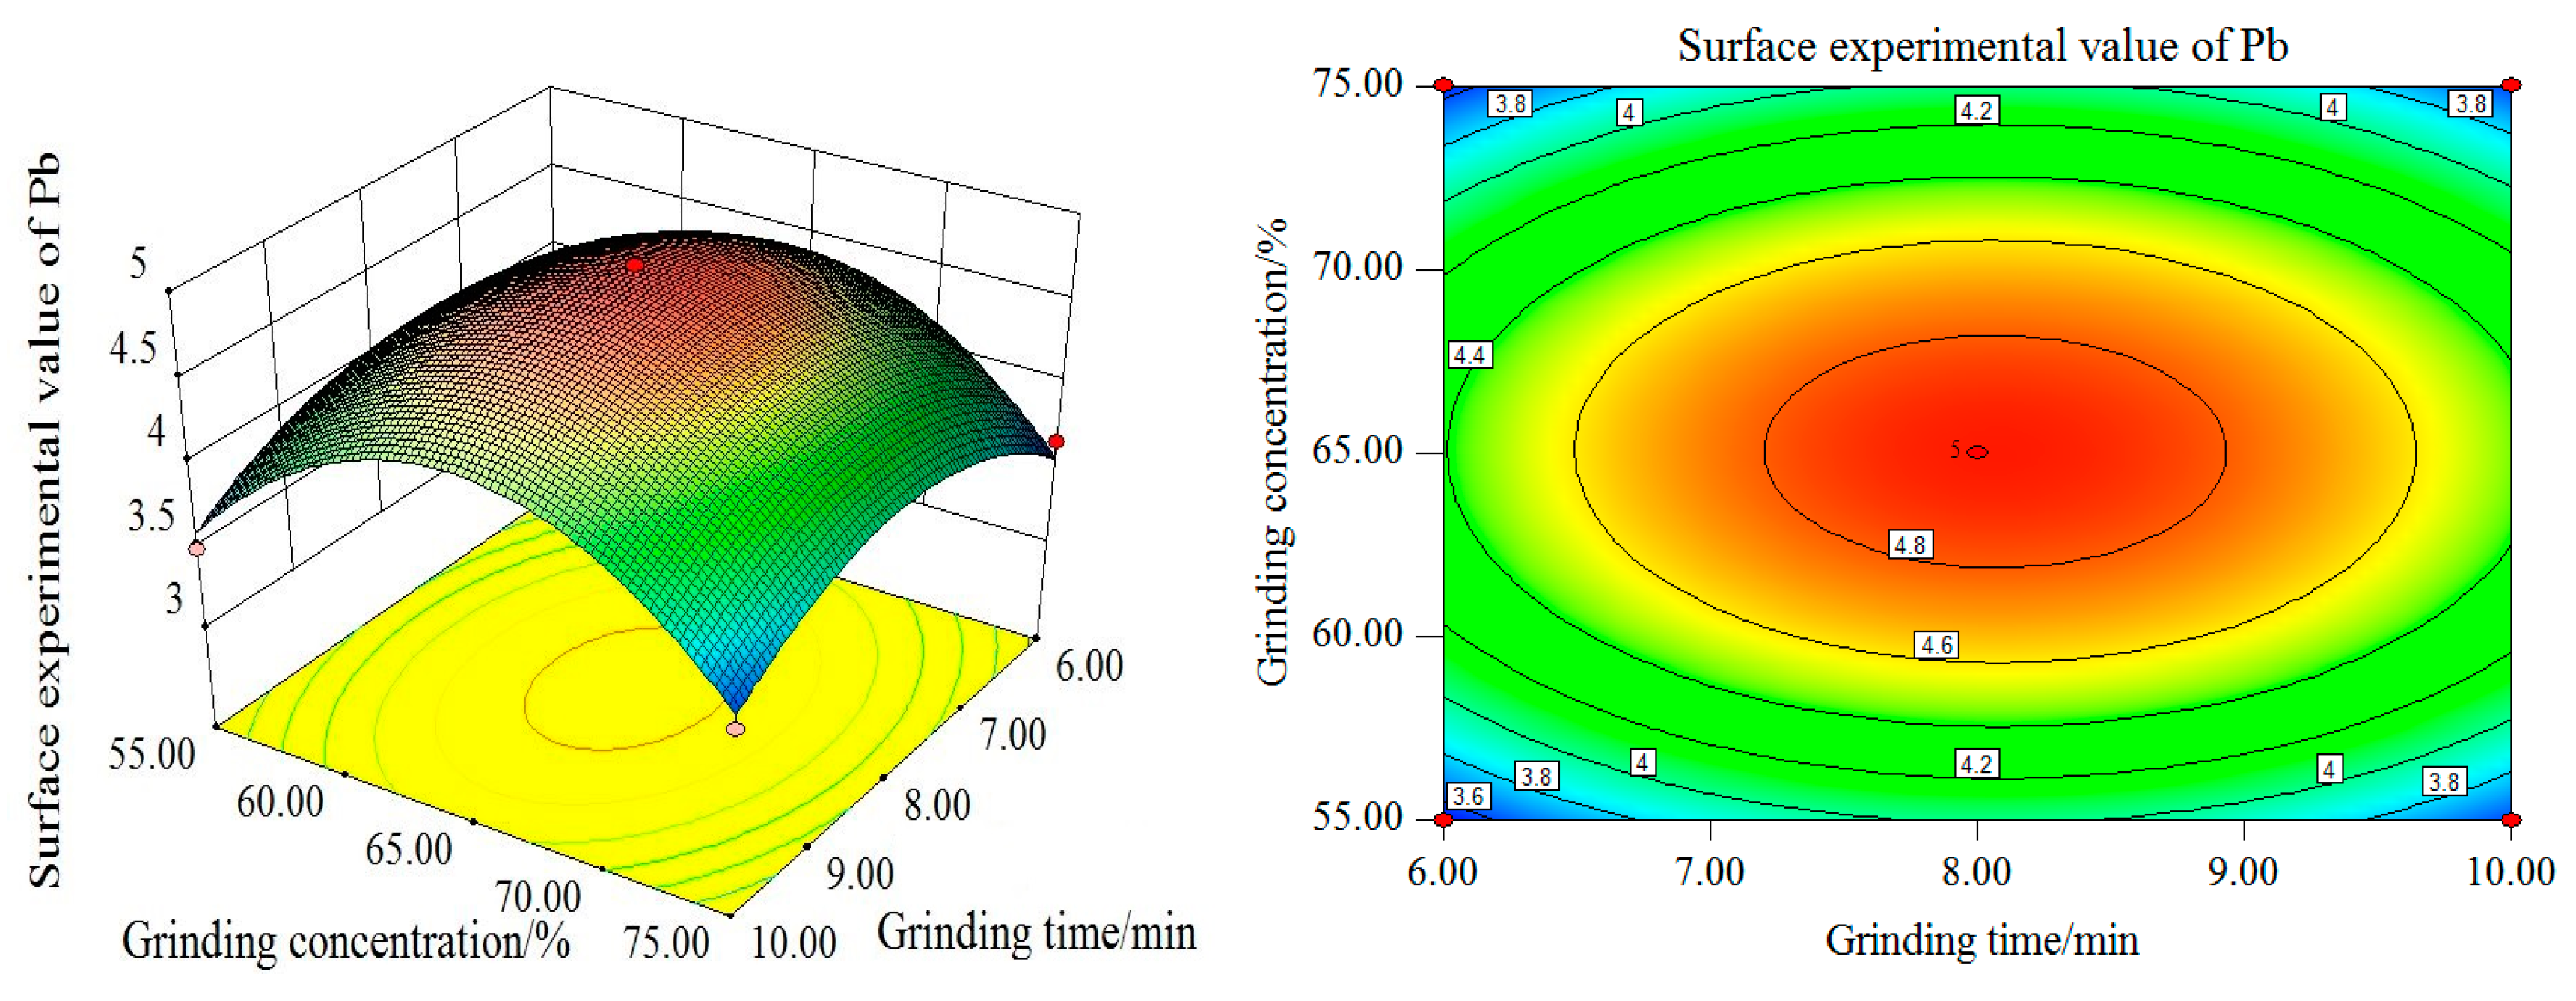
Figure 14, with the increase of grinding time and grinding concentration, the Pb surface test value firstly increases and then decreases, reaching its maximum when the grinding time is at 8 min and grinding concentration at 65%. From the perspective of single factor, the influence of grinding time and grinding concentration on the experimental value of the Pb curved surface is remarkable. As can be seen from the contour map, the interaction between the grinding time and grinding concentration is more significant. The influence curve between the filling ratio and grinding time on the experimental value of Pb curved surface also increases first and then decreases. When the grinding time is 8 min and the filling ratio is about 37%, the maximum Pb surface test value can be obtained.
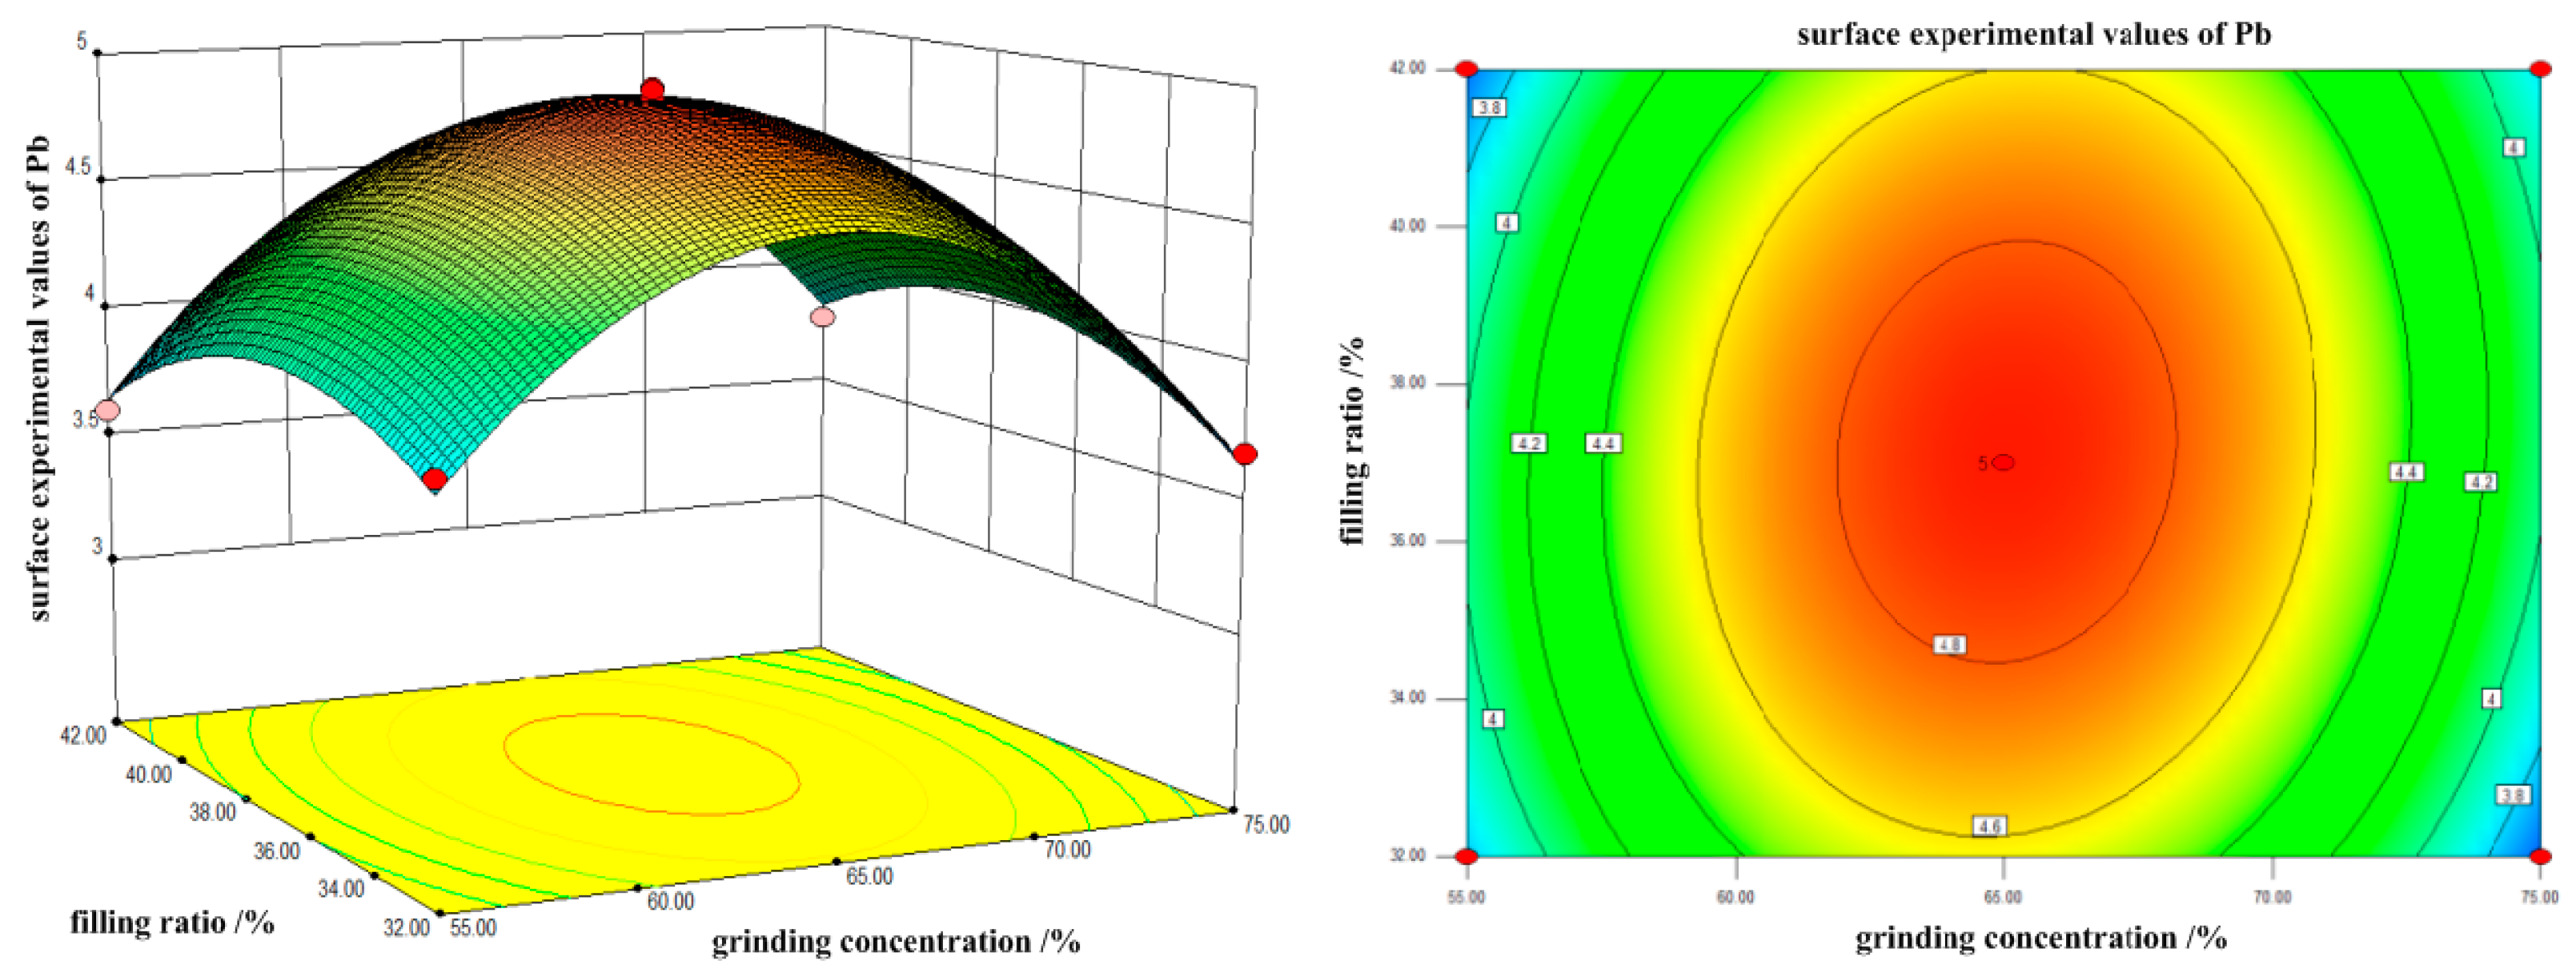
In terms of the single factor, the experimental value of Pb curved surface is significantly affected by grinding time and filling ratio. As can be seen from the contour map, the interaction between the grinding time and filling ratio is more significant. With the increase in grinding concentration and filling ratio, the Pb surface test value increases first and then decreases. The maximum value is reached when the grinding concentration is 65% and the filling ratio is about 37%. From the single factor, the filling ratio and grinding concentration have a significant influence on the experimental value of the Pb curved surface.
The contour map illustrates that the interaction between the grinding concentration and the filling ratio is not significant. In conclusion, the order of the influence degree on the Sn surface test value from high to low is as follows: grinding concentration, grinding time and filling ratio. The interaction between grinding concentration and filling ratio is weak, while the interaction between the grinding time and grinding concentration and between the grinding time and filling ratio, is stronger.
As shown in Figure 15, Figure 16 and 
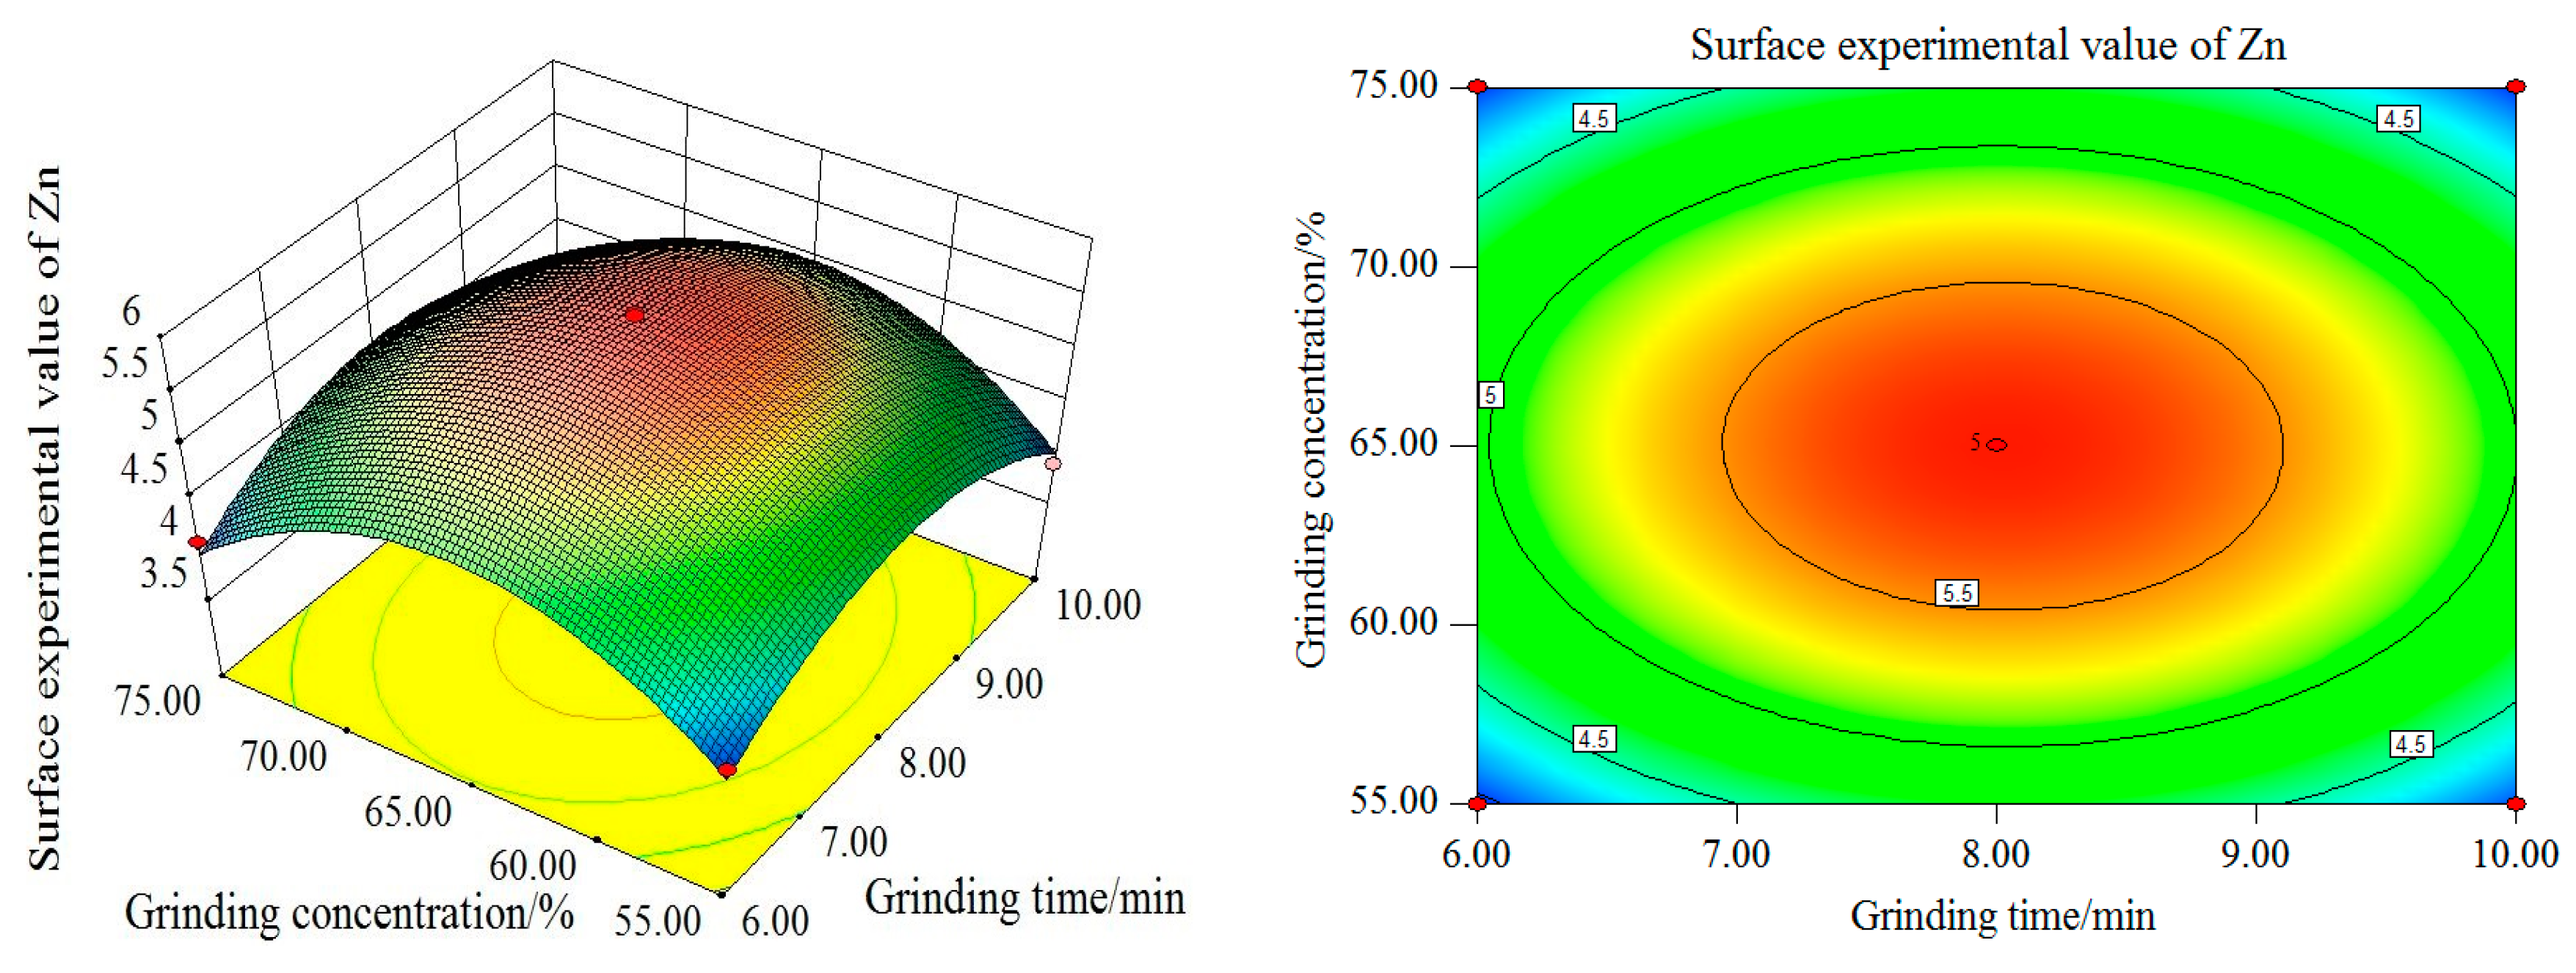
Figure 17, with the increase of grinding time and grinding concentration, the Zn surface test value firstly increases and then decreases, reaching its maximum at 8 min of grinding time and 65% of grinding concentration. From the single factor, the influence of grinding time and grinding concentration on the experimental value of the Zn curved surface is remarkable. As can be seen from the contour map, the interaction between the grinding time and the grinding concentration is more significant. The influence curve between the filling ratio and grinding time on the experimental value of the Zn curved surface also increases first and then decreases. When the grinding time is 8 min and the filling ratio is about 37%, the maximum Zn surface test value can be obtained. From the single factor, the influence of grinding concentration on the experimental value of the Zn surface is more significant than that of the filling ratio.
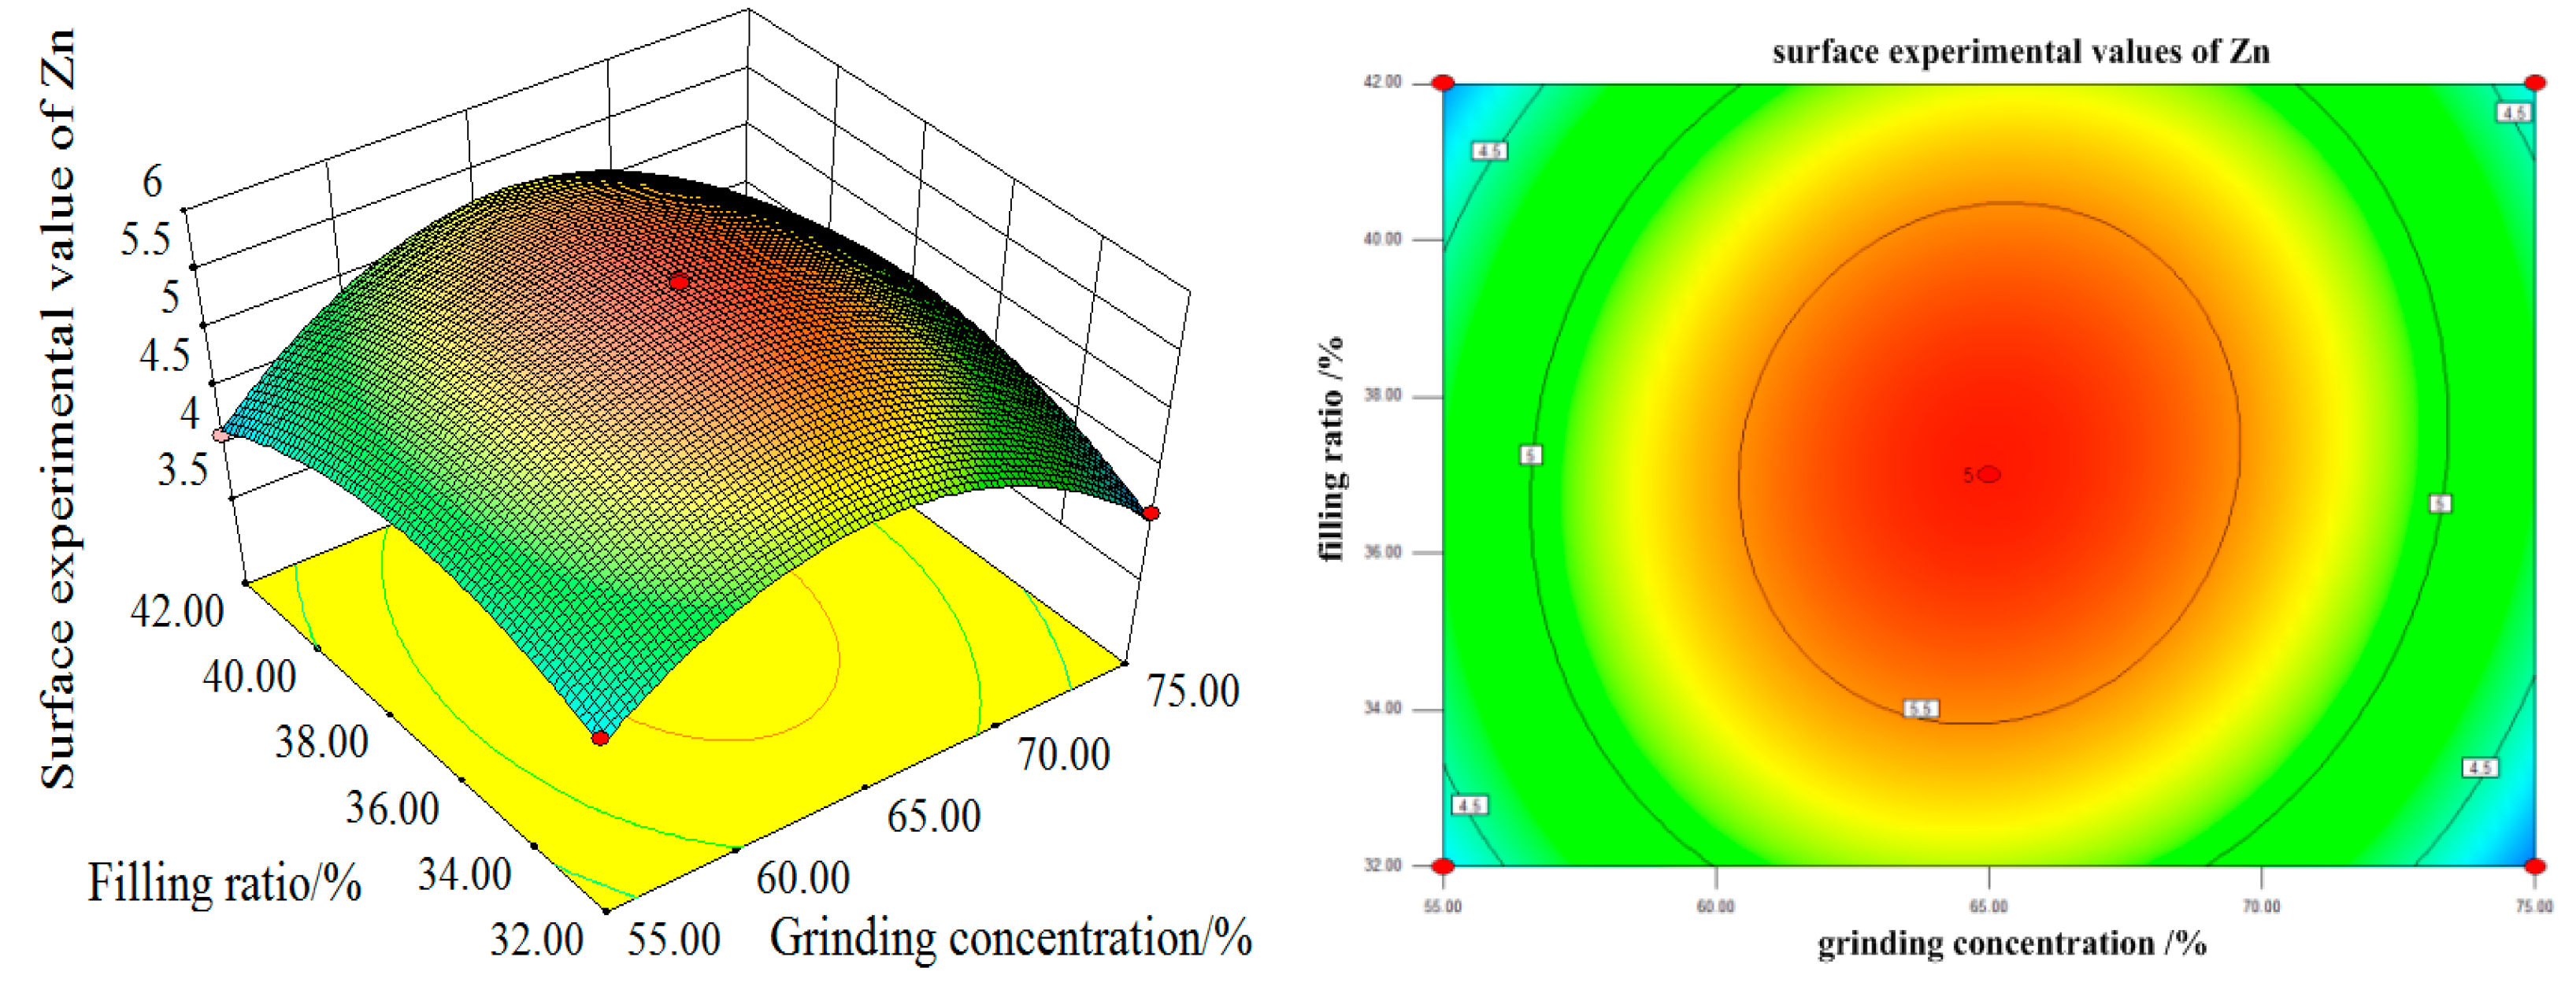
It can be seen from the contour map that the interaction between the grinding time and filling ratio is not significant. With the increase in the grinding concentration and filling ratio, the Zn surface test value increases first and then decreases. The maximum value is reached when the grinding concentration is 65% and the filling ratio is about 37%. From the single factor, the influence of grinding concentration on the experimental value of the Zn surface is more significant than that of the filling ratio.
The contour map illustrates that the interaction between the grinding concentration and the filling ratio is not significant. In summary, the order of the influence degree on the Zn surface test value from high to low is as follows: the grinding concentration, grinding time, and filling ratio. The interaction between the grinding concentration and grinding time is strong, the interaction between the grinding concentration and filling ratio is weak, and the interaction between the grinding time and filling ratio is weak.

4.2. Grinding Verification Test

The Sn surface design model can be obtained by accurately solving the model. The optimal theoretical parameters were a grinding time of 3.81 min, grinding concentration of 62.42%, and filling ratio of 37.07%. Therefore, the predicted value of the Sn surface was 5.847. The optimal theoretical parameters of Pb and Zn surface design models were a grinding time of 8.03 min, grinding concentration of 65.03%, and filling ratio of 37.13%. Accordingly, the prediction values of the Pb and Zn surface tests were 4.887 and 5.712, respectively. To verify the reliability and validity of the three equation models, A and B tests were carried out respectively on the prediction conditions and results. The results are shown in Table 13 and Table 14.
Through two verification tests, the conclusion can be reached that the predicted results were close to the experimental results, and the errors were within the range of ±2%. This finding shows that the model has strong reliability and validity. Therefore, on the premise of meeting the minimum energy consumption and the highest qualified particle size index, the grinding optimization condition of the cassiterite polymetallic sulfide ore can be obtained. Thus, Sn, as the representative of cassiterite, achieves optimum grinding conditions with a grinding time of 3.8 min, a grinding concentration of 63%, and a filling ratio of 37%. Polymetallic sulphide ore, represented by Pb and Sn, achieves the optimum grinding conditions with a grinding time of 8 min, a grinding concentration of 65% and a filling ratio of 37%.

5. Conclusions

In this paper, a grinding optimization characterization method was proposed to characterize the grinding properties of the required particle size. It is referred to as the unit energy consumption of metal grade accumulation method.
Based on the experimental evaluation, the grinding time for reaching the highest grinding optimization degree of the cassiterite and sulfide ore was 4 min and 8 min, respectively, indicating that the cassiterite ore is brittle and easy to grind with low hardness, while the sulfide ore is difficult to grind with high hardness. Accordingly, the grinding optimization method can be proposed on the theory of cassiterite polymetallic sulfide ore, i.e., sorting tin after 4 Min of grinding, followed by another 4-min grinding to sort the sulfide ore. This process can alleviate the conflict of cassiterite overgrinding and sulfide ore undergrinding, and ensure the grinding energy is most efficiently utilized. The optimum grinding concentration and filling ratio are 65% and 37%, respectively.
Furthermore, the surface prediction results were close to the experimental results, and the errors were within the range of ±2%, indicating that the model has a strong reliability and validity. The effects of different grinding parameters on the surface test values of various elements including Sn, Pb and Zn, are different, and the interactions between different grinding parameters are also different.

Author Contributions

Conceptualization, J.Y. and S.M.; methodology, J.Y.; software, W.Z.; validation, Z.S., J.Y. and W.Z.; formal analysis, W.Z.; investigation, J.Y.; resources, S.M.; data curation, Z.S.; writing—original draft preparation, W.Z.; writing—review and editing, J.Y.; visualization, J.Y.; supervision, J.Y.; project administration, S.M.; funding acquisition, S.M.

Funding

The authors gratefully acknowledge the financial support for this study from the Natural Science Foundation of China (No. 51874105, No.51264001), Guangxi Natural Science Foundation (No. 2018GXNSFAA281204) and the 973 Program of China (No. 2014CB460606).

Conflicts of Interest

The authors declare no conflict of interest.

References

  1. Xu, T.L. Study on Cassiterite Polymetallic Sulfide Ore Selective Grinding Behavior; Guangxi University: Nanning, China, 2014. (In Chinese) [Google Scholar]
  2. Liu, J. Experimental Study on Grinding Materials of a New Medium with Two Spheres in CheHe Concentrator; Guangxi University: Nanning, China, 2013. (In Chinese) [Google Scholar]
  3. Qiu, G.Z.; Hu, Y.H.; Wang, D.Z. Interaction between Particles and Fine Flotation; Central South University of Technology Press: Changsha, China, 1993. (In Chinese) [Google Scholar]
  4. Qin, W.Q.; Wang, P.P.; Ren, L.Y.; Wei, Q.; Peng, Z.B.; Gu, Y.L. Effect of matching relationship between particles and bubbles on the flotation of fine cassiterite. J. China Univ. Min. Technol. 2012, 41, 420. [Google Scholar]
  5. Qin, W.Q.; Ren, L.Y.; Wang, P.P.; Yang, C.R.; Zhang, Y.S. Electro-flotation and collision-attachment mechanism of fine cassiterite. Trans. Nonferrous Met. Soc. China 2012, 22, 917. [Google Scholar] [CrossRef]
  6. Sreenivas, T.; Padmanabhan, N.P.H. Surface chemistry and flotation of cassiterite with alkyl hydroxamates. Colloids Surf. 2001, 205, 47. [Google Scholar] [CrossRef]
  7. Qin, W.Q.; Xu, Y.B.; Liu, H.; Ren, L.Y.; Yang, C.R. Flotation and surface behavior of cassiterite with salicylhydroxamic acid. Ind. Eng. Chem. Res. 2011, 50, 10778. [Google Scholar] [CrossRef]
  8. Wu, X.Q.; Zhu, J.G. Selective flotation of cassiterite with benzohydroxamic acid. Min. Eng. 2006, 19, 1410. [Google Scholar] [CrossRef]
  9. Bazin, C.; Obiang, P. Should the slurry density in a grinding mill be adjusted as a function of grinding media size. Min. Eng. 2007, 20, 810. [Google Scholar] [CrossRef]
  10. Schmidt, J.; Plata, M.; Troger, S.; Peukert, W. Production of polymer particles below 5 μm by wet grinding. Powder Technol. 2012, 228, 84–88. [Google Scholar] [CrossRef]
  11. Matijasic, G.; Kurajica, S. Grinding kinetics of amorphous powder obtained by sol-gel process. Powder Technol. 2010, 197, 165. [Google Scholar] [CrossRef]
  12. Fuerstenau, D.W.; Phatak, P.B.; Kapur, P.C.; Abouzeid, A.Z. Simulation of the grinding of coarse/fine (heterogeneous) systems in a ball mill. Int. J. Min. Process. 2011, 99, 32. [Google Scholar] [CrossRef]
  13. Powell, M.S.; Weerasekara, N.S.; Cole, S.; LaRoche, R.D.; Favier, J. DEM modelling of linear evolution and its influence on grinding rate in ball mills. Min. Eng. 2011, 24, 341. [Google Scholar] [CrossRef]
  14. Duan, X.X. Crushing and Grinding; Metallurgical Industry Press: Beijing, China, 2006. (In Chinese) [Google Scholar]
Figure 1. Effect of grinding time on the W(Sn).
Minerals 09 00134 g001
Figure 2. Effect of grinding time on the the W(Pb), W(Zn), M(Pb) and M(Zn).
Minerals 09 00134 g002
Figure 3. Effect of grinding concentration on the W(Sn) and M(Sn).
Minerals 09 00134 g003
Figure 4. Effect of grinding concentration on the the W(Pb), W(Zn), M(Pb) and M(Zn).
Minerals 09 00134 g004
Figure 5. Effect of grinding filling ratio on the W(Sn) and M(Sn).
Minerals 09 00134 g005
Figure 6. Effect of grinding filling ratio on the W(Pb), W(Zn), M(Pb) and M(Zn).
Minerals 09 00134 g006
Figure 7. Comparison of the curved surface experimental and predicted values of the Sn and Pb grinding rate model.
Minerals 09 00134 g007
Figure 8. Comparison of the curved surface experimental and predicted values of the Zn grinding rate model.
Minerals 09 00134 g008
Figure 9. Sn curved surface experimental value and contour map under grinding concentration and grinding time action.
Minerals 09 00134 g009
Figure 10. Sn curved surface experimental value and contour map under grinding time and grinding filling ratio action.
Minerals 09 00134 g010
Figure 11. Sn curved surface experimental value and contour map under grinding concentration and grinding filling ratio action.
Minerals 09 00134 g011
Figure 12. Pb curved surface experimental value and contour map under grinding concentration and grinding time action.
Minerals 09 00134 g012
Figure 13. Pb curved surface experimental value and contour map under grinding time and grinding filling ratio action.
Minerals 09 00134 g013
Figure 14. Pb curved surface experimental value and contour map under grinding concentration and grinding filling ratio action.
Minerals 09 00134 g014
Figure 15. Zn curved surface experimental value and contour map under grinding concentration and grinding time action.
Minerals 09 00134 g015
Figure 16. Zn curved surface experimental value and contour map under grinding time and grinding filling ratio action.
Minerals 09 00134 g016
Figure 17. Zn curved surface experimental value and contour map under grinding concentration and grinding filling ratio action.
Minerals 09 00134 g017
Table 1. Undersize yield and metal distribution rate with a grinding time of 2 Min.
Particle Size/mmUndersize Yield (γ)/(0 min)%Undersize Yield (γ)/(2 min)%Metal Distribution Rate (D)/(2 min)%
D(Sn)D(Zn)D(Pb)
−1.7 + 1100.00100.003.7911.2014.46
−1 + 0.42582.5597.3031.7510.308.43
−0.425 + 0.2352.1695.7714.6913.756.93
−0.23 + 0.1536.9493.767.5816.1513.25
−0.15 + 0.07516.1184.5713.2716.8614.16
−0.075 + 0.03810.6672.0715.4016.7515.06
−0.0384.5629.6513.5114.9827.71
Table 2. The Qualified Particle Size Index (W) with Grinding Time of 2 min.
Mineral/ElementOptimal Feeding Particle Size/mmγ/%γ1/%γ2/%γ3/%E/%Metal Distribution Rate (D)/%Qualified Particle Size Index (W)/(%)2
Cassiterite/(Sn)−0.23 + 0.07593.7636.9410.6672.071.5920.8533.12
Sulfide/(Zn)−0.15 + 0.03884.5716.114.5629.651.0833.6136.26
Sulfide/(Pb)−0.15 + 0.03884.5716.114.5629.651.0829.2231.53
Table 3. The grinding optimization degree (M) with a grinding time of 2 min.
Mineral/ElementOptimal Feeding Particle Size/mmQualified Particle Size Index (W)/(%)2F/μmP/μmWIB/kw∙h∙t−1WC/kw∙hGrinding Optimization Degree(M)
Cassiterite/(Sn)−0.23 + 0.07533.1261410015.109.013.67
Sulfide/(Zn)−0.15 + 0.03836.2661410015.109.014.02
Sulfide/(Pb)−0.15 + 0.03831.5361410015.109.013.50
Table 4. Effect of grinding time on the M(Sn).
Grinding Time/min.W(Sn)/(%)2WC/kw·h·t−1M(Sn)
233.129.013.67
472.2613.515.35
663.3614.324.43
879.9115.065.31
1060.8916.784.16
Table 5. Effect of Grinding Time on the M(Zn).
Grinding Time/minW(Zn)/(%)2WC/kw·h·t−1M(Zn)
236.269.014.02
461.5813.514.56
658.8314.324.11
881.4515.065.41
1069.2716.784.73
Table 6. Effect of grinding time on the M(Pb).
Grinding Time/minW(Pb)/(%)2WC/kw·h·t−1M(Pb)
231.539.013.50
460.3213.514.46
653.3214.323.72
877.3115.065.13
1064.3916.784.39
Table 7. Effect of grinding concentration on the M(Sn).
Concentration/%W(Sn)/(%)2WC/kw·h·t−1M(Sn)
3540.9713.682.99
4526.3913.781.92
5552.8114.143.73
6563.2814.504.36
7517.8514.421.24
8557.3313.714.18
Table 8. Effect of grinding concentration on the M(Zn).
Concentration/%W(Zn)/(%)2WC/kw·h·t−1M(Zn)
3551.6113.683.77
4546.5513.783.38
5560.5314.144.28
6572.6114.505.01
7558.7414.424.07
8549.7213.713.63
Table 9. Effect of grinding concentration on the M(Pb).
Concentration/%W(Pb)/(%)2WC/kw·h·t−1M(Pb)
3548.9913.683.58
4542.8713.783.11
5552.6914.143.73
6564.1414.504.42
7553.7414.423.73
8556.4013.714.11
Table 10. Effect of the grinding filling ratio on the M(Sn).
Filling Ratio/%W(Sn)/WC/kw·h·t−1M(Sn)
2233.4913.322.51
2752.0613.473.86
3260.7313.744.42
3763.8413.784.63
4252.2313.853.77
Table 11. Effect of grinding filling ratio on the M(Zn).
Filling Ratio/%W(Zn)/(%)2WC/kw·h·t−1M(Zn)
2248.8013.323.66
2750.2513.473.73
3256.3413.744.10
3768.7413.784.99
4264.2213.854.64
Table 12. Effect of grinding filling ratio on the M(Pb).
Filling Ratio/%W(Pb)/(%)2WC/kw·h·t−1M(Pb)
2246.6413.323.50
2748.3113.473.59
3260.2713.744.39
3758.9213.784.28
4259.3313.854.28
Table 13. Verification test results.
Conditions and ResultsGrinding Time/minGrinding Concentration/%Filling Ratio/%M(Sn)
Prediction of optimal conditions and results3.8162.4237.075.847
A test conditions and results3.8063.0037.005.833
B test conditions and results3.8063.0037.005.854
A error between experimental and predicted values0.24%
B error between experimental and predicted values−0.12%
Table 14. Verification test results.
Conditions and ResultsGrinding Time/minGrinding Concentration/%Filling Ratio/%M(Pb)M(Zn)
Prediction of optimal conditions and results8.0365.0337.134.8875.712
A test conditions and results8.0065.0037.004.7935.688
B test conditions and results8.0065.0037.004.9105.783
A error between experimental and predicted values1.92%0.42%
B error between experimental and predicted values−0.47%−1.24%

