Article

Hydration Mechanism and Hardening Property of α-Hemihydrate Phosphogypsum

1
Mining College, Guizhou University, Guiyang 550025, China
2
National & Local Joint Laboratory of Engineering for Effective Utilization of Regional Mineral Resources from Karst Areas, Guiyang 550025, China
3
Guizhou Key Lab of Comprehensive Utilization of Nonmetallic Mineral Resources, Guiyang 550025, China
*
Author to whom correspondence should be addressed.
Minerals 2019, 9(12), 733; https://doi.org/10.3390/min9120733
Submission received: 25 October 2019 / Revised: 19 November 2019 / Accepted: 25 November 2019 / Published: 28 November 2019
(This article belongs to the Section Mineral Processing and Extractive Metallurgy)

Abstract

:
The hydration and hardening of α-hemihydrate phosphogypsum (HH) prepared in the absence and presence of L-Aspartic acid (L-Asp) were investigated by thermodynamic analysis, measurements of ion concentrations and crystal water content, and morphology observation. In addition, computed tomography (CT) scanning was proposed to analyze the hole characteristic of hardened gypsum in situ. The results show that HH will pass through the unstable region and the stable region of dihydrate gypsum (DH) in turn during the hydration. The hydration of HH follows the dissolution–crystallization principle; the hydration process can be divided into the dissolution stage, dissolution–crystallization stage and equilibrium stage. Compared with the HH prepared without crystal modifier, the hydration process of HH prepared with L-Asp is obviously prolonged, and the morphology of DH changes from needle-like to diamond-shape crystals with an aspect ratio of 1:1. Meanwhile, the defect-specific surface and porosity of hardened gypsum significantly decreases, achieving a more compact, hardened paste with higher compressive strength.

Graphical Abstract

1. Introduction

Phosphogypsum (PG) is a solid waste discharged during the production of phosphoric acid [1,2]. The main component is dihydrate gypsum (CaSO4·2H2O, DH) and the content generally reaches 90% [3], while it contains some impurities such as phosphate, fluoride, organic matters, et al. [4,5]. The preparation of α-hemihydrate gypsum (CaSO4·0.5H2O, HH) from PG is an important utilization approach. Many studies have confirmed that the morphology of HH is one of the most important factors for affecting mechanical strength of hardened paste, and the short hexagonal prism crystal with an aspect ratio of 1:1 is a perfect morphology with high strength [6,7,8,9]. Crystal modifiers such as succinic acid [10,11,12,13], maleic acid [14], citric acid [15], et al. can regulate the morphology of HH from a needle-shaped particle to a short columnar crystal. Our previous research indicated that L-Aspartic acid (L-Asp) is an effective crystal modifier for the preparation of short columnar HH [16], but the effects of L-Asp on the hydration process and hardening property of HH are not clear.
The mechanical properties of hardened paste can be obtained after hydration and hardening of HH. HH can only be stable for a period of time in aqueous solution and then converted into the stable phase DH due to its metastability [17]. Currently, there are two theories about the hydration mechanism of HH: One is colloid theory, the other is dissolution crystallization theory. According to the colloid theory, HH first combines with water molecules to form a kind of adsorption complex (namely hydrosol), then the hydrosol agglomerates to form gel, which will further transform into crystalline DH. Saha et al. [18] demonstrated that the transformation of HH to DH is a multistep particle formation model, where an amorphous phase forms first, followed by the transformation into a crystalline product, and the addition of citric acid significantly delays the reorganization to DH crystals. Because the structure of HH has a long chain channel, and the crystal water is partially filled in the channel in the form of the hydrogen bond, thus forming a water molecular channel with a diameter of 0.3 nm, which allows foreign water molecules into the HH crystal directly for hydration. Therefore, the existence of water molecular channels enables HH to hydrate in a relatively short time. Yang et al. [19] further confirmed that the water channels were mainly distributed in the cylinders of HH crystal, whereas no water channel existed in the conical surfaces parallel to the z-axis.
The dissolution crystallization theory holds that the saturation solubility of HH is highly supersaturated for the equilibrium solubility of DH, so the crystal nucleus of DH will spontaneously form and grow in a solution. Van Driessche et al. [20] found that the formation of bassanite nanocrystals at undersaturated conditions and their oriented self-assembly are the crucial steps controlling gypsum formation from aqueous solutions. The nucleation mechanism is independent of the solution conditions (supersaturation, temperature) and that Mg2+ and citric acid influence differently the nucleation pathway and growth kinetics of DH [21].
The hardened gypsum is a kind of porous network structure, which is formed by the intersection of hydration products DH. It was observed that small HH particles rapidly dissolved and hydrated, forming DH crystals network around large HH particles, which makes an increasingly dense microstructure and promotes the setting of gypsum paste [22]. The hardened paste of short column HH shows excellent mechanical strength because of low normal consistency and porosity, the DH particles interlock together tightly, resulting in a compact microstructure. Conversely, needle-like HH present poor mechanical property owing to high normal consistency and porous structure, meanwhile the morphology of DH is also long columnar. Consequently, the pore characteristic is a crucial parameter for the mechanical strength of hardened gypsum. In previous studies, the mercury porosimetry [23] and Brunauer-Emmett-Teller (BET) method [24] were usually used to investigate the holes distribution in hardened gypsum. Unfortunately, these methods are ex situ and severely restricted by the sample size, especially the closed holes in the hardened gypsum, can cause a large error of test data.
In conclusion, the hydration mechanism of HH has not formed a unified recognition, in particular, the hole defects inside the hardened gypsum cannot be observed in situ and analyzed accurately. Therefore, the hydration mechanism was systematically investigated by thermodynamic analysis and measurements of ion concentrations, crystal water content, morphology and particle size of hydration products. Furthermore, computed tomography (CT) scanning is proposed to visually observe and quantitatively analyze the hole characteristic of hardened gypsum.

2. Materials and Methods

2.1. Materials

Analytical grade calcium chloride (CaCl2) and L-Asp were obtained from Sinopharm Chemical Reagent Co., Ltd., Shanghai, China. PG was provided by Wengfu (Group) Co., Ltd., Guizhou, China. The main phase of PG is DH with little quartz (SiO2) and co-crystallized phosphorus (CaHPO4·2H2O). The contents of DH, soluble phosphate and soluble fluorine are 91.32 wt %, 0.18 wt % and 0.01 wt %, respectively [16].

2.2. Preparation of HH Powders

HH particles were produced using a salt solution method. The hydrothermal reaction was carried out in the CaCl2 solution. Our previous study found that L-Asp is an effective modifier to regulate the morphology of HH, and the short columnar HH with an aspect ratio of 1.21:1 could be obtained with the addition of 2.50 mM. Compared with the blank test, the hardened paste of HH prepared with 2.50 mM L-Asp showed better mechanical strength [16]. Therefore, the L-Asp concentration of 2.50 mM was adopted in this study. Firstly, 2.97 M CaCl2 and different concentrations of L-Asp (0.00, 2.50 mM) mixed solutions were preheated by an oil bath in a three-mouth flask. The solution temperature was measured by a thermometer and maintained with a deviation of ±0.5 °C. Then, PG was added into the mixed solutions when the temperature reached 95 °C. After the reaction is completed, the slurry was filtrated, then the filtration cake was washed with boiling water five times before drying at 120 °C for 2 h in an oven.

2.3. Preparation of Hydration Products

The as-prepared HH powder and deionized water were added into the beaker and stirred evenly according to the mass ratio of 1:15. During the hydration, 50 mL of the slurry was sampled at a certain time interval and immediately filtrated to obtain filter cake and filter liquor. The filter cake was washed with anhydrous alcohol for three times to stop its hydration reaction, then the sample was dried in an oven at 40 °C to constant weight. Finally, the crystal water content of the hydration product was determined according to the Gypsum plasters—Determination of water of crystallization content (GB/T 17669.2-1999, Chinese National Standard for Gypsum Plasters [25]). The concentrations of Ca2+ and SO42− in filtrate were measured by the ethylene diamine tetraacetic acid (EDTA) titration method (GB 7476-87 [26]) and the gravimetric method (GB 11899-89 [27]), respectively.

2.4. Characterization Methods

Unless otherwise specified, the as-prepared hydration products used to test are original state, namely without further grinding or damaging the morphology. The crystal morphology of the hydration products was directly observed without coating material by a scanning electron microscope (SEM, SU8010, Hitachi, Japan) using the secondary electrons, the accelerating voltage and working distance were 3 kV and 15 mm, respectively.
The phase compositions of the hydration products at different time were determined by a powder X-ray diffraction (XRD) analyzer (X’Pert PRO, PANalytical Company, Almelo, the Netherlands) with Cu radiation (V = 40 kV, I = 40 mA) in the 2θ range from 5° to 90°. The scanning step was 0.026°, the scanning time per step is 17.34 s, and the scanning type is continuous.
Zeta potentials of the hydration products were measured by a zeta potential analyzer (Delsa™ Nano C, Beckman Coulter, Miami, Florida, USA). The HH powders were further ground to −5 μm in an agate mortar. A suspension containing 0.1 wt % of the solid content in the 1 mM KNO3 background electrolyte solution was agitated with a magnetic stirrer so that the HH powders could be fully dispersed. The measurements were performed three times and the results are expressed as the mean value.
The particle size distributions of the hydration products were measured in aqueous solution by a laser particle size analyzer (LS13320, Beckman Coulter, Miami, Florida, USA) after being dispersed into the anhydrous ethanol with an ultrasonic bath. The processing module of sample is aqueous liquid module (ALM). The primary light source is a 5 mW diode laser with 780 nm wavelength.
The hardened gypsum was subjected to a nondestructive detection to investigate the hole characteristics by industrial computed tomography (CT, XT H 225 ST, X-Tek Systems Ltd., Tokyo, Japan) (see Figure 1). The hardened paste was placed on the metal turntable to keep the rotation center of the sample consistent with that of the turntable, and then the data was collected. The diameter and height scanning for the field of vision are Φ 250 mm and 250 mm, respectively. The upper limit voltage is 225 kV, the maximum power is 225 W, and the maximum resolution is 4.5 μm.

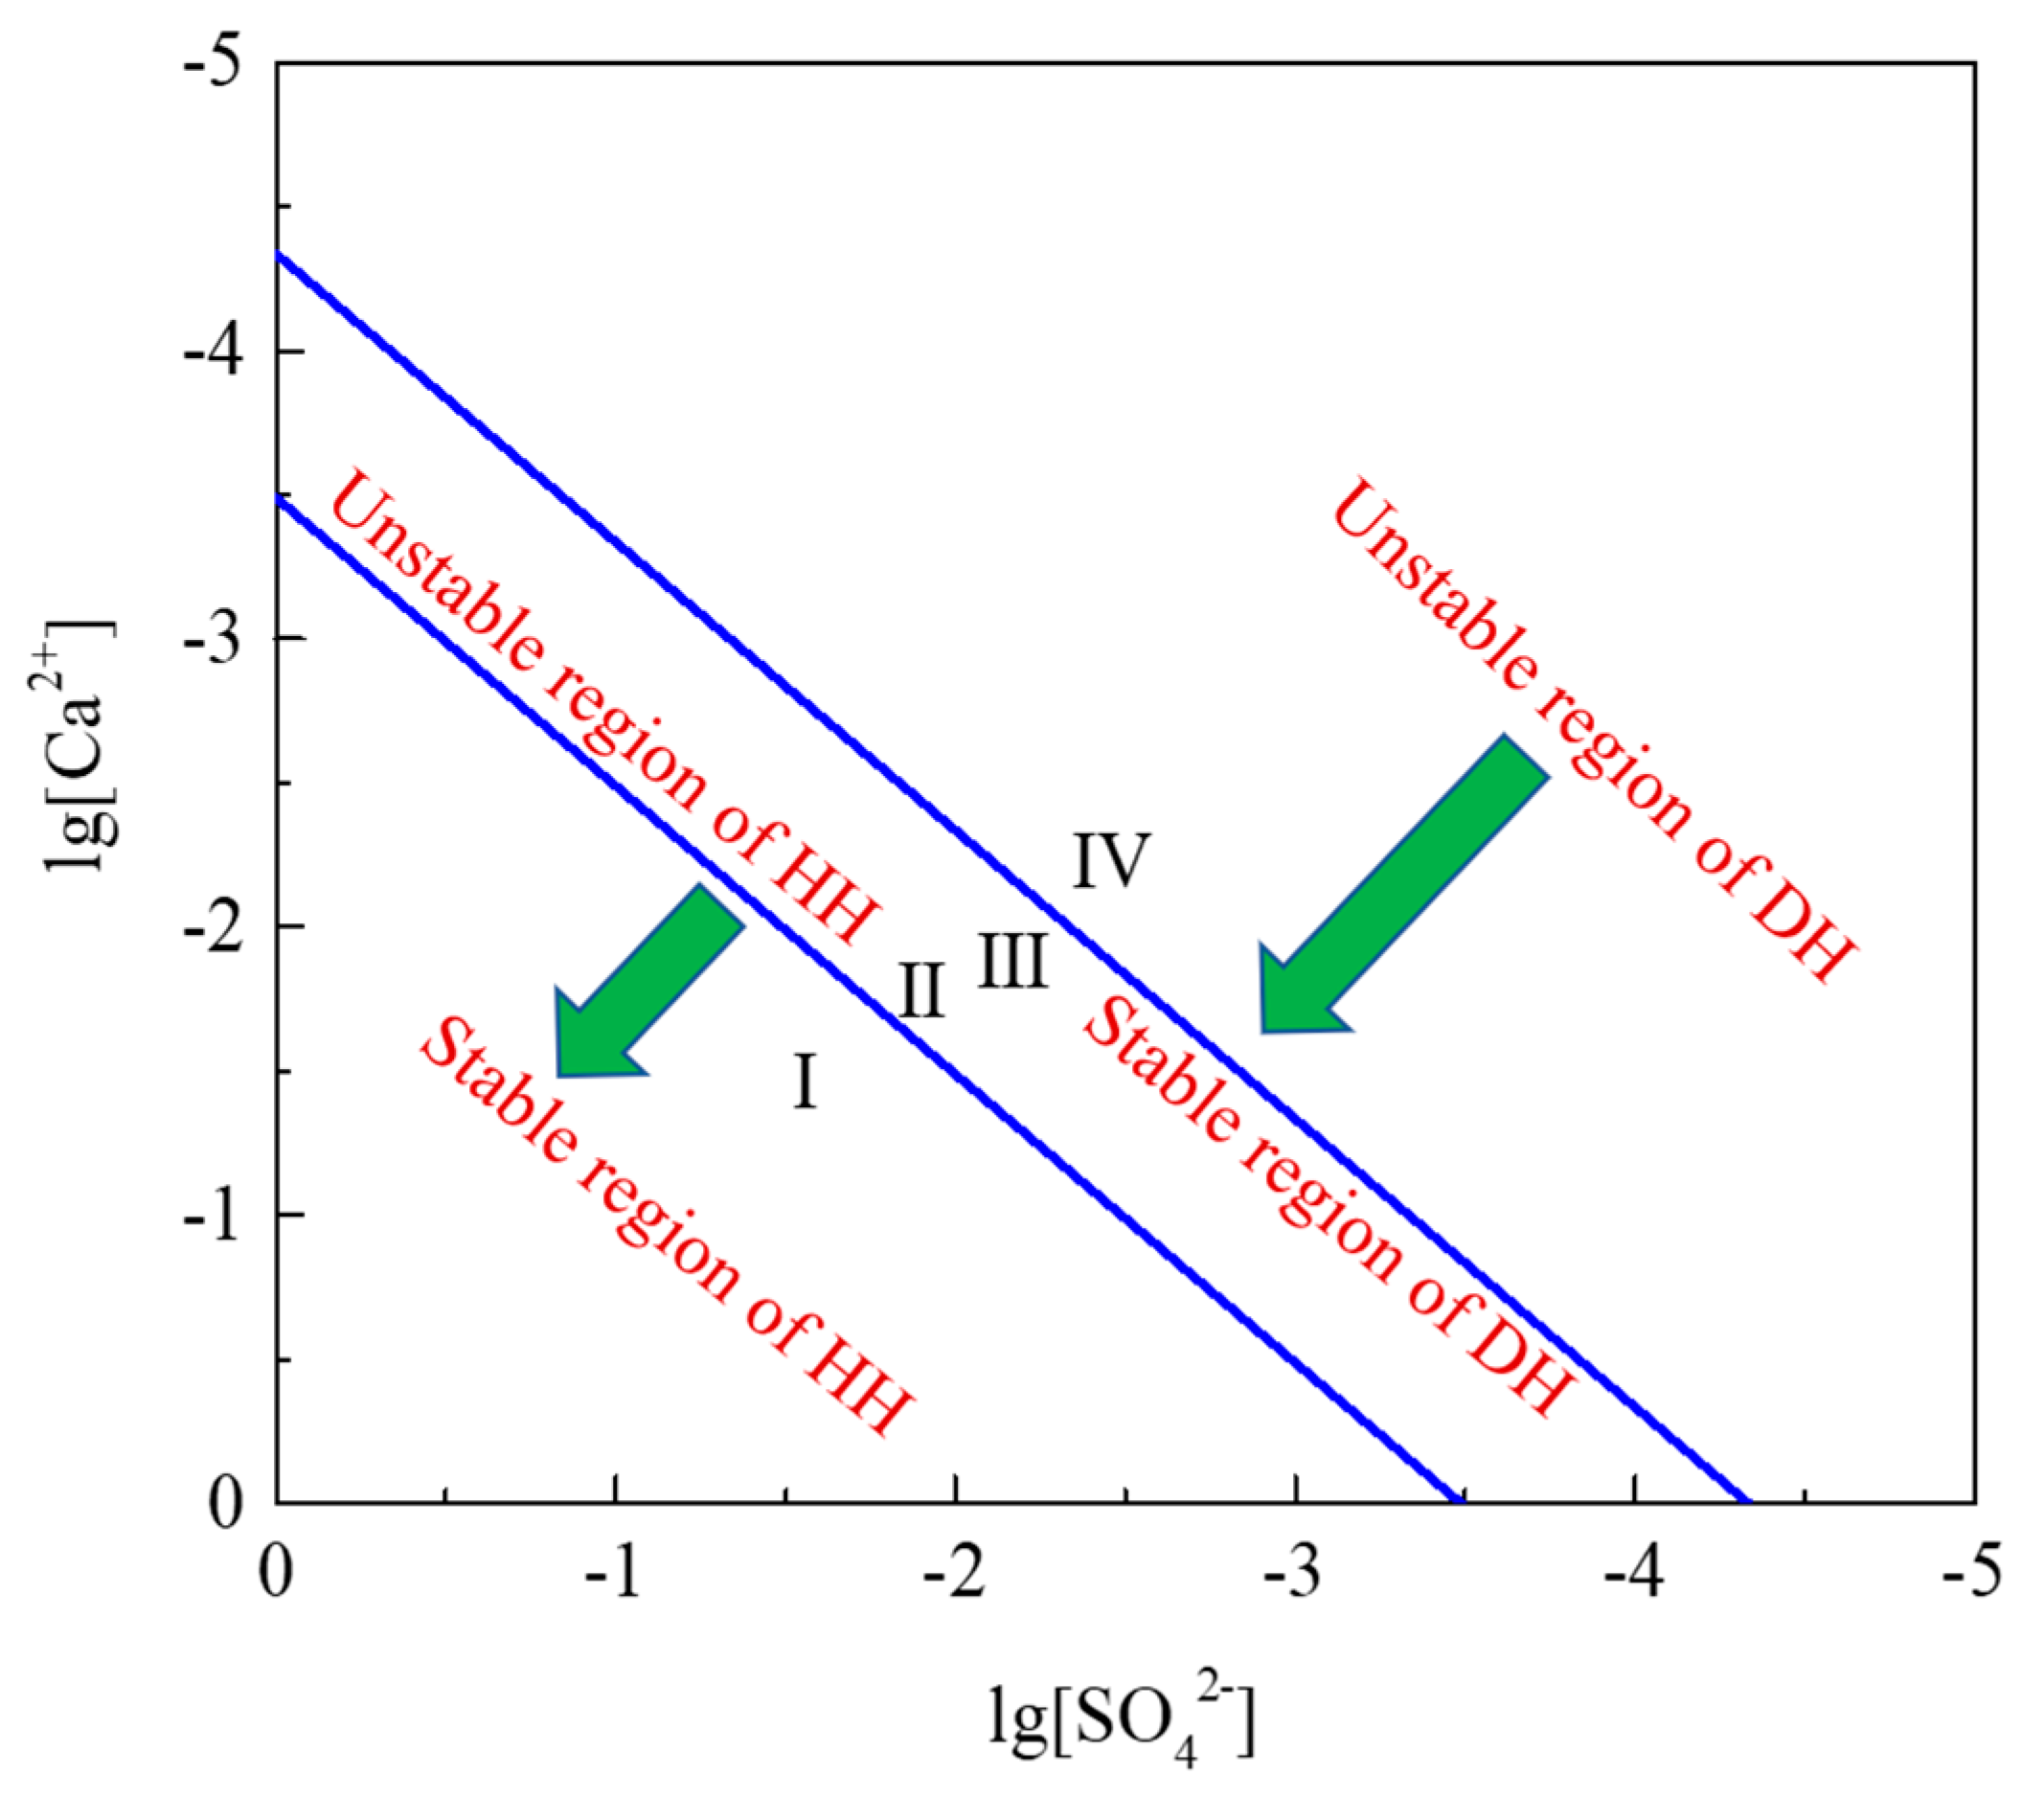
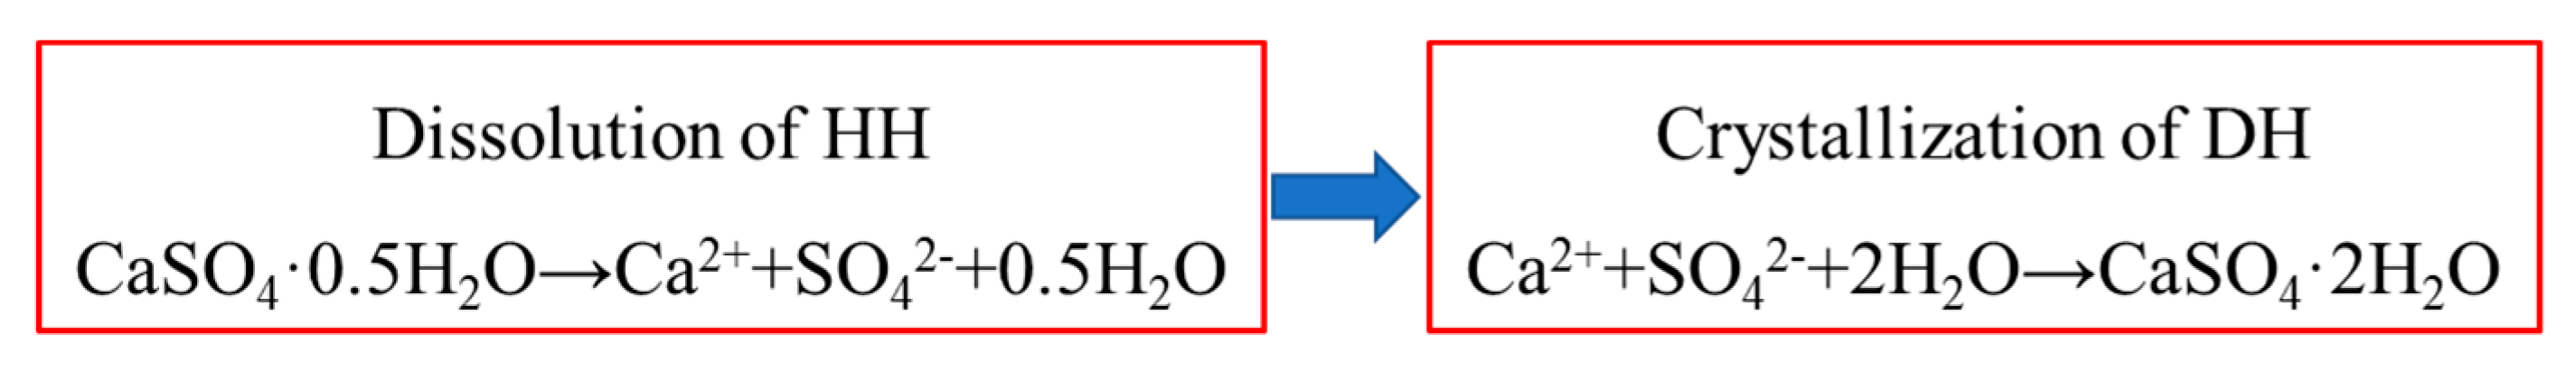
3. Thermodynamic Analysis of Hydration Process of HH

In aqueous solution, the equation of hydration reaction of HH is expressed as follows:
CaSO4·0.5H2O + 1.5H2O + aq = CaSO4·2H2O + Q + aq
The standard Gibbs free energy and standard enthalpy of formation of the hydration reaction can be calculated using the following Equations:
Δ G 298 ( HH   hydration   ) 0   =   Δ G CaSO 4 · 2 H 2 O 0     Δ G CaSO 4 · 0.5 H 2 O 0     1.5 Δ G H 2 O   0 =   4.83   kJ / mol
Δ H 298 ( HH   hydration   ) 0   =   Δ H CaSO 4 · 2 H 2 O 0     Δ H CaSO 4 · 0.5 H 2 O 0     1.5 Δ H H 2 O 0   =   17.15   kJ / mol
From the viewpoint of thermodynamics, HH can spontaneously hydrate to DH in aqueous solution at 298 K due to Δ G 298 ( HH   hydration ) 0   <   0 . Meanwhile, the hydration is an exothermic reaction because of Δ H 298 ( HH   hydration ) 0   < 0 .
(1) Dissolution process of HH
The dissolution process of HH at room temperature and atmospheric pressure:
CaSO4·0.5H2O + aq = Ca2+ + SO42− + 0.5H2O + aq
Δ G 298 ( HH   dissolution ) 0   =   Δ G Ca 2 + 0   +   Δ G SO 4 2   0 +   0.5 Δ G H 2 O   0   Δ G CaSO 4 · 0.5 H 2 O   0 =   19.90   kJ / mol
Δ G 298 ( HH   dissolution )   =   Δ G 298 ( HH   dissolution ) 0   +   RTln K p
where R = 8.314 J/(mol·K), T = 298 K, and Kp is the equilibrium constant of reaction Equation (4).
Δ G 298 ( HH   dissolution )   =   19.90   +   5.70 lg K p
K p   =   [ Ca 2 + ] [ SO 4 2 ] [ H 2 O ] 0.5 / [ CaSO 4 · 0.5 H 2 O ]
Since the activity of HH and H2O are 1, and when the dissolution of HH reaches equilibrium Δ G 298 ( HH   dissolution )   =   0 .
lg [ Ca 2 + ]   =   3.49     lg [ SO 4 2 ]
The Equation (9) can be expressed as Figure 2.
(2) Dissolution process of DH
The dissolution equation of DH can be described as:
CaSO4·2H2O+aq=Ca2++SO42-+2H2O+aq
Δ G 298 ( DH   dissolution ) = Δ G 298 ( DH   dissolution ) 0 + RTln K p = 24.73 + 5.70 lg K p
K p = [ Ca 2 + ] [ SO 4 2 ] [ H 2 O ] 2 / [ CaSO 4 · 2 H 2 O ]
Because the activity of DH is 1. Similarly, when the dissolution of DH reaches equilibrium, Δ G 298 ( DH   dissolution )   =   0 .
lg [ Ca 2 + ]   =   4.335     lg [ SO 4 2 ]
The Equation (13) is expressed as Figure 2. As can be seen from Figure 2, in the dissolution process of HH, it will pass through the unstable region and the stable region of DH in turn. Namely, it has already precipitated DH crystals before HH reaches the self-dissolution equilibrium. Yue et al. [28] also found that anhydrite (II·CaSO4) experienced the unstable region and stable region of DH during the dissolution process.

4. Results and Discussion

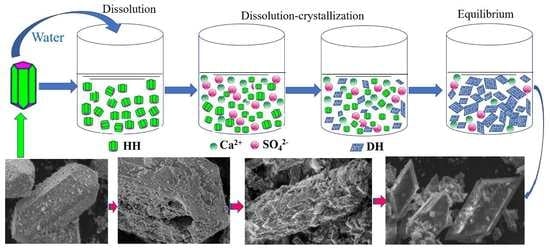
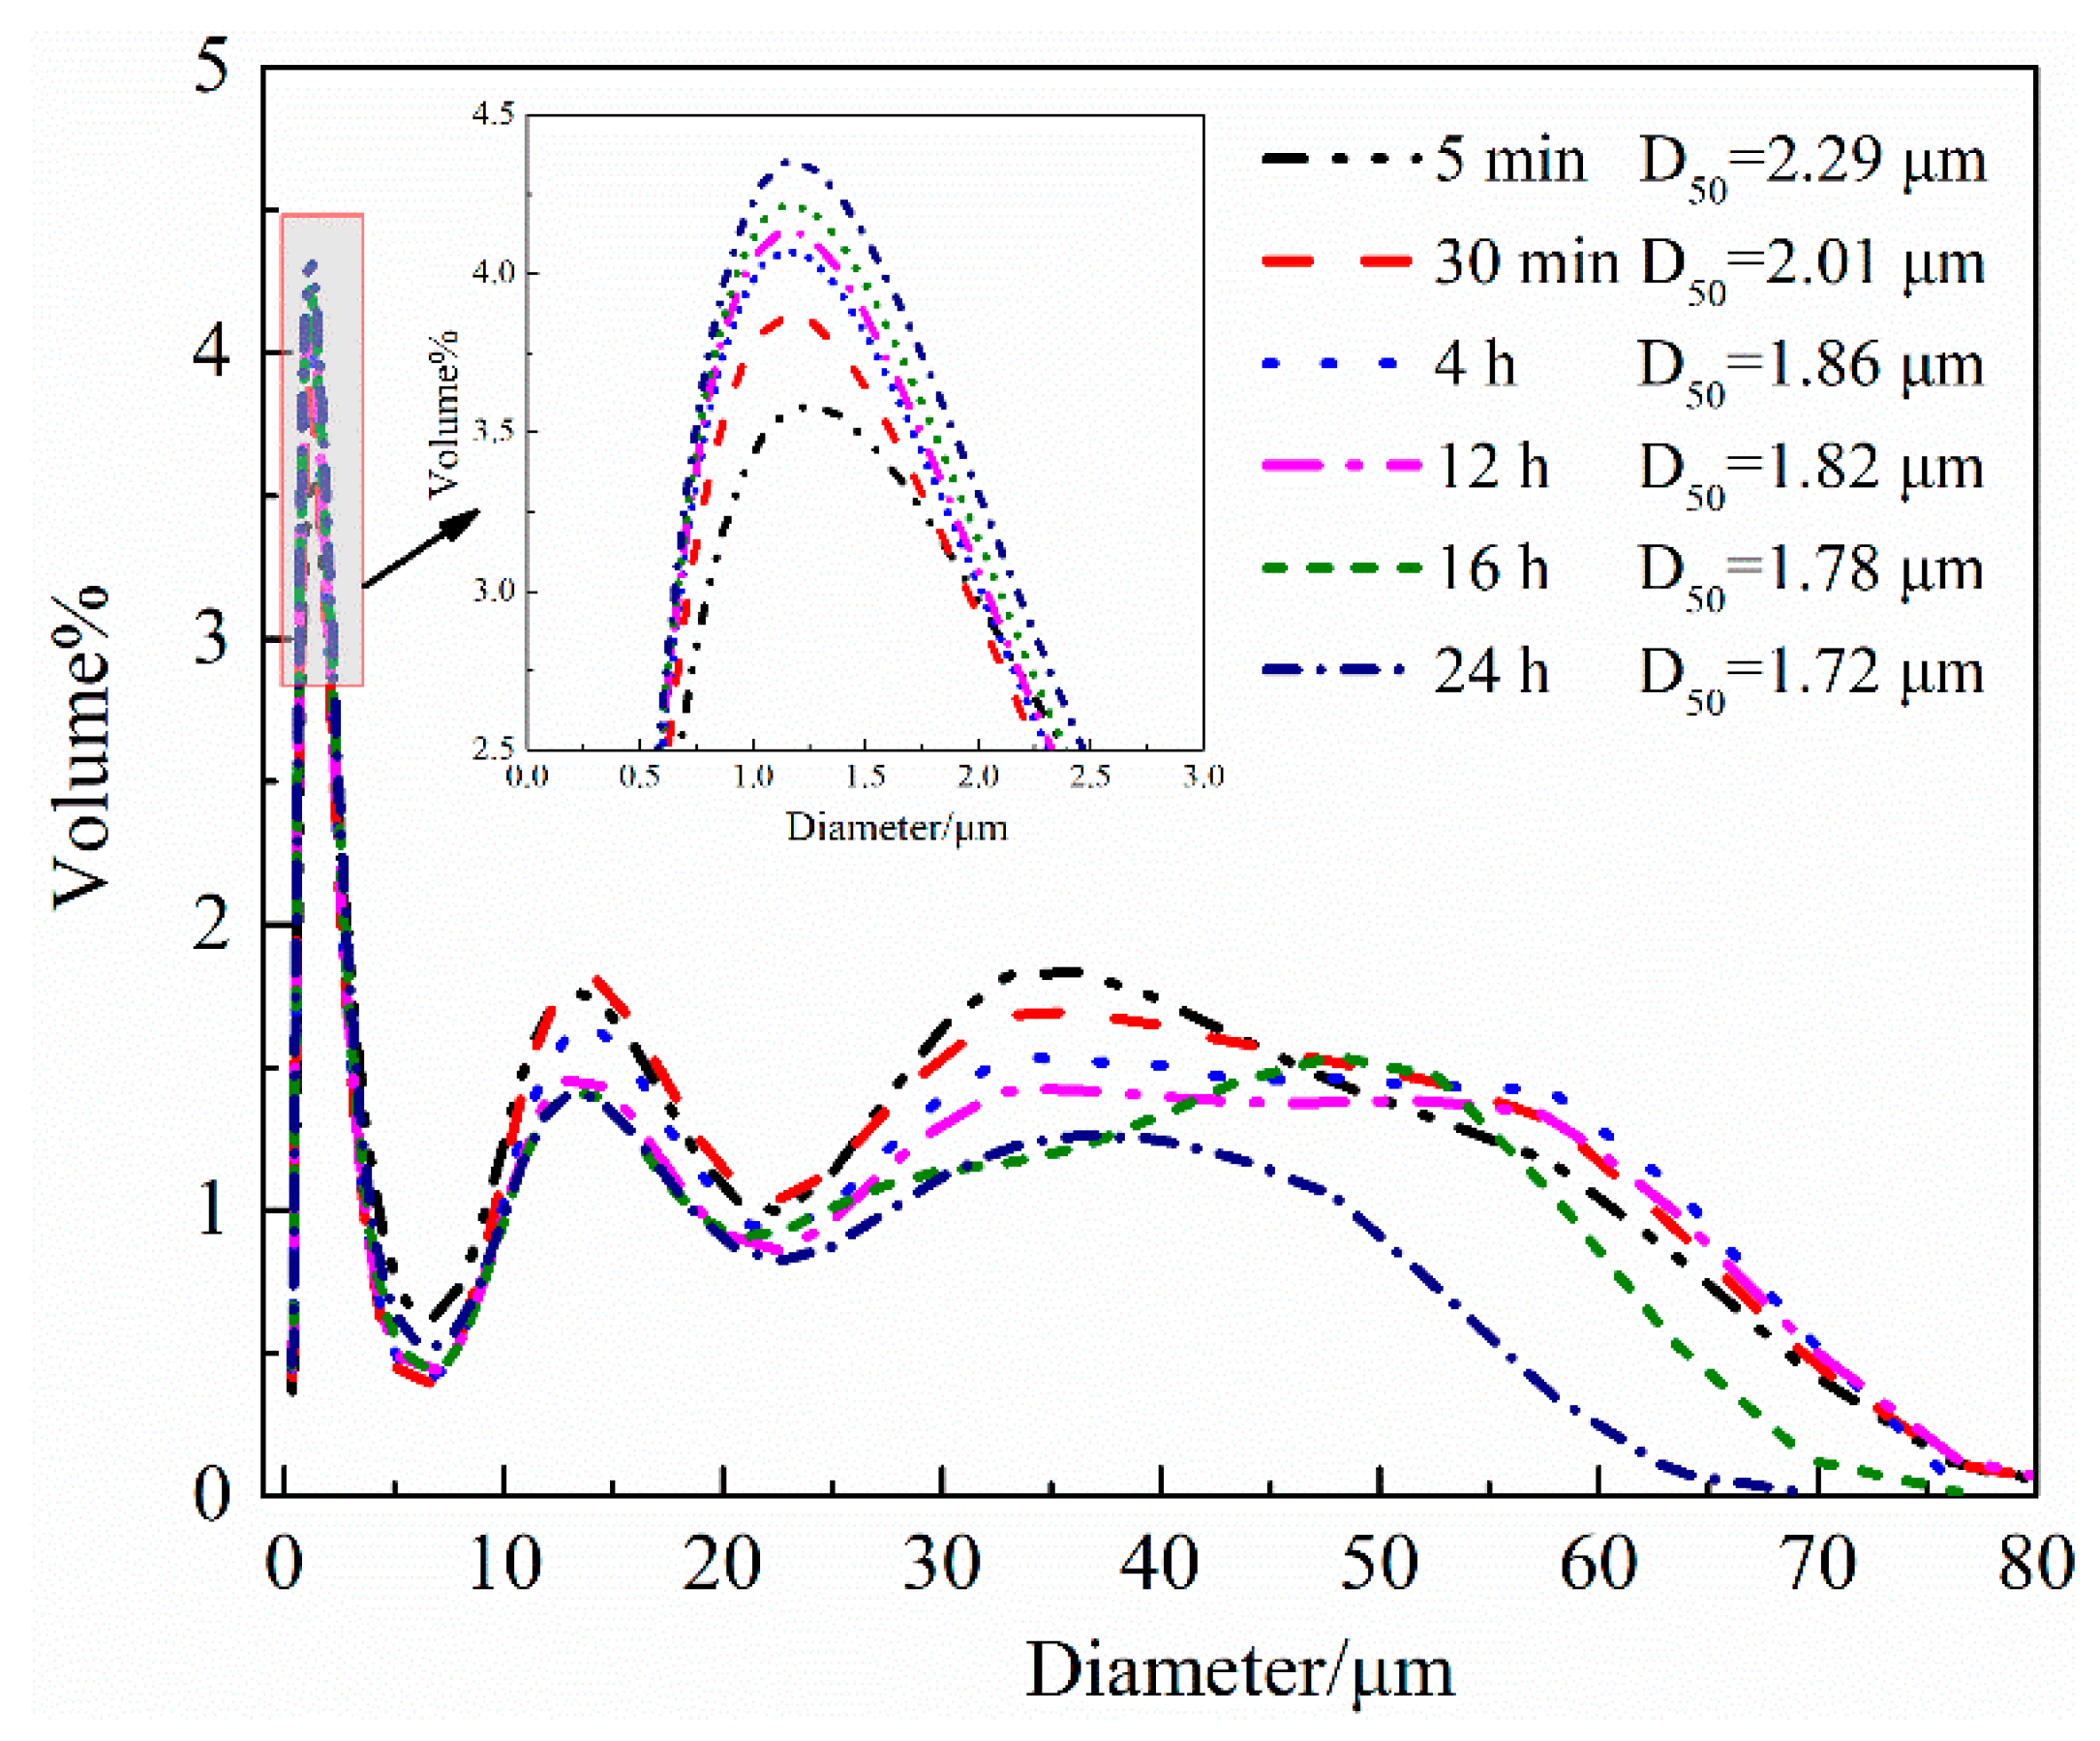
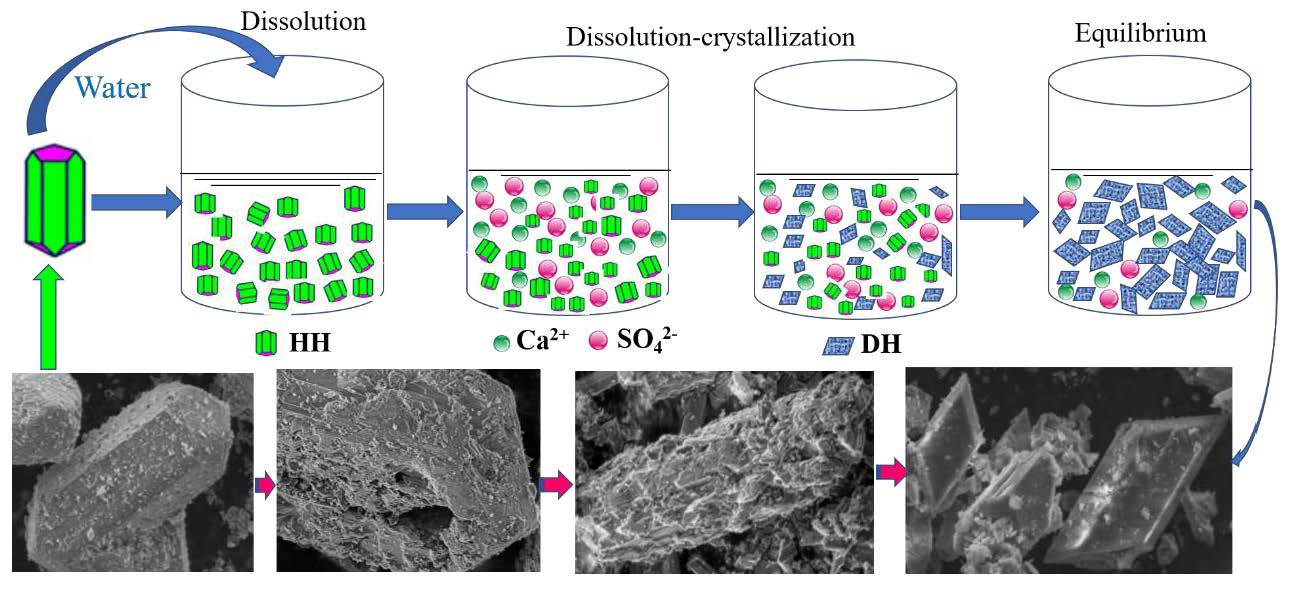
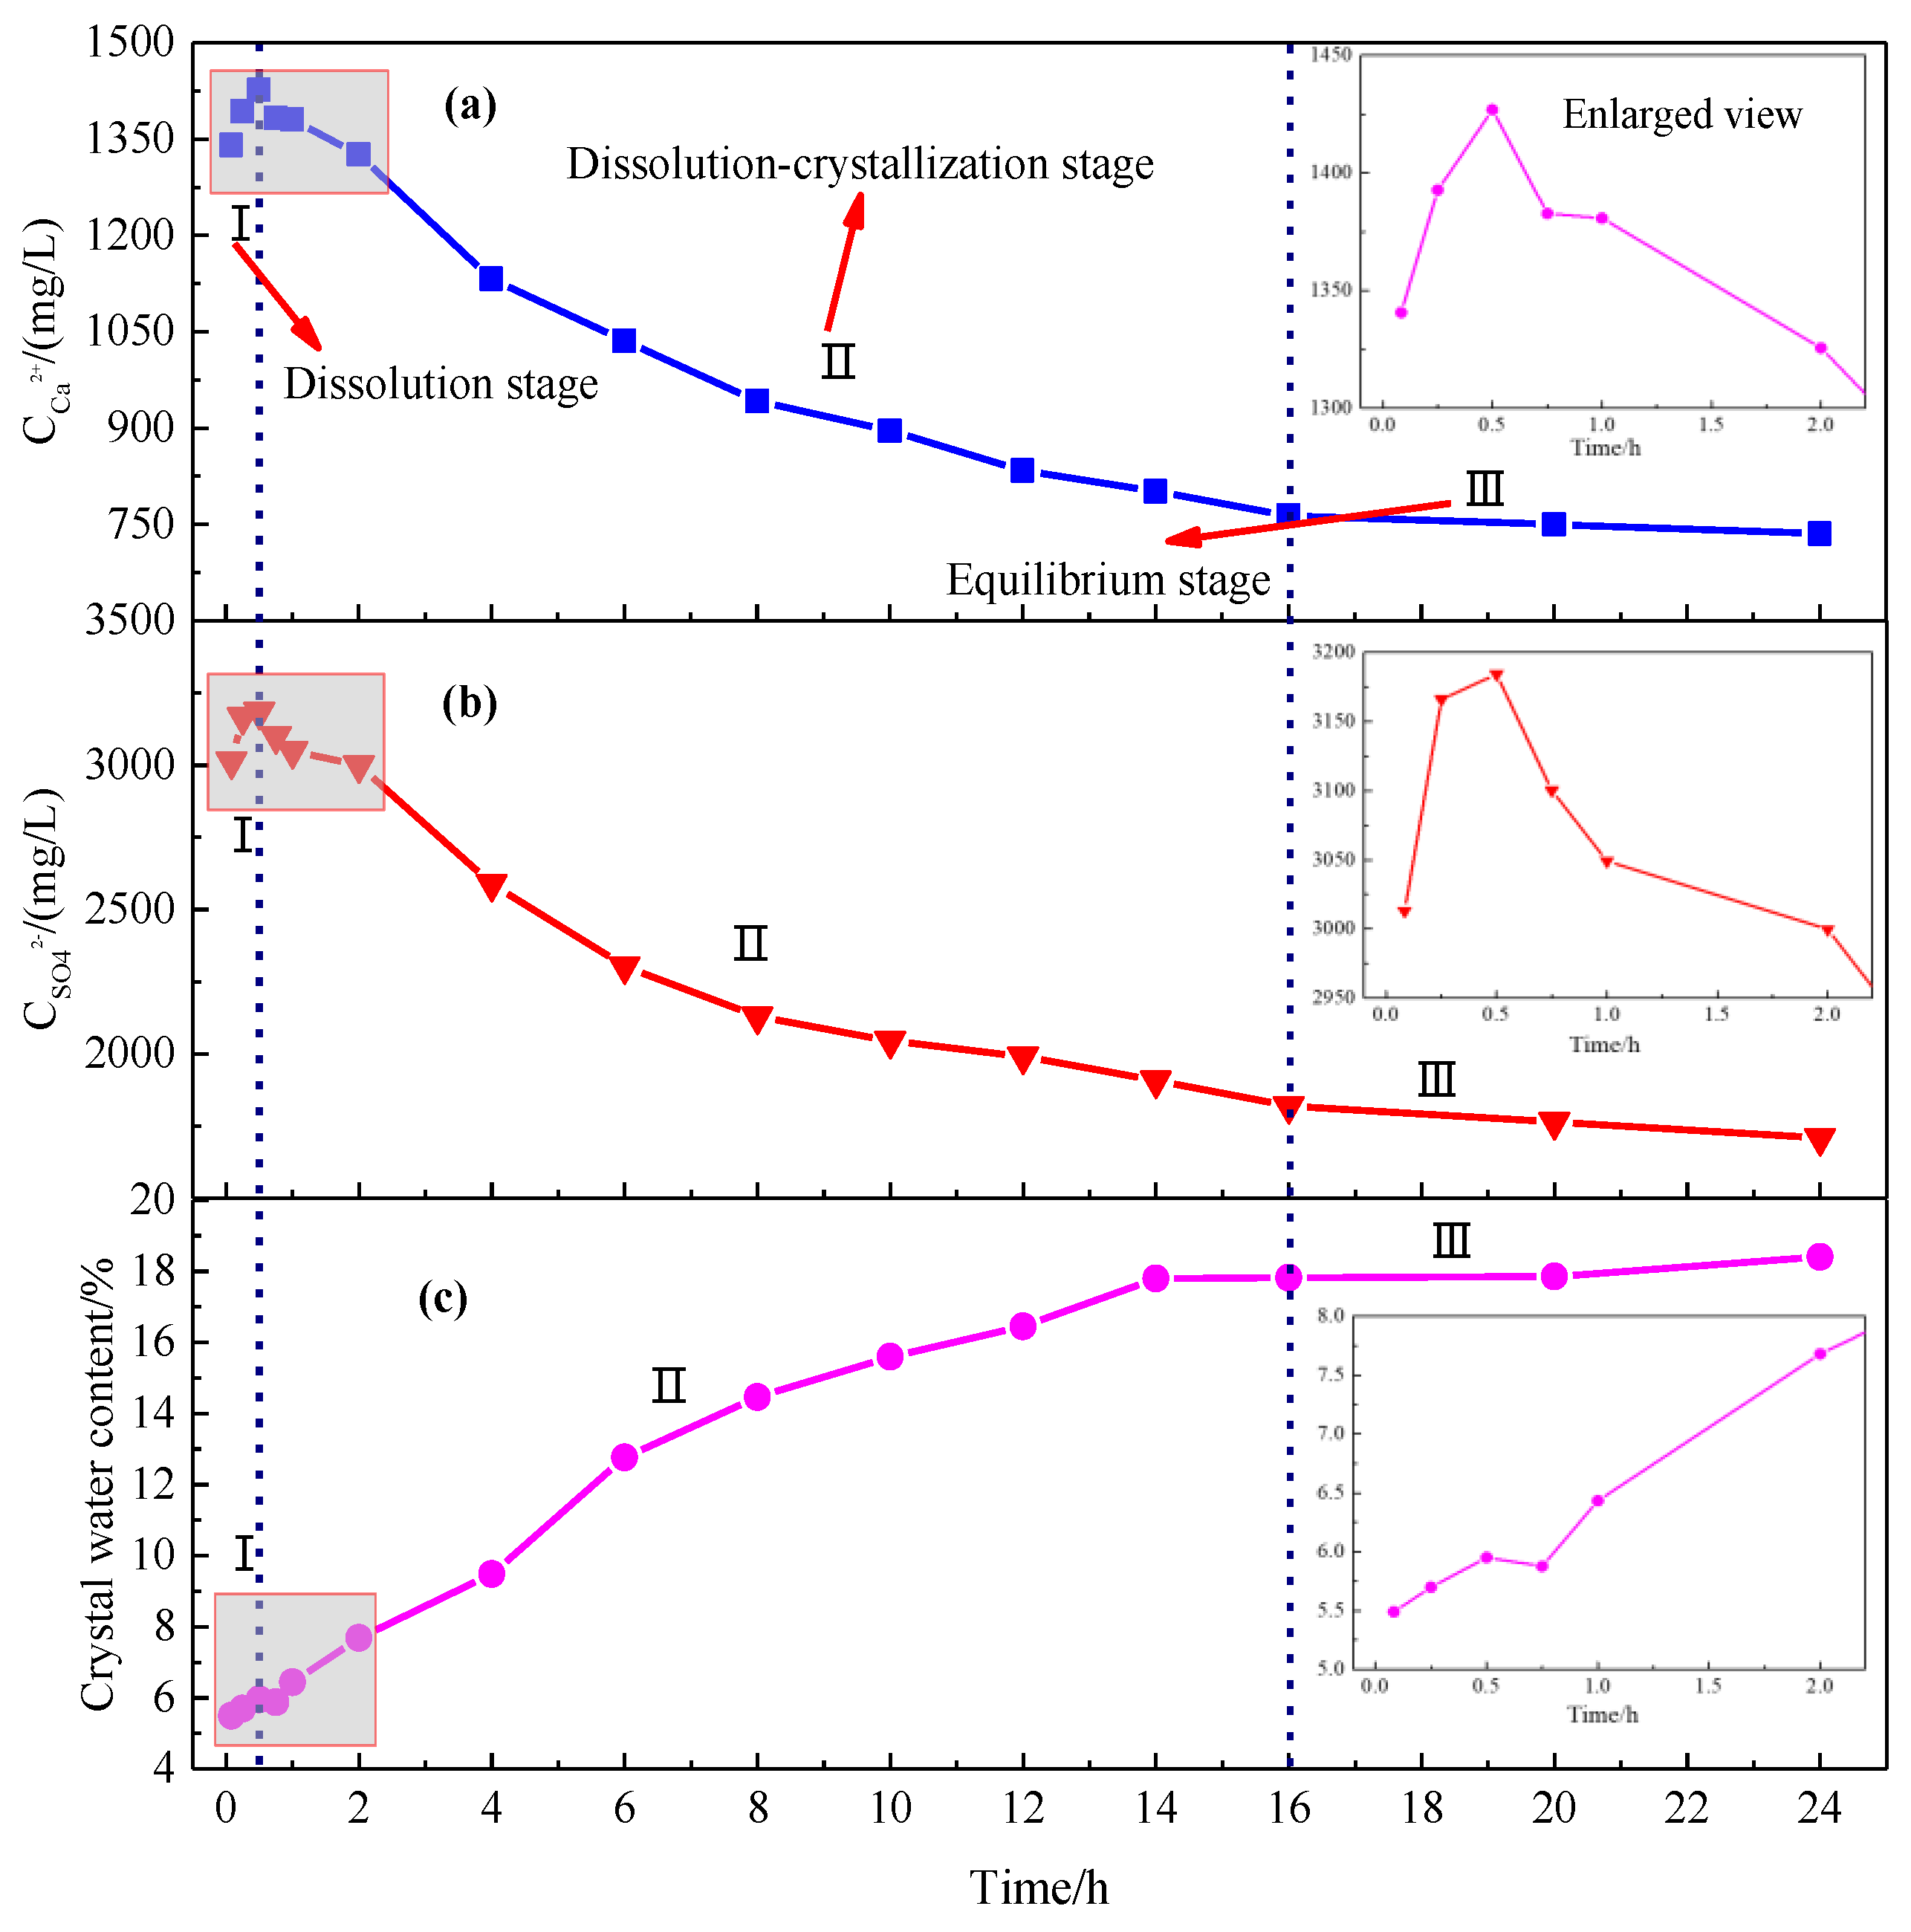
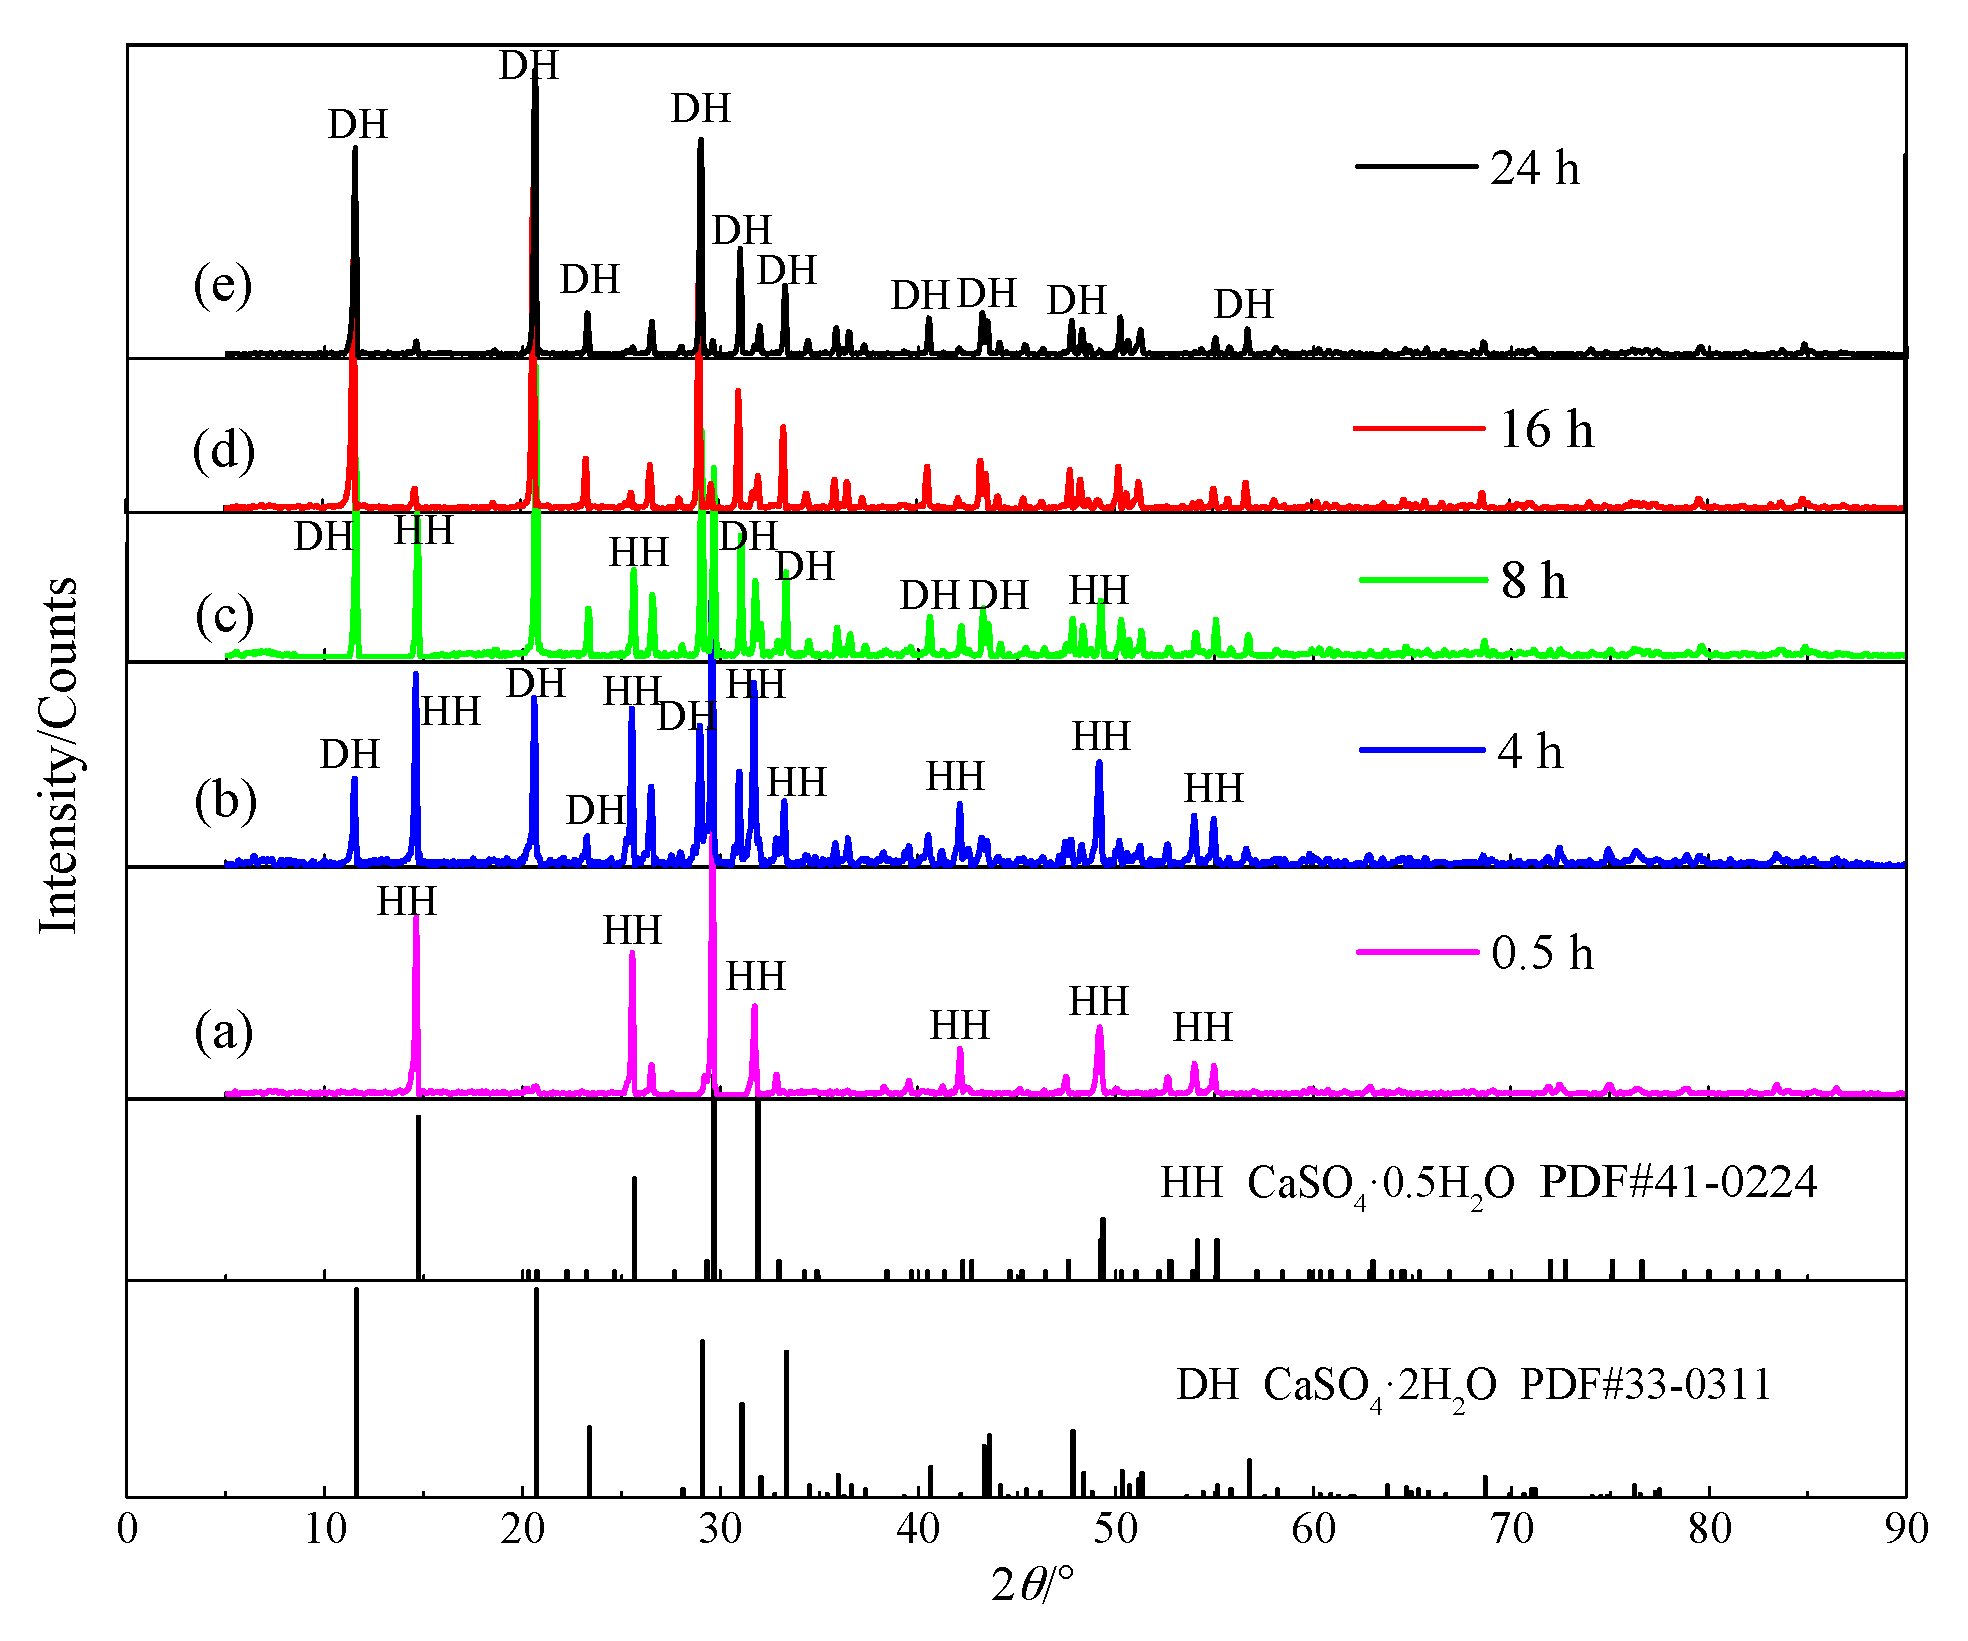
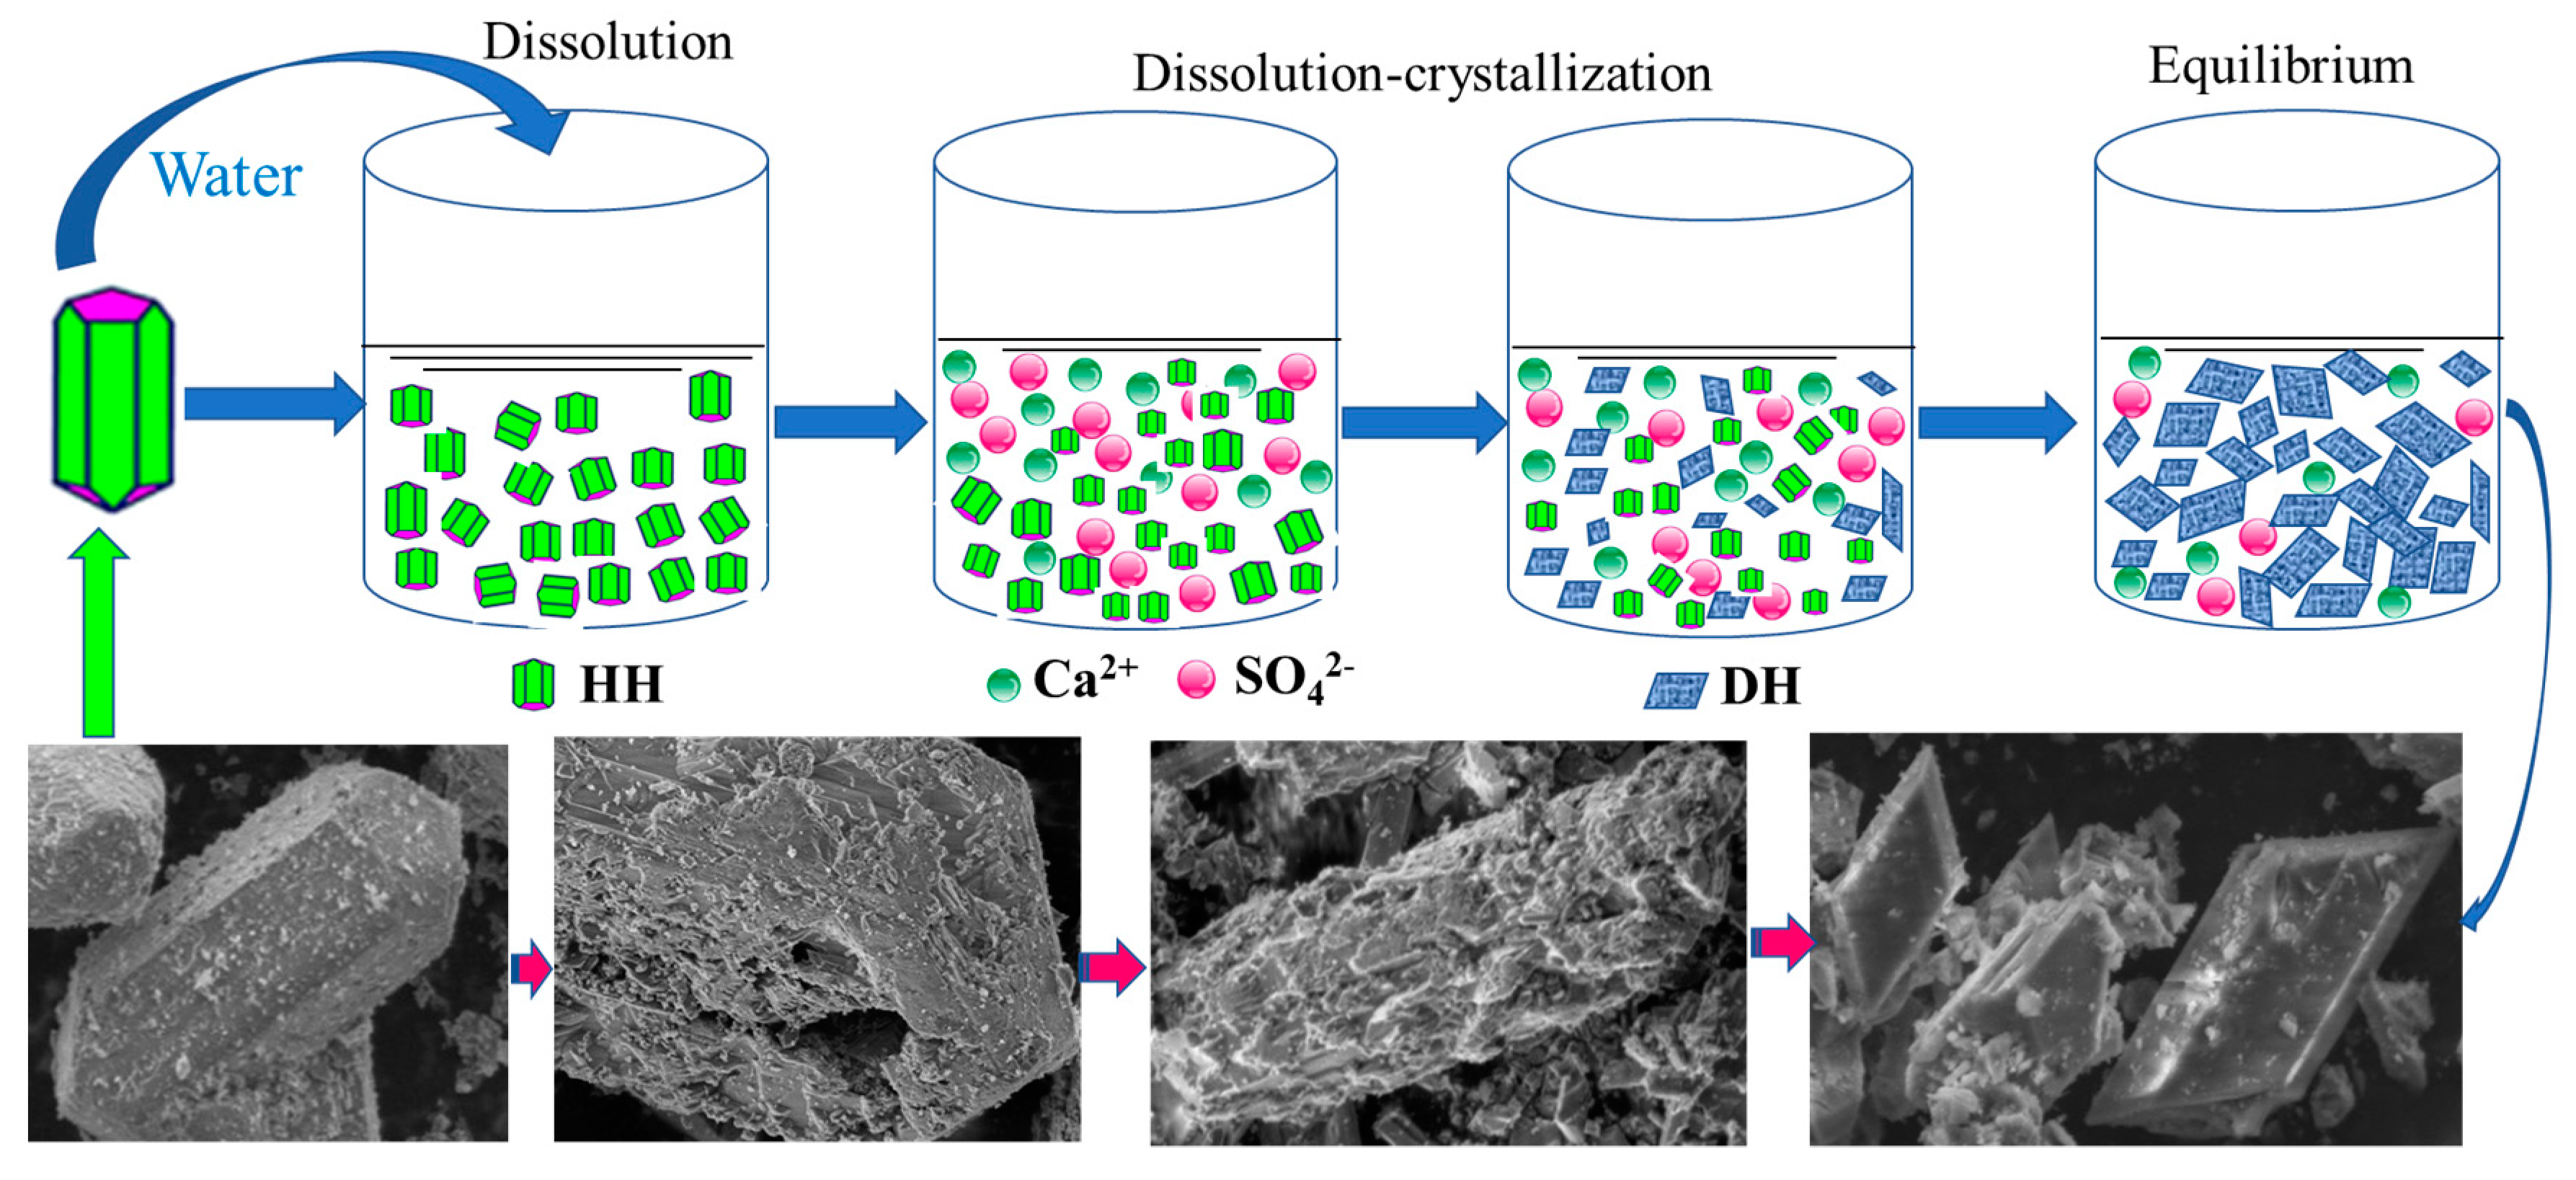
4.1. Hydration Process of HH

In order to further investigate the hydration mechanism of HH, the variations of ion concentrations, crystal water content, morphology and particle size of the products during the hydration process were constantly monitored.

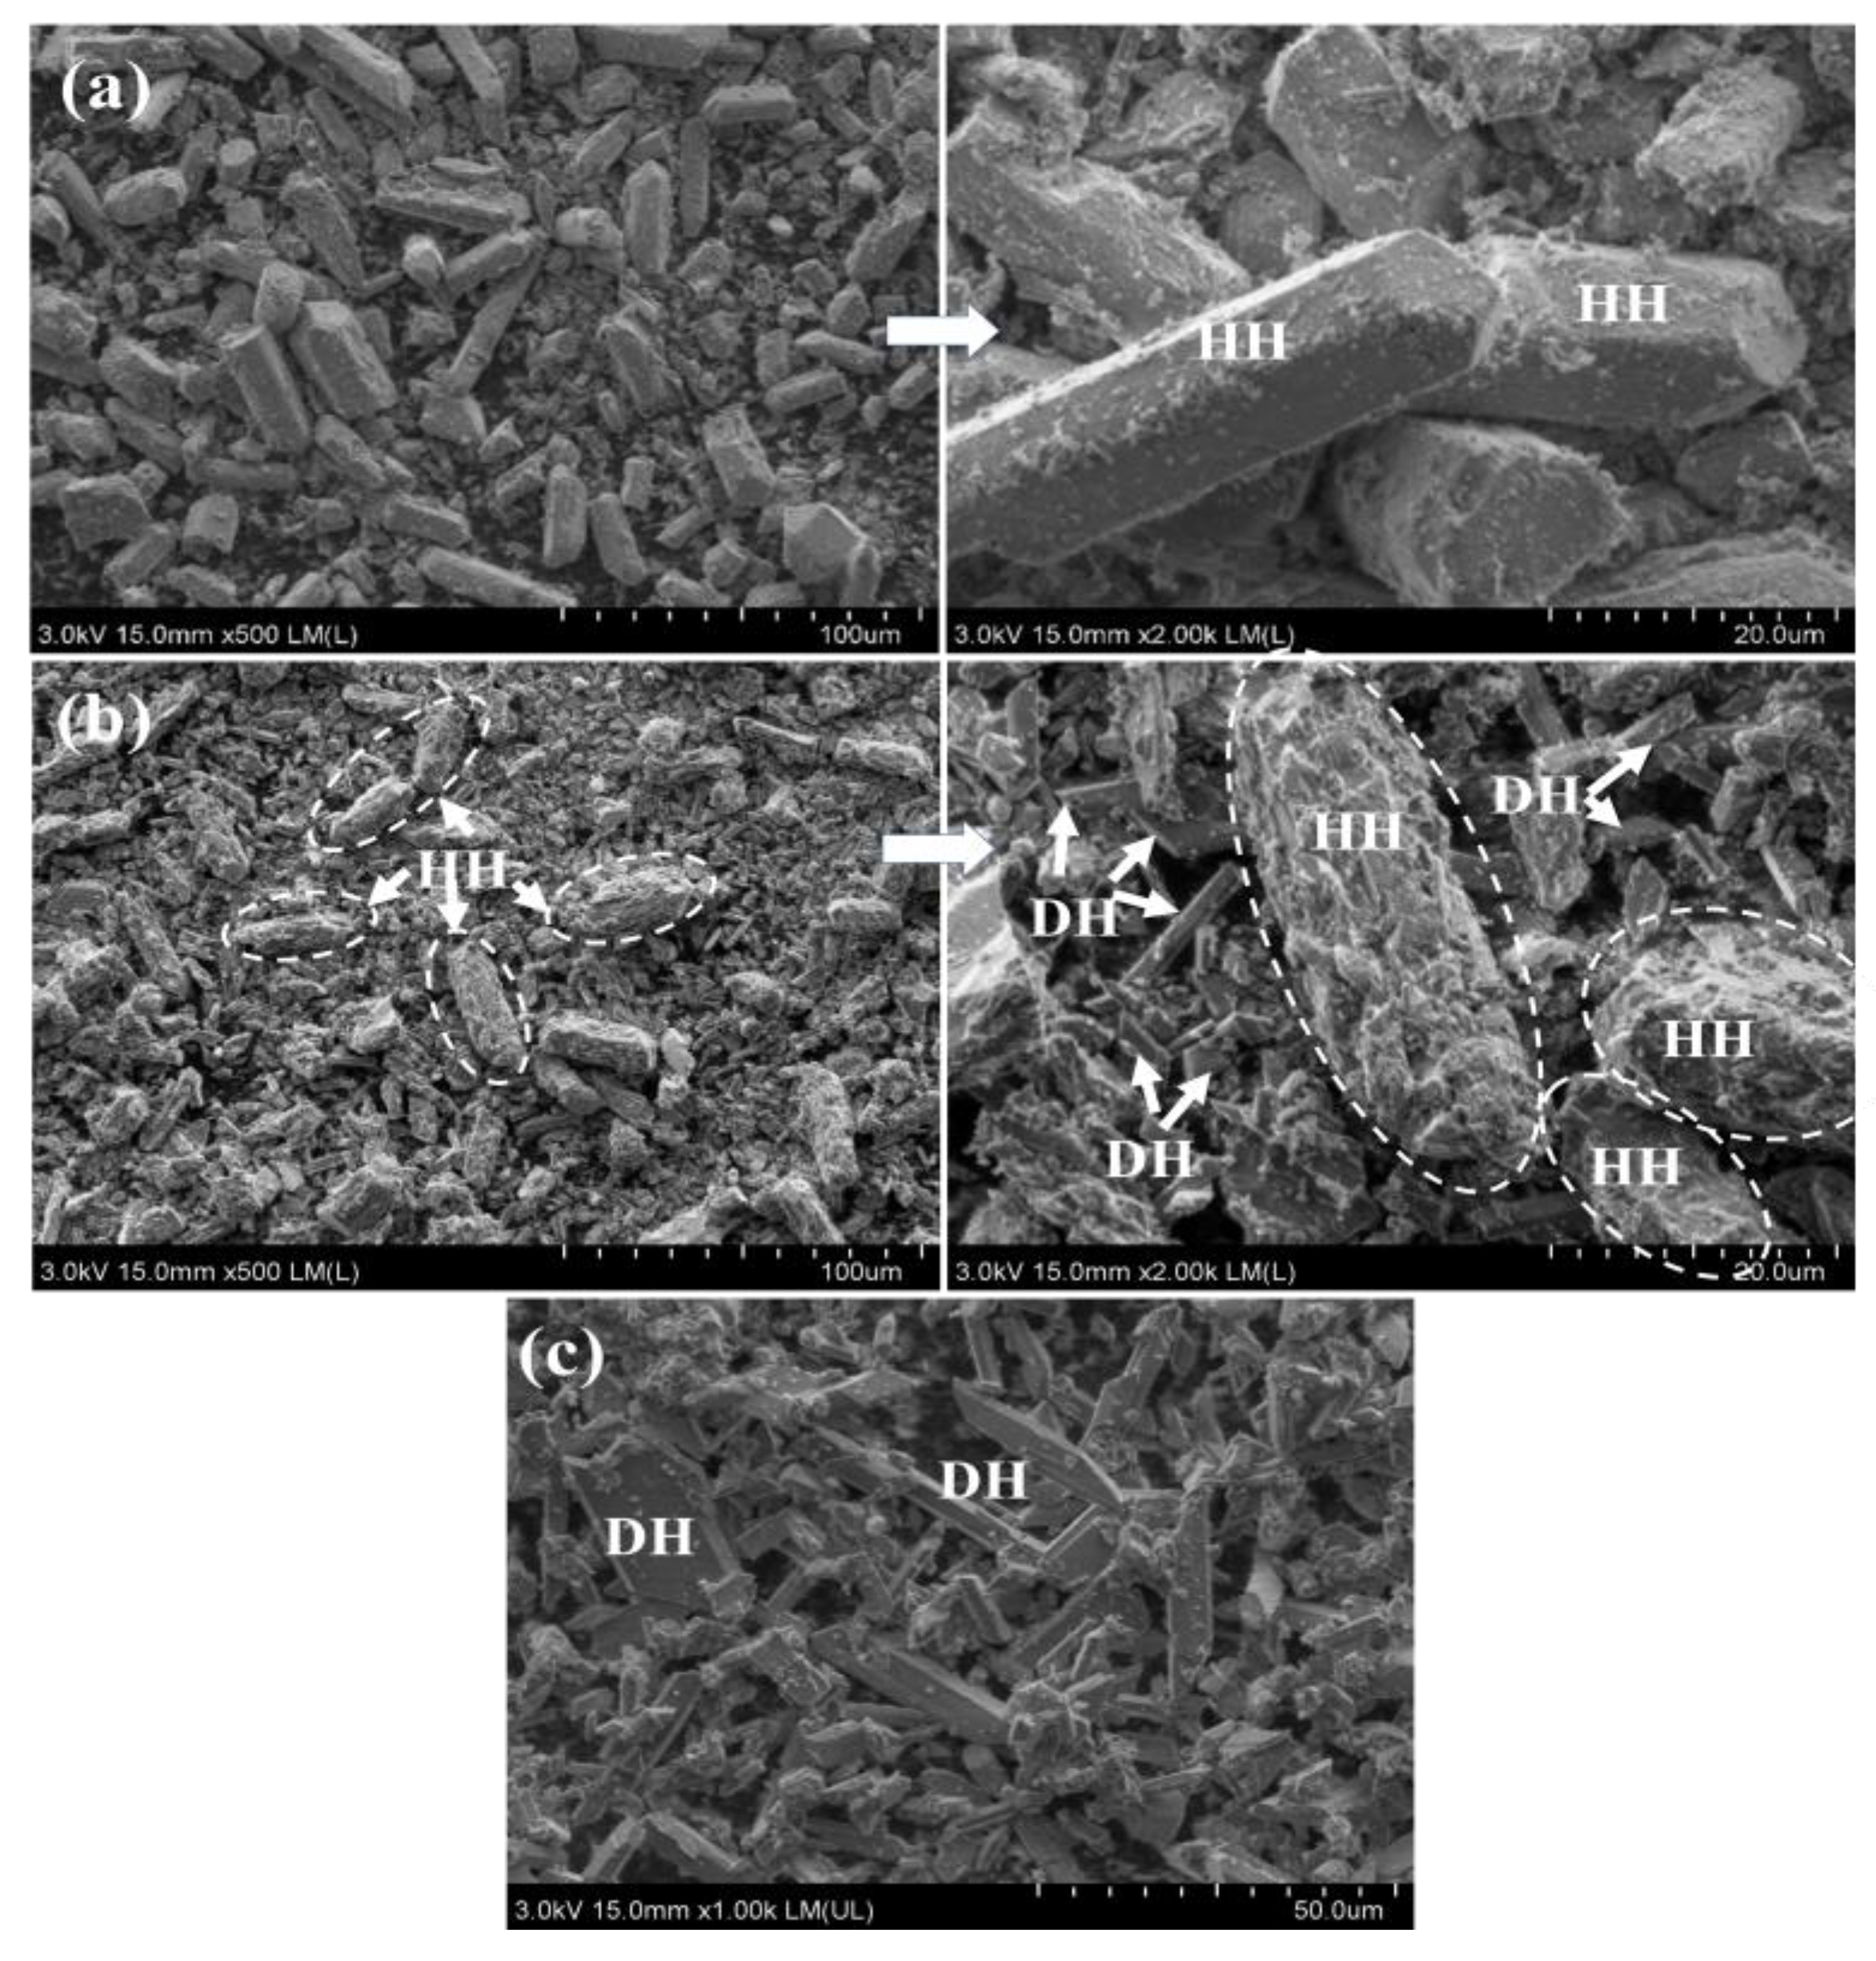
4.1.1. Hydration Process of HH Prepared in the Absence of Crystal Modifier

The concentrations of Ca2+ and SO42−, crystal water content of the products in the hydration process of HH are shown in Figure 3. According to the trend of curves, it is clear that the hydration process of HH can be divided into three stages: Dissolution stage, dissolution–crystallization stage and equilibrium stage.
In the dissolution stage, part of HH particles begin to dissolve into Ca2+ and SO42−, and the concentrations increase rapidly with the progress of hydration. The concentrations of Ca2+ and SO42− reached their peaks at 0.5 h; the values are 1426.85 mg/L and 3184.14 mg/L, respectively. At the same time, the crystal water content of hydration products increases slightly, and the overall change was not significant. The morphology of the hydration product at 0.5 h is shown in Figure 4a. The morphology of the large particles is hexagonal long column, and the crystal surface is slightly dissolved, but relatively complete. Meanwhile, the product is still HH, and no DH particles were observed. Besides, the XRD analysis further shows that the product at 0.5 h matches well with the standard pattern of HH (PDF#41-0224) and no characteristic peaks of DH (PDF#33-0311) can be observed clearly, and the content of HH is about 90.7% (Figure 5a).
The dissolution–crystallization stage is a dynamic process, and the schematic illustration of this process is shown in Figure 6. Because the solubility of HH (6.2 g/L) is higher than that of DH (2 g/L), resulting the HH particles to dissolve to form the saturated solution, which is highly supersaturated for DH. Therefore, the DH can be spontaneously precipitated from the supersaturated solution. Besides, as can be seen from Figure 3a,b, the concentrations of Ca2+ and SO42− gradually decrease, this indicates that the crystallization rate of DH is higher than the dissolution rate of HH. The crystallization of DH destroys the dissolution equilibrium state of HH in the solution, which promotes the further dissolution of HH to compensate for the loss of Ca2+ and SO42− ions. Thus, the dissolution of HH and the crystallization of DH are continuously circulated until the complete dissolution of HH. In addition, due to the formation of DH crystals, the crystal water content of the hydration product increases rapidly from 5.95% to 17.82%.
The morphology of the hydration product at 4 h is shown in Figure 4b. Compared with Figure 4a, it can be seen that the number of coarse particles decrease and fine particles increase significantly due to the dissolution. The surface of HH particles becomes very rough and uneven, and there is no complete crystal surface (Figure 4b). Therefore, in the process of hydration, HH is gradually dissolved from the surface to the interior. At the same time, a small amount of long columnar DH crystals can be observed in the hydration products. Furthermore, the diffraction peaks of DH at 11.508°, 20.608°, 23.260° and 28.980° can be easily observed from Figure 5b, and the content of DH is about 33% at 4 h. With the progress of hydration, a significant reduction in the diffraction intensity of HH and an increase in the intensity of DH were observed. The XRD pattern of the hydration product at 8 h is shown in Figure 5c, the content of DH increases to 62.7%.
In the equilibrium stage, HH is basically hydrated into DH, the dissolution and recrystallization of DH itself reach dynamic equilibrium. Besides, the crystal water content of the hydration product remains at about 18%. The crystal morphology of the hydration product at 24 h is shown in Figure 4c. It is observed that the HH particles in the hydration product are disappeared and completely converted into DH crystals, which are mainly in the form of long column crystals with a large aspect ratio of 3.78:1. This is because there are two bonds with a high stability between Ca2+ and SO42− in the c-axis direction of DH crystal, and the two end-faces can be bonded, promoting the growth parallel to the c-axis direction and forming a long, columnar crystal without additives. Furthermore, as can be seen from Figure 5d,e, the diffraction peaks of HH are disappeared, and the XRD pattern of the hydration product matches well with the standard pattern of DH. The results further demonstrate that the HH was completely transformed into DH, and the content of DH is about 91.1% at 24 h. According to the observation of morphology and analysis of XRD for the hydration products, the hydrosol or gel was not observed by SEM and the amorphous phases were not detected by XRD in the whole hydration process. Thus, the hydration of HH does not follow the colloid theory.
The particle size distribution of products in the hydration process is shown in Figure 7. With the increase of hydration time, the distribution of particles in the range of intermediate particle size 10–20 μm and coarse particle size 25–70 μm decrease gradually, while the distribution of particles in the range of fine particle size 0–5 μm increase, the median diameter (D50) decreases from 2.29 μm to 1.72 μm, indicating that HH particles dissolve and recrystallize formation DH crystals with smaller particle size.
In the whole hydration process, the zeta potential of the product changes with time as shown in Table 1. The zeta potential of hydration products is negative under different hydration times, indicating that the surface of HH and DH are negatively charged and have similar surface potentials. This is because the surface of particles comes into contact with water and begins to dissolve into Ca2+ and SO42−; since the volume of SO42− is much larger than that of Ca2+, it is difficult to diffuse outwards and stay on the surface of HH particles to form potential ions, while Ca2+ quickly enters into the solution to form coordination ions because of its small volume and strong diffusion ability, thus forming a double electric layer structure with negative zeta potential. The average value of zeta potential is −1.38 mV, which is close to the zeta potential of DH (−1.36 mV) reported in the literature [29].
{[CaSO4·0.5H2O]nSO42−·xCa2+}−2n(n − x)(n − x)Ca2+

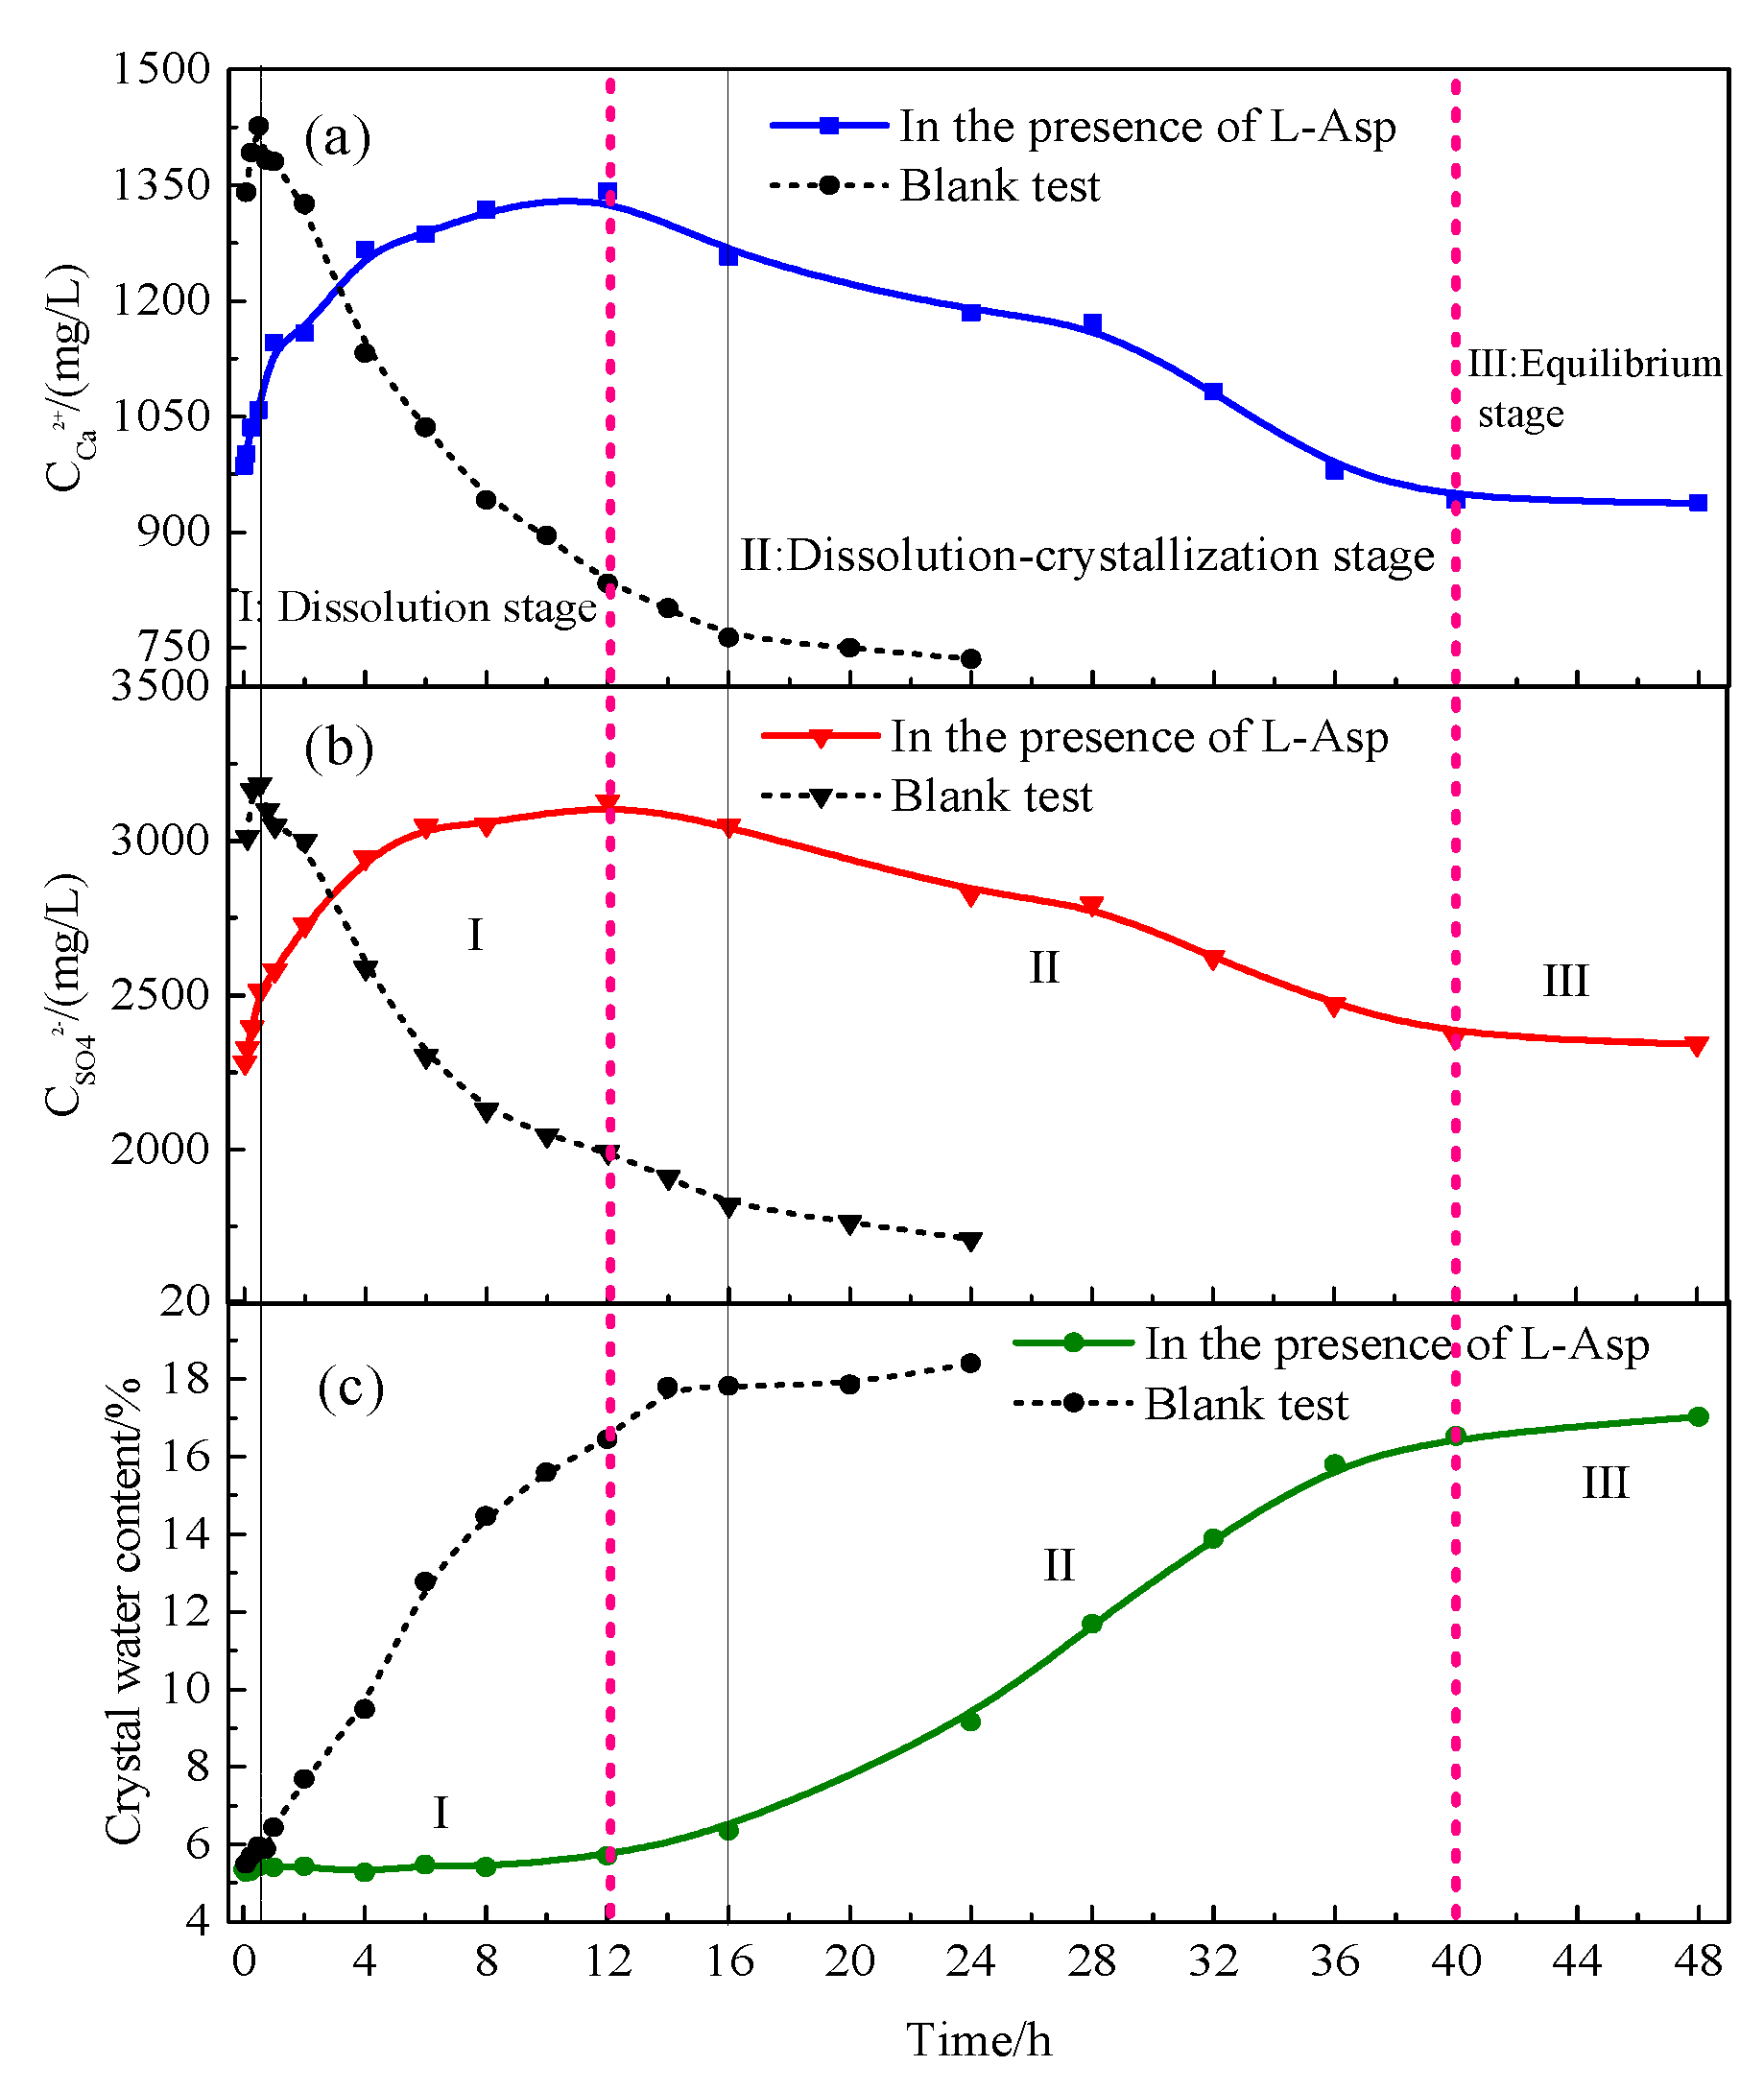
4.1.2. Hydration Process of HH Prepared in the Presence of L-Asp

HH particles were prepared with 2.50 mM L-Asp, and the variations of ions concentration and crystal water content of products in the hydration process of as-prepared HH are shown in Figure 8. Compared with the blank test, the hydration process of HH prepared with L-Asp can also be divided into three stages. The difference is that the dissolution and crystallization time are obviously prolonged. This is because amino acids can inhibit the dissolution of HH and the formation of DH crystal nucleus through adsorption and colloidal protection, hindering the early hydration of HH and prolonging the hydration induction period [30,31]. Ding et al. [32] also found that combination with Ca2+ on the surface of DH crystal nuclei may form a chemisorbed layer, reduce the surface energy of the crystal nuclei, and inhibit the growth of the crystal nuclei of DH. Similarly, succinic, malic and citric acids (except tartaric acid) could adsorb on solid surfaces and retard the hydration of HH [33,34]. Besides, during the dissolution and crystallization stages, the ion concentrations (Ca2+, SO42−) increase and decrease slowly, respectively. The equilibrium concentrations of Ca2+ and SO42− are increased for HH prepared with L-Asp.
The morphology evolution of the hydration production is shown in Figure 9. The product is still short columnar HH and without DH formation at 8 h. However, on the surface of HH particles, there are a large number of dissolved holes, and a part of the DH crystals can be observed at 24 h. The HH particles have been completely transformed into the diamond shape DH crystals at 48 h. Therefore, the DH crystals with an aspect ratio of 1:1 can be obtained from HH prepared in the presence of L-Asp, it is helpful to reduce the pores in the hardened paste.
In the hydration process of HH, the particle size distribution of the hydration products with time is shown in Figure 10. Along with the hydration of HH, the particle size of the hydration product decreases significantly due to the dissolution of HH at first, and then increases slightly due to the crystallization of DH. As a whole, the particle size of hydration products DH is smaller than that of HH.
The main factor for affecting the crystallization is the degree of supersaturation. The formula of the maximum relative supersaturation (Smax) in the hydration process of HH is as follows:
S max = C D H , max C D H , e q u i l i b r i u m C D H , e q u i l i b r i u m
where CDH,max is the concentration of DH calculated by the top concentration of SO42−, and CDH,equilibrium is the equilibrium concentration of DH calculated by the last point of SO42− concentration.
The value of Smax during the hydration of HH is shown in Table 2, it can be seen that the Smax of HH prepared without crystal modifier is 0.86, and the Smax of HH prepared in the presence of L-Asp is distinctly reduced to 0.34. Therefore, under the action of organic acids, the Smax of HH hydration can be decreased, thus the hydration time was prolonged.
In conclusion, the model of HH hydration into DH is proposed and its schematic diagram is shown in Figure 11. The hydration process goes through three stages successively: dissolution, dissolution–crystallization, and equilibrium. Therefore, the hydration of HH to DH follows the dissolution–crystallization principle.

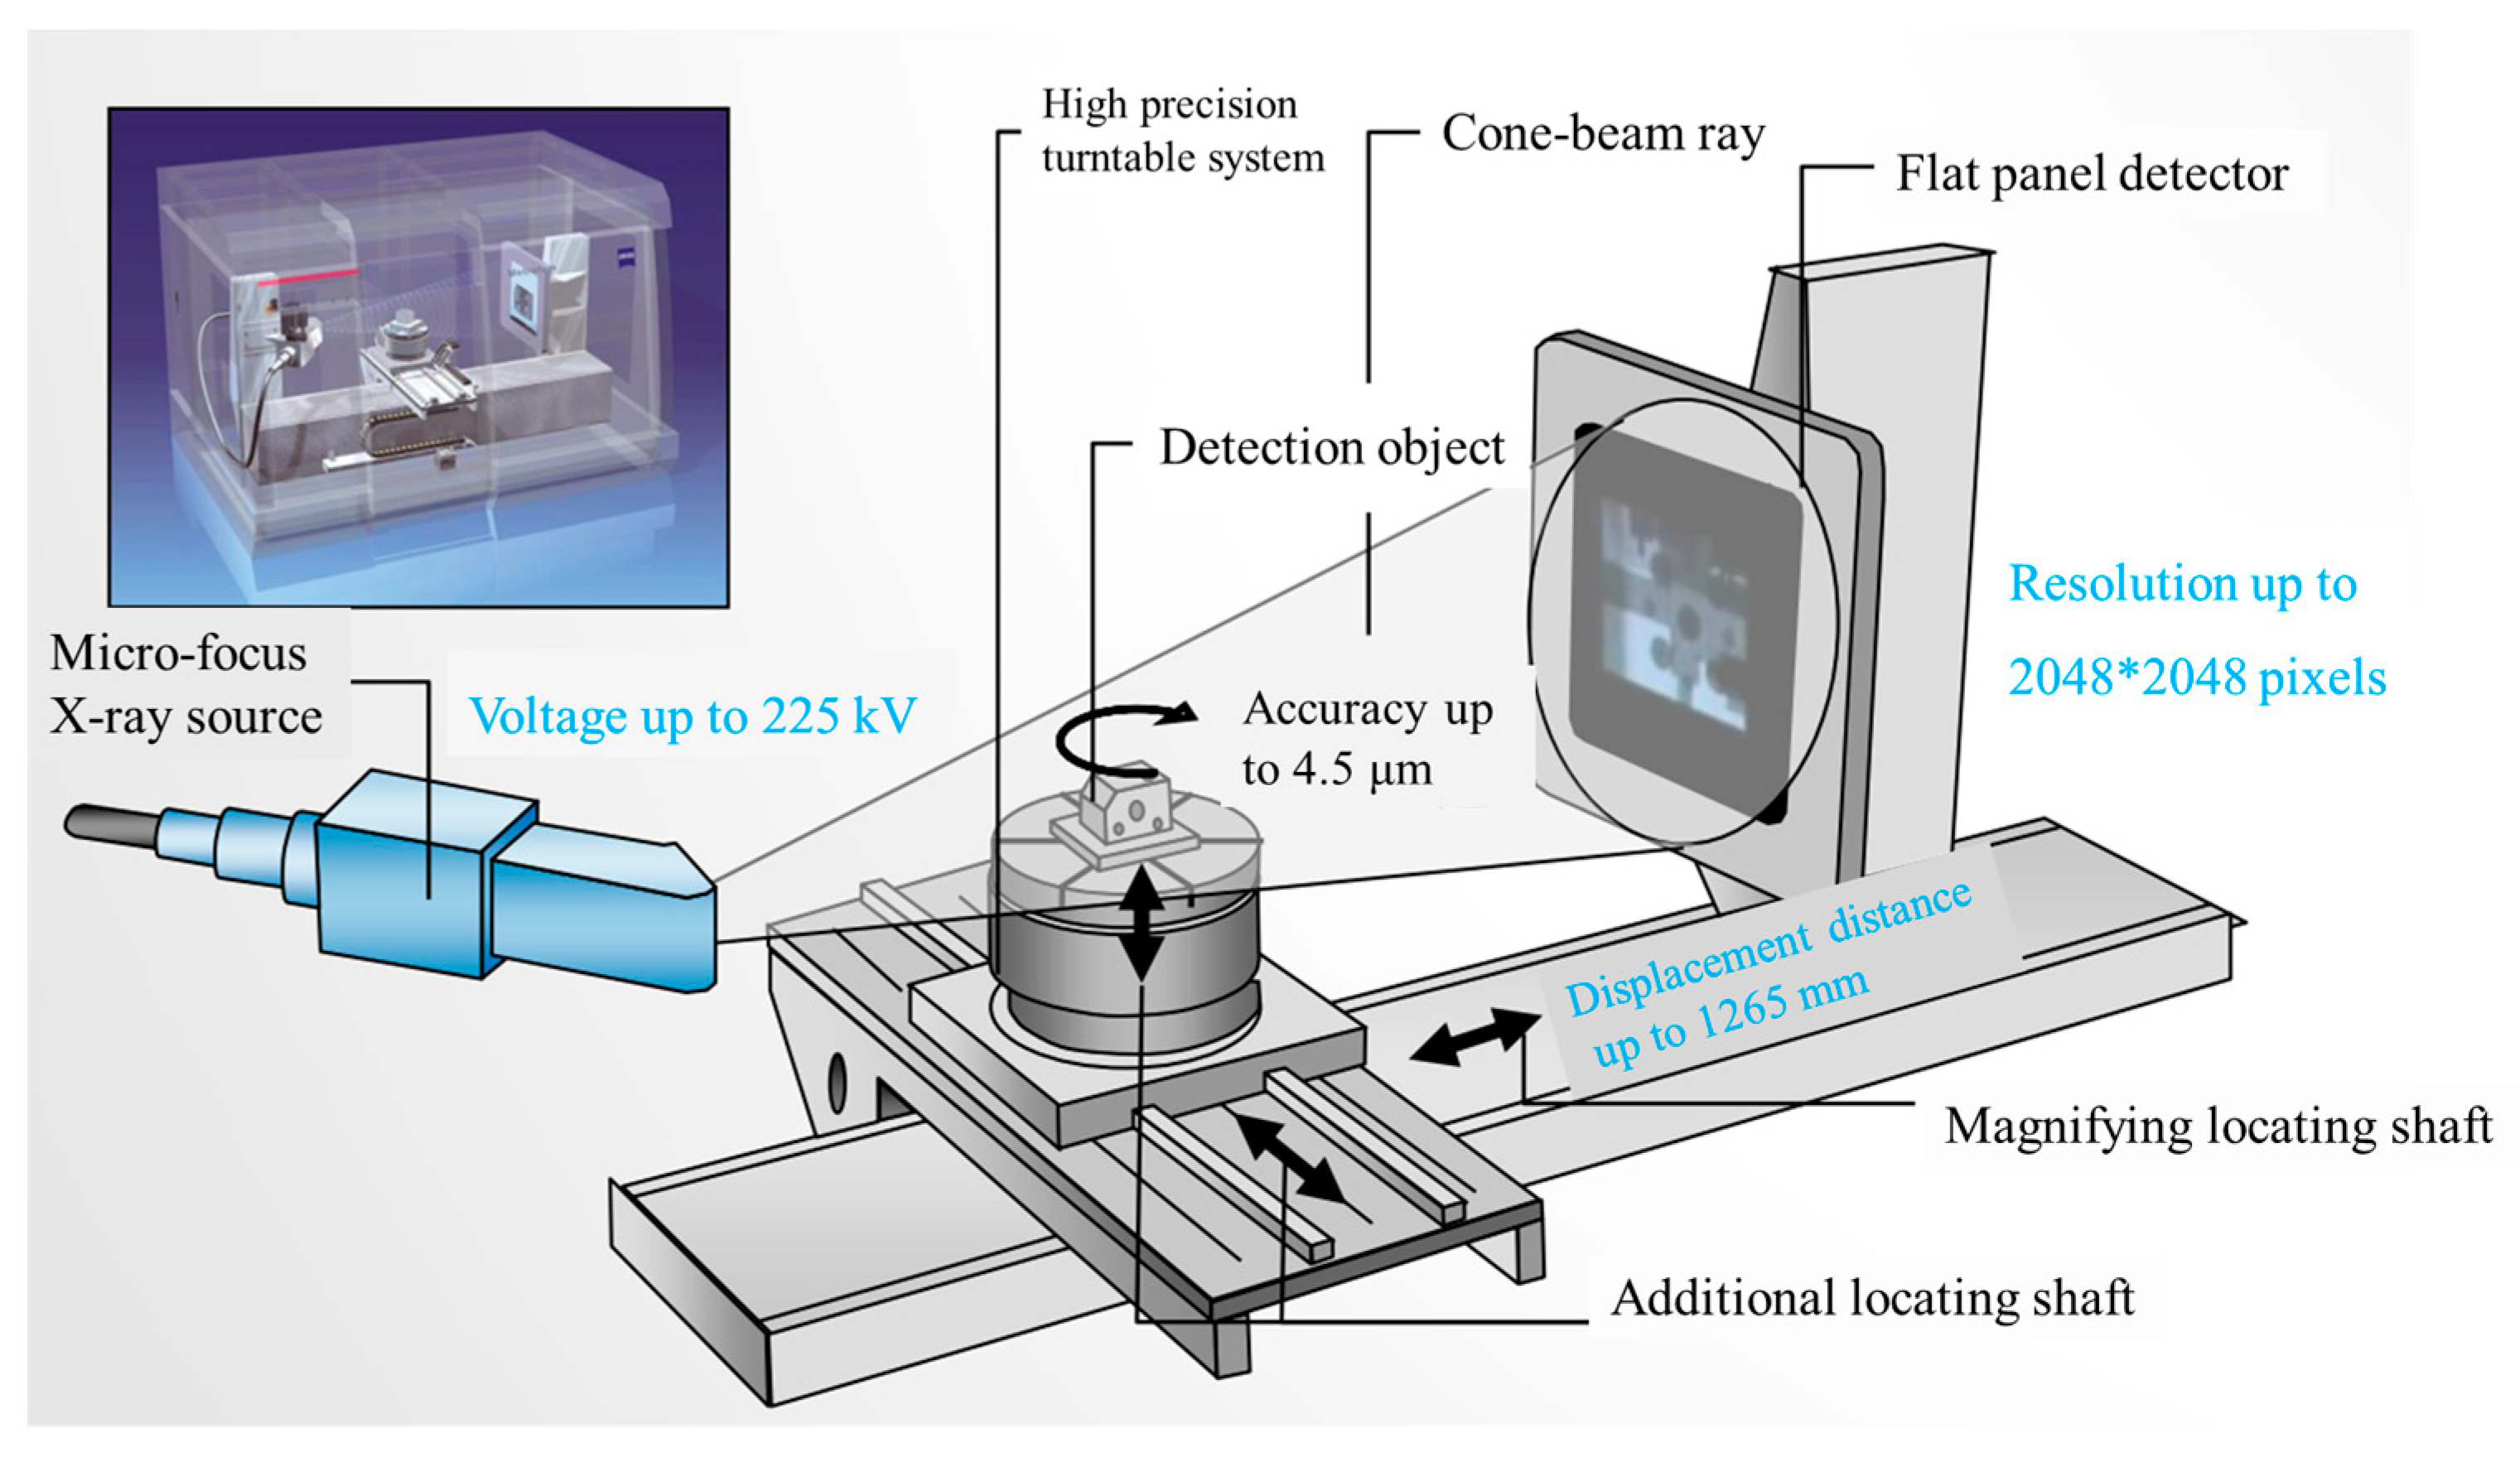
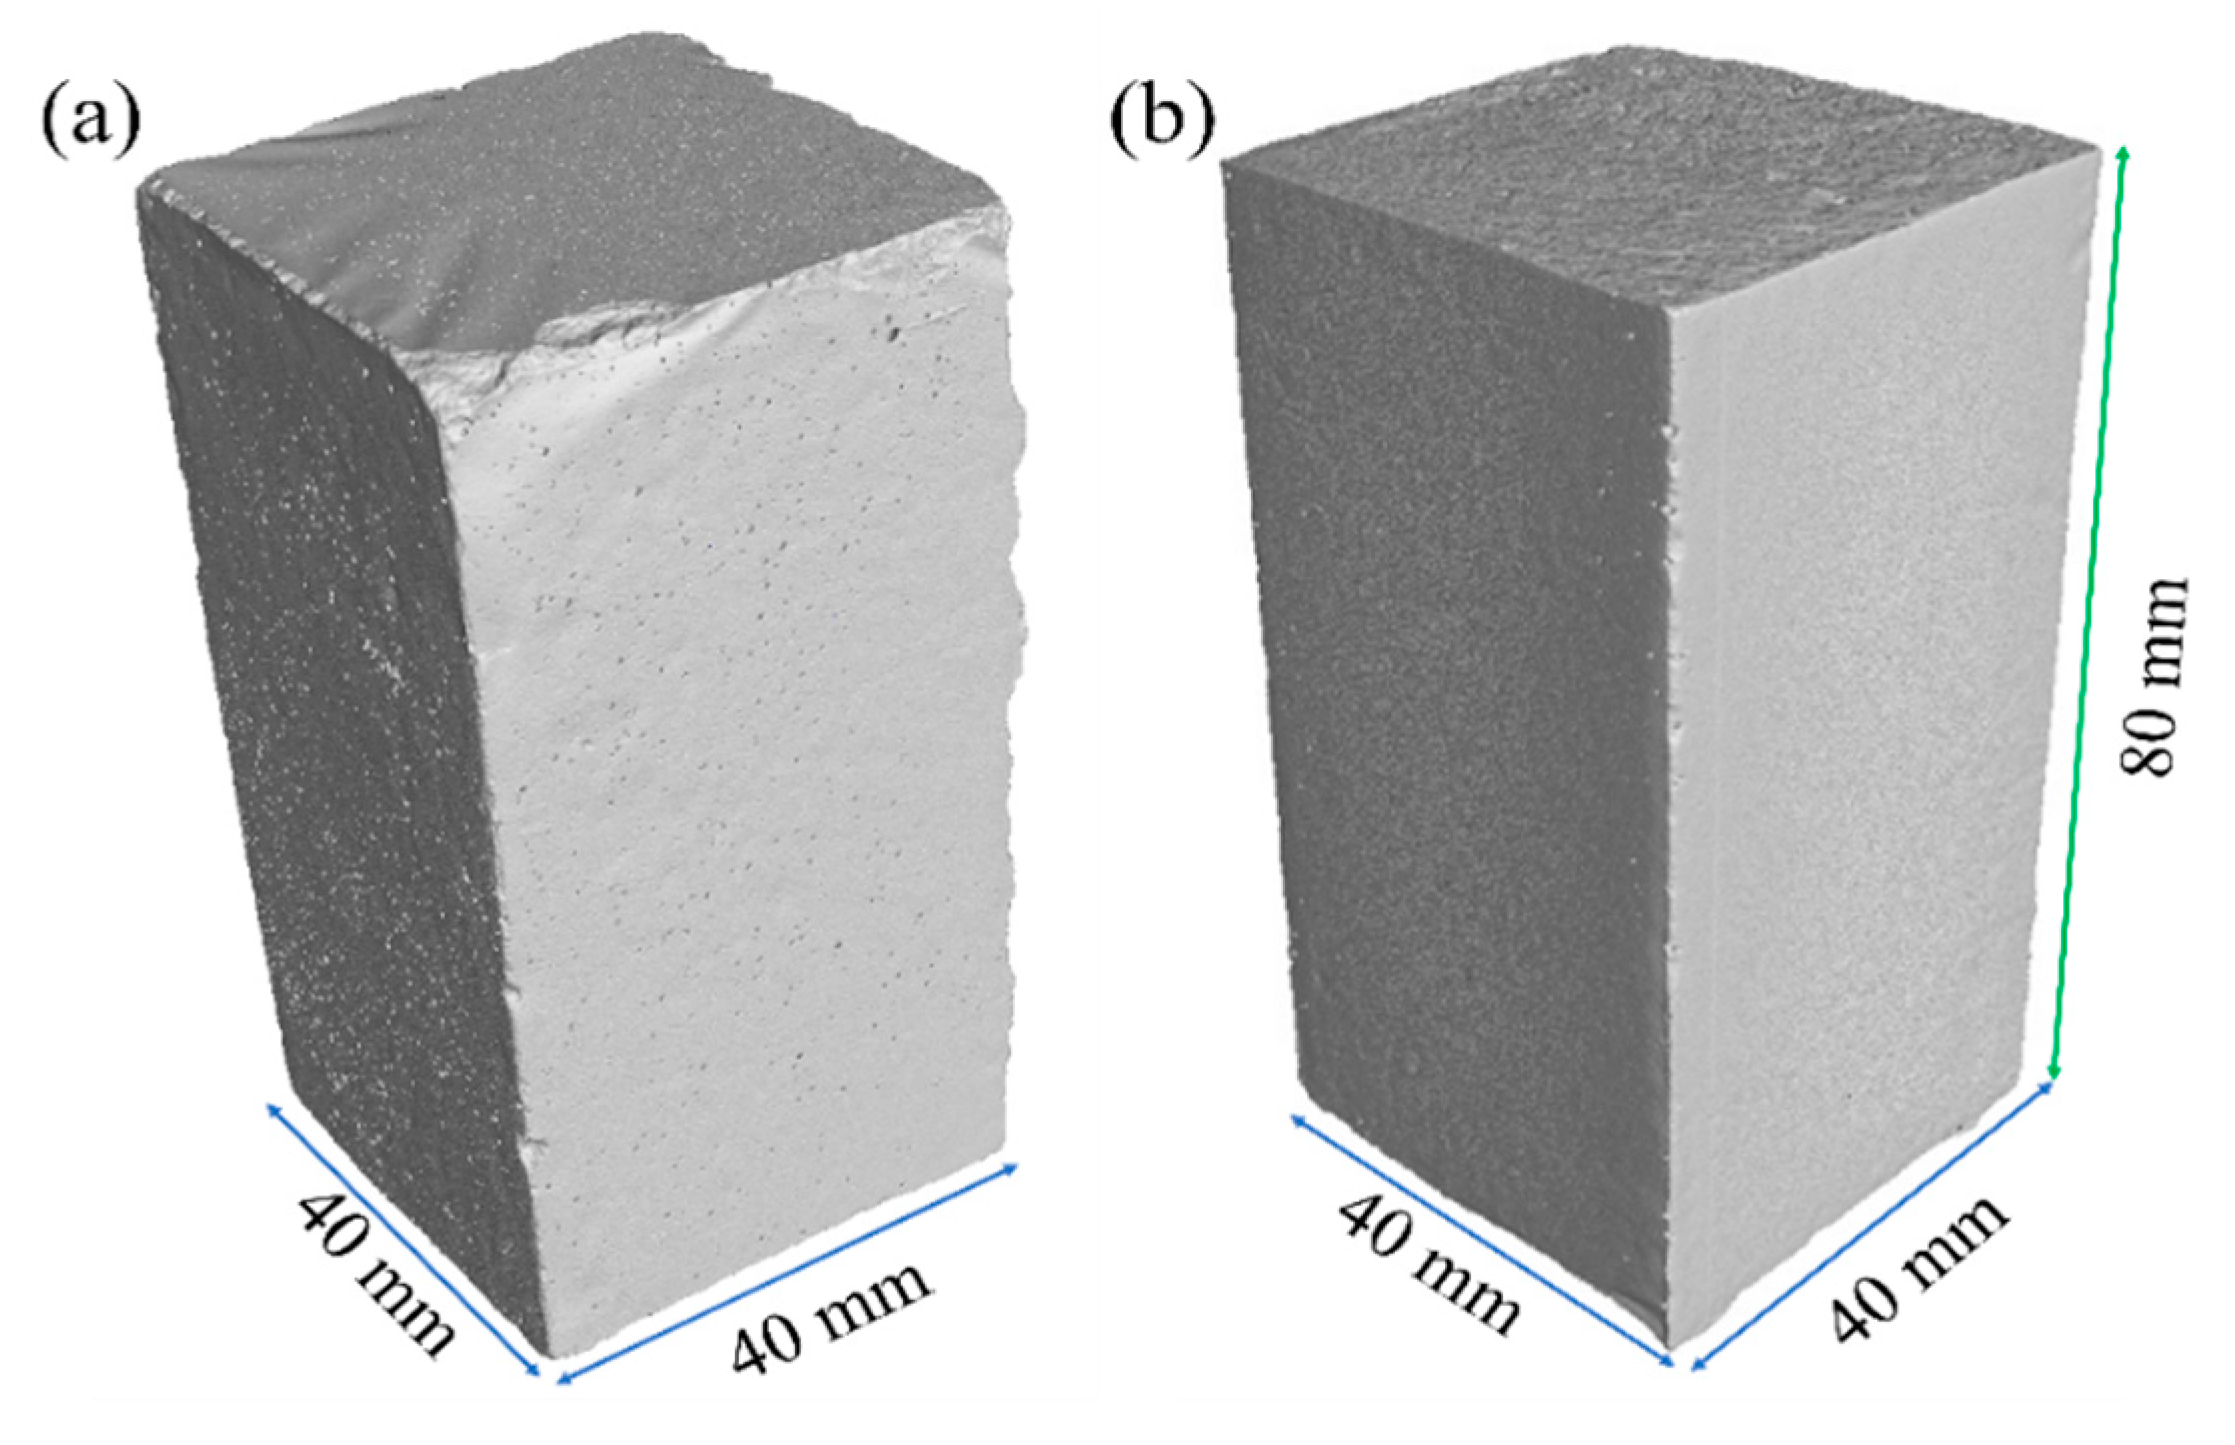
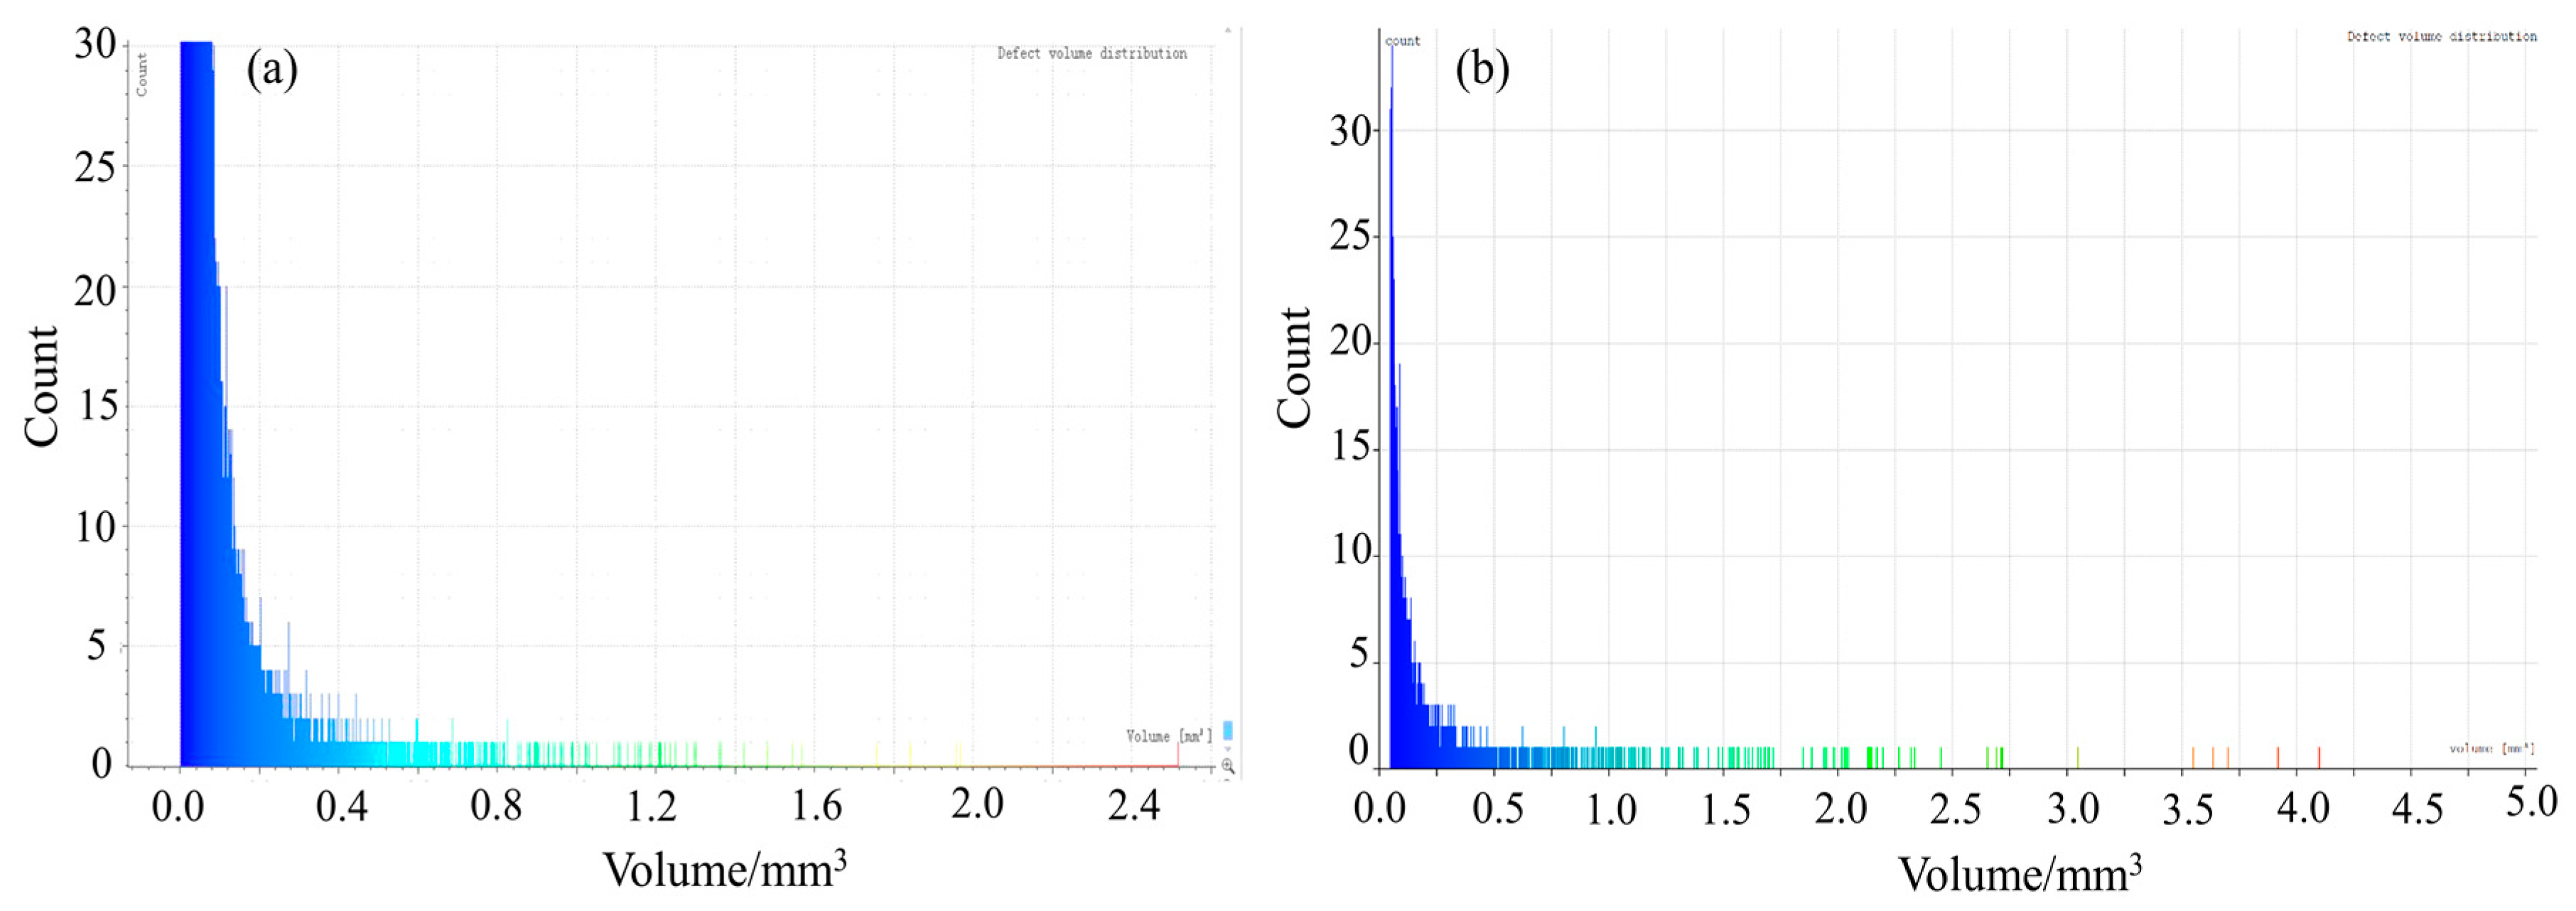
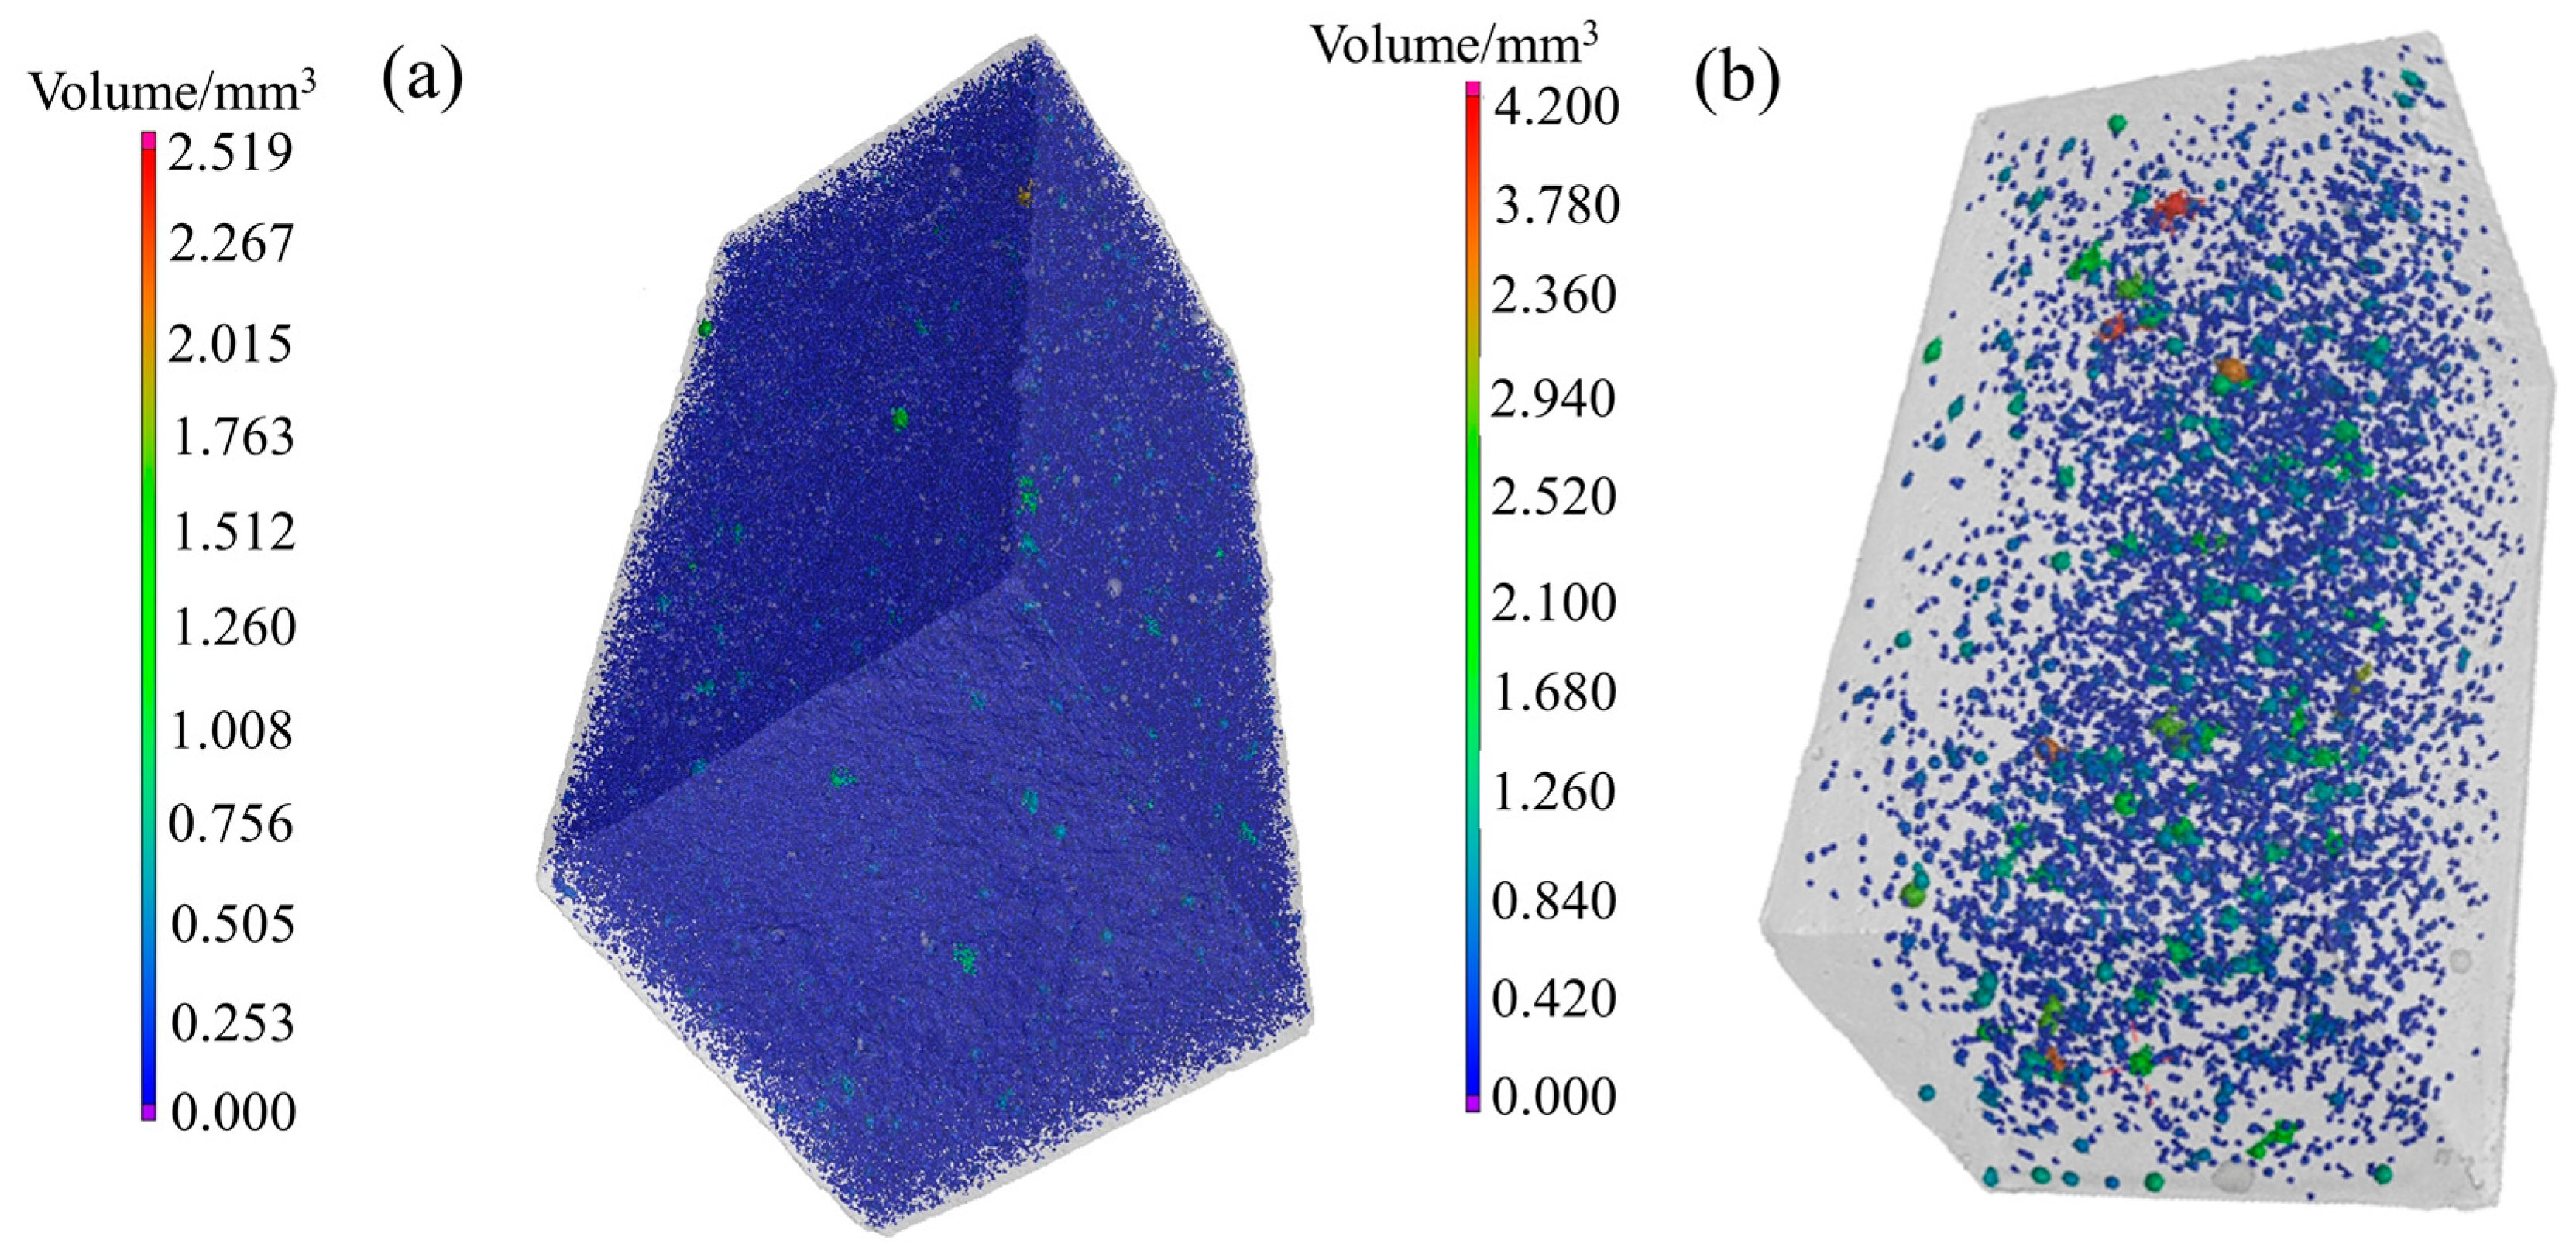
4.2. CT Scanning Analysis of Hardened Gypsum

The mechanical property of HH is mainly determined by the structure of the hardened gypsum. Although SEM can be used to observe the local microstructure and morphology of the hardened gypsum, it is difficult to quantitatively analyze the distribution, pore volume and defect area of the three-dimensional pore structure in the hardened body. CT scanning can in situ detect the internal structure with 3D visualization, and it cannot damage the structure of material, so as to determine the proportion, size and distribution rule of the holes in the hardened gypsum.
The scanning hardened pastes by CT are shown in Figure 12. In appearance, there are a lot of holes on the surface of the hardened body of HH prepared without crystal modifier, whereas the surface of the hardened paste of HH prepared with L-Asp is smooth and basically without holes. The scanning process of hardened gypsum of HH prepared in the absence and presence of L-Asp are shown in Videos S1 and S2, respectively.
The distribution of holes in the hardened paste is shown in Figure 13—The points of different colors represent pore volume. As can be seen from Figure 13a, the holes in the hardened body of HH prepared without a crystal modifier are very rich and evenly distributed the whole hardened paste. Meanwhile, it can be seen from the distribution diagram of the corresponding hole number with volume (Figure 14a) that the pore volume is distributed within the range of 0.001–2.6 mm3, among which most of the holes are distributed in the range of 0.001–0.12 mm3, followed by 0.12–0.21 mm3.
Figure 13b shows that the number of holes inside the hardened body of HH prepared with L-Asp is significantly reduced and mainly distributed in the center of the hardened gypsum. As can be seen from Figure 14b, the pore volume in the hardened body is distributed within the range of 0.05–4.10 mm3, among which most of holes are distributed in the range of 0.05–0.12 mm3, followed by 0.12–0.33 mm3. Compared with Figure 14a,b, the number of pores in the hardened body of HH prepared with L-Asp is significantly decreased, especially the small pores (0.001–0.12 mm3). The theoretical water consumption of HH hydration into DH is 18.6%. However, in order to make the slurry have enough fluidity for pouring, the normal consistency of HH (the mass ratio of water to HH powders) is significantly higher than the theoretical water consumption, which leads to the evaporation of excess water in the process of hydration and hardening, the space originally occupied by water particles leaves a large number of holes inside the hardened paste. Our previous study found that the normal consistency shows a significant linear correlation with the aspect ratio of HH, namely the short column HH shows higher fluidity and lower normal consistency than that of needle-like HH, and the short column HH can be obtained with the addition of L-Asp, which can suppress the crystal growth of HH along the c-axis. Furthermore, with increasing L-Asp concentration from 0.00 to 2.50 mM, the aspect ratio and normal consistency of HH are decreased from 5.74:1 to 1.21:1 and from (41.5 ± 0.7)% to (31.2 ± 0.3)%, respectively [16]. Therefore, in the preparation of HH, the addition of crystal modifier can reduce the aspect ratio and normal consistency of HH, and then decrease the pore defects in the hardened gypsum.
The specific surface area and porosity of defects of the hardened gypsum are shown in Table 3. Compared with the blank experiment, the defect specific surface area of the hardened gypsum of HH prepared with L-Asp is decreased from 17.28 cm2/g to 0.99 cm2/g, and the porosity (volume ratio) is decreased from 6.07% to 0.80%, respectively. Therefore, the defect area and porosity of hardened body of HH prepared with L-Asp decreases rapidly, achieving a more compact microstructure, so that the compressive strength increases from 9.7 MPa to 28.8 MPa.

5. Conclusions

The thermodynamic analysis shows that during the hydration process of HH, it will pass through the unstable region and the stable region of DH in turn, meanwhile the hydration of HH to DH follows the dissolution–crystallization principle, and the hydration process goes through three stages successively: dissolution, dissolution–crystallization, and equilibrium. Compared with HH prepared without crystal modifier, the hydration process of HH prepared with L-Asp is prolonged obviously because of low relative supersaturation, and the morphology of DH converts from long columnar to diamond shape crystals with an aspect ratio of 1:1. Furthermore, the defect specific surface and porosity of hardened gypsum are obviously decreased, achieving a more compact and hardened paste with higher compressive strength.

Supplementary Materials

The following are available online at https://www.mdpi.com/2075-163X/9/12/733/s1, Video S1: CT scanning of hardened gypsum of HH prepared in the absence of L-Asp, Video S2: CT scanning of hardened gypsum of HH prepared in the presence of L-Asp.

Author Contributions

X.L. performed the experiments and wrote the manuscript, Q.Z. conceived and designed the experiments.

Funding

This research was funded by the National Natural Science Foundation of China, grant number U1812402.

Conflicts of Interest

The authors declare no conflict of interest.

References

  1. Hammas, I.; Horchani-Naifer, K.; Férid, M. Solubility study and valorization of phosphogypsum salt solution. Int. J. Miner. Process. 2013, 123, 87–93. [Google Scholar] [CrossRef]
  2. Romero-Hermida, I.; Morales-Flórez, V.; Santos, A.; Villena, A.; Esquivias, L. Technological proposals for recycling industrial wastes for environmental applications. Minerals 2014, 4, 746–757. [Google Scholar] [CrossRef]
  3. Cuadri, A.A.; Navarro, F.J.; García-Morales, M.; Bolívar, J.P. Valorization of phosphogypsum waste as asphaltic bitumen modifier. J. Hazard. Mater. 2014, 279, 11–16. [Google Scholar] [CrossRef] [PubMed]
  4. Zhou, J.; Gao, H.; Shu, Z.; Wang, Y.; Yan, C. Utilization of waste phosphogypsum to prepare non-fired bricks by a novel Hydration–Recrystallization process. Constr. Build. Mater. 2012, 34, 114–119. [Google Scholar] [CrossRef]
  5. Tian, T.; Yan, Y.; Hu, Z.H.; Xu, Y.Y.; Chen, Y.P.; Shi, J. Utilization of original phosphogypsum for the preparation of foam concrete. Constr. Build. Mater. 2016, 115, 143–152. [Google Scholar] [CrossRef]
  6. Guan, Q.J.; Sun, W.; Hu, Y.H.; Yin, Z.G.; Zhang, C.H.; Guan, C.P.; Zhu, X.N.; Ahmed Khoso, S. Simultaneous control of particle size and morphology of α-CaSO4·½H2O with organic additives. J. Am. Ceram. Soc. 2019, 102, 2441–2449. [Google Scholar]
  7. Shen, Z.X.; Guan, B.H.; Fu, H.L.; Yang, L.C. Effect of potassium sodium tartrate and sodium citrate on the preparation of α-calcium sulfate hemihydrate from flue gas desulfurization gypsum in a concentrated electrolyte solution. J. Am. Ceram. Soc. 2009, 92, 2894–2899. [Google Scholar] [CrossRef]
  8. Duan, Z.Y.; Li, J.X.; Li, T.G.; Zheng, S.R.; Han, W.M.; Geng, Q.Y.; Guo, H.B. Influence of crystal modifier on the preparation of α-hemihydrate gypsum from phosphogypsum. Constr. Build. Mater. 2017, 133, 323–329. [Google Scholar] [CrossRef]
  9. Li, F.; Liu, J.L.; Yang, G.Y.; Pan, Z.Y.; Ni, X.; Xu, H.; Huang, Q. Effect of pH and succinic acid on the morphology of α-calcium sulfate hemihydrate synthesized by a salt solution method. J. Cryst. Growth 2013, 374, 31–36. [Google Scholar] [CrossRef]
  10. Guan, Q.J.; Tang, H.H.; Sun, W.; Hu, Y.H.; Yin, Z.G. Insight into influence of glycerol on preparing α-CaSO4·1/2H2O from flue gas desulfurization gypsum in glycerol–water solutions with succinic acid and NaCl. Ind. Eng. Chem. Res. 2017, 56, 9831–9838. [Google Scholar] [CrossRef]
  11. Guan, Q.J.; Sun, W.; Hu, Y.H.; Yin, Z.G.; Guan, C.P. Synthesis of α-CaSO4·0.5H2O from flue gas desulfurization gypsum regulated by C4H4O4Na2·6H2O and NaCl in glycerol-water solution. RSC Adv. 2017, 7, 27807–27815. [Google Scholar] [CrossRef]
  12. Mi, Y.; Chen, D.Y.; Wang, S.Z. Utilization of phosphogypsum for the preparation of α-calcium sulfate hemihydrate in chloride-free solution under atmospheric pressure. J. Chem. Technol. Biotechnol. 2018, 93, 2371–2379. [Google Scholar] [CrossRef]
  13. Shao, D.D.; Zhao, B.; Zhang, H.Q.; Wang, Z.G.; Shi, C.J.; Cao, J.L. Preparation of large-grained α-high strength gypsum with FGD gypsum. Cryst. Res. Technol. 2017, 52, 1700078. [Google Scholar] [CrossRef]
  14. Li, X.B.; Zhang, Q.; Ke, B.L.; Wang, X.C.; Li, L.J.; Li, X.H.; Mao, S. Insight into the effect of maleic acid on the preparation of α-hemihydrate gypsum from phosphogypsum in Na2SO4 solution. J. Cryst. Growth 2018, 493, 34–40. [Google Scholar] [CrossRef]
  15. Tan, H.; Dong, F. Morphological regulation of calcium sulfate hemihydrate from phosphogypsum. Mater. Werkst. 2017, 48, 1191–1196. [Google Scholar] [CrossRef]
  16. Li, X.B.; Zhang, Q.; Shen, Z.H.; Li, L.J.; Li, X.H.; Mao, S. L-aspartic acid: A crystal modifier for preparation of hemihydrate from phosphogypsum in CaCl2 solution. J. Cryst. Growth 2019, 511, 48–55. [Google Scholar] [CrossRef]
  17. Mao, J.W.; Jiang, G.M.; Chen, Q.S.; Guan, B.H. Influences of citric acid on the metastability of α-calcium sulfate hemihydrate in CaCl2 solution. Colloids Surf. A 2014, 443, 265–271. [Google Scholar] [CrossRef]
  18. Saha, A.; Lee, J.; Pancera, S.M.; Bräeu, M.F.; Kempter, A.; Tripathi, A. Bose, A. New insights into the transformation of calcium sulfate hemihydrate to gypsum using time-resolved cryogenic transmission electron microscopy. Langmuir 2012, 28, 11182–11187. [Google Scholar] [CrossRef]
  19. Yang, L.; Cao, J.X.; Li, C.Y. Enhancing the hydration reactivity of hemi-hydrate phosphogypsum through a morphology-controlled preparation technology. Chin. J. Chem. Eng. 2016, 24, 1298–1305. [Google Scholar] [CrossRef]
  20. Van Driessche, A.E.; Benning, L.G.; Rodriguez-Blanco, J.D.; Ossorio, M.; Bots, P.; Garcia-Ruiz, J.M. The role and implications of bassanite as a stable precursor phase to gypsum precipitation. Science 2012, 336, 69–72. [Google Scholar] [CrossRef]
  21. Ossorio, M.; Stawski, T.; Rodríguez-Blanco, J.; Sleutel, M.; García-Ruiz, J.; Benning, L.; Van Driessche, A. Physicochemical and additive controls on the multistep precipitation pathway of gypsum. Minerals 2017, 7, 140. [Google Scholar] [CrossRef]
  22. Liu, C.B.; Gao, J.M.; Tang, Y.B.; Zhao, Y.S. Early hydration and microstructure of gypsum plaster revealed by environment scanning electron microscope. Mater. Lett. 2019, 234, 49–52. [Google Scholar] [CrossRef]
  23. Zhao, H.; Hu, G.H.; Ye, G.B.; Ren, X.M.; Zhang, Q.C.; Jiang, T.; Zhao, H.; Hu, G.H.; Ye, G.B.; Ren, X.M. Effects of superplasticisers on hydration process, structure and properties of α -hemihydrate calcium sulfate. Adv. Cem. Res. 2017, 30, 1–8. [Google Scholar] [CrossRef]
  24. Eve, S.; Gomina, M.; Jernot, J.P.; Ozouf, J.C.; Orange, G. Microstructure characterization of polyamide fibre/latex-filled plaster composites. J. Eur. Ceram. Soc. 2007, 27, 3517–3525. [Google Scholar] [CrossRef]
  25. Gypsum Plasters–Determination of Water of Crystallization Content; GB/T 17669.2-1999; The State Bureau of Quality Technical Supervision: Beijing, China, 1999.
  26. Water Quality–Determination of Calcium–EDTA Titrimetric Method; The State Department of Environmental Conservation: Beijing, China, 1987; GB 7476-87.
  27. Water Quality–Determination of Sulfate–Gravimetric Method; The State Department of Environmental Conservation: Beijing, China, 1989; GB 11899-89.
  28. Yue, W.H.; Zhao, Q.N. Study of the thermodynamics during the process of hydration and hardening of the anhydrite. J. Wuhan Univ. Technol. 1988, 3, 283–289. [Google Scholar]
  29. Bellotto, M.; Artioli, G.; Dalconi, M.C.; Corso, R. On the preparation of concentrated gypsum slurry to reuse sulfate-process TiO2 byproduct stream. J. Clean. Prod. 2018, 195, 1468–1475. [Google Scholar] [CrossRef]
  30. Wang, Y.; Gao, L.M. Effect of amino acid retarders on the hydration of flue gas desulfurization gypsum. New Build. Mater. 2017, 44, 21–23. [Google Scholar]
  31. Harouaka, K.; Kubicki, J.D.; Fantle, M.S. Effect of amino acids on the precipitation kinetics and Ca isotopic composition of gypsum. Geochim. Cosmochim. Acta 2017, 218, 343–364. [Google Scholar] [CrossRef]
  32. Ding, Y.; Fang, Y.C.; Fang, H.; Zhang, Q.C.; Zhang, F.J.; Oh, W. Study on the retarding mechanism and strength loss of gypsum from hydrolyzed wheat protein retarder. J. Korean Ceram. Soc. 2015, 52, 28–32. [Google Scholar] [CrossRef]
  33. Singh, N.B.; Vellmer, C.; Middendorf, B. Effect of carboxylic acids on the morphology, physical characteristics and hydration of α-hemihydrate plaster. Indian J. Eng. Mater. Sci. 2005, 12, 337–344. [Google Scholar]
  34. Badens, E.; Veesler, S.; Boistelle, R. Crystallization of gypsum from hemihydrate in presence of additives. J. Cryst. Growth 1999, 198, 704–709. [Google Scholar] [CrossRef]
Figure 1. Schematic diagram of industrial computed tomography.
Minerals 09 00733 g001
Figure 2. The stable region relationship between HH and DH in aqueous solution: I: stable region of HH; II: unstable region of HH; III: stable region of DH; IV: unstable region of DH.
Minerals 09 00733 g002
Figure 3. Changes of Ca2+ concentration (a) SO42− concentration (b) and crystal water content of product (c) in the hydration process of HH.
Minerals 09 00733 g003
Figure 4. Morphology of the hydration products at different time (a) 0.5 h; (b) 4 h; (c) 24 h.
Minerals 09 00733 g004
Figure 5. X-ray diffraction patterns of the hydration products at different time (a) 0.5 h; (b) 4 h; (c) 8 h; (d) 16 h; (e) 24 h.
Minerals 09 00733 g005
Figure 6. Schematic illustration of HH hydration into DH.
Minerals 09 00733 g006
Figure 7. Particle size distribution of products in hydration process.
Minerals 09 00733 g007
Figure 8. Changes of Ca2+ concentration (a), SO42− concentration (b) and crystal water content of product (c) in the hydration process of HH prepared in the presence of L-Asp.
Minerals 09 00733 g008
Figure 9. Morphology of hydration products at different hydration time (a) 8 h; (b) 24h; (c) 48 h.
Minerals 09 00733 g009
Figure 10. Particle size distribution of products in hydration process of HH prepared with L-Asp.
Minerals 09 00733 g010
Figure 11. Hydration process diagram of HH.
Minerals 09 00733 g011
Figure 12. Scanning images of hardened paste of HH prepared in the absence (a) and presence (b) of L-Asp.
Minerals 09 00733 g012
Figure 13. Distribution of holes in hardened paste of HH prepared in the absence (a) and presence (b) of L-Asp.
Minerals 09 00733 g013
Figure 14. Distribution of pore volume in hardened gypsum of HH prepared in the absence (a) and presence (b) of L-Asp.
Minerals 09 00733 g014
Table 1. Change of zeta potential of products in hydration process.
Hydration Time/h0.080.526101624
zeta potential/mV−1.49−1.51−1.64−1.54−1.40−0.92−1.22
Table 2. Maximum relative supersaturation during hydration of HH.
Crystal ModifierCSO42−,max/(mg/L)CSO42−,equ/(mg/L)CDH,max/(mg/L)CDH,equ/(mg/L)Smax
None3184.141708.965707.503063.280.86
L-Asp3128.162342.005604.624196.080.34
Table 3. Data of pores in the hardened paste.
Crystal ModifierDefect Area/mm2Specific Surface Area of Defect /(cm2/g)Pores Volume /mm3Porosity/%Compressive Strength/MPa
None291,235.4717.287141.956.079.7
L-Asp20,861.440.991023.810.8028.8

