Article

Determination of Size Distribution of Precipitation Aggregates Using Non-Invasive Microscopy and Semiautomated Image Processing and Analysis

by
Michelle Quilaqueo
1,
Minghai Gim-Krumm
1,2,
René Ruby-Figueroa
3,
Elizabeth Troncoso
2,3,* and
Humberto Estay
1,*
1
Advanced Mining Technology Center (AMTC), University of Chile, Av. Tupper 2007 (AMTC Building), Santiago 8370451, Chile
2
Department of Chemistry, Universidad Tecnológica Metropolitana, Las Palmeras 3360, Ñuñoa, Santiago 7800003, Chile
3
Programa Institucional de Fomento a la Investigación, Desarrollo e Innovación, Universidad Tecnológica Metropolitana, Ignacio Valdivieso 2409, San Joaquín, Santiago 8940577, Chile
*
Authors to whom correspondence should be addressed.
Minerals 2019, 9(12), 724; https://doi.org/10.3390/min9120724
Submission received: 9 October 2019 / Revised: 12 November 2019 / Accepted: 19 November 2019 / Published: 22 November 2019
(This article belongs to the Section Mineral Processing and Extractive Metallurgy)

Abstract

:
Particle size distribution (PSD) determination is a typical practice for the characterization of the slurries generated in a precipitation plant. Furthermore, the precipitates generated in these processes form colloidal or aggregated suspensions. Nevertheless, the conventional methods used to estimate PSD (e.g., laser diffraction and/or a cyclosizer) have not been designed to measure particles that tend to aggregate or disaggregate, since they include external forces (e.g., centrifugal, agitation, pumping and sonication). These forces affect the true size of the aggregates formed in a unit operation, thereby losing representativeness in terms of aggregates particle size. This study presents an alternative method of measuring the size distribution of particles with aggregation behavior, particularly, by using non-invasive microscopy and image processing and analysis. The samples used were obtained from an experimental precipitation process by applying sulfidization to treat the cyanide-copper complexes contained in a cyanidation solution. This method has been validated with statistical tools and compared with a conventional analysis based on laser diffraction (Mastersizer). The PSD results obtained with optical microscopy show a bi-modal behavior of the precipitates. However this behavior could be not determined when using the laser diffraction technique. The PSD obtained for the sample tested by microscopy had a mean of 119.7 μm, a median of 147 μm and a 90% distribution reached a particle size of 312.5 μm. These values differ with those obtained by the laser diffraction technique. Our results show significant differences between the methods analyzed, demonstrating that the image processing and analysis obtained by optical microscopy is an excellent and non-invasive alternative to obtain size distributions of aggregates in precipitation processes.

Graphical Abstract

1. Introduction

1.1. Background

The precipitation process is one of the technological options available for treating solutions in hydrometallurgical plants, with the purpose of recovering or removing metals, among others compounds [1]. Typical applications are found in gold cementation, using zinc powder [2]; copper cementation, using scrap iron [1]; acid mine drainage (AMD) treatment, using milk of lime [3]; copper sulfide precipitation from acid mine drainage, using hydrogen sulfide [4] and copper sulfide precipitation from cyanide solutions in gold mining [5]. These processes must accommodate a subsequent solid–liquid separation stage (i.e., thickeners and/or filters) to remove the solids generated from the solution. The characteristics of these precipitates (colloidal behavior and fine particles) determine the kind of thickeners, large filter size and rigorous operational control required to prevent a high content of suspended solids in the recovered solutions [6,7,8,9]. Particularly, the copper sulfide precipitation process from acid mine drainage and cyanide solutions is very attractive, owing to its capacity to recover valuable by-products from wastewaters (in the case of AMD) and gold mining (in the case of cyanide solutions). An appropriate characterization of the precipitates size is crucial for the selection and design of an adequate separation process. In this context, there are some studies that characterize the precipitates formed in sulfidization processes for treating AMD [6,7] and cyanide solutions [9,10]. These studies determined the aggregate characteristics from metal sulfide precipitates and the dependence of pH and sulfide dosage (chemical solution characteristics) on aggregate size. Thus, settling rate results determined by operational conditions related to pH and sulfide dosage. These results indicate the relevance of the aggregate size to operational conditions when operating and designing solid–liquid separation equipment. For this reason, the experimental technique used to quantify particle size and particle size distribution could play a critical role in the interpretation of data, which may underestimate or overestimate set-points for chosen operational conditions when operating solid–liquid separation equipment. Unfortunately, the methodologies currently used to measure particle size and particle size distribution (PSD) of fine particles (0.1–100 µm), such as a Malvern Mastersizer (MMS) or cyclosizer (CS), have been designed to quantify PSD, but not to measure aggregate size distribution (ASD). This quantification is crucial to define optimal operational conditions for thickening process. The two methods above mentioned (MMS and CS) involve external forces (e.g., agitation, pumping and centrifugal in the case of CS), which can affect the physical integrity of the aggregates and consequently alter results obtained to quantify size distributions. A previous study shows the impact of CS on the mineral’s surface, due to the external forces applied to separate particles of different sizes [11]. However, the focused beam reflectance measurement (FBRM) allows determining the aggregate size distribution, although this technique is still very expensive for experimental and research purposes. Hence, it is necessary to quantify the ASD using non-invasive and less expensive techniques than FBRM.

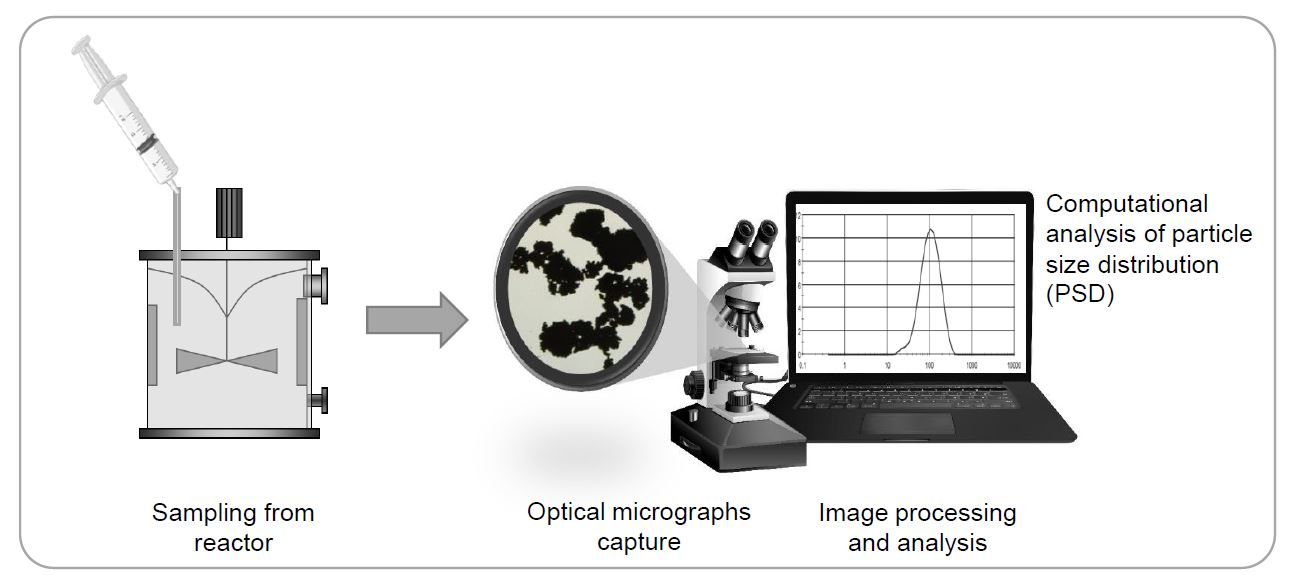
1.2. Particle Size Distribution Using Microscopy and Image Processing and Analysis

The measurement of particle or aggregate size distribution is not a simple task, because it depends on a series of factors, which affect the measurement. As mentioned above, these factors include the heterogeneity of the sample itself as well as the strategy employed to make the results representative of the sample’s characteristics. In this regard, microscopy is a technique that has not only been used as a powerful tool when morphological information is required to understand the behavior of a material (such as civil engineering materials) [12,13] or in the electronics industry [14], but also to quantify the particle size distribution successfully in various fields, such as food, pharmaceuticals, and mineral processing. For example, microscopy has been employed to quantify microstructures and correlate them with rheological properties in apple tissue [15]. In addition, microscopy has been applied to determine the bubble size distribution in aerated whey protein gels [16]. Moreover, successful applications have also been reported regarding the measurement of soil grain-size distribution, in which no significant differences were found in comparison with the traditional mechanical (sieve) analysis [12,17] or the use of reflected light microscopy (RLM) for the recognition of hematite grains in materials engineering [18]. In addition, interesting applications have been reported in batch solution crystallization processes, where images captured by microscopy enabled the estimation of the time-varying particle size distribution of particles in suspension, through crystallization experiments [19]. After using image processing and analysis, it was also possible to determine simultaneous occurrence of particulate events such as nucleation, breakage and aggregation, in order to monitor and control the properties of crystalline products [19]. In this sense, the application of confocal microscopy and multiple sensors for dynamic measurements of crystal properties, such as size, shape and polymorph, allows relevant attributes to be determined, related not only to downstream processes (filtration, washing, granulation, drying, grinding, transportation, storage and tableting), but also to end-use properties, such as bulk density, mechanical strength of a tablet, catalytic activity, stability, wettability and flowability [20]. Consequently, the application of image processing and analysis for aggregate size and shape determinations could be beneficial for the mining, comminution and materials handling industries. In particular, the efficiency of these technologies is located in their capacity to make measurements without disrupting production streams, as traditional sieving methods do. Additionally, measurements can be made in real time, so that appropriate adjustments to the comminution and screening processes can be made in real time, before large quantities of out-of-specification materials are produced [21].
Among the advantages of microscopy over other techniques, is the fact that it is less expensive than the others—in terms of capital costs—and in particular the fact that it makes the particle size and shape visible, without any intervention during the analysis. Its disadvantages, however, mainly relate to the reliability of its measurements, that is, for selecting the representative number of particles measured [15,22]. Furthermore, in some cases it is difficult to determine whether two or more particles are ‘‘touching” or if they are permanently stuck together and, therefore, must be considered to be one bigger particle [20]. In addition, some authors emphasize that the sampling preparation, acquisition and nature of images, image processing, such as linear filters, rank filters and morphological filters, play a key role [13]. All of the considerations mentioned are essential in the variability of the measurement. However, there are several statistical tools that one may use to address the disadvantages mentioned above and to validate that the microscopic measurement is representative. In this regard, analysis of the variability between the images per sample and between samples will allow it to be determined whether there are significant differences between the distribution of particles or aggregates size that were measured. Depending on the data distribution (normal distribution or not), parametric and non-parametric statistics can be used to compare the population group (data within images or between images).
The aim of this study was to apply a non-invasive method to quantify the size distribution of aggregates using optical microscopy and semiautomated image processing and analysis. This valuable information can be a useful tool for measuring, in a more realistic manner, the aggregate size distribution and the critical parameter when designing optimal operational conditions for the solid–liquid separation processes.

2. Methodology

2.1. Reagents

The reagents used in this study (NaCN, CuCN, NaHS, NaOH and H2SO4) were analytical grade chemicals obtained from Merck and Sigma Aldrich (Santiago, Chile). All solutions were made using demineralized water (<1 µS). The pH electrode (Model 913, Methrom, Herisau, Switzerland,) was calibrated using pH buffer solutions (Hanna, Santiago, Chile).

2.2. Generation of Precipitation Aggregates

The precipitation aggregates generated were sulfide copper, which was produced from synthetic cyanide solutions, simulating the typical operational conditions of the SART (Sulfidization, Acidification, Recycling and Thickening) process. This technology has been designed to recover copper and cyanide from cyanide solutions in gold mining [5,23], according to the following general chemical reaction:
2   Cu ( CN ) 3 2 +   3   H 2 SO 4   +   S 2     Cu 2 S ( s ) +   6   HCN ( aq ) +   3   SO 4 2 .
The synthetic cyanide solution was made by mixing NaCN, CuCN and NaOH to adjust the pH value at 12, avoiding HCN volatilization. The copper and total cyanide concentration were fixed at 1800 mg/L and 2460 mg/L, respectively. The copper concentration was chosen based on the copper concentrations found in gold mining, which have high cyanide–soluble copper content in the ore [5,24,25,26]. Moreover, the cyanide concentration was defined according to the cyanide associated to copper, in order to keep a free cyanide concentration of 100 mg/L; a typical value set in gold mining operations to ensure gold dissolution [2,27]. This value was estimated from the thermodynamic equilibrium of the copper–cyanide complexes by using the software Hydra/Medusa (Version 1) from the KTH Royal Institute of Sweden [28]. The sulfidization reaction (Equation (1)) was carried out in a glass reactor of 650 mL capacity over a period of 15 min, setting the pH at 4.0 and sulfide dosage at 120% stoichiometric, using 1 M sulfuric acid and NaHS dosage, respectively. These conditions were selected with the aim of ensuring the maximum precipitate generation according to literature [5].

2.3. Size Distribution Analysis Techniques

A quantification of the PSD using optical microscopy and image analysis and processing was compared with a conventional method to measure PSD for suspensions or slurries containing small particles (laser diffraction or Mastersizer).

2.3.1. Laser Diffraction Analysis

A 600 mL sample of a suspension, which resulted from the sulfide precipitation, was analyzed by the laser diffraction technique, using a Malvern Mastersizer 2000 (MM2000, Malvern Panalytical Ltd., Malvern, UK). The aim was to measure the particle size distribution (PSD) of the suspended solids (i.e., copper sulfide precipitates). The Mastersizer equipment uses an agitated tank, which operates at 1000 rpm. The sample is recirculated by a centrifugal pump (2500 rpm), in order to keep the solids suspended and homogenized in the suspension. Additionally, the supplier of the Mastersizer 2000 (MM2000) recommends the use of an additional pre-treatment of ultrasound at 20 KHz during 1 min, when the suspended particles form aggregates [29].

2.3.2. Microscopy and Semiautomated Image Processing and Analysis

The particle size distribution (PSD) of aggregates was measured using an optical microscope (Leica DM 750, Leica Microsystems, Wetzlar, Germany) connected to a digital camera HD 5 MGPXL WI-FI (Leica ICC50W, Leica Microsystems, Wetzlar, Germany), which captured the images. The size distribution was determined using two software for image processing. The Leica Application Suite V4 12 (Leica Microsystems, Wetzlar, Germany) was used to measure the equivalent diameter of the aggregates up to 320 µm, whereas aggregates with an equivalent diameter larger than 320 µm were analyzed using the software Image Pro Plus 6 (Media Cybernetics, Rockville, MD, USA). After these analyses, the complete PSD was estimated by mixing the distribution curves obtained from both software. The use of two software was done to ensure the precision of the measurements in a wide range of diameter sizes.
Taking into account that copper sulfide precipitates tend to form aggregates rapidly [10,30], the suspension sampling and the image-capture must be carried out in a short time span. Hence, when the sulfidization reaction was completed (after 15 min), the suspension sampling and image-capture were performed in a maximum time period of two minutes. Sample was taken using a syringe connected to a 7 mm diameter tubing to avoid the destruction of aggregates. In this time, it was possible to capture nine images (M1–M9 images), which were obtained from 70 µL of suspension collected from the reactor. This sample was placed on three zones of the microscope slide in order to be analyzed by the optical microscope. It is relevant to mention that the aggregation behavior of these precipitates limited the samples number and the total time to take the sample and image capture, in order to avoid the lost of representativeness of the sample.

2.4. Measurement of Copper Content in the Sulfide Precipitate

The copper sulfide precipitate obtained during the sulfidization reaction was characterized by a scan by an electron microscope coupled with an energy-dispersive X-ray (SEM-EDX), JEOL model IT300 LV (Thermo Fisher Scientific, Eindhoven, The Netherlands). With this analysis, the copper content in the precipitate generated was quantified.

2.5. Copper Sulfide Conversion

A sample of the suspension was taken from the sulfidization reactor during each 15-min reaction interval. This sample was filtered using a syringe filter of 0.22 µm pore size. The solution collected was neutralized at pH 12 with a 1 M NaOH solution. The dissolved copper was measured using an atomic absorption spectrometer (AAS), GBC model SensAA dual. The copper concentration measured in the sample was used to estimate the conversion of sulfide copper precipitate (copper recovery), considering the initial copper concentration in the cyanide solution. Moreover, the total suspended solids (TSS) was estimated using the following equation.
TSS   =   Initial   copper   concentration   ×   Copper   conversion Copper   content .

2.6. PSD Estimation and Statistical Analysis

For the PSD estimation, data obtained from images captured using optical microscopy (MC) comprised nine images (M1…M9) captured from the sample taken from reactor. These nine images completed 192 objects randomly chosen (particles were measured by a proper methodology according to their size, as previously described). Furthermore, the PSD measurements made using the laser diffraction technique (MM2000) were divided into two groups: (i) samples without pre-treatment (MS1) and (ii) samples pre-treated by the use of sonication (MS2). The inclusion of pre-treatment analysis is useful to demonstrate the aggregation behavior of the particles, being typically applied when using the laser diffraction technique to estimate the non-aggregated particle size [29]. Thus, 556 and 377 objects formed the population of MS1 and MS2, respectively. Then, the first step was to analyze the data distribution (test normal distribution) for the PSD obtained by optical microscopy and laser diffraction technique, for the samples with and without pre-treatment. The exploratory data analysis, which determines whether the data has a normal distribution, was used to compare PSD from samples obtained by optical microscopy and laser diffraction. This is because many statistical procedures, including correlation, regression, t test and the analysis of variance (ANOVA; parametric tests), are based on the assumption that the data follows a normal distribution. In the case of abnormally distributed data, the use of parametric statistics does not allow accurate and reliable conclusions to be drawn [31]. In this regard, the normality was evaluated by two common and robust non-parametric statistics for this purpose: modified Kolmogorov–Smirnov (K–S) and Shapiro–Wilk (S–W). After determining the data distribution, multiple comparison tests were conducted in order to determine whether there were significant differences between the data obtained by optical microscopy and those obtained by the laser diffraction technique for PSD. In the case of images obtained by microscopy (M1…M9), the comparison was carried out by the analysis of variance (ANOVA; parametric test) and Kruskal Wallis, which is the equivalent non-parametric statistic for one-way ANOVA [32]. In cases where ANOVA and Kruskal Wallis reject the null hypothesis, this means that there are significant differences between the PSD on the microscopy images it is then necessary to perform additional analysis (post-hoc test) to clarify the differences between particular pairs of experimental groups. Tukey’s HDS (honestly significant difference) procedure was used as a post-hoc test because it allows multiple comparisons of the mean to be performed, in order to evaluate whether there are significant differences between the means at 95% of confidence level. The same procedure was performed for the data comparison between microscopy and laser diffraction technique, with and without pre-treatment as well as for the validation test using non-agglomerated material as CuCN.

2.7. Validation of Method Using an Unbiased Sample

A validation procedure was performed, in order to estimate the error of the method proposed in this study with respect to the MM2000, using an unbiased sample. For this purpose, a sample of an insoluble salt in water without aggregation behavior (CuCN, the same used for synthetic solutions) was used to validate the measure of PSD by microscopy. In this sense, a suspension of 1 g/L of CuCN was prepared using demineralized water. The method of data acquisition by microscopy employed was the same as the method described in Section 2.3.2. The statistical procedure employed was the same as the procedure described in Section 2.6.

3. Results and Discussion

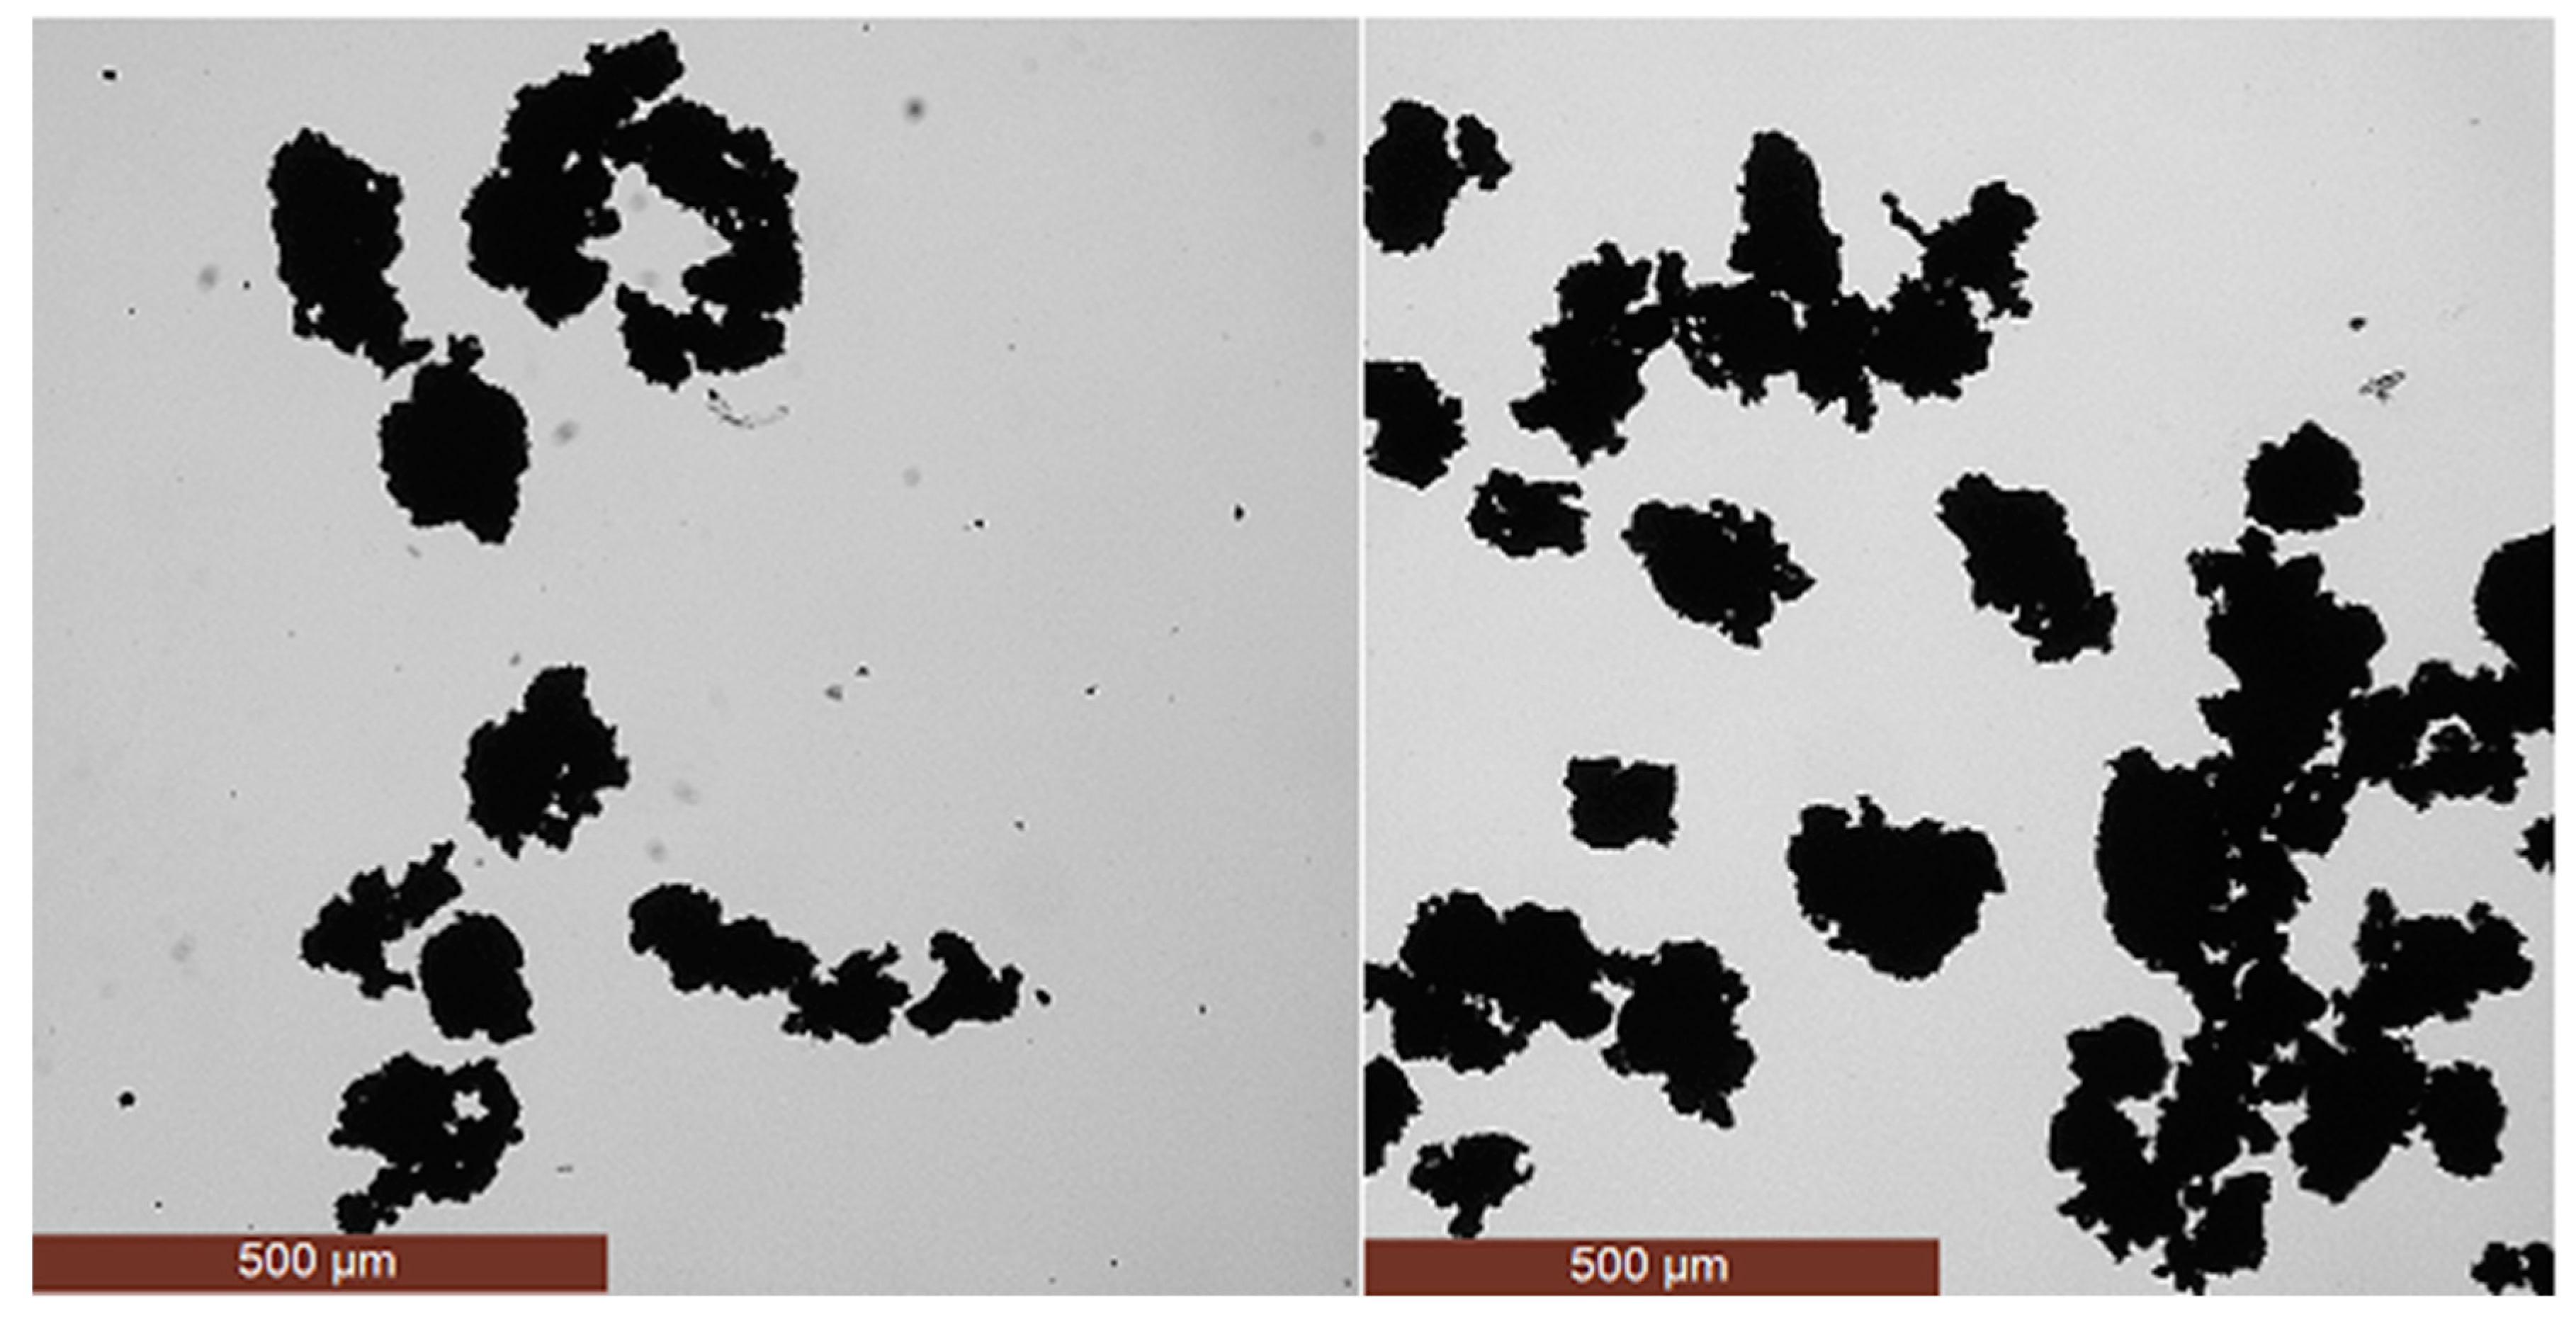
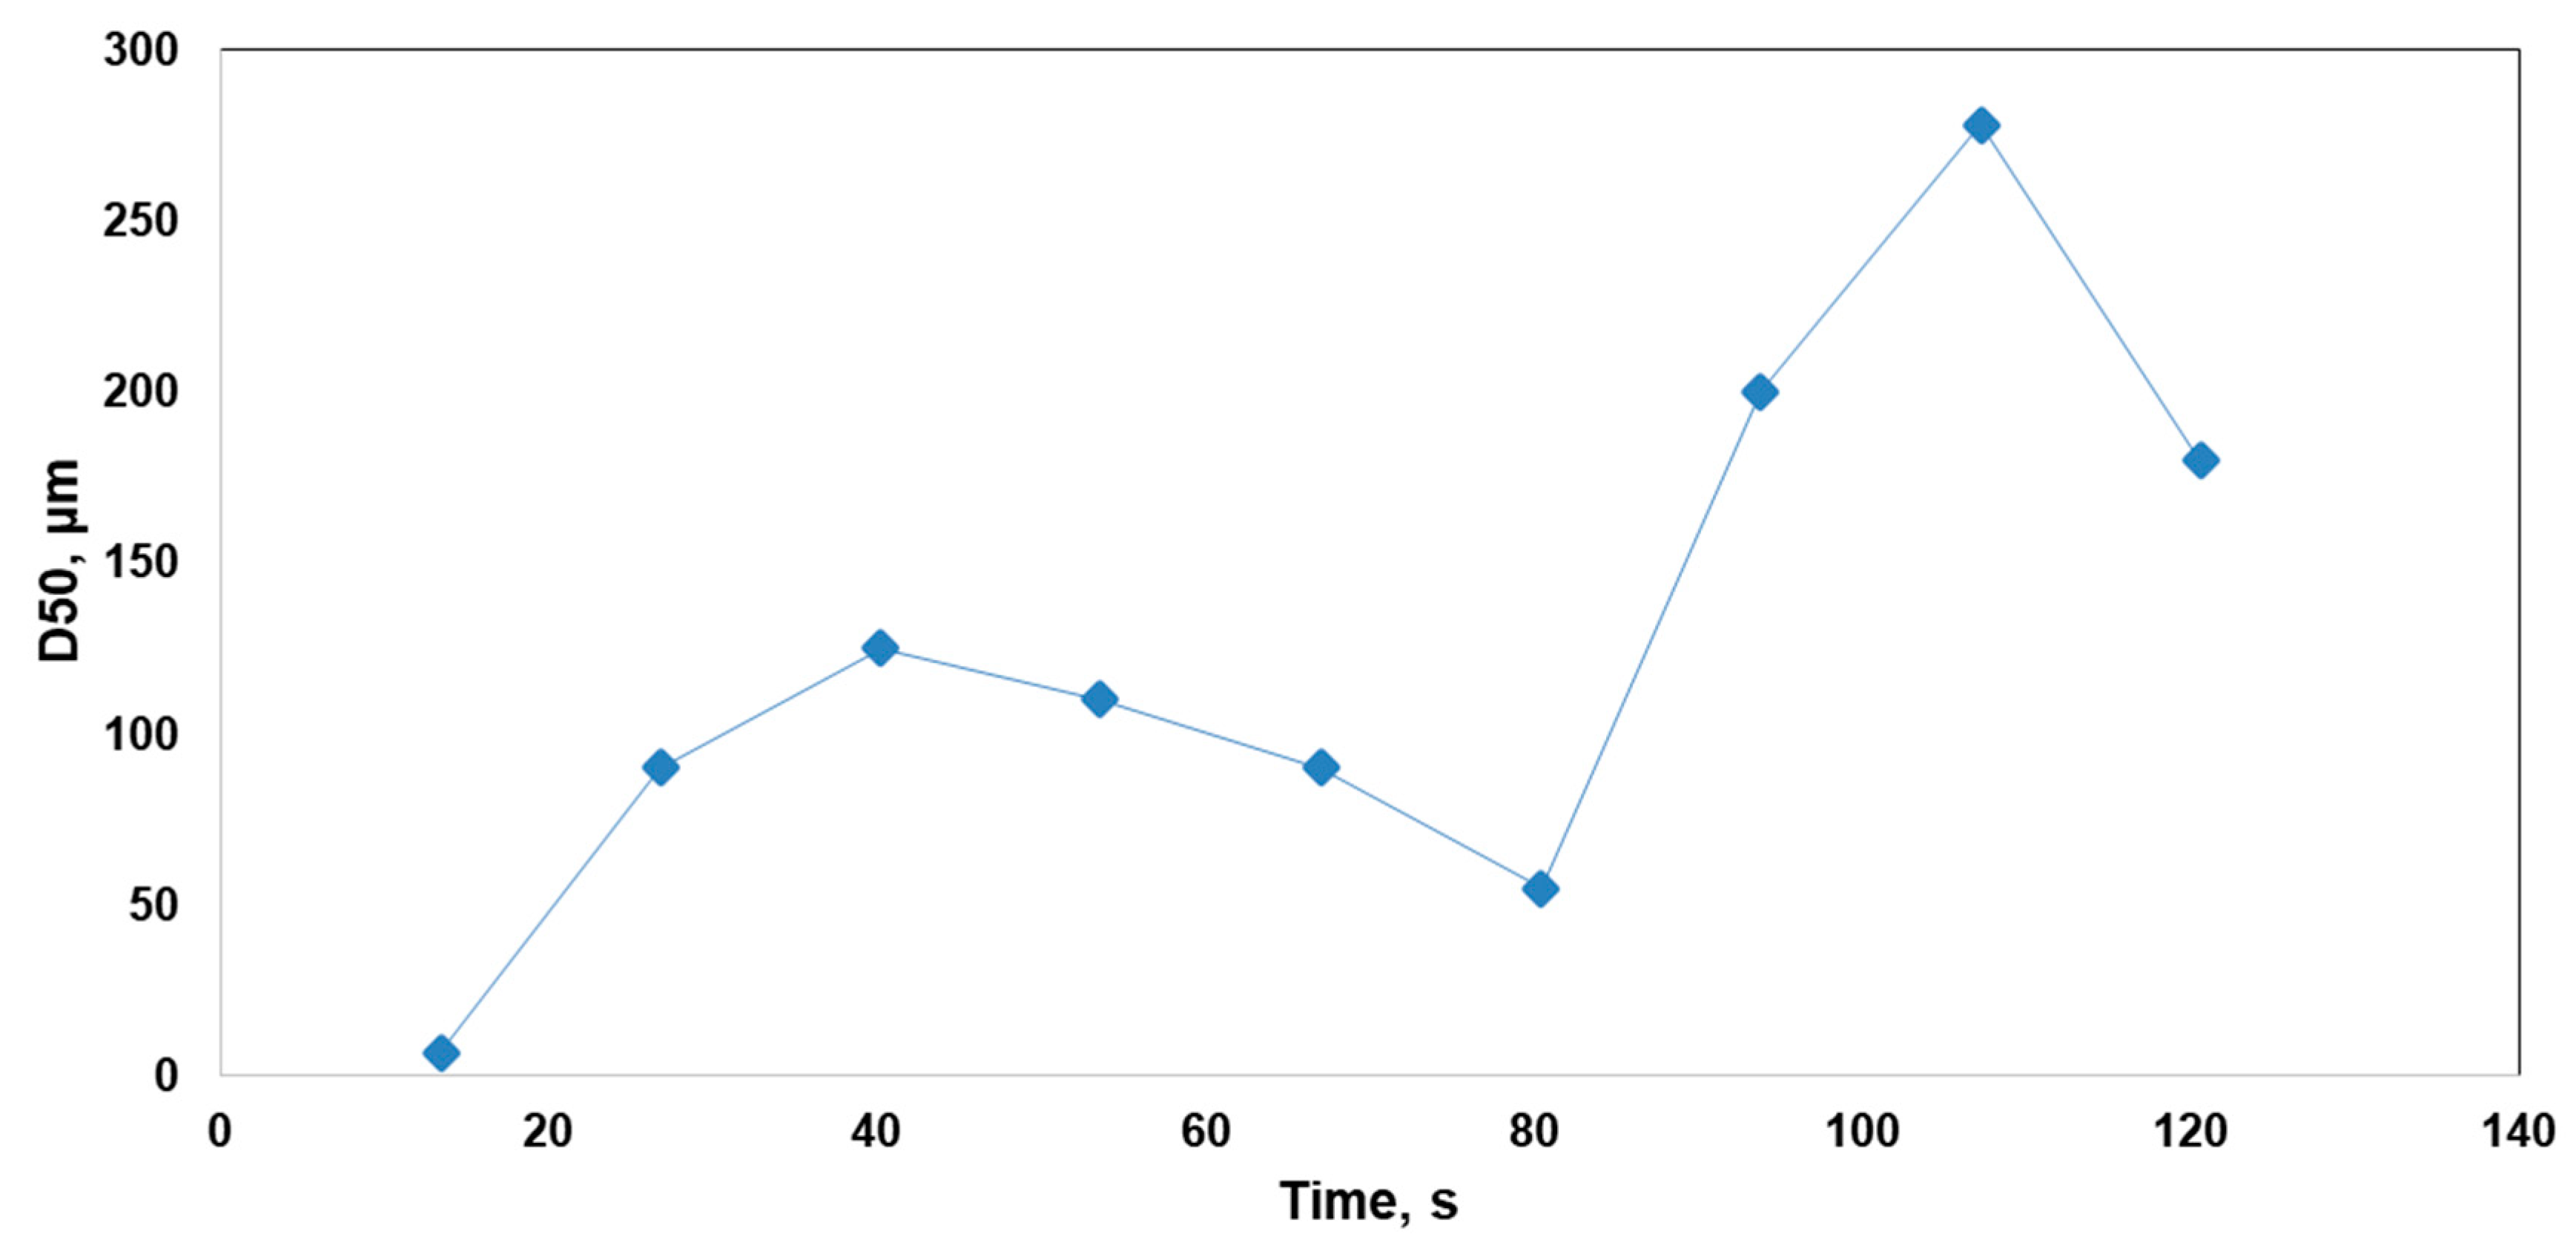
3.1. Generation of Precipitation Aggregates

The results of the reaction conversion and the copper content obtained from the sulfidization reaction are shown in Table 1. A maximum precipitate generation of 99.97% was reached for the operational conditions assessed, and it was possible to obtain a precipitate quality with 67.69% w/w of copper content, as found in other SART studies or industrial plants [5]. After determining the copper content and conversion, this data was used to estimate the TSS generated in the reaction, which reached a value of 2658 mg/L.

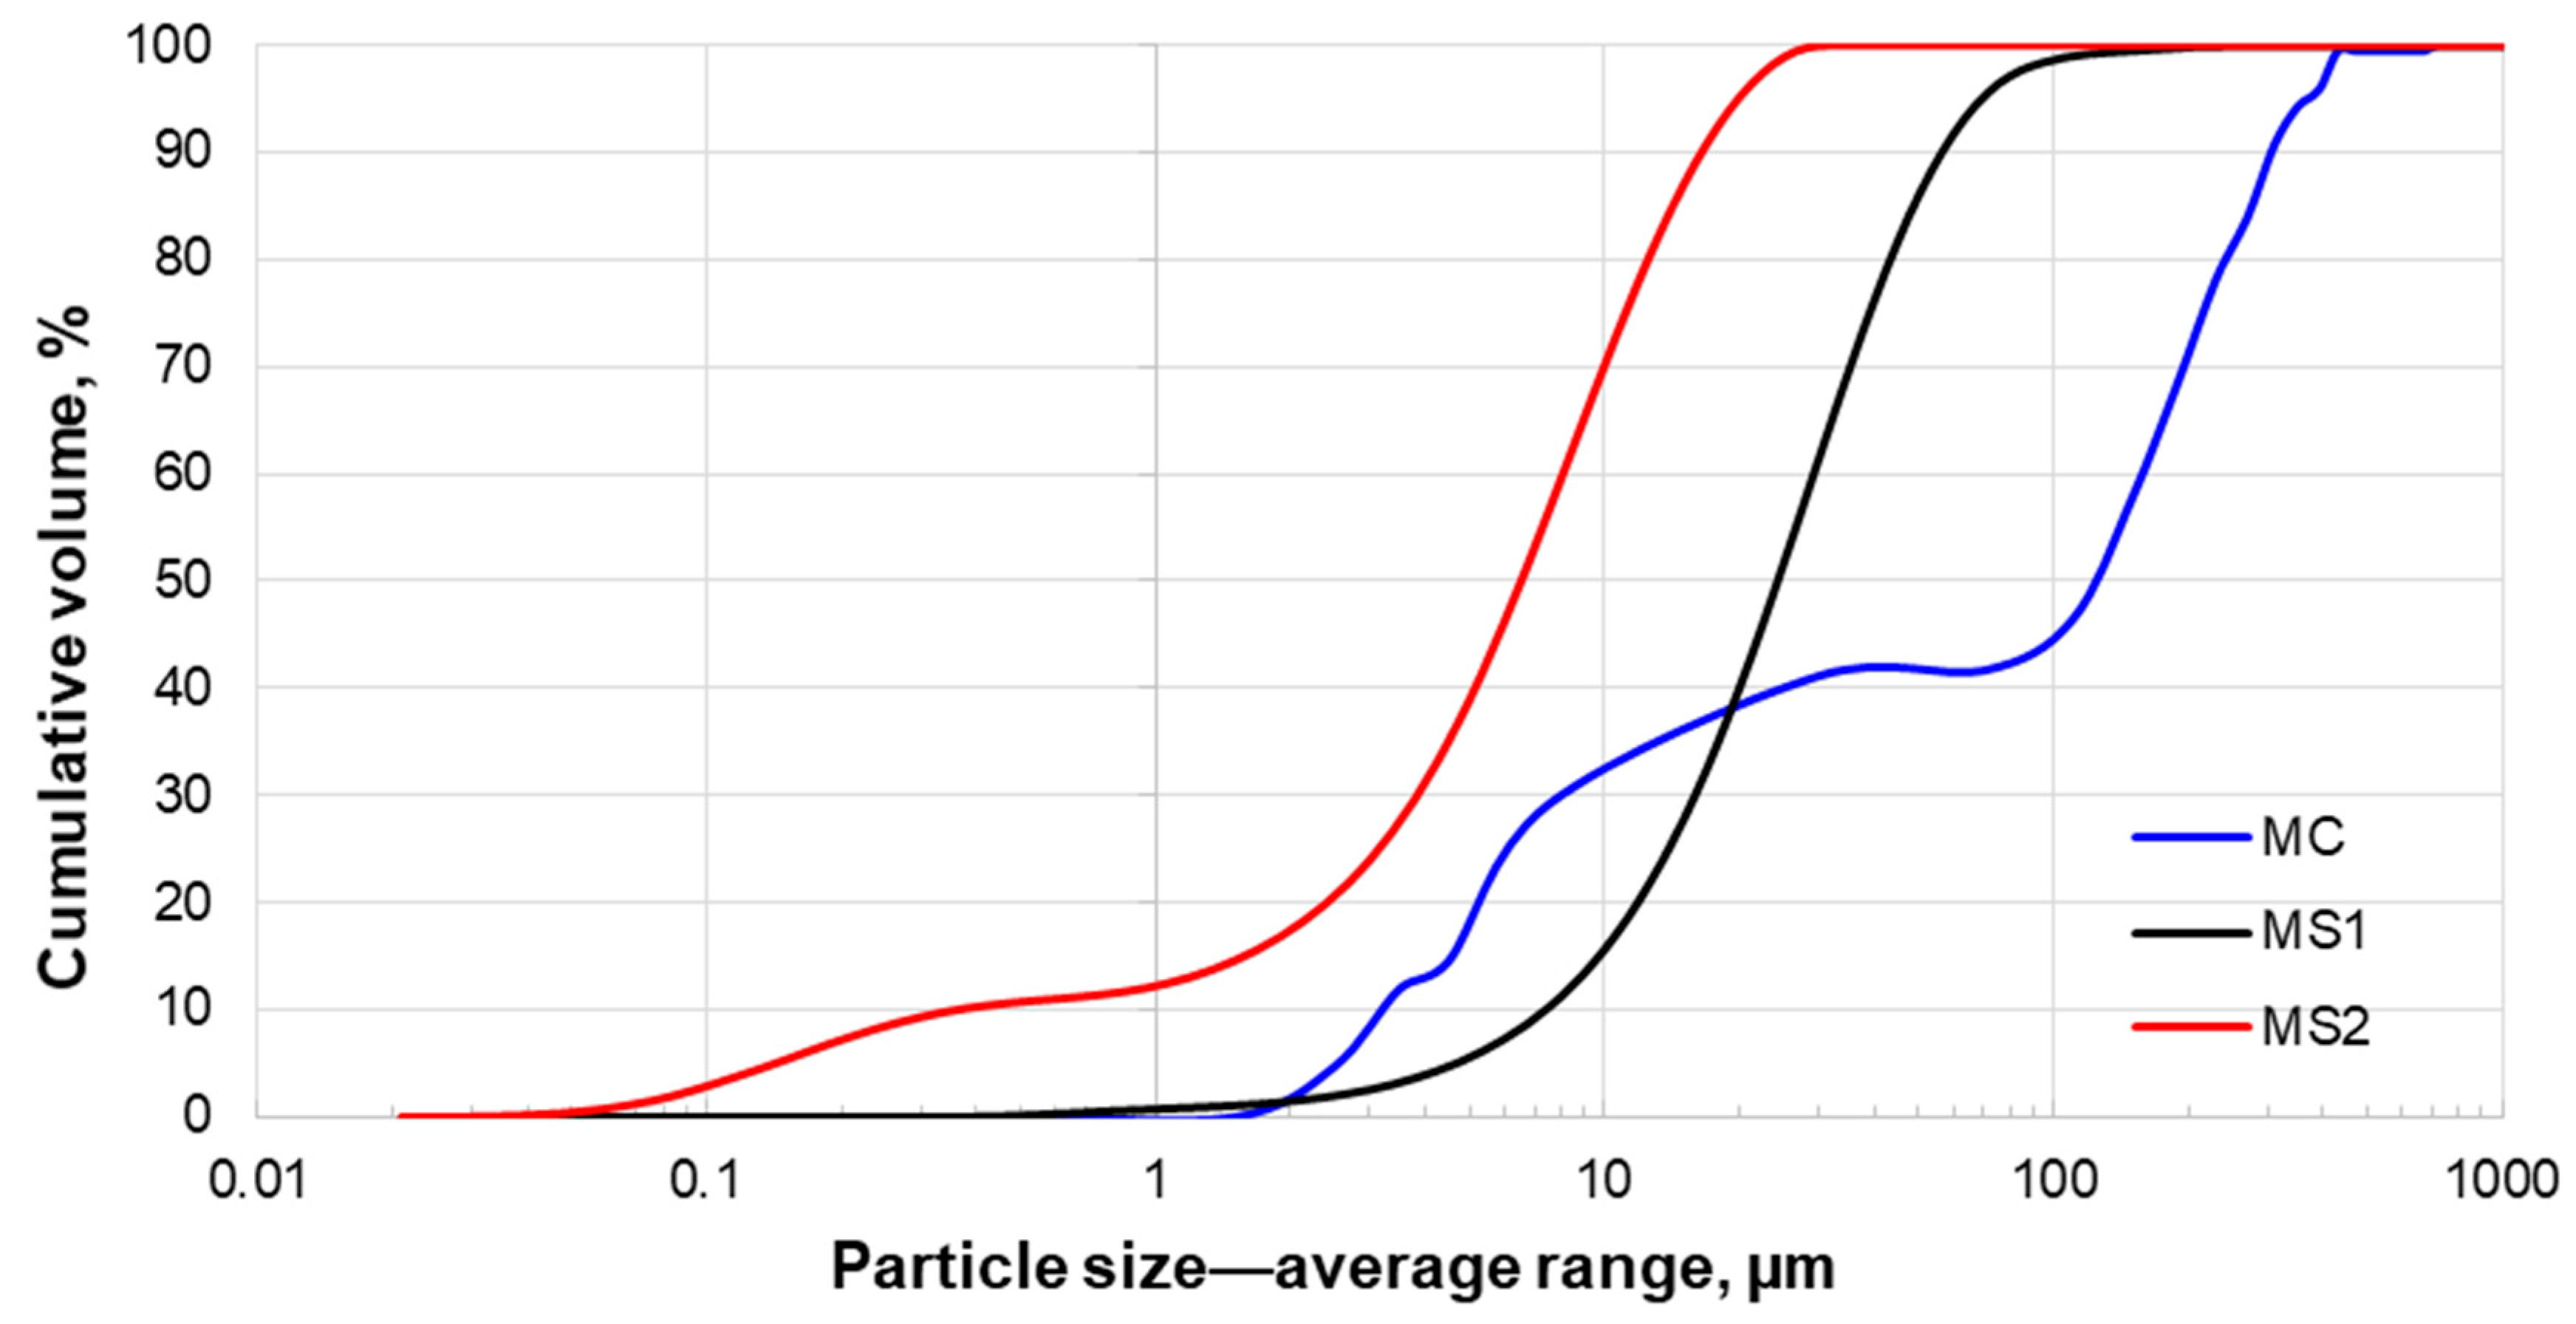
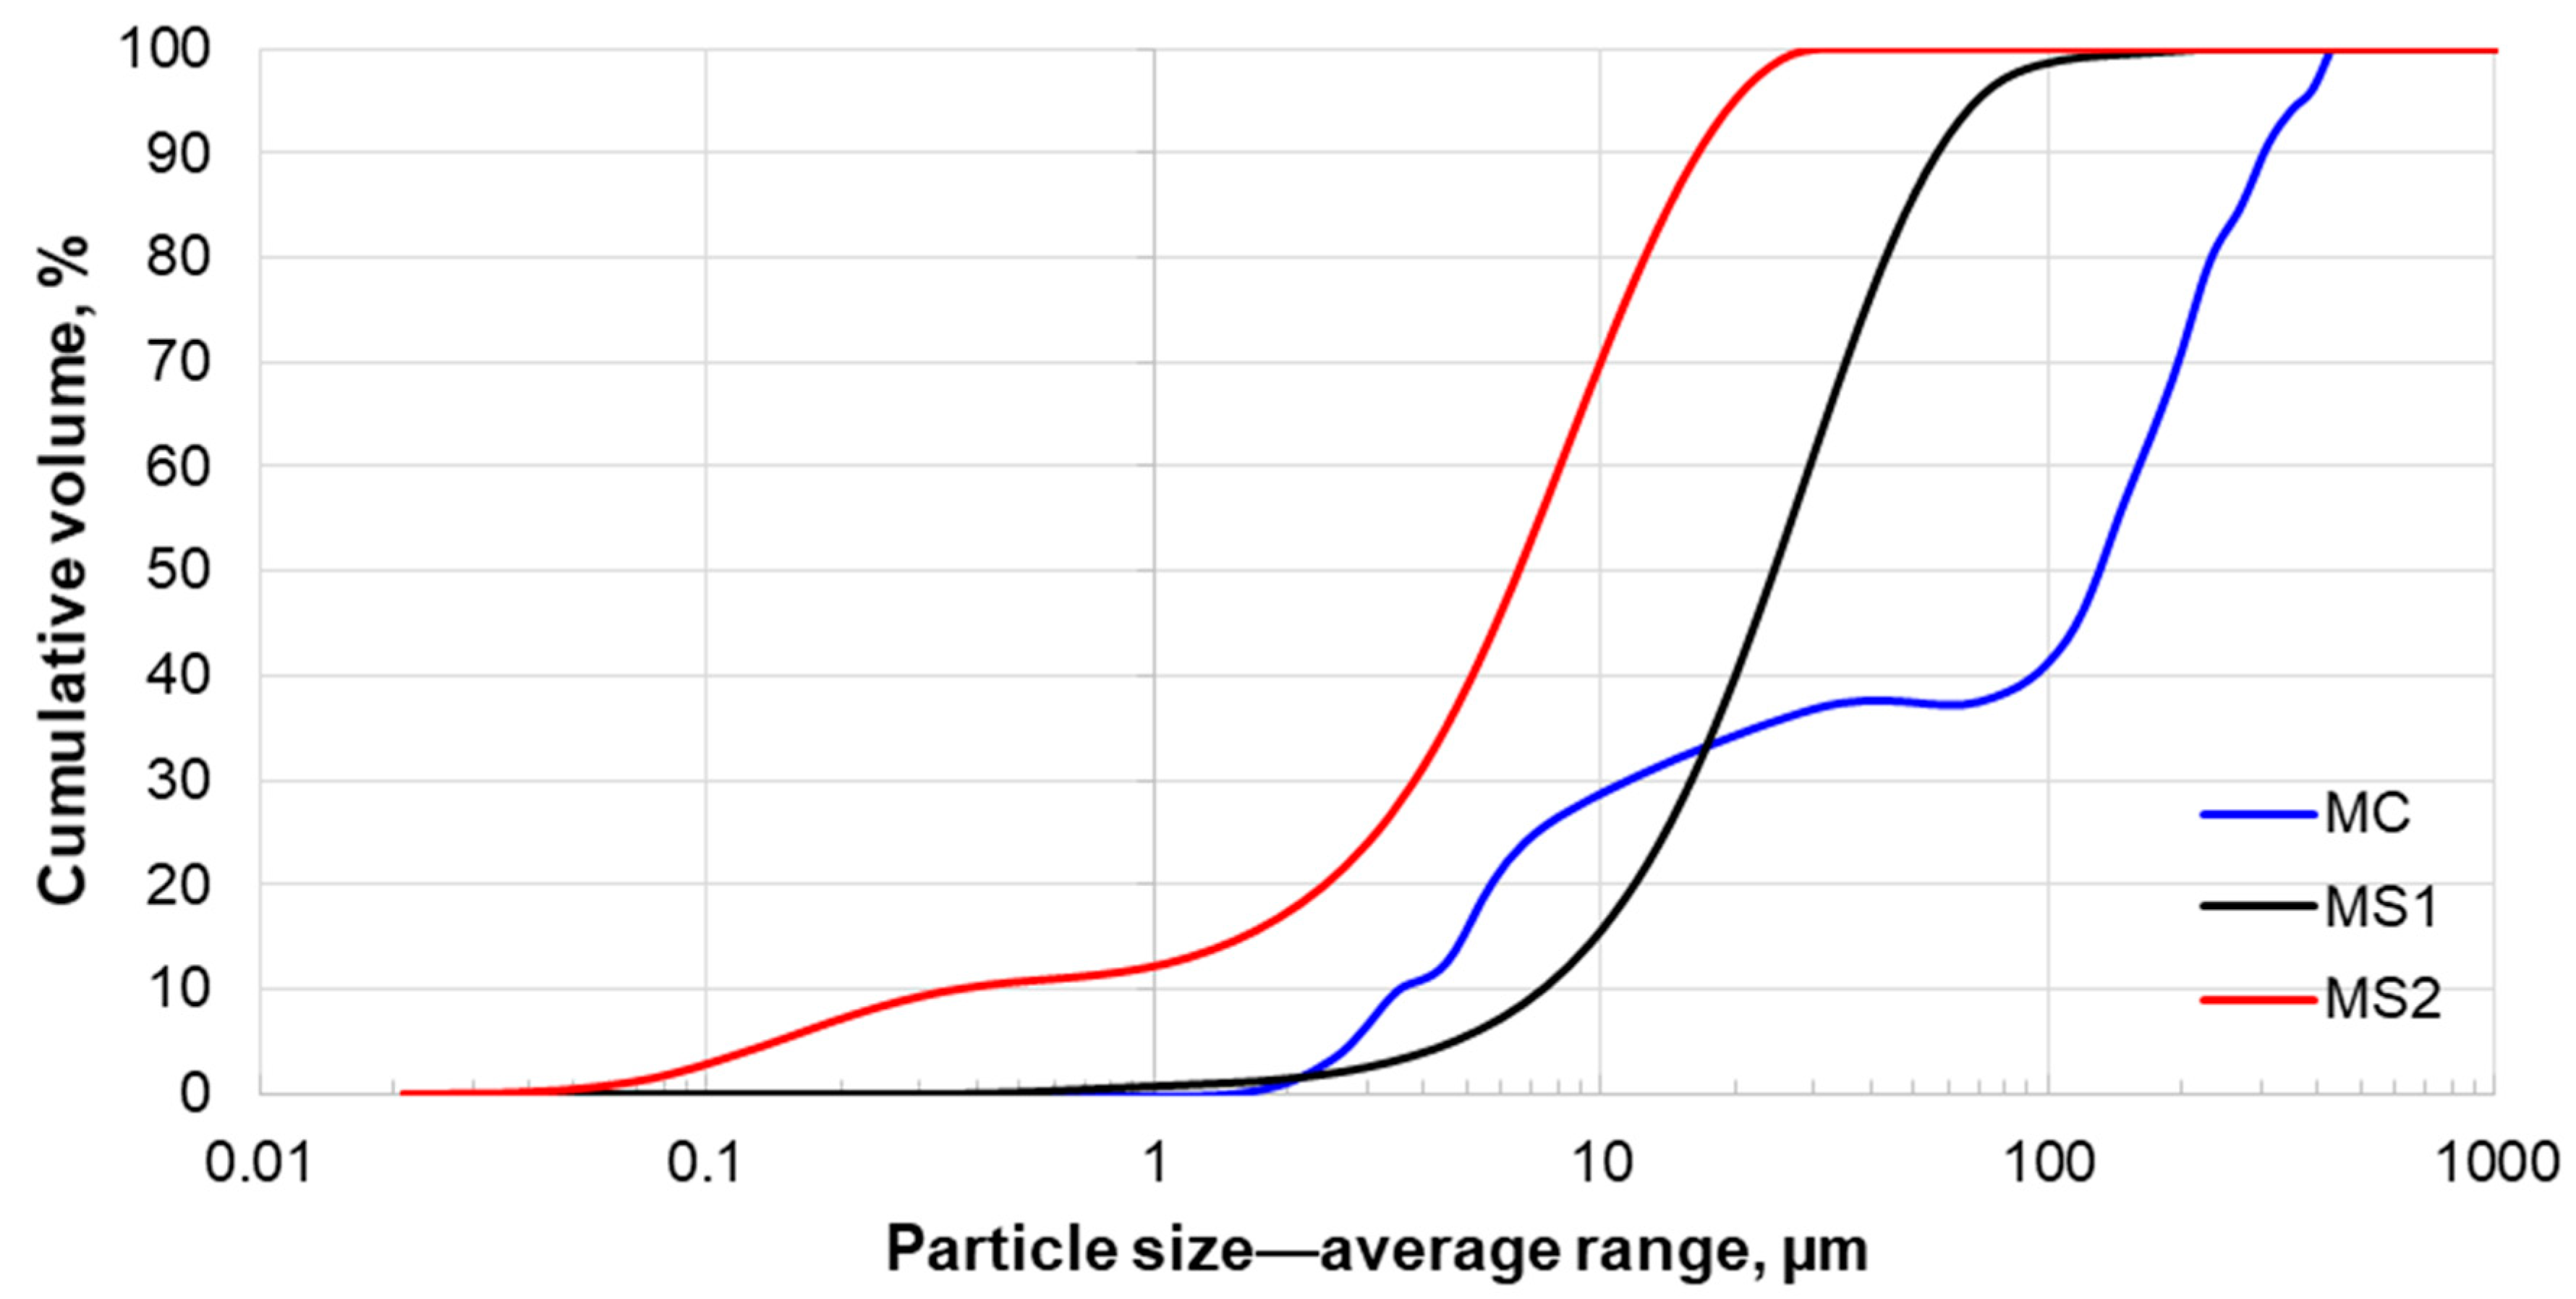
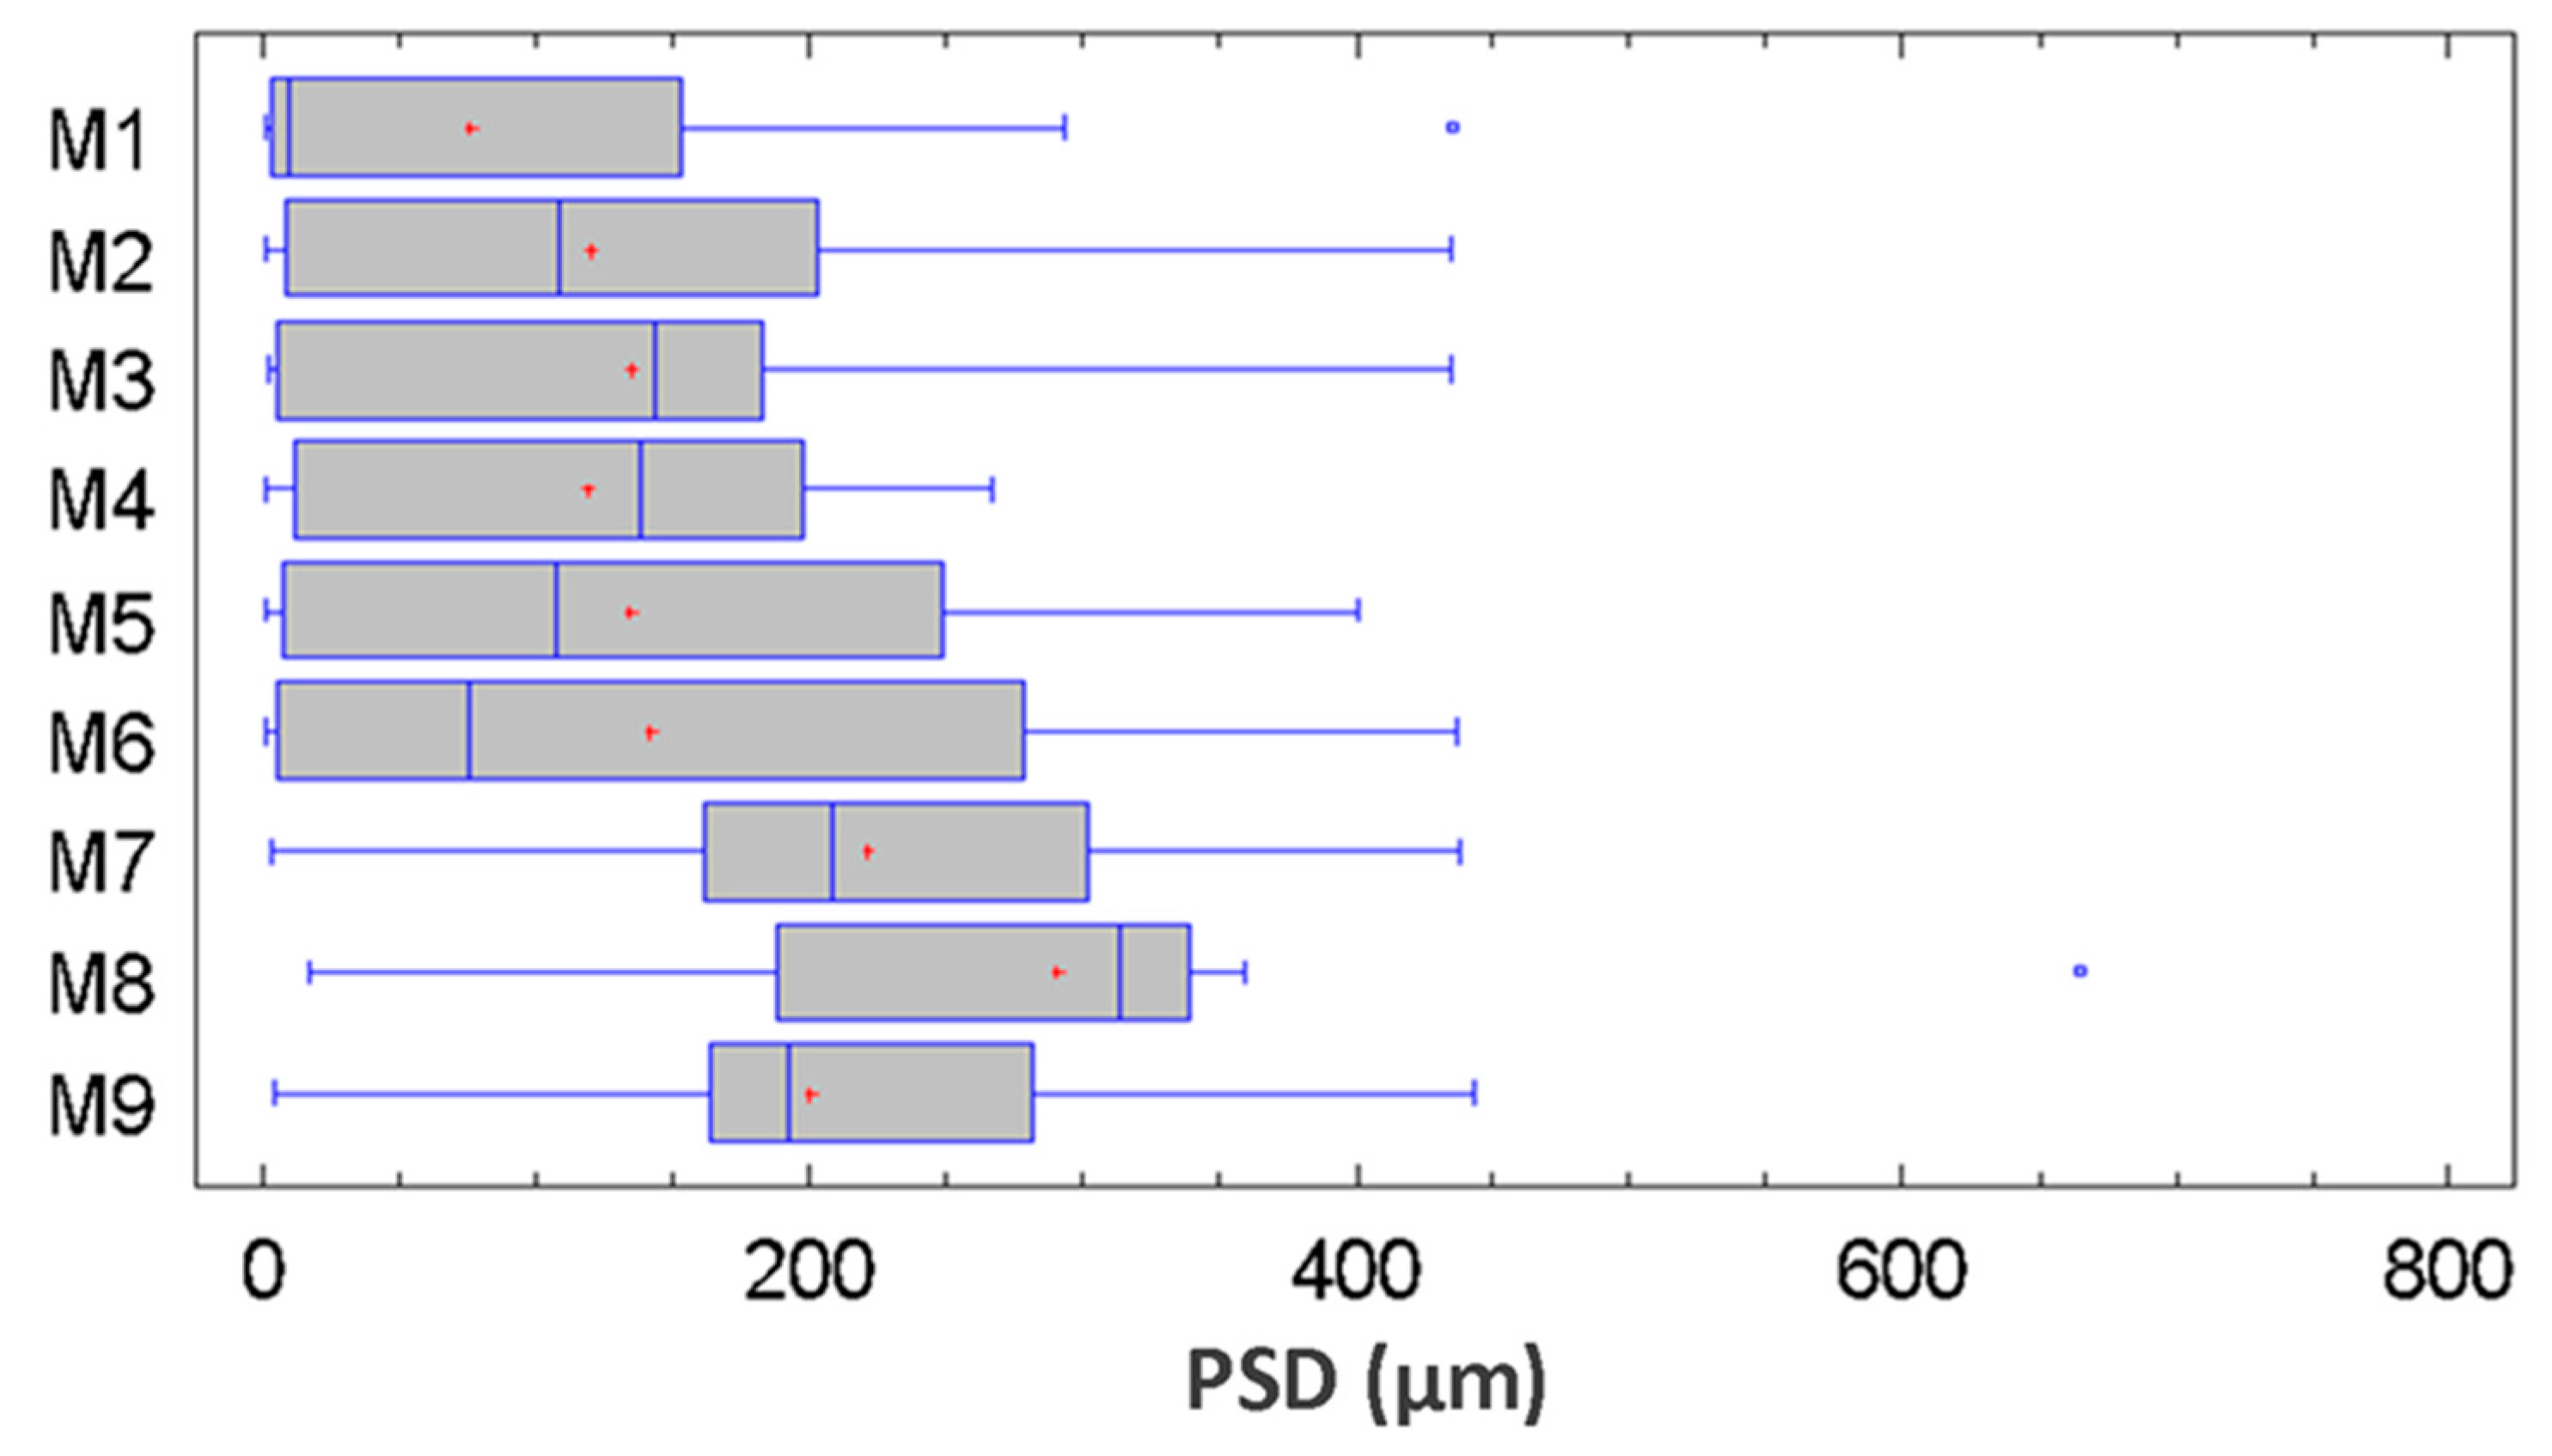
3.2. Size Distribution Analysis

From the distribution curves, the particle size was estimated at 50% distribution (P50) and 90% (P90) for all conditions studied (see Table 2). Size data were obtained by laser diffraction using the MM2000 for samples with and without pre-treatment, and by image processing and analysis obtained from samples studied by optical microscopy. The samples pre-treated with sonication (20 kHz), as suggested by the supplier, showed the lowest particle sizes prior to particle size measurement using the MM2000 (6.9 and 17.4 µm for P50 and P90, respectively), in comparison with the samples analyzed by optical microscopy (119.0 and 307.0 µm, respectively) and the samples analyzed by laser diffraction without sonication (25.7 and 59.6 µm, respectively). It is important to mention that the use of sonication is indeed a pre-treatment, as recommended by the supplier. This pre-treatment was carried out with the aim of ensuring good particle size measurements, thereby avoiding aggregation effects in the results. Furthermore, the differences observed in the values of particle sizes among the three methods can be explained by the influence of external forces on the samples prior to measuring the particle size, particularly in both cases of MM2000 (agitation, pumping and sonication). In fact, the sonicated samples presented smaller particle sizes due to disaggregation effects promoted by the sonication, generating fine particles. This methodology can be useful as an informative backup. However, it can yield impractical results for equipment design and process control purposes, since the particles with aggregation behavior will form new aggregates when sonication or other external forces (agitation and pumping) are stopped. Therefore, the results obtained from image analysis captured by optical microscopy were non-invasive. These results can thereby determine more realistic particle sizes of the aggregates. Thus, the P50 size determined by microscopy was around 17 times higher than the MM2000 analysis with pre-treatment, and almost five times higher than the MM2000 results without pre-treatment. Figure 1 shows the cumulative size distribution curves obtained with the three methods: optical microscopy (MC), laser diffraction without pre-treatment (MS1) and laser diffraction with sonication as pre-treatment (MS2), where the size distribution resulting from image analysis obtained by microscopy reached values higher than 400 µm, presenting a curve with reduced slope between values 100 and 400 µm. Of aggregates 40% were also smaller than 30 µm in size. Moreover, the disaggregation effect that occurred when using the MM2000 determined a PSD with a high quantity of fine particles.
The method of measurement for particle size by optical microscopy was also useful for observing the aggregation evolution over time, specifically when fine particles agglomerate to form new, larger aggregates. In the case of copper sulfide precipitates, the attraction forces promote rapid aggregation among particles [30]. Therefore, the image capture must be very fast. Figure 2 shows the optical micrographs captured by the camera for M1 and M9 samples. In this case, M9 had a higher quantity of aggregates with fewer fine particles around the large aggregates. Figure 3 shows the D50 with respect to the time, from M1 to M9 (at 2 min). The particle size rose drastically from M7, indicating the increase of aggregates, although the behavior in samples M1 to M6 was parabolic, demonstrating a variable behavior. In this context, the validation of the method proposed for measuring particle size distribution is fundamental to support the representativeness of the samples taken from a process.
Previous studies have used optical microscopy and image analysis to quantify PSD, demonstrating the representativeness of results. These methodologies have been based on the minimization of the standard deviation, when quantifying mean values of physical parameters (e.g., area) for a total of “n” objects measured using parametric and non-parametric test, for comparison between captured images [22]. Others studies have based their methods on the objects number quantified from optical micrographs that allows obtaining constant values of mean area and perimeter [15] or bubble size [16]. In fact, optical microscopy is a simple and non-invasive method to achieve representativeness for PSD. However, in cases such as CuCN where the particle size can change with respect to the time, a robust statistical analysis must be done. In this regard, this work included not only an exploratory data analysis and normal distribution determination (using modified Kolmogorov–Smirnov; K–S and Shapiro–Wilk; S–W tests) but also parametric (ANOVA) and non-parametric statistical tests (Kruskal Wallis statistic) to validate the PSD obtained by optical microscopy and compare the results with those obtained by laser diffraction, a traditional technique used for PSD determination. In the case of copper sulfide precipitates, the representativeness of the sample can be affected if the image is captured after certain time since the sample was taken. For this reason, a more robust statistical analysis must be considered for these cases, where size changes with respect to the time force to take low quantity of samples and limited capture of images.
It is necessary to mention that the PSD quantification by optical microscopy has been used mainly in particles without colloidal behavior in which aggregation and changes in PDS towards the time for captured images are not present. In this case, the use of optical microscopy for colloidal behavior of CuCN has not been reported. Thus, there is no background to compare the results obtained in this study.

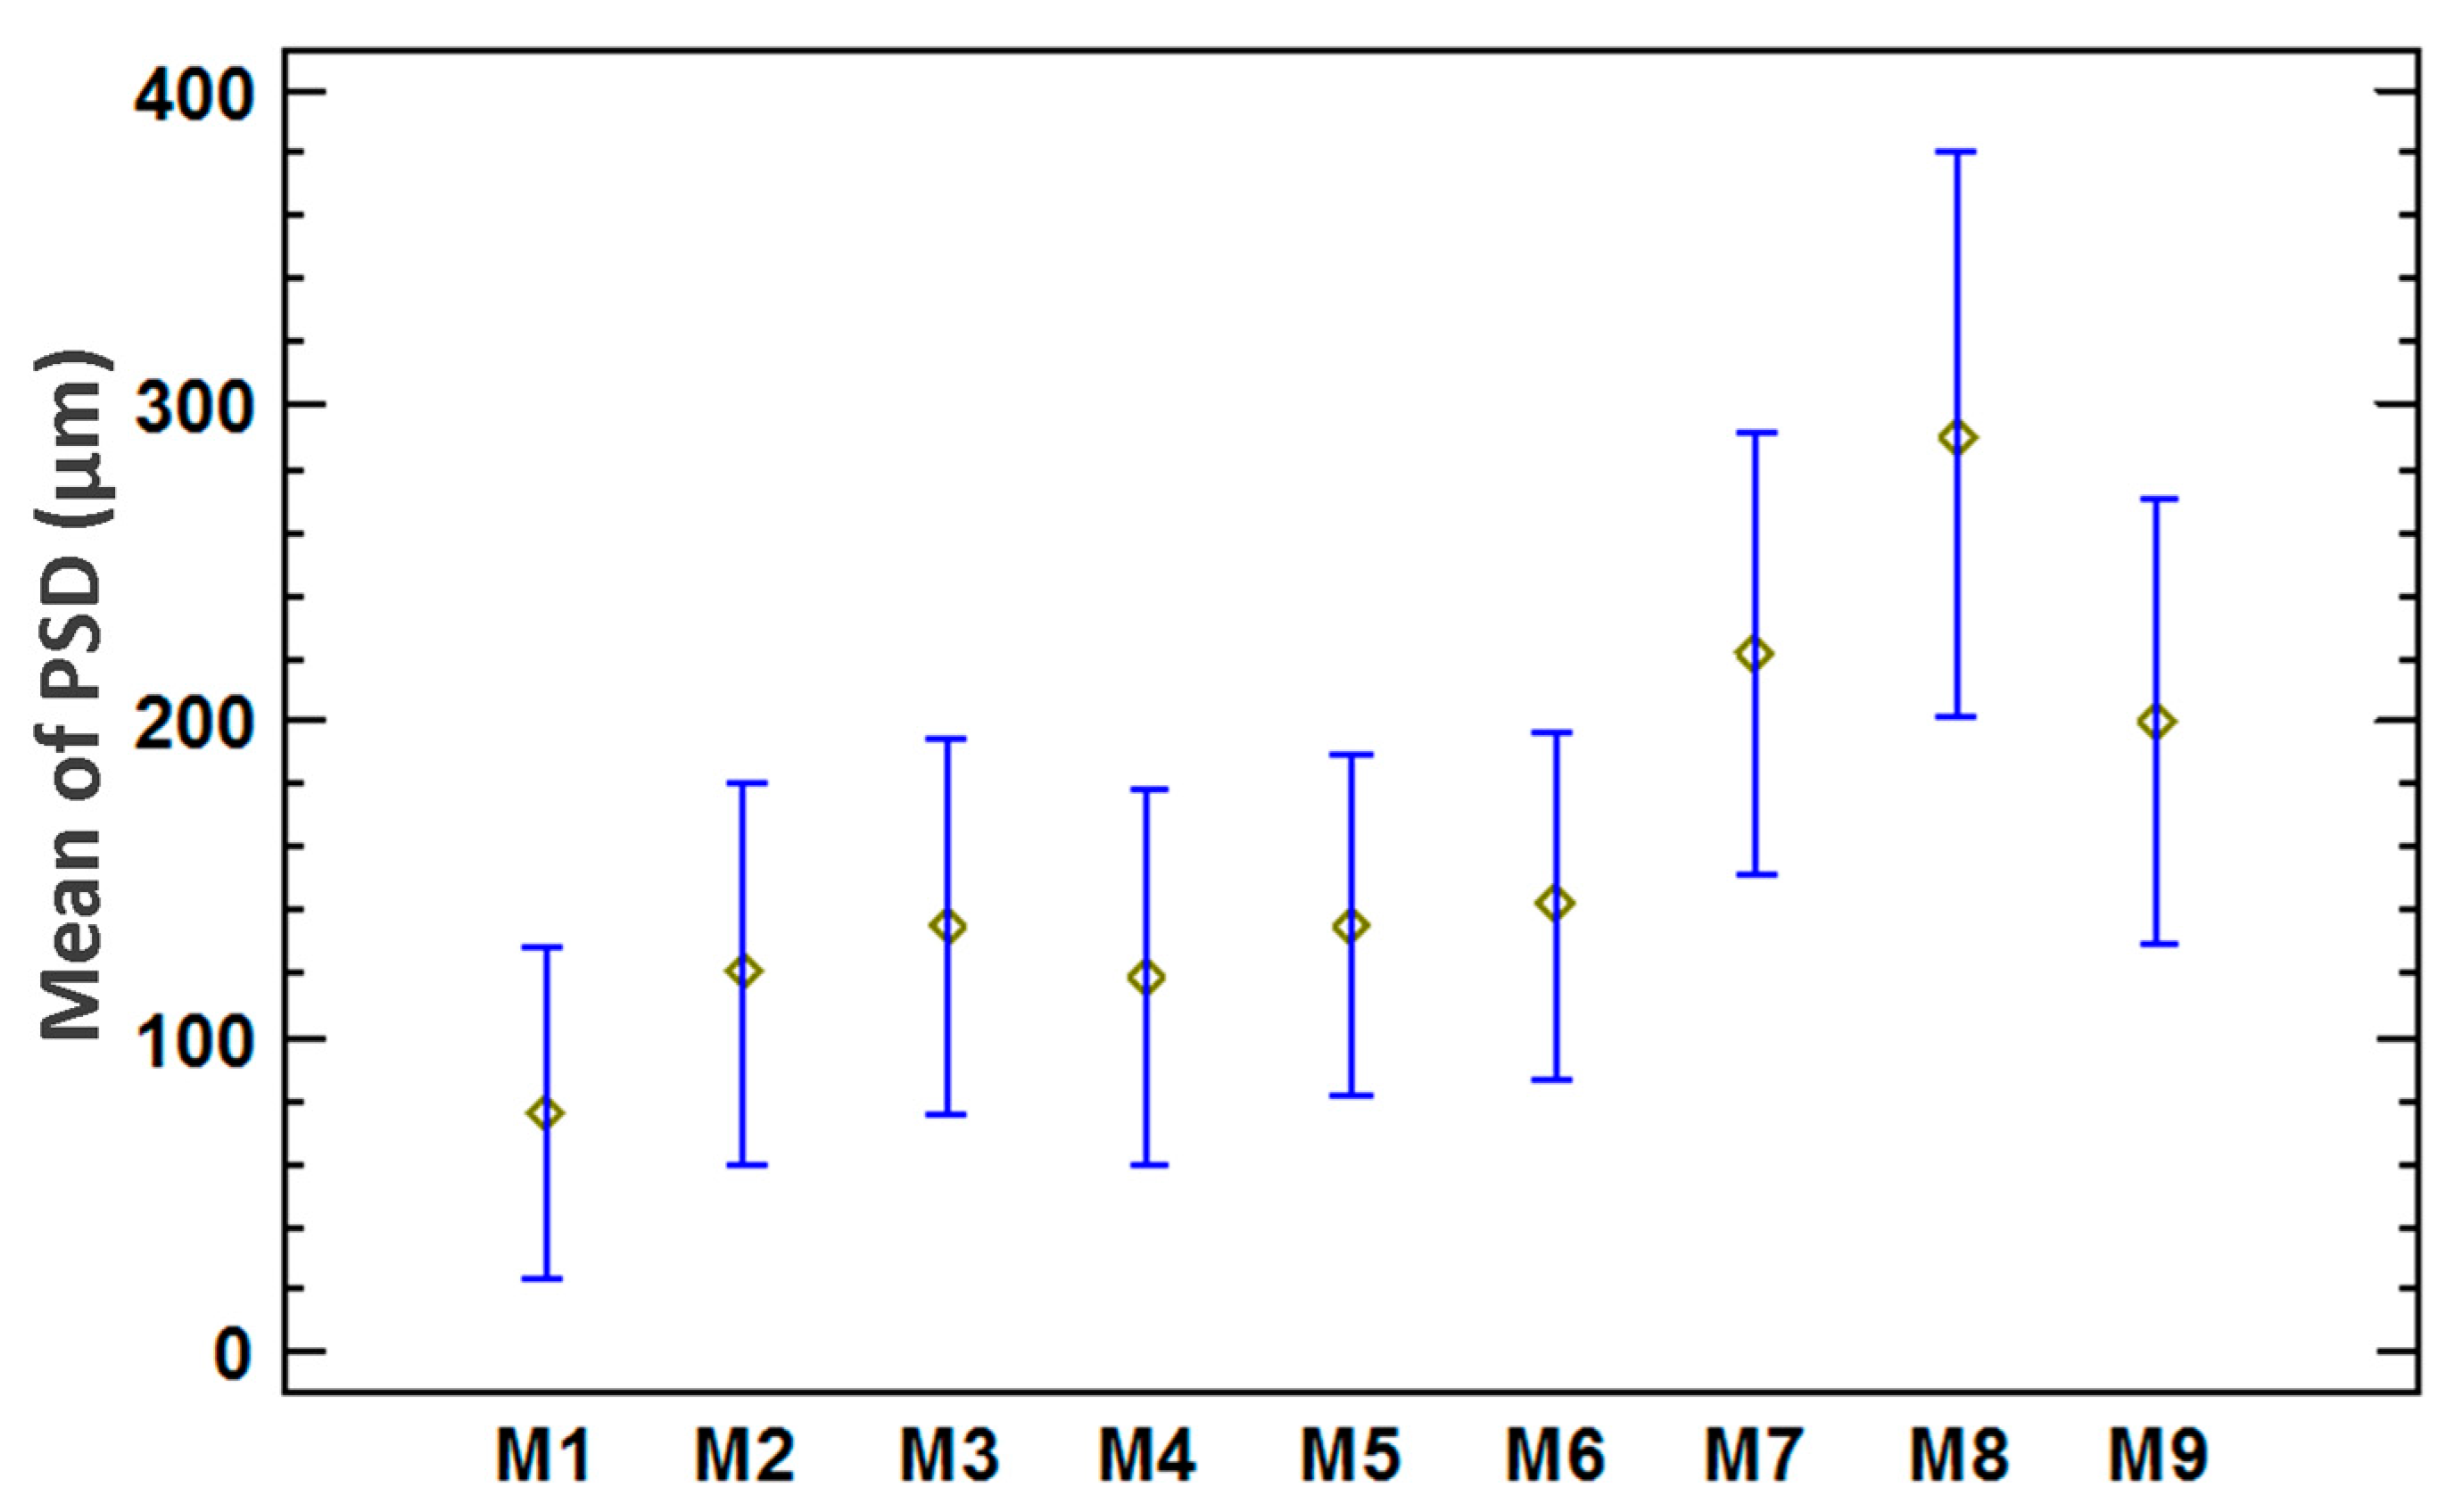
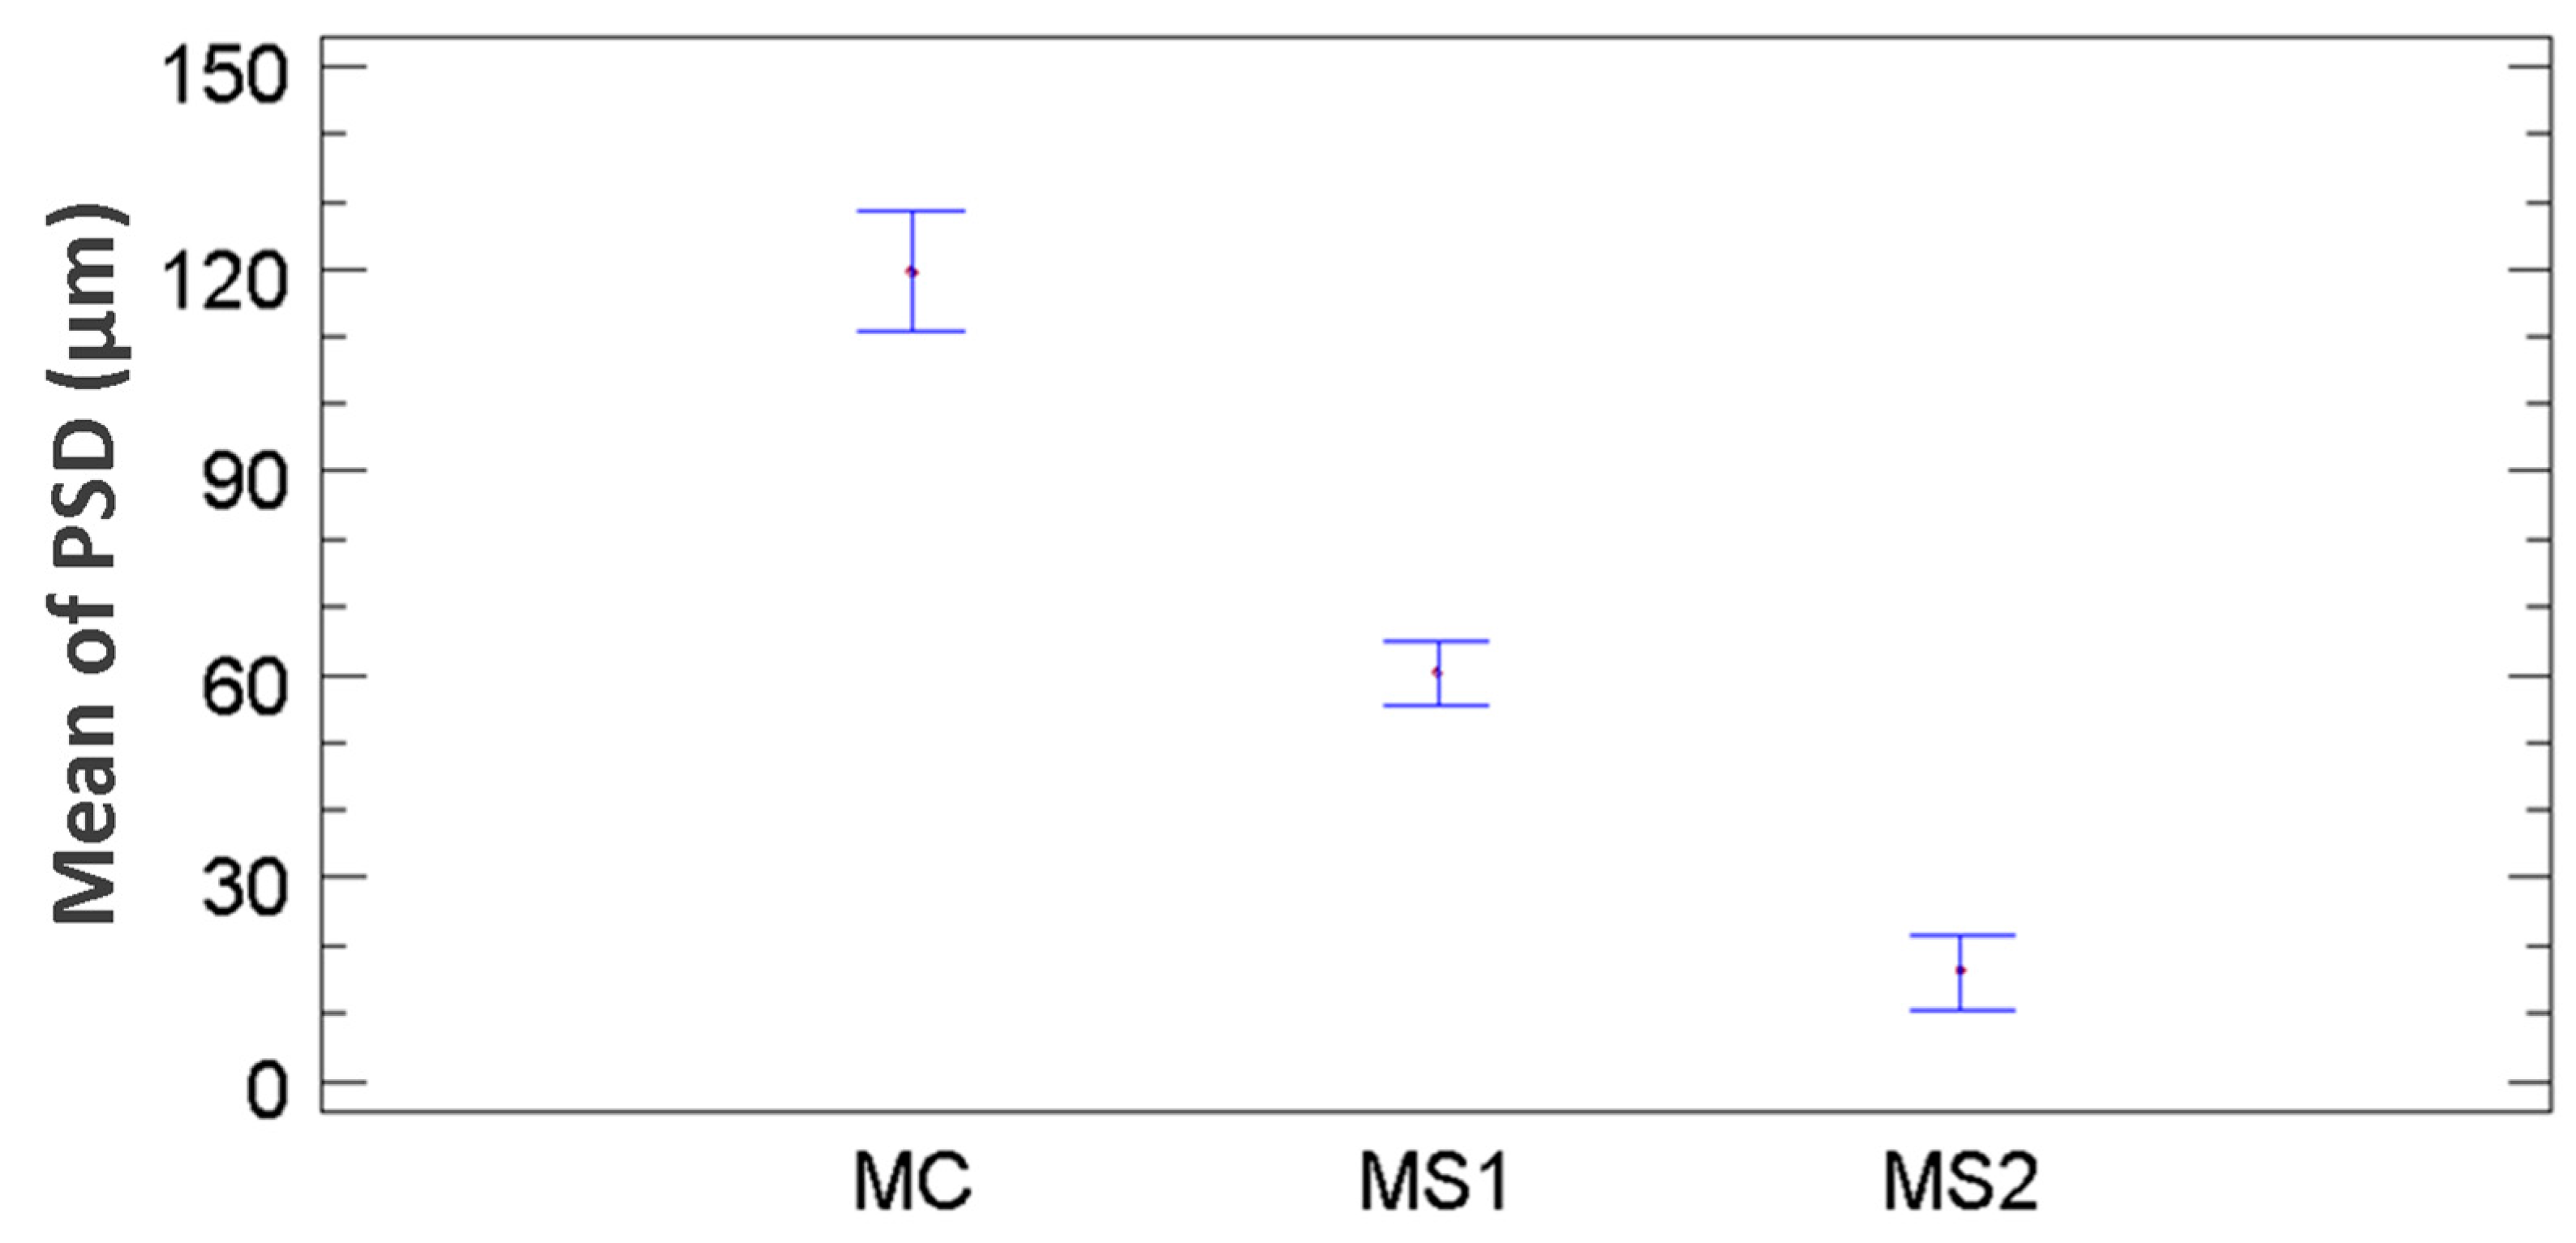
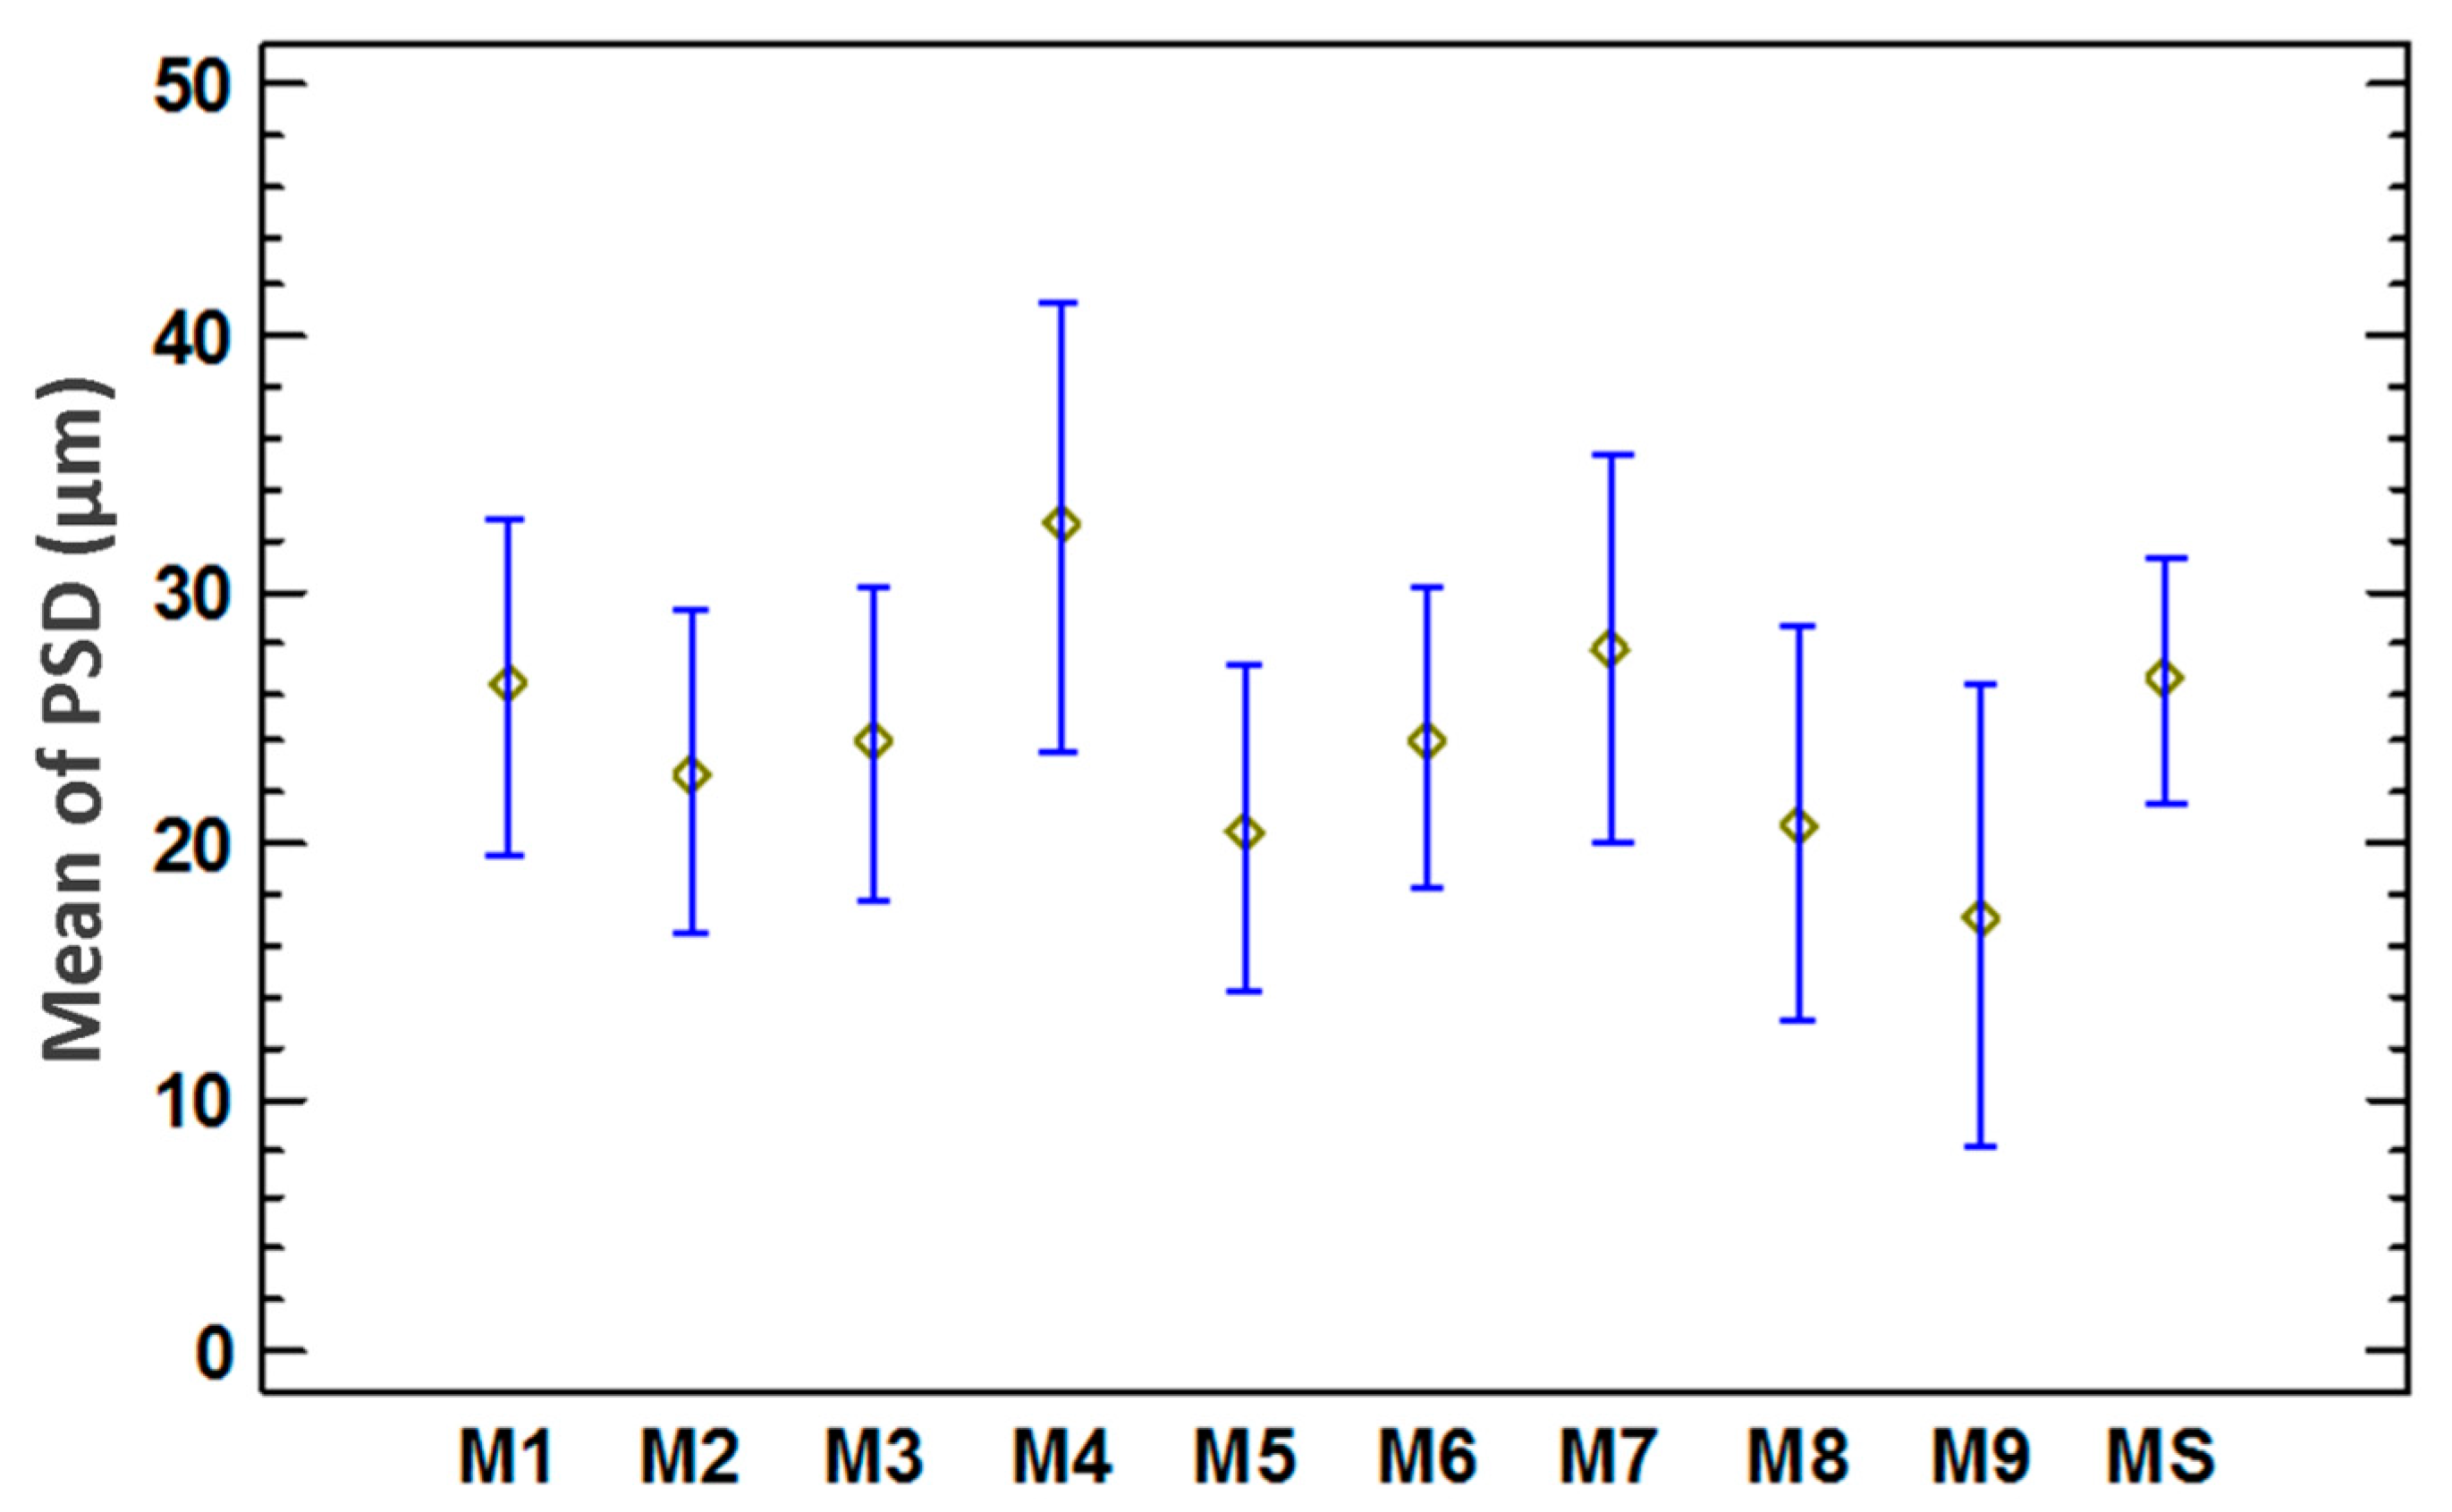
3.3. Statistical Analysis of the Particle Size Distribution for Copper Aggregates

The analysis of size distribution for samples studied by optical microscopy and laser diffraction technique is shown in Table 3. It is appreciated that none of the techniques used for PSD characterization have shown a normal distribution. This is an indication of the complexity of the aggregates and the variability that can be found in the distribution. Figure 4 shows the distribution of all the images (M1…M9) in a box-and-whisker plot. In this figure not only was it confirmed that the distribution was not normal, but also it was shown that two of the images (M1 and M8) had 50% of the data located in the range of 160–340 μm in comparison with the rest of the images in which 50% of the data were located in a PSD lower than 160 μm. This could be explained by the fact mentioned above, namely, that the precipitates obtained in the sulfidization process tend to aggregate over time. Therefore, fewer small particles were quantified by the image analysis during the image capture. The aggregates grew over time, changing the size distribution.
According to the non-parametric Kruskal–Wallis, there were significant differences between the images (F-ratio = 27.35; p-value = 0.0006). Additionally, ANOVA analysis showed that there were significant differences (F-ratio = 4.12; p-value = 0.0002) between the images (M1…M9) obtained by optical microscopy. However, those differences did not appear in all the images. Figure 5 shows the Tukey’s HDS plot for the PSD by optical microscopy, in which it was observed that images M1 and M8 exhibited differences from the other images. The differences observed in these images with respect to the other images could be attributed to the aggregation behavior of precipitates over time. In this case, the M1 image was measured first and M8 was captured closer to the defined time-limit for taking the picture (2 min). Therefore, the size of the aggregates was greater than in the other samples (the 2 min time could be variable for different particles. This will depend on the aggregation characteristics).
Considering that M1 and M8 showed a different distribution, these images were removed from the analysis, since the time that elapsed affected the representativeness of these samples, under or over estimating the size of aggregates with respect to the real-time expended in the reactor. ANOVA and Kruskal–Wallis results without M1 and M8 showed that there were no significant differences between the images for the ANOVA (F-ratio = 1.87; p-value = 0.0903) and the Kruskal–Wallis test (F-ratio = 1.7266; p-value = 0.1163). This means that the distribution obtained was representative from a statistical point of view. Additionally, Levene’s statistic was calculated in order to determine whether there are significant differences between the standard deviation of the seven images. Results obtained for this statistic showed that there were no significant differences (F-ratio = 1.7266; p-value = 0.1188) within the standard deviation. Thus, the standard deviation obtained from the seven images was representative at 95% of confidence level.
The validated PSD obtained by optical microscopy was compared with the analysis of the laser diffraction technique with and without pre-treatment. ANOVA and Kruskal–Wallis analysis showed significant differences between the PSD (p ≤ 0.05). Figure 6 shows the Tukey’s HDS plot in which significant differences between optical microscopy and laser diffraction technique with and without pre-treatment could be observed. It is particularly interesting that the pre-treatment applied to the sample had a significant impact on the PSD. The sample in which a previous sonication (MS2) was applied showed the lower mean of 16.245 ± 3.699 μm, whereas the sample without sonication has a mean of 60.226 ± 3.046 μm. Considering that PSD plays a crucial role in the solid–liquid separation processes, the type of analysis must be carefully considered, because the pre-treatment and the type of analysis themselves generate variability in the PSD characterization.
Furthermore, images obtained by optical microscopy (seven images) showed higher values in the mean (119.721 ± 125.346 μm) in comparison with the laser diffraction technique. This result could be explained by the fact that the optical microscopy is not an invasive measurement technique. Therefore, the PSD obtained by optical microscopy represents reality effectively. This is crucial in the selection and design of solid–liquid separation processes. Finally, Figure 7 shows the definitive PSD obtained for the seven images selected (P50 = 147.044 µm; P90 = 312.503 µm), comparing it with the MM2000 PSD results. The elimination of M1 caused the increase in P50 and P90 values with respect to the complete PSD (Figure 1), although the tendency of each curves was very similar. The curve obtained with optical microscopy in Figure 7 presents two main zones of particles or aggregates, one representing the fine particles (<40 µm) and another one representing the larger aggregates (>100 µm), i.e., a bi-modal behavior. This fact was the main difference with respect to the laser diffraction technique, which was not able to determine and quantify the bi-modal curve in a suspension containing particles with aggregation behavior. The limit of these two zones and their values of P50 should be the relevant information for use in solid–liquid separation process of precipitates.
In fact, recent studies focused on the increase of particle size of aggregates formed from metal sulfides precipitates have supported their results with laser diffraction measurements (Mastersizer) [33,34]. Results shown in Figure 7 demonstrate that the differences between a non-invasive technique as optical microscopy and Mastersizer could conduct to a confused interpretation. By this, an adequate selection of the technique used to determine physical parameters as particle size and/or particle size distribution is critical when these measurements determine operational definitions.

3.4. Validation of Method Using an Unbiased Sample

Results of the comparative analysis for the CuCN sample are shown in Figure 8, where a Tukey´s HDS plot for the nine images obtained for CuCN sample was compared with laser diffraction technique measurement (MS). In that figure, it was observed that there were no significant differences (p = 0.11699 in ANOVA) between the images (M1…M9) and between them and the laser diffraction technique measurement (MS), as well. This means that microscopy was a validated statistical technique as a non-invasive method for the PSD determination.

4. Conclusions

Image processing and analysis using optical microscopy, coupled with statistical methods to validate the results, is a non-invasive and reliable alternative to conventional methods for quantifying the PSD of slurries containing solids with aggregation behavior, generated from precipitation processes. Furthermore, the method presented in this study was easy to implement for research and industrial purposes in a standard laboratory. Additionally, this methodology could also be used to determine PSD for different fine particles (ranging between 1 and 500 µm), as an alternative to conventional methods. Therefore, this methodology could be the basis for the application of image processing and analysis to measure PSD in different processes online, in order to improve the control and performance of solid–liquid separation equipment.

Author Contributions

Conceptualization, E.T., R.R.-F., and H.E.; Tests Execution: M.Q., and M.G.-K.; Methodology: M.Q., R.R.-F., E.T.; Validation: M.Q., and M.G.-K.; Investigation: E.T., R.R.-F., and H.E.; Resources: H.E.; Writing-Original Draft Preparation: H.E., M.Q., and R.R.-F.; Writing-Review & Editing: E.T., H.E., and R.R.-F.; Supervision: H.E., Project Administration: H.E.; Funding Acquisition: H.E.

Funding

The authors gratefully acknowledge the financial support of the National Commission for Scientific and Technological Research (CONICYT Chile) through the CONICYT-PIA Project AFB180004 and the FONDEF/IDeA Program, FONDEF/CONICYT 2017+ID17I10021.

Conflicts of Interest

The authors declare no conflict of interest.

References

  1. Habashi, F. Handbook of Extractive Metallurgy. J. Light Met. 1997, 19, 21–22. [Google Scholar]
  2. Walton, R. Zinc cementation. In Gold Ore Process, 2nd ed.; Adams, M.D., Ed.; Elsevier: Amsterdam, The Netherlands, 2016; pp. 553–560. [Google Scholar] [CrossRef]
  3. Akcil, A.; Koldas, S. Acid Mine Drainage (AMD): Causes, treatment and case studies. J. Clean. Prod. 2006, 14, 1139–1145. [Google Scholar] [CrossRef]
  4. Fu, F.; Wang, Q. Removal of heavy metal ions from wastewaters: A review. J. Environ. Manag. 2011, 92, 407–418. [Google Scholar] [CrossRef] [PubMed]
  5. Estay, H. Designing the SART process—A Review. Hydrometallurgy 2018, 176, 147–165. [Google Scholar] [CrossRef]
  6. Mokone, T.P.; van Hille, R.P.; Lewis, A.E. Effect of solution chemistry on particle characteristics during metal sulfide precipitation. J. Colloid Interface Sci. 2010, 351, 10–18. [Google Scholar] [CrossRef]
  7. Mokone, T.P.; Lewis, A.E.; van Hille, R.P. Effect of post-precipitate conditions on surface properties of colloidal metal sulphide precipitates. Hydrometallurgy 2012, 119–120, 55–66. [Google Scholar] [CrossRef]
  8. Martin, A.; Fawcett, S.; Kulczycki, E.; Loomer, D.; Al, T.; Rollo, A. Application of High-Resolution Microscopy Methods to the Analysis of Fine-Grained and Amorphous Treatment Sludges. In Proceedings of the Proceedings Tailings and Mine Waste, Vancouver, BC, Canada, 6–9 November 2011. [Google Scholar]
  9. Fleming, C.A.; Melashvili, M. The SART process: Killing the sacred cows. In Proceedings of the XXVIII International Mineral Processing Congress (IMPC 2016), Quebec City, QC, Canada, 11–15 September 2016. [Google Scholar]
  10. Gim-Krumm, M.; Quilaqueo, M.; Rojas, V.; Seriche, G.; Ruby-Figueroa, R.; Cortés-Arriagada, D.; Romero, J.; Troncoso, E.; Estay, H. Impact of precipitate characteristics and precipitation conditions on the settling performance of a sulfide precipitation process: An exhaustive characterization of the aggregation behavior. Hydrometallurgy 2019, 189, 105150. [Google Scholar] [CrossRef]
  11. Greet, C.J.; Smart, R.S.C. The effect of separation by cyclosizing and sedimentation/decantation on mineral surfaces. Miner. Eng. 1997, 10, 995–1011. [Google Scholar] [CrossRef]
  12. Arasan, S.; Akbulut, S.; Hasiloglu, A.S. Effect of particle size and shape on the grain-size distribution using Image analysis. Int. J. Civ. Struct. Eng. 2011, 1, 968–985. [Google Scholar] [CrossRef]
  13. Coster, M.; Chermant, J.L. Image analysis and mathematical morphology for civil engineering materials. Cem. Concr. Compos. 2001, 23, 133–151. [Google Scholar] [CrossRef]
  14. Ghasemy, A.; Rahimi, E.; Malekzadeh, A. Introduction of a new method for determining the particle-size distribution of fine-grained soils. Meas. J. Int. Meas. Confed. 2019, 132, 79–86. [Google Scholar] [CrossRef]
  15. Ramírez, C.; Troncoso, E.; Muñoz, J.; Aguilera, J.M. Microstructure analysis on pre-treated apple slices and its effect on water release during air drying. J. Food Eng. 2011, 106, 253–261. [Google Scholar] [CrossRef]
  16. Orrego, M.; Troncoso, E.; Zúñiga, R.N. Aerated whey protein gels as new food matrices: Effect of thermal treatment over microstructure and textural properties. J. Food Eng. 2015, 163, 37–44. [Google Scholar] [CrossRef]
  17. Graham, D.; Rice, S.P.; Reid, I. A transferable method for the automated grain sizing of rivergravels. Water Resour. Res. 2005, 41, 1–12. [Google Scholar] [CrossRef]
  18. Alvarez-Iglesias, J.C.; Gomes, O.; Paciornik, S. Automatic recognition of hematite grains under polarized reflected light microscopythrough image analysis. Min. Eng. 2011, 24, 1264–1270. [Google Scholar] [CrossRef]
  19. Presles, B.; Debayle, J.; Févotte, G.; Pinoli, J.C. Novel image analysis method for in situ monitoring theparticle size distribution of batch crystallization processes. J. Electron. Imaging 2010, 19, 031207. [Google Scholar] [CrossRef]
  20. Singh, M.R.; Chakraborty, J.; Nere, N.; Tung, H.H.; Bordawekar, S.; Ramkrishna, D. Image-Analysis-Based Method for 3D Crystal Morphology Measurement and Polymorph Identification Using ConfocalMicroscopy. Crist. Growth Des. 2012, 12, 3735–3748. [Google Scholar] [CrossRef]
  21. Maerz, N.H. Aggregate sizing and shape determination using digital image processing. In Proceedings of the Center for Aggregates Research (ICAR) Sixth Annual Symposium Proceedings, St. Louis, MO, USA, 19–20 April 1998; pp. 195–203. [Google Scholar]
  22. Ramírez, C.; Aguilera, J.M. Determination of a representative area element (RAE) based on nonparametric statistics in bread. J. Food Eng. 2011, 102, 197–201. [Google Scholar] [CrossRef]
  23. MacPhail, P.K.; Fleming, C.; Sarbutt, K. Cyanide Recovery by the SART Process for the Lobo-Marte Project. In Proceedings of the Chile, Randol Gold and Silver Forum, Denver, CO, USA, 26–29 April 1998. [Google Scholar]
  24. Botz, M.; Acar, S. Copper Precipitation and Cyanide Recovery Pilot Testing for the Newmont Yanacocha Project. In Proceedings of the Society for Mining, Metallurgy & Exploration (SME) Annual Meeting, Denver, CO, USA, 25–28 February 2007. [Google Scholar]
  25. Botz, M.; Kaczmarek, A.; Orser, S. Managing copper in leach solution at the Copler gold mine: Laboratory testing and process design. Min. Metall. Proc. 2011, 28, 133–138. [Google Scholar] [CrossRef]
  26. Estay, H.; Carvajal, P.; Hedjazi, F.; Van Zeller, T. The SART process experience in the Gedabek plant. In Proceedings of the HydroProcess, 4th International Workshop on Process Hydrometallurgy, Santiago, Chile, 12–13 July 2012. [Google Scholar]
  27. Marsden, J.O.; House, C.I. The Chemistry of Gold Extraction, 2nd ed.; Society for Mining, Metallurgy and Exploration SME: Englewood, CO, USA, 2006. [Google Scholar]
  28. Puigdomenech, I. Hydra-Medusa Software (Hydrochemical Equilibrium Constant, Database and Make Equilibrium Diagrams Using Sophisticated Algorithms), 1st ed.; Royal Institute of Technology: Stockholm, Sweden, 2004. [Google Scholar]
  29. Malvern Instruments Ltd. Mastersizer 2000 User Manual UK. 2007. Available online: https://www.labmakelaar.com/fjc_documents/mastersizer-2000-2000e-manual-eng1.pdf (accessed on 23 November 2018).
  30. Wrighton-Araneda, K.; Ruby-Figueroa, R.; Estay, H.; Cortés-Arriagada, D. Interaction of H2O with (CuS)n, (Cu2S)n, and (ZnS)n small clusters (n = 1–4, 6): Relation to the aggregation characteristics of metal sulfides at aqueous solutions. J. Mol. Model. 2019, 25, 291. [Google Scholar] [CrossRef]
  31. Ghasemi, A.; Zahediasl, S. Normality tests for statistical analysis: A guide for Non-statiticians. Int. J. Endocrinol. Metab. 2012, 10, 486–489. [Google Scholar] [CrossRef] [PubMed]
  32. Montgomery, D.C. Design and analysis of experiments-second edition. Qual. Reliab. Eng. Int. 1987, 3, 212. [Google Scholar] [CrossRef]
  33. Peng, X.; Xia, Z.; Kong, L.; Hu, X.; Wang, X. UV light irradiation improves the aggregation and settling performance of metal sulfide particles in strongly acidic wastewater. Water Res. 2019, 163, 114860. [Google Scholar] [CrossRef] [PubMed]
  34. Deng, Z.; Oraby, E.A.; Eksteen, J.J. Sulfide precipitation of copper from alkaline glycine-cyanide solutions: Precipitate characterization. Min. Eng. 2020, 145, 106102. [Google Scholar] [CrossRef]
Figure 1. Cumulative particle size distribution curves for different methods of particle size measurement. In the case of MC, it considers nine original samples.
Minerals 09 00724 g001
Figure 2. Optical micrographs of samples analyzed at different times, M1 at 10 s (left) and M9 at 2 min (right).
Minerals 09 00724 g002
Figure 3. Results of D50 particle size of copper precipitates with respect to the capture time of image in the microscope.
Minerals 09 00724 g003
Figure 4. Box-and-whisker plot for the particle size distribution (PSD) of nine images obtained by optical microscopy.
Minerals 09 00724 g004
Figure 5. Tukey’s honestly significant difference (HDS) plot for PSD by optical microscopy.
Minerals 09 00724 g005
Figure 6. Tukey’s HDS plot for comparison of PSD between optical microscopy and laser diffraction technique with and without pre-treatment.
Minerals 09 00724 g006
Figure 7. Cumulative particle size distribution curves for three methods of particle size measurement. In this case, the PSD obtained from image analysis by optical microscopy includes M2–M7 and M9.
Minerals 09 00724 g007
Figure 8. Tukey’s HDS plot for comparison of PSD between optical microscopy (M1…M9) and laser diffraction technique (MS) for the CuCN sample.
Minerals 09 00724 g008
Table 1. Sulfidization results.
DescriptionValue
Copper content, % w/w67.69
Copper sulfide conversion, %99.97
Total suspended solids, mg/L2658
Table 2. Particle size estimated by optical microscopy and laser diffraction technique.
Particle Size, µmMCMS1MS2
P50119.025.76.9
P90307.059.617.4
P50: particle size at 50% distribution; P90: particle size at 90% distribution. MC: optical microscopy; MS1: laser diffraction without pre-treatment; MS2: laser diffraction with pre-treatment.
Table 3. Analysis of normal distribution for samples analyzed by optical microscopy and laser diffraction technique.
StatisticsMCMS1MS2
F-Ratiop-ValueF-Ratiop-ValueF-Ratiop-Value
Shapiro-Wilk0.87288<0.050.60841<0.050.77999<0.05
Modified Kolmogorov-Smirnov2.73516<0.055.82743<0.055.03322<0.05
MC: optical microscopy; MS1: laser diffraction without pre-treatment.; MS2: laser diffraction with pre-treatment.

