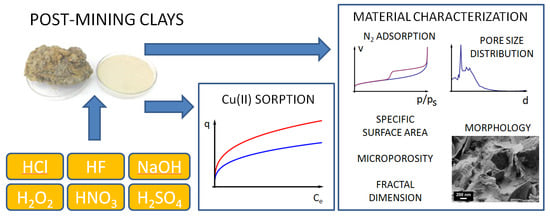
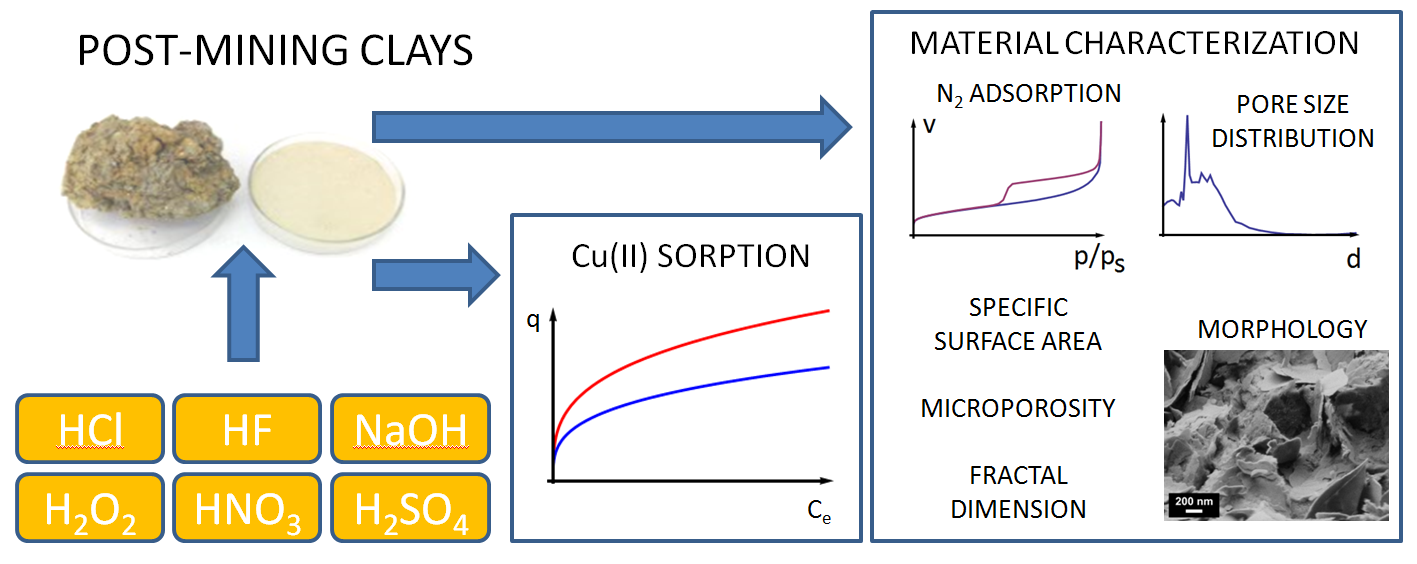
Natural and Chemically Modified Post-Mining Clays—Structural and Surface Properties and Preliminary Tests on Copper Sorption


Abstract
1. Introduction
2. Materials and Methods
2.1. Materials
2.2. Sample Preparation
- S1—unmodified clay;
- S2—clay activated with HF;
- S3—clay activated with H2O2;
- S4—clay activated with H2SO4;
- S5—clay activated with HCl;
- S6—clay activated with HNO3;
- S7—clay activated with NaOH.
2.3. Characterization of Material
2.4. Cu(II) Sorption
3. Results and Discussion
3.1. Mineralogical and Chemical Composition
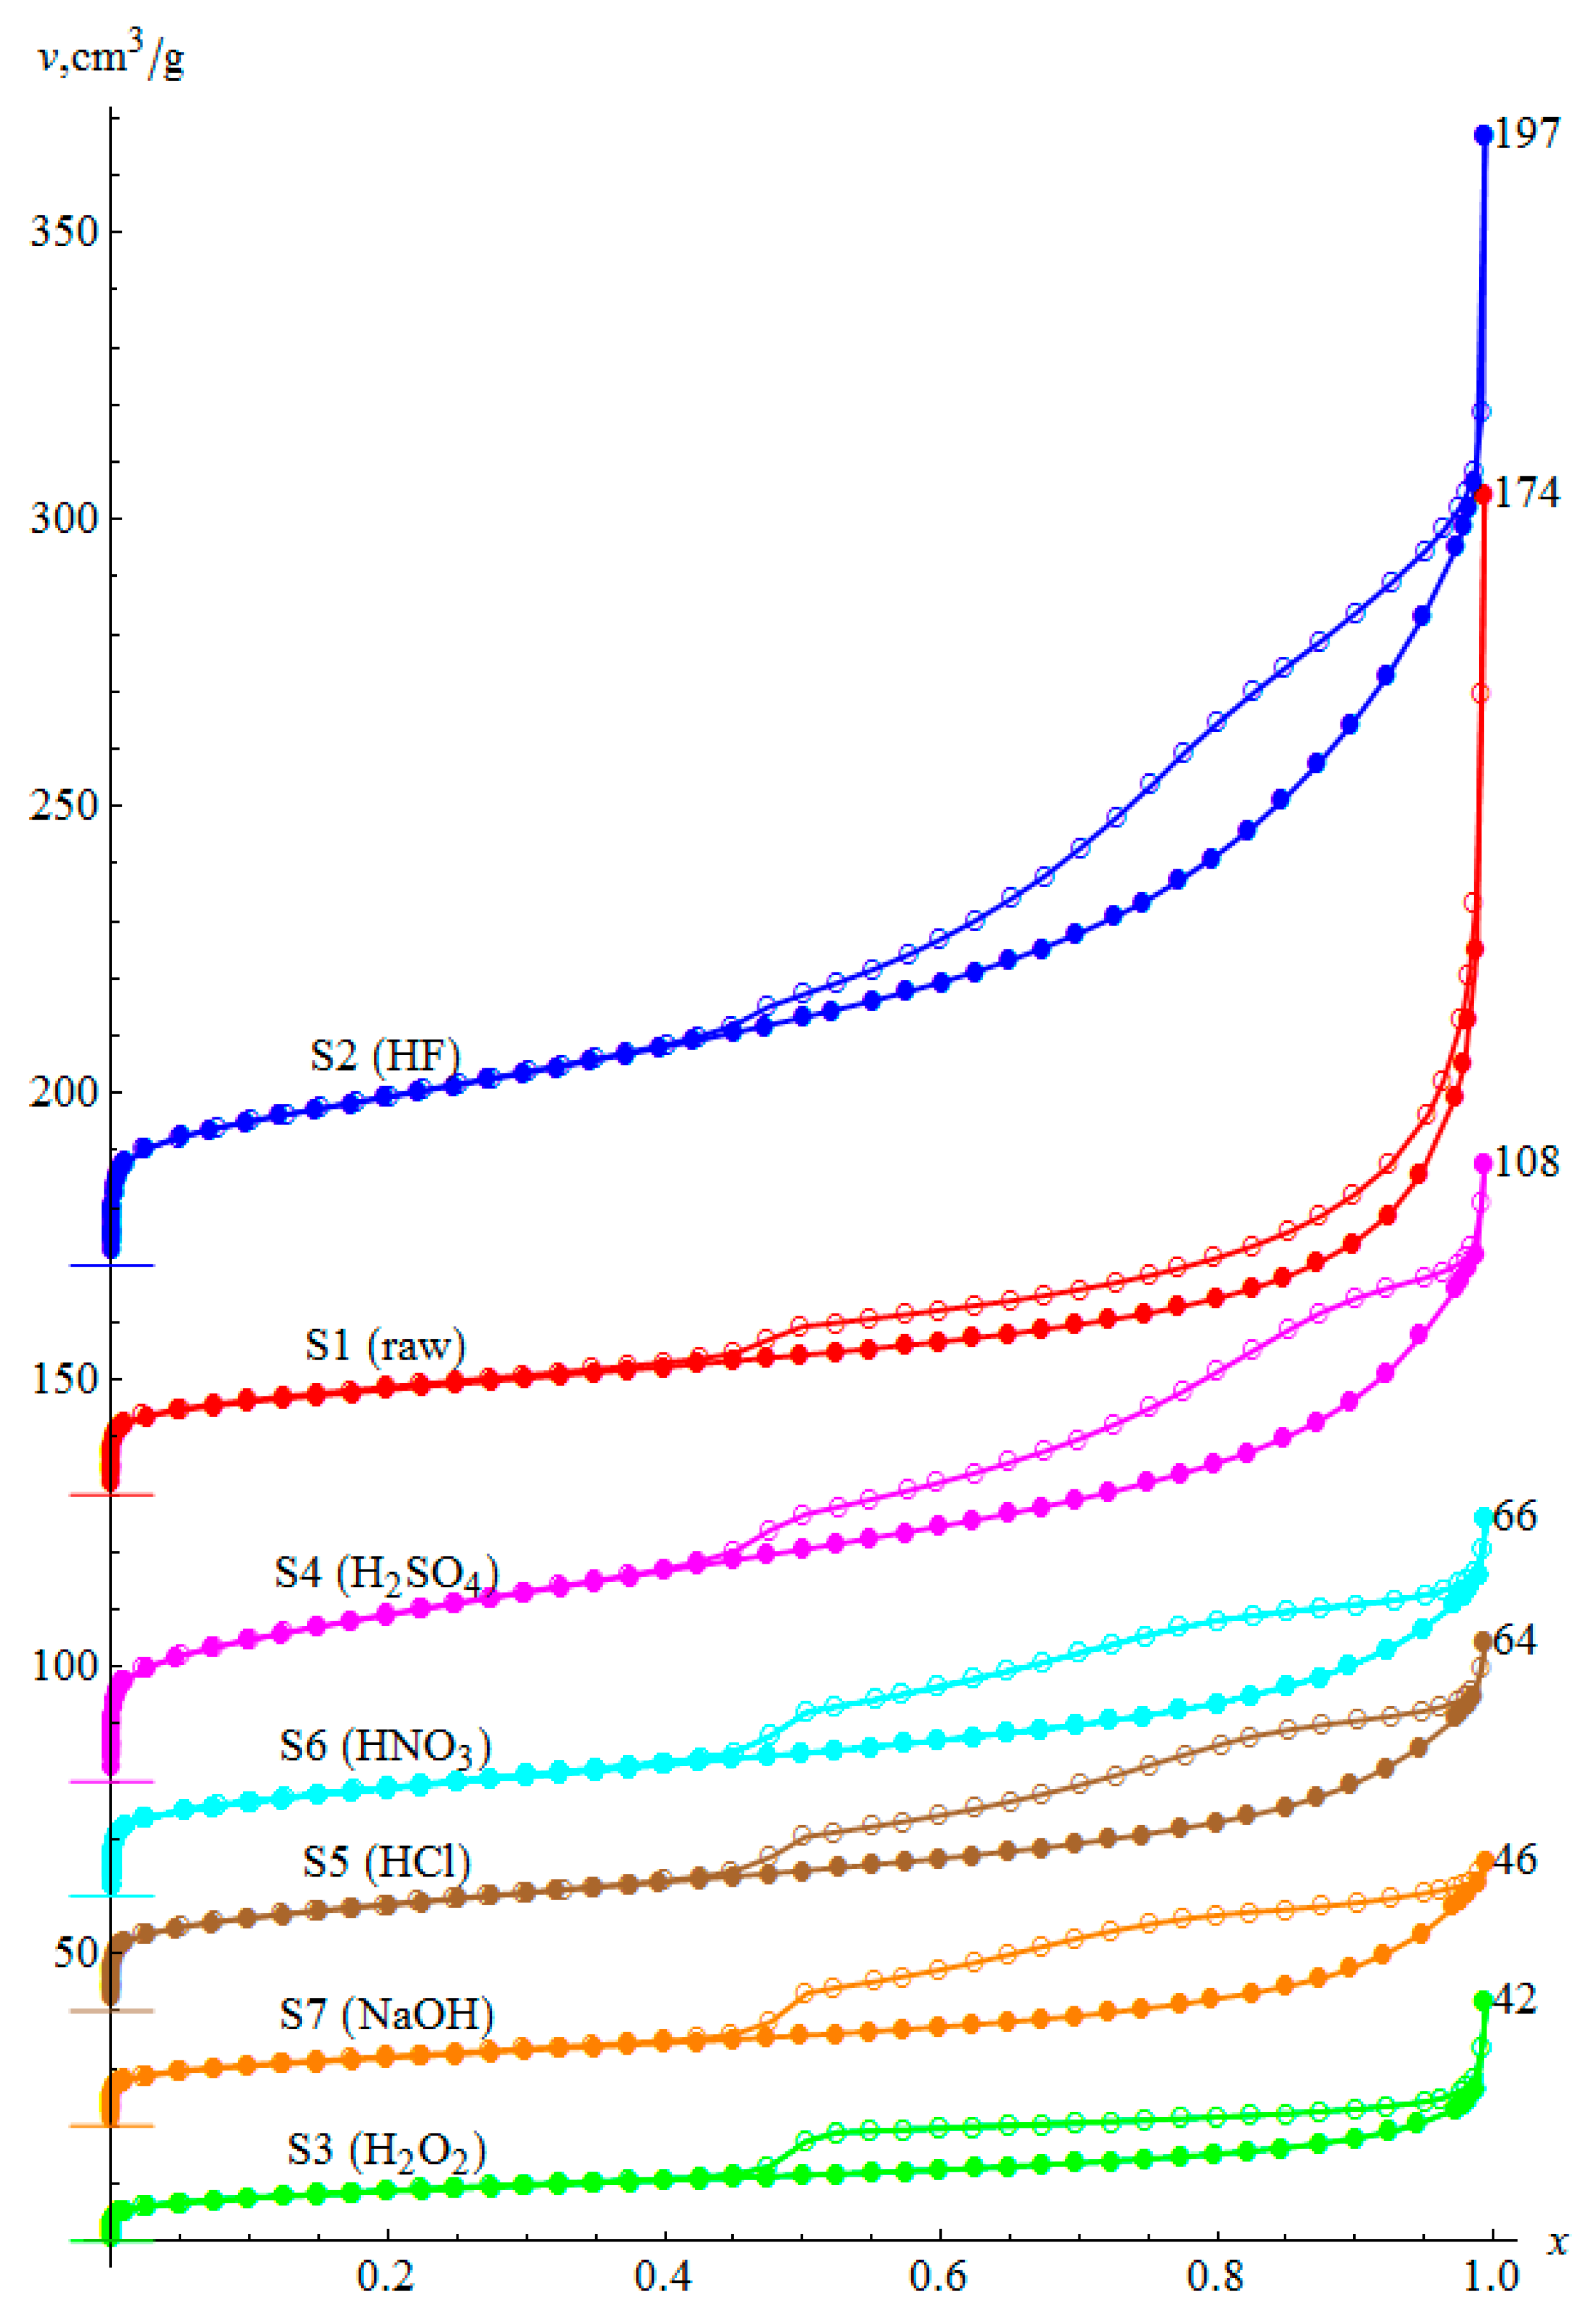
3.2. Nitrogen Adsorption and Desorption Isotherms
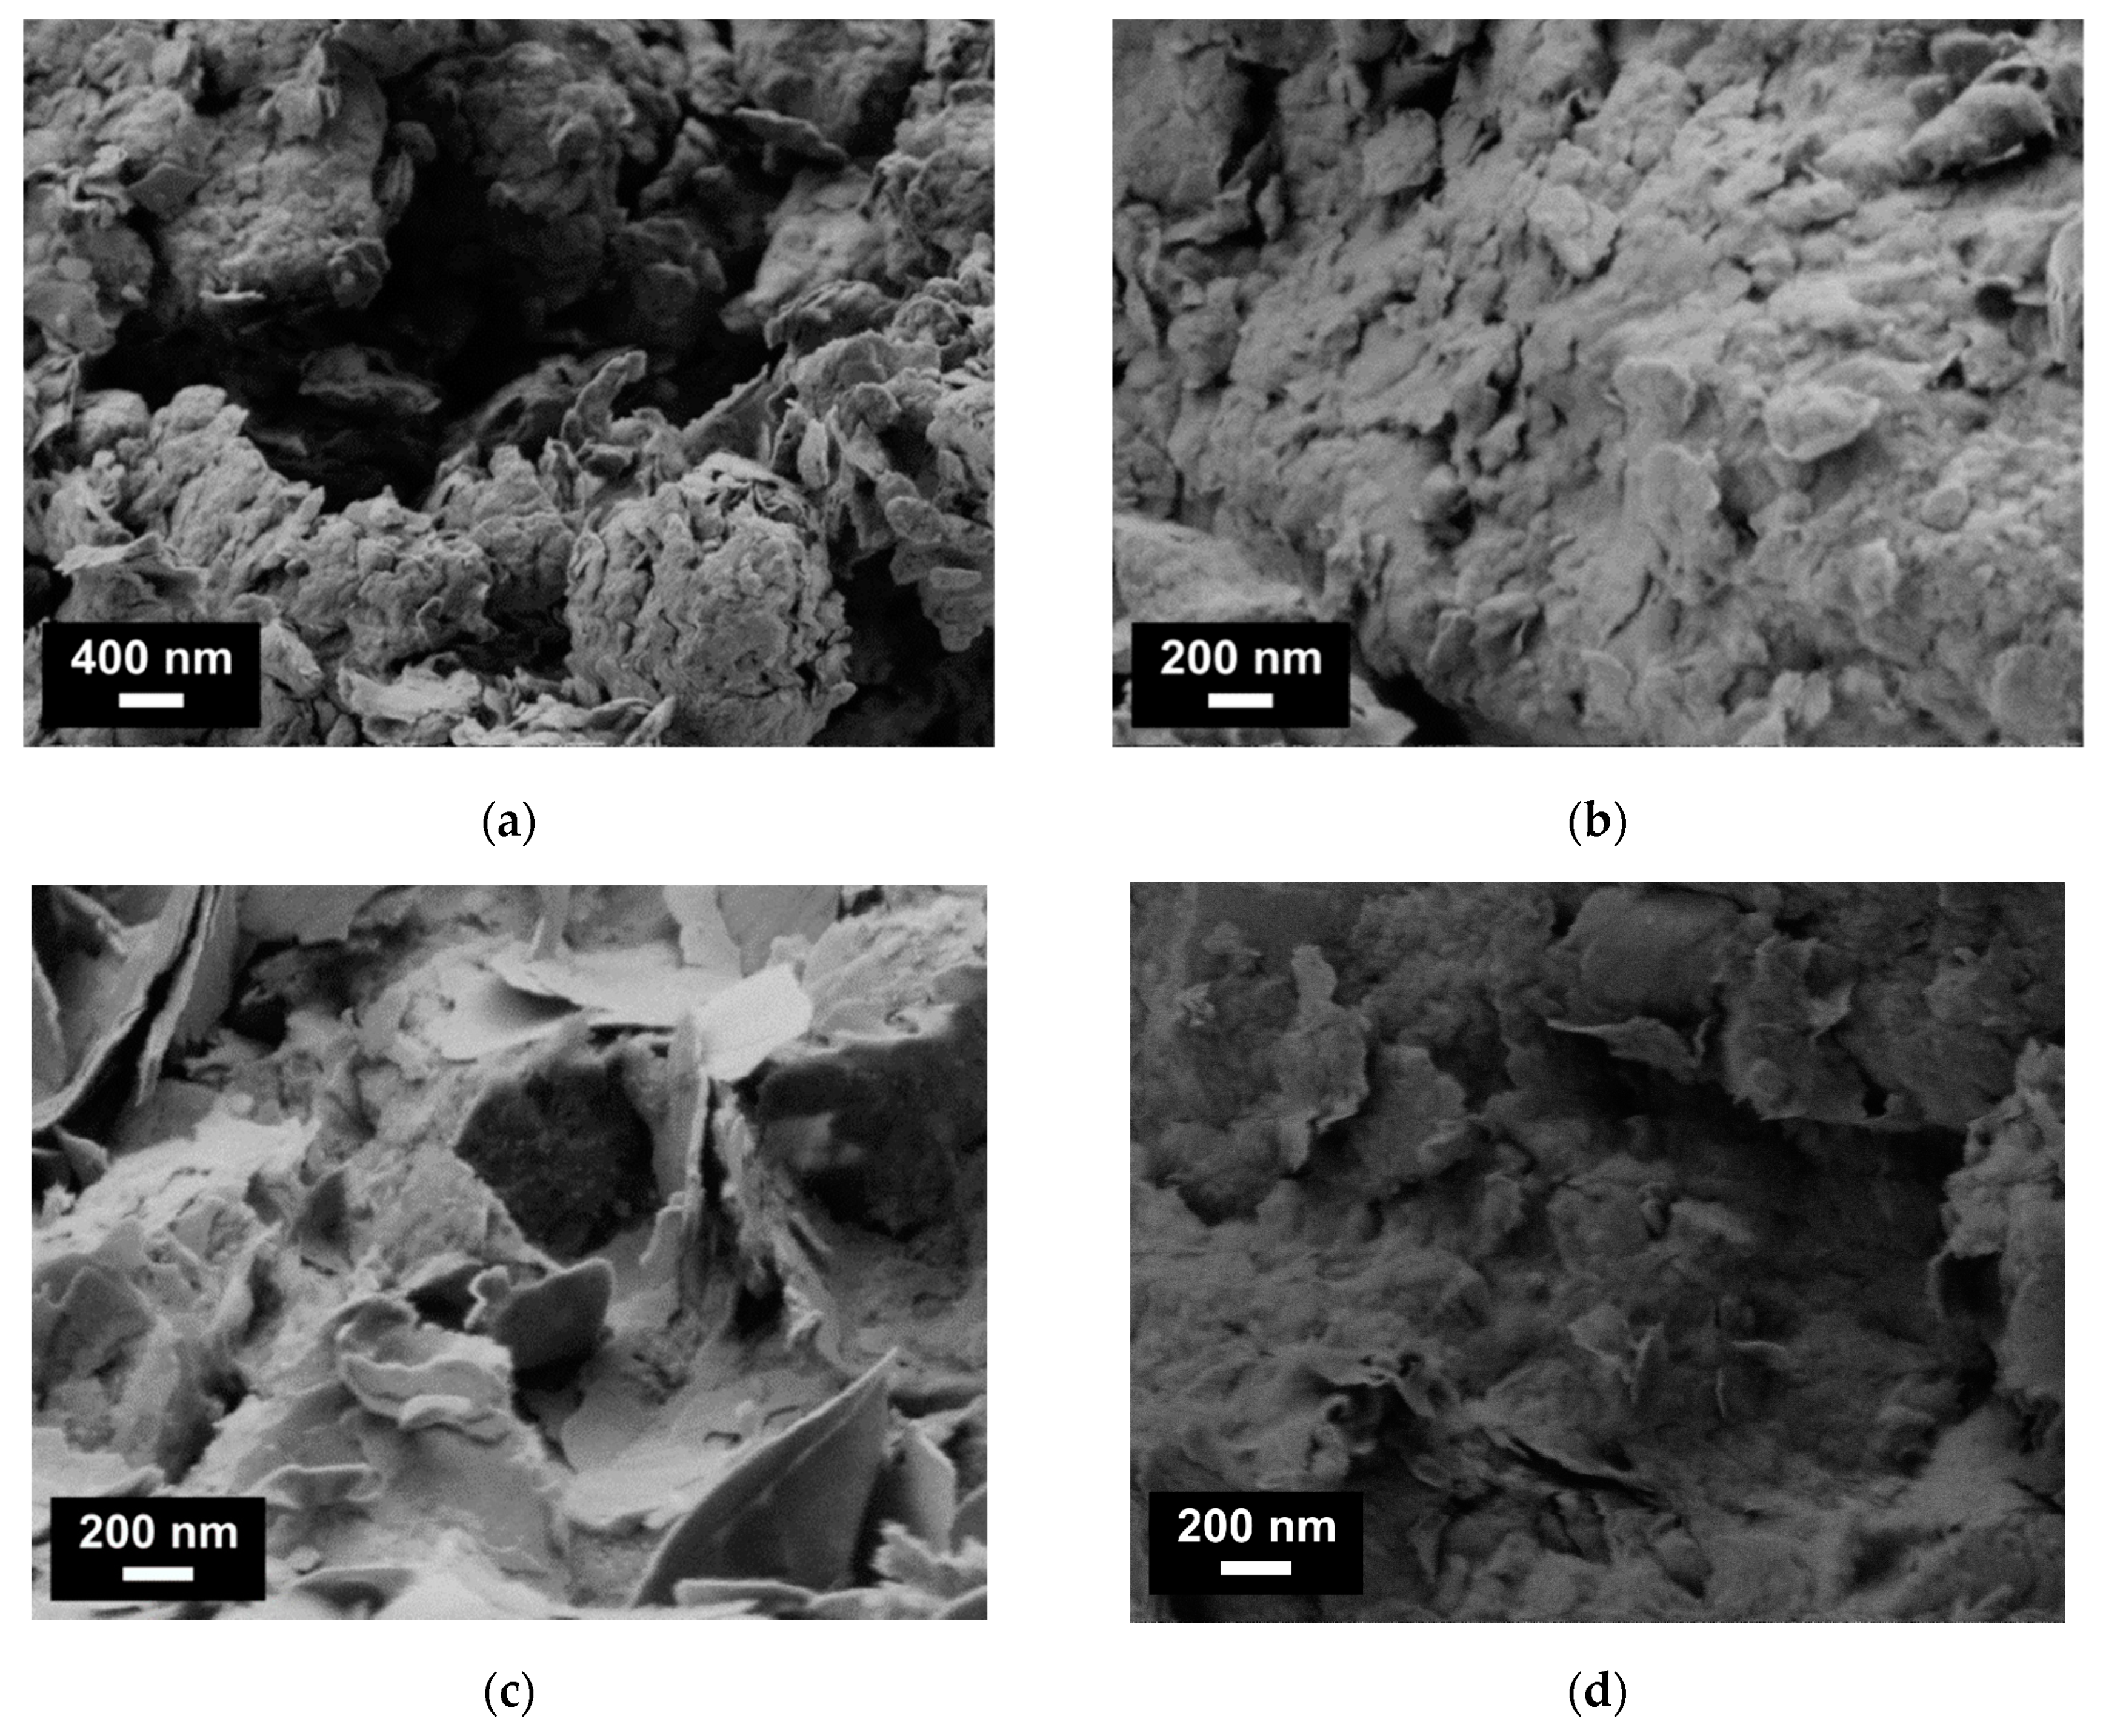
3.3. Morphology
3.4. Specific Surface Area
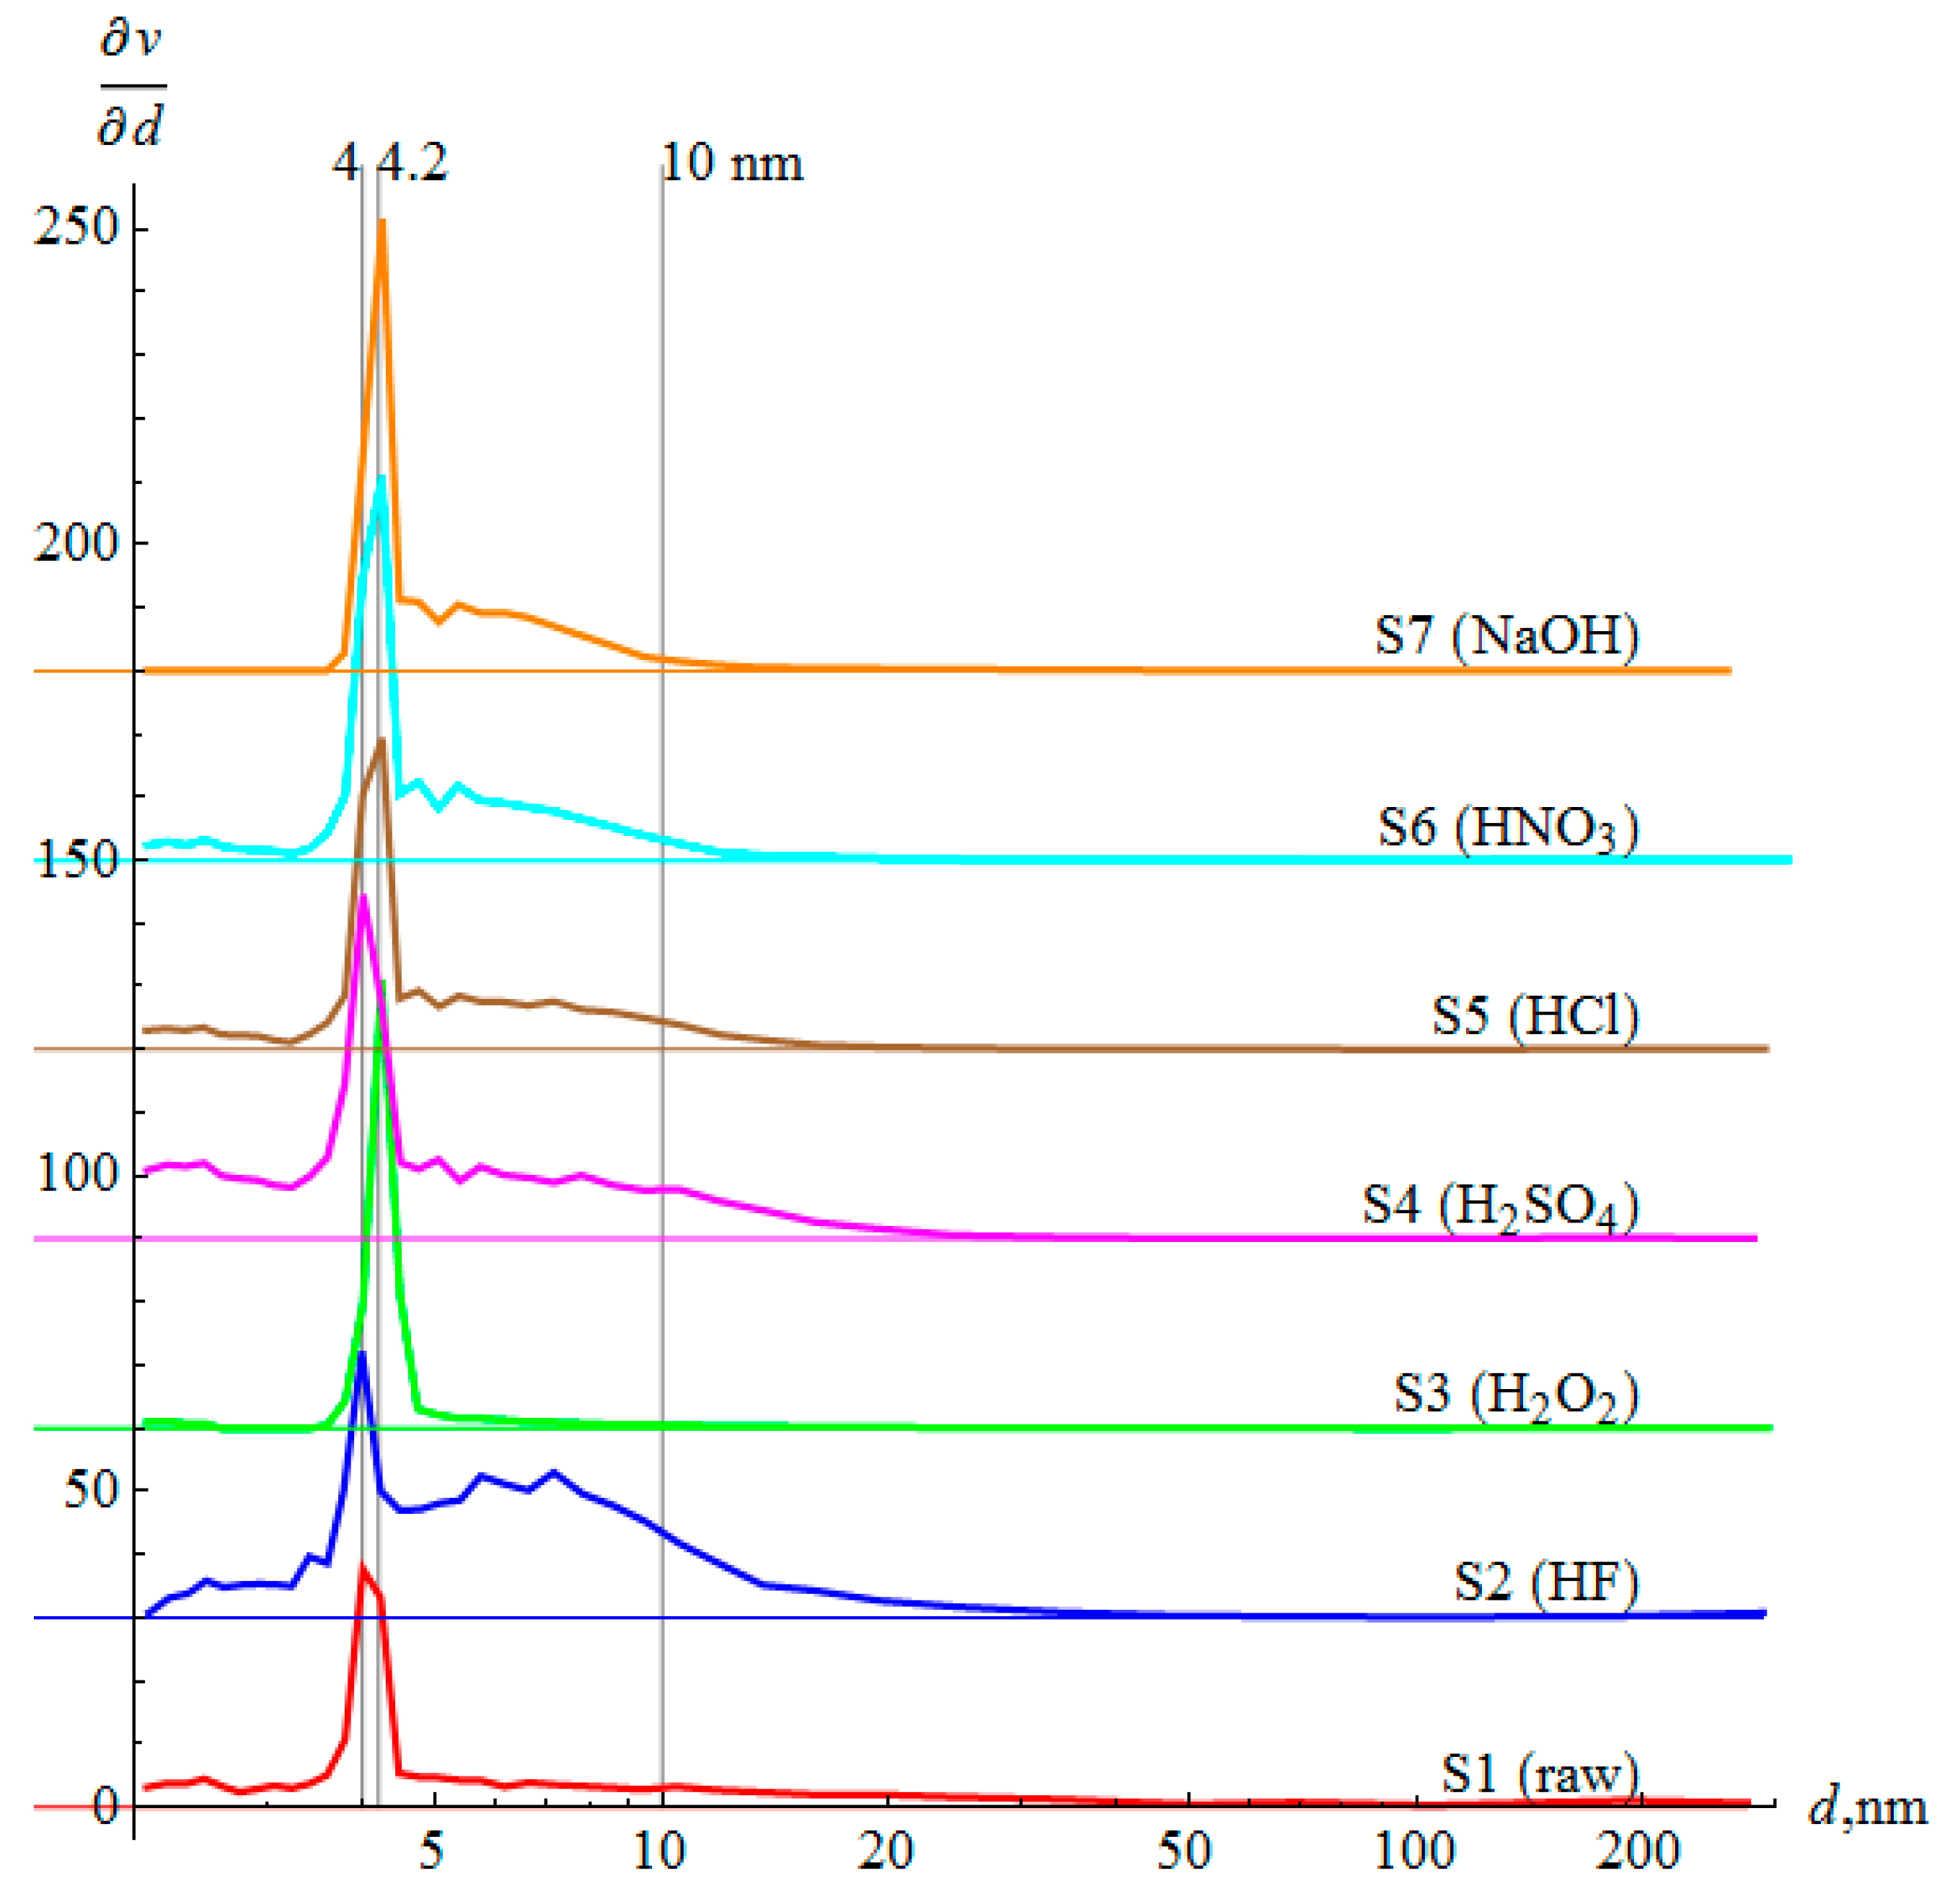
3.5. Mesoporosity
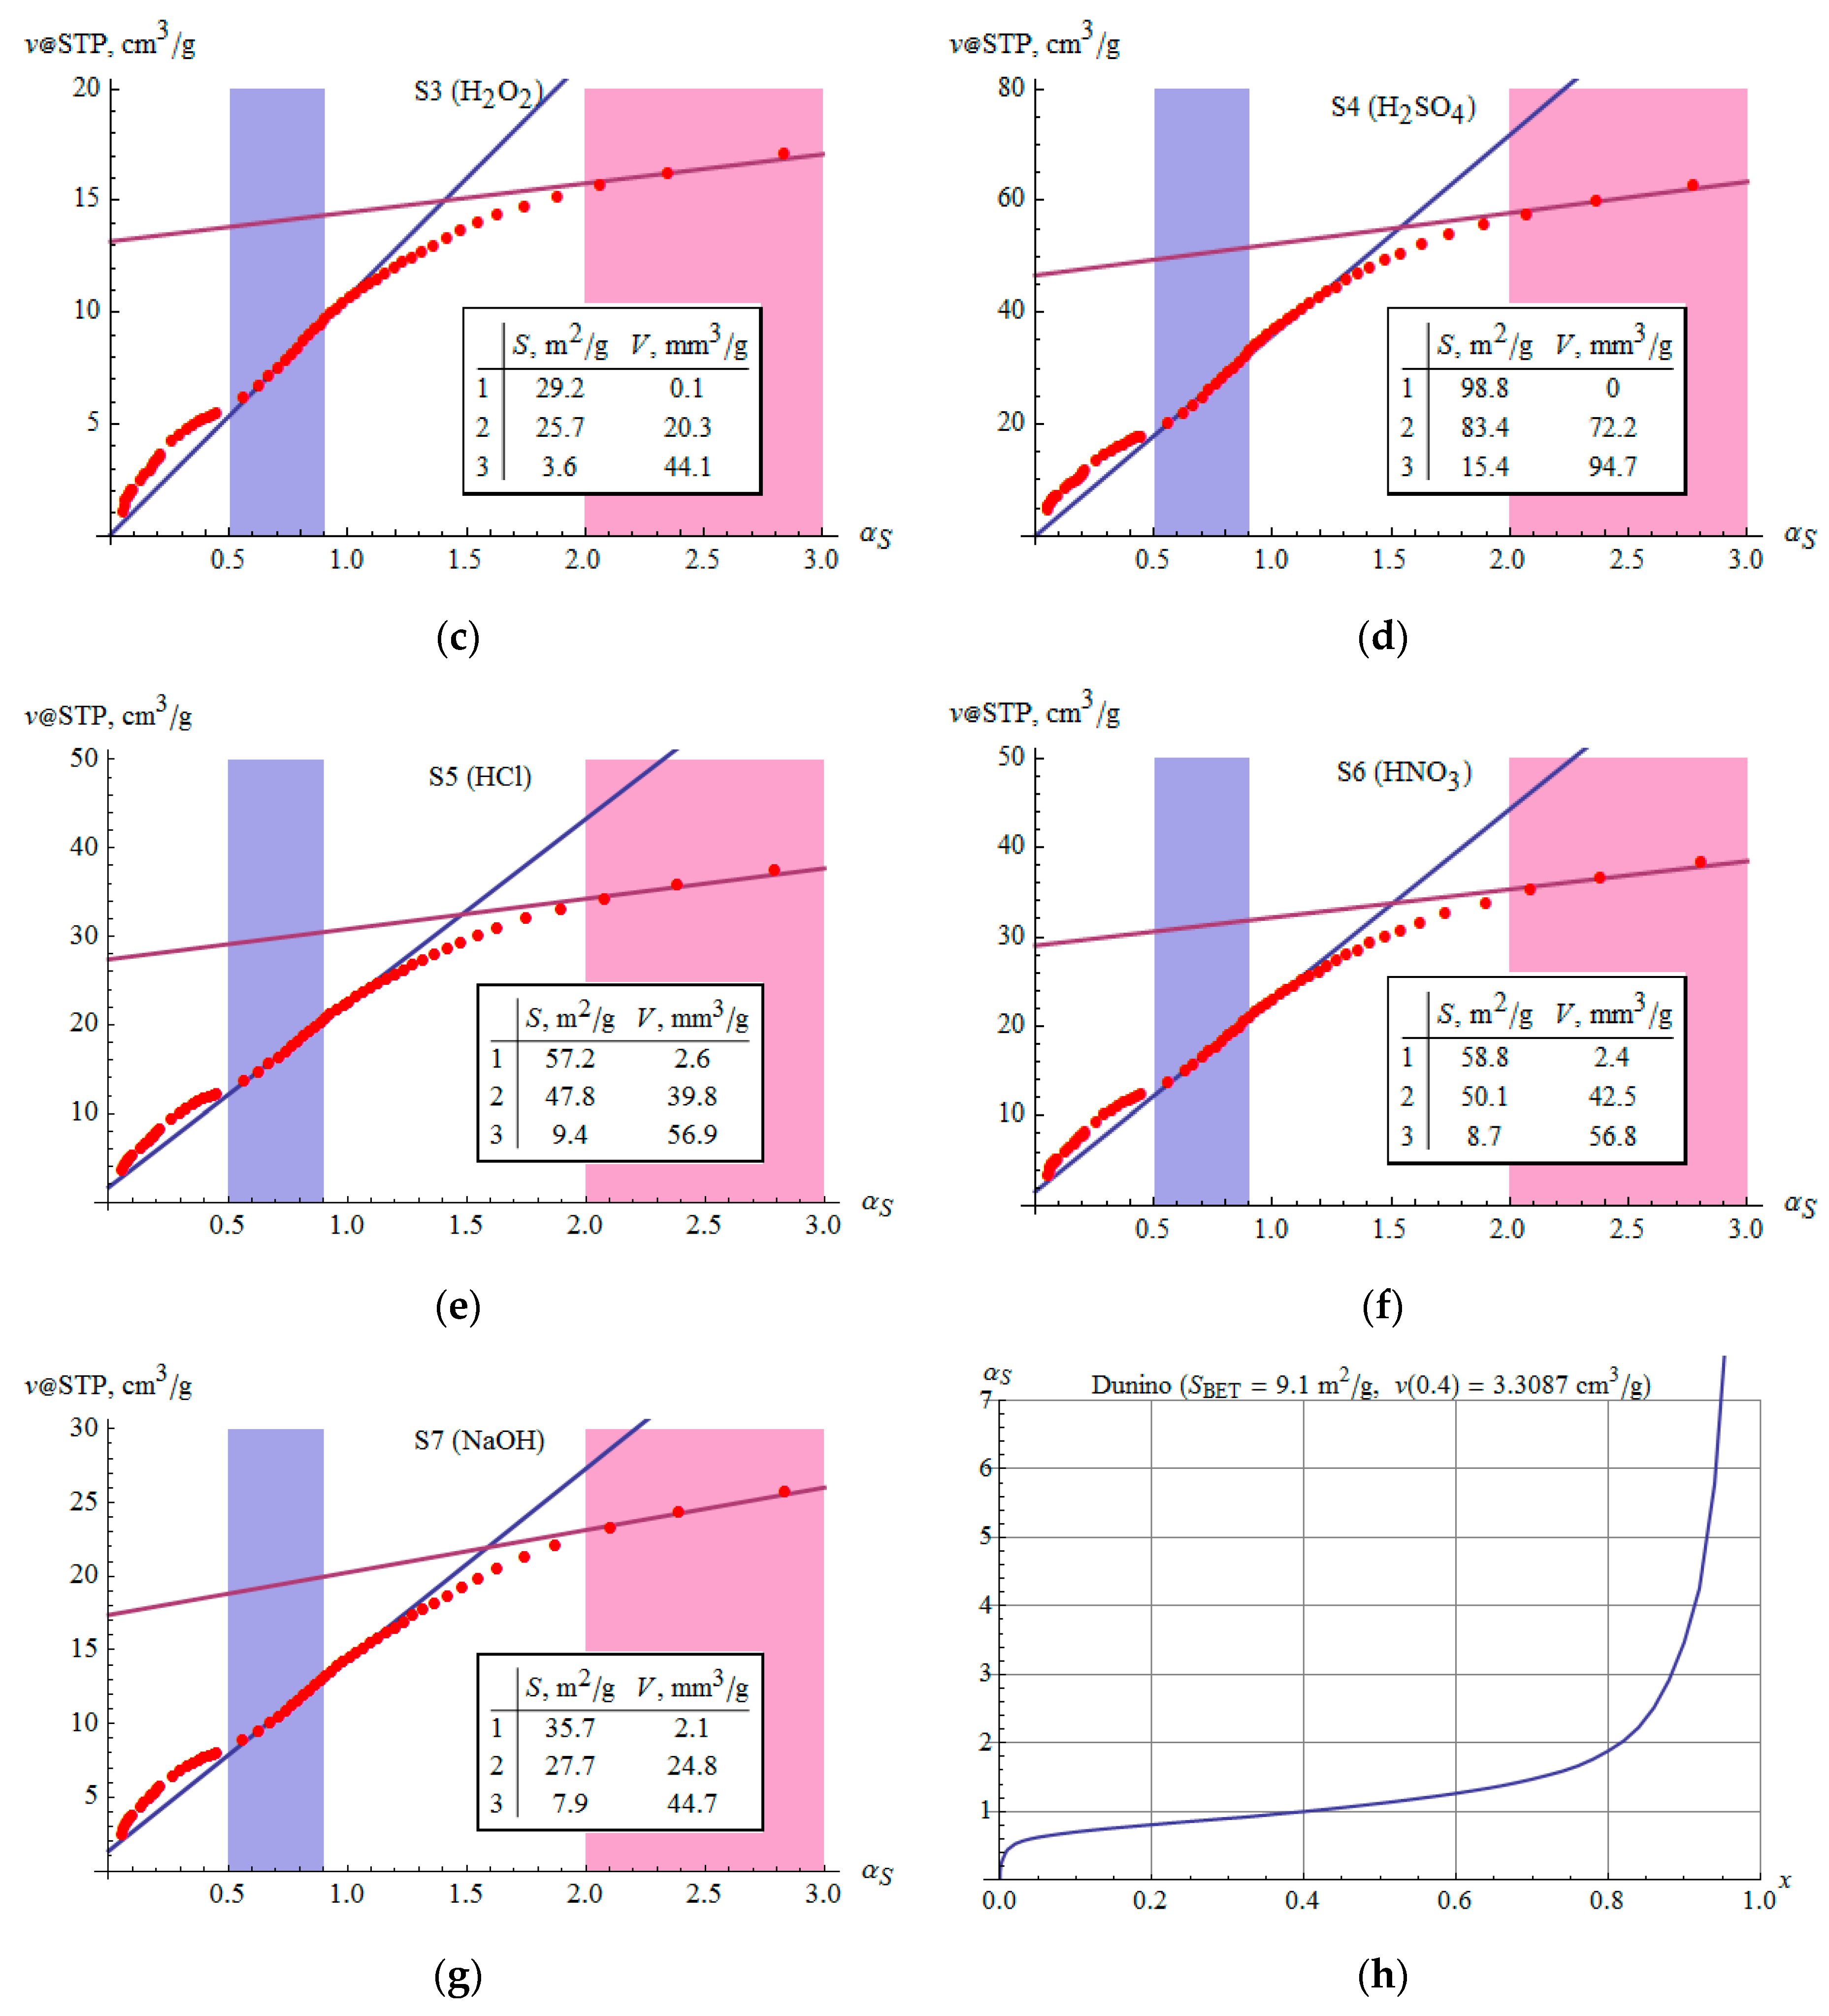
3.6. Microporosity
3.7. Fractal Dimension
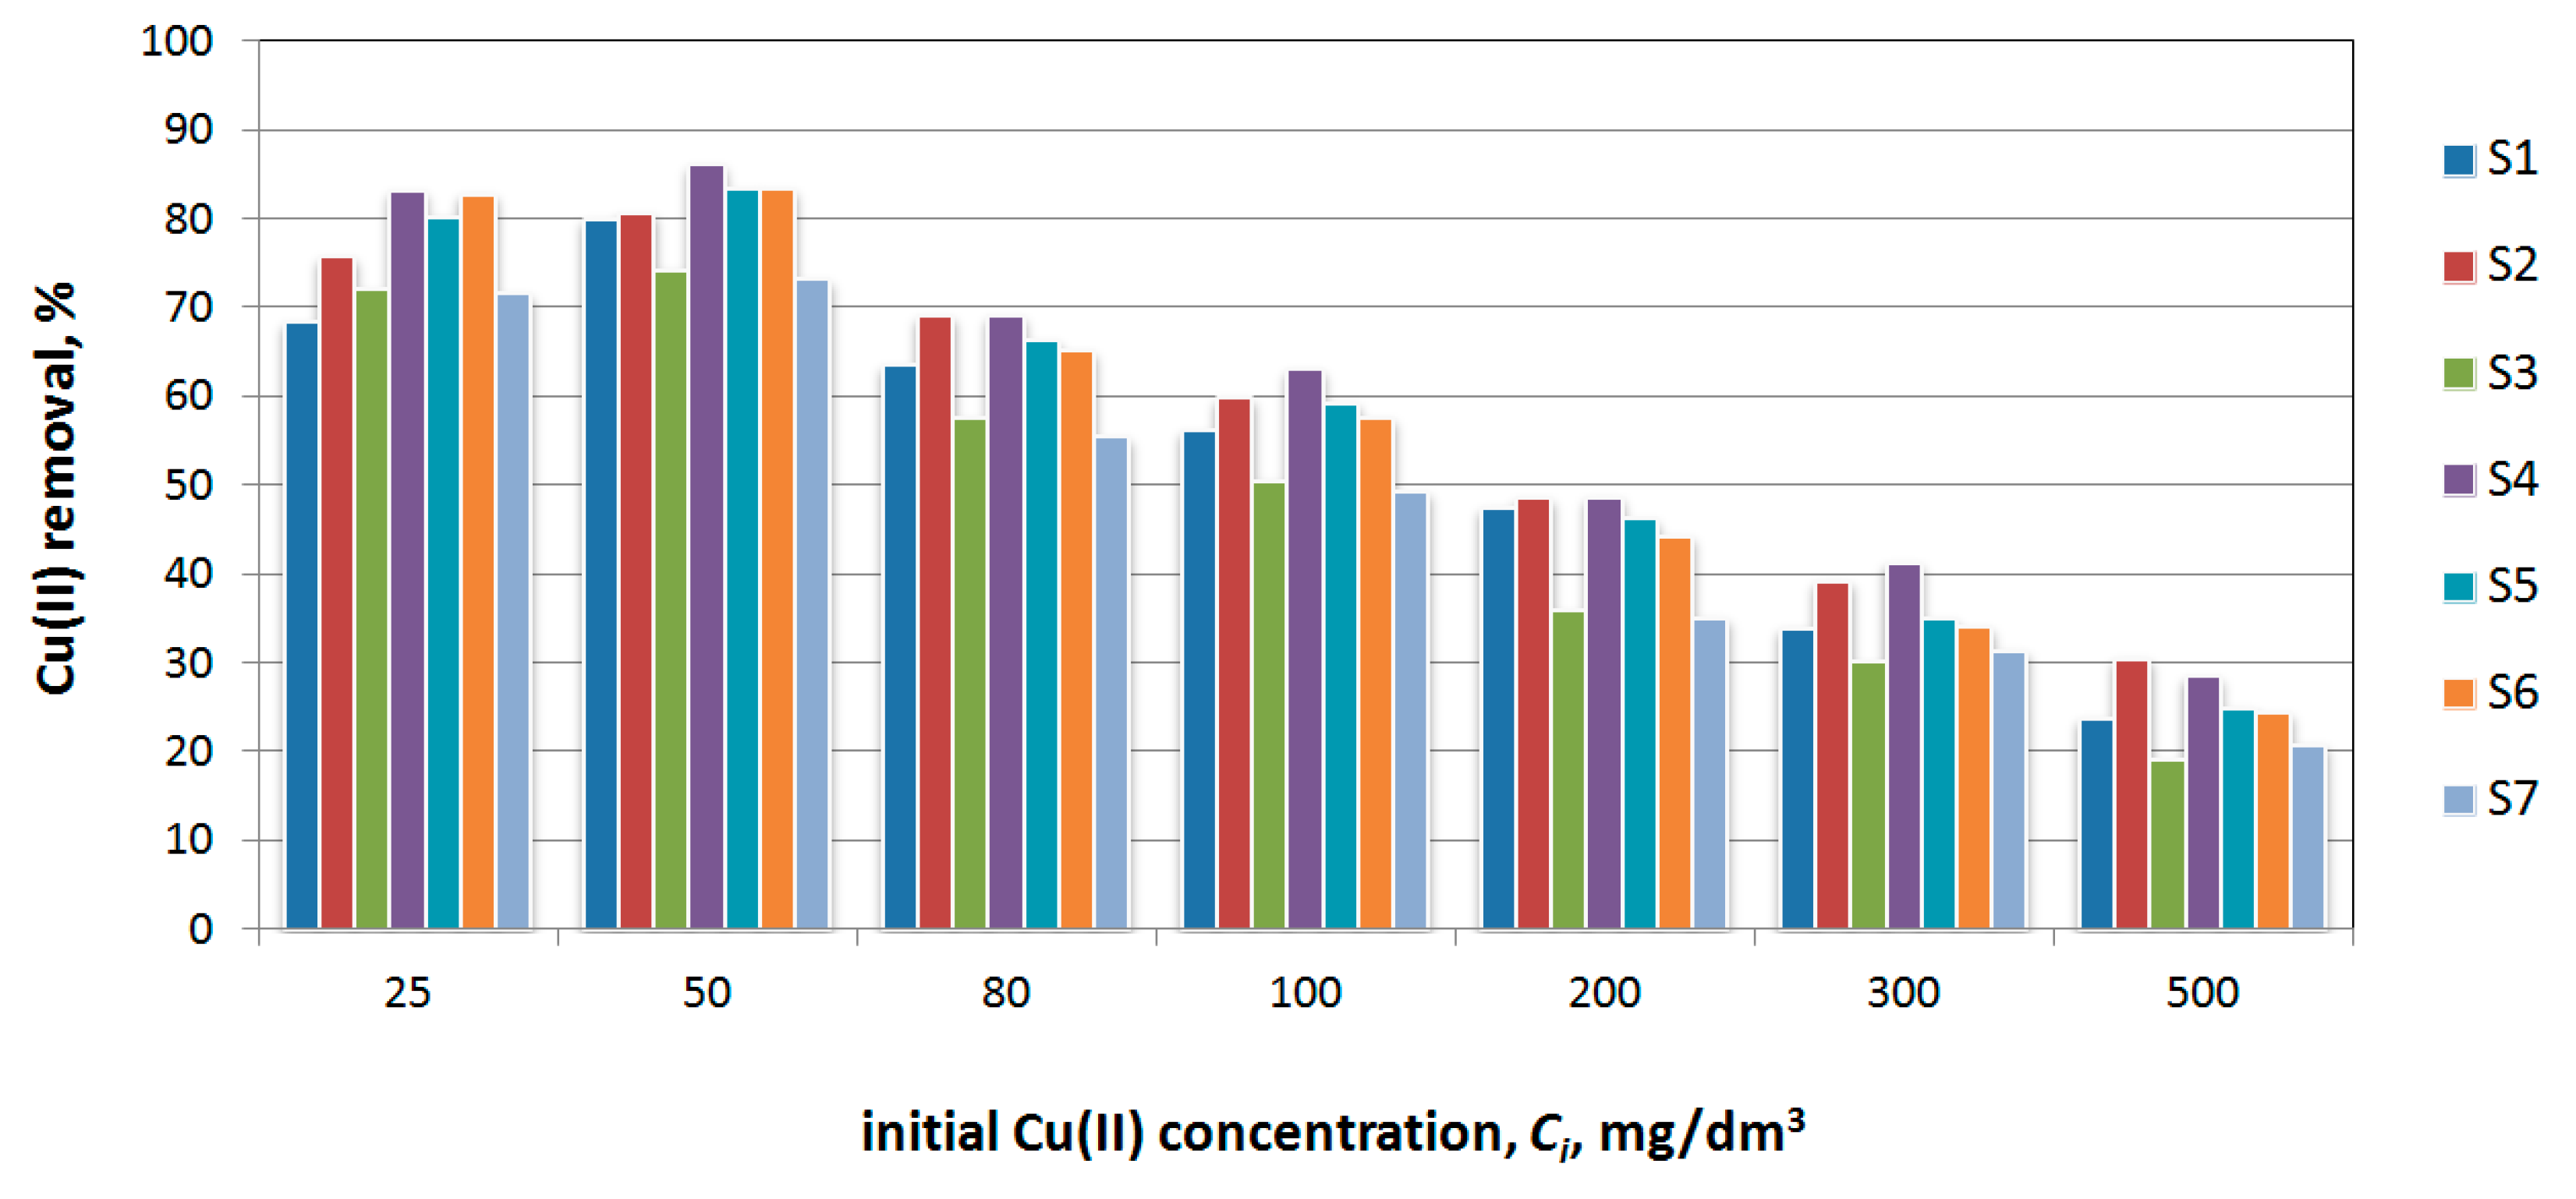
3.8. Cu(II) Sorption
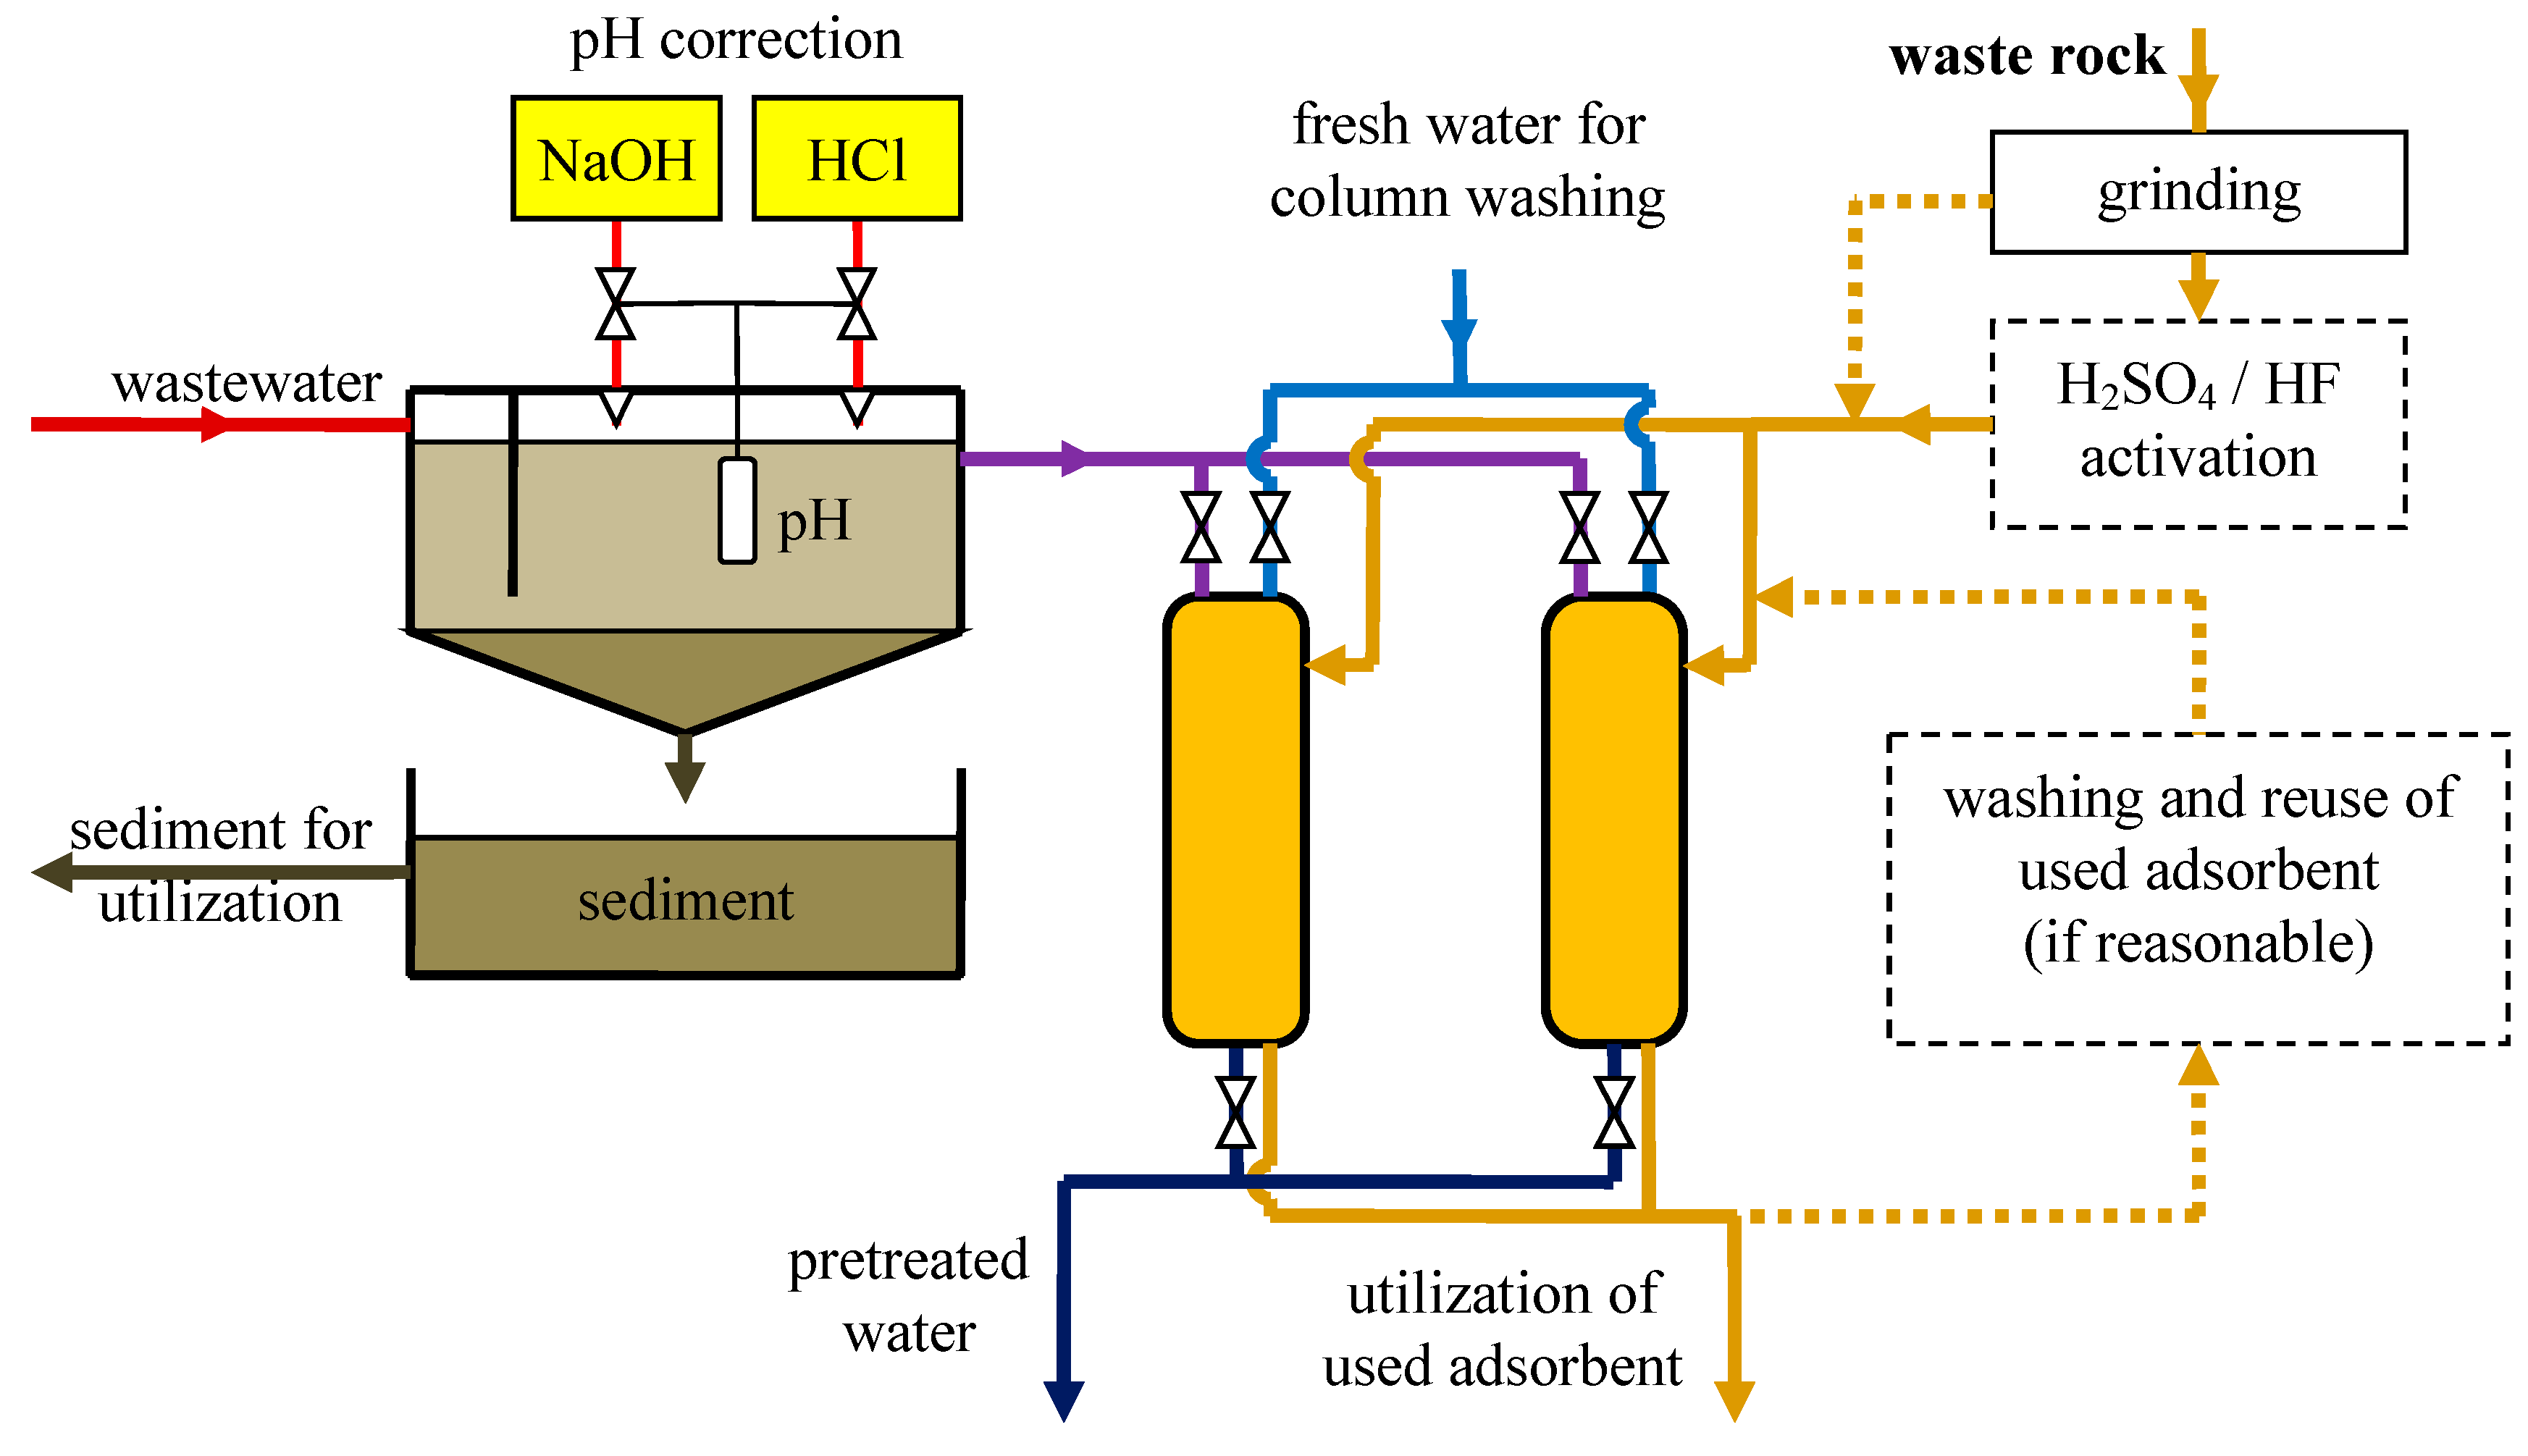
3.9. Industrial Wastewater Pretreatment
4. Conclusions
- Raw clays under testing have an SSA of approximately 66 m2/g; modifications with 1 mol/dm3 HF or H2SO4 increase the SSA over 60%; modifications with 1 mol/dm3 HCl or HNO3 practically do not change the SSA; treatment with 1 mol/dm3 NaOH or H2O2 results in a significant decrease in SSA. The SSA of the tested samples can be described by relations: H2SO4 ≈ HF > HNO3 ≈ HCl ≈ raw > NaO > H2O2.
- Adsorption isotherms (pseudo-second type with H3 hysteresis loop) indicate the presence of non-rigid aggregates, which is typical for some clays.
- Chemical treatment changes the pore size distribution—acids produce small and medium mesopores, NaOH removes small mesopores, and H2O2 comprises the majority of mesopores.
- The volume of micropores according to DR theory corresponds to relations analogous to the SSA. The presence of micropores is also confirmed by αS analysis.
- The fractal dimension of the raw sample is 2.49–2.55. After chemical treatment, it increases to 2.61–2.98.
- Cu(II) sorption results reflect the structural and surface changes in the samples. The highest sorption capacity is obtained for modifications with HF or H2SO4.
- The investigated clays may be considered as prospective inexpensive adsorbents. Two aspects of cleaner production are obtained, in lignite extraction as well as in ion metal removal from specific industrial wastewater. For such a purpose, HF and H2SO4 produce the most favorable changes—they result in a significant increase in SSA, the formation of small and medium mesopores, as well as micropores (according to the DR theory). This shows a reflection in tests of Cu(II) sorption.
Author Contributions
Funding
Acknowledgments
Conflicts of Interest
Appendix A

References
- Ratajczak, T.; Bahranowski, K.; Górniak, K.; Szydłak, T.; Wyszomirski, P. Kopaliny towarzyszące. In Eksploatacja Selektywna Węgla Brunatnego I Kopalin Towarzyszących Wraz Z Uwarunkowaniami Techniczno-Ekonomicznymi I Korzyściami Ekologicznymi; Stryszewski, M., Ed.; Wydawnictwo CPPGSMiE PAN: Cracow, Poland, 1995; pp. 45–74. [Google Scholar]
- Ratajczak, T.; Hycnar, E.; Jończyk, W. Złoże węgla brunatnego Bełchatów a problemy eksploatacji surowców skalnych i ceramicznych. Biul. PIG 2008, 429, 157–161. [Google Scholar]
- Adamczyk, K.; Jończyk, M.W.; Skórzak, A. Kopaliny towarzyszące eksploatacji złoża węgla brunatnego Bełchatów—Historia dokumentowania i zagospodarowania. Kalendarium. Górnictwo Odkryw. 2012, 1–2, 25–41. [Google Scholar]
- Galos, K.; Kot-Niewiadomska, A. Możliwości i perspektywy stosowania surowców ilastych z kopalń węgla brunatnego. Górnictwo Odkryw. 2012, 1–2, 15–19. [Google Scholar]
- Kyzioł-Komosińska, J.; Rosik-Dulewska, C.; Pająk, M.; Czupioł, J.; Dzieniszewska, A.; Krzyżewska, I. Sorption of acid Green 16 from aqueous solution onto low-moor great and smectite clay co-occurring in lignite of Belchatow Mine Field. Annu. Set Environ. Prot. 2015, 17, 165–187. [Google Scholar]
- Jabłońska, B.; Siedlecka, E. Removing heavy metals from wastewaters with use of shales accompanying the coal beds. J. Environ. Manag. 2015, 155, 58–66. [Google Scholar] [CrossRef] [PubMed]
- Jabłońska, B. Sorption of phenol on rock components occurring in mine drainage water sediments. Int. J. Miner. Process. 2012, 104–105, 71–79. [Google Scholar] [CrossRef]
- Zhou, L.; Zhou, H.; Hu, Y.; Yan, S.; Yang, J. Adsorption removal of cationic dyes from aqueous solutions using ceramic adsorbents prepared from industrial waste coal gangue. J. Environ. Manag. 2019, 234, 245–252. [Google Scholar] [CrossRef]
- Ngulube, T.; Gumbo, J.R.; Masindi, V.; Maity, A. An update on synthetic dyes adsorption onto clay based minerals: A state-of-art review. J. Environ. Manag. 2017, 191, 35–57. [Google Scholar] [CrossRef]
- Pernyeszi, T.; Farkas, R.; Kovács, J. Methylene Blue Adsorption Study on Microcline Particles in the Function of Particle Size Range and Temperature. Minerals 2019, 9, 555. [Google Scholar] [CrossRef]
- Cuevas, J.; Dirocie, N.; Yunta, F.; Delgado, C.G.; Santamaría, D.E.G.; Ruiz, A.I.; Fernández, R.; Eymar, E. Evaluation of the Sorption Potential of Mineral Materials Using Tetracycline as a Model Pollutant. Minerals 2019, 9, 453. [Google Scholar] [CrossRef]
- Sprynskyy, M. Heterogeniczność Strukturalna Oraz Właściwości Adsorpcyjne Adsorbentów Naturalnych; Wydawnictwo Naukowe UMK: Toruń, Poland, 2012. [Google Scholar]
- Ding, Z.; Kloprogge, J.T.; Frost, R.L. Porous Clays and Pillared Clays-Based Catalysts. Part 2: A Review of the Catalytic and Molecular Sieve Applications. J. Porous Mater. 2001, 8, 273–293. [Google Scholar] [CrossRef]
- Akri, M.; Achak, O.; Granger, P.; Wang, S.; Batiot-Dupeyrat, C.; Chafik, T. Autothermal reforming of model purified biogas using an extruded monolith: A new catalyst based on nickel incorporated illite clay promoted with MgO. J. Clean. Prod. 2018, 171, 377–389. [Google Scholar] [CrossRef]
- Kooli, F.; Liu, Y.; Hbaieb, K.; Al-Faze, R. Characterization and catalytic properties of porous clay heterostructures from zirconium intercalated clay and its pillared derivatives. Microporous Mesoporous Mater. 2016, 226, 482–492. [Google Scholar] [CrossRef]
- Del Mar Orta, M.; Martín, J.; Medina-Carrasco, S.; Santos, J.L.; Aparicio, I.; Alonso, E. Novel synthetic clays for the adsorption of surfactants from aqueous media. J. Environ. Manag. 2018, 206, 357–363. [Google Scholar] [CrossRef] [PubMed]
- Saleh, T.A.; Tuzen, M.; Sar, A. Polyamide magnetic palygorskite for the simultaneous removal of Hg(II) and methyl mercury; with factorial design analysis. J. Environ. Manag. 2018, 211, 323–333. [Google Scholar] [CrossRef] [PubMed]
- Jackson, T.A. Preferential polymerization and adsorption of L-optical isomers of amino acids relative to D-optical isomers on kaolinite templates. Chem. Geol. 1971, 7, 295–306. [Google Scholar] [CrossRef]
- Banković, P.; Milutinović-Nikolić, A.; Mojović, Z.; Jović-Jovičić, N.; Perović, M.; Spasojević, V.; Jovanović, D. Synthesis and characterization of bentonites rich in beidellite with incorporated Al or Al–Fe oxide pillars. Microporous Mesoporous Mater. 2013, 165, 247–256. [Google Scholar] [CrossRef]
- Directive 2006/21/EC of the European Parliament and of the Council of 15 March 2006 on the Management of Waste from Extractive Industries and Amending Directive 2004/35/EC. Available online: https://eur-lex.europa.eu/legal-content/EN/ALL/?uri=CELEX%3A32006L0021 (accessed on 1 October 2019).
- Helios-Rybicka, E.; Wójcik, R. Competitive sorption/desorption of Zn, Cd, Pb, Ni, Cu, and Cr by clay-bearing mining wastes. Appl. Clay Sci. 2012, 65–66, 6–13. [Google Scholar] [CrossRef]
- Osman, A.I.; Ahmed, A.T.; Johnston, C.R.; Rooney, D.W. Physicochemical characterization of Miscanthus and its application in heavy metals removal from wastewaters. Environ. Prog. Sustain. Energy 2017, 27, 1058–1067. [Google Scholar] [CrossRef]
- Jabłońska, B.; Kityk, A.V.; Busch, M.; Huber, P. The structural and surface properties of natural and modified coal gangue. J. Environ. Manag. 2017, 190, 80–90. [Google Scholar] [CrossRef]
- Lu, P.; Chen, T.; Liu, H.; Li, P.; Peng, S.; Yang, Y. Green Preparation of Nanoporous Pyrrhotite by Thermal Treatment of Pyrite as an Effective Hg(II) Adsorbent: Performance and Mechanism. Minerals 2019, 9, 74. [Google Scholar] [CrossRef]
- Deihimi, N.; Irannajad, M.; Rezai, B. Characterization studies of red mud modification processes as adsorbent for enhancing ferricyanide removal. J. Environ. Manag. 2018, 206, 266–275. [Google Scholar] [CrossRef] [PubMed]
- Leal, P.V.B.; Magriotis, Z.M.; de Sales, P.F.; Papini, R.M.; de Magalhães Viana, P.R. Effect of the acid treatment conditions of kaolinite on etheramine adsorption: A comparative analysis using chemometric tools. J. Environ. Manag. 2017, 197, 393–403. [Google Scholar] [CrossRef] [PubMed]
- Vollprecht, D.; Frühauf, S.; Stocker, K.; Ellersdorfer, M. Ammonium Sorption from Landfill Leachates Using Natural and Modified Zeolites: Pre-Tests for a Novel Application of the Ion Exchanger Loop Stripping Process. Minerals 2019, 9, 471. [Google Scholar] [CrossRef]
- Uddin, M.K. A review on the adsorption of heavy metals by clay minerals, with special focus on the past decade. Chem. Eng. J. 2017, 308, 438–462. [Google Scholar] [CrossRef]
- Gliniak, M.; Sobczyk, W. Zawartość metali toksycznych w glebach na terenach poprodukcyjnych. Przemysł Chem. 2017, 96, 53–57. [Google Scholar] [CrossRef]
- Muyumba, D.K.; Pourret, O.; Liénard, A.; Bonhoure, J.; Mahy, G.; Luhembwe, M.N.; Colinet, G. Mobility of Copper and Cobalt in Metalliferous Ecosystems: Results of a Lysimeter Study in the Lubumbashi Region (Democratic Republic of Congo). J. Geochem. Explor. 2019, 196, 208–218. [Google Scholar] [CrossRef]
- Bartkiewicz, B. Oczyszczanie Ścieków Przemysłowych; Wydawnictwo Naukowe PWN: Warszawa, Poland, 2002. [Google Scholar]
- Kabata-Pendias, A.; Pendias, H. Biogeochemia Pierwiastków Śladowych; Wydawnictwo Naukowe PWN: Warszawa, Poland, 1999. [Google Scholar]
- Komadel, P. Chemically modified smectites. Clay Miner. 2003, 38, 127–138. [Google Scholar] [CrossRef]
- Bergaya, F.; Theng, B.K.G.; Lagaly, G. Modified clays and clay minerals. In Handbook of Clay Science; Bergaya, F., Theng, B.K.G., Lagaly, G., Eds.; Elsevier Science: Amsterdam, The Netherlands, 2006; Volume 1, pp. 261–422. [Google Scholar]
- Kunecki, P.; Panek, R.; Wdowin, M.; Franus, W. Synthesis of faujasite (FAU) and tschernichite (LTA) type zeolites as a potential direction of the development of lime Class C fly ash. Int. J. Miner. Process. 2017, 166, 69–78. [Google Scholar] [CrossRef]
- Espantaleon, A.G.; Nieto, J.A.; Fernandez, M.; Marsal, A. Use of activated clays in the removal of dyes and surfactants from tannery waste waters. Appl. Clay Sci. 2003, 24, 105–110. [Google Scholar] [CrossRef]
- Jozefaciuk, G.; Bowanko, G. Effect of acid and alkali treatments on surface areas and adsorption energies of selected minerals. Clays Clay Miner. 2002, 50, 771–783. [Google Scholar] [CrossRef]
- Al-Jlil, S.A. Adsorption of cobalt ions from waste water on activated Saudi clays. Appl. Water Sci. 2017, 7, 383–391. [Google Scholar] [CrossRef]
- Polish std. PN-ISO 1171:2002P. Paliwa stałe, Oznaczanie popiołu, Wydawnictwa Normalizacyjne, Warszawa. Available online: http://sklep.pkn.pl/pn-iso-1171-2002p.html (accessed on 10 October 2002).
- Choma, J.; Jaroniec, M. Standardowe dane adsorpcji azotu, argonu i benzenu do charakterystyki nanoporowatych adsorbentów krzemionkowych. Ochr. Środowiska 2004, 2, 3–10. [Google Scholar]
- Choma, J.; Zdenkowski, J.A. Standardowe dane adsorpcji azotu do charakterystyki porowatych adsorbentów mineralnych. Ochr. Środowiska 2000, 4, 3–7. [Google Scholar]
- Anvir, D.; Farin, D.; Pfeifer, P. Molecular fractal surfaces. Nature 1984, 308, 261–263. [Google Scholar] [CrossRef]
- Hofmann, T.; Wallacher, D.; Huber, P.; Birringer, R.; Knorr, K.; Schreiber, A.; Findenegg, G.H. Small-angle X-ray diffraction of Kr in mesoporous silica: Effects of microporosity and surface roughness. Phys. Rev. B 2005, 72, 064122. [Google Scholar] [CrossRef]
- Wang, F.; Li, S. Determination of the surface fractal dimension for porous media by capillary condensation. Ind. Eng. Chem. Res. 1997, 5, 1598–1602. [Google Scholar] [CrossRef]
- Lowell, S.; Shields, J.E.; Thomas, M.A.; Thommes, M. Characterization of Porous Solids and Powders: Surface Area, Pore Size and Density; Springer Science + Business Media: New York, NY, USA, 2004. [Google Scholar] [CrossRef]
- Limousin, G.; Gaudet, J.P.; Charlet, L.; Szenknect, S.; Barthès, V.; Krimissa, M. Sorption isotherms: A review on physical bases, modeling and measurement. Appl. Geochem. 2007, 22, 249–275. [Google Scholar] [CrossRef]
- Cañizares, P.; Valverde, J.L.; Sun Kou, M.R.; Molina, C.B. Synthesis and characterization of PILCs with single and mixed oxide pillars prepared from two different bentonites. A comparative study. Microporous Mesoporous Mater. 1999, 29, 267–281. [Google Scholar] [CrossRef]
- Thommes, M.; Kaneko, K.; Neimark, A.V.; Olivier, J.P.; Rodriguez-Reinoso, F.; Rouquerol, J.; Sing, K.S.W. Physisorption of gases, with special reference to the evaluation of surface area and pore size distribution (IUPAC Technical Report). Pure Appl. Chem. 2015, 87, 1051–1069. [Google Scholar] [CrossRef]
- Sing, K.S.W.; Williams, R.T. Physisorption hysteresis loops and the characterization of nanoporous materials. Adsorpt. Sci. Technol. 2004, 22, 773–782. [Google Scholar] [CrossRef]
- Toor, M.; Jin, B. Adsorption characteristics, isotherm, kinetics, and diffusion of modified natural bentonite for removing diazo dye. Chem. Eng. J. 2012, 187, 79–88. [Google Scholar] [CrossRef]
- Arya, V.; Philip, L. Adsorption of pharmaceuticals in water using Fe3O4 coated polymer clay composite. Microporous Mesoporous Mater. 2016, 232, 273–280. [Google Scholar] [CrossRef]
- Bhattacharyya, K.G.; Gupta, S.S. Removal of Cu(II) by natural and acid-activated clays: An insight of adsorption isotherm, kinetic and thermodynamics. Desalination 2011, 272, 66–75. [Google Scholar] [CrossRef]
- Fijał, J.; Klapyta, Z.; Żabiński, W.; Żyła, M. Własności Powierzchniowe Minerałów Ilastych i Możliwości Ich Modyfikacji; Series: Prace Mineralogiczne; Wrocław-Kraków, Zakład Narodowy im. Ossolińskich: Wrocław, Poland, 1980; Volume 65. [Google Scholar]
- Bruckman, K.; Fijał, J.; Haber, J.; Kłapyta, Z.; Wiltowski, T.; Żabiński, W. Influence of different activation methods on the catalytic properties of montmorillonite. Miner. Pol. 1976, 7, 5–14. [Google Scholar]
- Belzunce, M.J.; Mendioroz, S.; Haber, J. Modification of sepiolite by treatment with fluorides: Structural and textural changes. Clays Clay Miner. 1998, 46, 603–614. [Google Scholar] [CrossRef]
- Madejová, J.; Bujdák, J.; Janek, M.; Komadel, P. Comparative FT-IR study of structural modifications during acid treatment of dioctahedral smectites and hectorite. Spectrochim. Acta Part A Mol. Biomol. Spectrosc. 1998, 54, 1397–1406. [Google Scholar] [CrossRef]
- Komadel, P.; Madejová, J. Acid activation of clay minerals. In Handbook of Clay Science; Bergaya, F., Theng, B.K.G., Lagaly, G., Eds.; Elsevier: Amsterdam, The Netherlands, 2006; pp. 263–288. [Google Scholar]
- Rassineux, F.; Griffault, L.; Meunier, A.; Berger, G.; Petit, S.; Vieillard, P.; Zellagui, R.; Munoz, M. Expandability-layer stacking relationship during experimental alteration of a Wyoming bentonite in pH 13.5 solutions at 35 and 60 °C. Clay Miner. 2001, 36, 197–210. [Google Scholar] [CrossRef]
- Melo, J.D.D.; de Carvalho Costa, T.C.; de Medeiros, A.M.; Paskocimas, C.A. Effects of thermal and chemical treatments on physical properties of kaolinite. Ceram. Int. 2010, 36, 33–38. [Google Scholar] [CrossRef]
- Petri, B.G.; Watts, R.J.; Teel, A.L.; Huling, S.G.; Brown, R.A. Fundamentals of ISCO using hydrogen peroxide. In In Situ Chemical Oxidation for Groundwater Remediation; Siegrist, R.L., Crimi, M., Simpkin, T.J., Eds.; Springer Science + Business Media: New York, NY, USA, 2011; pp. 33–88. [Google Scholar] [CrossRef]
- Ratajczak, T.; Hycnar, E.; Bożęcki, P. The beidellite clays from the Bełchatów lignite deposit as a raw material for constructing waterproofing barriers. Gospod. Surowcami Miner. Miner. Res. Manag. 2017, 33, 53–68. [Google Scholar] [CrossRef]
- Demiral, H.; Güngör, C. Adsorption of copper (II) from aqueous solutions on activated carbon prepared from grape bagasse. J. Clean. Prod. 2016, 124, 103–113. [Google Scholar] [CrossRef]
- Ben-Ali, S.; Jaouali, I.; Souissi-Najar, S.; Ouederni, A. Characterization and adsorption capacity of raw pomegranate peel biosorbent for copper removal. J. Clean. Prod. 2017, 142, 3809–3821. [Google Scholar] [CrossRef]
- Sen Gupta, S.; Bhattacharyya, K.G. Influence of acid activation on adsorption of Ni(II) and Cu(II) on kaolinite and montmorillonite: Kinetic and thermodynamic study. Chem. Eng. J. 2008, 136, 1–13. [Google Scholar]
- Mu’azu, N.D.; Bukhari, A.; Munef, K. Effect of montmorillonite content in natural Saudi Arabian clay on its adsorptive performance for single aqueous uptake of Cu(II) and Ni(II). J. King Saud Univ. Sci. 2018. [Google Scholar] [CrossRef]
- Bansal, R.C.; Goyal, M. Activated Carbon Adsorption; CRC Press, Taylor & Francis Group: Boca Raton, FL, USA, 2005. [Google Scholar]


| Component | SiO2 | Al2O3 | Fe2O3 | CaO | MgO | Na2O | K2O | MnO | P2O5 | TiO2 | SO3 | LOI |
|---|---|---|---|---|---|---|---|---|---|---|---|---|
| wt % | 56.1 | 23.2 | 4.05 | 2.7 | 0.97 | 1.4 | 0.47 | 0.97 | 0.17 | 0.03 | 0.08 | 9.2 |
| Parameter | S1 (Raw) | S2 (HF) | S3 (H2O2) | S4 (H2SO4) | S5 (HCl) | S6 (HNO3) | S7 (NaOH) |
|---|---|---|---|---|---|---|---|
| 0.997 | 0.994 | 0.995 | 0.994 | 0.994 | 0.995 | 0.996 | |
| , nm | 295 | 319 | 375 | 300 | 317 | 377 | 463 |
| , mm3/g a | 270 | 305 | 65 | 167 | 99 | 102 | 72 |
| ( = 0.99), mm3/g a,b | 165 | 227 | 43 | 146 | 88 | 87 | 66 |
| Parameter | S1 (Raw) | S2 (HF) | S3 (H2O2) | S4 (H2SO4) | S5 (HCl) | S6 (HNO3) | S7 (NaOH) |
|---|---|---|---|---|---|---|---|
| , m2/g | 66.1(1) | 105.8(1) | 32.0(1) | 106.5(1) | 67.0(1) | 67.9(1) | 42.8(1) |
| , cm3/g (STP) | 15.18(1) | 24.30(1) | 7.36(1) | 24.48(1) | 15.40(1) | 15.61(1) | 9.83(1) |
| 3.1(1) | 4.4(1) | 3.0(1) | 3.6(1) | 3.1(1) | 3.2(1) | 3.1(1) | |
| 226(5) | 122(3) | 97(2) | 91(2) | 165(3) | 173(4) | 183(3) |
| Parameter | S1 (Raw) | S2 (HF) | S3 (H2O2) | S4 (H2SO4) | S5 (HCl) | S6 (HNO3) | S7 (NaOH) |
|---|---|---|---|---|---|---|---|
| Pore size | |||||||
| Dominant size, nm | 4.0 | 4.0 | 4.2 | 4.0 | 4.2 | 4.2 | 4.2 |
| Average size a, nm | 15.2 | 9.9 | 7.1 | 5.5 | 5.5 | 5.5 | 6.2 |
| Average size b, nm | 16.3 | 11.5 | 8.1 | 6.3 | 5.9 | 6.0 | 6.7 |
| Pore volume | |||||||
| Total, mm3/g | 269.5 | 305.1 | 64.5 | 166.9 | 99.3 | 101.8 | 71.6 |
| Cumulative, mm3/g | 269.6 | 320.1 | 68.3 | 180.6 | 105.0 | 108.2 | 78.9 |
| macropores | 177.9 | 113.1 | 28.3 | 31.2 | 18.6 | 21.5 | 8.6 |
| mesopores | 85.3 | 201.3 | 37.8 | 136.4 | 79.1 | 80.0 | 70.1 |
| micropores c | 6.4 | 5.7 | 2.2 | 13.1 | 7.3 | 6.7 | 0.2 |
| Pore surface area | |||||||
| BET, m2/g | 66.1 | 105.8 | 32.0 | 106.5 | 67.0 | 67.9 | 42.8 |
| Cumulative, m2/g | 70.7 | 129.2 | 38.5 | 131.0 | 76.8 | 79.4 | 50.5 |
| macropores | 4.7 | 2.1 | 0.6 | 0.7 | 0.5 | 0.5 | 0.2 |
| mesopores | 46.8 | 107.8 | 31.2 | 92.8 | 54.6 | 58.7 | 49.5 |
| micropores c | 19.2 | 19.2 | 6.7 | 37.4 | 21.7 | 20.1 | 0.8 |
| Quantity | S1 (Raw) | S2 (HF) | S3 (H2O2) | S4 (H2SO4) | S5 (HCl) | S6 (HNO3) | S7 (NaOH) |
|---|---|---|---|---|---|---|---|
| DR theory | |||||||
| , mm3/g | 24.7(4) | 36.9(8) | 12.1(2) | 36.5(7) | 23.9(4) | 25.0(4) | 15.8(2) |
| t-plot | |||||||
| , mm3/g | 6.6(2) | 3.9(2) | 1.3(1) | 2.3(1) | 4.7(3) | 4.8(3) | 3.7(2) |
| , m2/g | 39.9(5) | 75.8(5) | 22.3(2) | 78.1(3) | 44.0(6) | 44.6(6) | 26.8(3) |
| , m2/g | 21.5(6) | 27.4(6) | 7.2(3) | 23.6(4) | 18.4(7) | 19.3(7) | 13.0(4) |
| Quantity | S1 (raw) | S2 (HF) | S3 (H2O2) | S4 (H2SO4) | S5 (HCl) | S6 (HNO3) | S7 (NaOH) |
|---|---|---|---|---|---|---|---|
| 2.49(1) | 2.72(1) | 2.61(2) | 2.75(1) | 2.74(1) | 2.76(1) | 2.75(1) | |
| 2.55(1) | 2.84(3) | 2.58(6) | 2.89(3) | 2.92(4) | 2.93(4) | 2.98(3) |
| Parameter | S1 (Raw) | S2 (HF) | S3 (H2O2) | S4 (H2SO4) | S5 (HCl) | S6 (HNO3) | S7 (NaOH) |
|---|---|---|---|---|---|---|---|
| Freundlich isotherm | |||||||
| 1.4(4) | 1.4(3) | 1.4(3) | 1.9(3) | 1.8(3) | 1.9(3) | 1.3(2) | |
| 0.43(7) | 0.46(5) | 0.38(5) | 0.40(4) | 0.38(5) | 0.36(4) | 0.41(4) | |
| 0.871 | 0.943 | 0.926 | 0.943 | 0.933 | 0.948 | 0.945 | |
| Langmuir isotherm | |||||||
| 16.4(7) | 21(1) | 13.0(5) | 19(1) | 16.7(7) | 16.2(8) | 14.4(9) | |
| 0.022(4) | 0.017(4) | 0.025(4) | 0.025(5) | 0.027(5) | 0.027(6) | 0.019(4) | |
| 0.992 | 0.976 | 0.993 | 0.987 | 0.990 | 0.987 | 0.983 | |
© 2019 by the authors. Licensee MDPI, Basel, Switzerland. This article is an open access article distributed under the terms and conditions of the Creative Commons Attribution (CC BY) license (http://creativecommons.org/licenses/by/4.0/).
Share and Cite
Jabłońska, B.; Busch, M.; Kityk, A.V.; Huber, P. Natural and Chemically Modified Post-Mining Clays—Structural and Surface Properties and Preliminary Tests on Copper Sorption. Minerals 2019, 9, 704. https://doi.org/10.3390/min9110704
Jabłońska B, Busch M, Kityk AV, Huber P. Natural and Chemically Modified Post-Mining Clays—Structural and Surface Properties and Preliminary Tests on Copper Sorption. Minerals. 2019; 9(11):704. https://doi.org/10.3390/min9110704
Chicago/Turabian StyleJabłońska, Beata, Mark Busch, Andriy V. Kityk, and Patrick Huber. 2019. "Natural and Chemically Modified Post-Mining Clays—Structural and Surface Properties and Preliminary Tests on Copper Sorption" Minerals 9, no. 11: 704. https://doi.org/10.3390/min9110704
APA StyleJabłońska, B., Busch, M., Kityk, A. V., & Huber, P. (2019). Natural and Chemically Modified Post-Mining Clays—Structural and Surface Properties and Preliminary Tests on Copper Sorption. Minerals, 9(11), 704. https://doi.org/10.3390/min9110704