1. Introduction
In general, the heterogeneity of crustal rocks is mainly the result of variable mineral composition and of the presence of pores and cracks. At all scales, from local to regional, rocks are heterogeneous. The influence of heterogeneity in rock, as long as it remains moderate, can often be handled by considering that the medium is statistically homogeneous on the local scale. That means that a representative volume element (RVE) exists and that any part of the system with a volume much larger than the RVE has identical physical properties.
Within this assumption, use of effective elasticity in order to predict elastic properties and, hence, elastic wave velocities is of direct interest. In shallow conditions, rocks contain pores and cracks. These “defects” were identified for a long time as having a major influence on elastic properties.
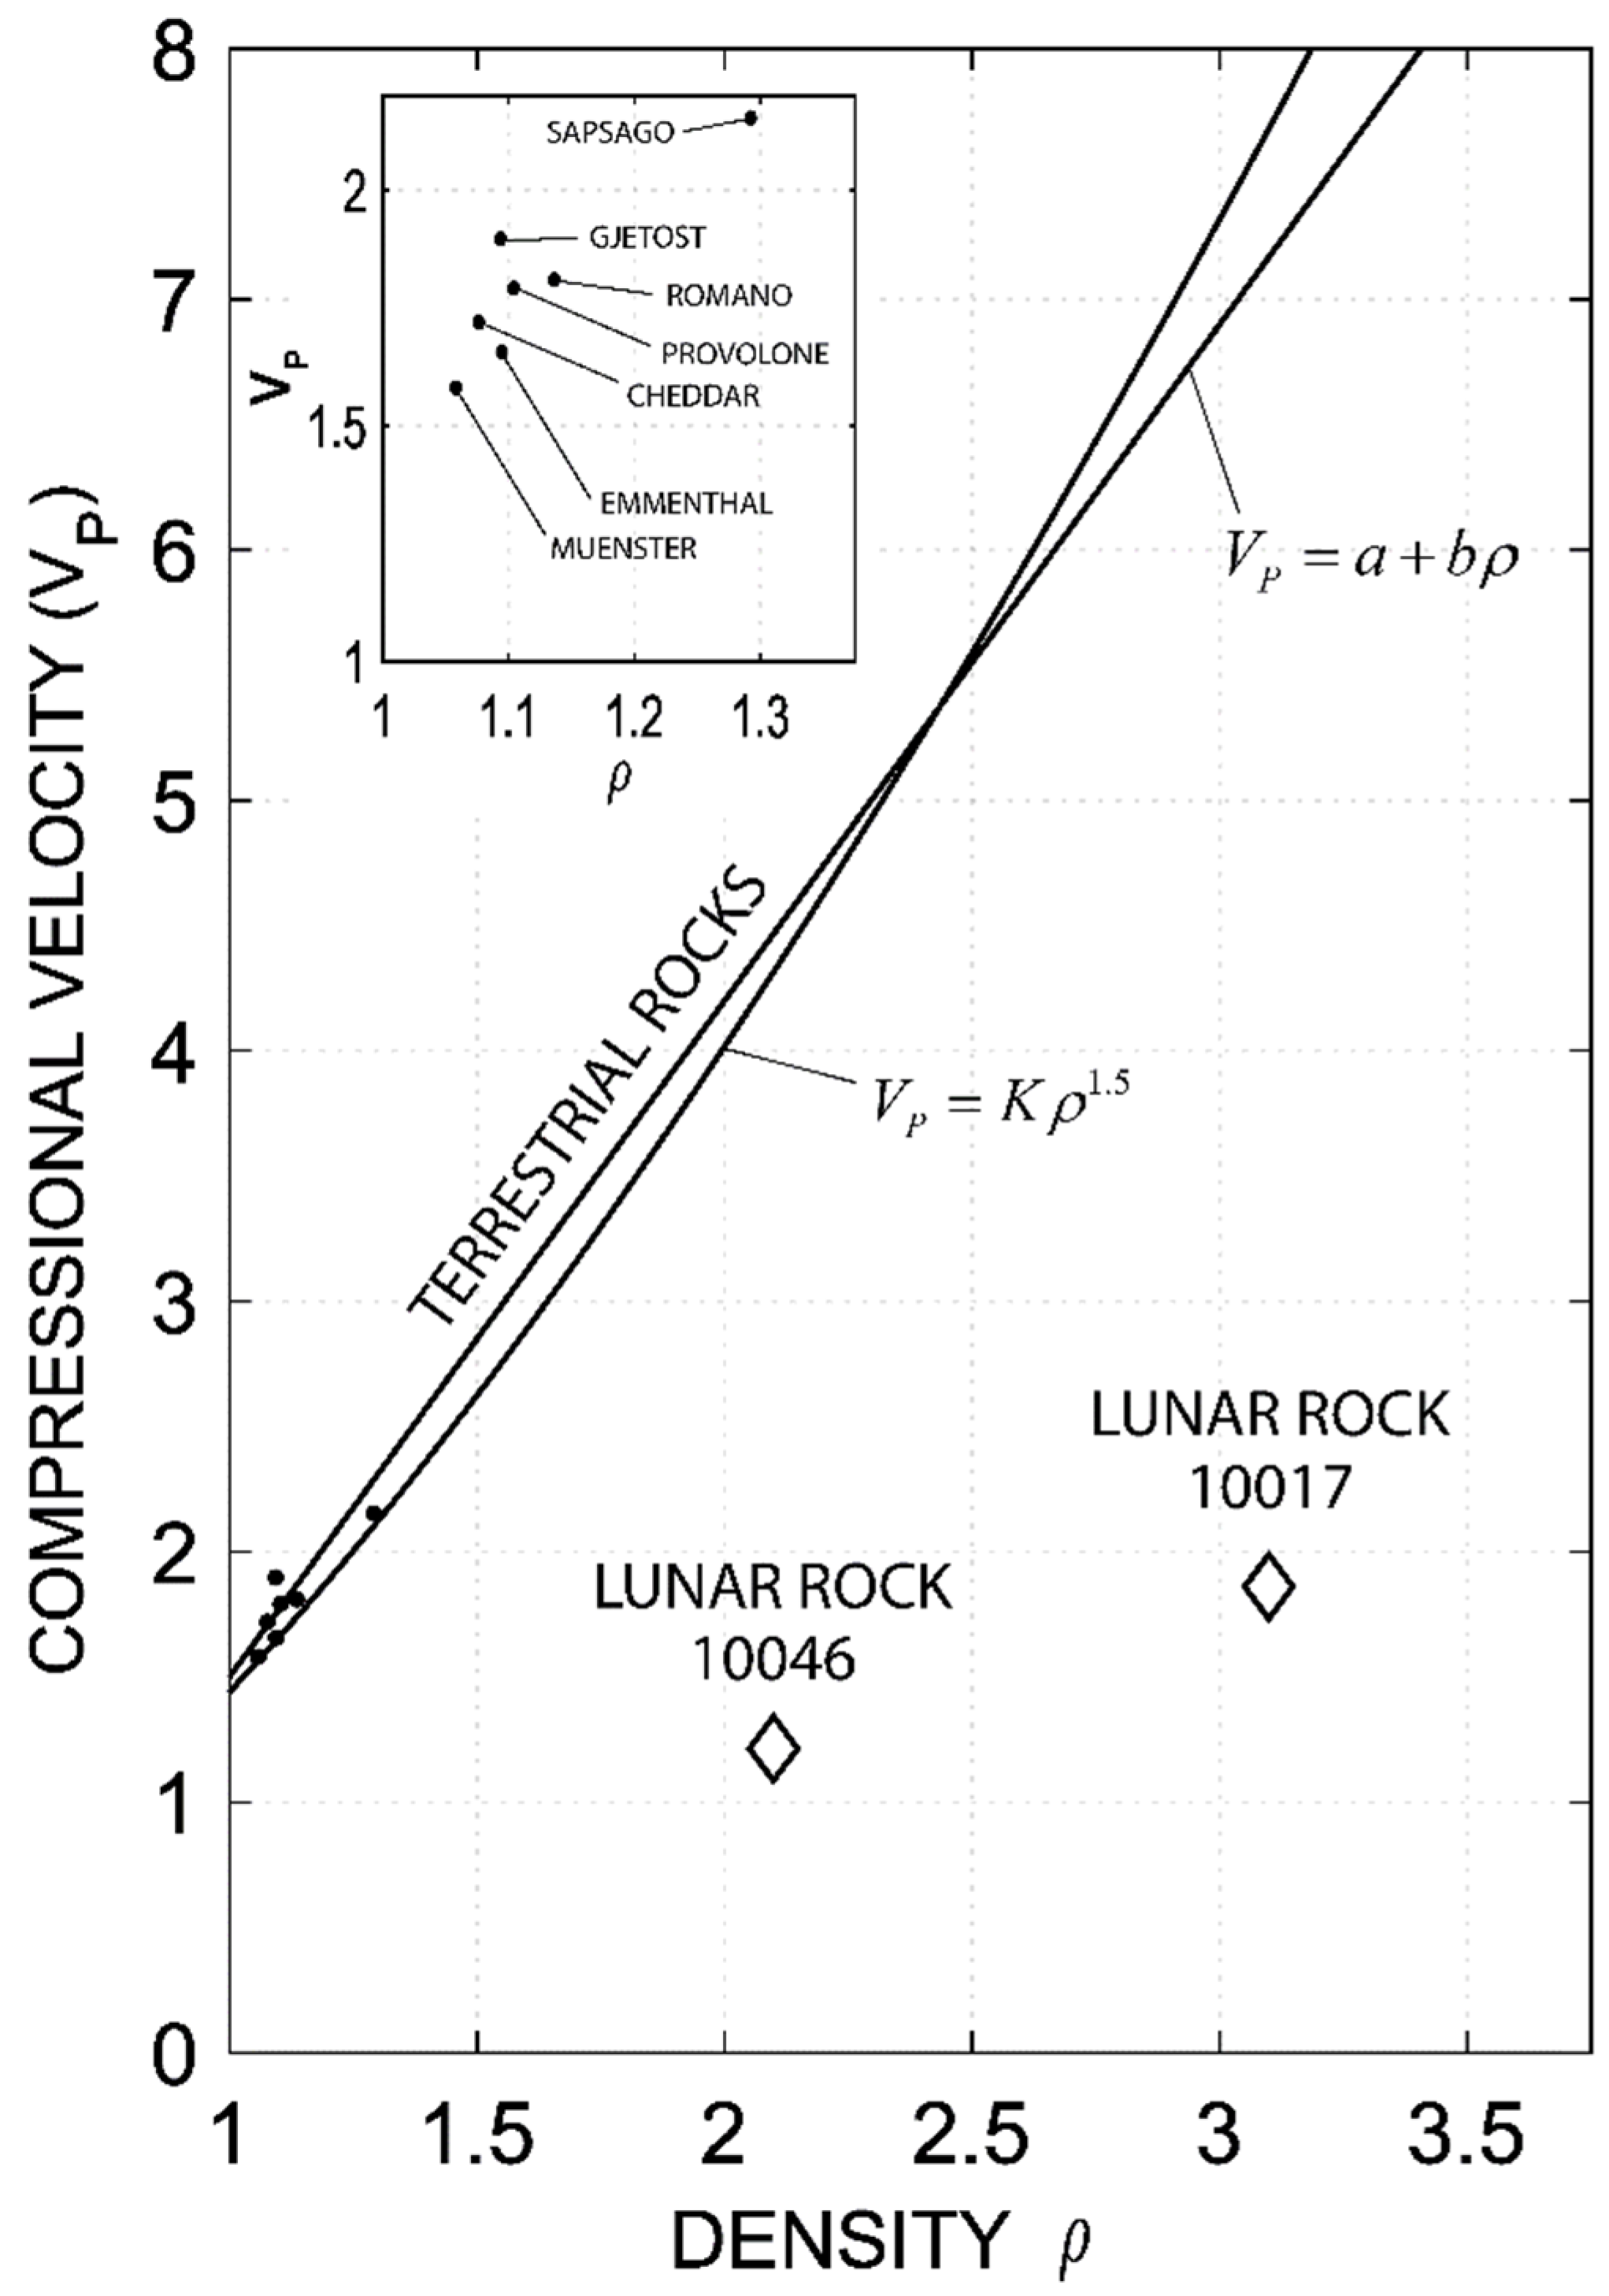
When fluids are present, frequency dependence is expected, and the combined use of effective elasticity and poroelasticity allows accounting for it. This can be applied to the results described a long time ago by Anderson [
1], who reported that the average sound velocity of Moon rocks was close to provolone cheese and very low in comparison to those found on Earth (
Figure 1).
2. Effective Elasticity of Cracked Rocks
Effective elasticity allows one to derive the elastic moduli for a dry or saturated cracked rock in terms of the parameters defined below. Let us consider the simple, but interesting case of an isotropic distribution of three-dimensional (3D) identical circular cracks of radius
r and aspect ratio
ζ (thickness/diameter). The non-cracked matrix is assumed to be isotropic. Three groups of parameters are needed: (1)
E0, Young modulus (or equivalently
K0, the bulk modulus, or
G0, the shear modulus) and
υ0 Poisson ratio of the isotropic matrix; (2)
Kf, the fluid bulk modulus (the fluid is taken below as liquid water); (3) crack density
ρ =
nr3/
V, if an REV of volume
V contains n cracks of radius
r (this non-dimensional parameter is expected to vary between 0 and 1, but the model under the assumption of non-interactive cracks is accurate only if
ρ is low enough). Because cracks are very compliant, the effect of dry cracks on the modulus is very strong. The bulk modulus is decreased in the dry case (compared to the intact matrix modulus), and so is the shear modulus. Within the approximation of very thin cracks (
ζ < 10
−3) [
2,
3], the following relationships exist:
where
Kdry stands for the dry cracked rock bulk modulus (same notation for
G). Using a standard value
υ0 = 0.25, the above equations become
K0/
Kdry = 1+ 3.3
ρ and
G0/
Gdry = 1 + 1.45
ρ.
For a water-saturated rock, the effect is less important for the bulk modulus, and more important for the shear modulus. Note that, in (high-frequency) effective elasticity, fluid phases are considered to be immobile. This means that different cracks may experience different fluid pressures since fluid has no time to move. This justifies the name “unrelaxed” for the effective saturated moduli. Experimentally, the appropriate measurements are ultrasonic measurements, because they are very-high-frequency ones, so that the “unrelaxed” situation is obtained. Then, with the same approximations as above [
2,
3], the following relationships exist:
where
Kur stands for the unrelaxed saturated cracked rock bulk modulus (same notation for
G). Using a standard value
υ0 = 0.25, the above equation becomes
G0/
Gur = 1 + 0.91
ρ.
Saturation strongly modifies the dry results; the unrelaxed saturated bulk modulus has, under the assumption of thin cracks, the same value as that of the intact matrix, but the saturated shear modulus is decreased and different from the dry case. Using values reported by Anderson [
1], (dry rock P-wave velocity of the order of 2 km/s for lunar rocks instead of 6 km/s for Earth rocks), it is straightforward to check that
ρ should be higher than 1. The crack density is so high that the above model under the approximation of non-interactive cracks is no longer quantitative, but the implication is that the cracking is very intense. A very useful (but unavailable) complementary set of data would be the velocity variation of lunar rocks with pressure. Since cracks close under pressure, one expects a strong decrease in crack density at higher pressure, down to a crack density range where the above model would be quantitatively applicable [
2,
3]. Differential [
4,
5] or self-consistent schemes [
6] may also be used beyond the limits of applicability of the non-interaction approximation.
As Anderson pointed out, this shows that lunar rocks are highly cracked and dry. If not dry, they would exhibit a much higher bulk modulus and, hence, a much higher P-wave velocity.
5. Q Factor
It results from the above that, in a saturated cracked medium, wavespeeds are expected to be frequency-dependent. If we use a viscoelastic framework [
8], the frequency dependence effect is accompanied by dispersion and attenuation, following the Kramers–Kronig relationships [
9].
In the simple case considered above, the dissipation is in shear only. Using the previous parameter values, one gets the following:
where ∆
G stands for the maximum variation of
G (from the unrelaxed state to the relaxed one, in a water-saturated cracked rock).
In the approximation of the simple linear viscoelastic body,
Q−1max = 0.5 ∆
G/
G, so that the squirt flow effect is expected to produce an attenuation peak on shear waves at
fc of
and, similarly, will also produce some attenuation for the P-wave (
Q−1max = 0.09
ρ).
For a crack density of 0.2 (likely to be lower than that for Moon rocks, but in a range where the above models are approximately valid), one gets an attenuation peak of Q−1max = 0.05 for the shear wave (Q−1max = 0.02 for the P-wave). This is a high value, possible only if fluids are present.
The above model can be extended to porous rocks. In that case, it can be shown that crack–pore flow also induces a strong bulk effect [
10].
In the situation of dry cracks, no dissipation related to fluid flow is expected and Equation (1) would apply both at low and high frequencies. In that case, ∆G/G = 0 and ∆K/K = 0, which results in Q−1max = 0, regardless of the crack density. This explains the apparent paradox between Moon (high crack density, low attenuation) and Earth rocks (low crack density, high attenuation).
6. Experimental Data
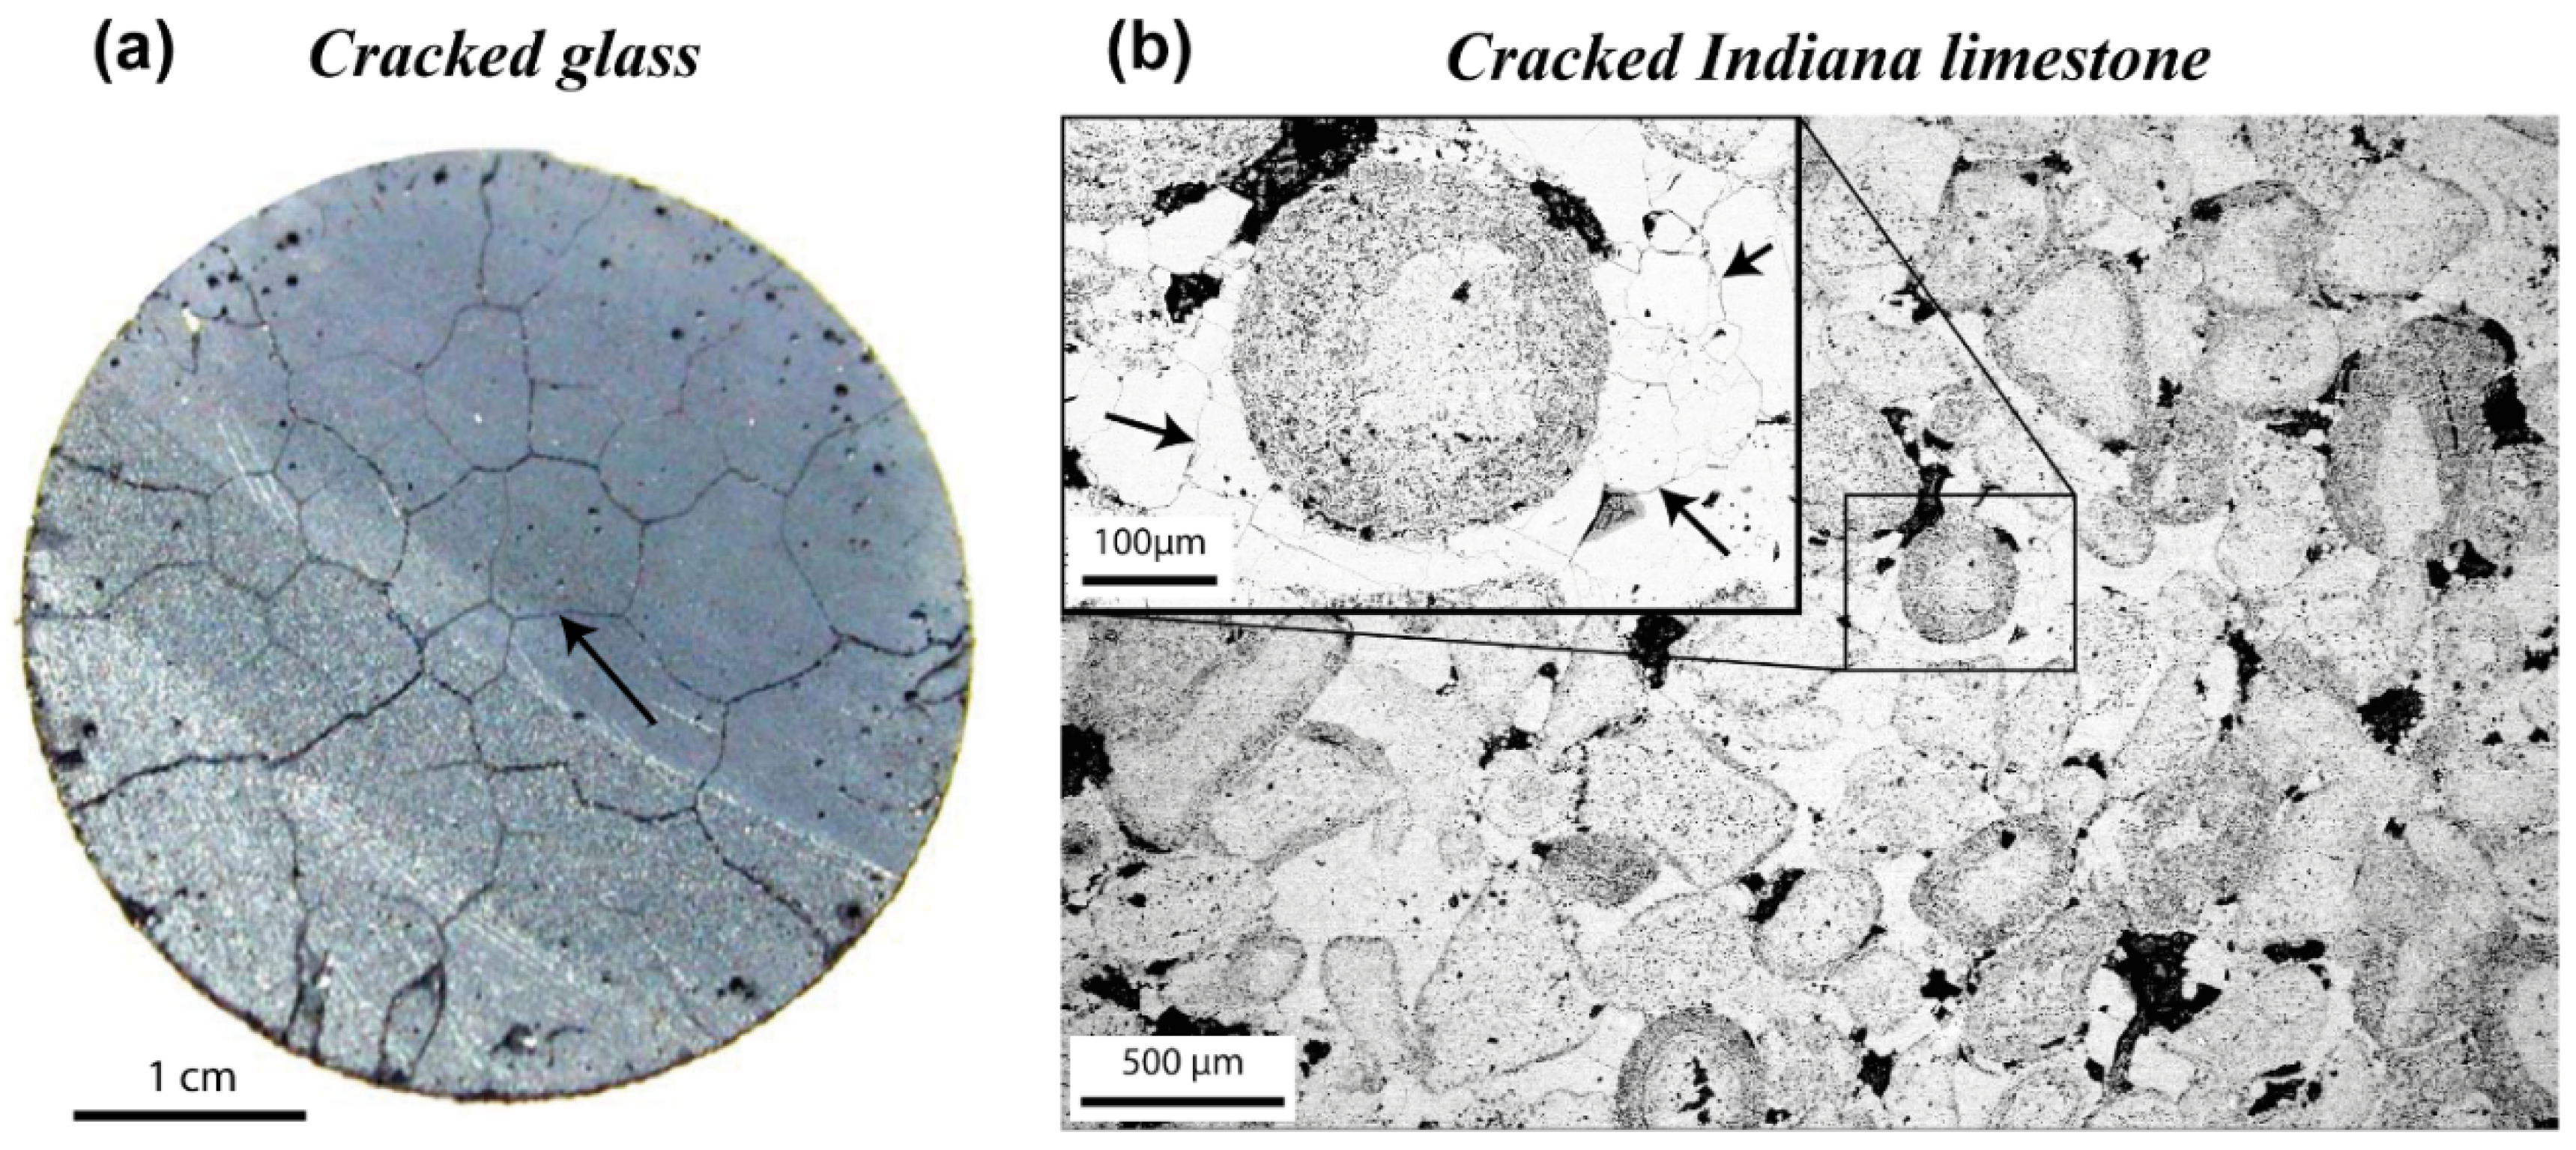
Convenient examples to illustrate the above predictions are given by data obtained on glass and Indiana limestone. A homogenous glass can be quenched, resulting in a connected network of cracks (
Figure 2a) [
11]. As with most sedimentary rocks, Indiana limestone is porous (
Figure 2b). Its crack content can be modified by thermal cracking, but its porosity is a characteristic of the rock that cannot be modified easily. The fact that pores are present is important. It implies that squirt flow can take place not only from crack to crack like in the glass, but as also from crack to pore, resulting in bulk dispersion together with shear dispersion [
10]. Here, we present a glass sample that was quenched from a temperature of 300 °C, and an Indiana limestone that was heated up to 500 °C for an hour prior to a natural cooling.
As seen on the microstructures (
Figure 2), the glass was composed of a network of cracks that could be of a millimetric to centimetric scale (
Figure 2a), whereas, in the Indiana limestone, the cracks were essentially induced in the homogeneous intergranular cement, with sizes around 100 µm (
Figure 2b). The crack porosity of the thermally treated (TT) glass was measured around 0.24% using a mercury porosimeter [
14]. Overall, the Indiana sample bears a total porosity of
Ф = 11.4%, measured by the triple-weight method [
13], essentially distributed between intragranular micropores and some intergranular mesopores (
Figure 2b).
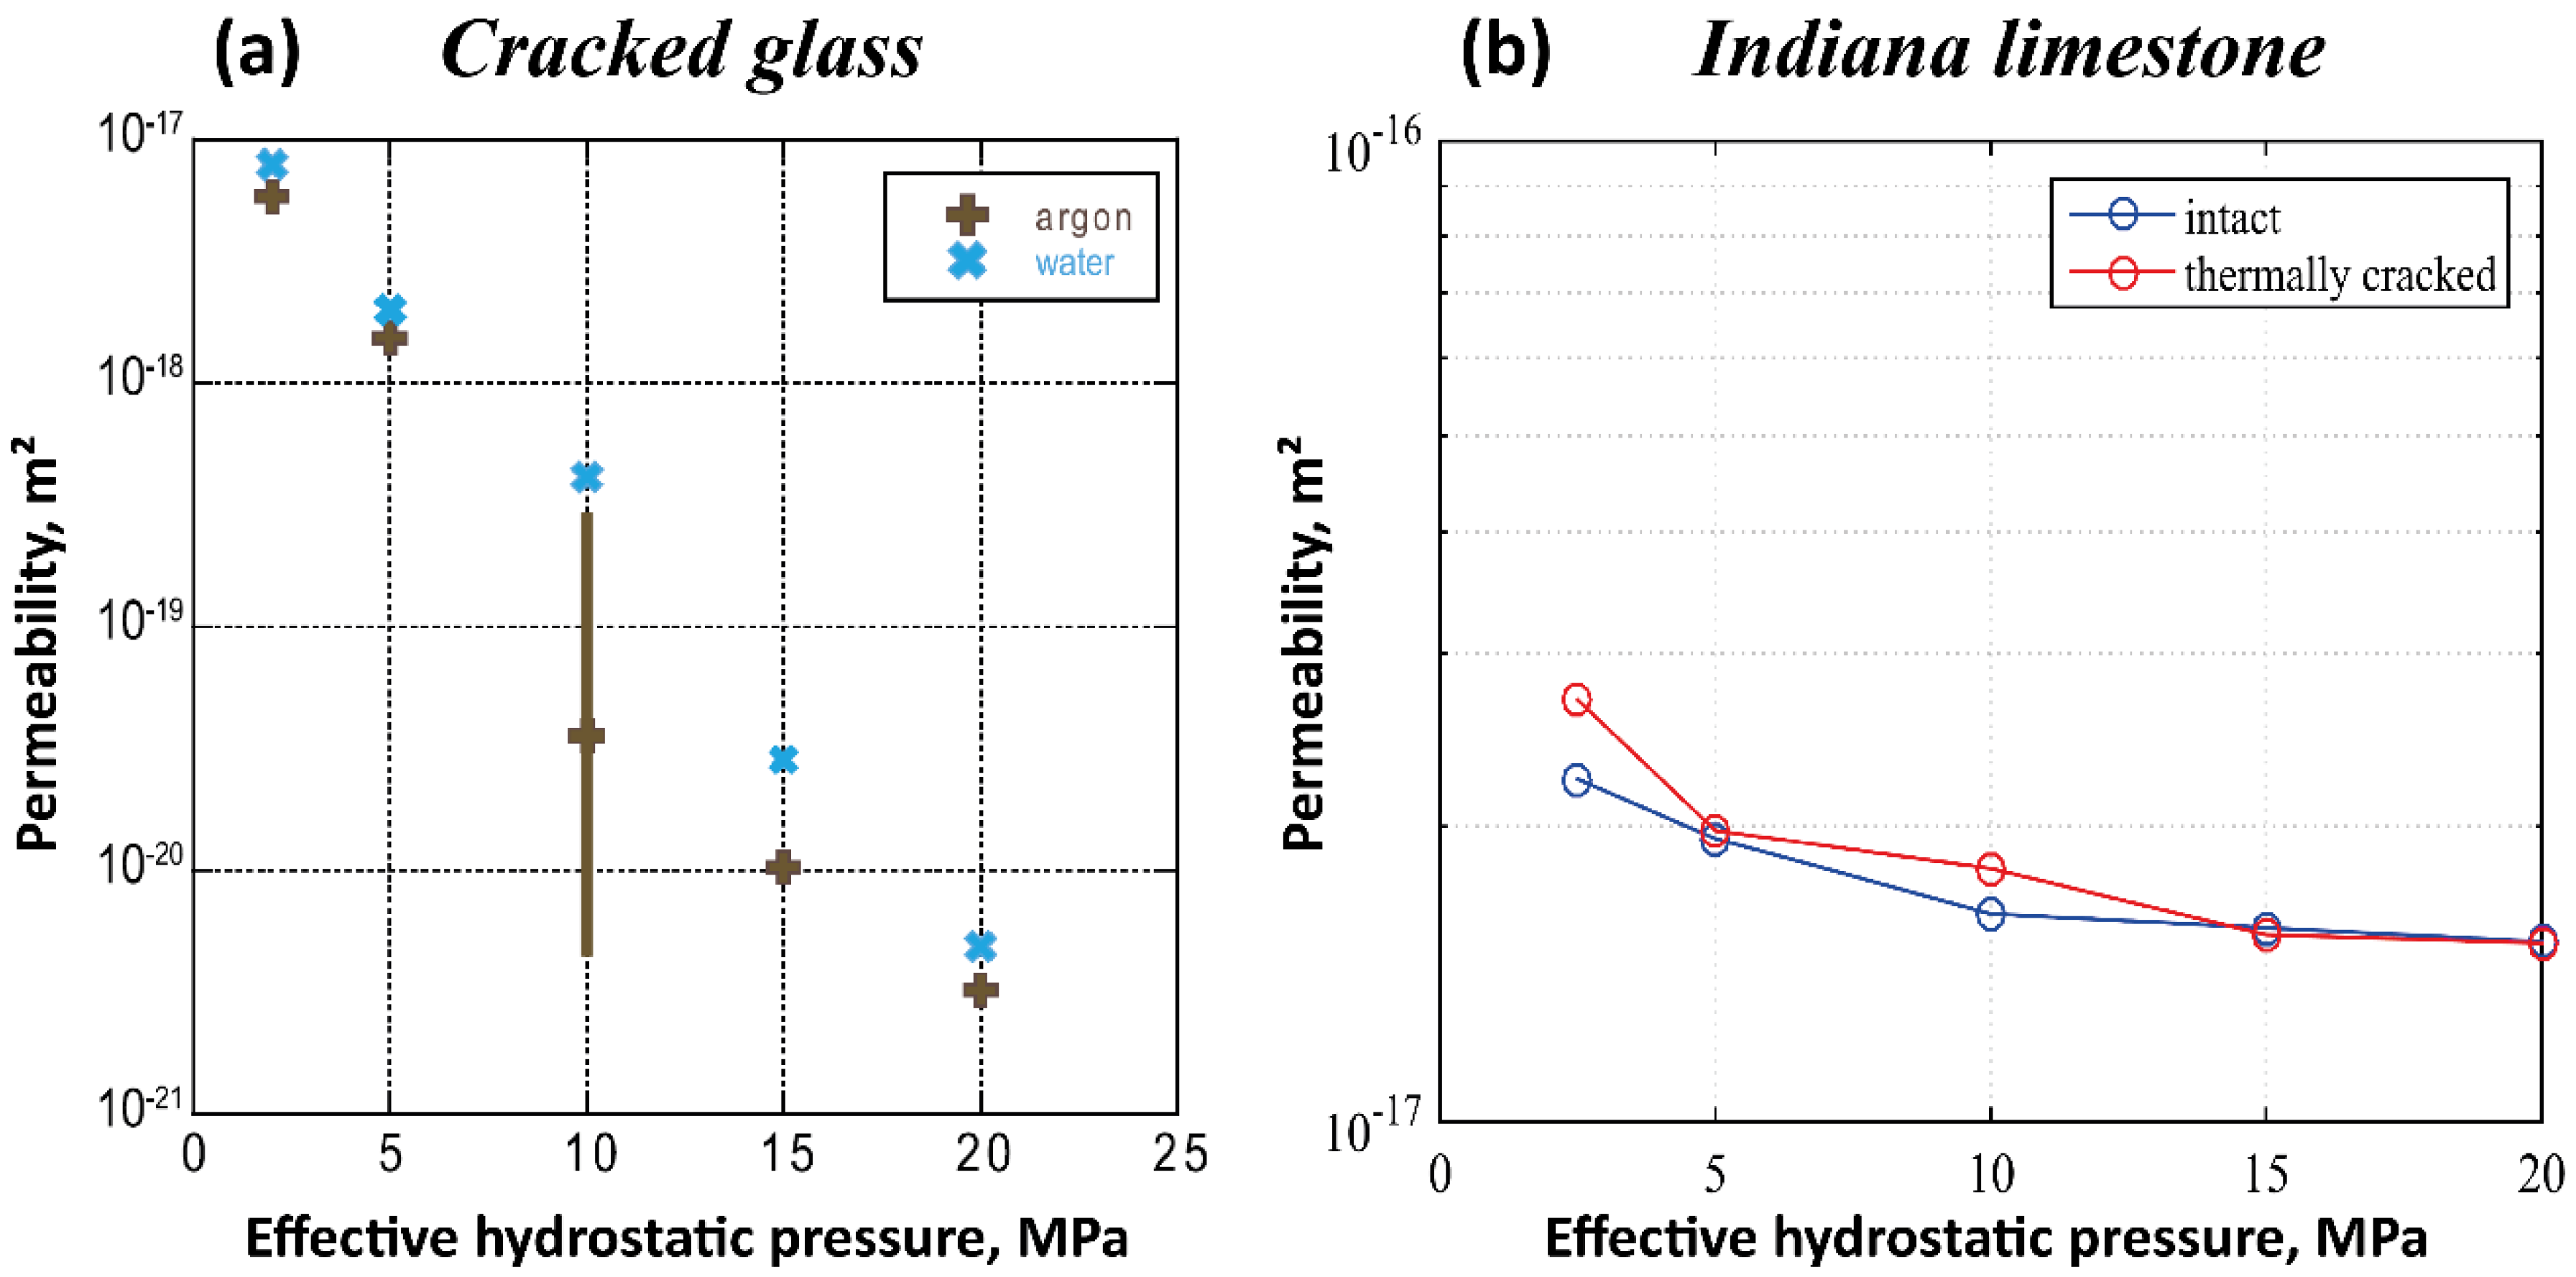
Permeability of the cracked glass was measured using the pulse decay method with argon and water [
14], and it was found to decrease strongly from 8 × 10
−17 to 4 × 10
−21 m
2 with an increase in effective pressure from 2 to 20 MPa (
Figure 3a). This is characteristic of crack closure with pressure, since the hydraulic conductivity is solely controlled by crack porosity. On the other hand, the permeabilities of the intact and the cracked Indiana limestones, measured with the steady-state flow rate method with water, exhibited a much smaller variation with effective pressure, decreasing from an average of 2.3 × 10
−17 to 1.4 × 10
−17 m
2 (
Figure 3b). We can note that the results for the intact and cracked limestone differed negligibly, leading to the belief that the pores were the main contributor to the hydraulic conductivity, with a very small contribution of the microcracks (
Figure 3b).
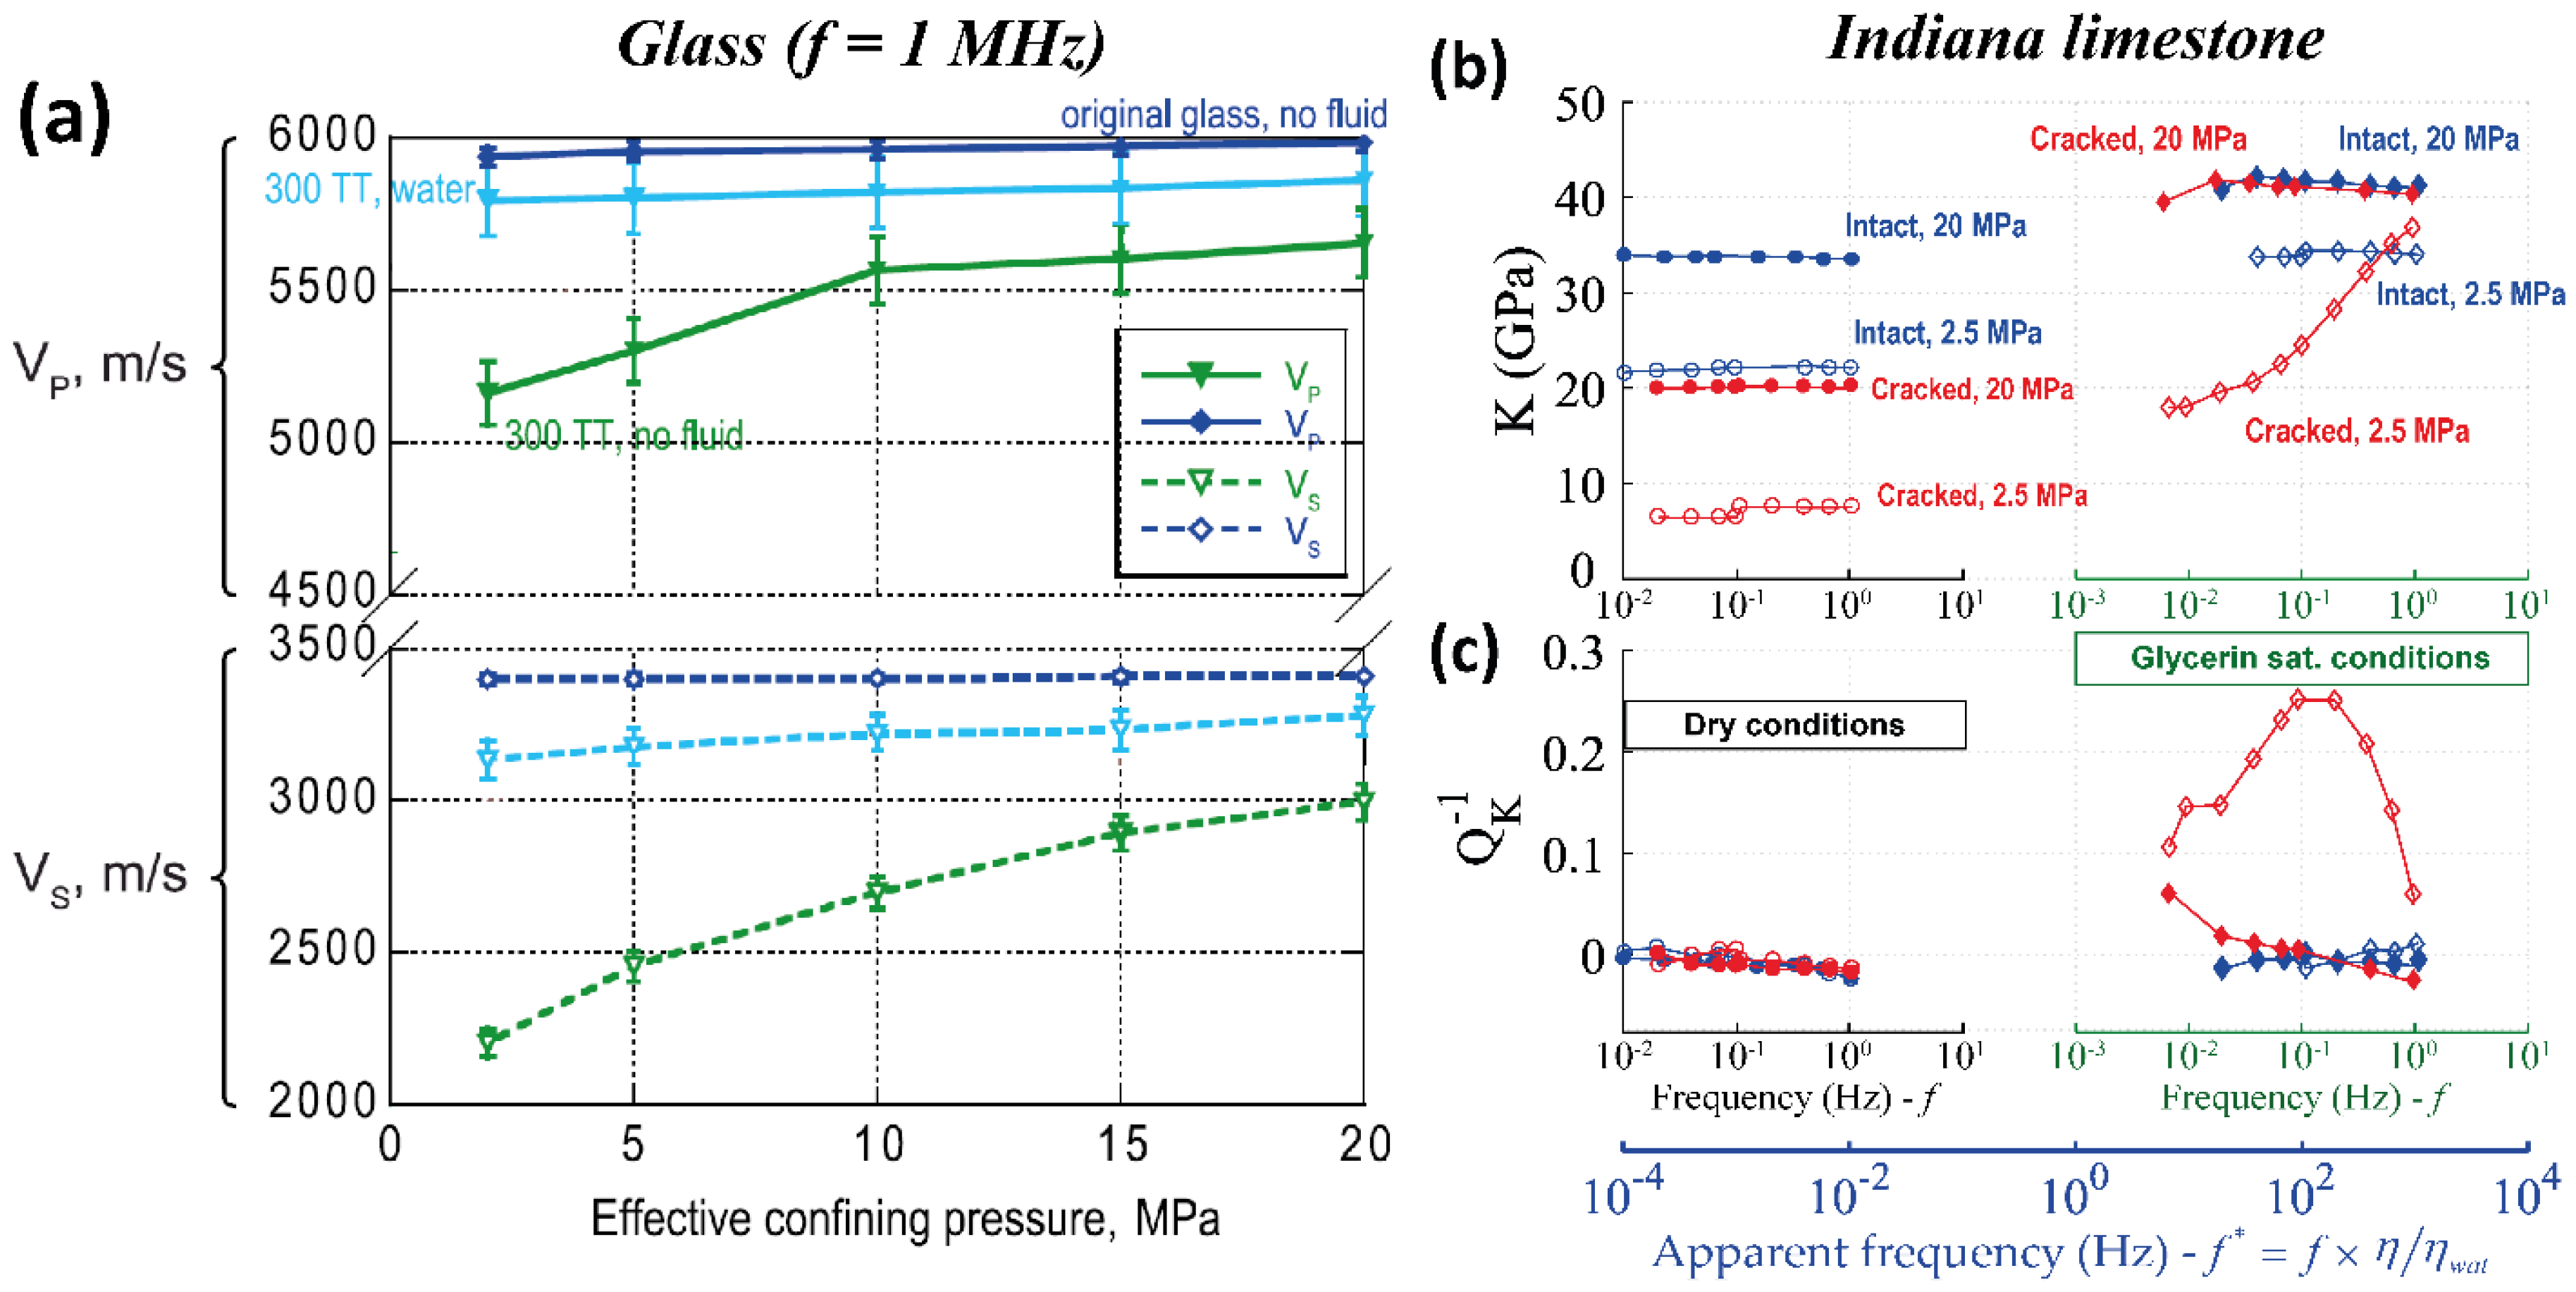
Results of the elastic/acoustic properties are presented in
Figure 4. For the glass sample, ultrasonic P- and S-wave velocities were measured over a range of effective pressures from 2.5 to 20 MPa [
14] (
Figure 4a). The intact sample exhibited no pressure dependence. For the cracked sample in dry conditions, the P- and S-wave velocities increased with pressure, consistently with crack closure. However, the water-saturated cracked sample exhibited no pressure dependence, and velocities were close to the intact sample (
Figure 4a). This is consistent with the high-frequency unrelaxed regime when crack-to-crack squirt flow occurs (Equation (2)).
The Indiana limestone was investigated using a specific apparatus at École normale supérieure (ENS) Paris that measures the frequency dispersion/attenuation of elastic moduli over a broad frequency range (0.004–100 Hz) using the forced-oscillation method [
13,
15]. Here, the results of the bulk modulus dispersion and attenuation (
) are presented (
Figure 4b and
Figure 4c, respectively), as induced from pure hydrostatic conditions over an experimental frequency range of 0.004–1 Hz and effective pressures of 2.5 and 20 MPa. The frequency was normalized by the dynamic viscosity of the saturating fluid/gas (
η), using water as a reference, in order to visualize the results in terms of “apparent frequency” (
f* =
f ×
η/
ηwat). With the use of glycerin
ηgly = 1000 mPa∙s) instead of water (
ηwat = 1 mPa∙s), one can investigate the bulk dispersion/attenuation in the apparent seismic frequency range (4–1000 Hz) of a water-saturated rock (
Figure 4b,c), as long as solely viscous-driven fluid-flow processes occur such as squirt flow (Equation (6)).
Both the intact and cracked Indiana samples were non-dispersive in the absence of fluid and showed no attenuation (
Figure 4b,c); the glycerin-saturated intact sample also showed no attenuation. On the other hand, the glycerin-saturated cracked sample at low effective pressure (2.5 MPa) exhibited a strong bulk dispersion (
Figure 4b) in the seismic range, associated with a strong attenuation peak (
Figure 4c) around 100 Hz. This dispersion/attenuation was absent for a high effective pressure (20 MPa), related to crack closure. Therefore, the observed dispersion was likely to be related to crack-to-pore squirt flow, with a transition between the relaxed (<10 Hz) and unrelaxed regimes (>1000 Hz). Similarly to the glass sample, the “unrelaxed” elastic properties of the cracked limestone had low sensibility to the effective pressure, contrarily to the dry case.
One may ask if the cut-off frequency of the squirt flow may be predicted. In order to use the prediction given by Equation (6), one must obtain an estimate of the crack aspect ratio (
ζ). The skeleton parameters of the glass were given by the intact sample (
E0 = 84 GPa,
υ0 = 0.27), and, for the Indiana limestone, one can take the properties of calcite in carbonates (
E0 = 83 GPa,
υ0 = 0.32, [
16]). The pressure closure of a crack is given by
[
17], and the valu was found to be around 20 MPa for both the glass and the Indiana limestone, which would give an aspect ratio around ζ ≈ 2.8 × 10
−4 for both samples. Therefore, the predicted cut-off frequency for squirt flow (Equation (6)) would be around 92 Hz, under water-saturated conditions (
η = 10
−3 Pa∙s), which seems in agreement with the results obtained on the cracked limestone (
Figure 4b,c).
One interesting alternative method to determine
ζ is to use the pressure dependence of the permeability. In a cracked medium, permeability may be calculated as follows [
18]:
where
k0 is the unconfined permeability. Moreover, the aperture (
w) of the crack varies with pressure according to Equation (10) [
19].
where
is the unconfined aperture. If we assume that the variations of
k and
with pressure are proportional, from Equations (9) and (10), we obtain
. This method applies only to a cracked medium and not to a mixture of cracks and pores. For the glass sample, the slope of the permeability versus pressure in
Figure 3a (considering the log scale) gives us
, from which we finally obtain
, consistent with the previous method.


