Injection of a CO2-Reactive Solution for Wellbore Annulus Leakage Remediation

Abstract
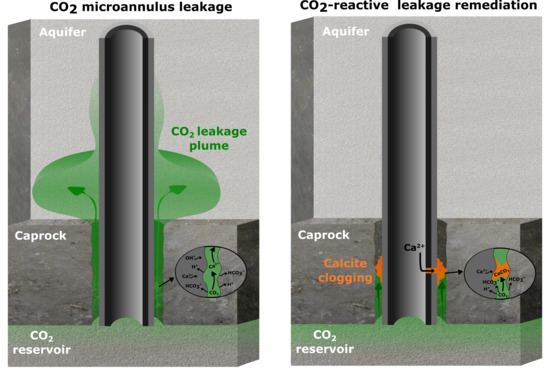
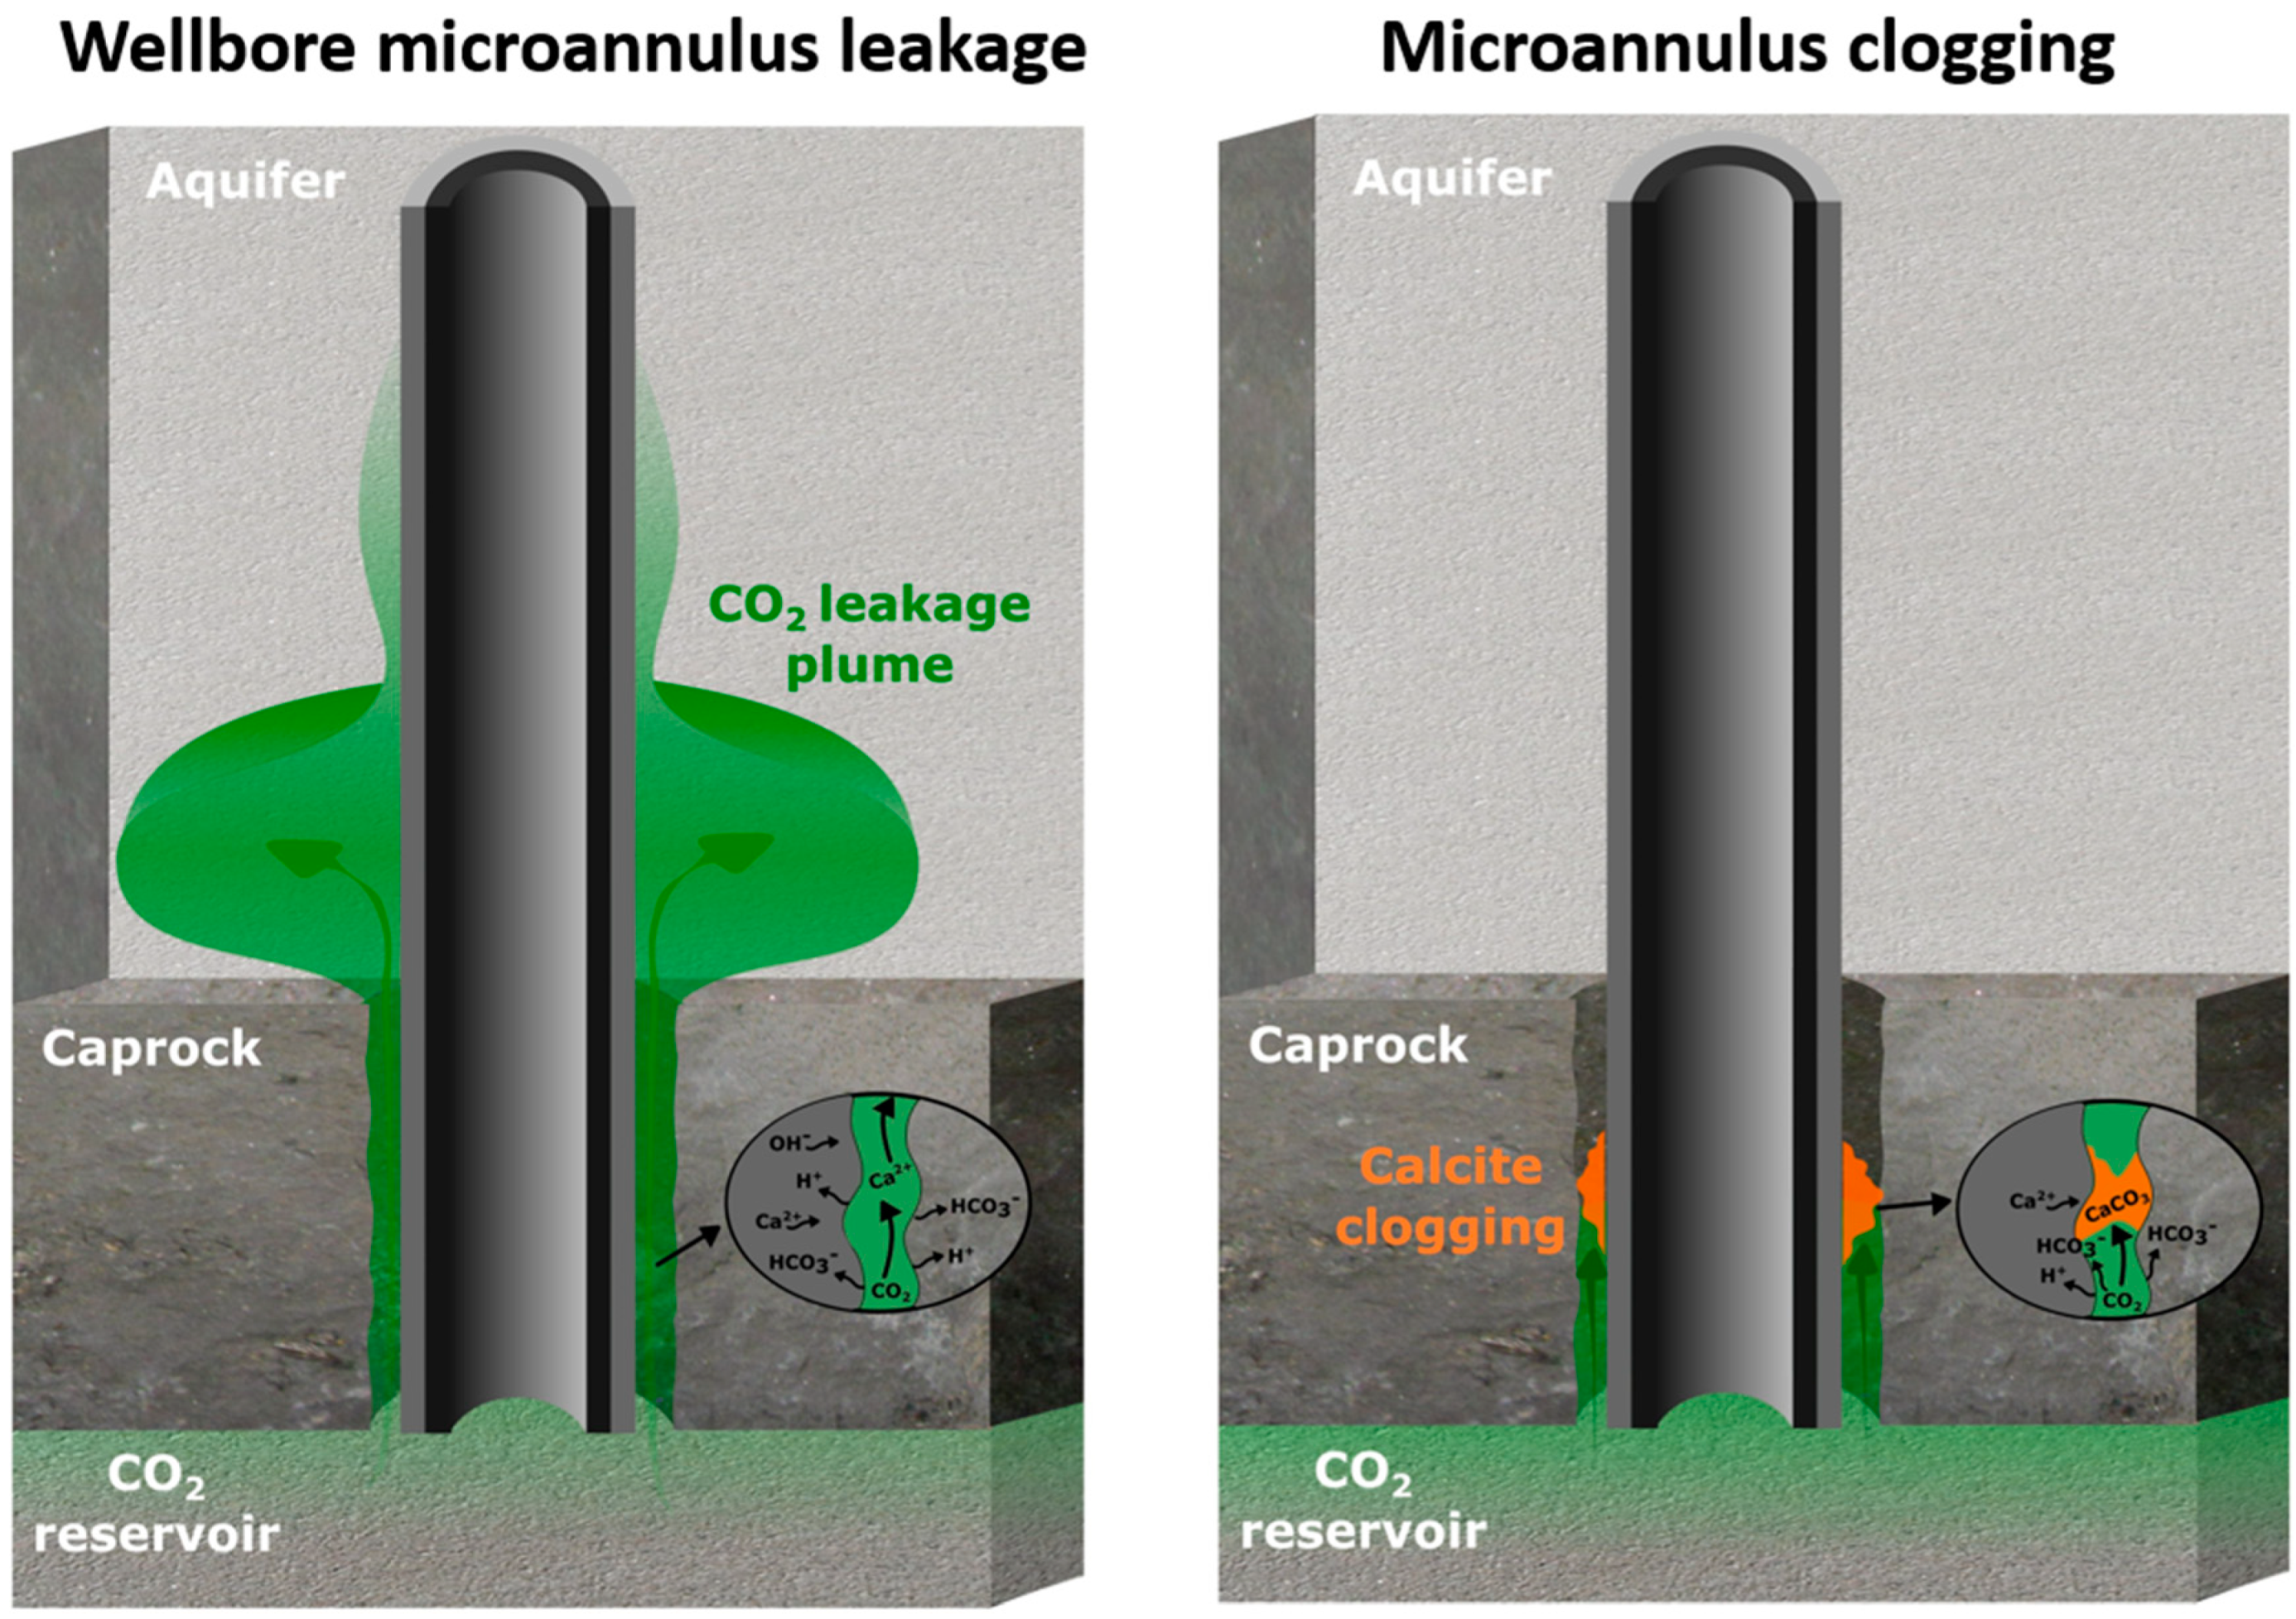
1. Introduction
- Flow of supercritical CO2 and brine along the initially water-saturated microannulus;
- Diffusion of dissolved CO2 into the caprock;
- Diffusion of dissolved CO2 into impermeable cement and reactions of dissolved CO2 and cement;
- Leakage into the aquifer overlying the caprock;
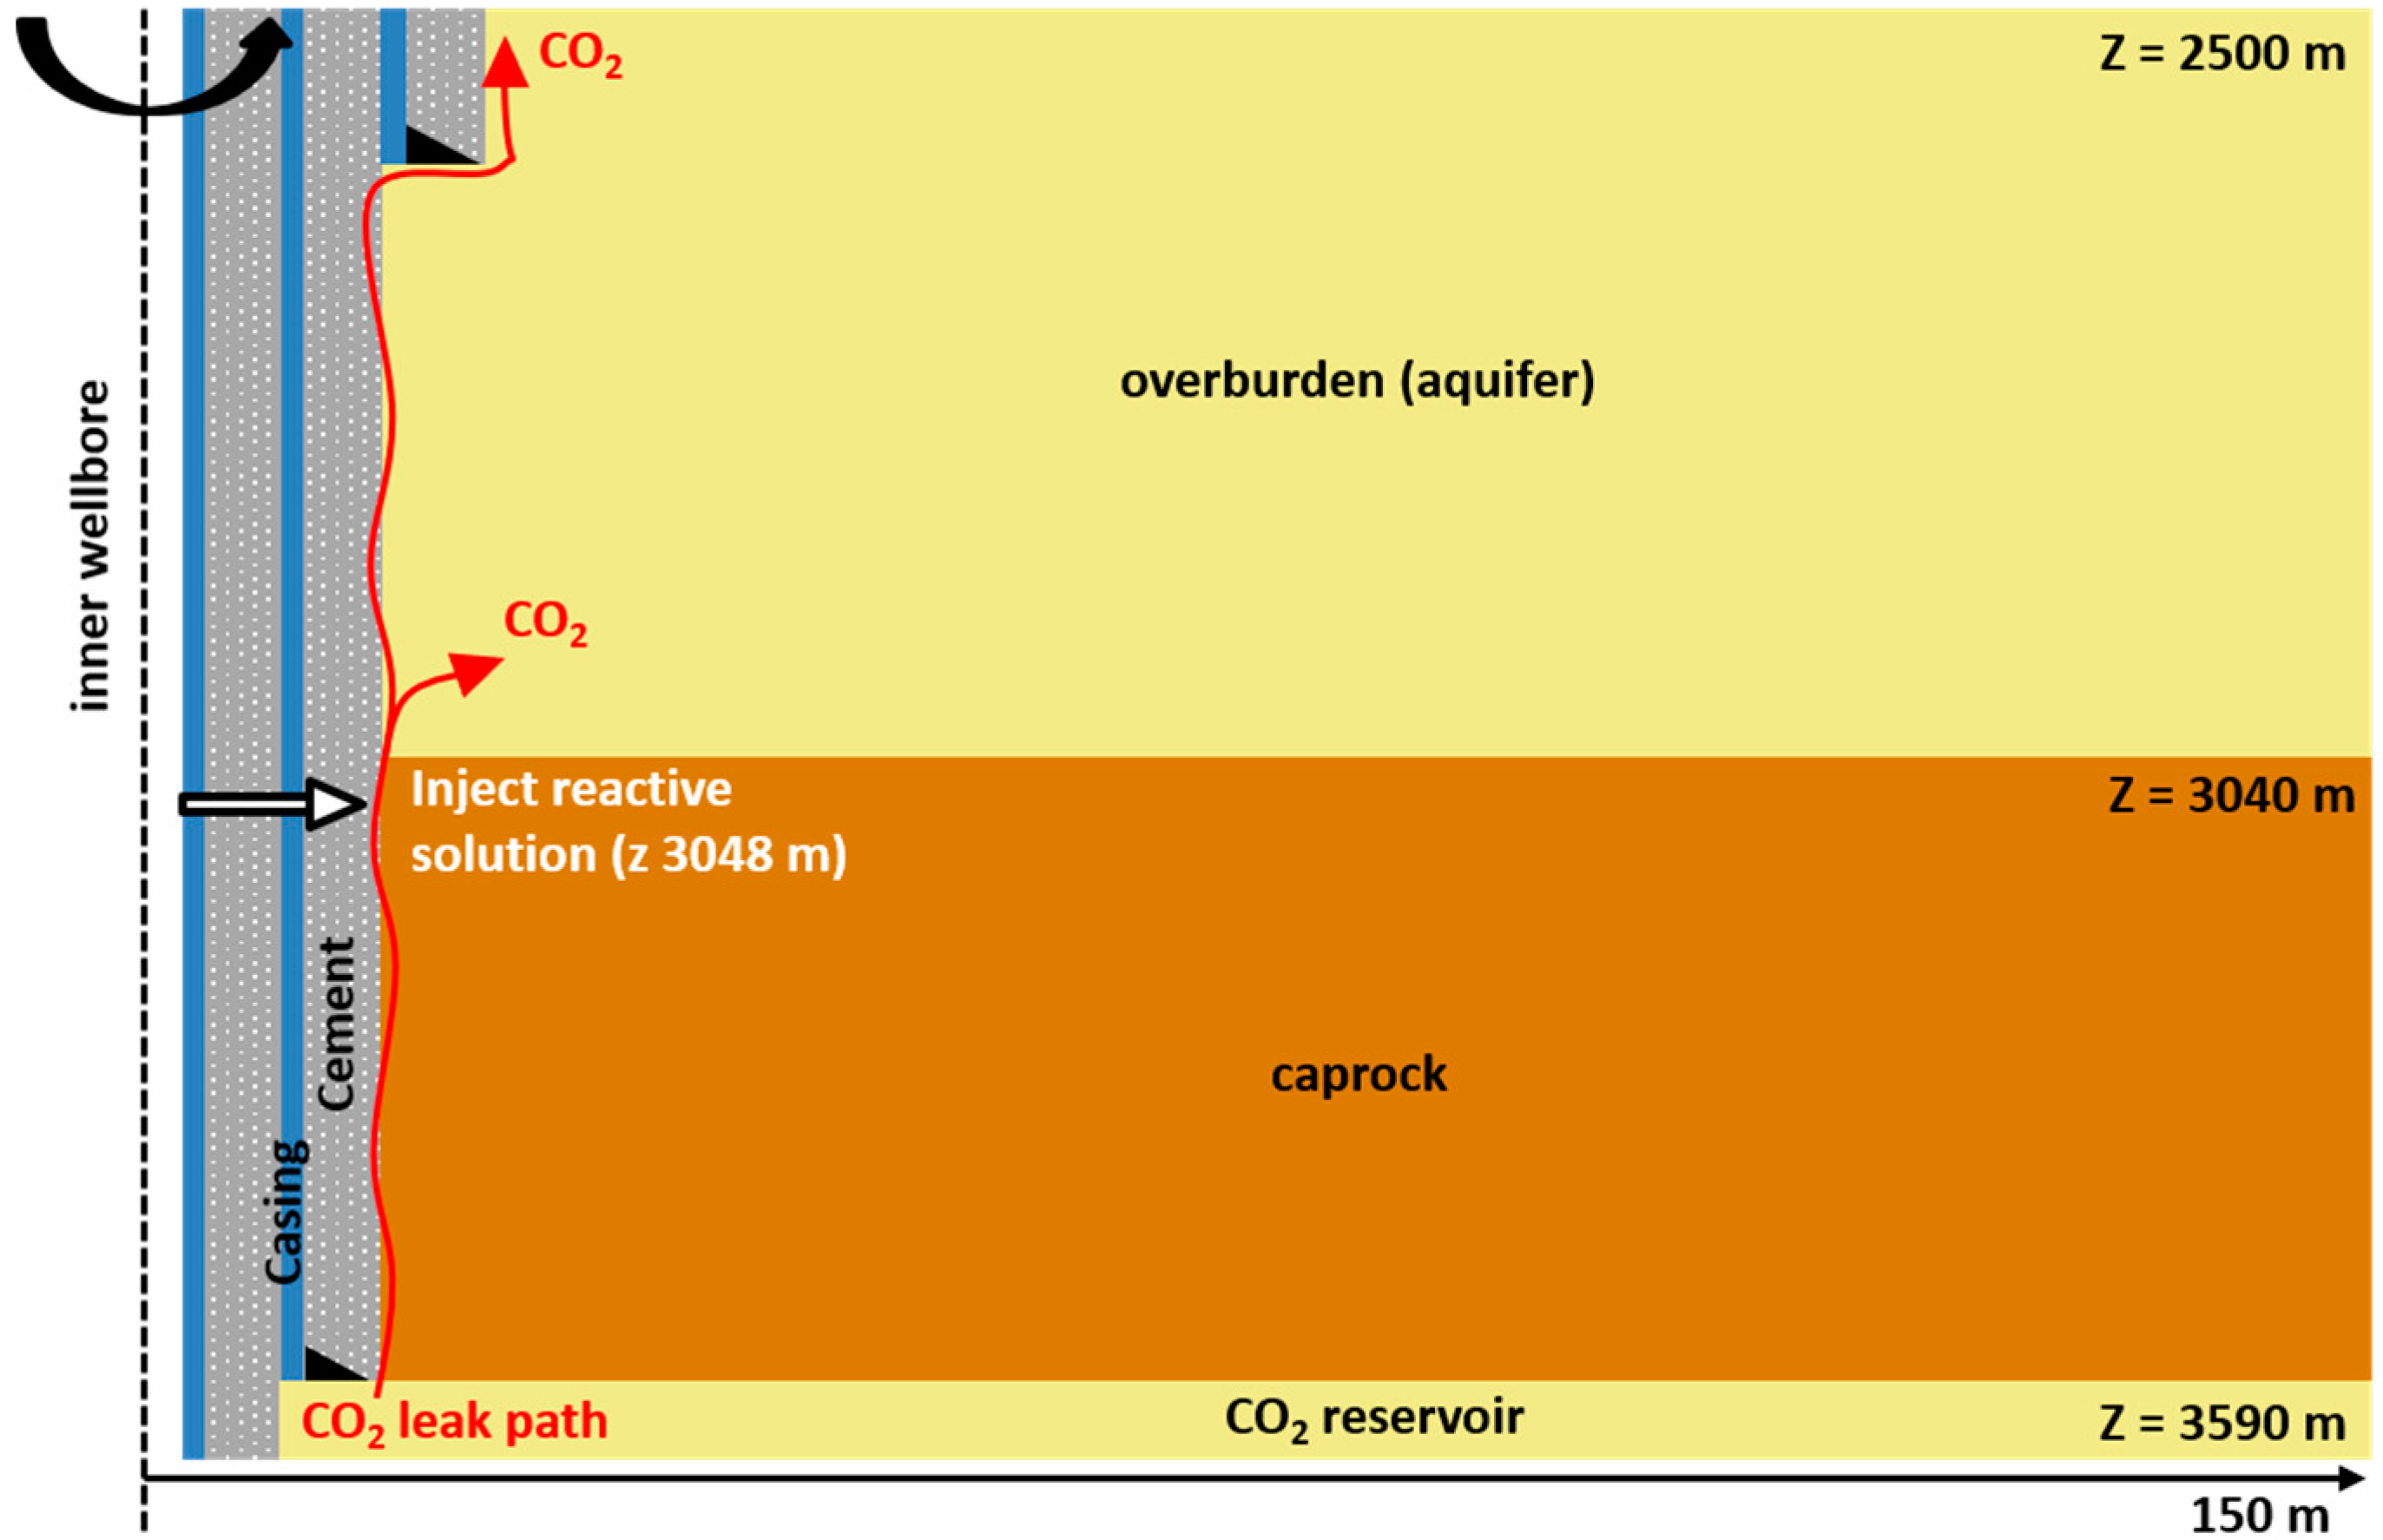
- Injection of a CO2-reactive solution in the microannulus leak path to promote clogging by calcite formation;
2. Materials and Methods
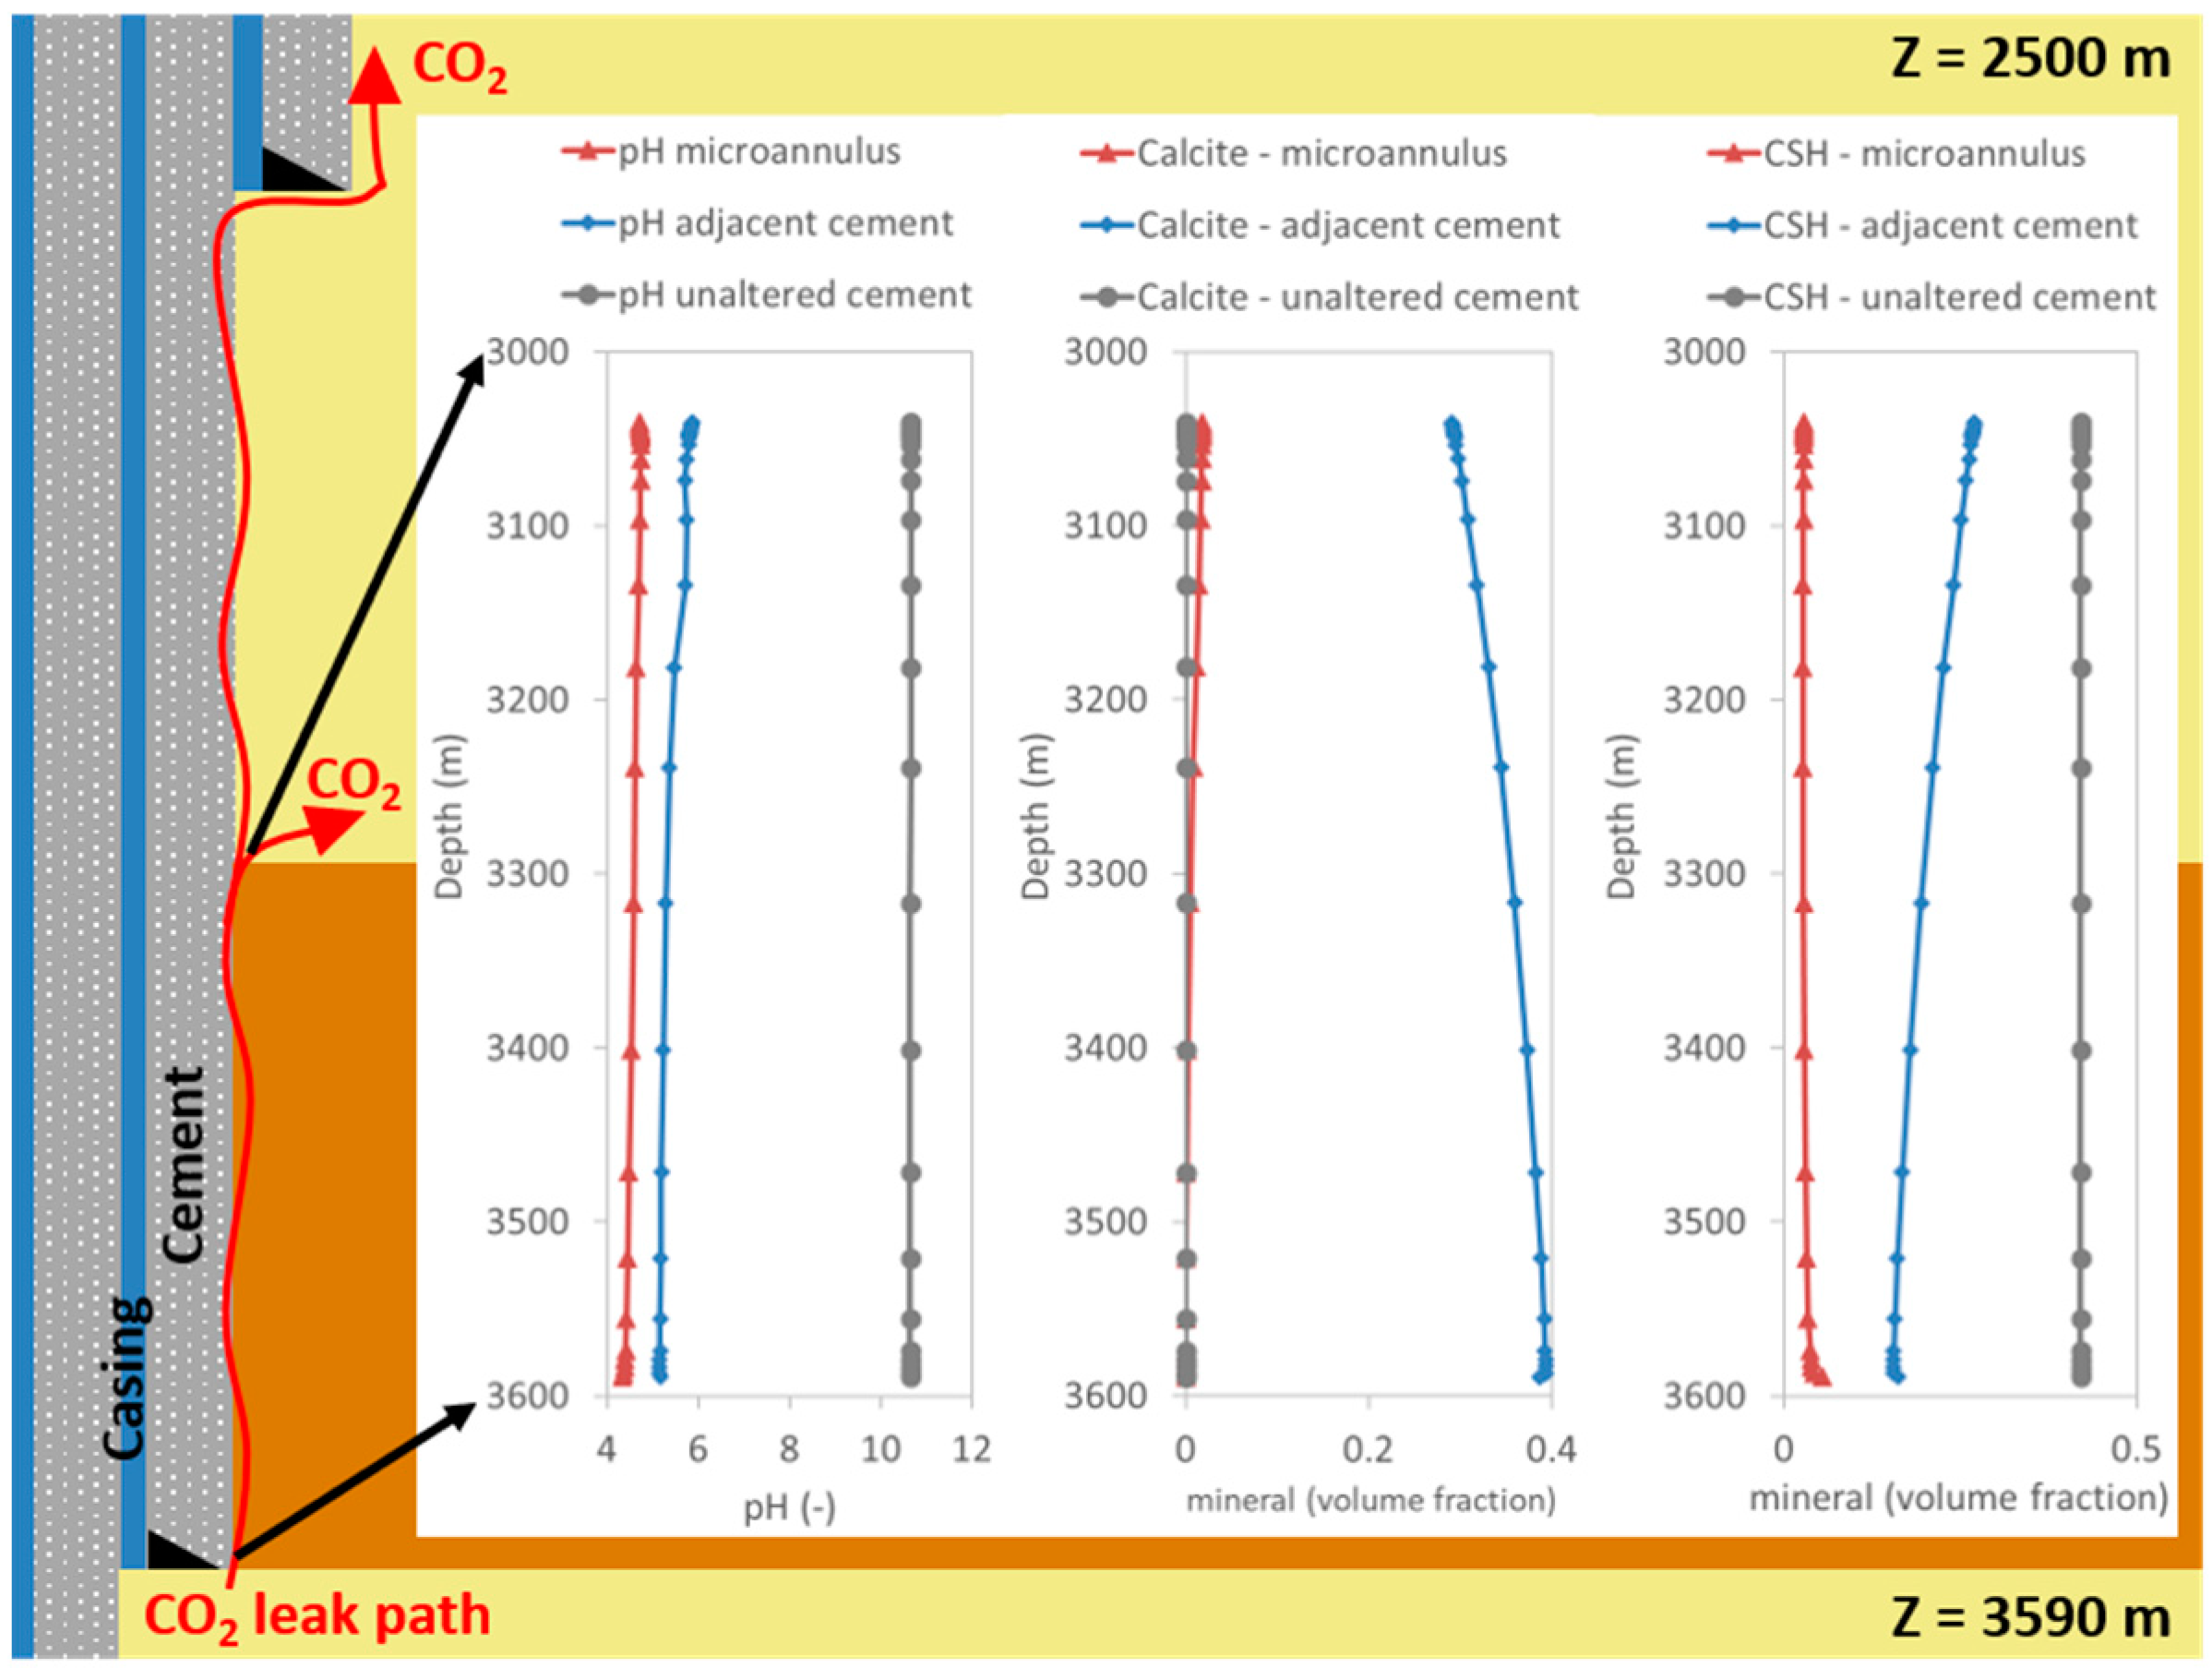
3. Results of CO2 Leakage and Natural Sealing
3.1. CO2 Leakage and Cement Reactions
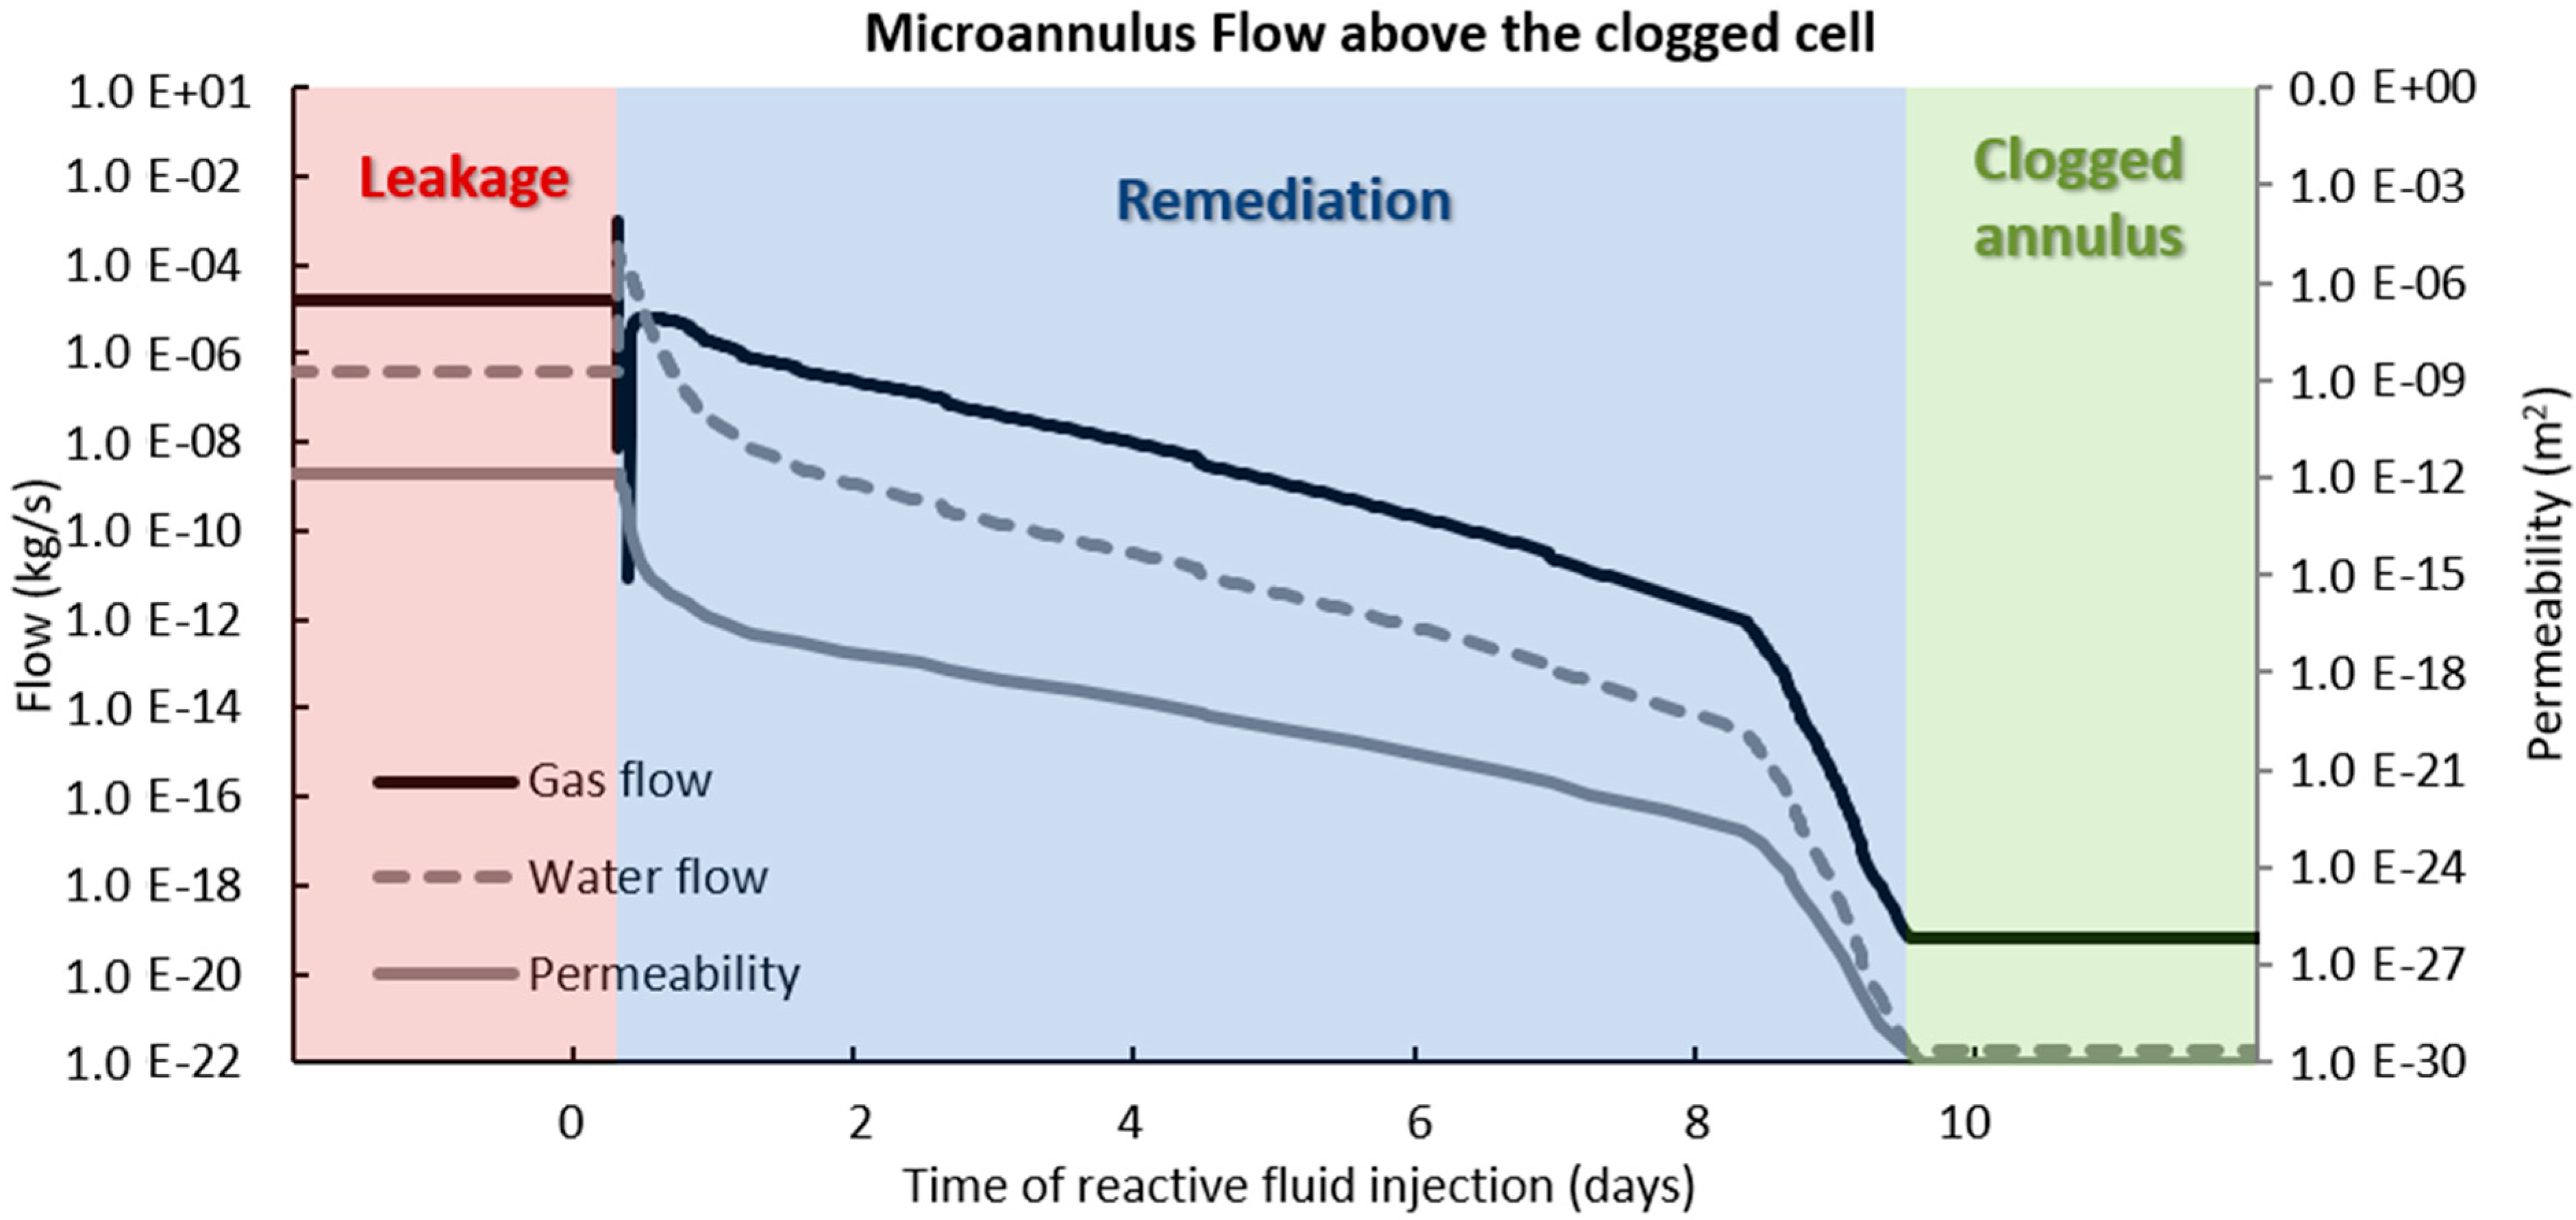
3.2. Microannulus Leakage Versus Natural Sealing
4. Results of CO2 Reactive Leakage Remediation
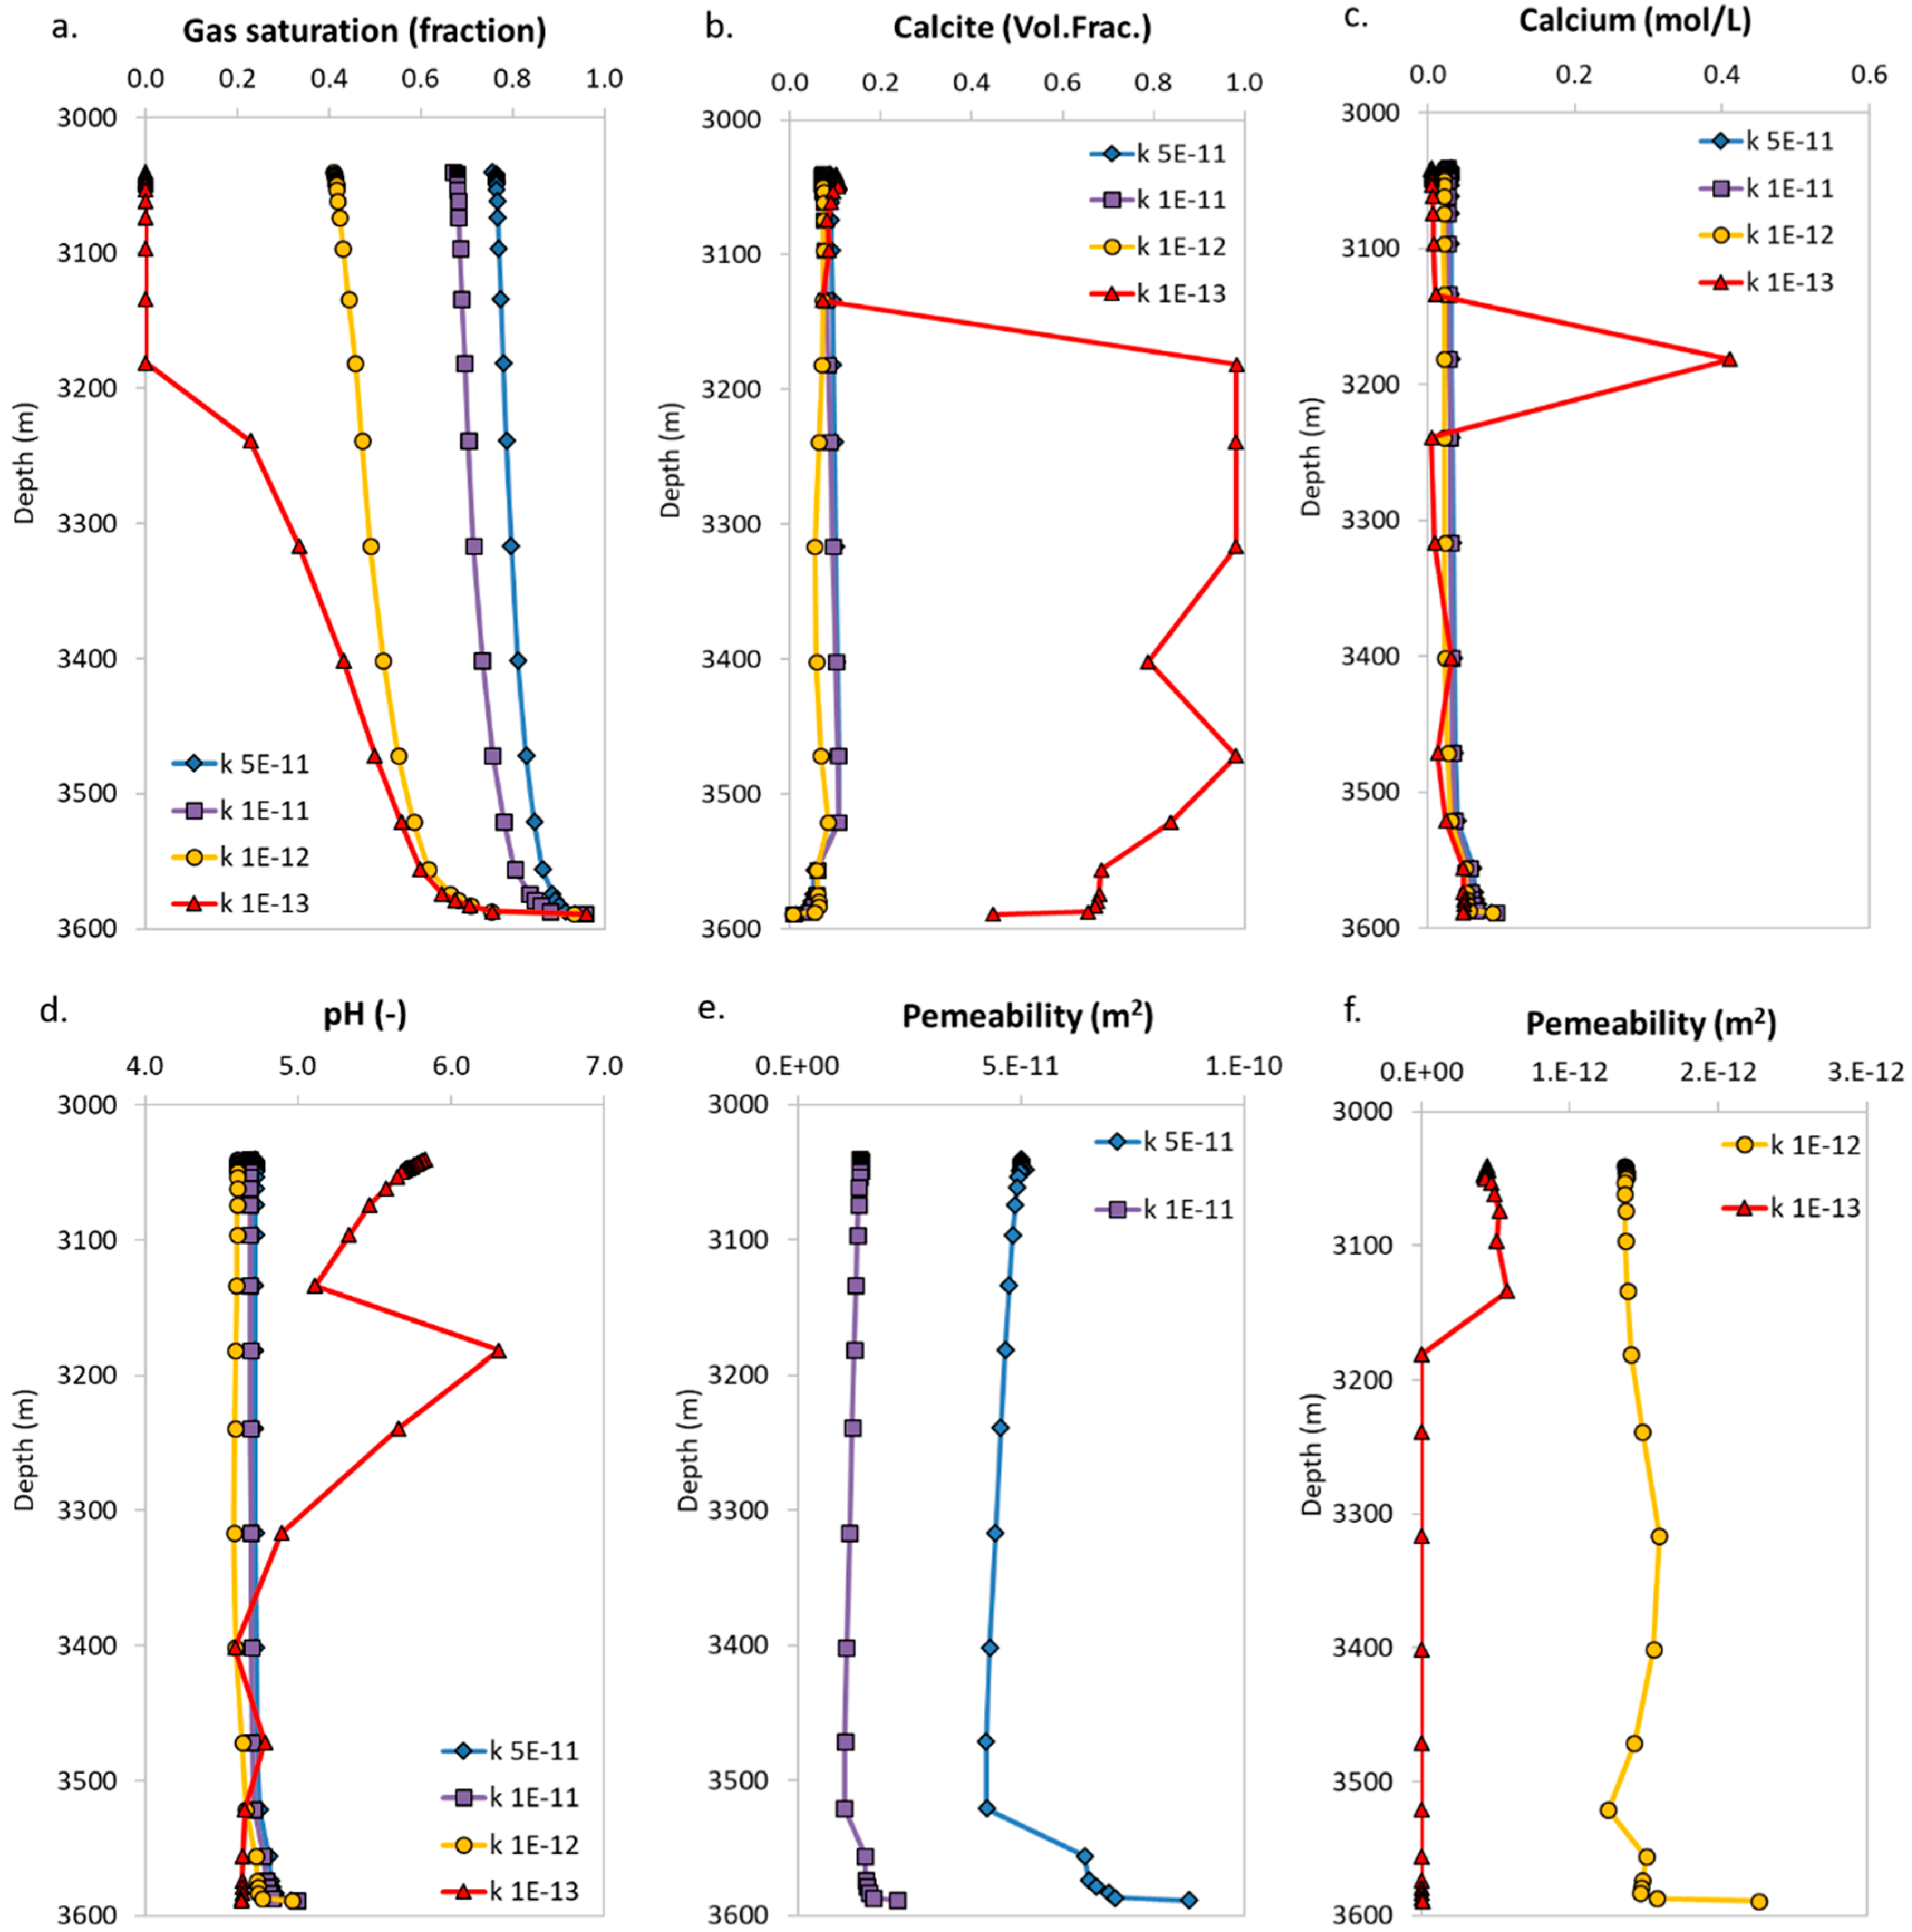
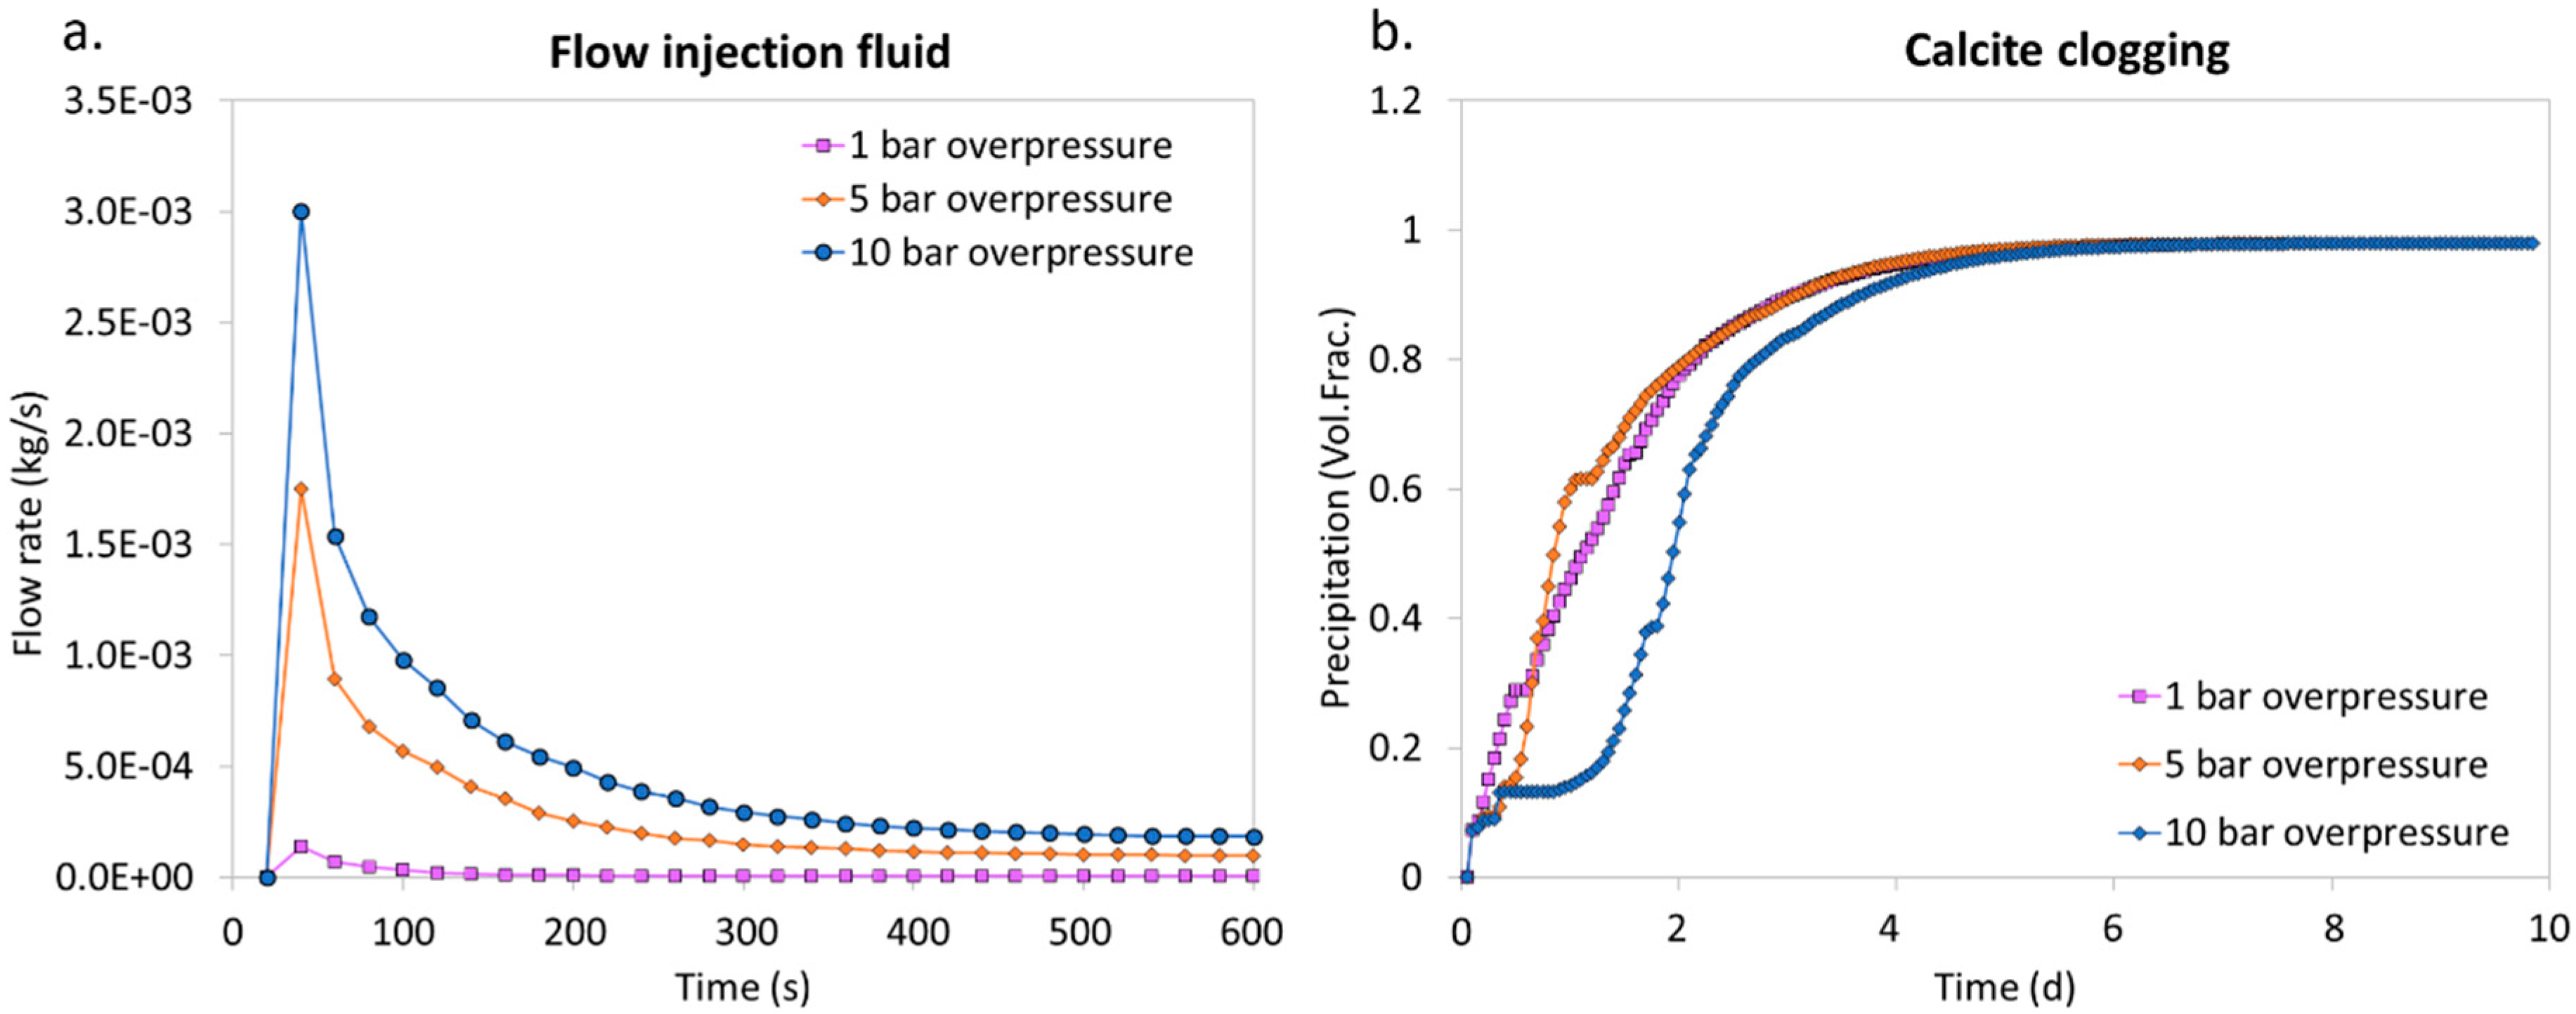
4.1. Injection of the CO2-Reactive Solution with Different Injection Pressures
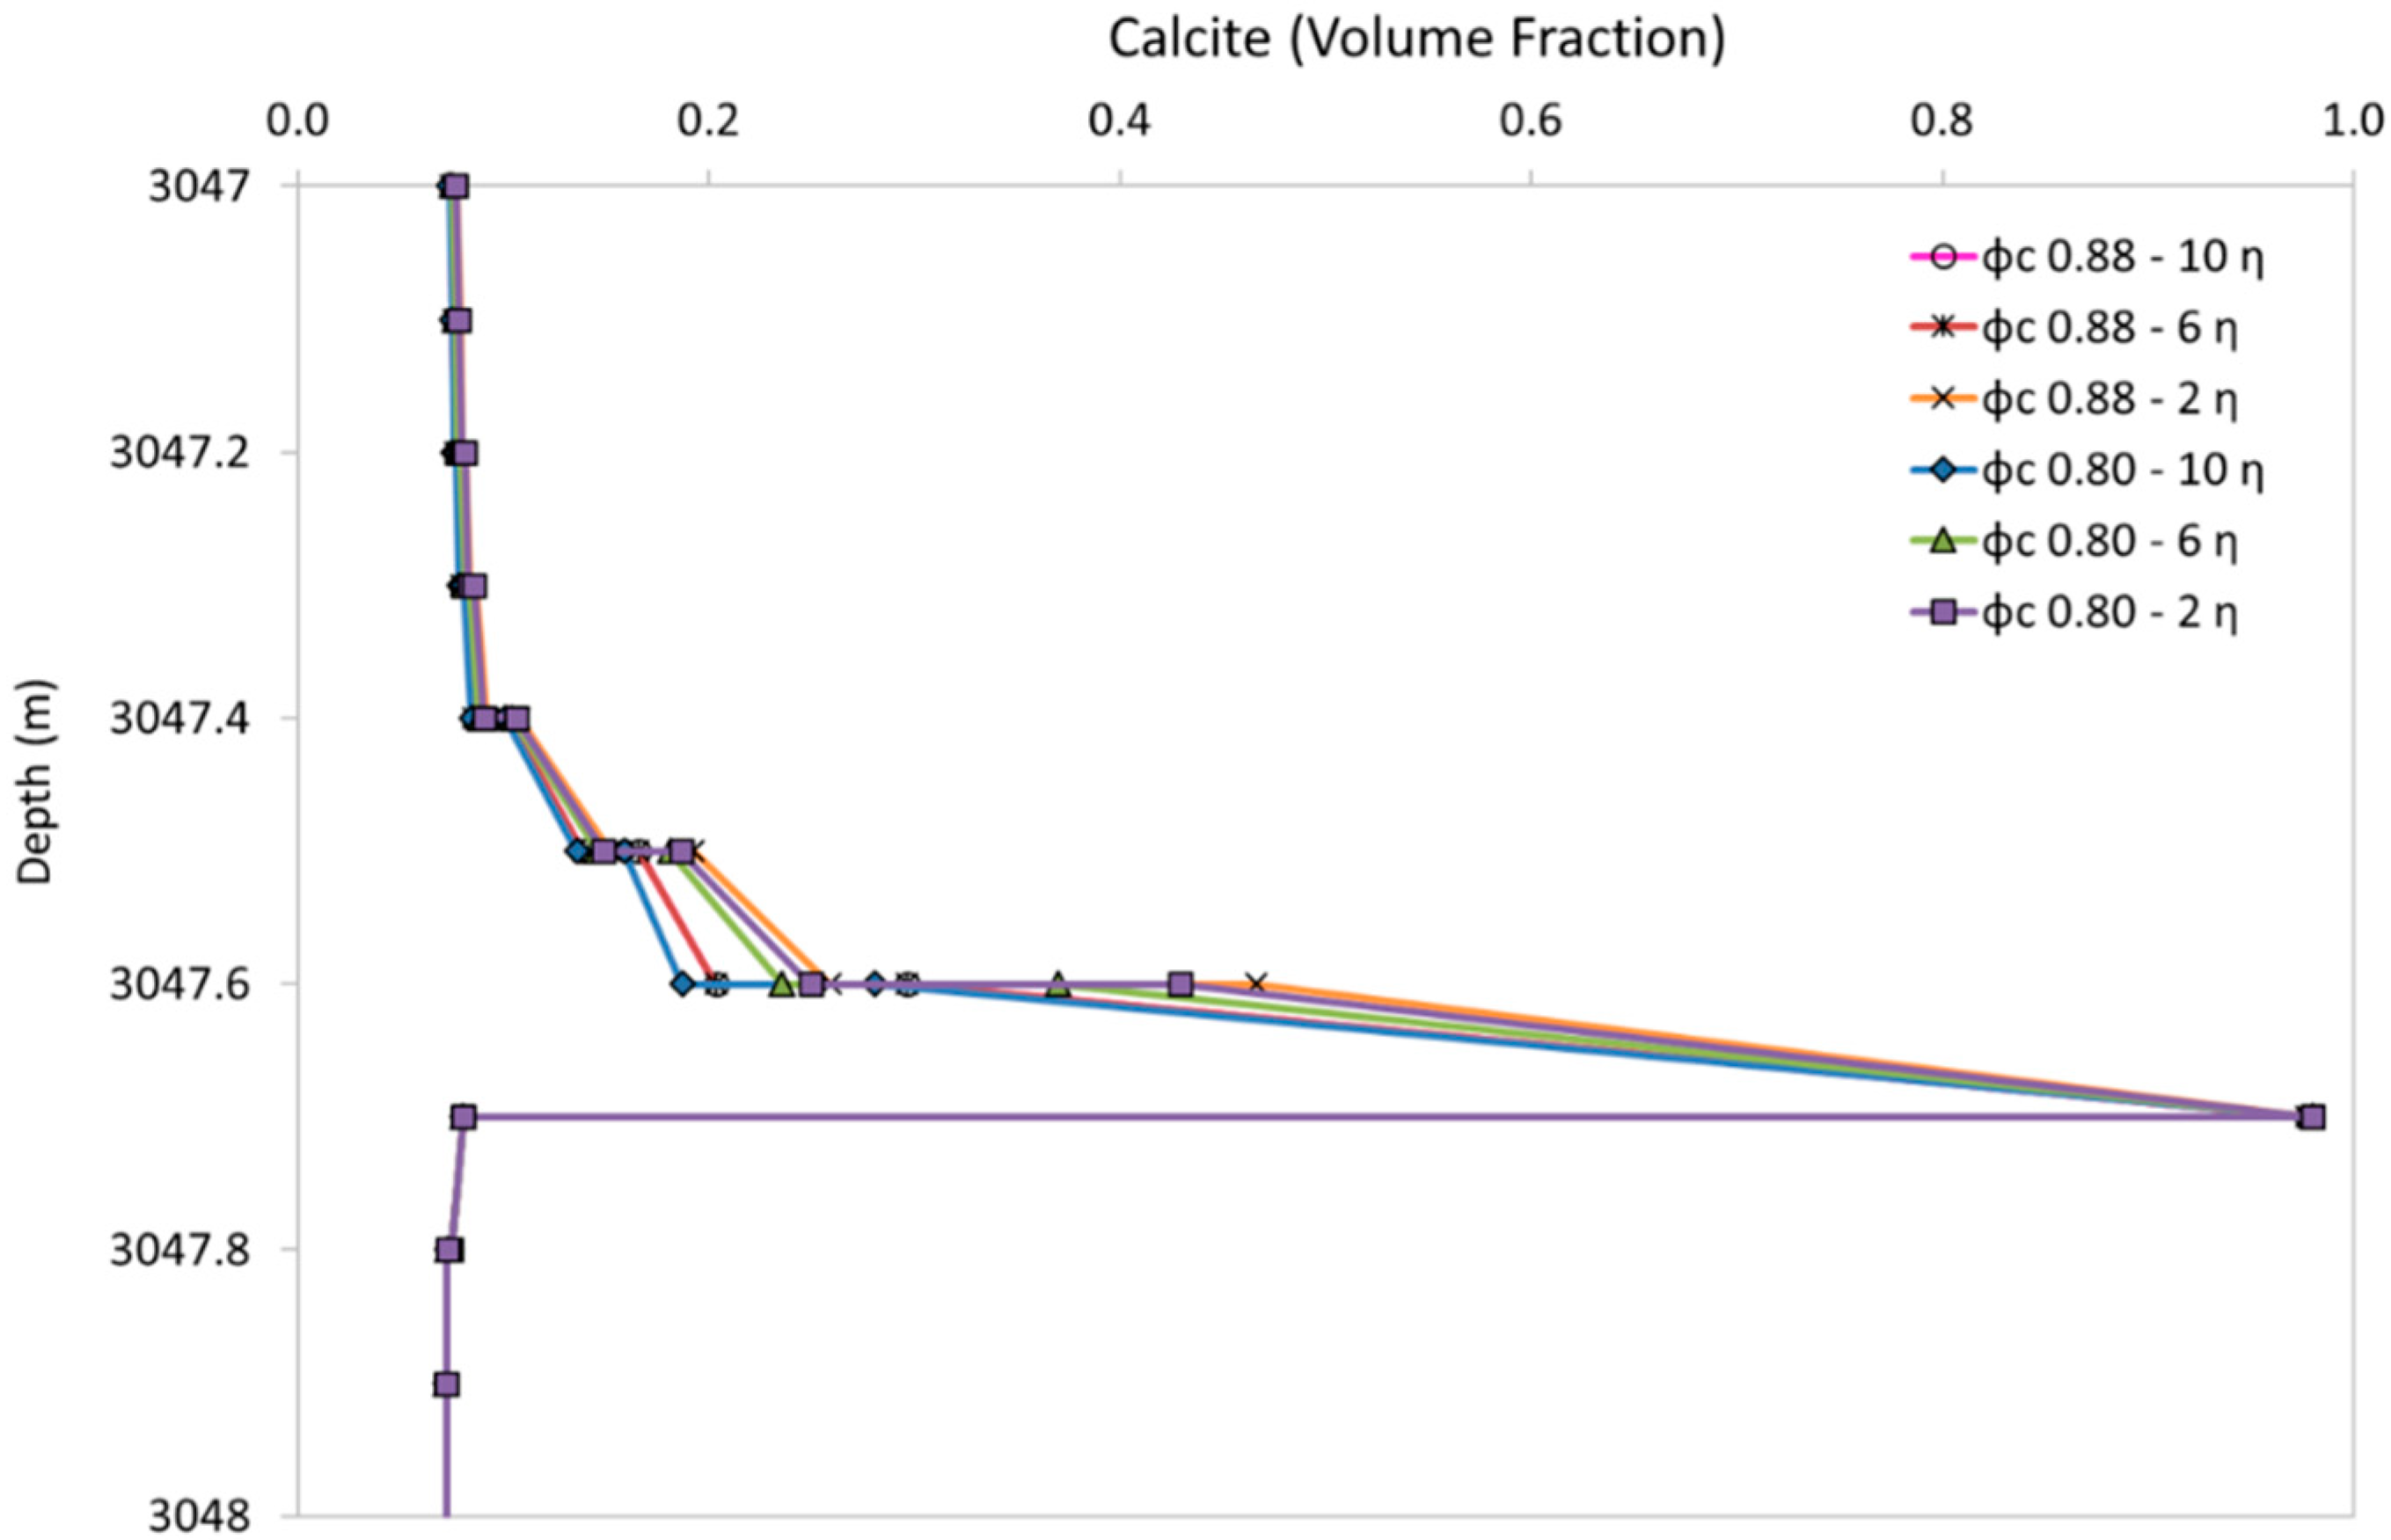
4.2. Sensitivity to Porosity-Permeability Relation Input Parameters
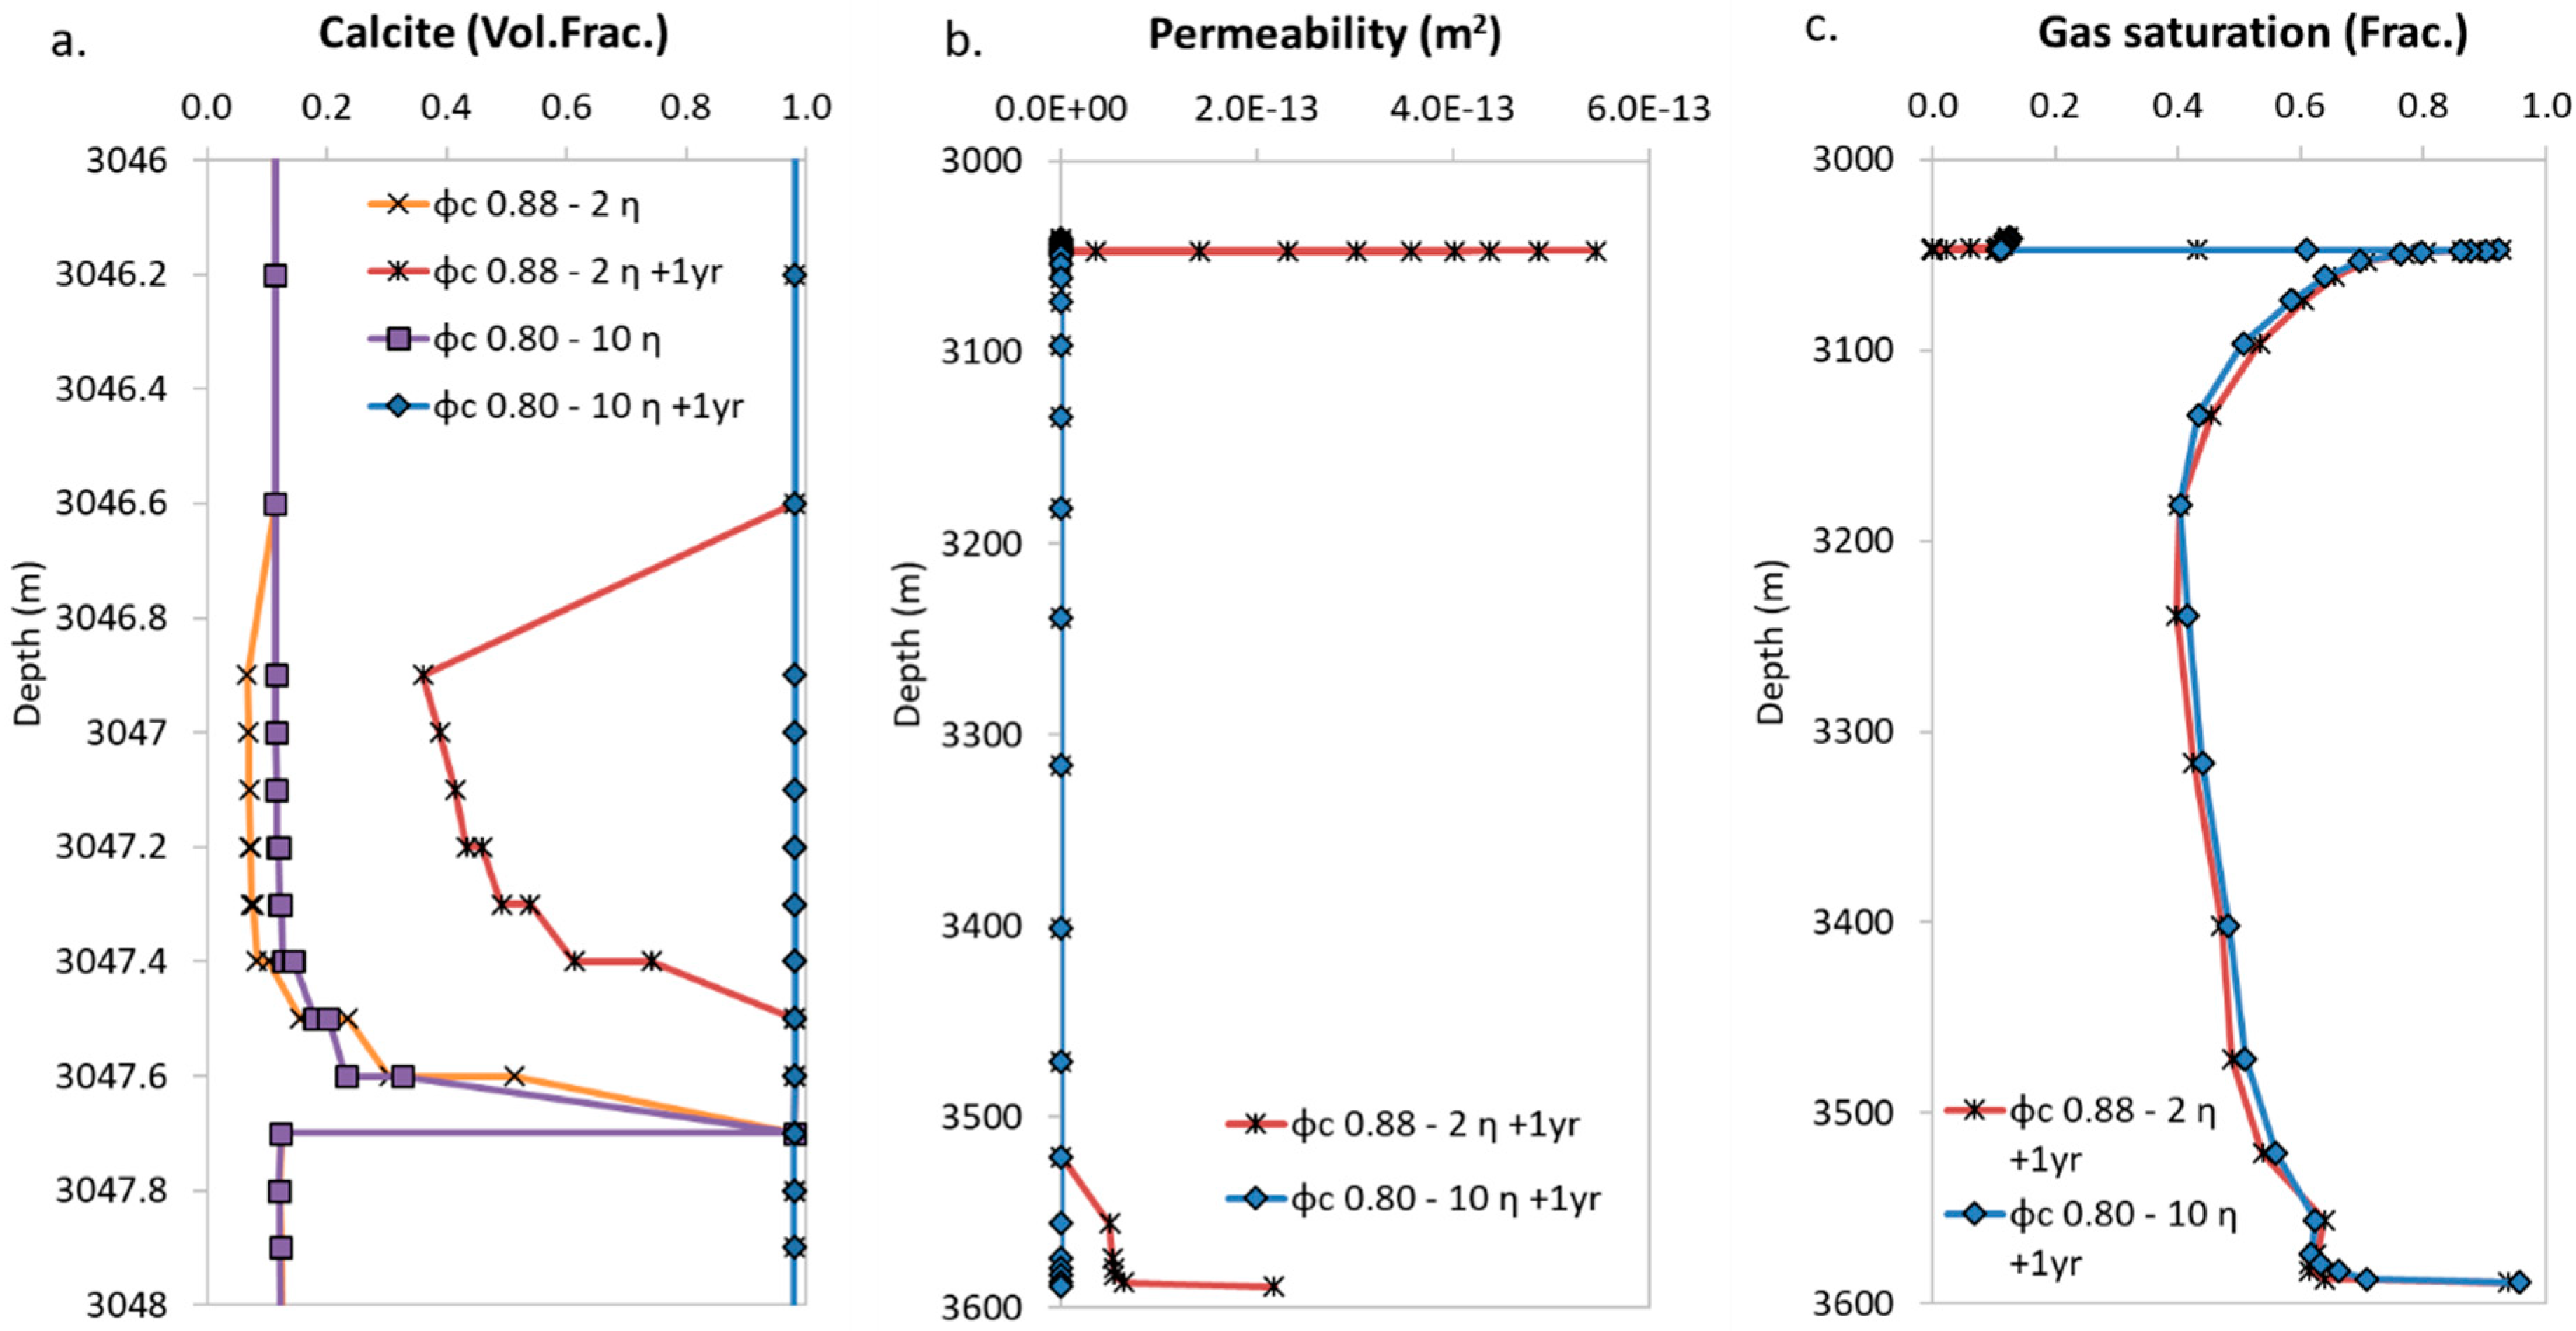
4.3. Stability of the Plug in Time
5. Discussion and Conclusions
Author Contributions
Funding
Conflicts of Interest
References
- Metz, B.; Davidson, O.; Coninck, H.D.; Loos, M.; Meyer, L. (Eds.) IPCC Special report on Carbon Dioxide Capture and Storage; Cambridge University Press: New York, NY, USA, 2005. [Google Scholar]
- Dusseault, M.B.; Gray, M.N.; Nawrocki, P.A. Why oilwells leak: Cement behavior and long-term consequences. In Proceedings of the International Oil and Gas Conference and Exhibition in China, Beijing, China, 7–10 November 2000. [Google Scholar]
- Bachu, S.; Bennion, D.B. Experimental assessment of brine and/or CO2 leakage through well cement at reservoir conditions. Int. J. Greenh. Gas Control 2009, 3, 494–501. [Google Scholar] [CrossRef]
- Carey, J.W.; Svec, R.; Grigg, R.; Zhang, J.; Crow, W. Experimental investigation of wellbore integrity and CO2-brine flow along the casing-cement microannulus. Int. J. Greenh. Gas Control 2010, 4, 272–282. [Google Scholar] [CrossRef]
- Gasda, S.E.; Bachu, S.; Celia, M.A. Spatial characterization of the location of potentially leaky wells penetrating a deep saline aquifer in a mature sedimentary basin. Environ. Geol. 2004, 46, 707–720. [Google Scholar] [CrossRef]
- Kutchko, B.G.; Strazisar, B.R.; Dzombak, D.A.; Lowry, G.V.; Thauiow, N. Degradation of well cement by CO2 under geologic sequestration conditions. Environ. Sci. Technol. 2007, 41, 4787–4792. [Google Scholar] [CrossRef]
- Carey, J.W.; Wigand, M.; Chipera, S.J.; WoldeGabriel, G.; Pawar, R.; Lichtner, P.C.; Wehner, S.C.; Raines, M.A.; Guthrie, G.D., Jr. Analysis and performance of oil well cement with 30 years of CO2 exposure from the SACROC Unit, West Texas, USA. Int. J. Greenh. Gas Control 2007, 1, 75–85. [Google Scholar] [CrossRef]
- Huet, B.; Prevost, J.H.; Scherer, G.W. Quantitative reactive transport modeling of Portland cement in CO2-saturated water. Int. J. Greenh. Gas Control 2010, 4, 561–574. [Google Scholar] [CrossRef]
- Gherardi, F.; Audigane, P.; Gaucher, E.C. Predicting long-term geochemical alteration of wellbore cement in a generic geological CO2 confinement site: Tackling a difficult reactive transport modeling challenge. J. Hydrol. 2012, 420, 340–359. [Google Scholar] [CrossRef]
- Duguid, A.; Scherer, G.W. Degradation of oilwell cement due to exposure to carbonated brine. Int. J. Greenh. Gas Control 2010, 4, 546–560. [Google Scholar] [CrossRef]
- Rimmelé, G.; Barlet-Gouédard, V.; Porcherie, O.; Goffé, B.; Brunet, F. Heterogeneous porosity distribution in Portland cement exposed to CO2-rich fluids. Cem. Concr. Res. 2008, 38, 1038–1048. [Google Scholar] [CrossRef]
- Barlet-Gouédard, V.; Rimmelé, G.; Porcherie, O.; Quisel, N.; Desroches, J. A solution against well cement degradation under CO2 geological storage environment. Int. J. Greenh. Gas Control 2009, 3, 206–216. [Google Scholar] [CrossRef]
- Temitope, A.; Gupta, I. A review of reactive transport modeling in wellbore integrity problems. J. Petrol. Sci. Eng. 2019, 175, 785–803. [Google Scholar]
- Lea, F.M. The constitution of Portland cement. Q. Rev. Chem. Soc. 1949, 3, 82–93. [Google Scholar] [CrossRef]
- Wasch, L.J.; Koenen, M.; Wollenweber, J.; Tambach, T.J. Sensitivity of chemical cement alteration—Modeling the effect of parameter uncertainty and varying subsurface conditions. GHG S T 2015, 5, 323–338. [Google Scholar] [CrossRef]
- Huerta, N.J.; Hesse, M.A.; Bryant, S.L.; Strazisar, B.R.; Lopano, C. Reactive transport of CO2-saturated water in a cement fracture: Application to wellbore leakage during geologic CO2 storage. Int. J. Greenh. Gas Control 2016, 44, 276–289. [Google Scholar] [CrossRef]
- Guthrie, G.D.; Pawar, R.J.; Carey, W.J.; Karra, S.; Harp, D.R.; Viswanathan, H.S. The mechanisms, dynamics, and implications of self-sealing and CO2 resistance in wellbore cements. Int. J. Greenh. Gas Control 2018, 75, 162–179. [Google Scholar] [CrossRef]
- Koenen, M.; Wasch, L.J. The Potential of CO2 Leakage Along De-Bonded Cement-Rock Interface. In Proceedings of the 14th Greenhouse Gas Control Technologies Conference, Melbourne, Australia, 21–26 October 2018; Available online: https://ssrn.com/abstract=3365897 (accessed on 21 April 2019).
- Wolterbeek, T.K.; Raoof, A. Meter-scale reactive transport modeling of CO2-rich fluid flow along debonded wellbore casing-cement interfaces. Environ. Sci. Technol. 2018, 52, 3786–3795. [Google Scholar] [CrossRef]
- Neele, F.; Grimstad, A.; Fleury, M.; Liebscher, A.; Korre, A.; Wilkinson, M. MiReCOL: Developing Corrective Measures for CO2 Storage. Energy Procedia 2014, 63, 4658–4665. [Google Scholar] [CrossRef]
- Pizzocolo, F.; Peters, E.; Loeve, D.; Hewson, C.W.; Wasch, L.; Brunner, L.J. Feasibility of Novel Techniques to Mitigate or Remedy CO2 Leakage. In Proceedings of the SPE Europec featured at 79th EAGE Conference and Exhibition, Paris, France, 12–15 June 2017. [Google Scholar] [CrossRef]
- Wasch, L.J.; Wollenweber, J.; Tambach, T.J. A novel concept for long-term CO2 sealing by intentional salt clogging. GHG S T 2013, 3, 491–502. [Google Scholar]
- Ito, T.; Xu, T.; Tanaka, H.; Taniuchi, Y.; Okamoto, A. Possibility to remedy CO2 leakage from geological reservoir using CO2 reactive grout. Int. J. Greenh. Gas Control 2014, 20, 310–323. [Google Scholar] [CrossRef]
- Druhan, J.L.; Vialle, S.; Maher, K.; Benson, S. Numerical simulation of reactive barrier emplacement to control CO2 migration. In Carbon Dioxide Capture for Storage in Deep Geologic Formations—Results from the CO2 Capture Project; Gerdes, K.F., Ed.; CPL Press and BPCNAI: Thatcham, Berks, UK, 2015. [Google Scholar]
- Wasch, L.J.; Wollenweber, J.; Neele, F.; Fleury, M. Mitigating CO2 Leakage by Immobilizing CO2 into Solid Reaction Products. Energy Procedia 2017, 114, 4214–4226. [Google Scholar] [CrossRef]
- Xu, T.; Sonnenthal, E.; Spycher, N.; Pruess, K. TOUGHREACT—A simulation program for non-isothermal multiphase reactive geochemical transport in variably saturated geologic media: Applications to geothermal injectivity and CO2 geological sequestration. Computat. Geosci. 2006, 32, 145–165. [Google Scholar] [CrossRef]
- Pruess, K. ECO2N: A TOUGH2 Fluid Property Module for Mixtures of Water, NaCl, and CO2; Lawrence Berkeley National Laboratory: Berkeley, CA, USA, 2005. [Google Scholar]
- Blanc, P.H.; Lassin, A.; Piantone, P.; Azaroual, M.; Jacquement, N.; Fabbri, A.; Gaucher, E.C. Thermoddem: A geochemical database focused on low temperature water/rock interactions and waste materials. Appl. Geochem. 2012, 27, 2107–2116. [Google Scholar] [CrossRef]
- Lasaga, A.C.; Soler, J.M.; Ganor, J.; Burch, T.E.; Nagy, K.L. Chemical weathering rate laws and global geochemical cycles. Geochim. Cosmochim. Acta 1994, 58, 2361–2386. [Google Scholar] [CrossRef]
- Hommel, J.; Coltman, E.; Class, H. Porosity–Permeability Relations for Evolving Pore Space: A Review with a Focus on (Bio)geochemically Altered Porous Media. Transp. Porous Med. 2018, 124, 589–629. [Google Scholar] [CrossRef]
- Verma, A.; Pruess, K. Thermohydrological conditions and silica redistribution near high-level nuclear wastes emplaced in saturated geological formations. J. Geophys. Res. 1988, 93, 1159–1173. [Google Scholar] [CrossRef]
- Palandri, J.L.; Kharaka, Y.K. A Compilation of Rate Parameters of Water-Mineral Interaction Kinetics for Application to Geochemical Modelling; Open File Report; U.S. Geological Survey: Menlo Park, CA, USA, 2004.
- Baur, I.; Keller, P.; Mavrocordatos, D.; Wehrli, B.; Johnson, C.A. Dissolution–precipitation behaviour of ettringite, monosulfate, and calcium silicate hydrate. Cem. Concr. Res. 2004, 34, 341–348. [Google Scholar] [CrossRef]
- Marty, N.C.M.; Claret, F.; Lassin, A.; Tremosa, J.; Blanc, P.; Madé, B.; Giffaut, E.; Cochepin, B.; Tournassat, C. A database of dissolution and precipitation rates for clay-rocks minerals. Appl. Geochem. 2015, 55, 108–118. [Google Scholar] [CrossRef]
- Xu, T.; Ontoy, Y.; Molling, P.; Spycher, N.; Parini, M.; Pruess, K. Reactive transport modeling of injection well scaling and acidizing at Tiwi field, Philippines. Geothermics 2004, 33, 477–491. [Google Scholar] [CrossRef]
- Orlic, B.; Chitu, A.; Brunner, L.; Koenen, M.; Wollenweber, J.; Schreppers, G.-J. Numerical Investigations of Cement Interface Debonding for Assessing Well Integrity Risks. In Proceedings of the 52nd U.S. Rock Mechanics/Geomechanics Symposium, Seattle, WA, USA, 17–20 June 2018. [Google Scholar]


| Transport Properties | Unit | Reservoir | Cement | Caprock | Microannulus | Aquifer |
|---|---|---|---|---|---|---|
| Porosity | φ (-) | 0.2 | 0.3 | 0.1 | 0.9 | 0.2 |
| Permeability | k (m2) | 2.0 × 10⁻¹³ | 1.0 × 10⁻³⁰ * | 1.0 × 10⁻³⁰ * | 1.3 × 10⁻¹² | 2.0 × 10⁻¹³ |
| Tortuosity | τ (-) | 0.4 | 0.01 | 0.05 | 0.4 | 0.4 |
| Capillary Curve | ||||||
| Van Genuchten | λ (-) | 0.2 | - | - | - | 0.2 |
| Slr (-) | 0.1 | - | - | - | 0.1 | |
| 1/P0 (-) | 0.002 | - | - | - | 0.002 | |
| P0 (Pa) | 1.0 × 10⁸ | - | - | - | 1.0 × 10⁸ | |
| Sls (-) | 1 | - | - | - | 1 | |
| TRUST | P0 (Pa) | - | 1.0 × 10⁶ | 1.0 × 10⁶ | - | - |
| Slr (-) | - | 0.2 | 0.2 | - | - | |
| η (-) | - | 0.4 | 0.4 | - | - | |
| Pe (Pa) | - | 4.0 × 10⁶ | 4.0 × 10⁶ | - | - |
| Mineral-Formula | Cement (Volume Fraction) | Aquifer/Caprock (Volume Fraction) |
|---|---|---|
| Portlandite-(Ca(OH)2) | 0.2 | - |
| CSH(1.6)-(Ca1.60SiO3.6:2.58H2O) | 0.6 | - |
| Monosulfoaluminate-(Ca4Al2SO10:12H2O) | 0.1 | - |
| Hydrotalcite-(Mg4Al2O7:10H2O) | 0.1 | - |
| Quartz-(SiO2) | - | 0.7 |
| Calcite-(CaCO3) | - | 0.01 |
| Amorphous silica-(SiO2) | - | - |
| Anhydrite-(CaSO4) | - | 0.01 |
| Dolomite-(CaMg(CO3)2) | - | 0.01 |
| Gibbsite-(Al(OH)3) | - | - |
| Microcline-(K(AlSi3)O8) | - | 0.1 |
| Albite-(NaAlSi3O8) | - | 0.1 |
| Kaolinite-(Al2Si2O5(OH)4 | - | 0.07 |
| Mineral | Acid Mechanism | Neutral Mechanism | Carbonate/Base Mechanism | |||||
|---|---|---|---|---|---|---|---|---|
| Log (k25 °C) (mol/m2/s) | ΔH (kJ/mol) | n | Log (k25 °C) (mol/m2/s) | ΔH (kJ/mol) | Log (k25 °C) (mol/m2/s) | ΔH (kJ/mol) | n | |
| Portlandite *c | −3.10 | 75 | 0.6 | −7.66 | 75 | - | - | - |
| C1.6SH *c | −7.23 | 23 | −0.28 | - | - | - | - | - |
| Monosulf. *b | −3.09 | 74.9 | 0.6 | −11.2 | 15 | - | - | - |
| Hydrotal. *b | −7.23 | 15 | 0.28 | −17.8 | 15 | - | - | - |
| Quartz *a | −7.52 | 56.9 | 0.5 | −4.55 | 56.9 | - | - | - |
| Calcite *a | −0.30 | 14.4 | 1 | −5.81 | 23.5 | −3.48 | 35.4 | 1 |
| Silica(am) *a | - | - | - | −9.42 | 49.8 | - | - | - |
| Anhydrite *a | - | - | - | −3.19 | 14.3 | - | - | - |
| Dolomite *a | −3.19 | 36.1 | 0.5 | −7.53 | 52.2 | −5.11 | 34.8 | 0.5 |
| Gibbsite *a | −7.65 | 47.5 | 0.99 | −11.5 | 61.2 | −16.7 | 80.1 | −0.78 |
| Albite *a | −10.2 | 65 | 0.46 | −12.6 | 69.8 | −15.6 | 71 | −0.57 |
| Cement | Aquifer/Caprock | CO2 Reservoir | CO2-Reactive Solution | |
|---|---|---|---|---|
| pH (-) | 10.8 | 6.2 | 3.5 | 13.8 |
| Ca2+ | 1.30 × 10⁻² | 3.15 × 10⁻² | 3.10 × 10⁻² | 0.68 |
| Mg2+ | 1.69 × 10⁻⁸ | 9.32 × 10⁻³ | 9.16 × 10⁻³ | - |
| Na+ | 1.0 | 0.98 | 0.98 | 1.03 |
| K+ | - | 8.62 × 10⁻³ | 8.48 × 10⁻³ | - |
| H4SiO4 | 4.10 × 10⁻⁶ | 8.57 × 10⁻⁴ | 8.46 × 10⁻⁴ | - |
| HCO3− | - | 8.29 × 10⁻³ | 1.78 | - |
| SO42− | 2.07 × 10⁻⁴ | 3.25 × 10⁻² | 3.20 × 10⁻² | - |
| Al3+ | 4.14 × 10⁻⁴ | 7.24 × 10⁻⁸ | 7.12 × 10⁻⁸ | - |
| Cl− | 1.0 | 1.0 | 0.98 | 1.03 |
| Scenario (φc–η) | 0.8–6 | 0.8–2 | 0.8–10 | 0.88–2 | 0.88–6 | 0.88–10 |
| Remediation Time (d) | 39 | 7 | 48 | 11 | 45 | 113 |
© 2019 by the authors. Licensee MDPI, Basel, Switzerland. This article is an open access article distributed under the terms and conditions of the Creative Commons Attribution (CC BY) license (http://creativecommons.org/licenses/by/4.0/).
Share and Cite
Wasch, L.; Koenen, M. Injection of a CO2-Reactive Solution for Wellbore Annulus Leakage Remediation. Minerals 2019, 9, 645. https://doi.org/10.3390/min9100645
Wasch L, Koenen M. Injection of a CO2-Reactive Solution for Wellbore Annulus Leakage Remediation. Minerals. 2019; 9(10):645. https://doi.org/10.3390/min9100645
Chicago/Turabian StyleWasch, Laura, and Mariëlle Koenen. 2019. "Injection of a CO2-Reactive Solution for Wellbore Annulus Leakage Remediation" Minerals 9, no. 10: 645. https://doi.org/10.3390/min9100645
APA StyleWasch, L., & Koenen, M. (2019). Injection of a CO2-Reactive Solution for Wellbore Annulus Leakage Remediation. Minerals, 9(10), 645. https://doi.org/10.3390/min9100645