Experimental Investigation of Perceptual Characteristics of Functional Cemented Backfilling Materials in Coal Mines


Abstract
1. Introduction
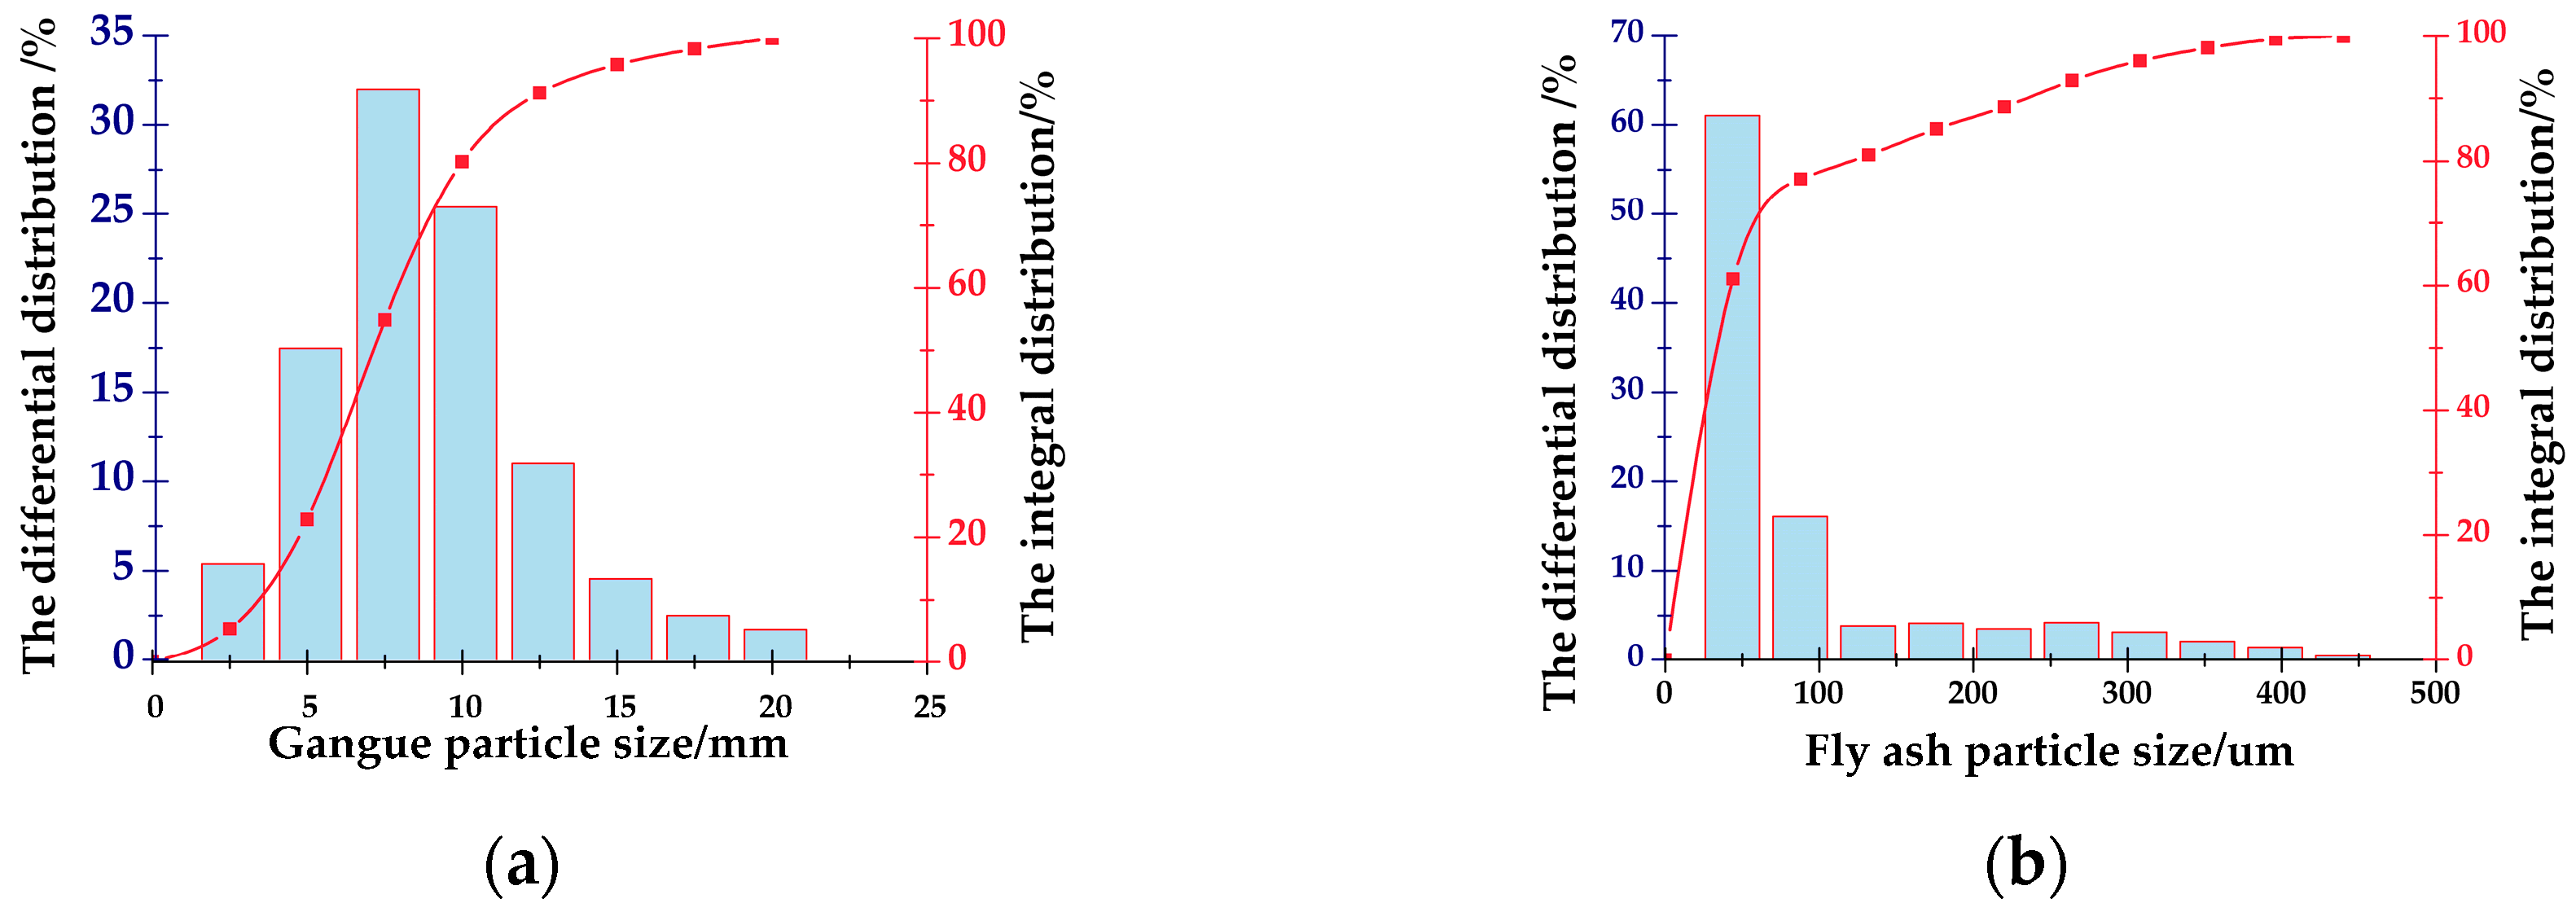
2. Experimental
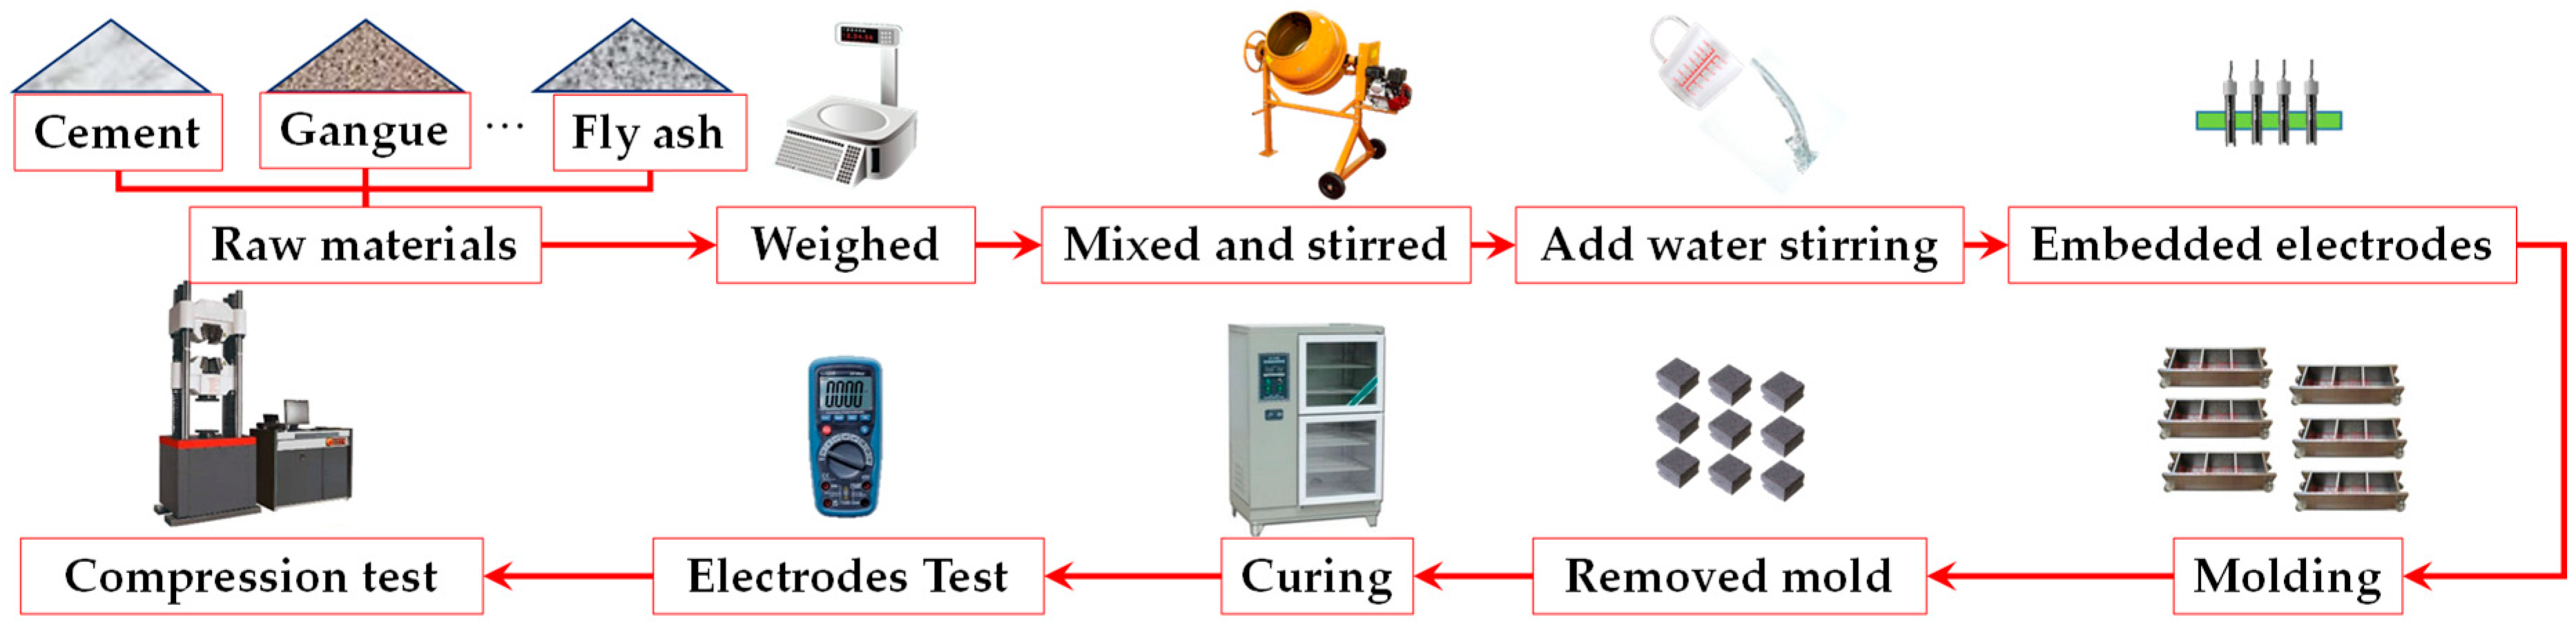
2.1. Test Procedures
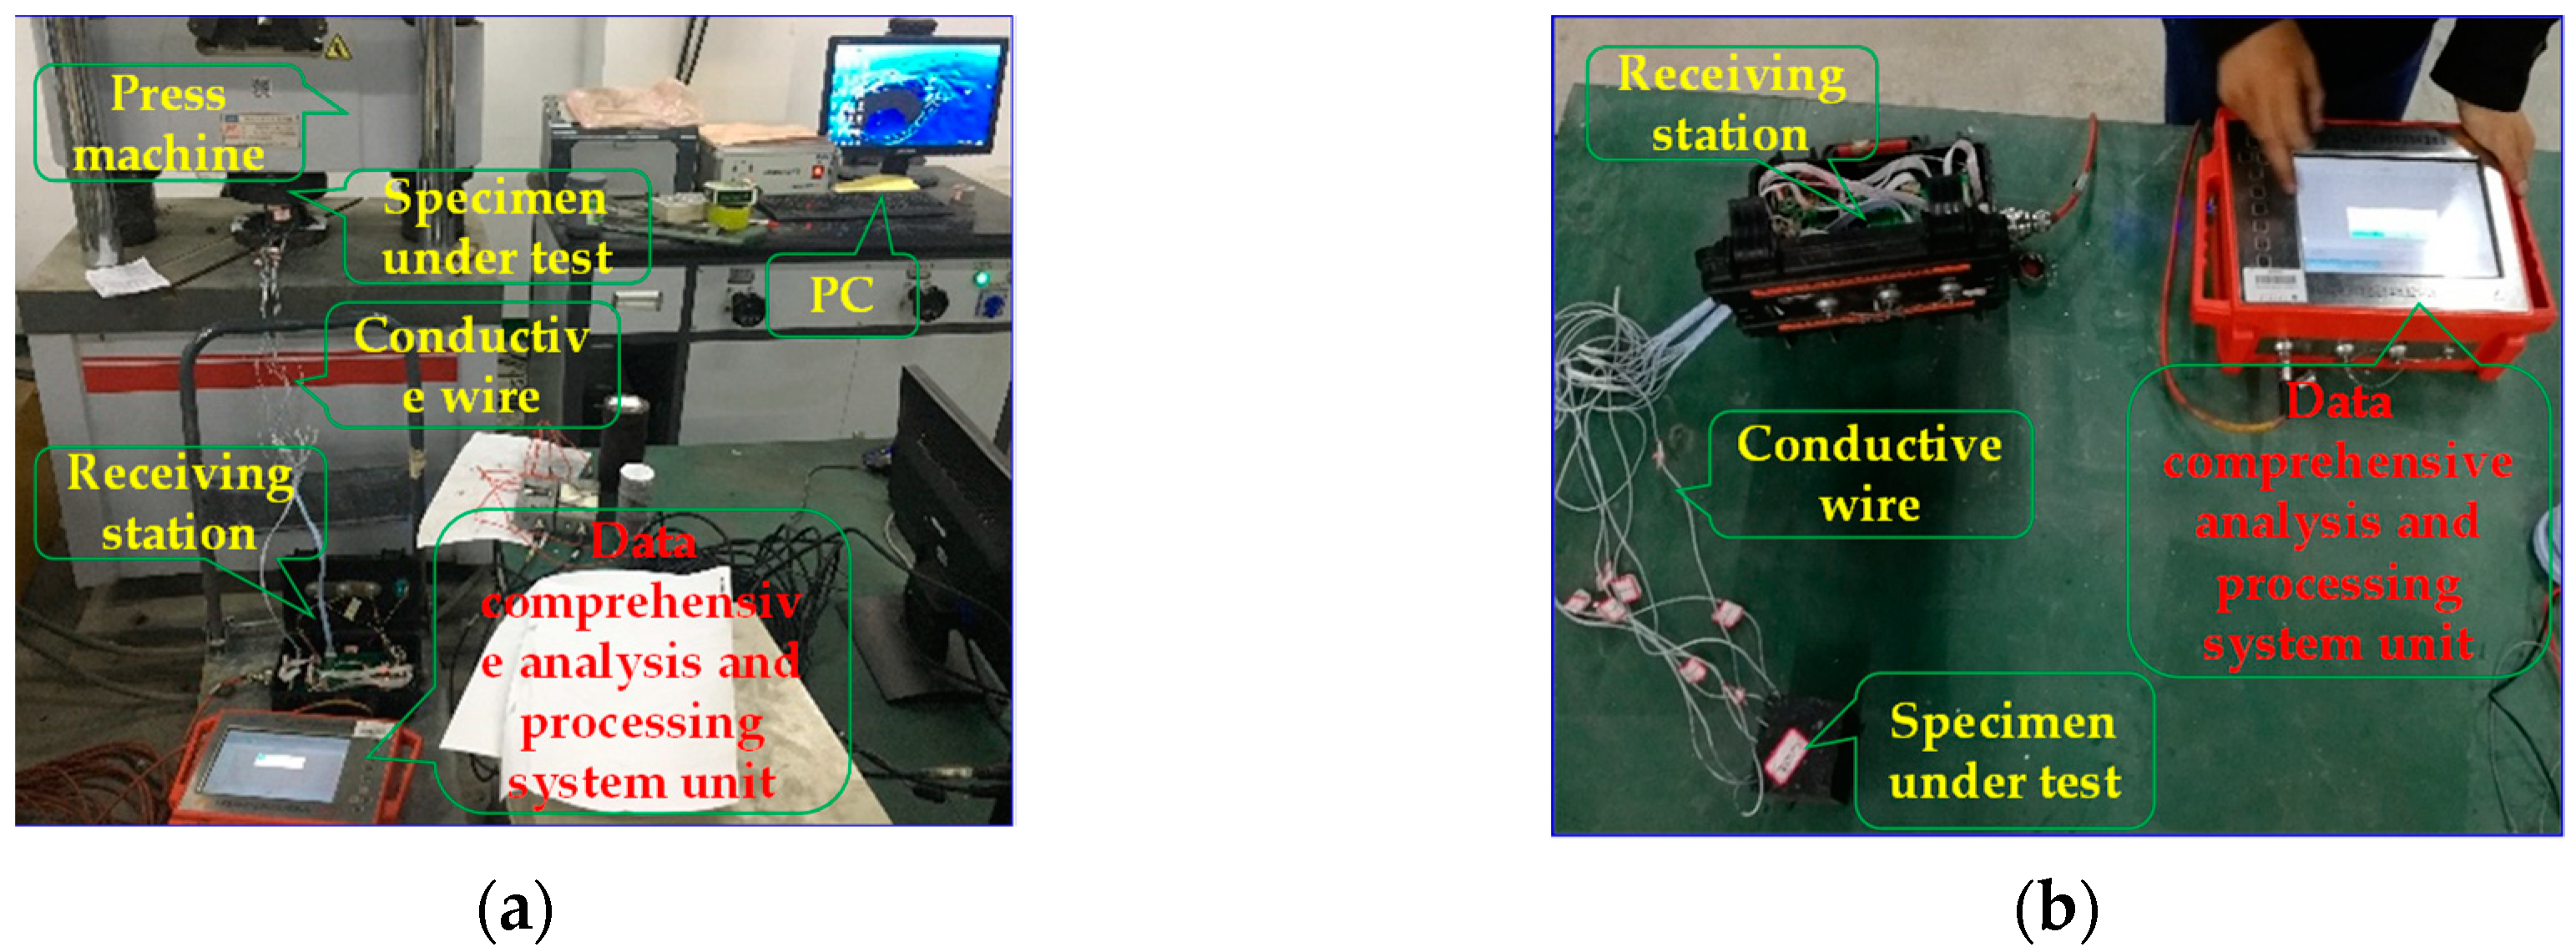
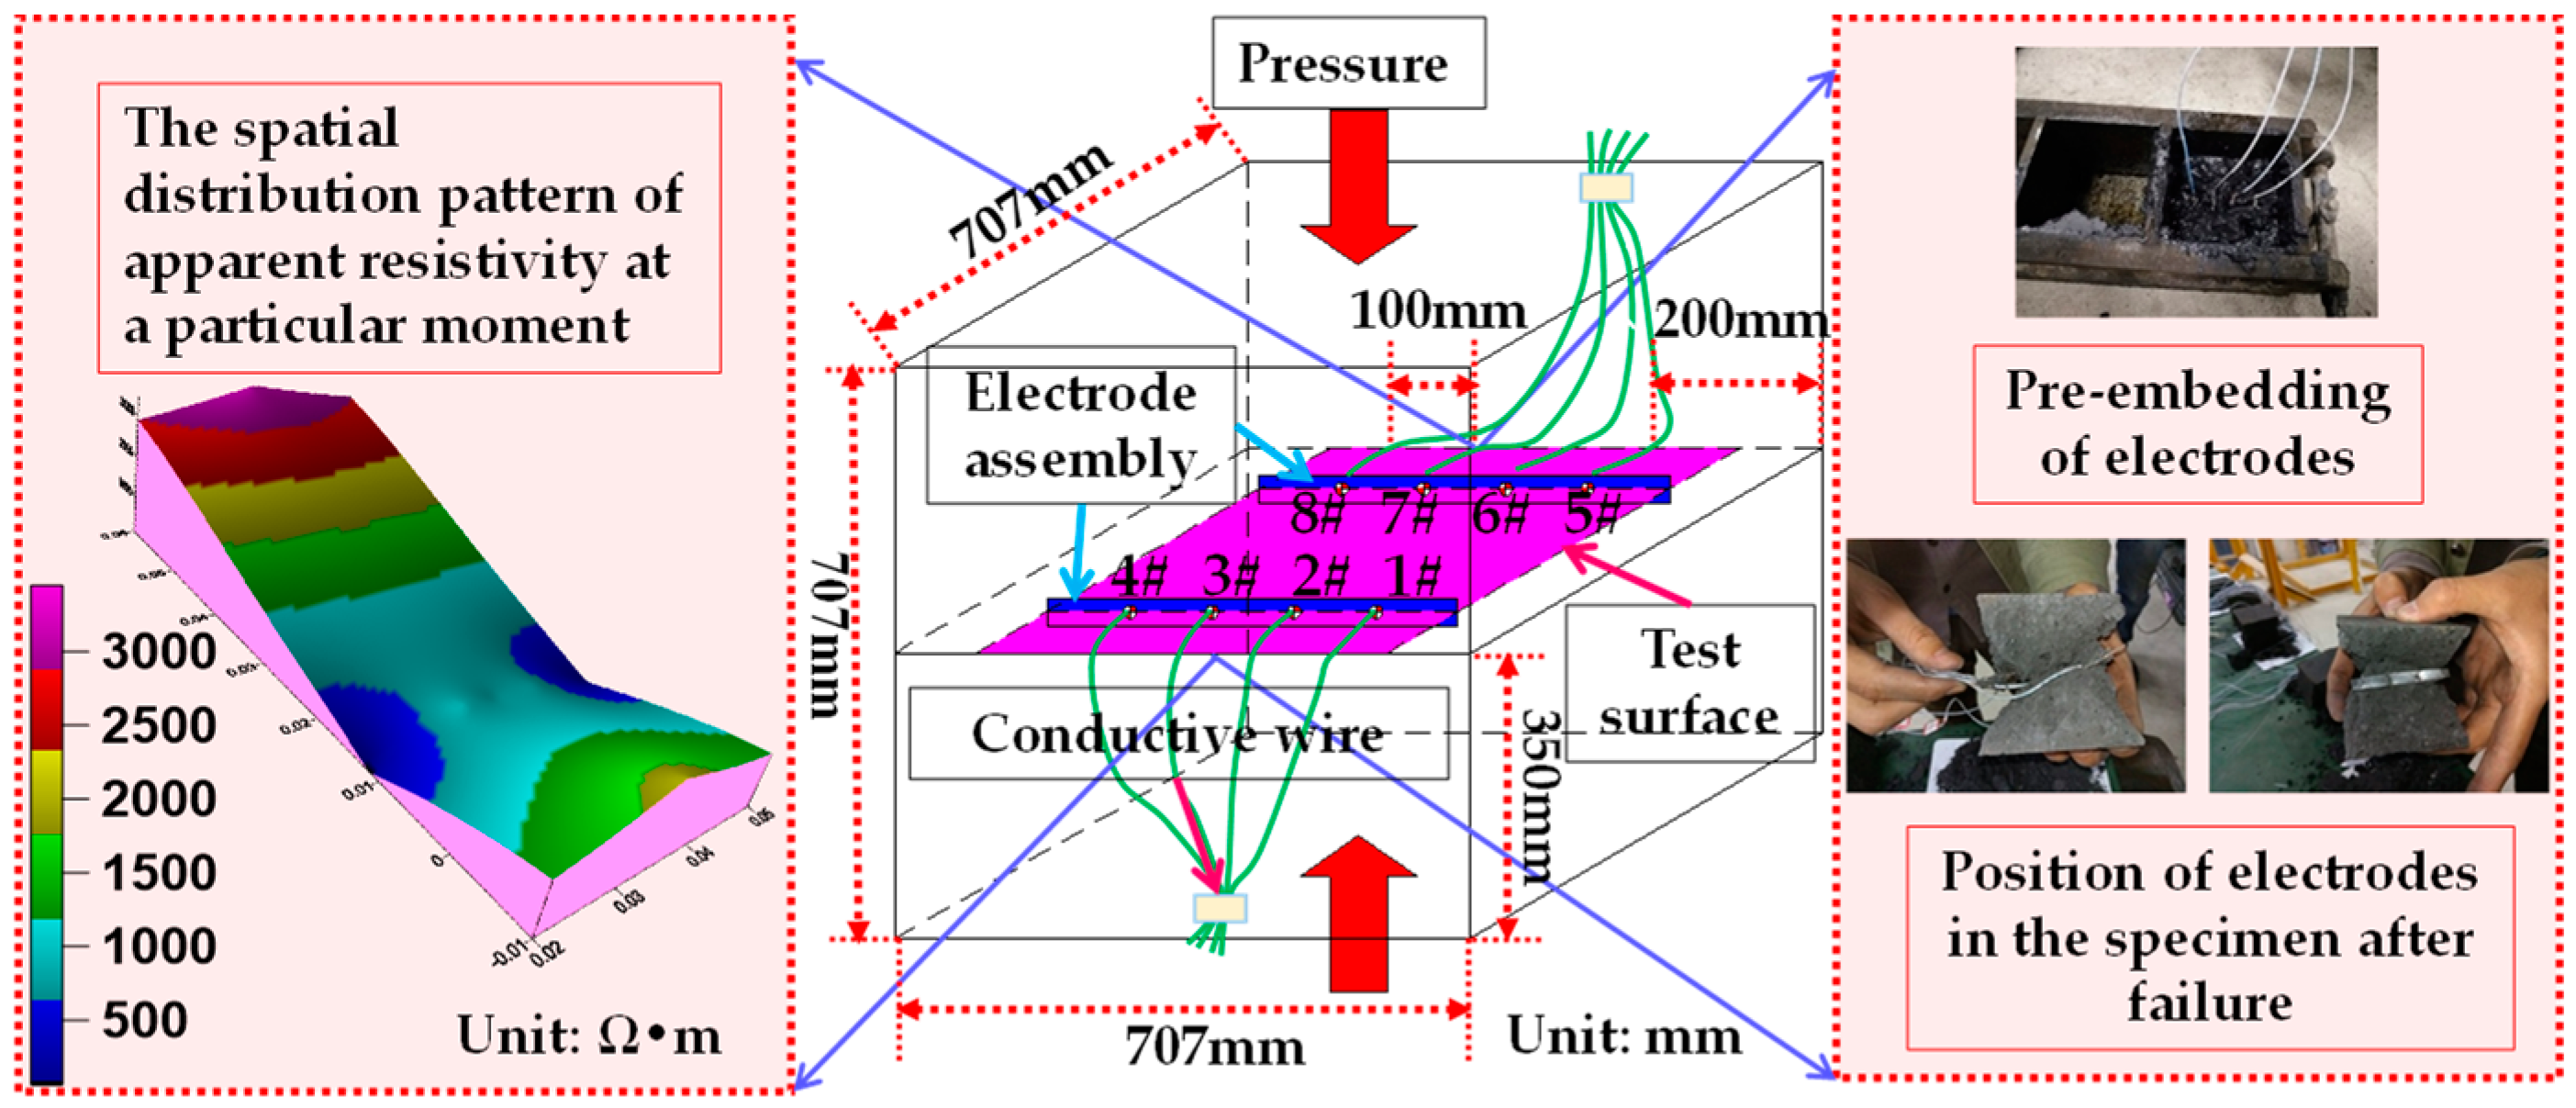
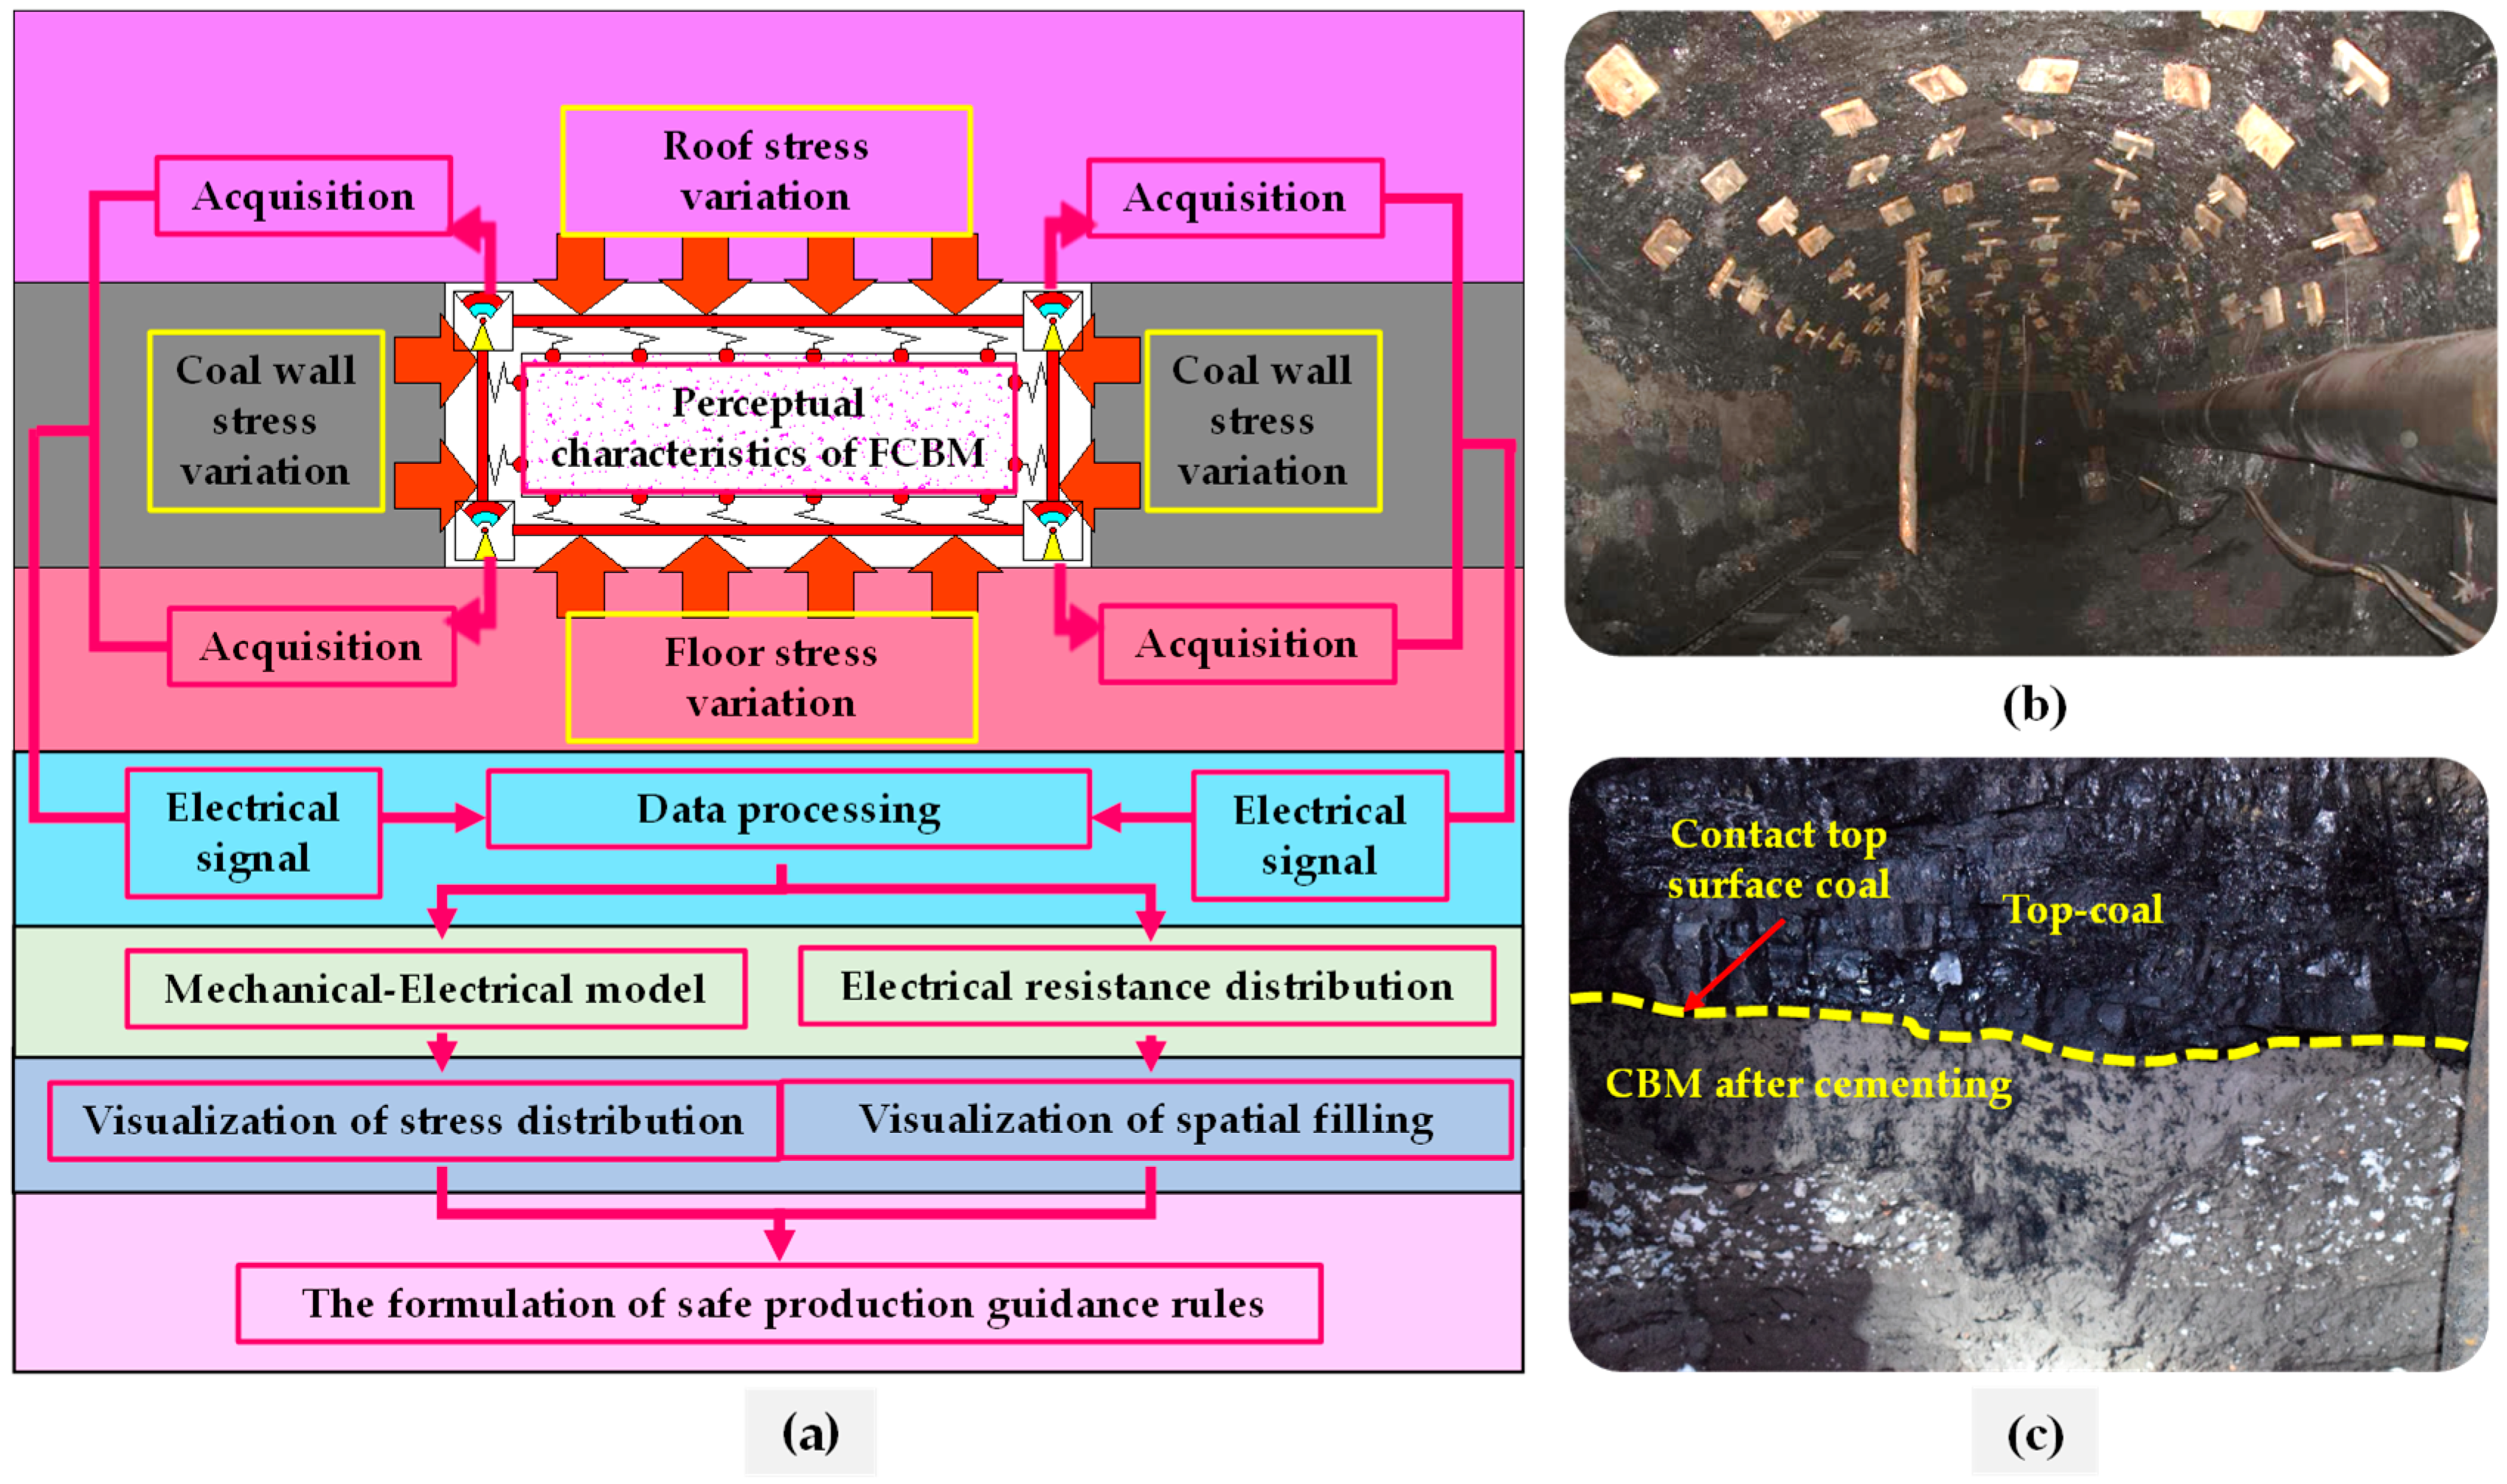
2.2. Principle of Resistivity Measurement
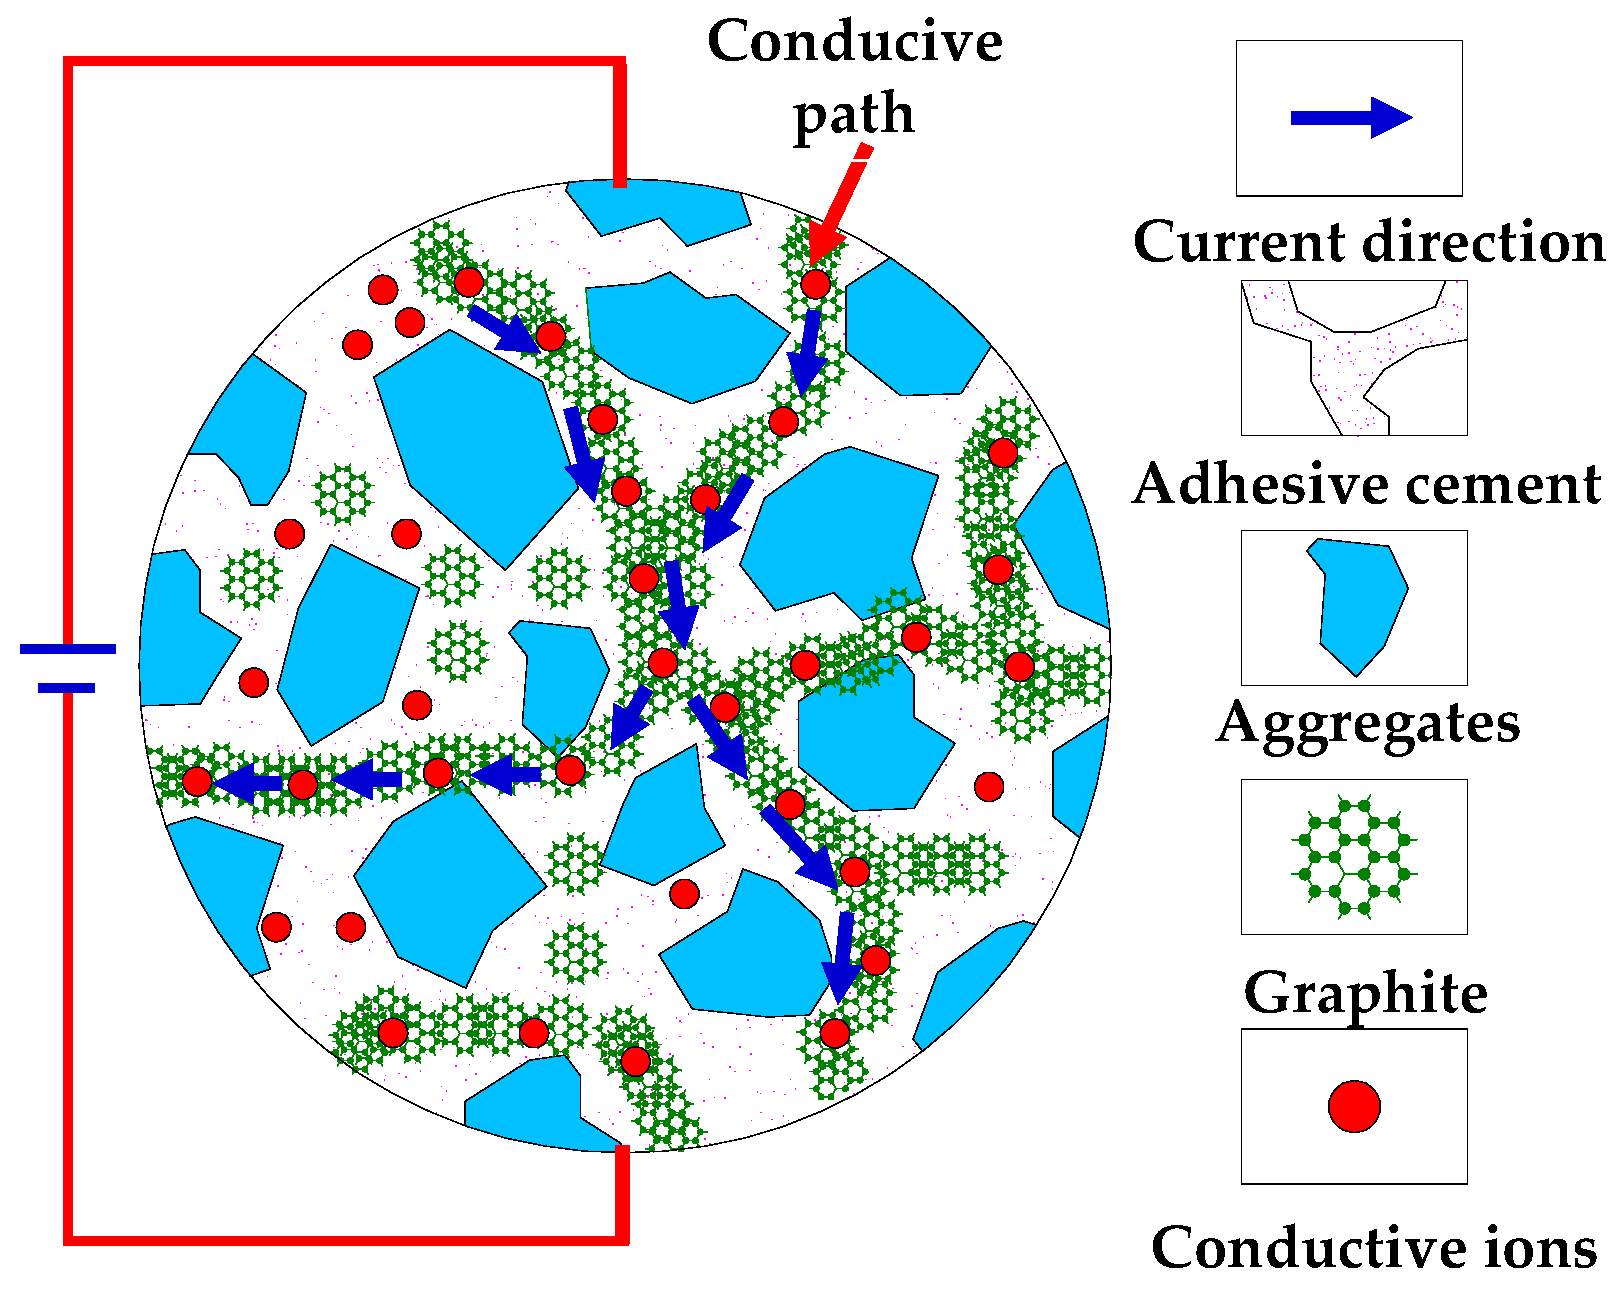
2.3. Conductive and Perceptual Mechanism
3. Results and Discussion
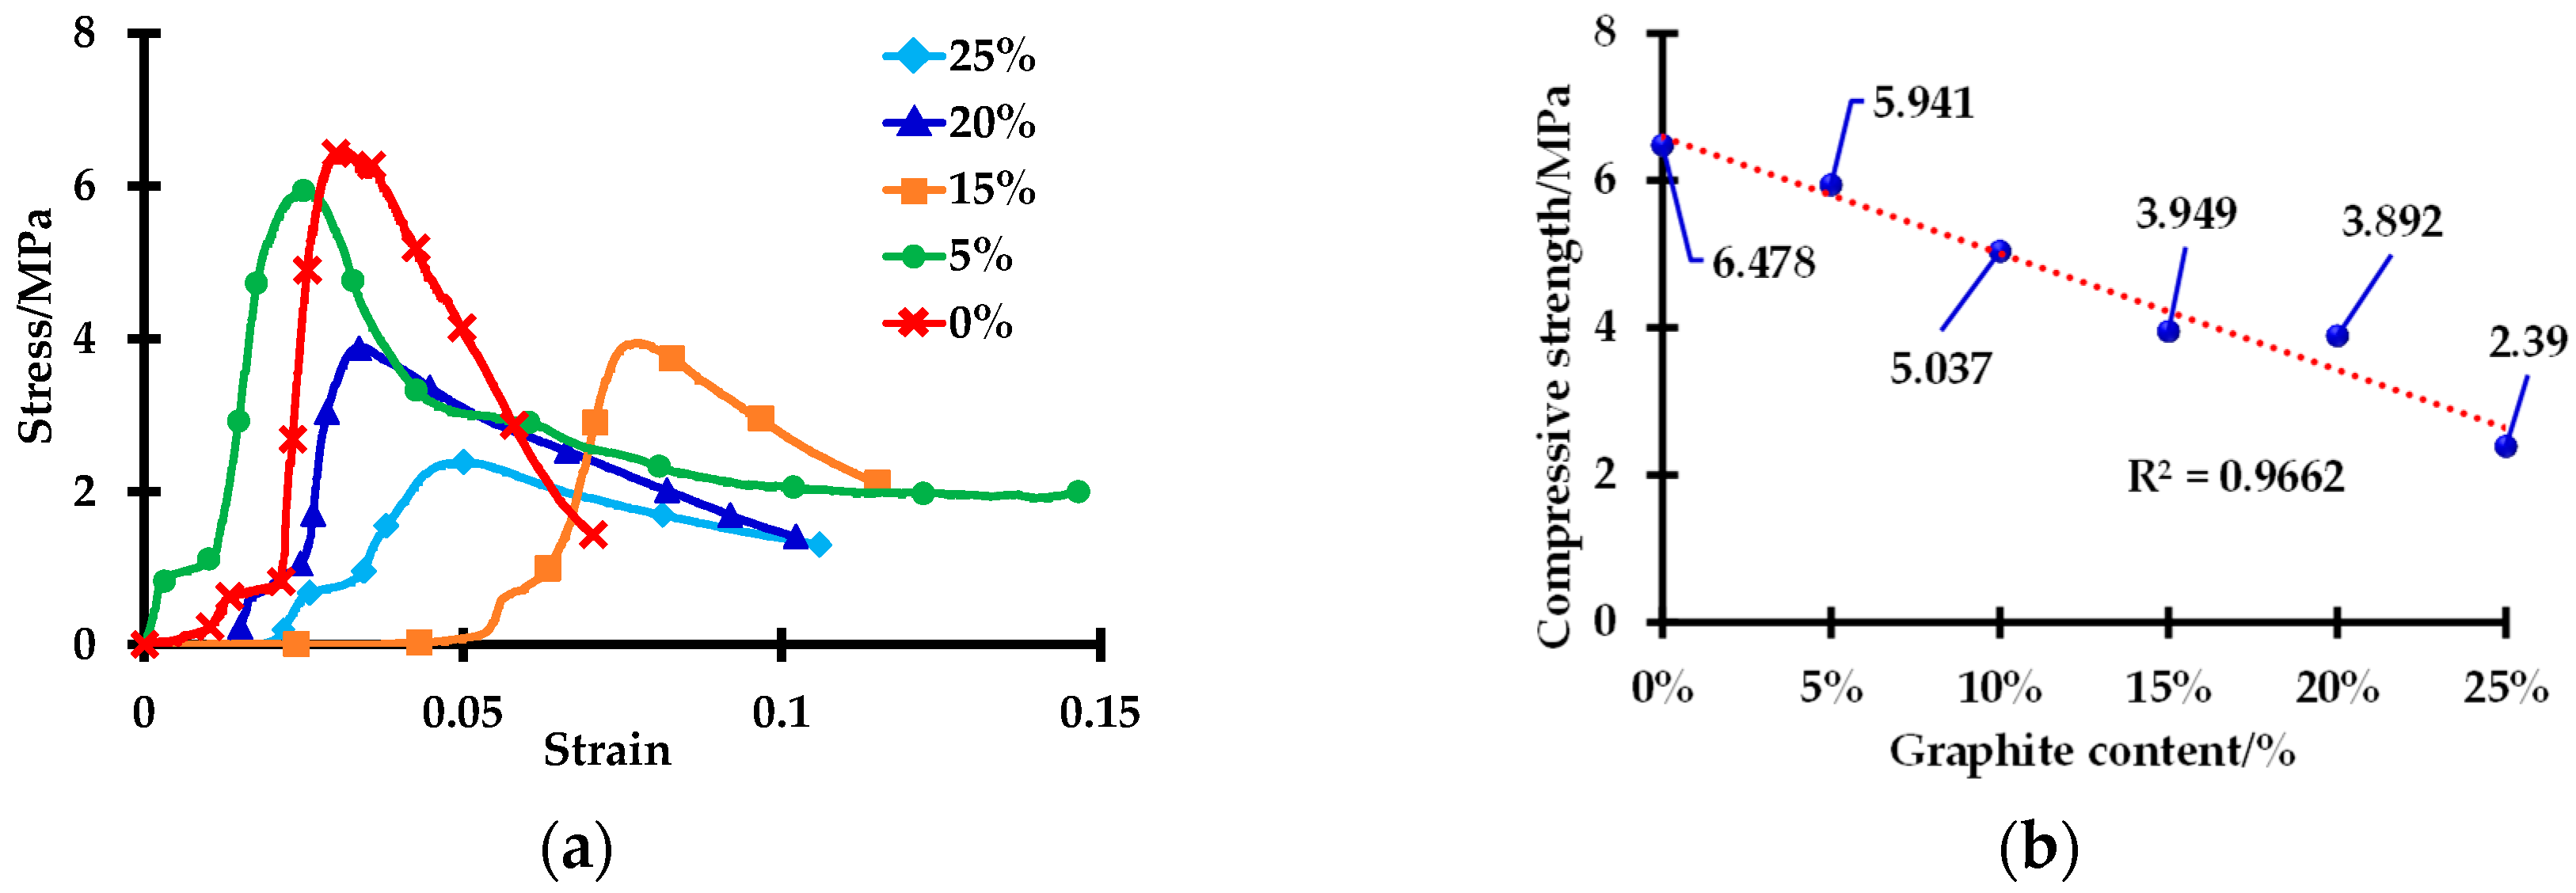
3.1. Effects of Graphite Content on Mechanical Properties of FCBM
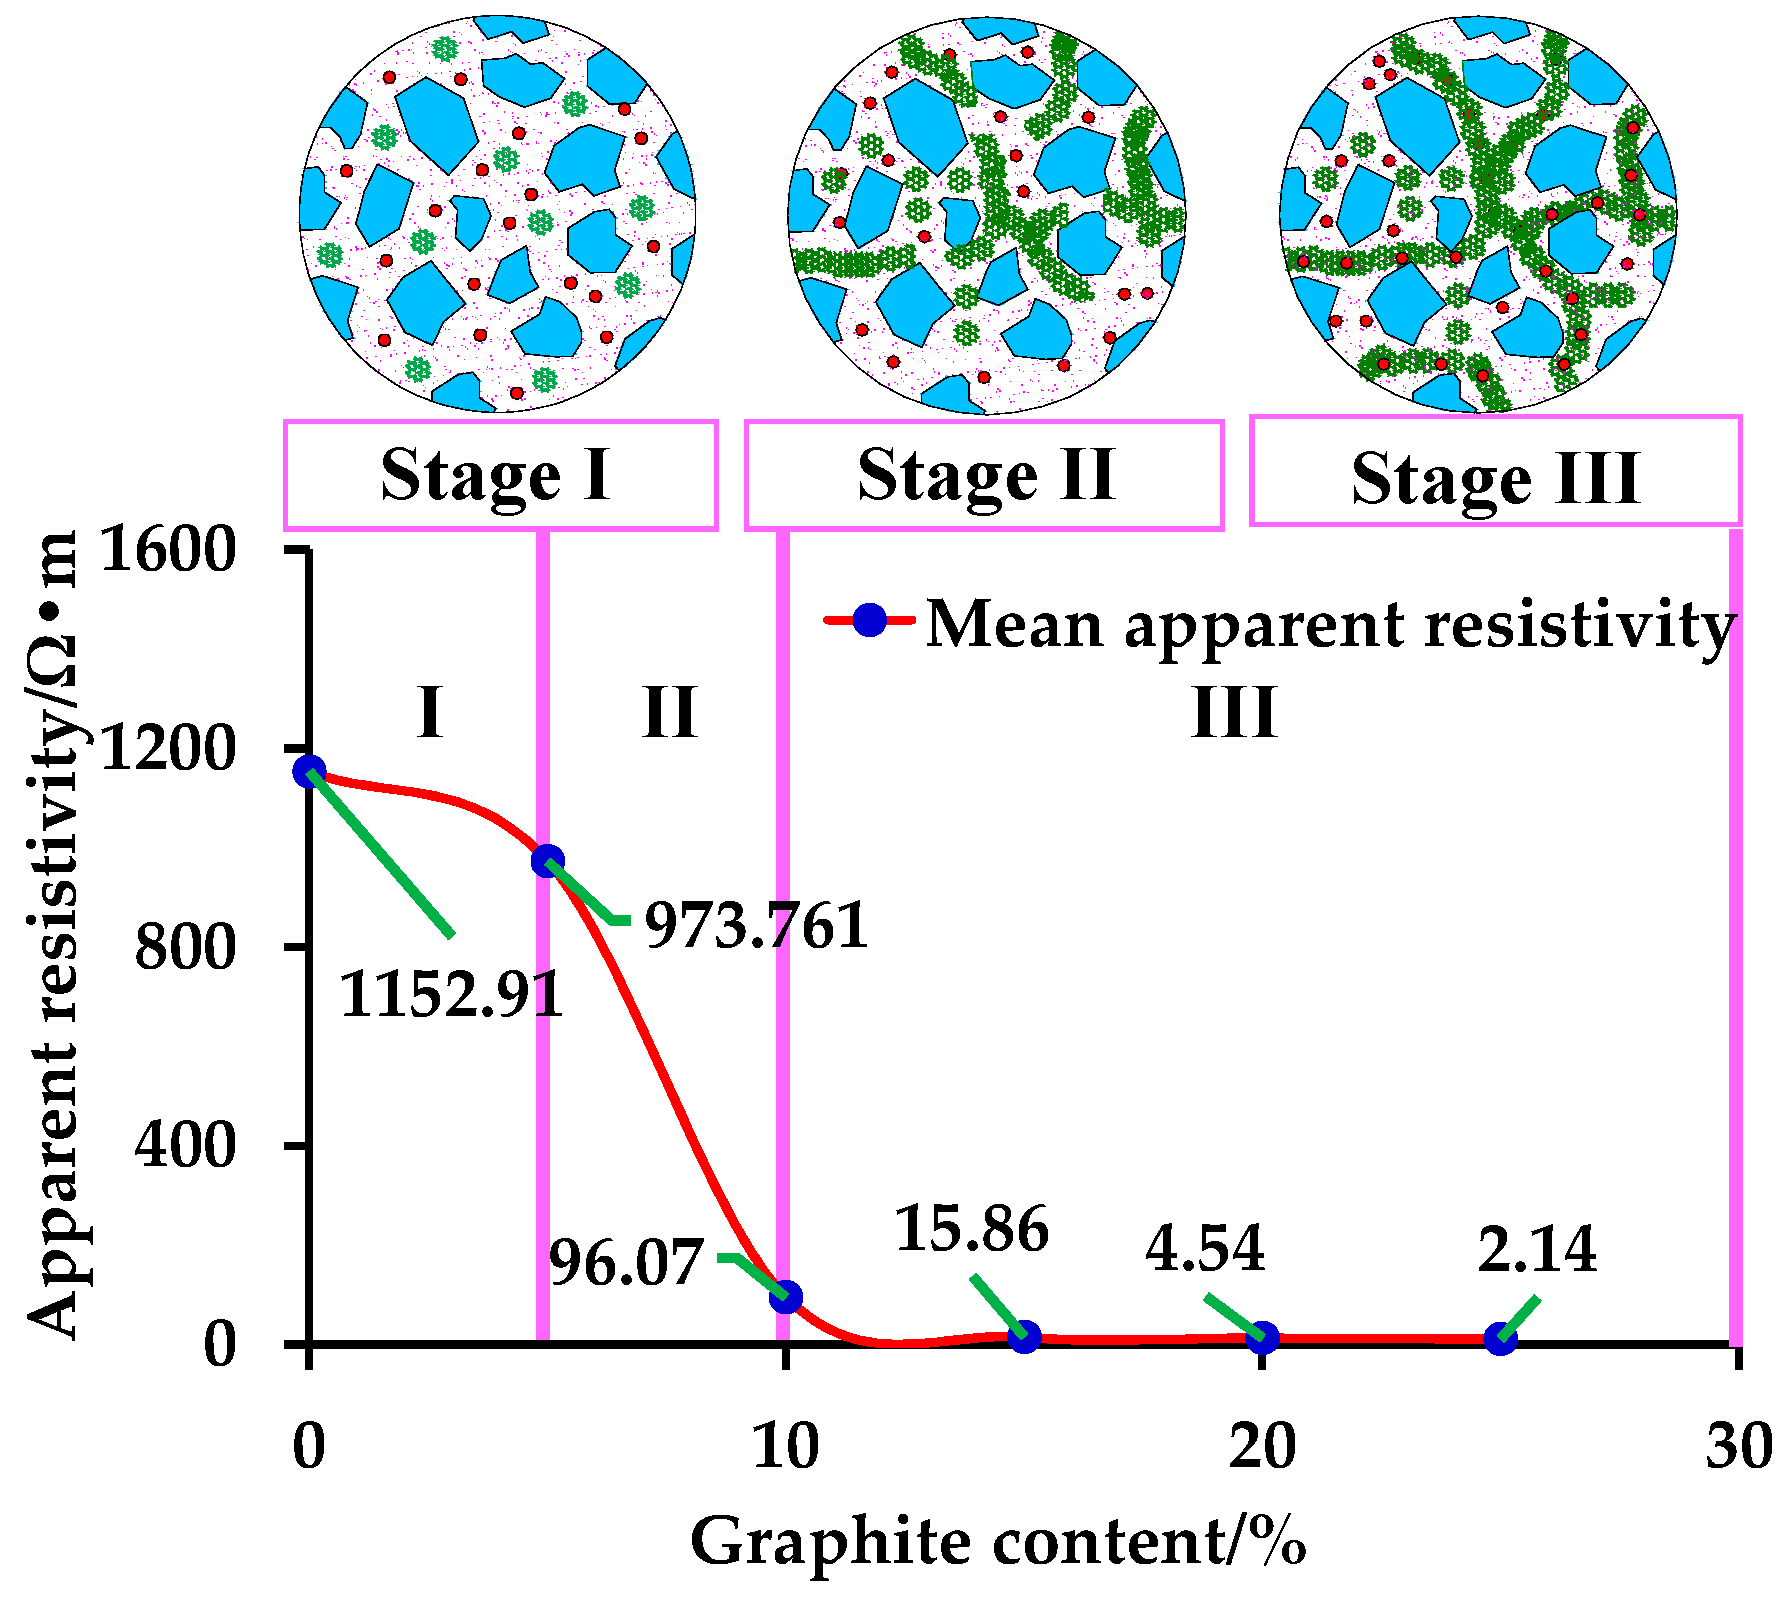
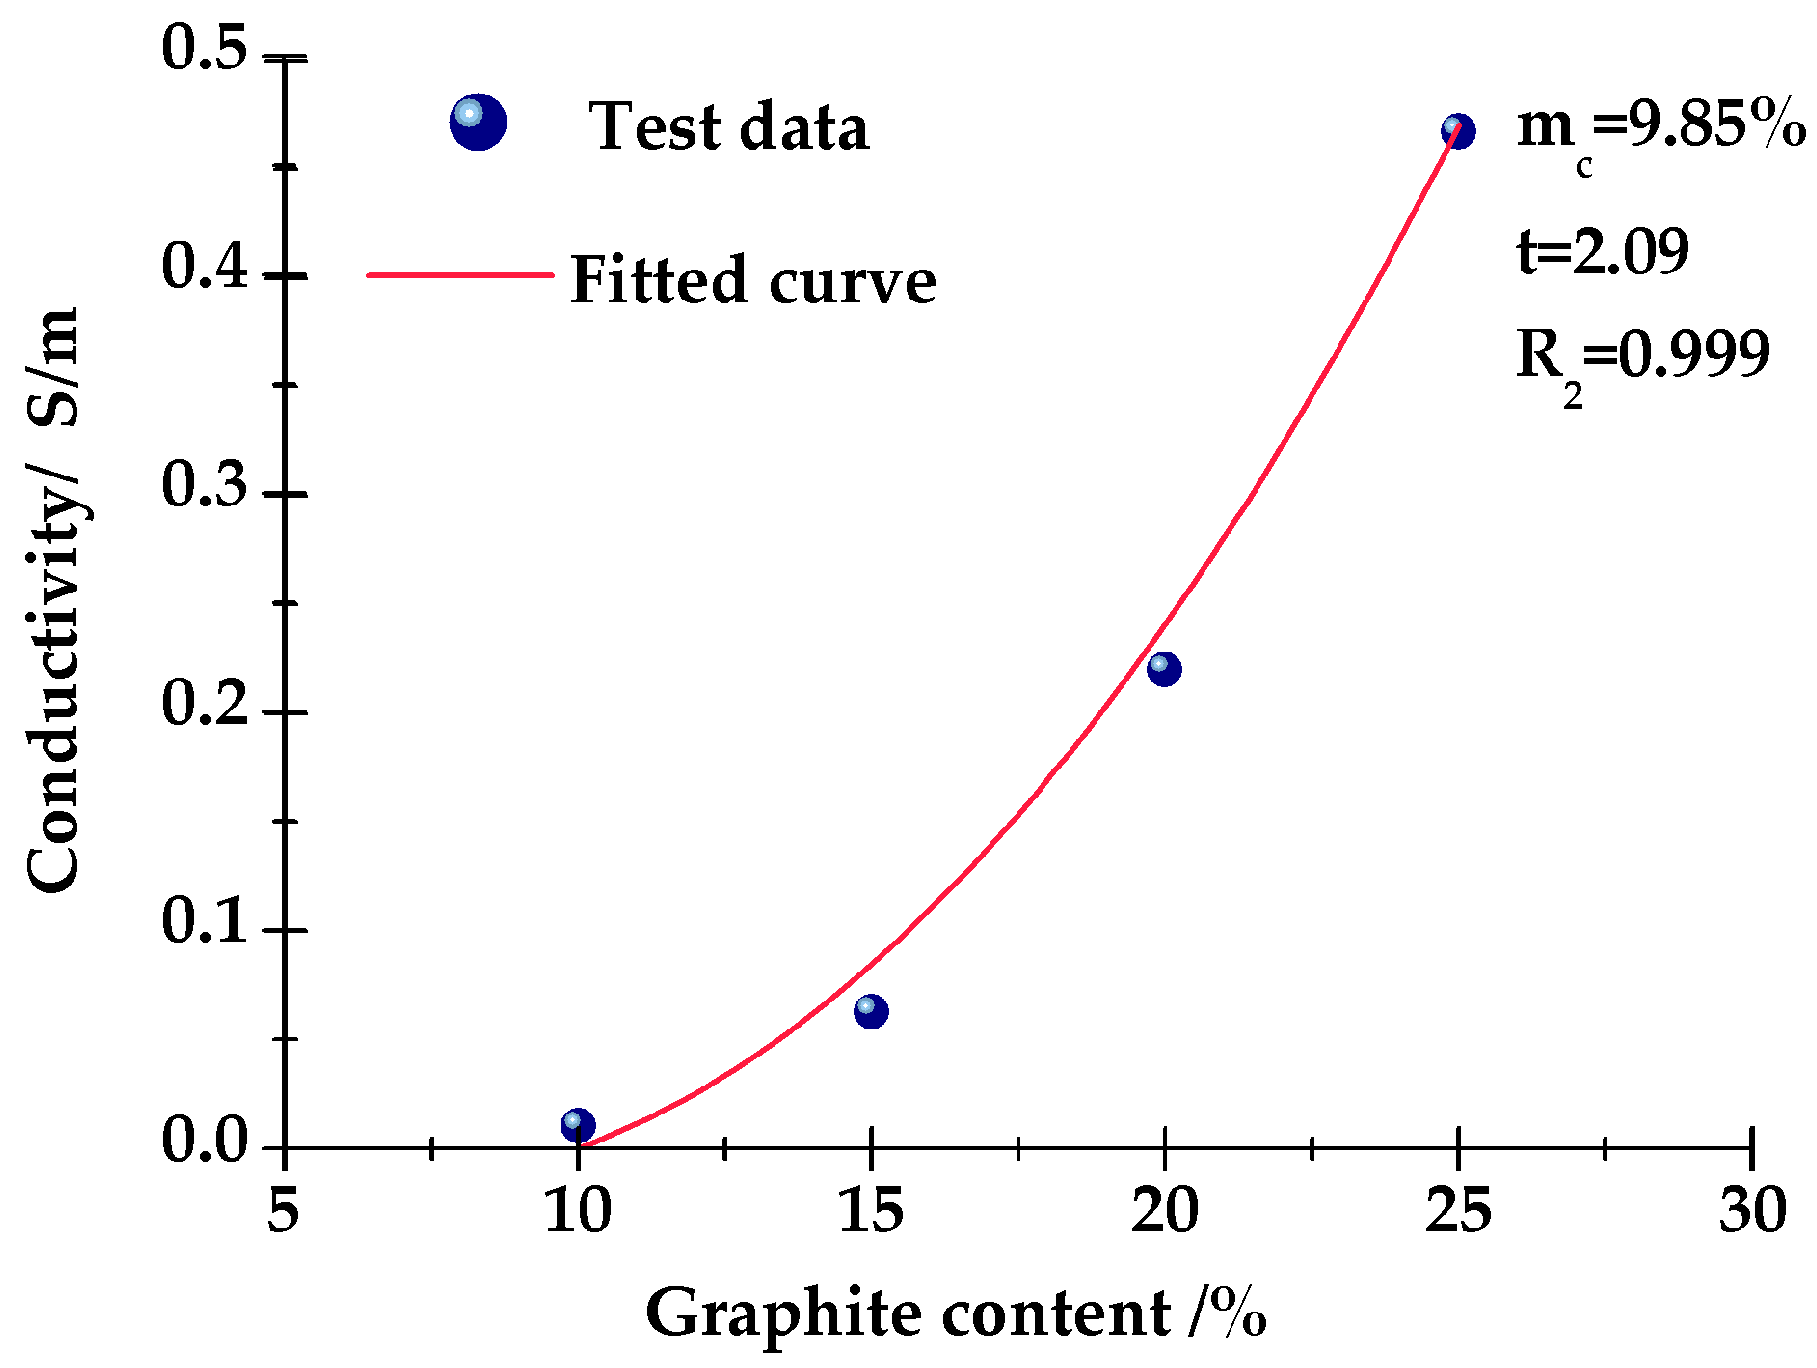
3.2. Effect of Graphite Content on the Apparent Resistivity of FCBM
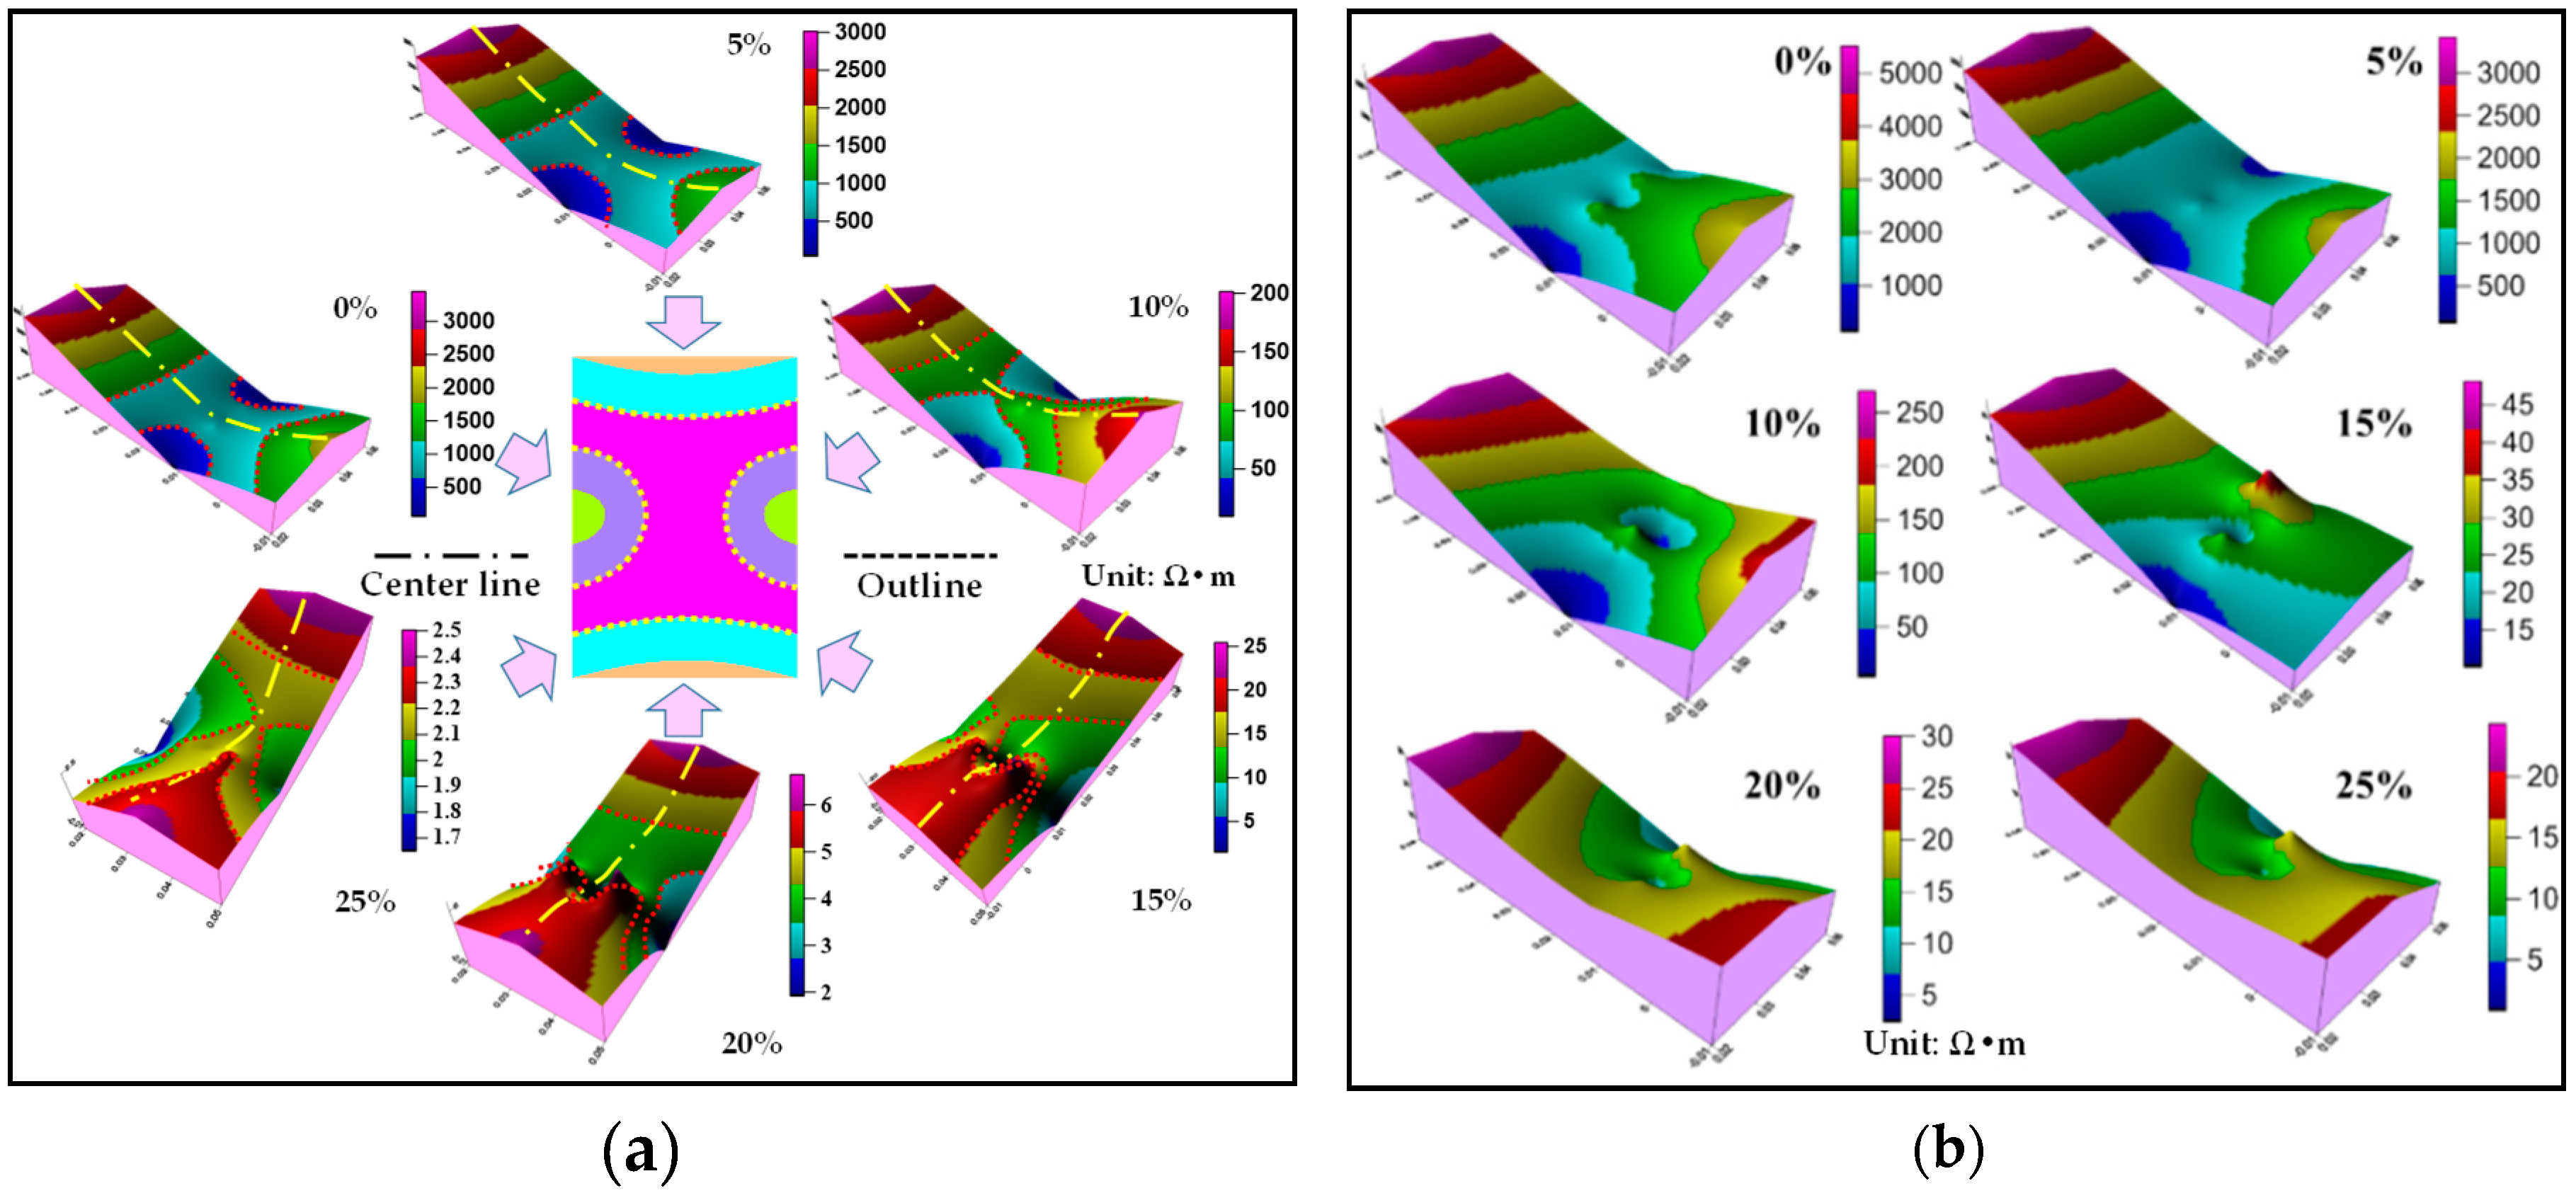
3.3. Spatial Distribution Rules of Apparent Resistivity in FCBM
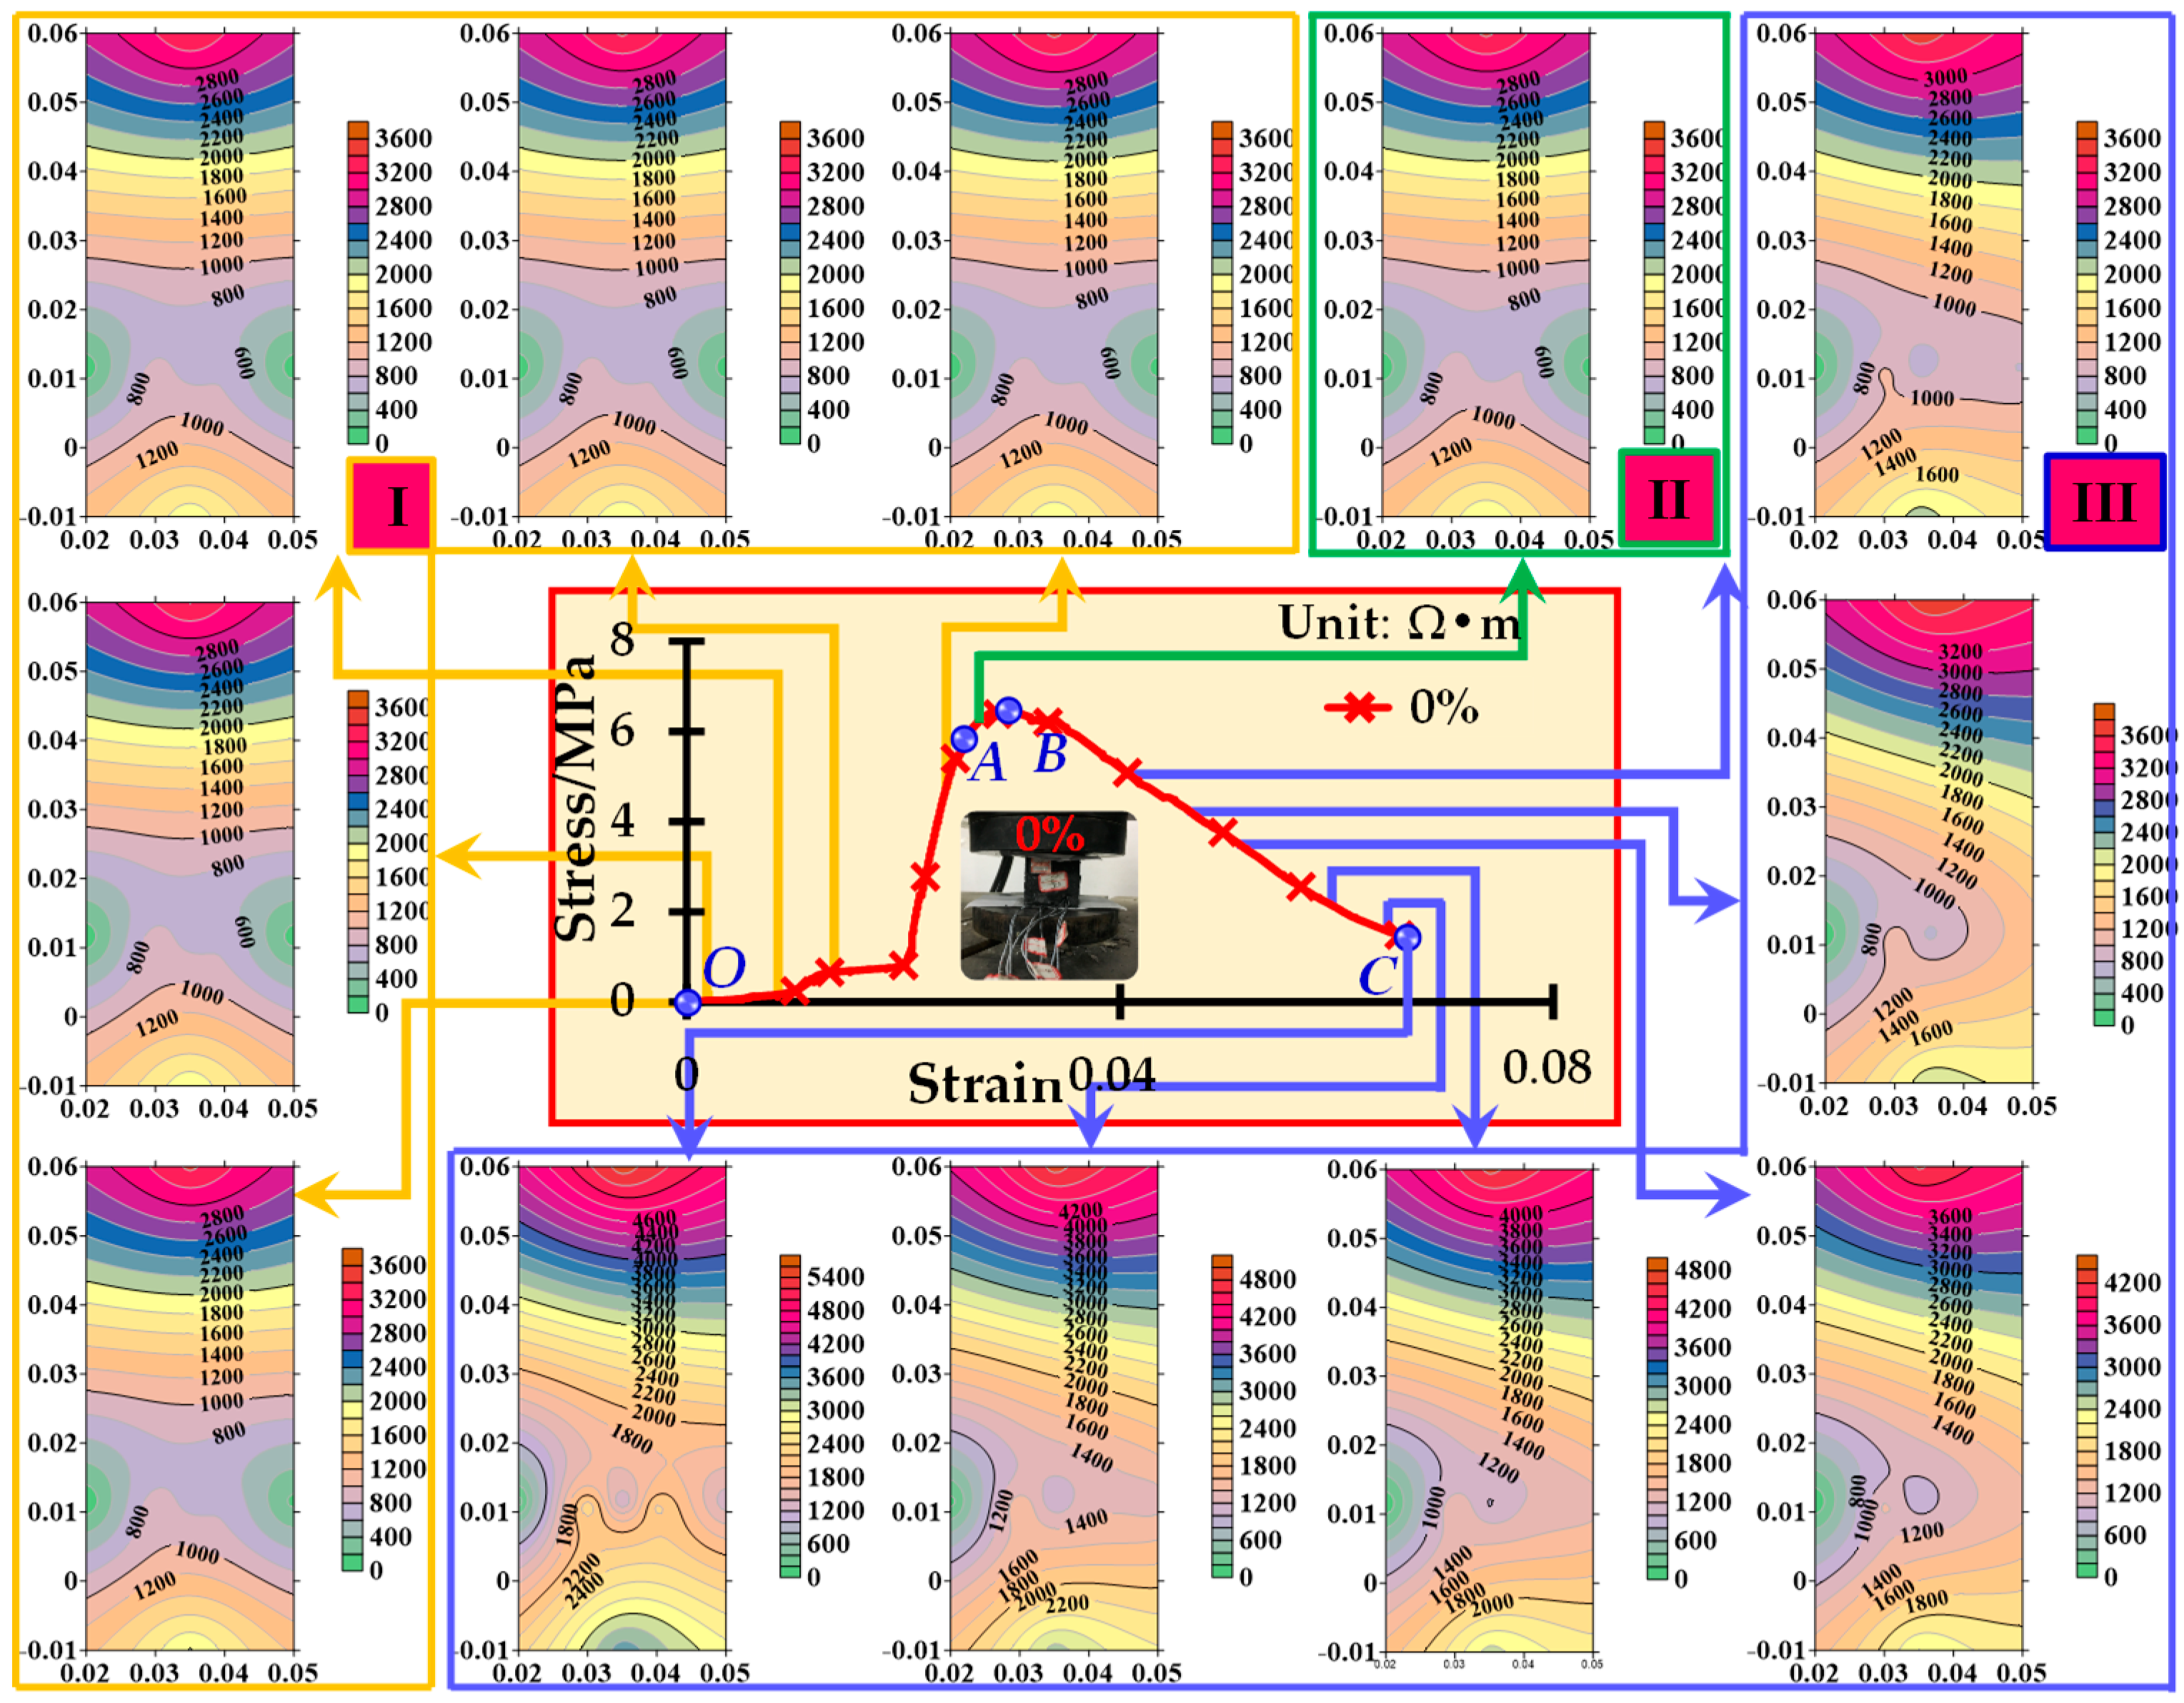
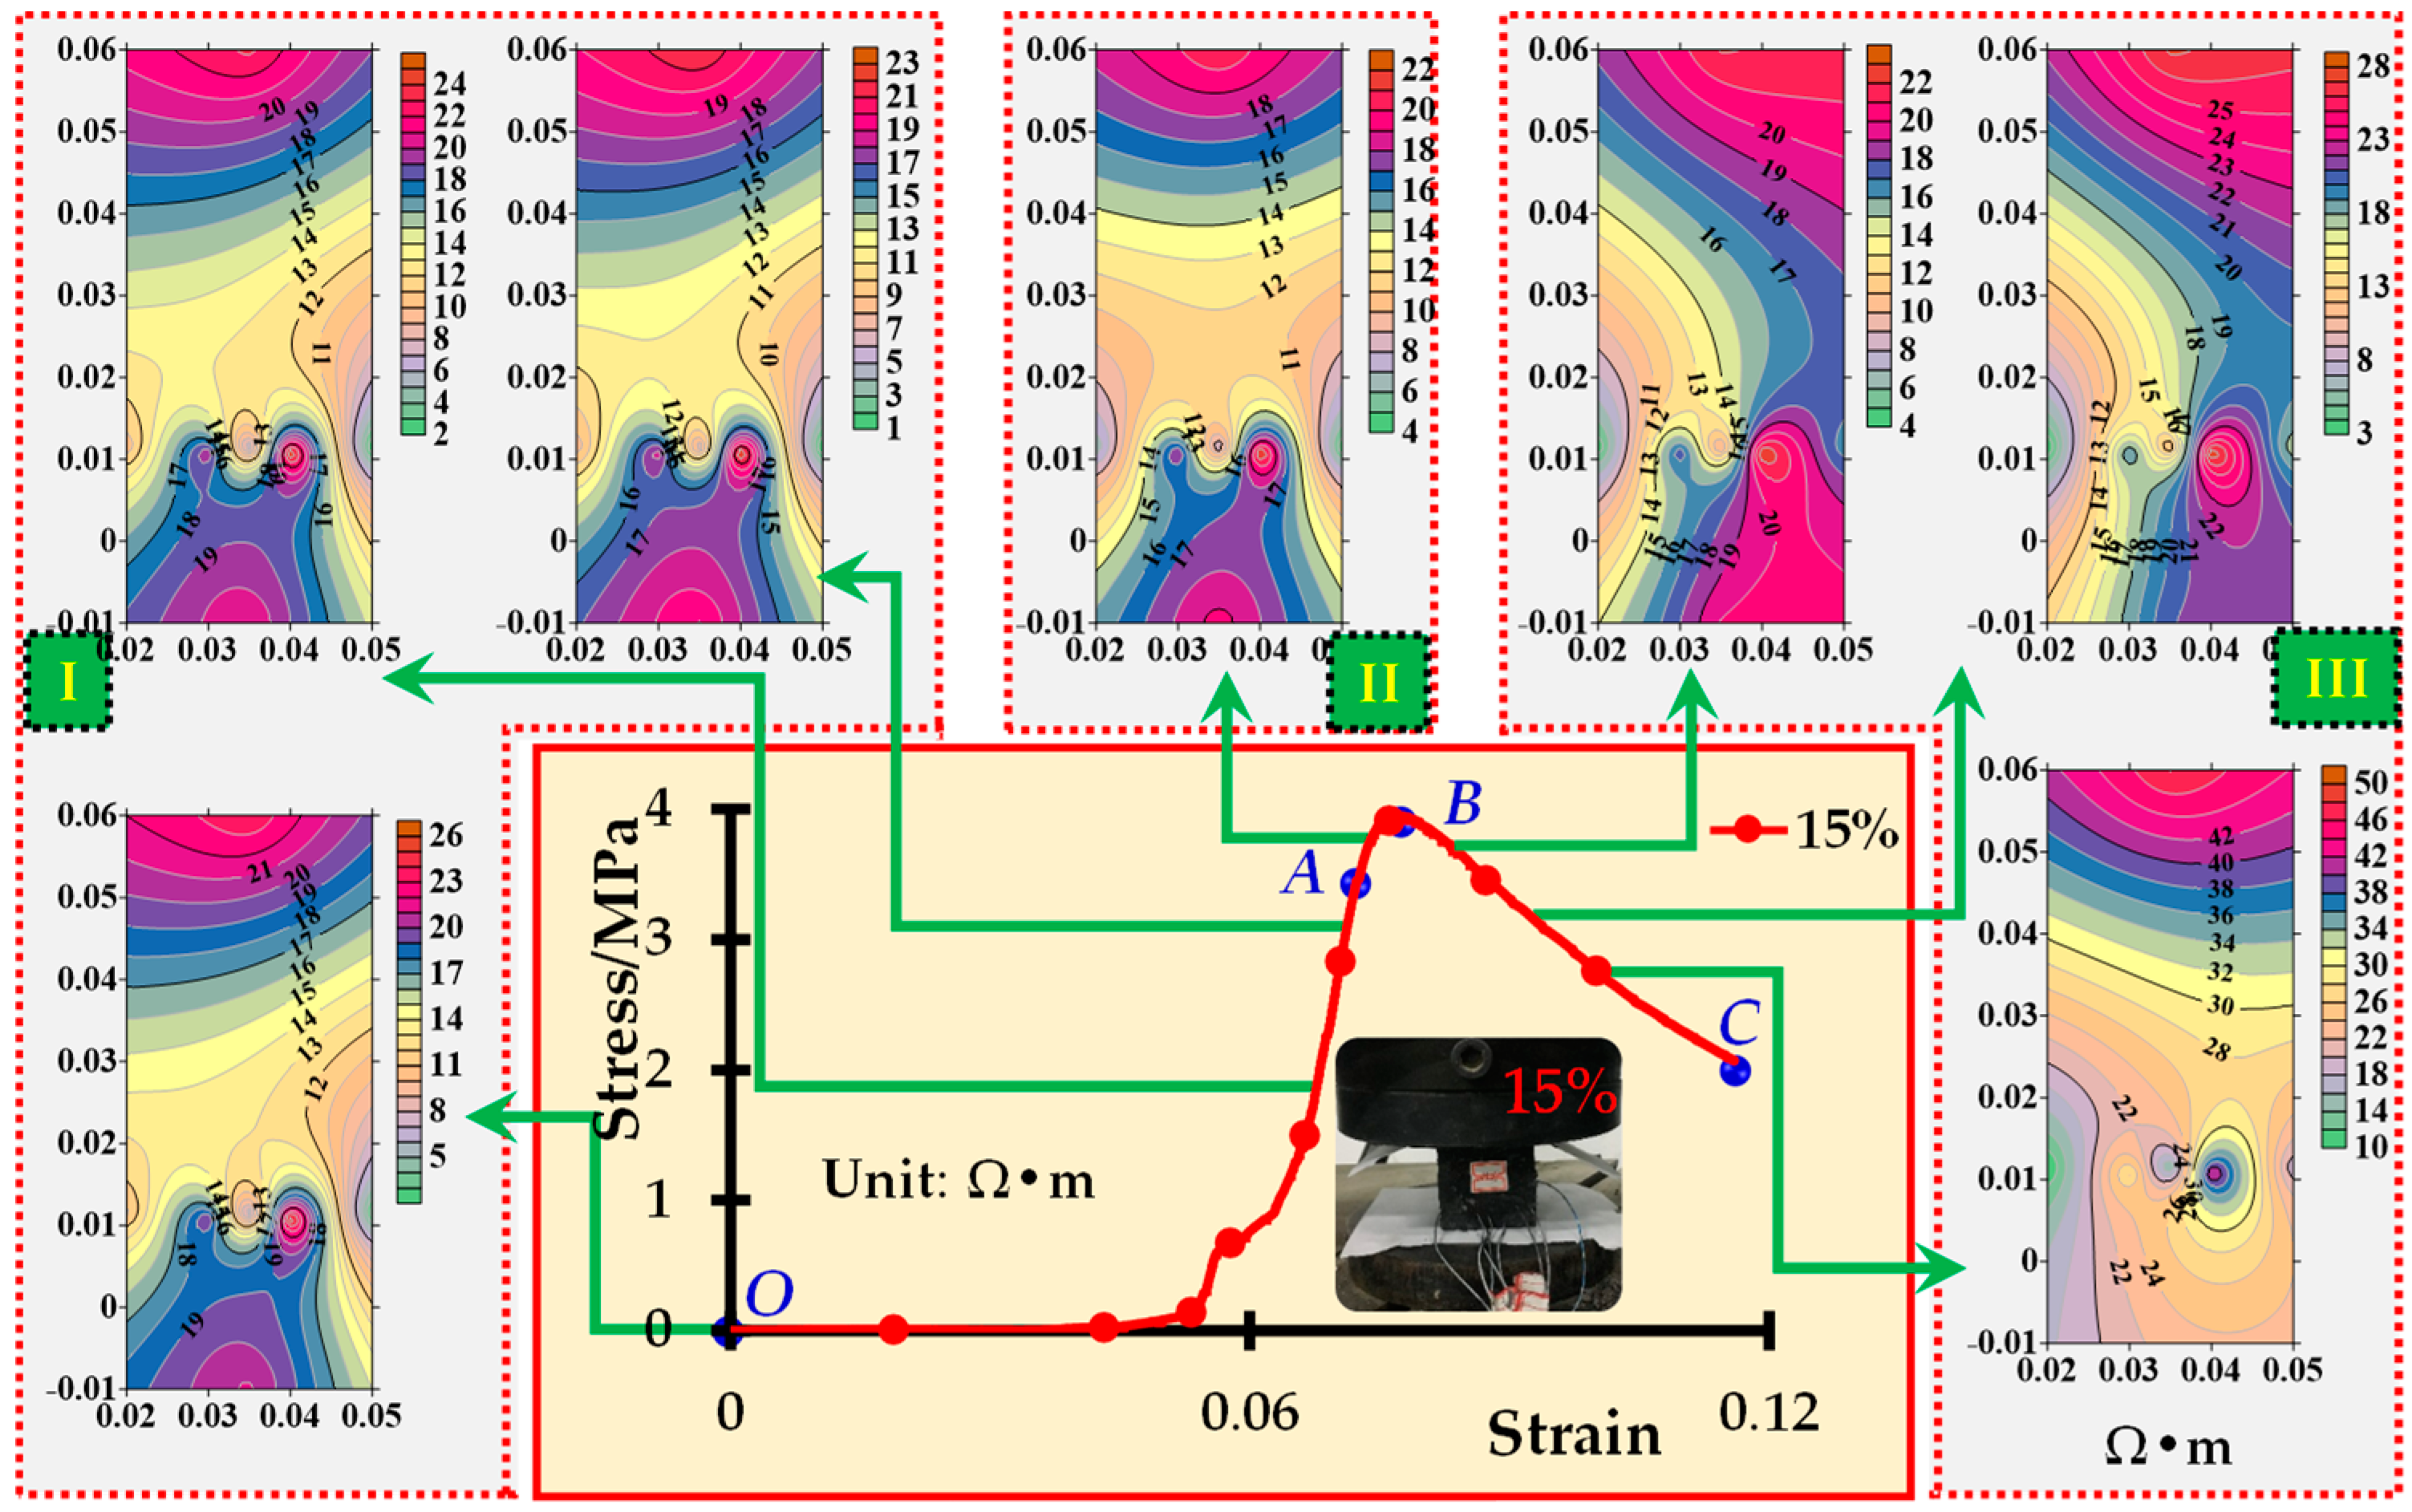
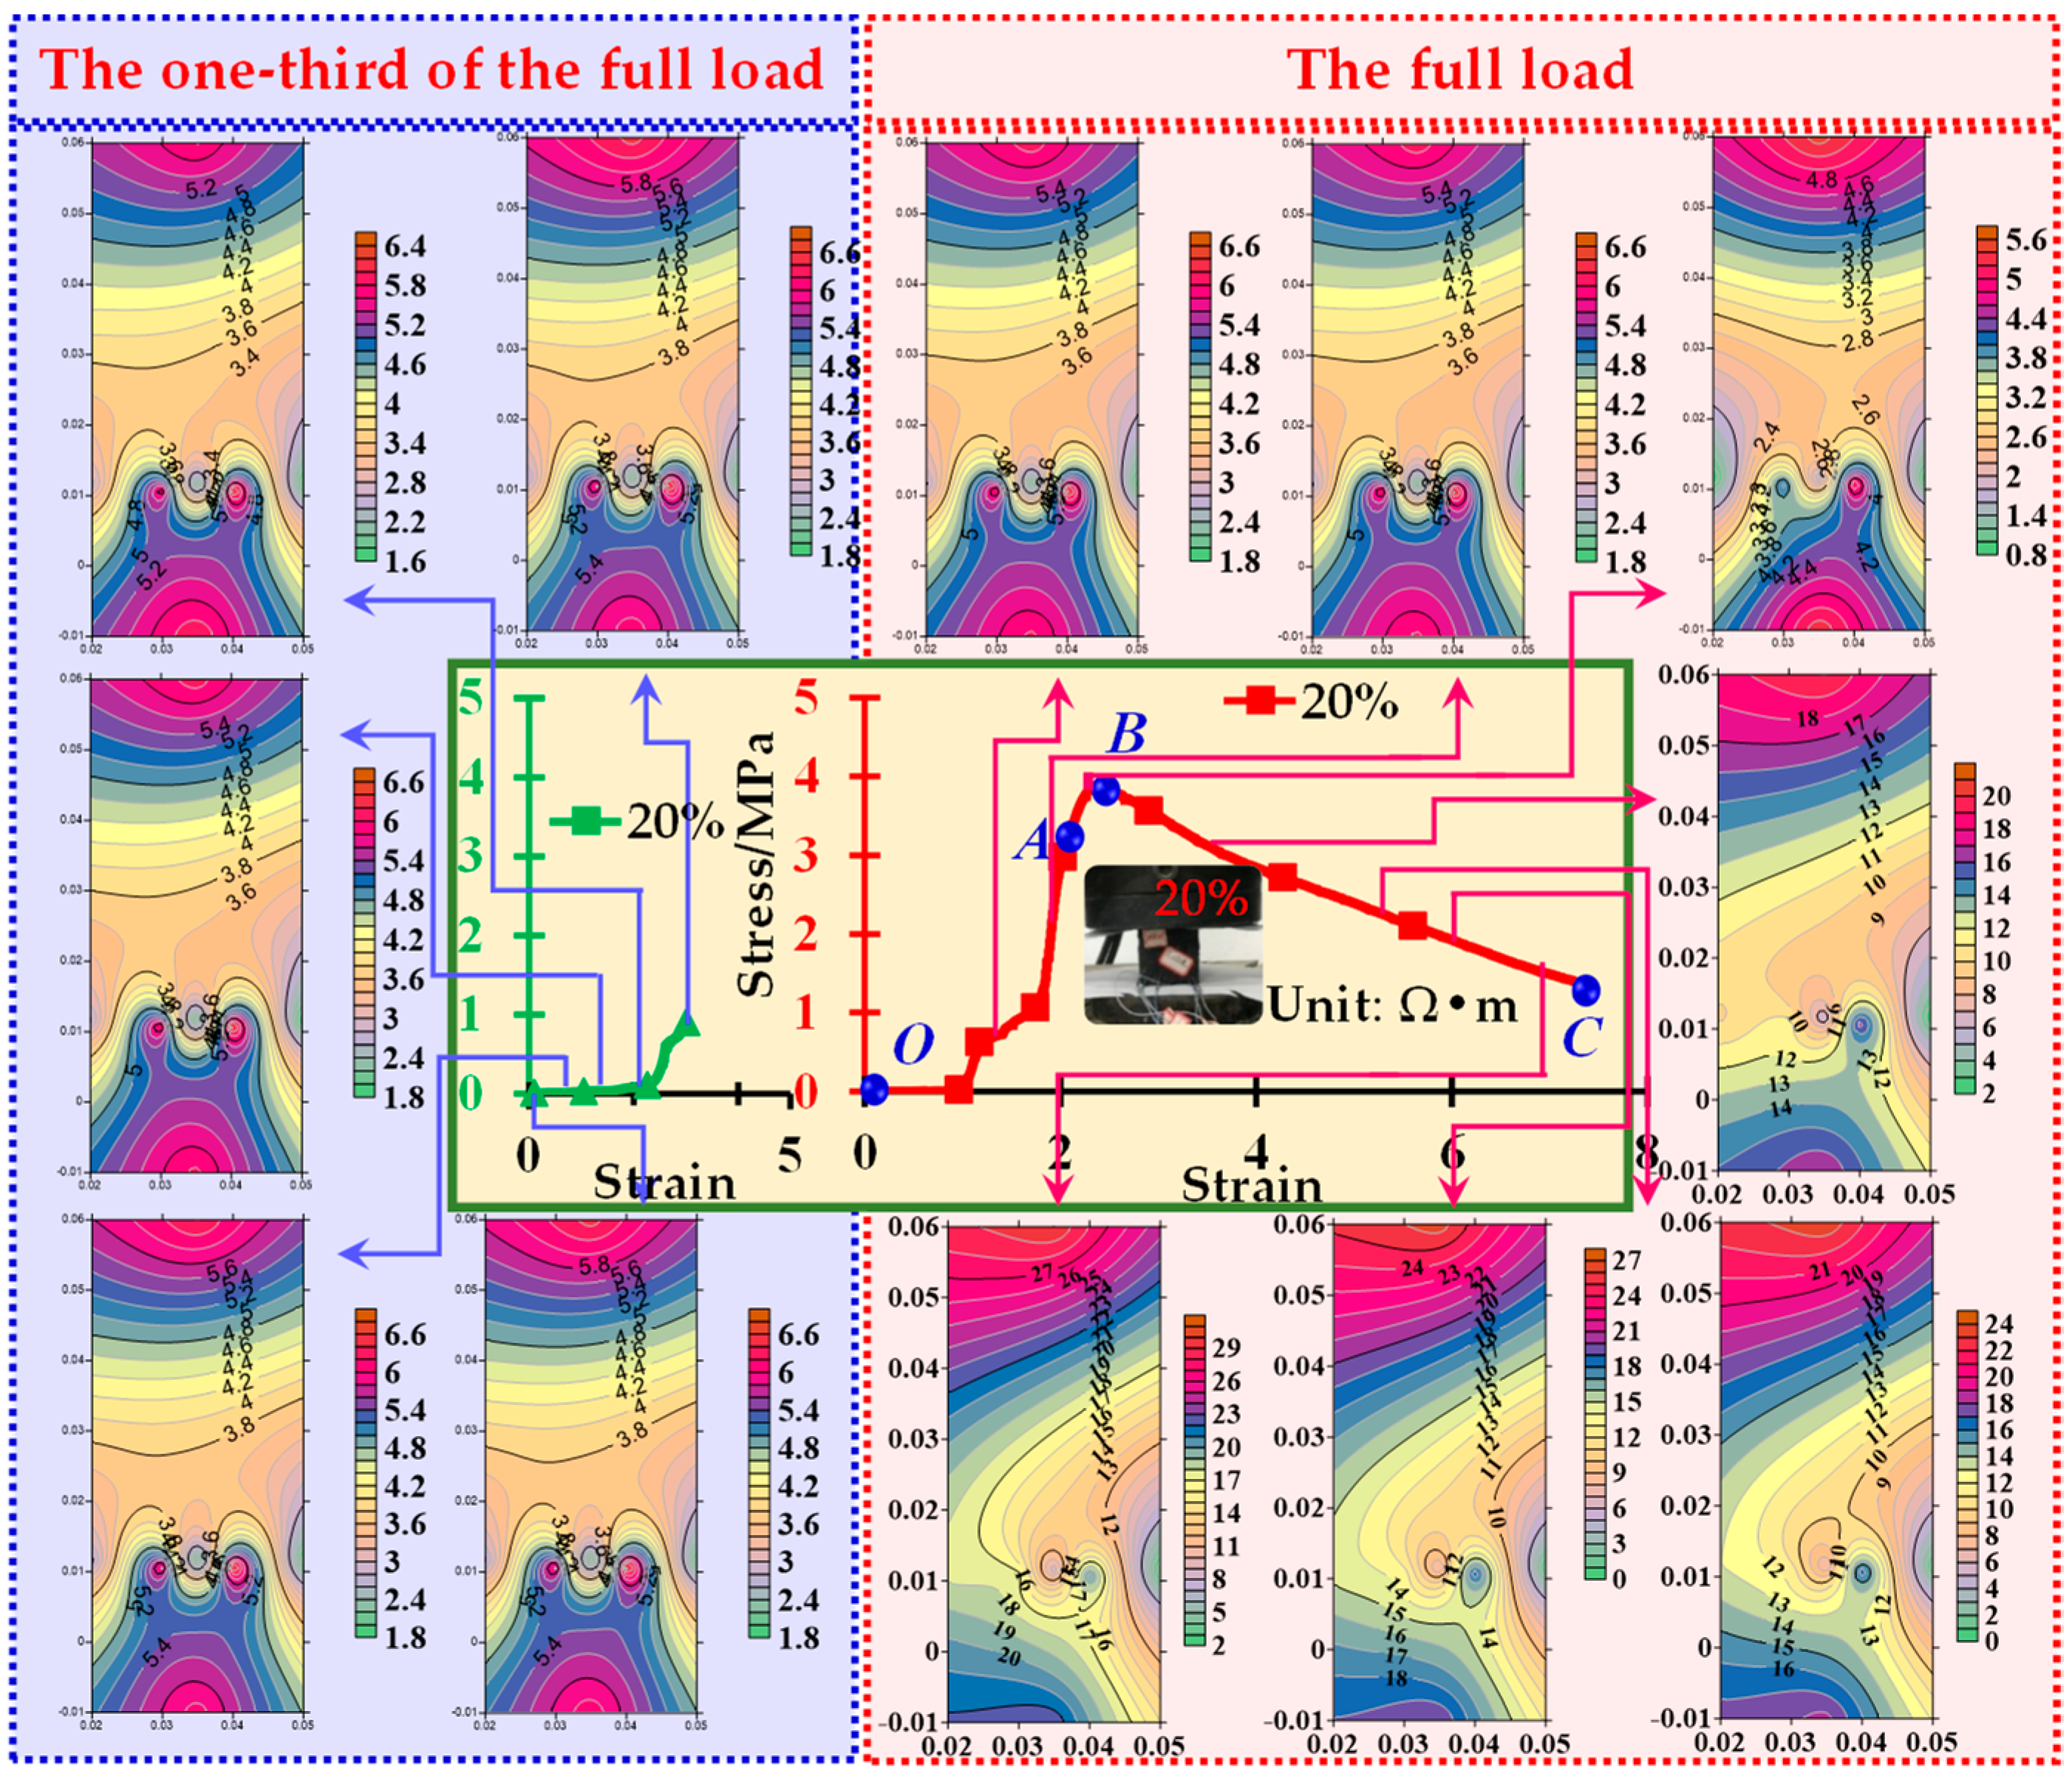
3.4. Variation of Apparent Resistivity of FCBM at Different Deformation Stages
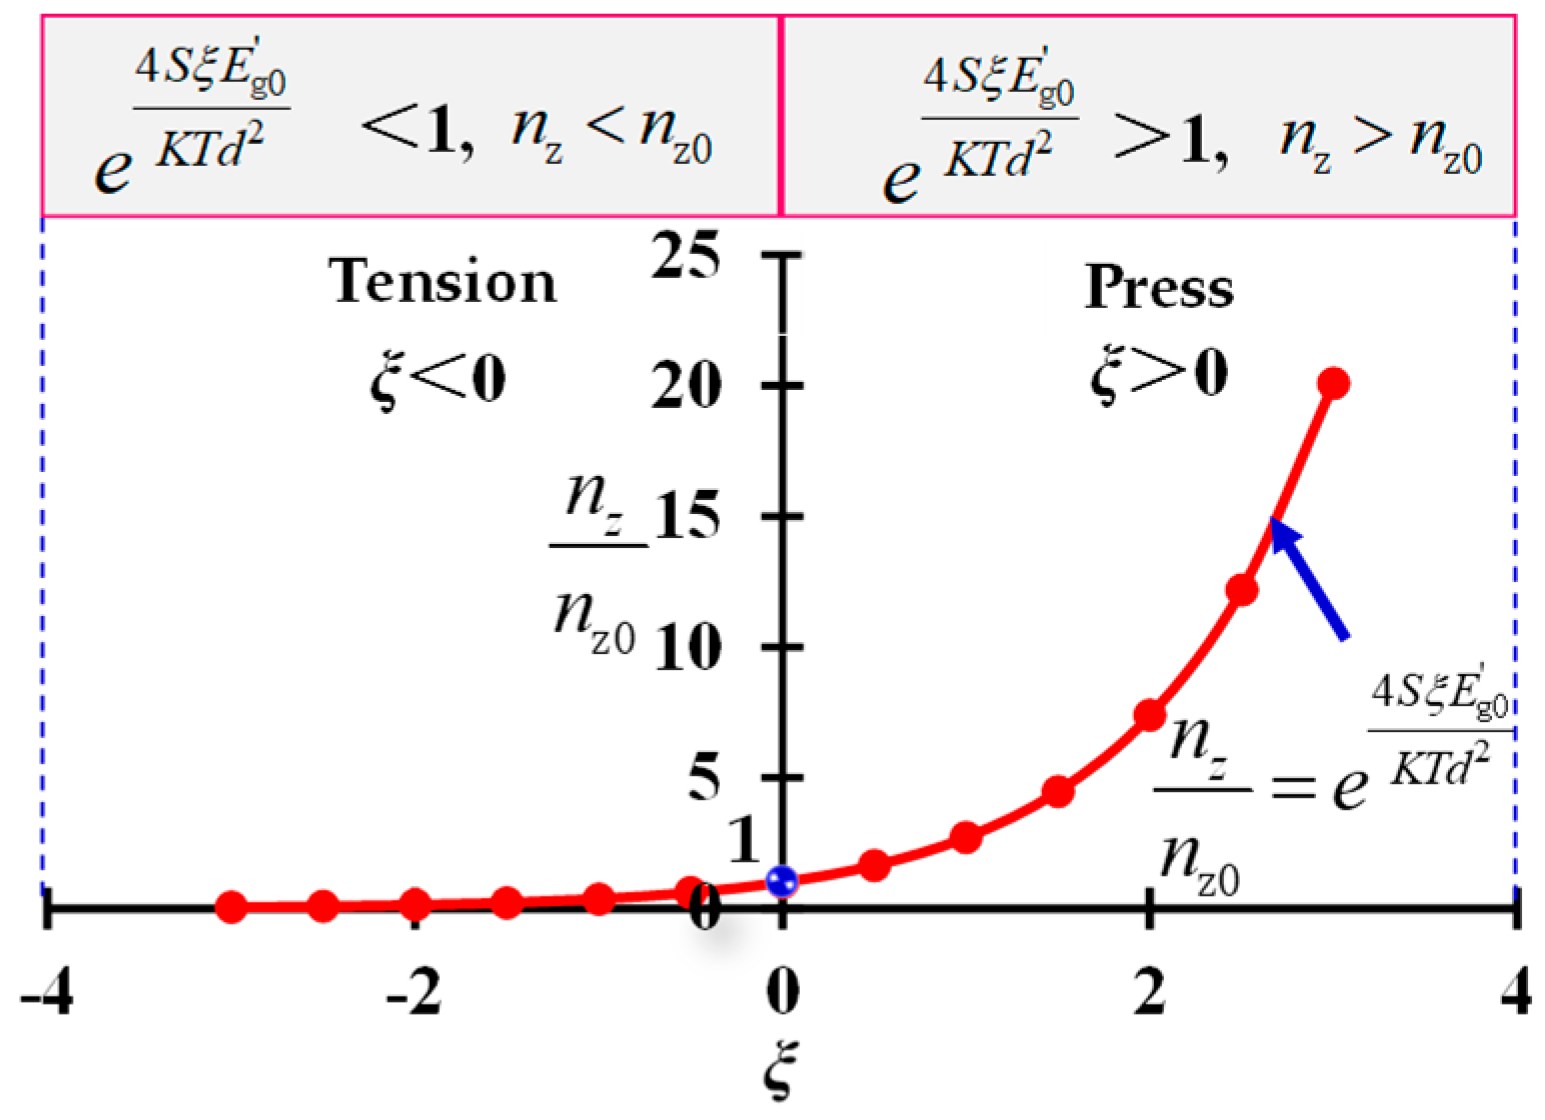
3.5. Further Analysis of the Variation of Apparent Resistivity of FCBM
4. Conclusions
Author Contributions
Funding
Acknowledgments
Conflicts of Interest
References
- Fall, M.; Célestin, J.C.; Pokharel, M.; Touré, M. A contribution to understanding the effects of curing temperature on the mechanical properties of mine cemented tailings backfill. Eng. Geol. 2010, 114, 397–413. [Google Scholar] [CrossRef]
- Ouattara, D.; Belem, T.; Mbonimpa, M.; Yahia, A. Effect of superplasticizers on the consistency and unconfined compressive strength of cemented paste backfills. Constr. Build. Mater. 2018, 181, 59–72. [Google Scholar] [CrossRef]
- Aldhafeeri, Z.; Fall, M. Time and damage induced changes in the chemical reactivity of cemented paste backfill. J. Environ. Chem. Eng. 2016, 4, 4038–4049. [Google Scholar] [CrossRef]
- Tekin, Y.; Ercikdi, B.; Karaman, K.; Külekçi, G. Assessment of strength properties of cemented paste backfill by ultrasonic pulse velocity test. Ultrasonics 2014, 54, 1386–1394. [Google Scholar]
- Lan, W.T.; Wu, A.X. Formulation optimization and formation mechanism of condensate expansion and filling composites. Acta Mater. Compos. Sin. 2019. online first. [Google Scholar]
- Deng, X.J. Ground Control Mechanism of Mining Extra-thick Coal Seam Using Upward Slicing Longwall-Roadway Cemented Backfilling Technology; China University of Mining and Technology: Xuzhou, China, 2017. [Google Scholar]
- Qi, T.Y.; Feng, G.R.; Zhang, X.J.; Yu, C.T.; Liu, H.F.; Kang, L.X. The application of resistivity evaluating filling effect method in Xinyang coal mine. J. Min. Saf. Eng. 2017, 34, 302–309. [Google Scholar]
- Liu, L.; Xin, J.; Zhang, B.; Zhang, X.Y.; Wang, M.; Qiu, H.F.; Chen, L. Basic Theories and Applied Exploration of Functional Backfill in Mines. J. China Caol Soc. 2018, 43, 1811–1820. [Google Scholar]
- Chung, D.D.L. Structural health monitoring by electrical resistance measurement. Smart Mater. Struct. 2001, 10, 624. [Google Scholar] [CrossRef]
- Pye, G.B.; Myers, R.E.; Arnott, M.R. Conductive concrete compositions containing carbonaceous particles. Chem. Abstr. 2001, 58, 76. [Google Scholar]
- Kang, S.H.; Ko, J.S.; Kim, J.J. Conductive carbon fiber composite for Concrete Structures. Chem. Ab-stracts. 2001, 57, 58. [Google Scholar]
- Tarun, R.N.; Rudolph, N.K.; Ramme, B.W.; Chun, Y.M.; Kumar, R. High-carbon fly ash in manufacturing conductive CLSM and concrete. J. Mater. Civil. Eng. 2006, 18, 743–746. [Google Scholar]
- Zhao, Y.; Soltani, A.; Taheri, A.; Karakus, M.; Deng, A. Application of Slag–Cement and Fly Ash for Strength Development in Cemented Paste Backfills. Minerals 2019, 9, 22. [Google Scholar] [CrossRef]
- Zhang, J.; Deng, H.W.; Taheri, A.; Deng, J.R.; Ke, B. Effects of Superplasticizer on the Hydration, Consistency, and Strength Development of Cemented Paste Backfill. Minerals 2018, 8, 381. [Google Scholar] [CrossRef]
- Yan, H.; Zhang, J.X.; Wang, J.Q.; Zhou, N.; Zhang, S. Multi-fractal characteristics of particle size distribution of granular backfilling materials under different loads. Mater. Test. 2018, 60, 202–208. [Google Scholar] [CrossRef]
- Li, M.; Zhang, J.X.; Sun, K.; Zhang, S. Influences of Lateral Loading on Compaction Characteristics of Crushed Waste Rock Used for Backfilling. Minerals 2018, 8, 552. [Google Scholar] [CrossRef]
- Volkmann, J.; Klitzsch, N. Wideband impedance spectroscopy from 1mHz to 10MHz by combination of four- and two-electrode methods. J. Appl. Geophys. 2015, 114, 191–201. [Google Scholar] [CrossRef]
- Uvarov, N.F.; Ulihin, A.S.; Bespalko, Yu.N.; Eremeev, F.; Krasnov, A.V.; Skriabin, P.I.; Sadykov, V.A. Study of Proton Conductivity of Composite Metal-Ceramic Materials Based on Neodimium Tugstates Using a Four-Electrode Technique with Ionic Probes. Int. J Hydrogen Energy 2018, 43, 21–27. [Google Scholar] [CrossRef]
- Karthick, S.; Velu, S.; Seung, J.K.; Han, S.L.; Rethinam, N.; Dong, J.P. A Novel in-Situ Corrosion Monitoring Electrode for Reinforced Concrete Structures. Electrochim. Acta 2018, 259, 29–44. [Google Scholar] [CrossRef]
- Lee, B.; Seokhoon, O. Modified Electrical Survey for Effective Leakage Detection at Concrete Hydraulic Facilities. J. Appl. Geophys. 2018, 149, 14–30. [Google Scholar] [CrossRef]
- Jakubas, A.; Paweł, J. The Influence of Electrode Size on Resistance Measurement in the Modified Four-Electrodes Method. Measurement 2017, 108, 34–40. [Google Scholar] [CrossRef]
- Mironov, V.S.; Kim, J.K.; Park, M.; Lim, S.; Cho, W.K. Comparison of electrical conductivity data obtained by four-electrode and four-point probe methods for graphite-based polymer composites. Polym. Test. 2007, 26, 547–555. [Google Scholar] [CrossRef]
- Liu, S.D.; Wu, R.X.; Zhang, P.S.; Cao, Y. Three-dimensional parallel electric surveying and its applications in water disaster exploration in coal mines. J. China Coal Soc. 2009, 34, 927–932. [Google Scholar]
- Tkalya, E.; Ghislandi, M.; Otten, R.; Lotya, M.; Alekseev, A.; Paul, V.D.S. Experimental and theoretical study of the influence of the state of dispersion of graphene on the percolation threshold of conductive graphene/polystyrene nanocomposites. ACS Appl. Mater. Interface 2014, 6, 15113–15121. [Google Scholar] [CrossRef] [PubMed]
- Lu, X.; Yvonnet, J.; Detrez, F.; Bai, J. Multiscale modeling of nonlinear electric conductivity in graphene-reinforced nanocomposites taking into account tunnelling effect. J. Comput. Phys. 2017, 337, 116–131. [Google Scholar] [CrossRef]
- Beek, L.K.H.V.; Pul, B.I.C.F.V. Internal field emission in carbon black-loaded natural rubber vulcanizates. J. Appl. Polym. Sci. 2010, 6, 651–655. [Google Scholar] [CrossRef]
- Wang, G.; Wang, C.; Zhang, F.; Yu, X. Electrical percolation of nanoparticle-polymer composites. Comp. Mater. Sci. 2018, 150, 102–106. [Google Scholar] [CrossRef]
- Bo, S.; Dong, L.; Li, M.Q.; Liu, B.; Kyunghoon, K.; Xu, X.F.; Zhou, J.; Liu, J. Thermal Percolation in Composite Materials with Electrically Conductive Fillers. Appl. Phys. Lett. 2018, 113, 041902. [Google Scholar]
- Han, B.Z.; Zhang, L.Y.; Han, B.G.; Liu, L.Y.; Hu, Z.X. Piezoresistive composites based on quantum tunneling effect. J. Funct. Mater. 2008, 39, 931–934. [Google Scholar]
- Gong, J.; Tang, Y.; Yang, P. Investigation on field emission properties of graphdiyne-BN composite. J. Mol. Struct. 2014, 1064, 32–36. [Google Scholar] [CrossRef]
- Ruschau, G.R.; Yoshikawa, S.; Newnham, R.E. Resistivities of conductive composites. J. Appl. Phys. 1992, 72, 953–959. [Google Scholar] [CrossRef]
- Wei, J.; Zhao, L.L.; Zhan, Q.; Nie, Z. Development of Seebeck Effect of Carbon Fiber Reinforced Cement-based Composites. Mater. Rev. 2017, 31, 84–89. [Google Scholar]
- Liang, X.X. Statistical Thermodynamics; Inner Mongolia University Press: Hohhot, China, 2000. [Google Scholar]
- Dong, Y.; Liu, C.; Duan, Z.; Birahima, G.; Tao, Y.; Zhang, Y. Molecular dynamics simulations of stiffness-dependent friction of graphene. J. Southeast Univ. 2017, 47, 28–32. [Google Scholar]
- Kalin, M.; Poljanec, D. Influence of the contact parameters and several graphite materials on the tribological behaviour of graphite/copper two-disc electrical contacts. Tribol. Int. 2018, 126, 192–205. [Google Scholar] [CrossRef]
- Liu, H.; Li, L. Graphitic materials: Intrinsic hydrophilicity and its implications. Extrem. Mech. Lett. 2017, 14, 44–50. [Google Scholar] [CrossRef]
- Androulidakis, C.; Koukaras, E.N.; Hadjinicolaou, M.; Galiotis, C. Non-Eulerian behavior of graphitic materials under compression. Carbon 2018, 138, 227–233. [Google Scholar] [CrossRef]
- Kirkpatrick, S. Percolation and conduction. Rev. Modem Phys. 1973, 45, 574–588. [Google Scholar] [CrossRef]


| Materials | Na2O | MgO | Al2O3 | SiO2 | K2O | CaO | Fe2O3 | Other Ingredients |
|---|---|---|---|---|---|---|---|---|
| Gangue | 0.53 | 1.8 | 21.2 | 54.3 | 2.2 | 1.2 | 5.9 | 12.87 |
| Fly ash | 1.85 | 2.31 | 18.5 | 50.8 | 1.82 | 9.6 | 3.62 | 11.5 |
| Specimen No. | Content of Graphite, % | Cement, g | Fly Ash, g | Gangue, g | Water-Reducing Agent, g |
|---|---|---|---|---|---|
| 1 | 0 | 450 | 760 | 1360 | 10 |
| 2 | 5 | 450 | 760 | 1360 | 10 |
| 3 | 10 | 450 | 760 | 1360 | 10 |
| 4 | 15 | 450 | 760 | 1360 | 10 |
| 5 | 20 | 450 | 760 | 1360 | 10 |
| 6 | 25 | 450 | 760 | 1360 | 10 |
© 2019 by the authors. Licensee MDPI, Basel, Switzerland. This article is an open access article distributed under the terms and conditions of the Creative Commons Attribution (CC BY) license (http://creativecommons.org/licenses/by/4.0/).
Share and Cite
Liu, H.; Zhang, J.; Zhang, W.; Gao, F.; Yan, H.; An, T. Experimental Investigation of Perceptual Characteristics of Functional Cemented Backfilling Materials in Coal Mines. Minerals 2019, 9, 55. https://doi.org/10.3390/min9010055
Liu H, Zhang J, Zhang W, Gao F, Yan H, An T. Experimental Investigation of Perceptual Characteristics of Functional Cemented Backfilling Materials in Coal Mines. Minerals. 2019; 9(1):55. https://doi.org/10.3390/min9010055
Chicago/Turabian StyleLiu, Hengfeng, Jixiong Zhang, Weiqing Zhang, Feng Gao, Hao Yan, and Tailong An. 2019. "Experimental Investigation of Perceptual Characteristics of Functional Cemented Backfilling Materials in Coal Mines" Minerals 9, no. 1: 55. https://doi.org/10.3390/min9010055
APA StyleLiu, H., Zhang, J., Zhang, W., Gao, F., Yan, H., & An, T. (2019). Experimental Investigation of Perceptual Characteristics of Functional Cemented Backfilling Materials in Coal Mines. Minerals, 9(1), 55. https://doi.org/10.3390/min9010055