Article

The Study on Numerical Simulation and Experiments of Four Product Hydrocyclone with Double Vortex Finders

College of Mechanical & Electronic Engineering, Shandong University of Science and Technology, Qingdao 266590, China
*
Author to whom correspondence should be addressed.
Minerals 2019, 9(1), 23; https://doi.org/10.3390/min9010023
Submission received: 14 November 2018 / Revised: 16 December 2018 / Accepted: 24 December 2018 / Published: 30 December 2018
(This article belongs to the Special Issue Physical Separation and Enrichment)

Abstract

:
A hydrocyclone is an instrument that can effectively separate multi-phase mixtures of particles with different densities or sizes based on centrifugal sedimentation principles. However, conventional hydrocyclones lead to two products only, resulting in an over-wide particle size range that does not meet the requirements of subsequent operations. In this article, a two-stage series, a four product hydrocyclone is proposed. The first stage hydrocyclone is designed to be a coaxial double overflow pipe: under the effect of separation, fine particles are discharged from the internal overflow pipe, while medium-size particles are discharged from external overflow pipe before entering the second stage hydrocyclone for fine sedimentation. In other words, one-stage grading leads to four products, including the first stage underflow, the first stage overflow, the second stage underflow, and the second stage overflow. The effects of structural parameters and operational parameters on flow field distribution in hydrocyclone were investigated via a study of flow field distribution in multi-product hydrocyclones using numerical simulations. The application of four product hydrocyclone in iron recovery shows that the grade and recovery of iron concentrate exceed 65.08% and 86.14%, respectively. This study provides references for understanding the flow field distribution in hydrocyclones and development of multi-product grading instrument in terms of both theory and industrial applications.

1. Introduction

A hydrocyclone is an instrument that can effectively separate mixtures of particles with different density or size based on centrifugal sedimentation principles [1,2,3,4,5,6,7]. Once pressurized into a hydrocyclone, powders are separated by separation: coarse/dense particles shift to the sidewall due to relatively large centrifugal forces, join the underflow via an outer swirl and leave via an underflow outlet; fine/sparse particles shift to the core due to relatively small centrifugal forces, join the overflow via an inner swirl and leave via an overflow pipe. One-stage grading by conventional hydrocyclones leads to coarse particle underflow and fine particle overflow only [8,9,10,11,12,13]. As shown in Figure 1, the size range is over-wide and fine grading has not been achieved, resulting in poor grading efficiency and accuracy.
To obtain multiple products in narrow size ranges using hydrocyclones, overflow series systems are usually employed. In particular, the first stage overflow serves as a feedstock for the second stage hydrocyclone, thus the fine particles mesh is obtained. By repeating this process, the multiple products in narrow size ranges may be produced, as shown in Figure 2.
However, this technique is limited by a tedious process and costly equipment. Great efforts have been made to achieve multiple products in narrow size ranges by one-stage grading in hydrocyclones. For instance, a sieve hydrocyclone was proposed for grading of fine slurry particles (see Figure 3). Coarse particle underflow, fine particle overflow, and undersieve medium particle can be obtained. This approach, however, is limited by the mesh blocking issue.
Ahmed et al. proposed a hydrocyclone for three products (one overflow and two underflows) by design of a tangential discharge outlet in a middle part of the cone section (see Figure 4) [14]. This three product hydrocyclone separates particles in sizes larger than the overflow fine particles, yet smaller than the underflow coarse particles. However, the size ranges of particles obtained by this process cannot be precisely controlled, thus so far it is not suitable for industrial applications.
A double overflow pipe three product hydrocyclone, with an insert of the other overflow pipe into the conventional hydrocyclone overflow pipe, was proposed in references [15,16,17,18]. In this way, the one-stage grading leads to an overflow containing fine particles, an overflow containing medium particles, and an underflow containing coarse particles. Nevertheless, the size ranges of particles in external overflow are still relatively wide and the diameter mismatch between internal and external overflow pipes can be a severe issue. Meanwhile, the effect of the insertion depth of an internal overflow pipe and effects of structural and functional parameters on the flow field performance have not been well understood.
In summary, the expanding applications of hydrocyclones lead to higher requirements on their grading accuracy and grading size. The one-stage grading by conventional hydrocyclones leads to two products only and the particle size ranges are over-wide. In such a case incomplete separation is inevitable, resulting in poor grading efficiency and accuracy and the phenomenon of “fine particle in underflow, coarse particle in overflow”. In this study a two-stage series, a four product hydrocyclone (see Figure 5) is proposed.
The first section hydrocyclone is designed as a coaxial double overflow pipe. Once pressurized into a hydrocyclone, matters are separated by separation: fine particles are discharged from the internal overflow pipe while medium-size particles are discharged from the external overflow pipe and serve as a feedstock to the second section hydrocyclone in which these particles are graded again. In this way four products, namely the first stage underflow, first stage overflow, the second stage underflow and the second stage overflow, can be obtained by one-stage grading. One-stage grading by the multi-product hydrocyclones leads to multiple products in narrow size ranges and is characterized by reduced particle size, improved grading accuracy and reduced energy consumption. We investigated flow field distributions in the proposed multi-product hydrocyclone by numerical simulation and performed experimental tests to facilitate understanding effects of structural and functional parameters on separation performance of hydrocyclone. This study provides references for understanding of grading by hydrocyclones and development of multi-product grading instrument in terms of both theory and industrial applications.
The remainder of this paper is organized as follows: Section 2 describes the mathematical model of the hydrocyclone with double vortex finders. Section 3 presents the numerical simulation results. Section 4 presents the tests results. The conclusions are summarized in Section 5.

2. Mathematical Model of Turbulent Flow Field of Hydrocyclones

The flow characteristics and flow motion inside the hydrocyclone are computed with continuity equation and momentum equation. Because the cyclone is cylindrical, therefore, the flow motion equation inside the cyclone is applied using cylindrical coordinates.
The continuity equation is expressed as follows:
1 r u θ θ + u r r + u z z + u r r = 0
The momentum equation is expressed as follows:
ρ ( u r u r r + u z u r z u θ 2 r ) = P r + μ ( 2 u r r 2 + 1 r u r r + 2 u r z 2 u r r 2 )
ρ ( u r u θ r + u z u θ z + u r u θ r ) = μ ( 2 u θ r 2 + 1 r u θ r + 2 u θ z 2 u θ r 2 )
ρ ( u r u z r + u z u z z ) = P z + μ ( 2 u z r 2 + 1 r u z r + 2 u z z 2 )
Reynolds proposed the theory of time-averaged flow field, which divides the instantaneous motion parameters into two parts, namely, the time-averaged values and the fluctuating values [19].
Therefore, the equation of continuity and the Navier-Stokes equation are written as follows:
1 r u θ θ + u r r + u z z + u r r = 0
ρ ( u r u r r + u z u r z u θ 2 r ) = P r + μ ( 2 u r r 2 + 1 r u r r + 2 u r z 2 u r r 2 ) ρ ( 1 r r r u r 2 ¯ + z u r u ¯ z + 1 r u θ 2 ¯ )
ρ ( u r u θ r + u z u θ z + u r u θ r ) = μ ( 2 u θ r 2 + 1 r u θ r + 2 u θ z 2 u θ r 2 ) ρ ( r u r u ¯ θ + z u θ u ¯ z + 2 r u r u ¯ θ )
ρ ( u r u z r + u z u z z ) = P z + μ ( 2 u z r 2 + 1 r u z r + 2 u z z 2 ) ρ ( r u r u ¯ z + z u z 2 ¯ )

3. Numerical Simulation

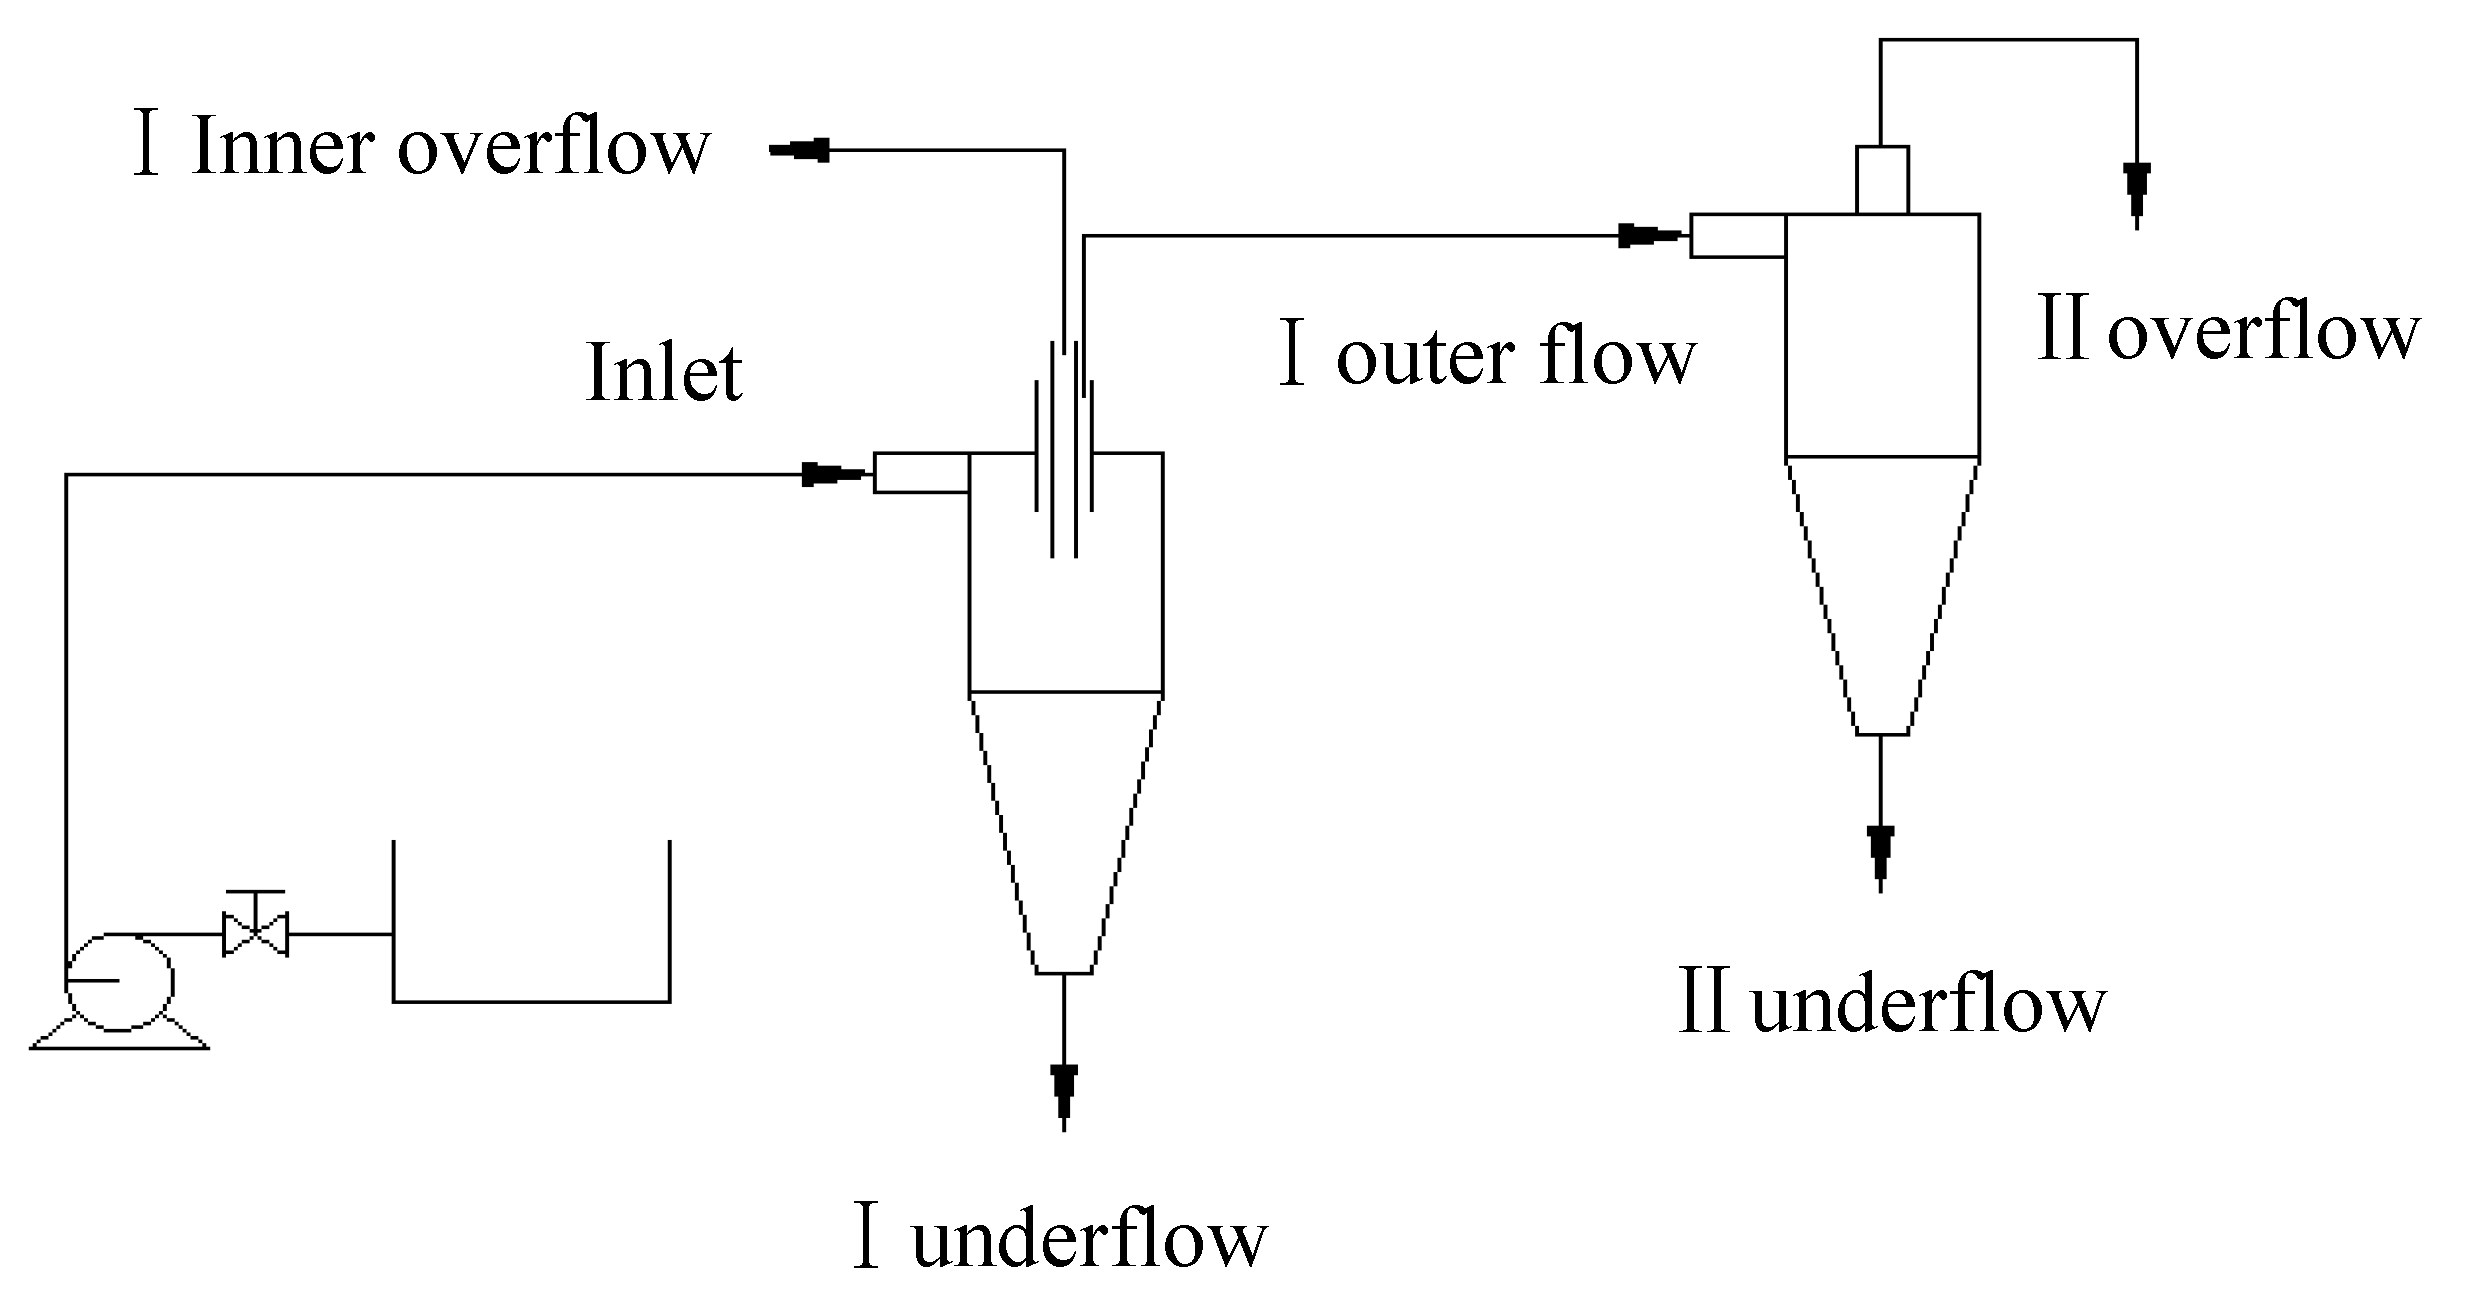
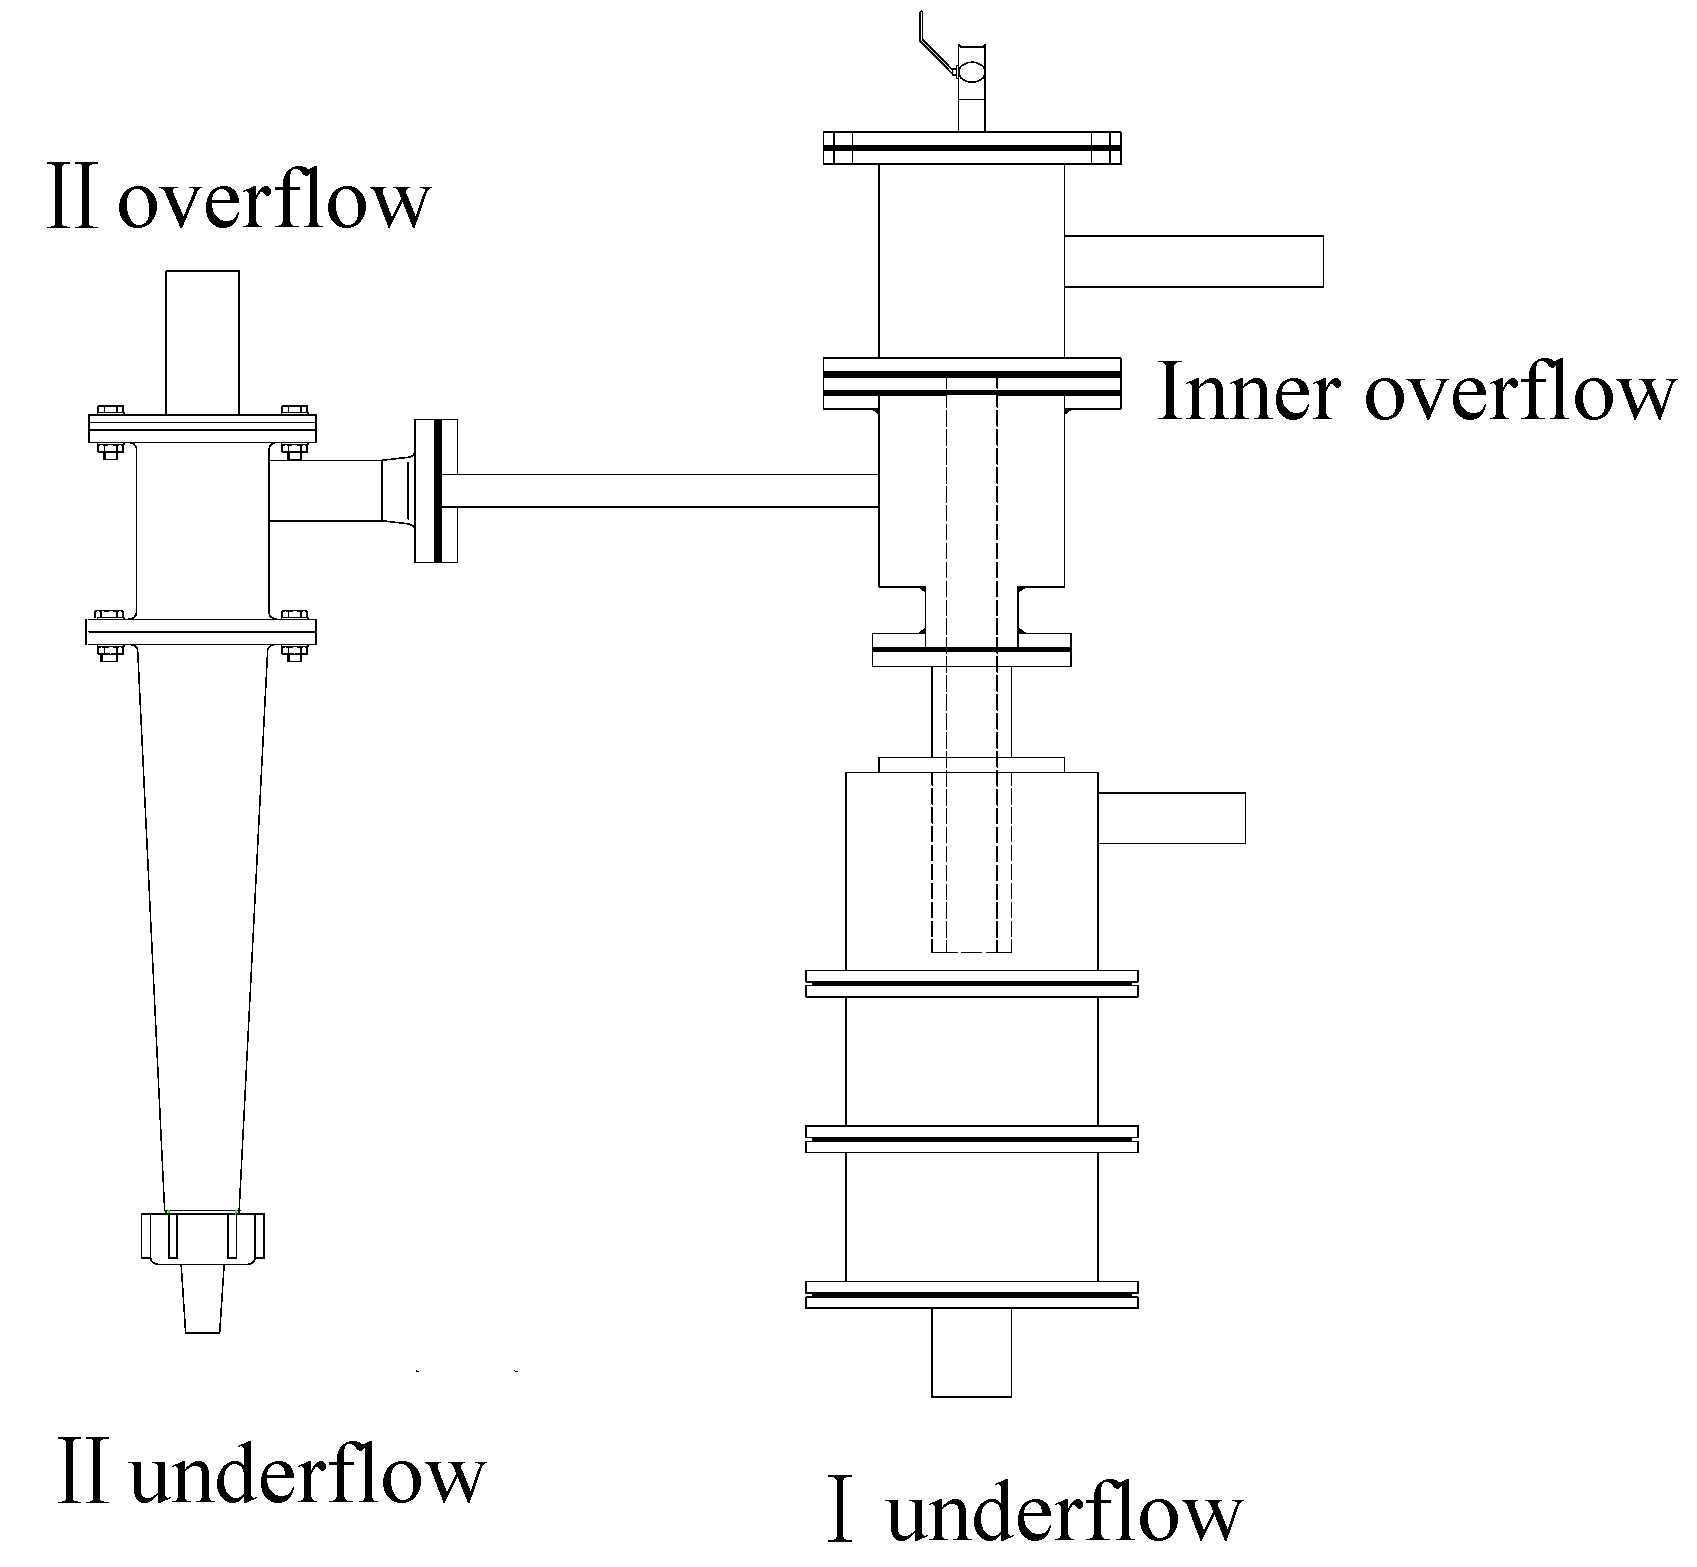
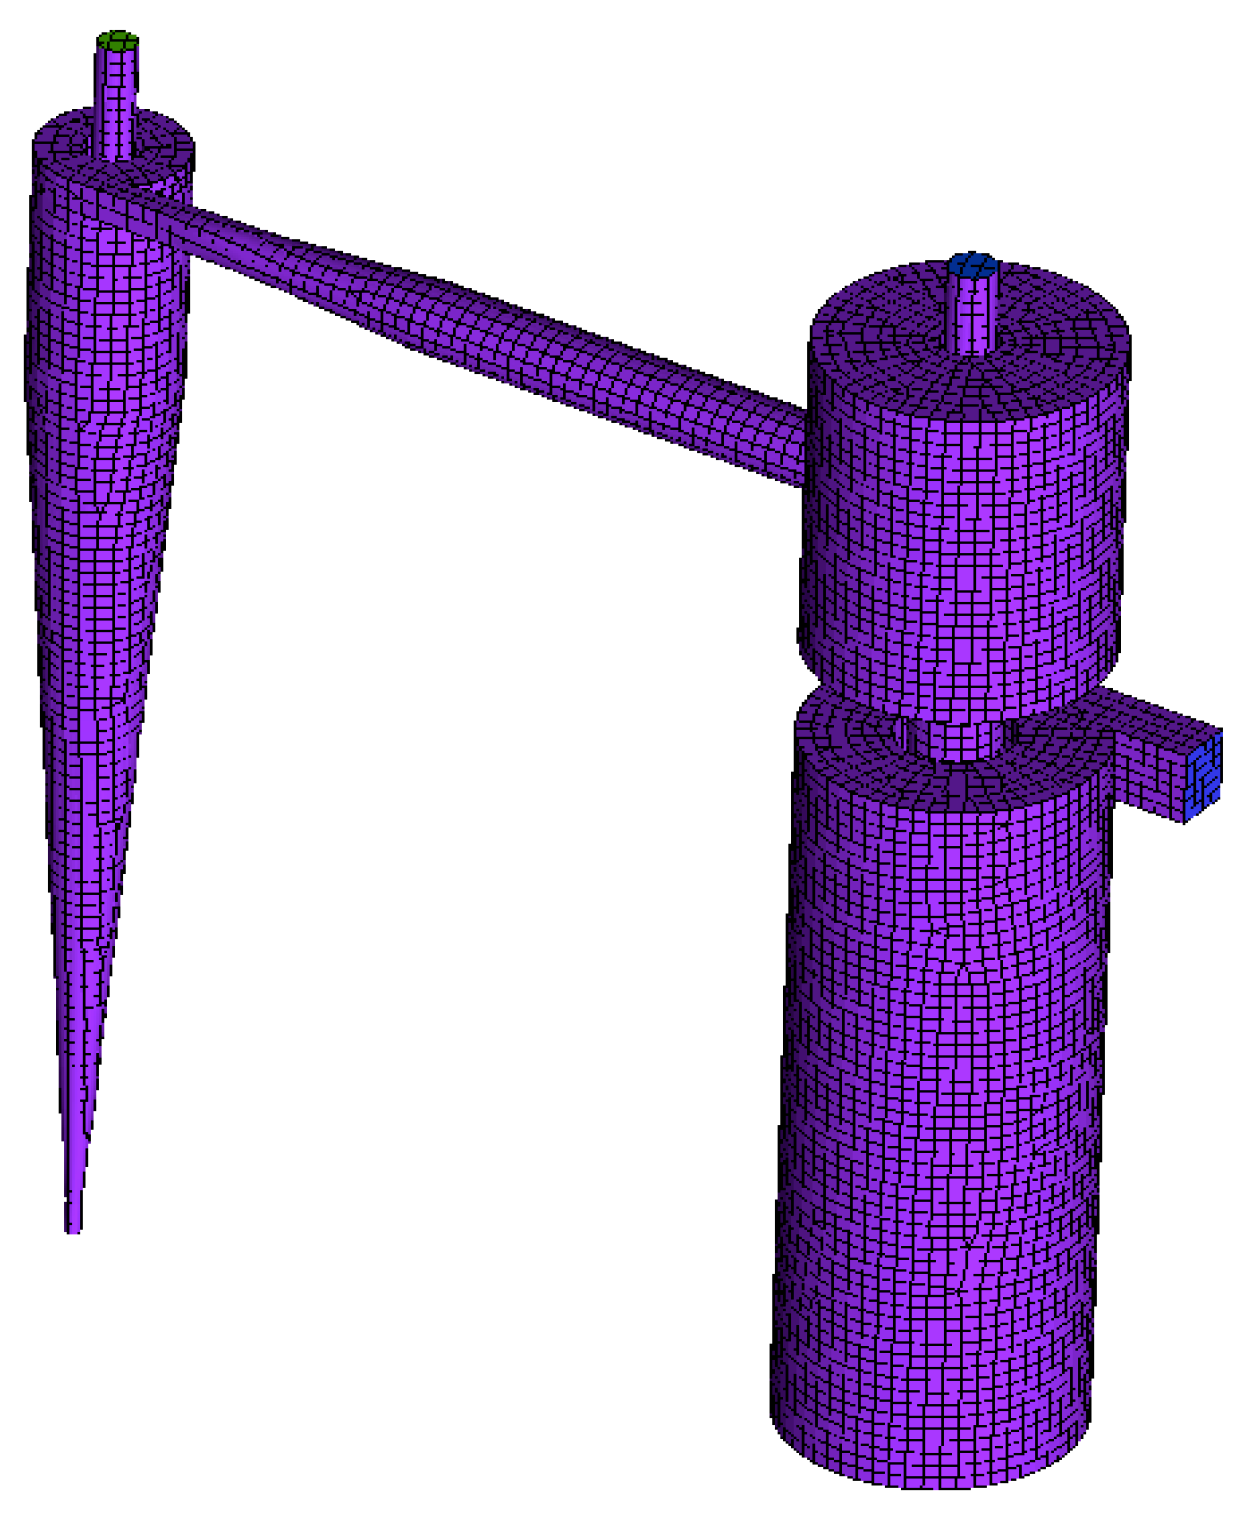
3.1. Modelling of Four Product Hydrocyclone

The first stage hydrocyclone is designed to be a 150 mm diameter double overflow pipe and the second cyclone was a conventional column cone 75 mm in diameter. The overflow of the first stage hydrocyclone was split into internal and external overflow paths. The external overflow, which is separated from the internal overflow by the overflow cap, is further graded in the second stage hydrocyclone. Figure 6 shows the structure model of the proposed hydrocyclone and Figure 7 shows the mesh. Then the mesh grid which determines the accuracy and the converging efficiency of numerical simulations that were developed for the model using meshing software ICEM. The fluid zone is divided into various hexahedron or tetrahedron meshes. The fitting degree is directly related to the mesh quantity. Mesh grids can be categorized as structural and non-structural grids. In structural grids [19,20] the mesh of each node in a specific zone is consistent with that of its adjacent node in this zone. These grids have advantages in boundary fitting, model accuracy, and data structure. However, structural grids are not well applicable for complicated flow field models. On the contrary, non-structural grids are applicable for any flow field model [21,22], although the calculation is usually time consuming and the accuracy is limited. In flow field models of four product hydrocyclones, the hexahedron structural grid was applied on a hydrocyclone column, while a non-structural grid was applied for feeding inlets and boundaries.
Figure 8 represents the quality of the grid. As shown in Figure 8, the mesh quality whose critical level for simulations is 0.2, exceeds 0.35, indicating high quality of the mesh grid.

3.2. Numerical Simulation

3.2.1. Selection of Turbulence Model and Multi-Phase Flow Model

In the Reynolds Stress equation Model (RSM) components of each stress are obtained by solving the Reynolds Stress equation. The RSM was selected as the turbulence model in this study [23,24,25,26,27,28,29].
In the multi-phase flow model, the VOF (Volume of Fluid) model is a simplified Euler-Euler model in which a momentum equation is solved and volume fraction of each fluid flowing through the computational domain is processed. The VOF model was selected to capture the liquid/gas interface in a hydrocyclone.

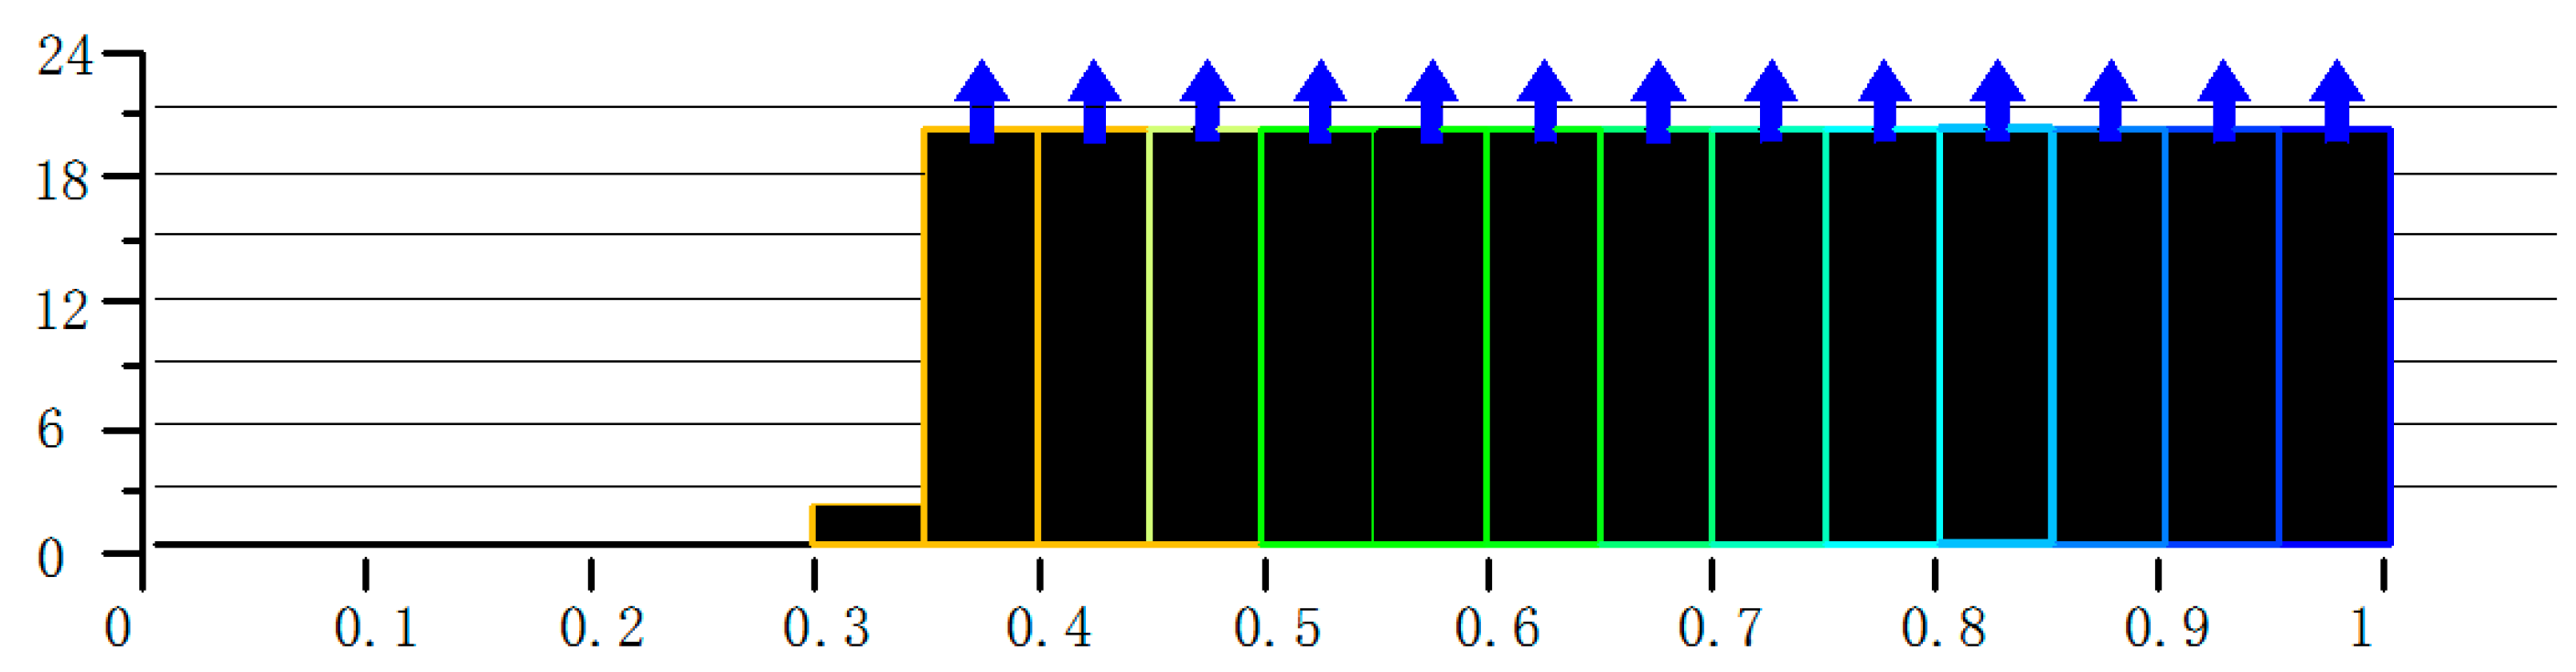
3.2.2. Boundary Condition and Calculation Scheme

Inlet boundary condition: the inlet velocity is defined as the inlet boundary condition. With the inlet velocity to be 2.5 m/s the turbulent intensity and hydraulic diameter are 3.8% and 36 mm respectively.
Outlet boundary condition: the outlet pressure is defined as the outlet boundary condition. For hydrocyclone, the outlet is exposed to atmosphere and the relative pressure is 0. Turbulence intensities and hydraulic diameters obtained are summarized in Table 1.
Numerical simulation and discrete scheme: numerical simulation was performed using the SIMPLE algorithm (pressure-velocity coupling). The discrete scheme for pressure was set to be PRESTO!, the discrete terms in momentum equation was set to be in First Order Upwind scheme and then turned into QUICK scheme after convergence. Discrete terms in all other functions were set to be in the First Order Upwind scheme.

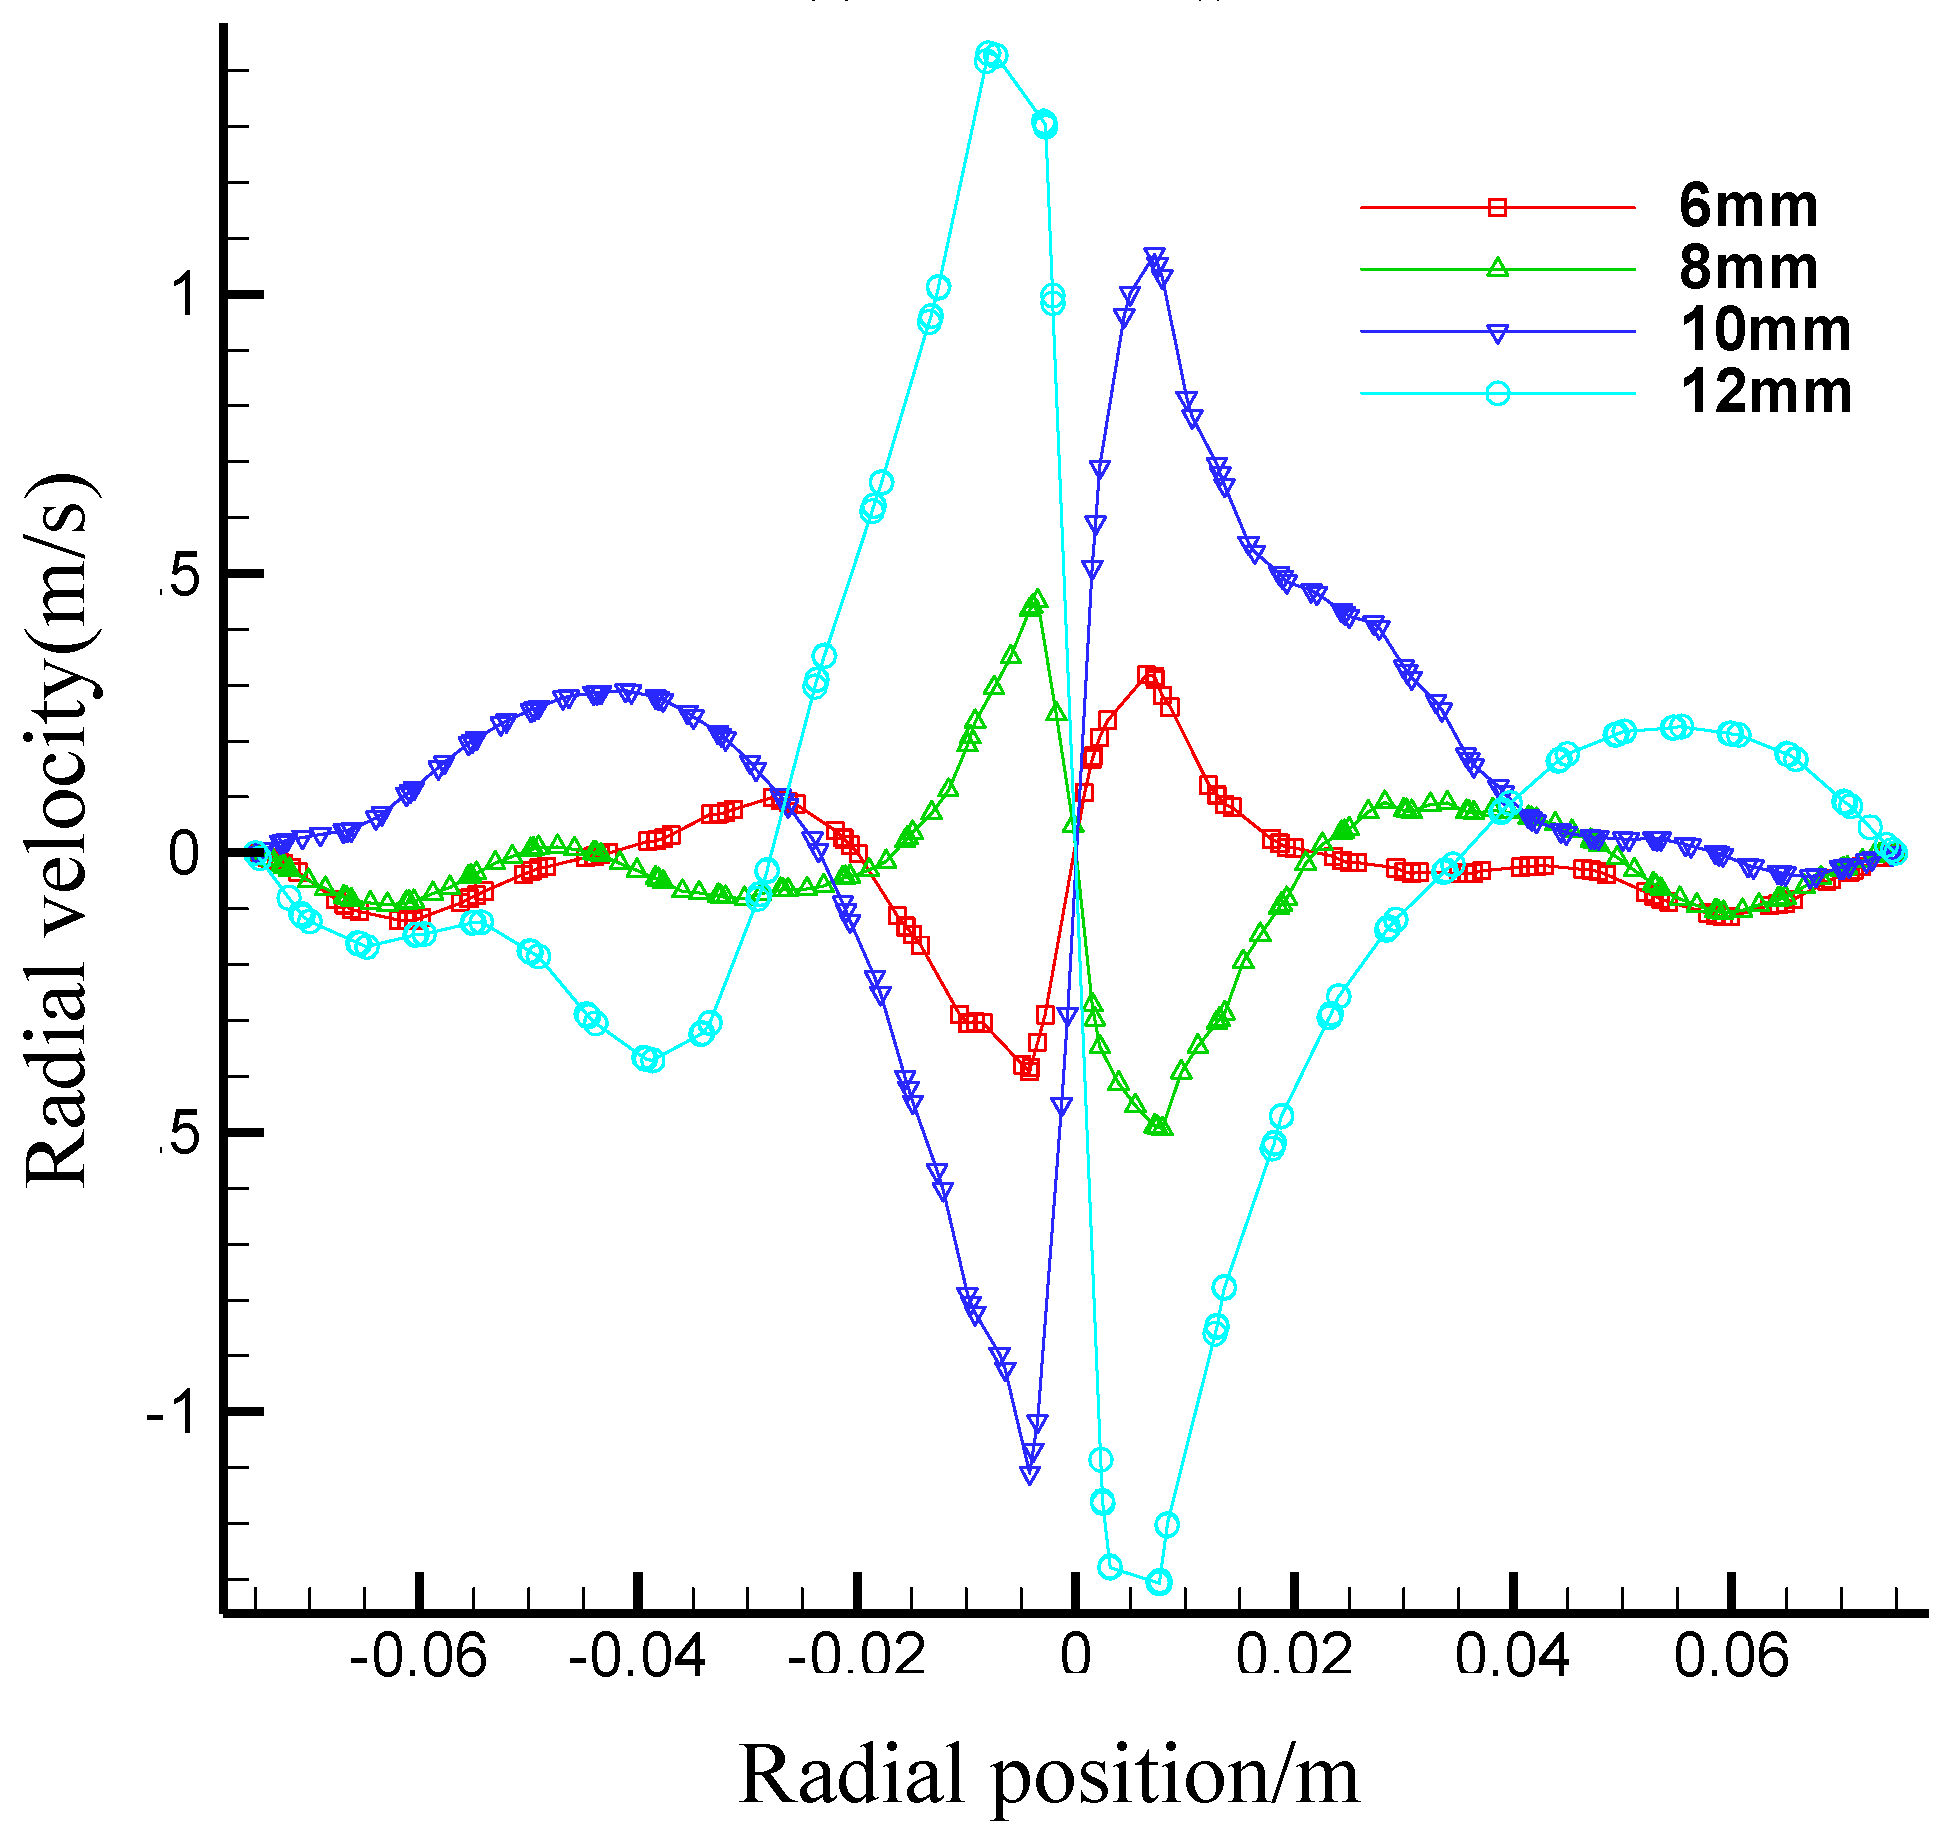
3.2.3. Simulation and Results Analysis

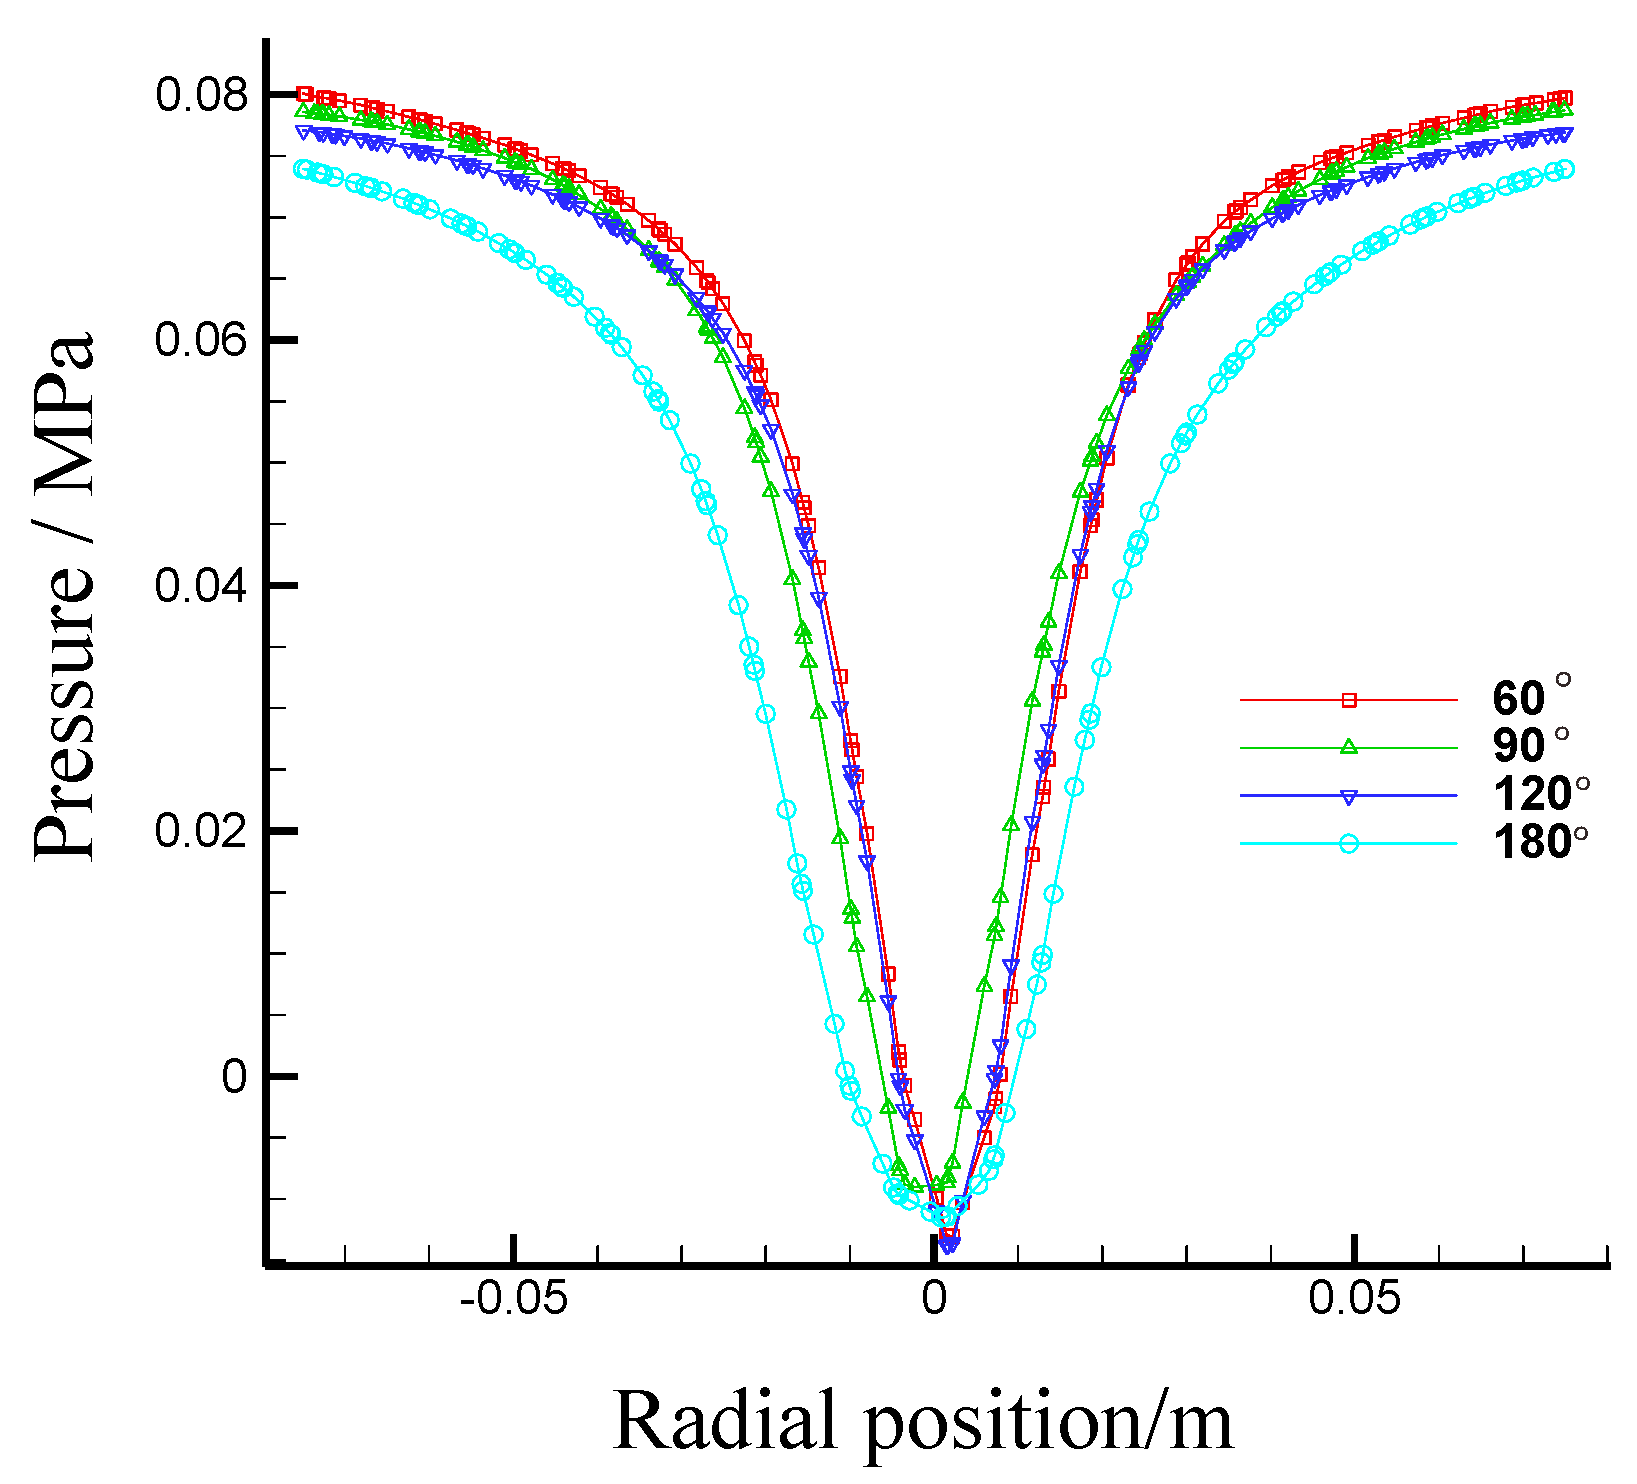
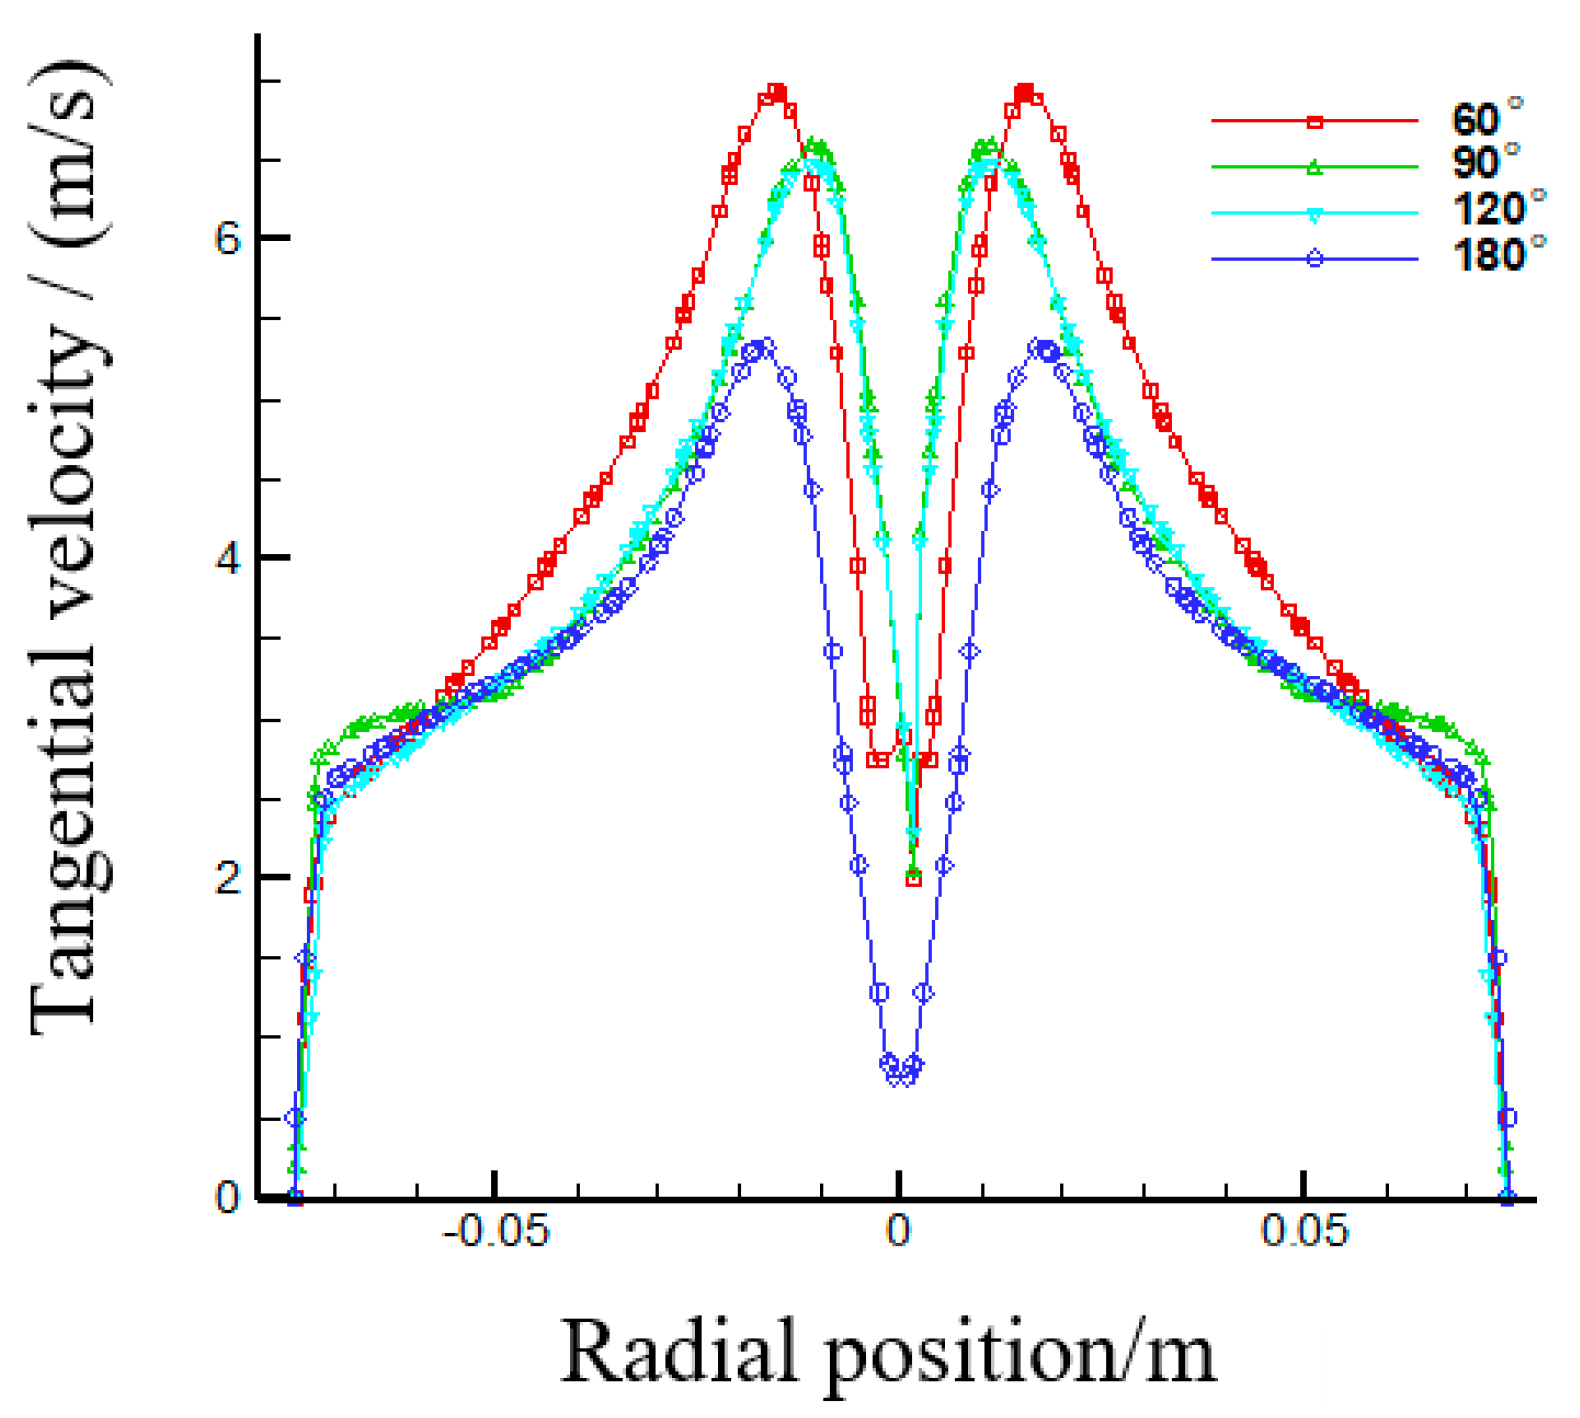
  • Effects of the first section cone angle on the flow fields in the first section hydrocyclone
Figure 9 summarizes pressures in the first section hydrocyclone at cone angles of 60°, 90°, 120°, and 180°.
As observed, pressure in the hydrocyclone decreased from sidewall towards the core part and was centrosymmetrically distributed. As a result, a negative pressure zone was observed in the core part. The pressure in the first section hydrocyclone decreased as the first section cone angle increased.
As shown in Figure 10, the flow field velocity is affected by the cone angle: the tangential velocity of flow fields in the hydrocyclone decreased as the cone angle increased. This can be attributed to space increase in the hydrocyclone due to cone angle increase at fixed hydrocyclone height.
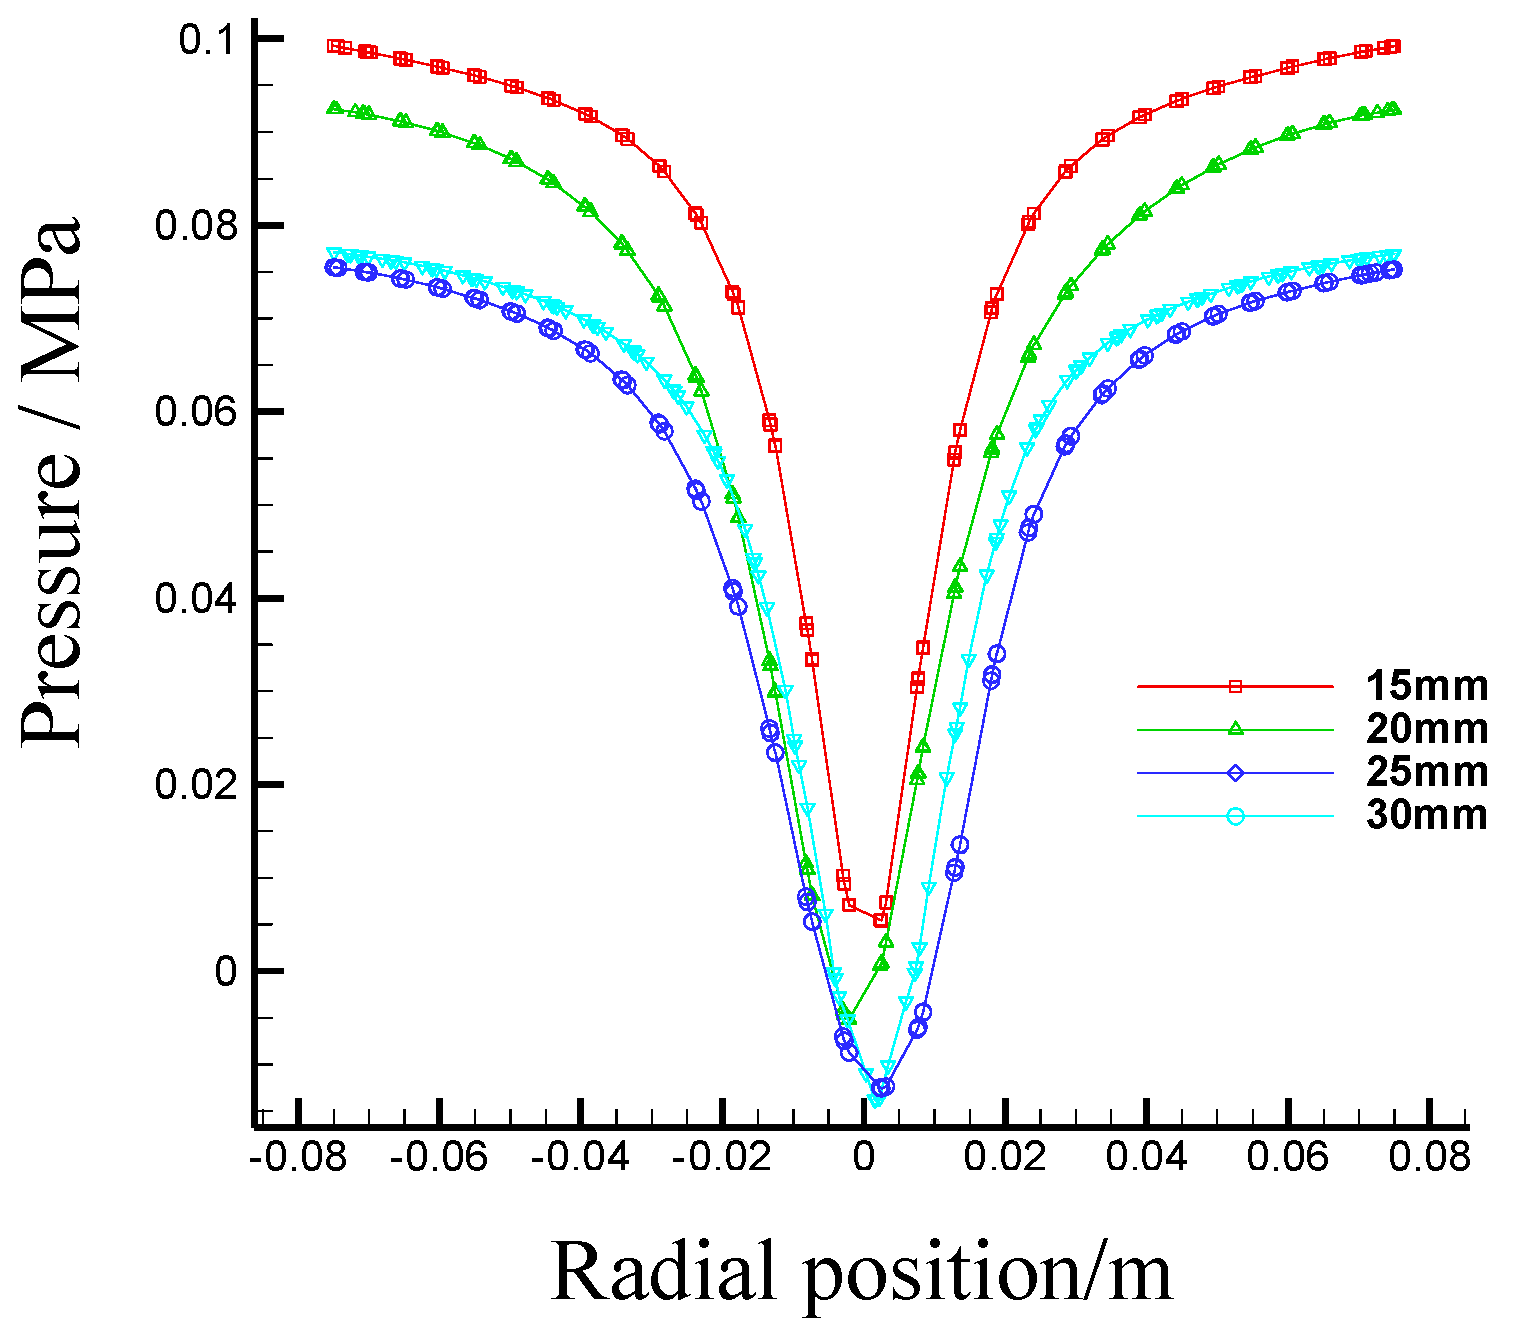
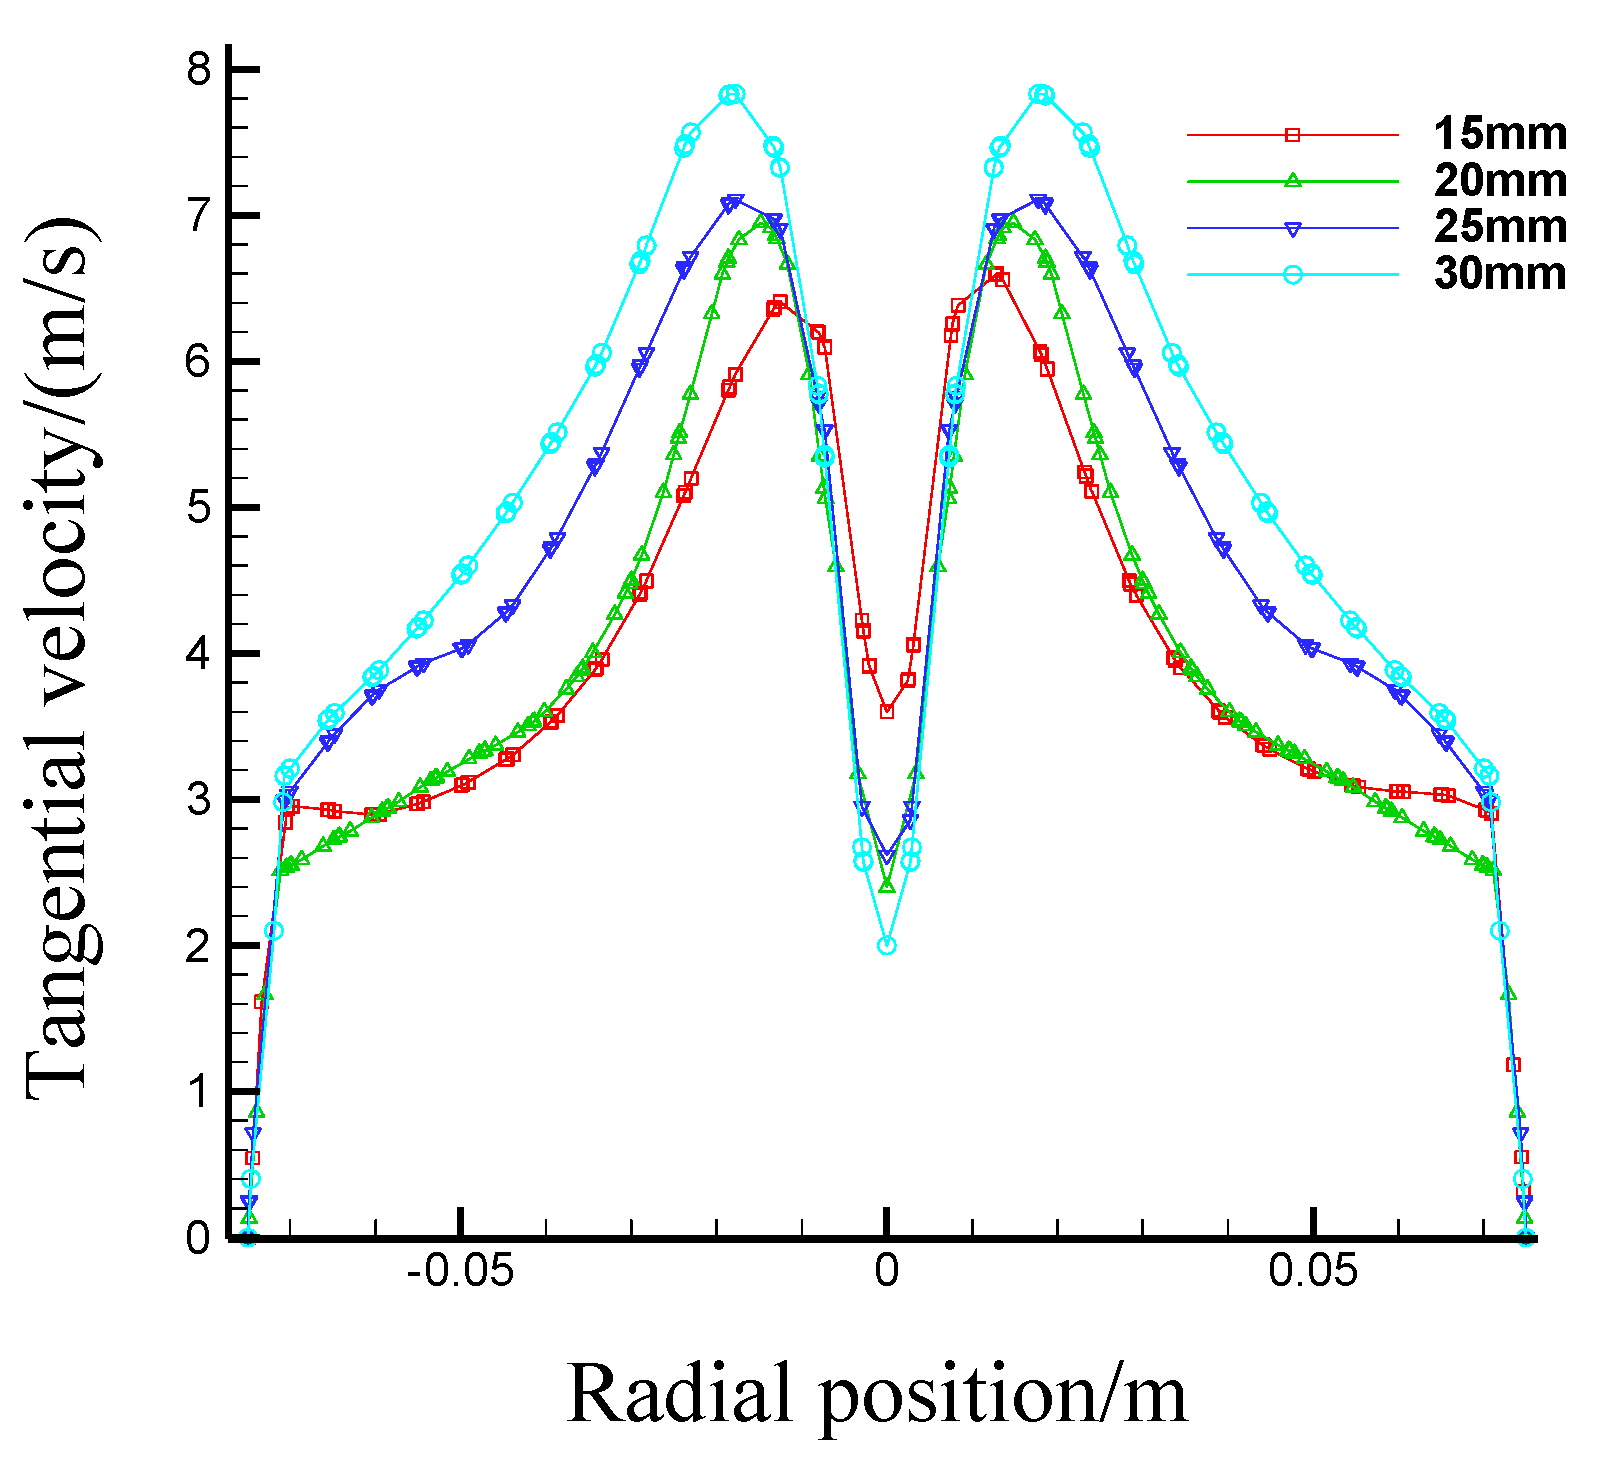
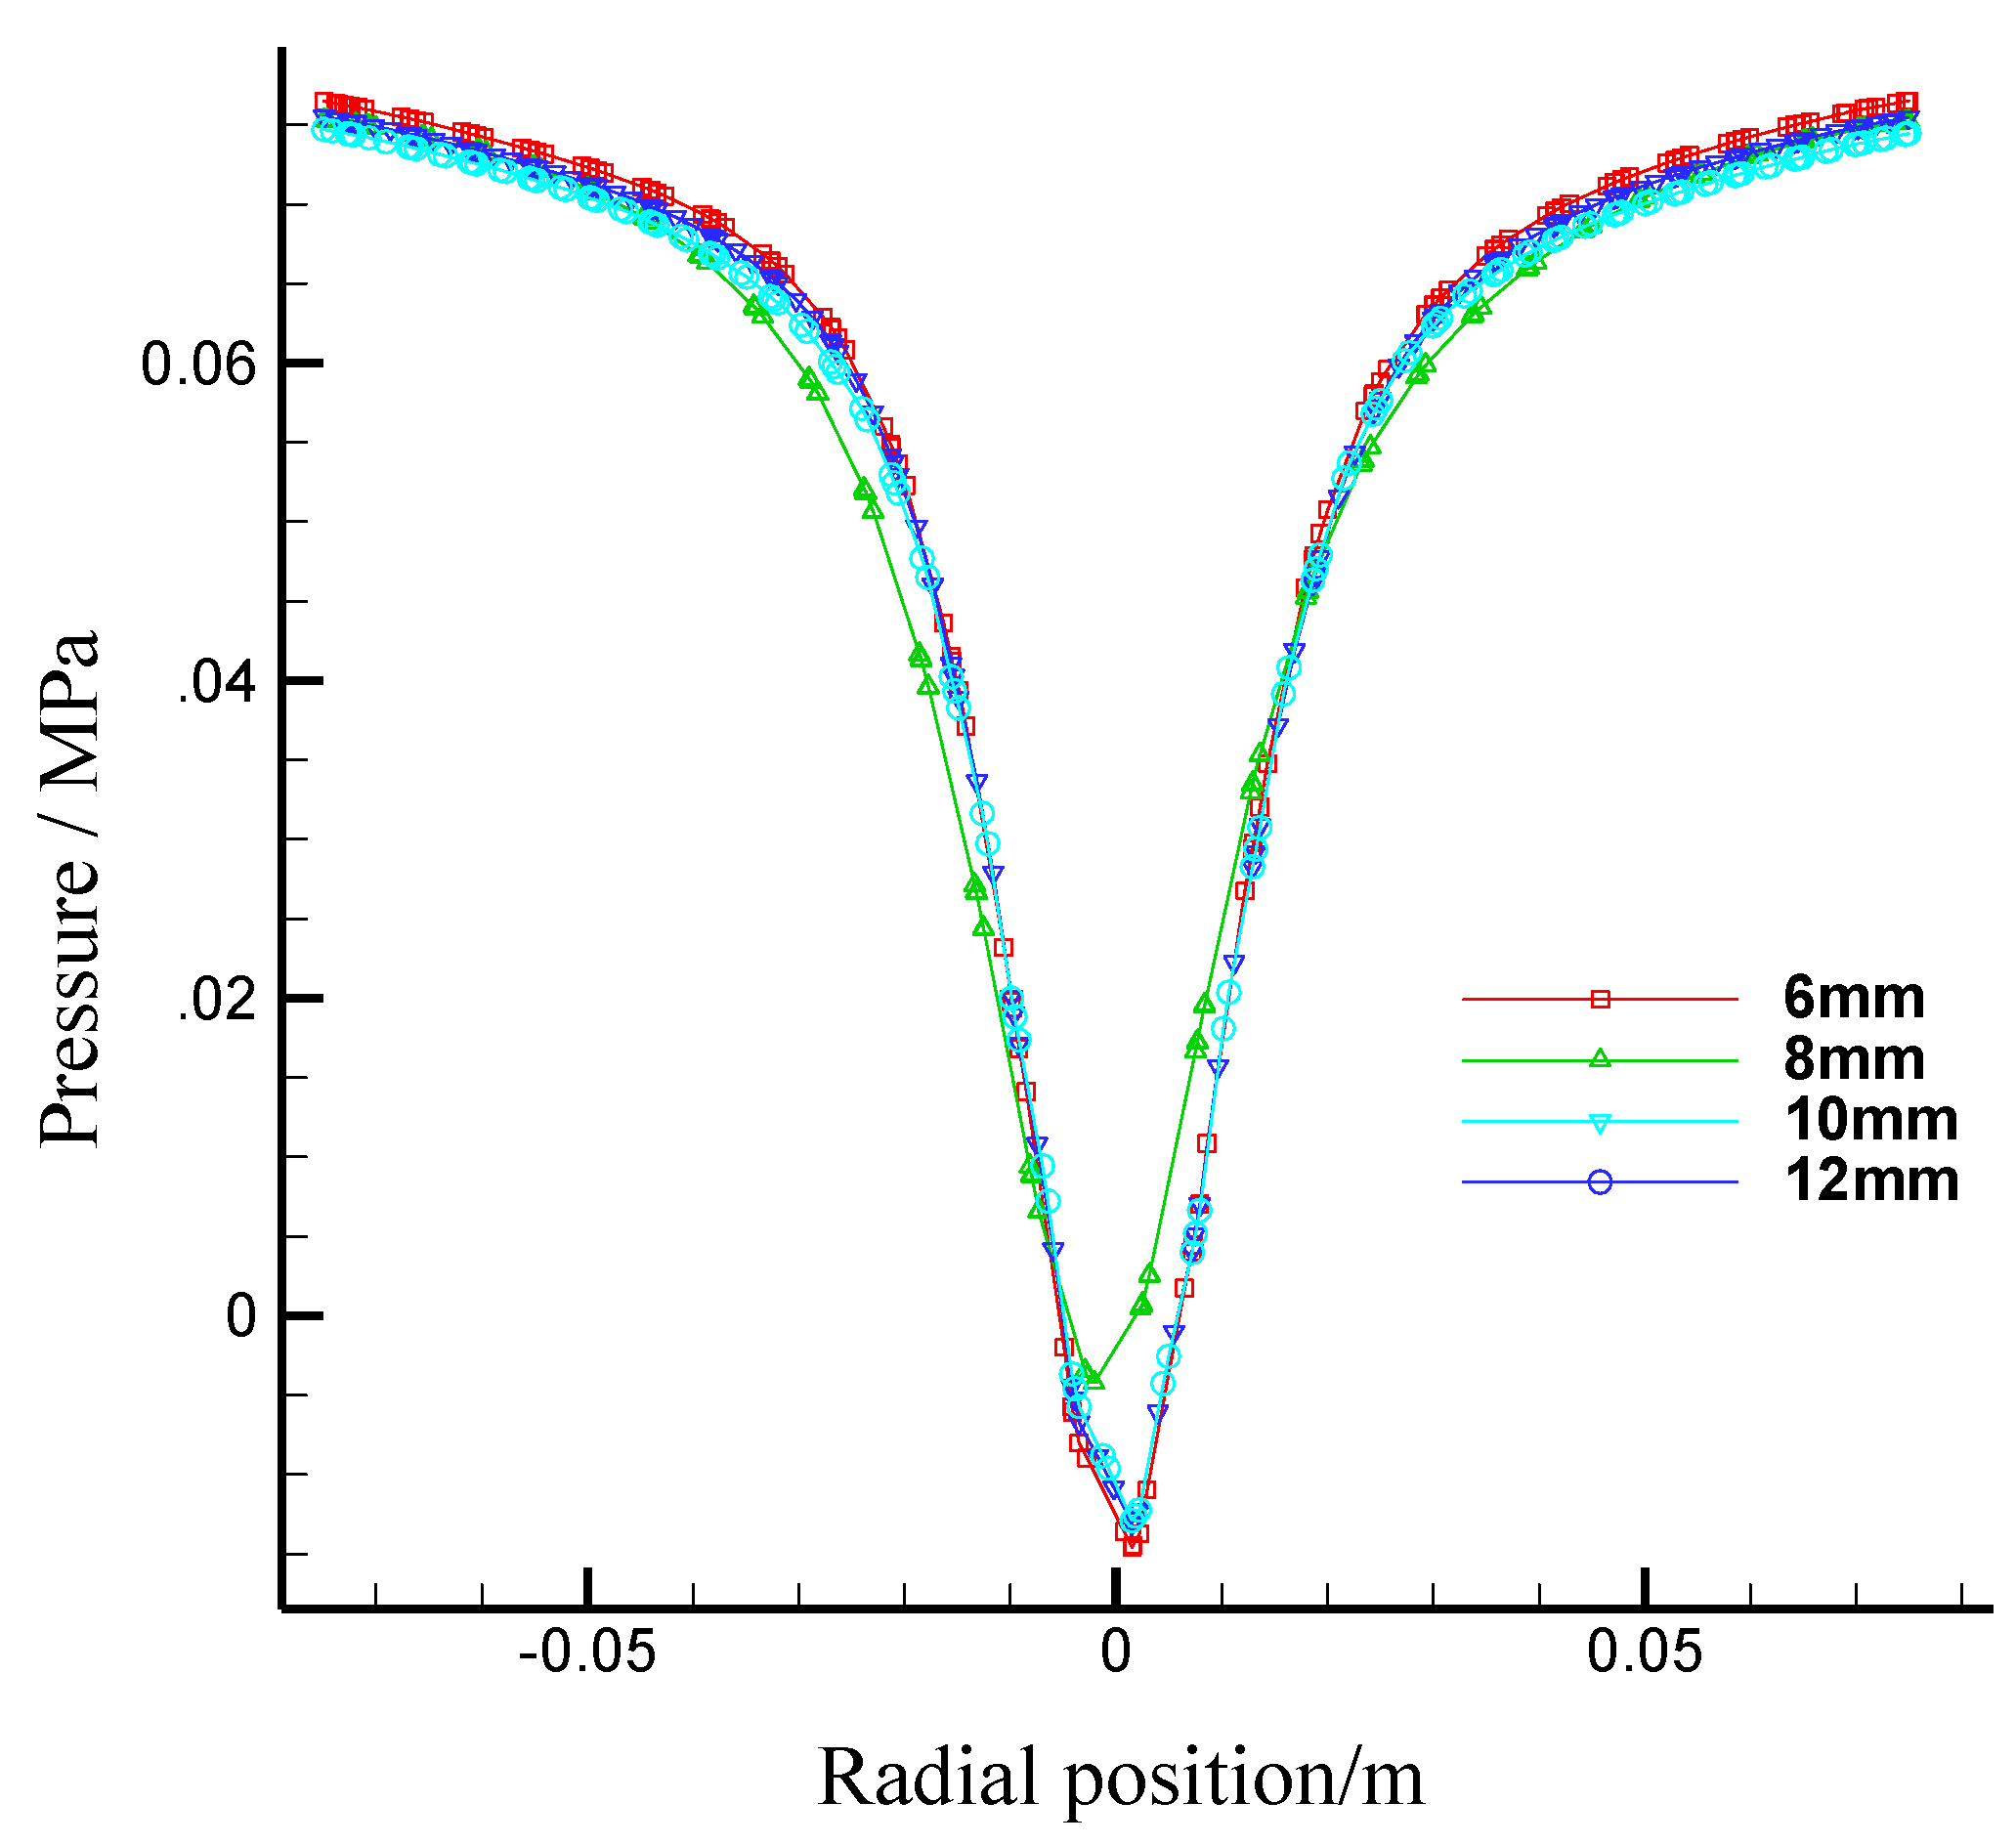
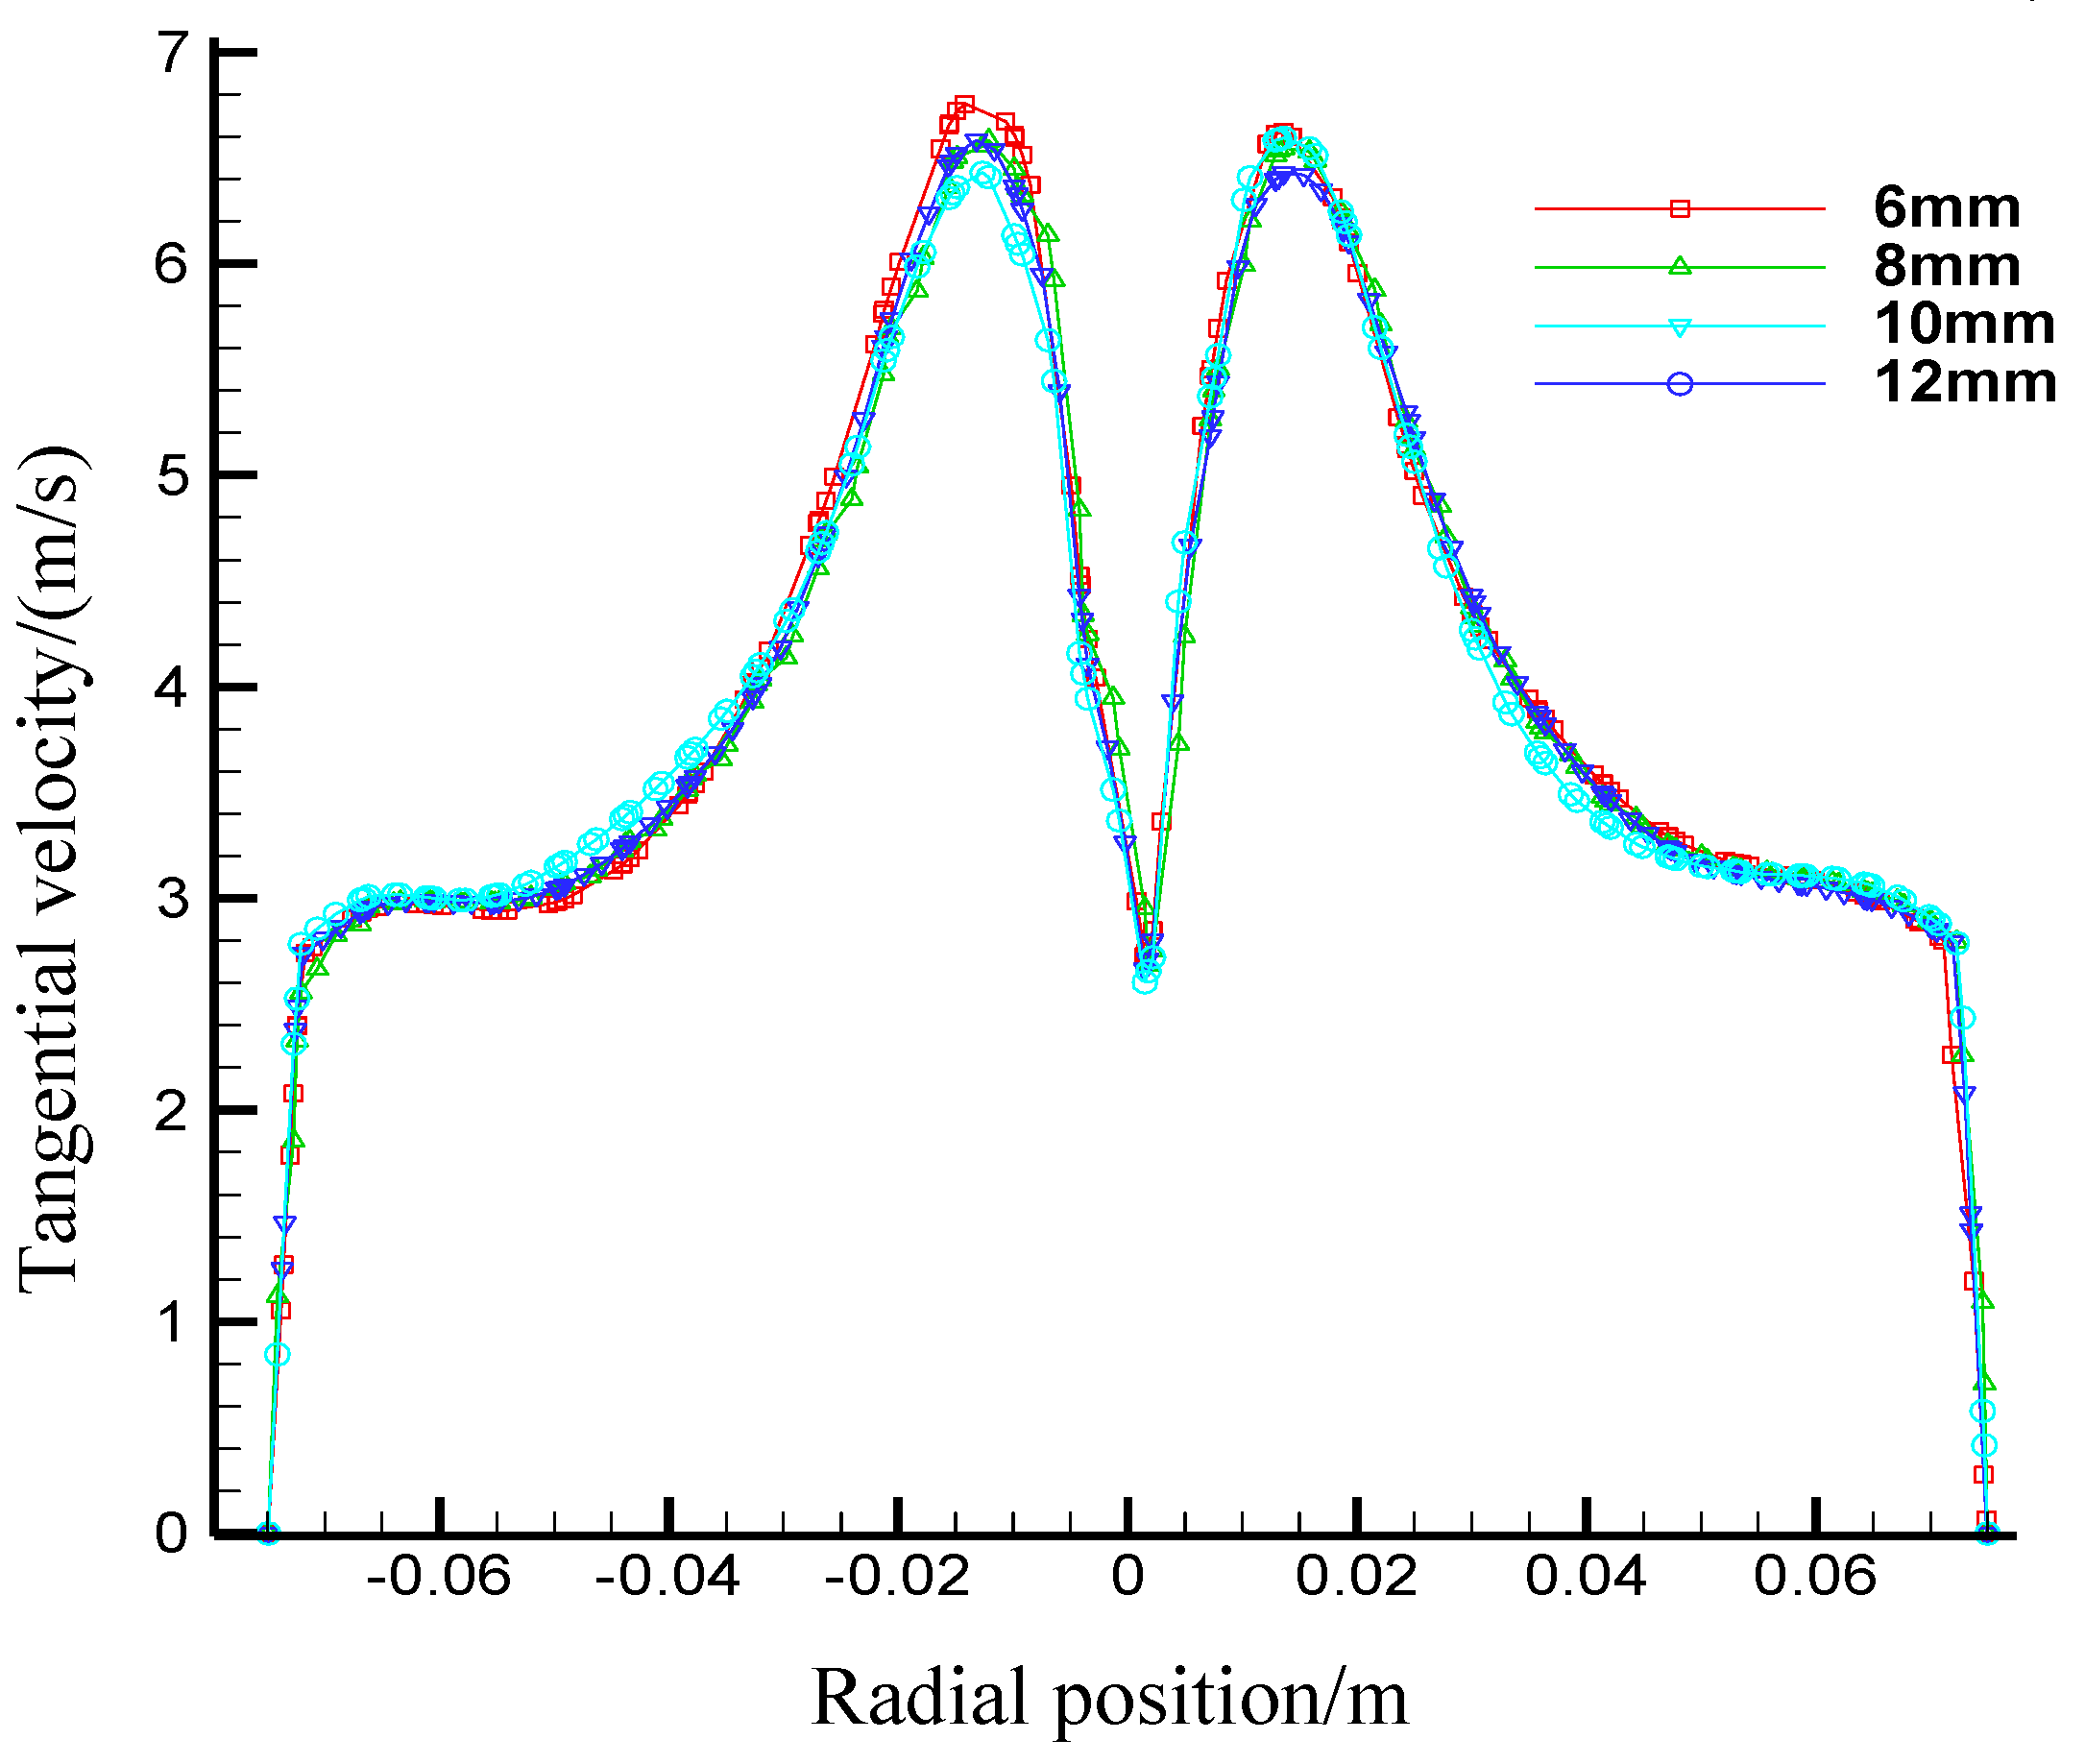
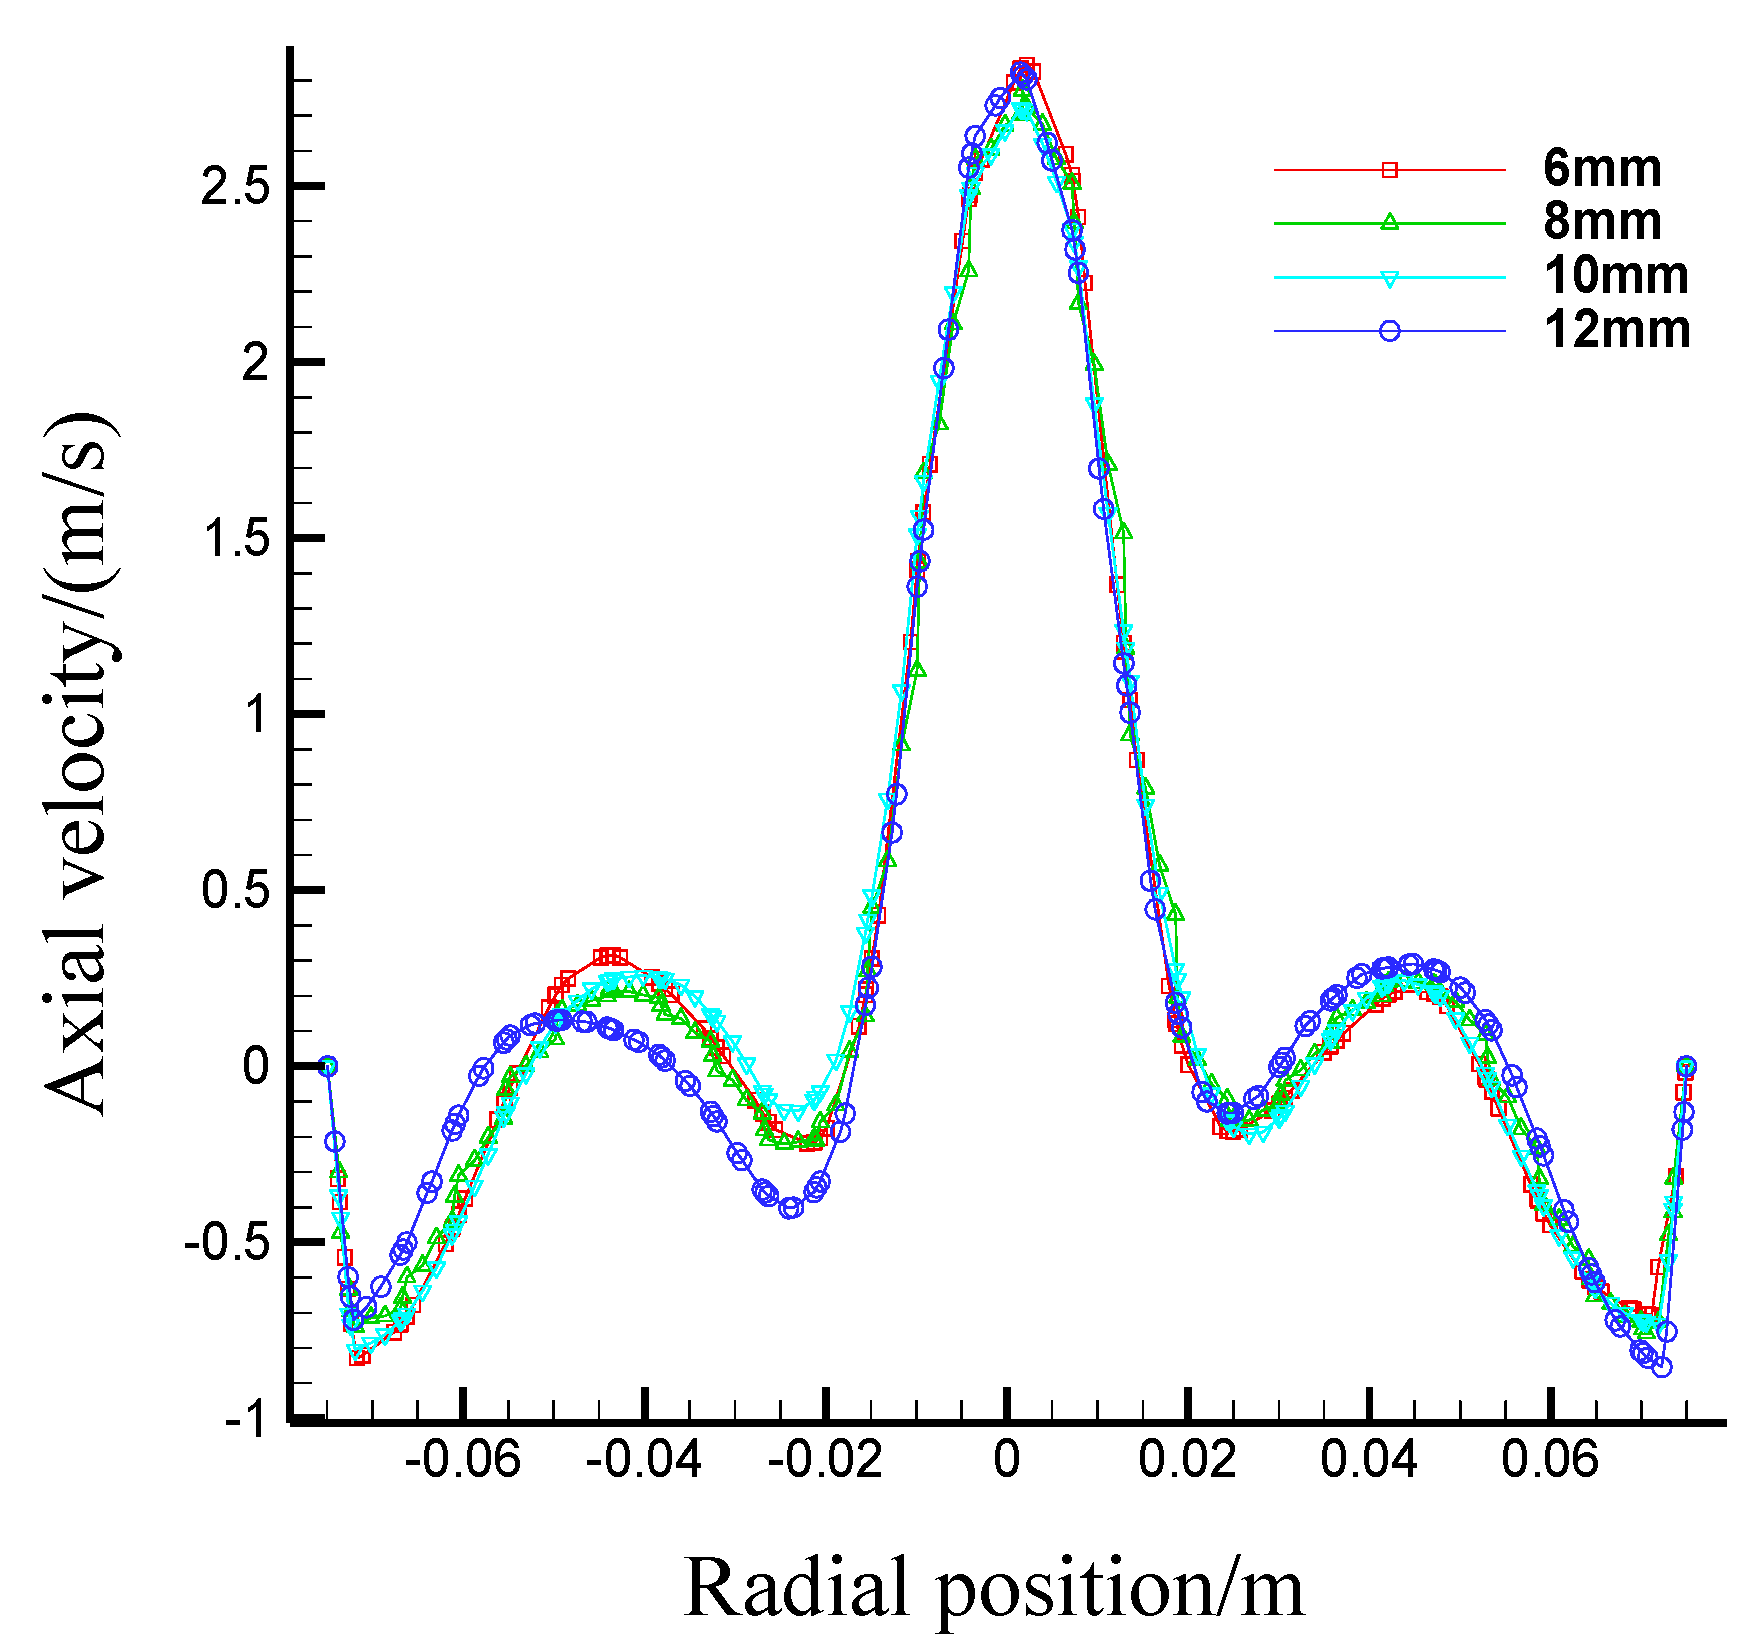
  • Effects of the first section internal overflow pipe diameter on flow fields in the first section hydrocyclone
Figure 11 shows the internal pressure distributions in the first section internal overflow pipe in diameters of 15 mm, 20 mm, 25 mm, and 30 mm. The pressure was maximized (feeding pressure = 0.08~0.1 MPa) on the hydrocyclone sidewall and degraded along the radial direction. As a result, a negative pressure zone was observed in the core part. The pressure decreased as the internal overflow pipe diameter increased.
As shown in Figure 12, four curves correspond to tangential velocities of flow fields in the first section hydrocyclone at internal overflow pipe diameters of 15 mm, 20 mm, 25 mm, and 30 mm respectively. The tangential velocities increase along with the overflow outlet diameter increase. In addition, the location of the maximum tangential velocity shifted outwards along the radial direction as the internal overflow pipe diameter increased. This can be attributed to the outward shift of trajectory surface of maximum tangential velocity as a result of increase of the overflow pipe diameter.
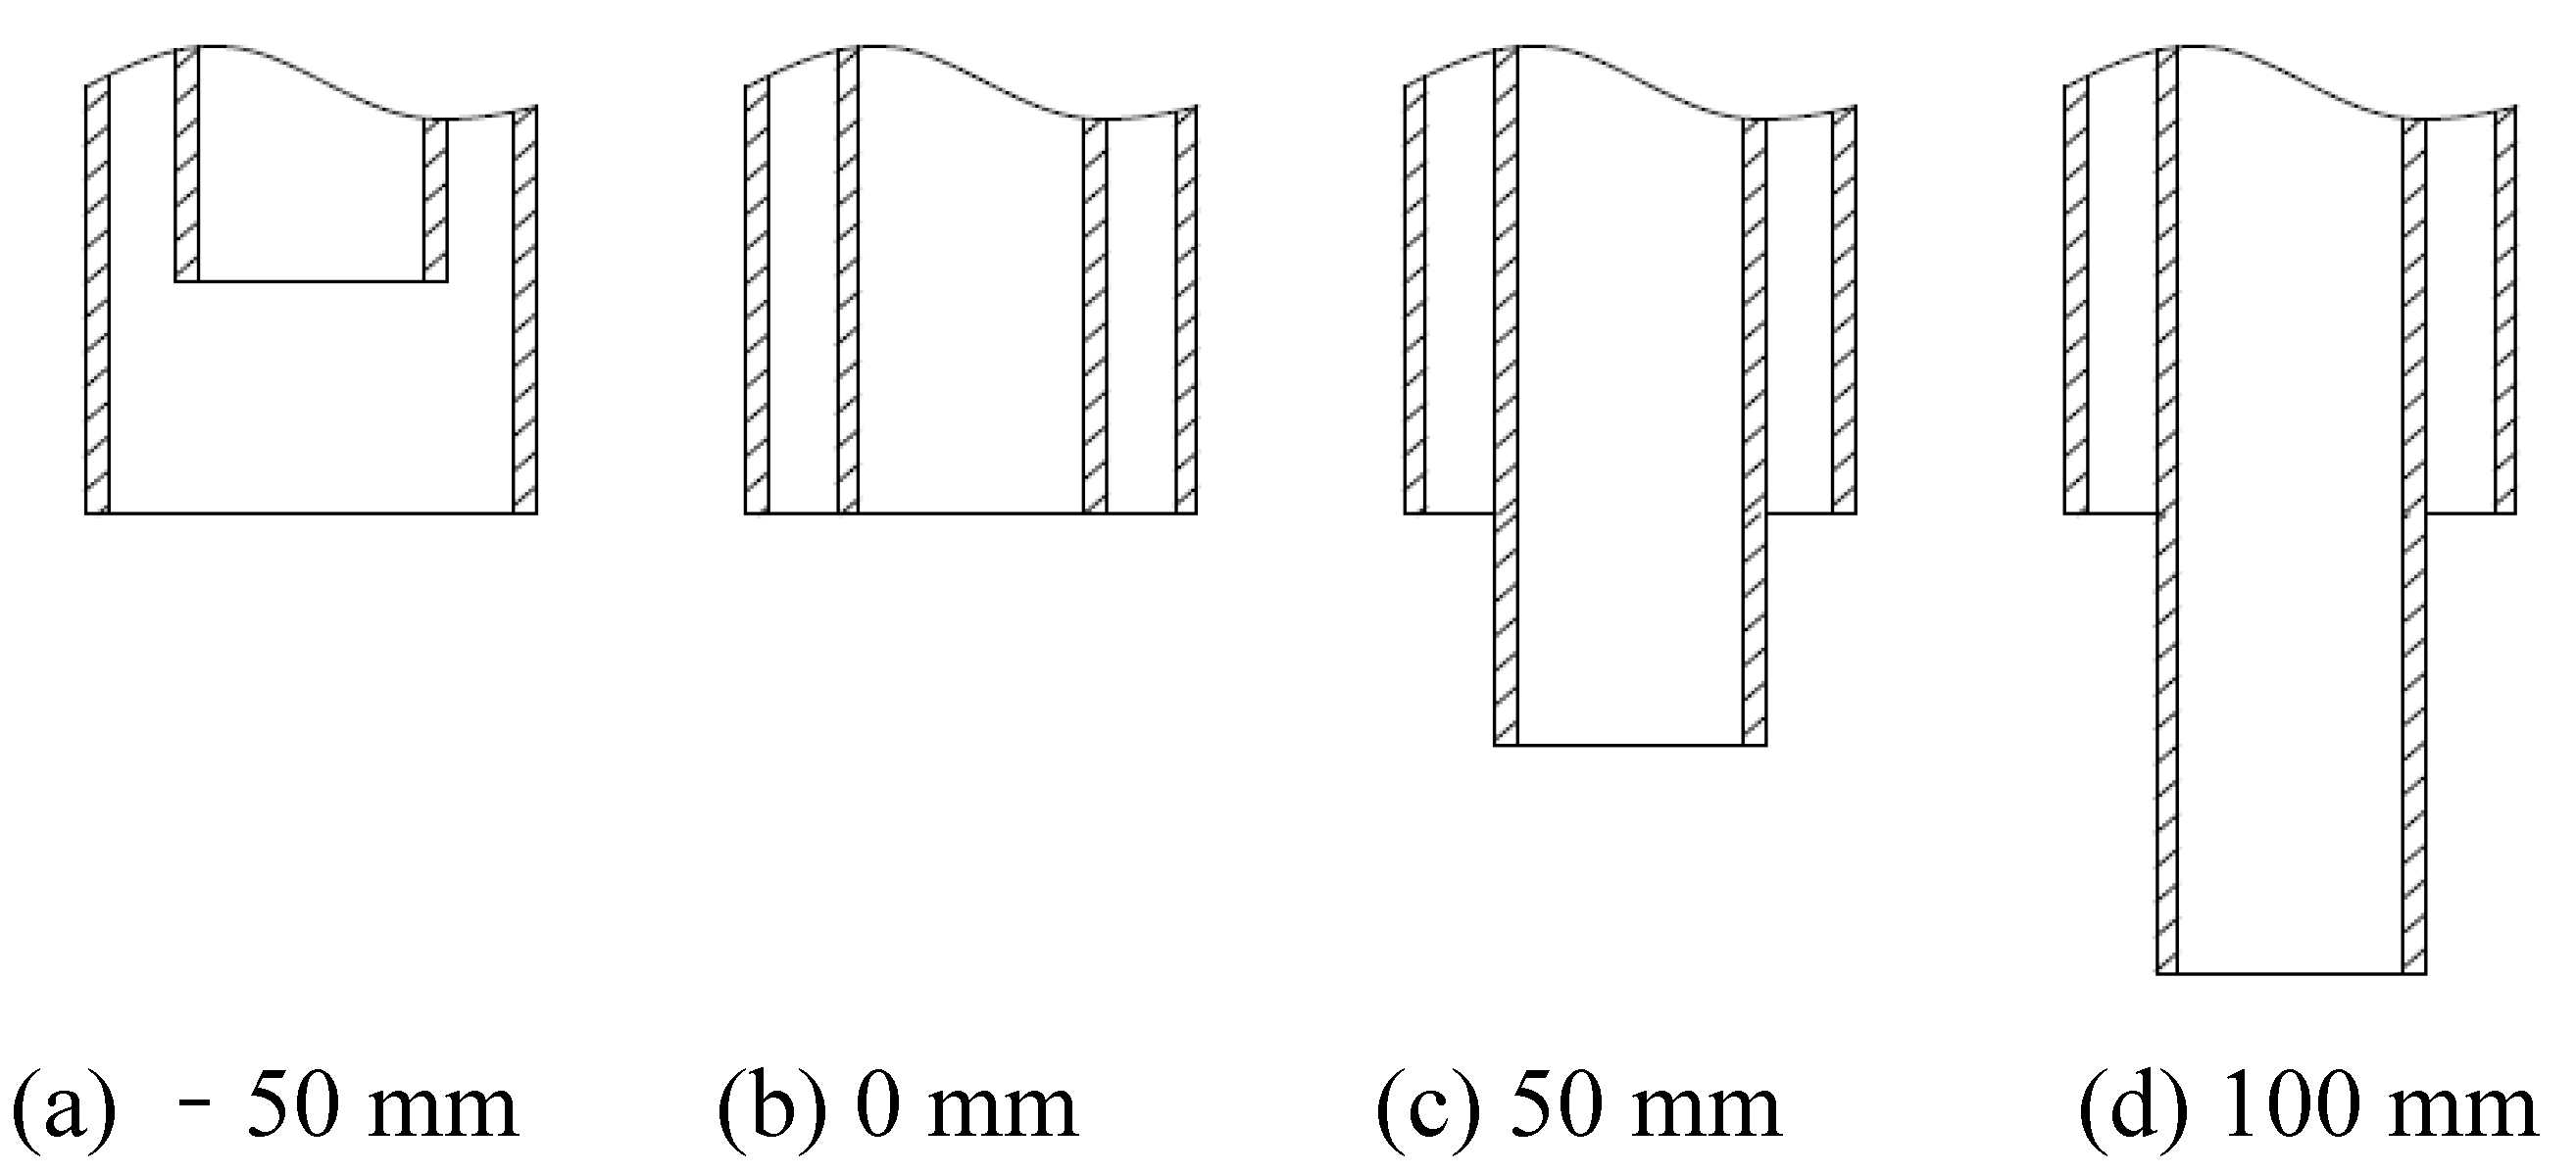
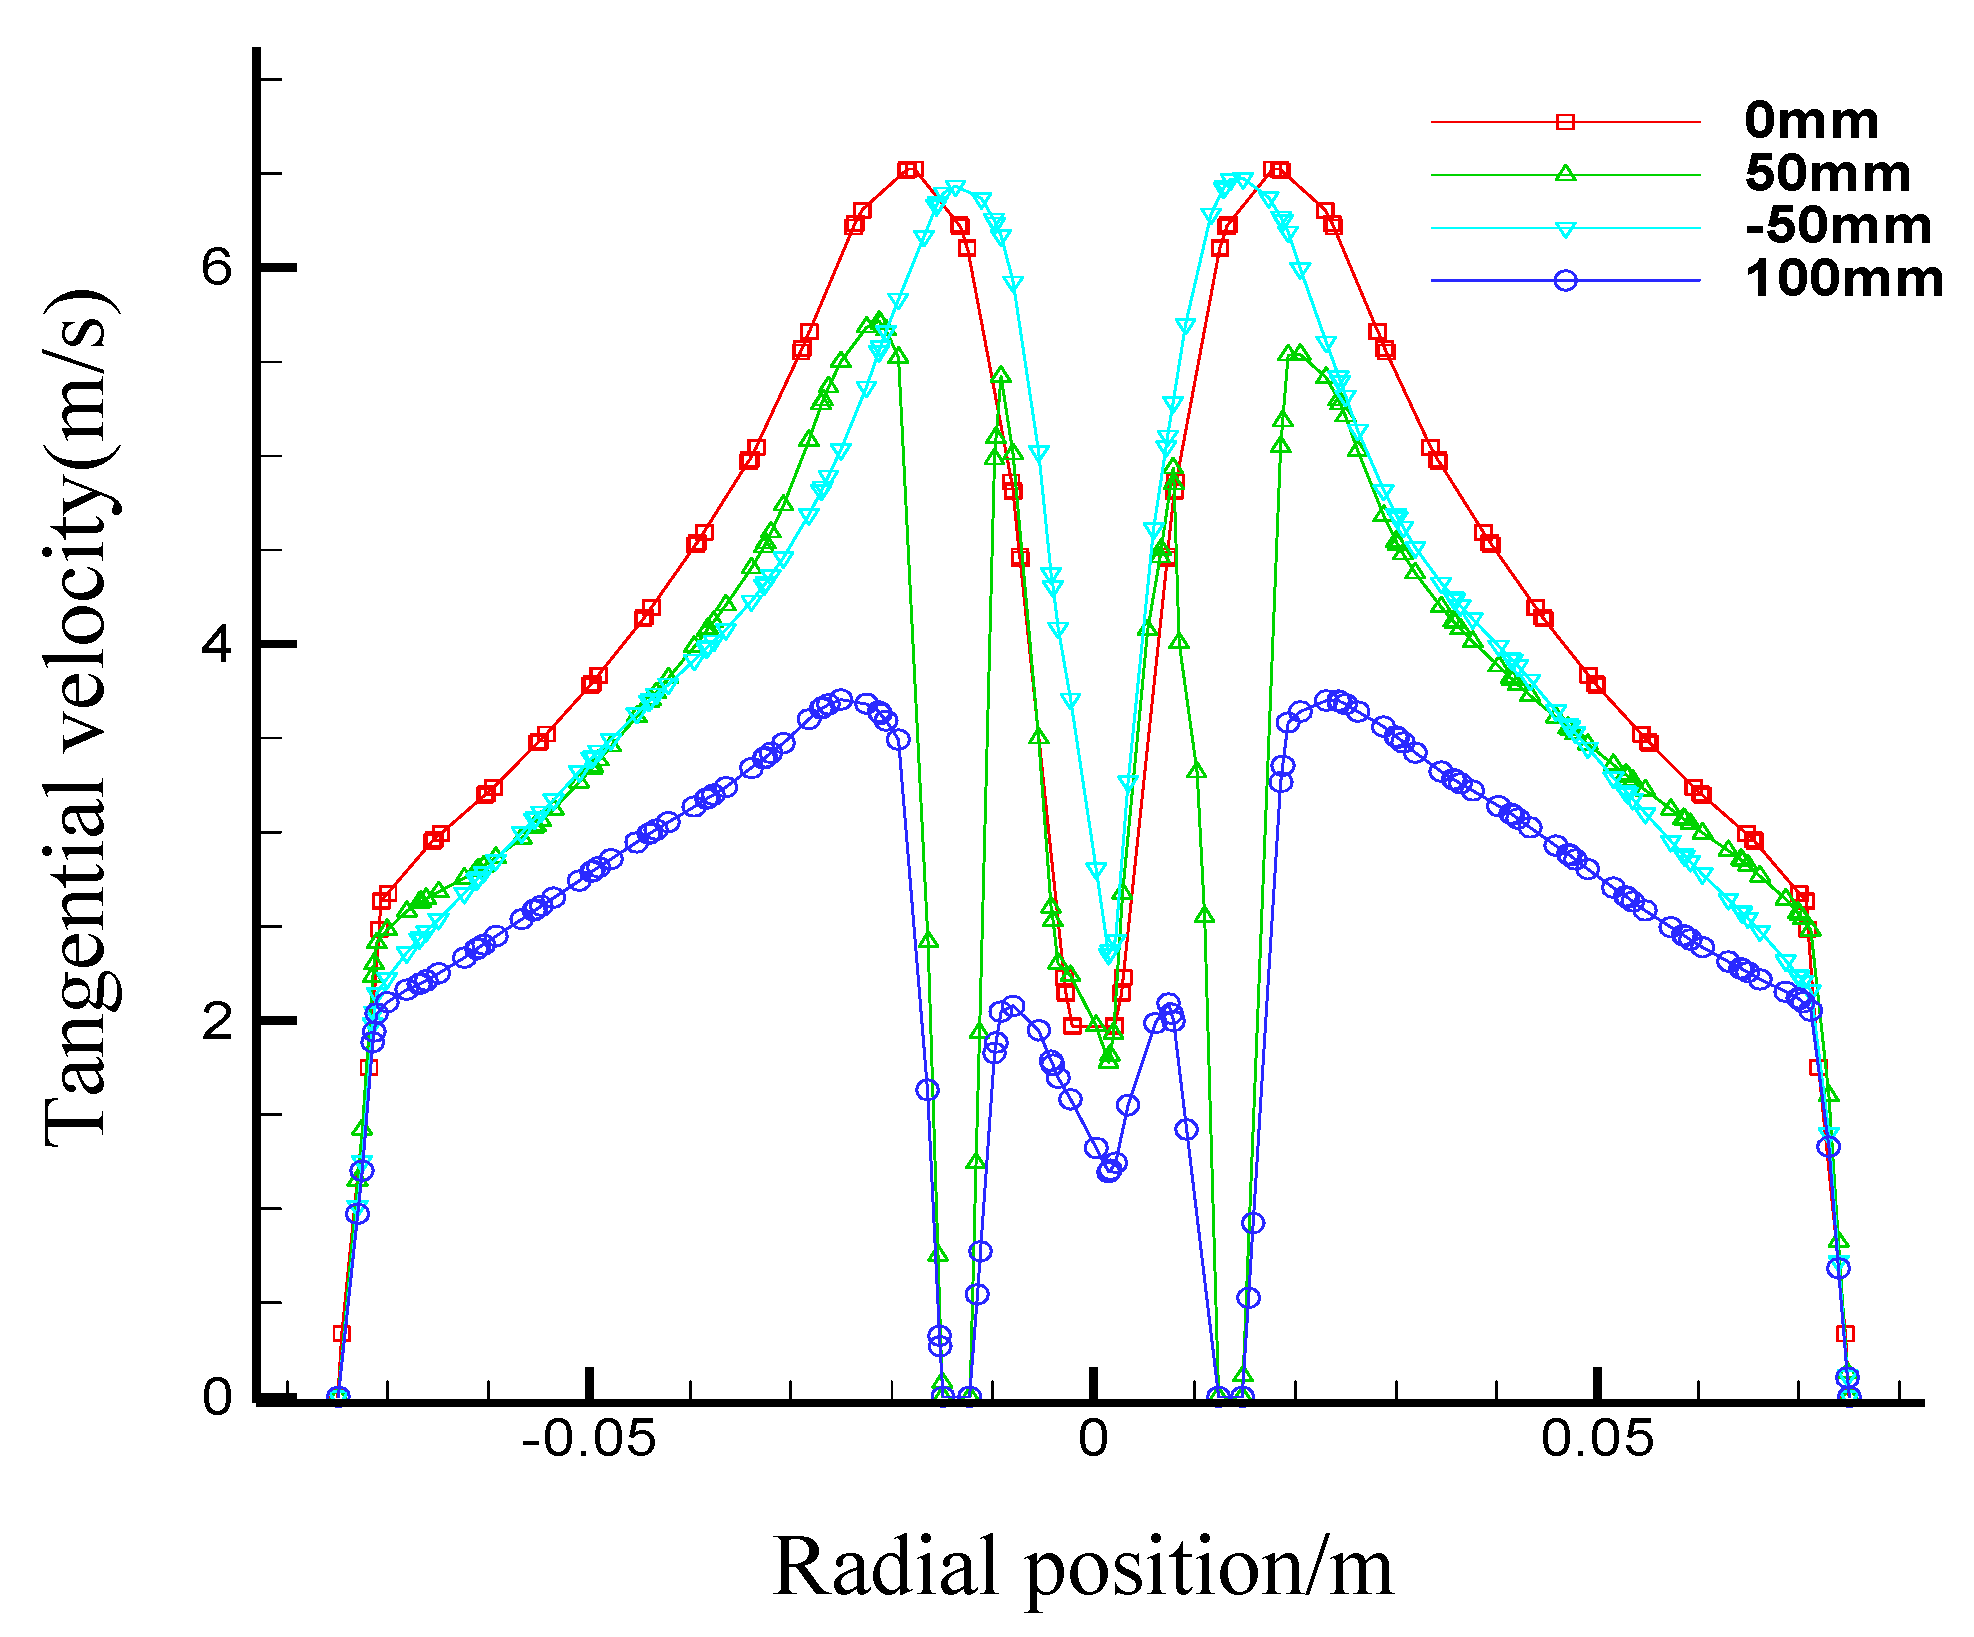
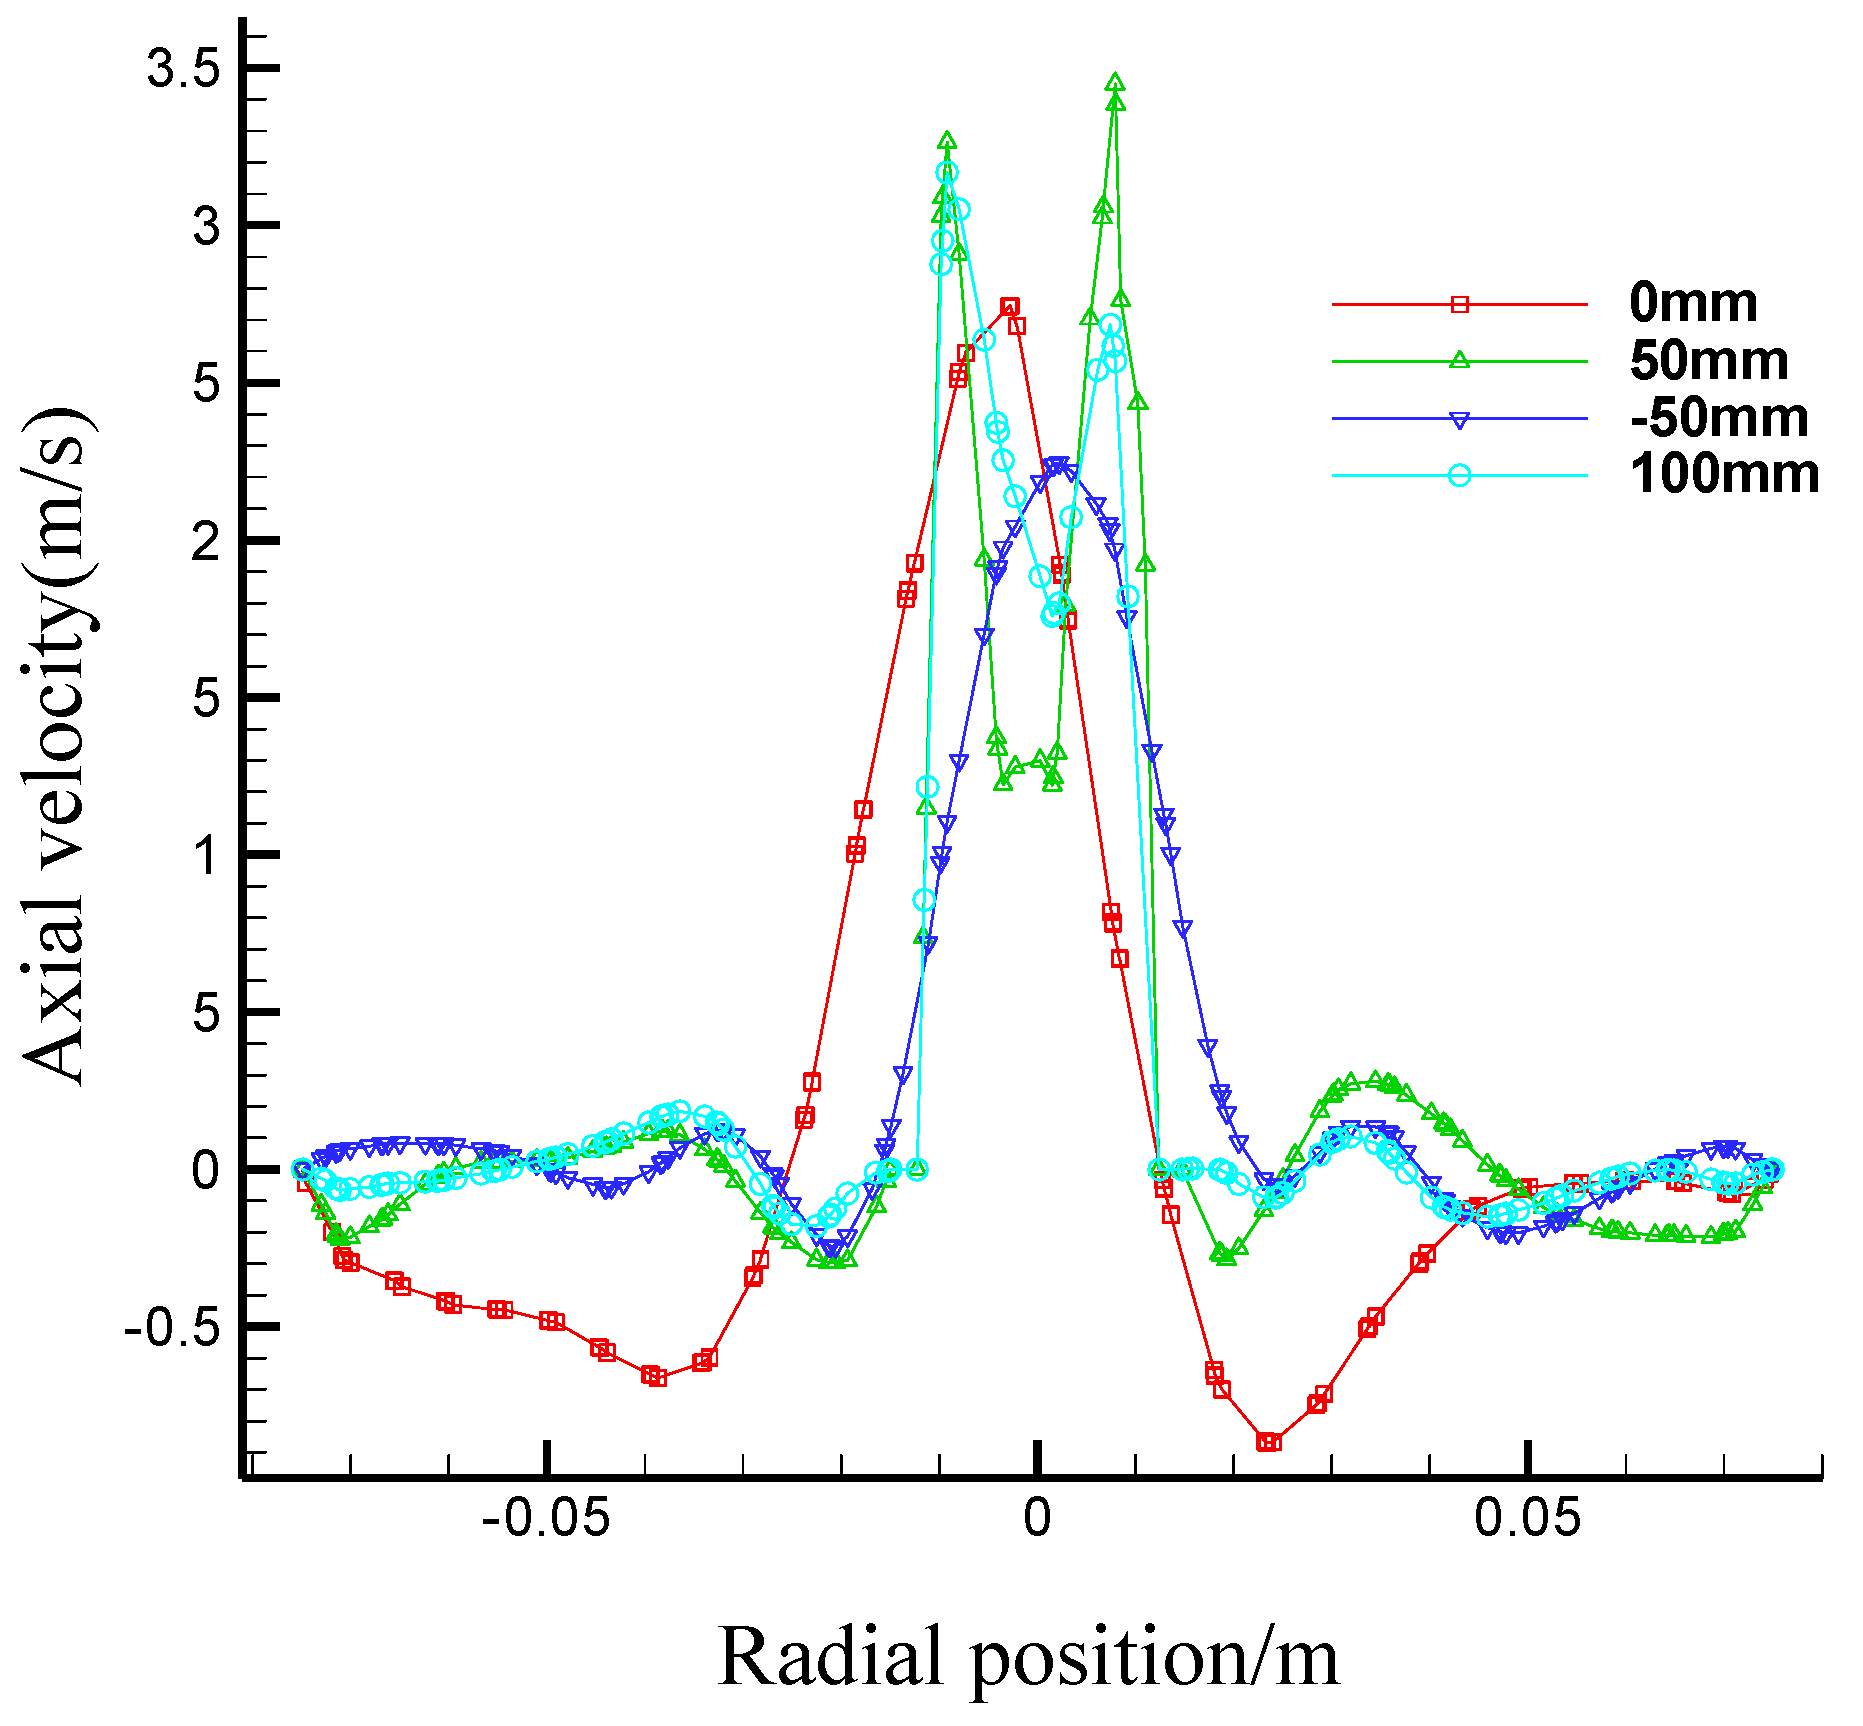
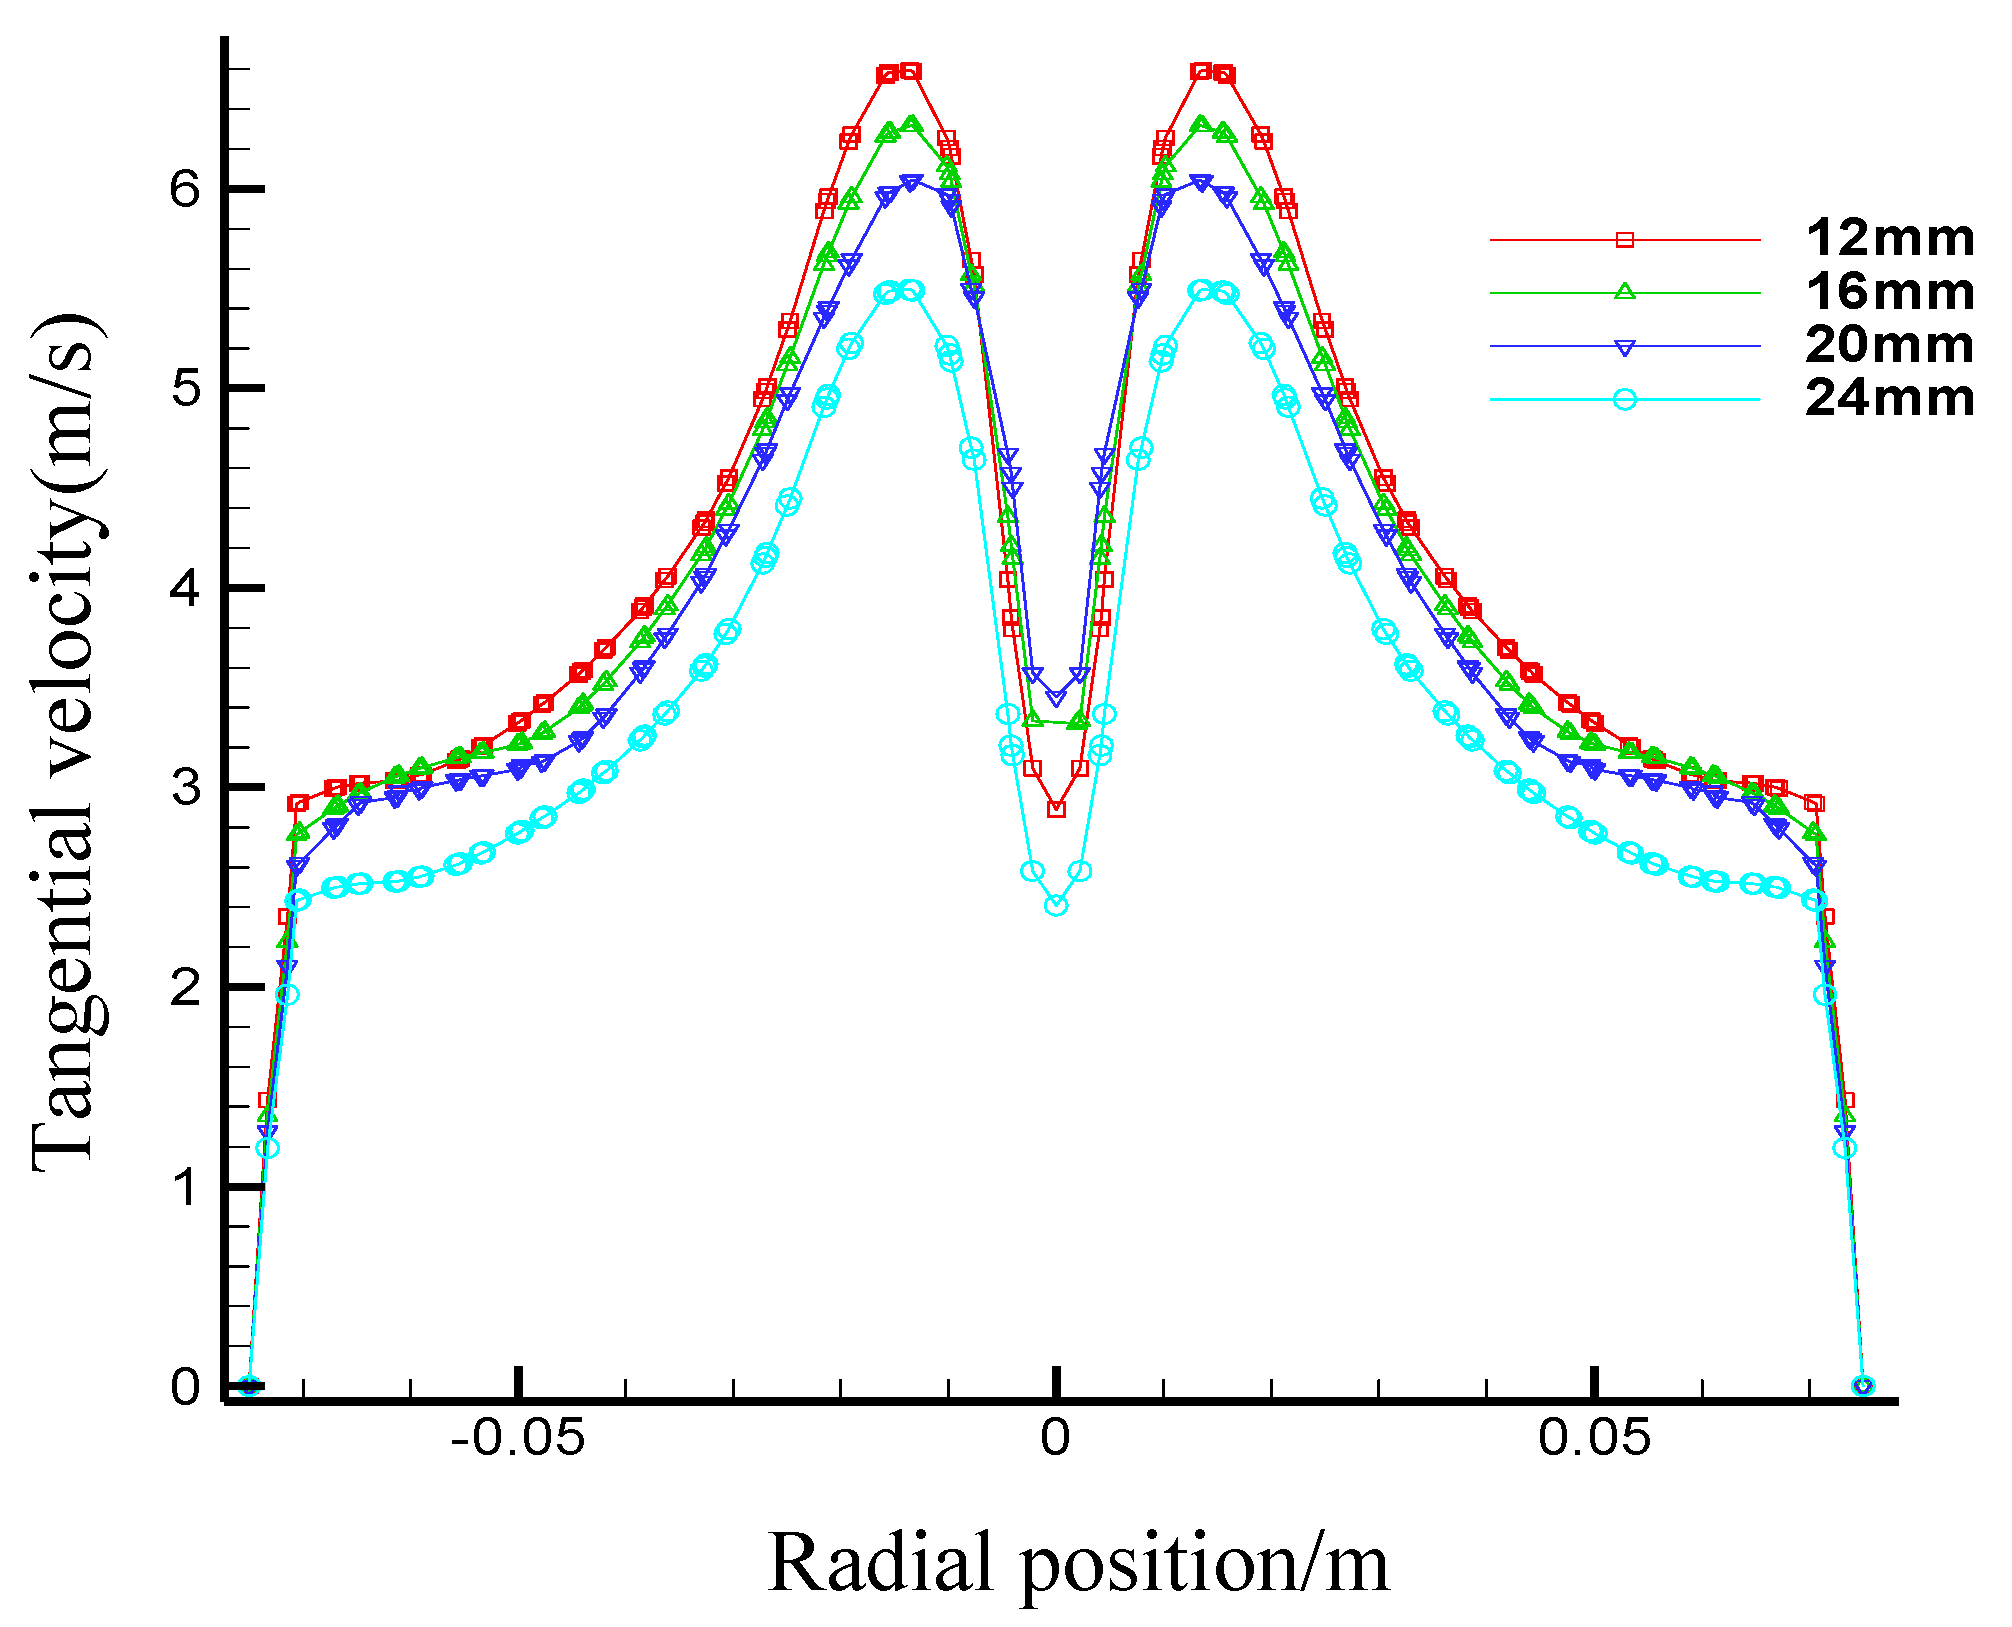
  • Effects of the first section internal overflow pipe insertion depth on flow fields in the first section hydrocyclone
The internal overflow pipe insertion depth refers to the relative location of internal overflow pipe and external overflow pipe. The effects of insertion depth will be discussed in three situations. In the first case the internal overflow pipe is shorter than the external one and the internal overflow pipe outlet is located inside the external overflow pipe (insertion depth of internal overflow pipe = −50 mm). In the second case the internal overflow pipe is aligned with the external overflow pipe and the insertion depth of the internal overflow pipe is 0. In the third case the internal overflow pipe is longer than the external overflow pipe and the insertion depth of the external overflow pipe is either 50 mm or 100 mm, as shown in Figure 13.
Figure 14 shows pressure distribution obtained by numerical simulation. Obviously, the effect of overflow pipe insertion depth is insignificant if the values of pressure at four different overflow pipe insertion depths are consistent.
Figure 15 shows the tangential velocity of flow fields in the hydrocyclone vs. the insertion depth of the internal overflow pipe. One can see that the tangential velocity is maximized at 0 insertion depth from the sidewall towards the trajectory surface of the maximum tangential velocity. As this zone is the main area of separation in the hydrocyclone, the separation efficiency is improved by an increase of tangential velocity. The tangential velocity decreases from −50 mm and 50 mm and is minimized at 100 mm insertion depth. Also, the insertion depth affects axial velocity of flow fields and the secondary vortex is observed.
Figure 16 shows the distribution of axial velocities of flow fields in the first section hydrocyclone. We found that the axial velocity of fluids greatly varied and the distributions of flow fields are asymmetric. The axial velocity passed the zero point several times (changes of axial speed direction), resulting in a secondary vortex which facilitates grading but also leads to issues like an energy consumption gain and flow field instability.
  • Effects of the first section underflow outlet diameter on flow fields in the first section hydrocyclone
Figure 17 shows pressure of flow field in the first section hydrocyclone vs. the first section underflow outlet diameter (12 mm, 16 mm, 20 mm, and 24 mm) by numerical simulations. As one can see, pressure decreases from the sidewall towards the core part along the radial direction and it decreases with an increase of the first section underflow outlet diameter d.
Figure 18 shows the tangential velocity of flow fields vs. the underflow outlet diameter. The tangential velocity of flow fields increases from the sidewall towards the core part along the radial direction. The maximum tangential velocity is observed at the interface between the inner and the outer swirls and it decreases after that. The tangential velocity of flow fields decreases with an increase of the underflow outlet diameter.
  • Effects of the second section underflow outlet diameter on the first section hydrocyclone
Figure 19 shows pressure of flow field in the first section hydrocyclone obtained by numerical simulations vs. the second section underflow outlet diameter (6 mm, 8 mm, 10 mm, and 12 mm).
Figure 20 and Figure 21 show distributions of tangential and axial velocities, respectively. It is evident that the second section underflow outlet diameter insignificantly affects distributions of pressure, tangential and axial velocities of flow field in the first section hydrocyclone.
Figure 22 shows the radial velocity distribution curve in the first section hydrocyclone as a function of the second section underflow outlet diameter. In this case the radial velocity of the first section hydrocyclone increases along with the second section underflow outlet diameter increase. On one hand, radial velocity increase has a positive effect on grading efficiency; on the other hand, a radial velocity increase results in a rise in energy consumption.

4. Experimental Tests and Results

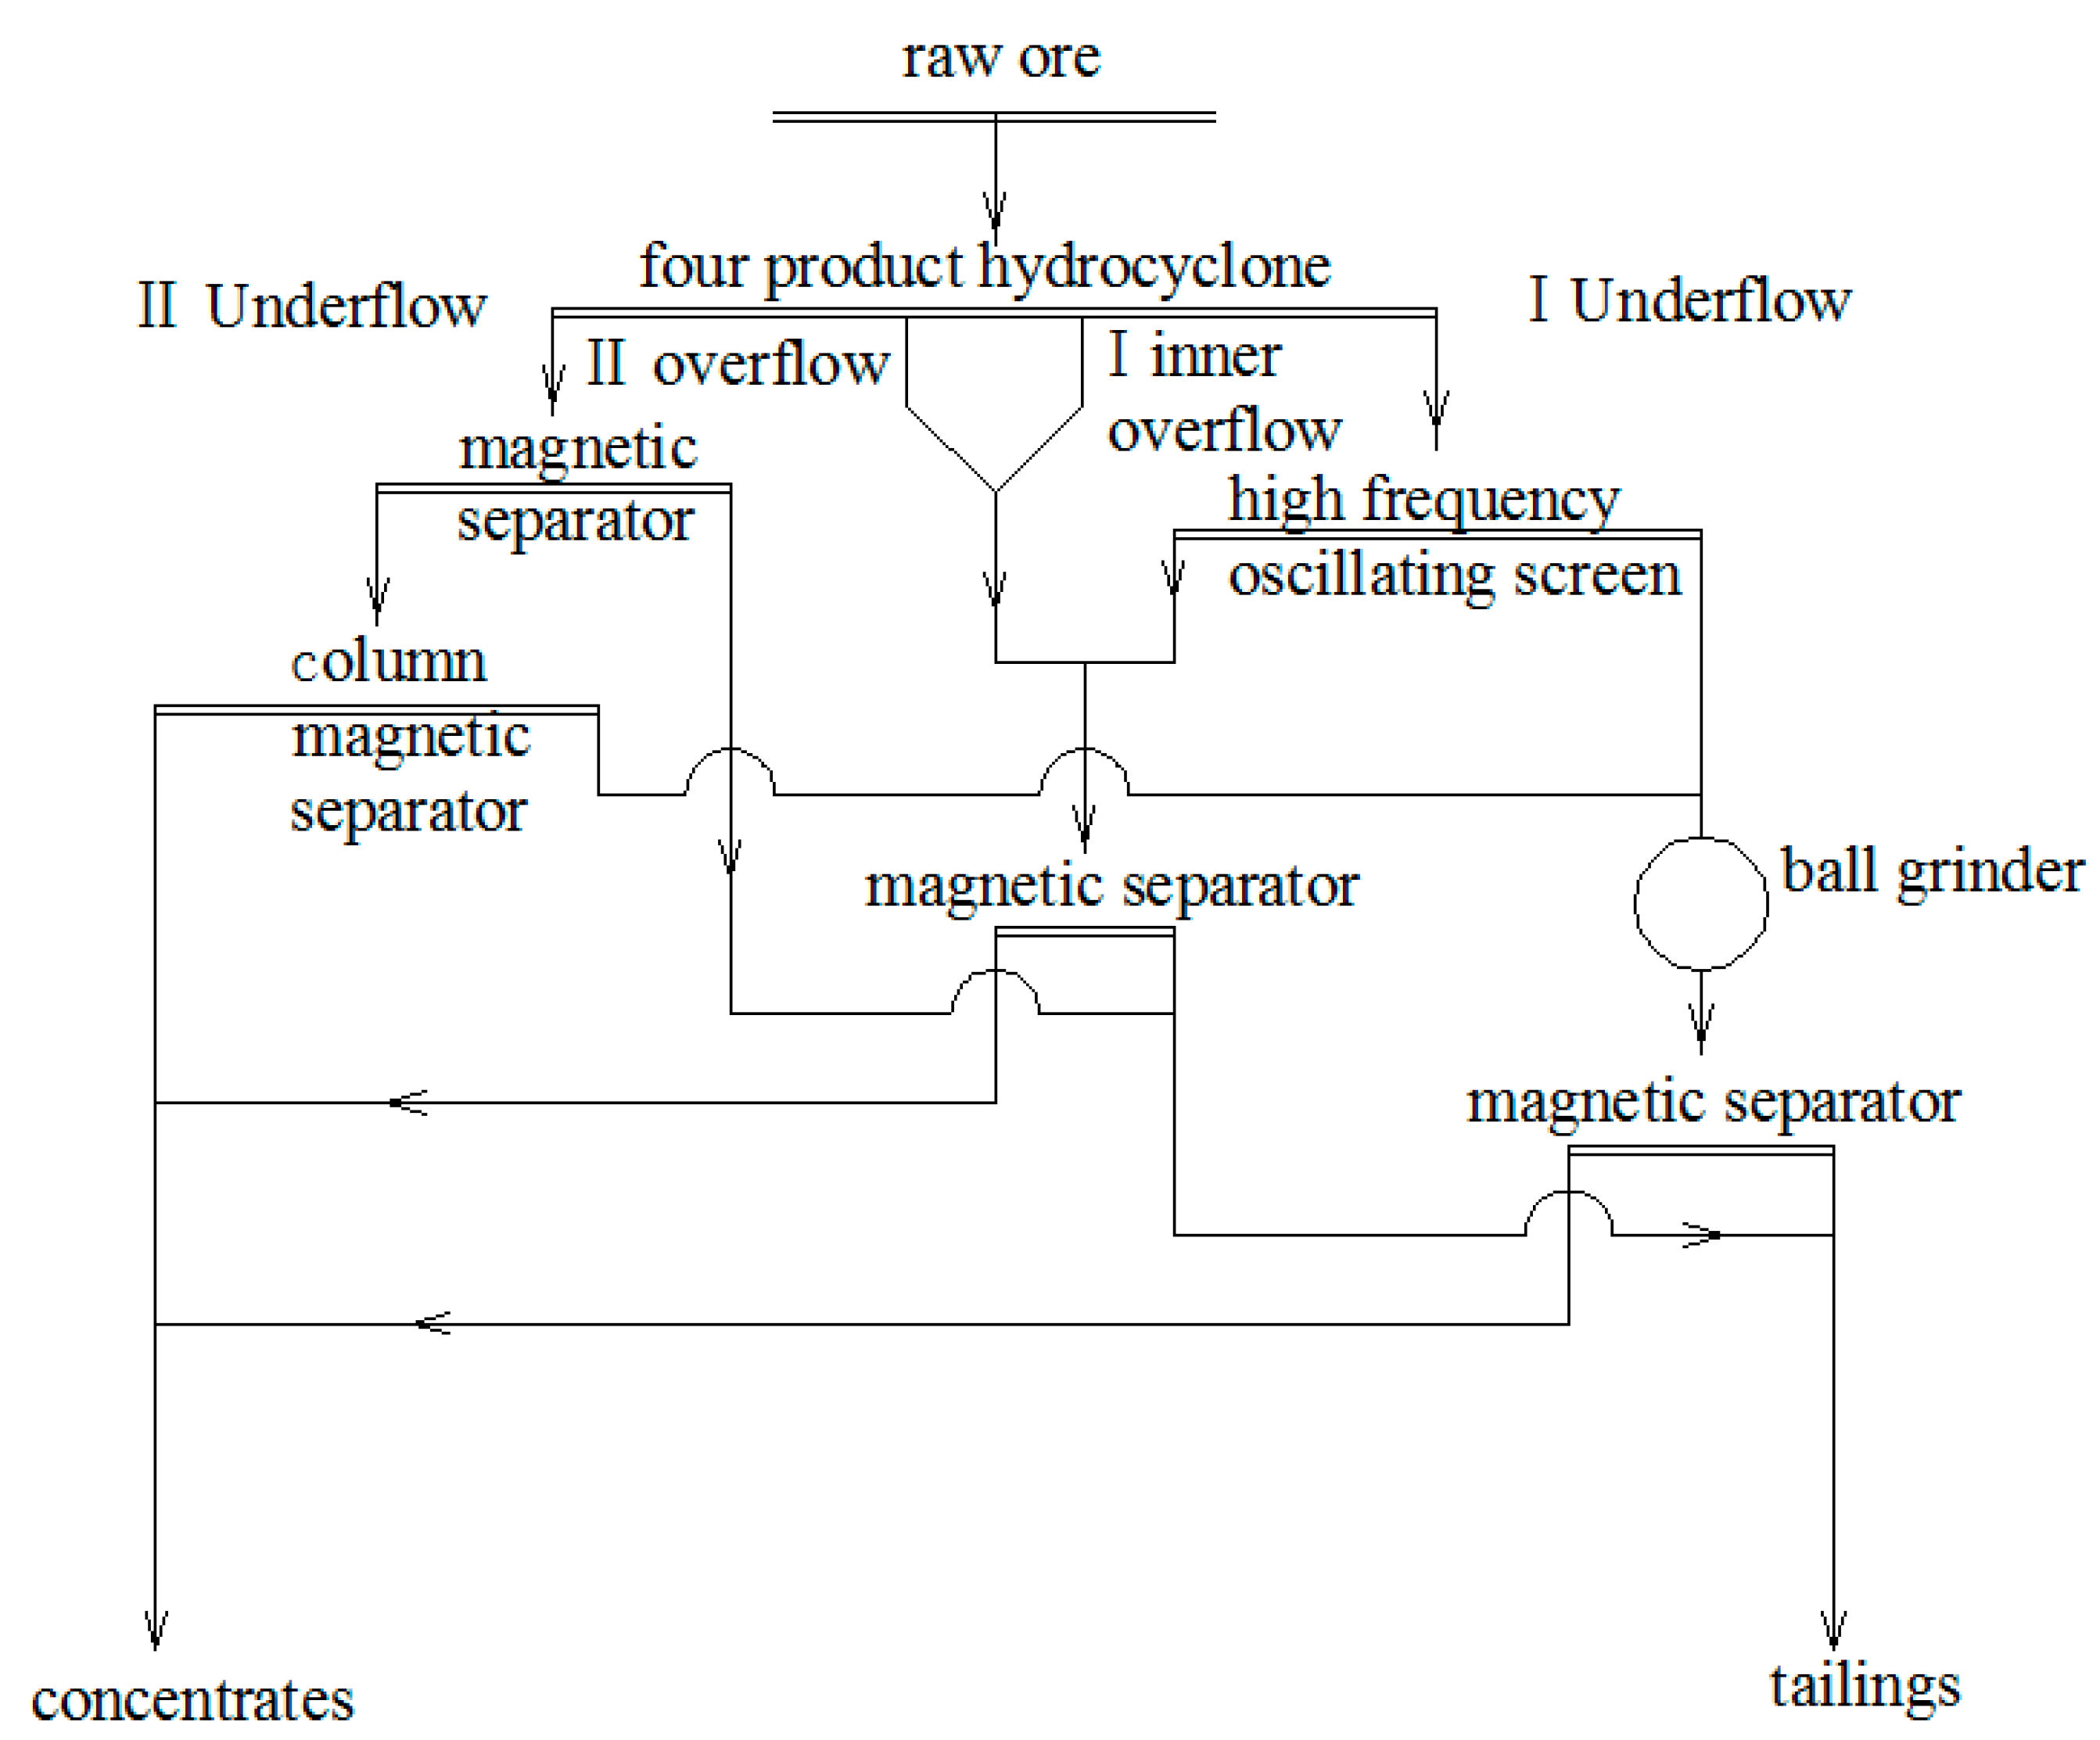
4.1. Procedure Design

For iron ore grading raw ore is grinded by the ball mill first. Then the ore is graded by conventional hydrocyclone: after monomer dissociation fine particles overflow goes to magnetic separator and iron concentrate is obtained; coarse particle underflow goes back to ball mill and hydrocyclone again for monomer dissociation. However, the conventional two product hydrocyclone provides fine particle overflow and coarse particle underflow in over-wide particle size ranges. Fine particles after monomer dissociation present in underflow, resulting in increased energy consumption and concentrate loss caused by over-grinding. We designed a technique for grading and recovery of iron ore fine particles using the proposed four product hydrocyclone, as shown in Figure 23.
After separation in the first stage hydrocyclone, the most coarse and dense ore particles joined in the underflow, while the finest particles joined in the internal overflow. The medium-size particles collect in the second stage hydrocyclone via the external overflow pipe and were further graded in the second stage overflow and the second stage underflow. Then, the first stage underflow of the hydrocyclone went to a high frequency oscillating screen. The mixture of under-sieve products from the internal overflow, and the second stage overflow went to a magnetic separator and concentrate was obtained.

4.2. Properties of Raw Ore

Table 2 summarizes properties of iron ore used in this study. As observed, particles under 38 μm reached 50.2% and the iron grade increases as the particle size decreases.

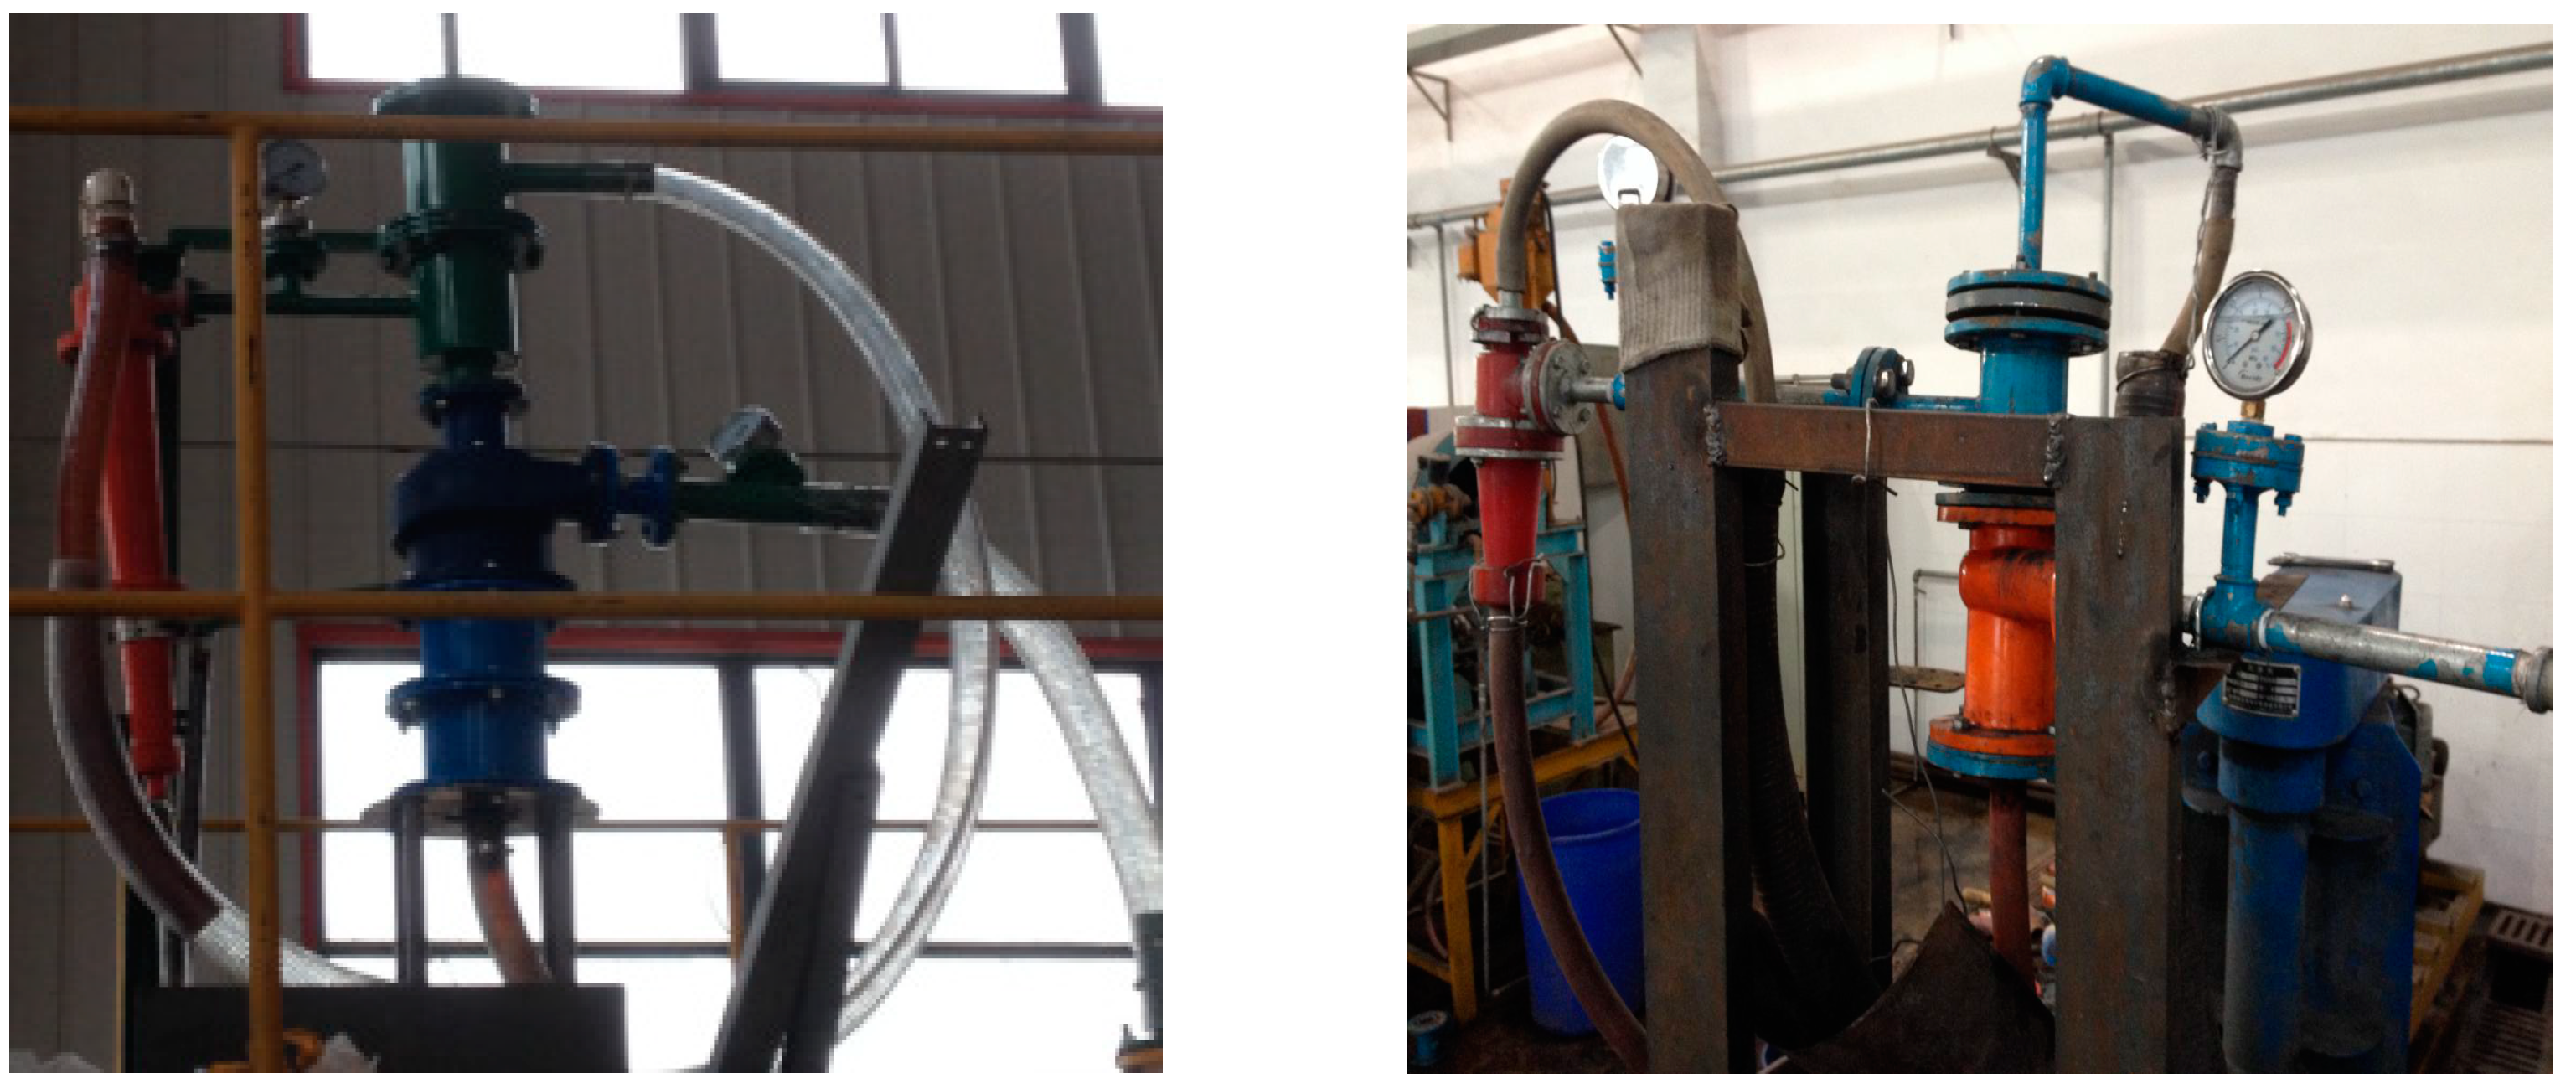
4.3. Hydrocyclone Design

According to the iron sample analysis, particles under 30 μm are essentially concentrate. Therefore, the diameters of the first stage hydrocyclone and the second stage hydrocyclone are 50 mm and 25 mm, respectively. The structure is shown in Figure 6 and the structural parameters and operation parameters are summarized in Table 3.

4.4. Result Analysis

The results of iron grading (Figure 24 shows the testing site of four product hydrocyclone) obtained by the procedure mentioned above are summarized in Table 4. The iron grade of concentrate obtained by the first section underflow is 66.24%. While combining the first stage internal overflow and the second stage overflow, the iron grade of concentrate is 62.53%. The iron grade of concentrate obtained from the second stage underflow is 61.14%. The iron grade of mixed concentrate was 65.08% (meeting the requirement of 65% for concentrate grade) and the concentrate recovery is 86.14%.

5. Conclusions

To avoid the over-wide particle size range and a poor separation accuracy that does not meet requirements of the subsequent operations, a two-stage series, four product hydrocyclone is proposed. The first stage hydrocyclone is designed to be a coaxial double overflow pipe: fine particles were obtained from the internal overflow and coarse particles were separated from the external overflow via the second section hydrocyclone. In this way, issues like over-wide particle size range and poor separation accuracy are avoided.
In experimental tests the proposed hydrocyclone was applied in iron recovery technology. Together with magnetic separator, oscillating screen, and ball mill, the proposed hydrocyclone can relieve the low iron concentrate recovery issue.

Author Contributions

Conceptualization, Y.Z. and P.L.; Methodology, Y.Z.; Software, Y.Z.; Validation, P.L. and L.J.; Formal Analysis, Y.Z.; Investigation, Y.Z. and L.J.; Resources, Y.Z.; Data Curation, X.Y.; Writing-Original Draft Preparation, Y.Z.; Writing-Review & Editing, Y.Z., P.L. and X.Y.

Funding

This research was funded by National Key R&D Program of China (2018YFC0604702), Natural Science Foundation of Shandong province (ZR2016EEM37) and key research and development project of Shangdong province(2017GSF216004).

Conflicts of Interest

The authors declare no conflict of interest.

References

  1. Vakamalla, T.R.; Kumbhar, K.S.; Ravi Gujjula, N.M. Computational and experimental study of the effect of inclination on hydrocyclone performance. Sep. Purif. Technol. 2014, 138, 104–117. [Google Scholar] [CrossRef]
  2. Svarovsky, L. Hydrocyclones; Technomic Publishing Co.: London, UK, 1984. [Google Scholar]
  3. Banerjee, C.; Chaudhury, K.; Majumder, A.K.; Chakraborty, S. Swirling flow hydrodynamics in hydrocyclone. Ind. Eng. Chem. Res. 2015, 54, 522–528. [Google Scholar] [CrossRef]
  4. Ni, L.; Tian, J.; Song, T.; Jong, Y.; Zhao, J. Optimizing Geometric Parameters in Hydrocyclones for Enhanced Separations: A Review and Perspective. Sep. Purif. Technol. 2018, 48, 30–51. [Google Scholar] [CrossRef]
  5. Vega, D.; Brito-Parada, P.R.; Cilliers, J.J. Optimising small hydrocyclone design using 3D printing and CFD simulations. Chem. Eng. J. 2018, 350, 653–659. [Google Scholar] [CrossRef]
  6. Hwang, K.; Chou, S. Designing vortex finder structure for improving the particle separation efficiency of a hydrocyclone. Sep. Purif. Technol. 2017, 172, 76–84. [Google Scholar] [CrossRef]
  7. Jiang, L.; Liu, P.; Yang, X.; Zhang, Y. Short-Circuit Flow in Hydrocyclones with Arc-Shaped Vortex Finders. Chem. Eng. Technol. 2018, 41, 1783–1792. [Google Scholar] [CrossRef]
  8. Yang, Y.; Wen, C. CFD modeling of particle behavior in supersonic flows with strong swirls for gas separation. Sep. Purif. Technol. 2017, 174, 22–28. [Google Scholar] [CrossRef]
  9. Hsiao, T.; Huang, S.; Hsu, C.; Chen, C.; Chang, P. Effects of the geometric configuration on cyclone performance. J. Aerosol Sci. 2015, 86, 1–12. [Google Scholar] [CrossRef]
  10. Krokhina, A.V.; Lvov, V.A.; Pavlikhin, G.P. A Probabilistic-Statistical Model of the Particle Classification Process in Small Hydrocyclone Classifiers. Chem. Eng. Technol. 2017, 40, 967–972. [Google Scholar] [CrossRef]
  11. Liu, P.; Chu, L.; Wang, J.; Yu, Y. Enhancement of Hydrocyclone Classification Efficiency for Fine Particles by Introducing a Volute Chamber with a Pre-Sedimentation. Chem. Eng. Technol. 2008, 31, 474–478. [Google Scholar] [CrossRef]
  12. Gonçalves, S.M.; Barrozo, M.A.S.; Vieira, L.G.M. Effects of solids concentration and underflow diameter on the performance of a newly designed hydrocyclone. Chem. Eng. Technol. 2017, 40. [Google Scholar] [CrossRef]
  13. Surmen, A.; Avci, A.; Karamangil, M.I. Prediction of the maximum-efficiency cyclone length for a cyclone with a tangential entry. Powder Technol. 2011, 207, 1–8. [Google Scholar] [CrossRef]
  14. Ahmed, M.M.; Ibrahim, G.A.; Farghaly, M.G. Performance of a three-product hydrocyclone. Int. J. Miner. Process. 2009, 91, 34–40. [Google Scholar] [CrossRef]
  15. Obeng, D.P.; Morrell, S. The JK three-product cyclone-performance and potential applications. Int. J. Miner. Process. 2003, 69, 129–142. [Google Scholar] [CrossRef]
  16. Obeng, D.P.; Morrell, S.; Napier-Munn, T.J. Application of central composite rotatable design to modeling the effect of some operating variables on the performance of the three-product cyclone. Int. J. Miner. Process. 2005, 76, 181–192. [Google Scholar] [CrossRef]
  17. Mainza, A.; Narasimha, M.; Powell, M.S.; Holtham, P.N.; Brennan, M. Study of flow behavior in a three-product cyclone using computational fluid dynamics. Miner. Eng. 2006, 19, 1048–1058. [Google Scholar] [CrossRef]
  18. Mainza, A.; Powell, M.S.; Knopjes, B. Differential classification of dense material in a three-product cyclone. Miner. Eng. 2004, 17, 573–579. [Google Scholar] [CrossRef]
  19. Bhasker, C. Flow simulation in industrial cyclone separator. Adv. Eng. Soft. 2010, 41, 220–228. [Google Scholar] [CrossRef]
  20. Chen, J.; Chu, K.; Zou, R.; Yu, A.B.; Vince, A.; Barnett, G.D.; Barnett, P.J. Systematic study of the effect of particle density distribution on the flow and performance of a dense medium cyclone. Powder Technol. 2017, 314, 510–523. [Google Scholar] [CrossRef]
  21. Vakamalla, T.R.; Korprolu, V.B.R.; Arugonda, R.; Mangadoddy, A. Development of novel hydrocyclone designs for improved fines classification using multiphase CFD model. Sep. Purif. Technol. 2017, 175, 481–497. [Google Scholar] [CrossRef]
  22. Slack, M.D.; Prasad, R.O.; Bakker, A.; Boysan, F. Advances in cyclone modeling using unstructured grids. Chem. Eng. Res. 2000, 78, 1098–1104. [Google Scholar] [CrossRef]
  23. Wang, S.; Luo, K.; Hu, C.; Fan, J. CFD-DEM study of the effect of cyclone arrangements on the gas-solid flow dynamics in the full-loop circulating fluidized bed. Chem. Eng. Sci. 2017, 172, 199–215. [Google Scholar] [CrossRef]
  24. Siadaty, M.; Kheradmand, S.; Ghadiri, F. Improvement of the cyclone separation efficiency with a magnetic field. J. Aerosol Sci. 2017, 114, 219–232. [Google Scholar] [CrossRef]
  25. Parvaz, F.; Hosseini, S.H.; Ahmadi, G.; Elsayed, K. Impacts of the vortex finder eccentricity on the flow pattern and performance of a gas cyclone. Sep. Purif. Technol. 2017, 187, 1–13. [Google Scholar] [CrossRef]
  26. Cui, B.; Zhang, C.; Wei, D.; Lu, S.; Feng, Y. Effects of feed size distribution on separation performance of hydrocyclones with differdent vortex finder diameters. Powder Technol. 2017, 322, 114–123. [Google Scholar] [CrossRef]
  27. Patra, G.; Velpuri, B.; Chakraborty, S.; Meikap, B.C. Performance evaluation of a hydrocyclone with a spiral rib for separation of particles. Adv. Powder Technol. 2017, 28, 3222–3232. [Google Scholar] [CrossRef]
  28. Zhang, Y.; Cai, P.; Jiang, F.; Dong, K.; Jiang, Y.; Wang, B. Understanding the separation of particles in a hydrocyclone by force analysis. Powder Technol. 2017, 322, 471–489. [Google Scholar] [CrossRef]
  29. Ji, L.; Kuang, S.; Qi, Z.; Wang, Y.; Chen, J.; Yu, A. Computational analysis and optimization of hydrocyclone size to mitigate adverse effect of particle density. Sep. Purif. Technol. 2017, 174, 251–263. [Google Scholar] [CrossRef]
Figure 1. Traditional cyclone with two products.
Minerals 09 00023 g001
Figure 2. Classification diagram of the three product cycolone.
Minerals 09 00023 g002
Figure 3. Diagram of the hydrocyclone with screen.
Minerals 09 00023 g003
Figure 4. Three-product cyclone with double spigot.
Minerals 09 00023 g004
Figure 5. Four product cyclone with double vortex finders.
Minerals 09 00023 g005
Figure 6. Structural representation of four product cyclone.
Minerals 09 00023 g006
Figure 7. The meshing of four-products hydrocyclone.
Minerals 09 00023 g007
Figure 8. The mesh quality of cyclone.
Minerals 09 00023 g008
Figure 9. Pressure distribution of different cone angle hydrocyclone.
Minerals 09 00023 g009
Figure 10. Tangential velocity distribution of different cone angle cyclone.
Minerals 09 00023 g010
Figure 11. Pressure distribution of hydrocyclone with different inner vortex finder.
Minerals 09 00023 g011
Figure 12. Velocity distribution of the hydrocyclone with a different inner vortex finder.
Minerals 09 00023 g012
Figure 13. Insertion depth of inner vortex.
Minerals 09 00023 g013
Figure 14. Pressure distribution inside cyclone with different insertion depth of inner vortex finder.
Minerals 09 00023 g014
Figure 15. Tangential velocity inside cyclone with different insertion depth of inner vortex finder.
Minerals 09 00023 g015
Figure 16. Axial velocity inside cyclone with different insertion depth of inner vortex finder.
Minerals 09 00023 g016
Figure 17. Pressure distribution inside cyclone with different I underflow pipe.
Minerals 09 00023 g017
Figure 18. Tangential velocity inside cyclone with different I underflow pipe.
Minerals 09 00023 g018
Figure 19. Pressure distribution inside cyclone with different II underflow pipe.
Minerals 09 00023 g019
Figure 20. Tangential velocity inside cyclone with different II underflow pipe.
Minerals 09 00023 g020
Figure 21. Axial velocity inside cyclone with different II underflow pipe.
Minerals 09 00023 g021
Figure 22. Radial velocity inside cyclone with different II underflow pipe.
Minerals 09 00023 g022
Figure 23. The process flow diagram of four-product cyclone.
Minerals 09 00023 g023
Figure 24. Four product hydrocyclone testing site.
Minerals 09 00023 g024
Table 1. Turbulence intensities and hydraulic diameters.
ParametersI UnderflowII UnderflowInner OverflowII Overflow
Turbulence intensities/%4.34.74.54.3
hydraulic diameter/mm2082520
Table 2. The properties of ore.
Particle Size/mmYield/%Cumulative Yield/%Iron Grade/%Iron Content/%Distribution Rate/%Cumulative Distribution Rate/%
+0.115.1010026.183.957.42100
−0.1 + 0.07610.7284.9037.934.077.6592.58
−0.076 + 0.05510.7074.1850.185.3710.0984.93
−0.055 + 0.04313.2863.4858.517.7714.6074.84
−0.043 + 0.03813.0650.260.737.9314.960.24
−0.038 + 0.0306.5337.1461.073.997.5045.34
−0.03030.6130.6165.820.1437.8437.84
total100.00 52.9653.22100.00
Table 3. The optimal parameter based on overflow fineness.
Mass Concentration/%Pressure/MPaAngle of Cone/°Diameter of I Underflow Pipe/mmDiameter of II Underflow Pipe/mmDiameter of Outer Overflow Pipe/mmDiameter of Inner Overflow Pipe/mm
300.1118084159
Table 4. Industries operating results.
ResultsIron Grade/%Iron Recovery Rate/%
I underflowConcentrates after magnetic separation66.2449.22
Tailings after magnetic separation22.46
merged overflowConcentrates after magnetic separation62.5312.86
Tailings after magnetic separation28.71
II underflowConcentrates after magnetic separation61.1424.06
Tailings after magnetic separation24.42
composite resultConcentrates after magnetic separation65.0886.14

