Article

Interfacial Precipitation of Phosphate on Hematite and Goethite

1
College of Resources and Environment, Huazhong Agricultural University, Wuhan 430070, China
2
Institut für Mineralogie, University of Münster, 48149 Münster, Germany
3
Department of Chemistry, Curtin University, Perth, WA 6845, Australia
4
GFZ German Research Centre for Geosciences, 14473 Potsdam, Germany
5
The Institute for Geoscience Research (TIGeR), Curtin University, Perth, WA 6102, Australia
*
Authors to whom correspondence should be addressed.
Minerals 2018, 8(5), 207; https://doi.org/10.3390/min8050207
Submission received: 19 March 2018 / Revised: 30 April 2018 / Accepted: 9 May 2018 / Published: 10 May 2018
(This article belongs to the Special Issue Mineral Surface Reactions at the Nanoscale)

Abstract

:
Adsorption and subsequent precipitation of dissolved phosphates on iron oxides, such as hematite and goethite, is of considerable importance in predicting the bioavailability of phosphates. We used in situ atomic force microscopy (AFM) to image the kinetic processes of phosphate-bearing solutions interacting with hematite or goethite surfaces. The nucleation of nanoparticles (1.0–4.0 nm in height) of iron phosphate (Fe(III)-P) phases, possibly an amorphous phase at the initial stages, was observed during the dissolution of both hematite and goethite at the earliest crystallization stages. This was followed by a subsequent aggregation stage where larger particles and layered precipitates are formed under different pH values, ionic strengths, and organic additives. Kinetic analysis of the surface nucleation of Fe-P phases in 50 mM NH4H2PO4 at pH 4.5 showed the nucleation rate was greater on goethite than hematite. Enhanced goethite and hematite dissolution in the presence of 10 mM AlCl3 resulted in a rapid increase in Fe-P nucleation rates. A low concentration of citrate promoted the nucleation, whereas nucleation was inhibited at higher concentrations of citrate. By modeling using PHREEQC, calculated saturation indices (SI) showed that the three Fe(III)-P phases of cacoxenite, tinticite, and strengite may be supersaturated in the reacted solutions. Cacoxenite is predicted to be more thermodynamically favorable in all the phosphate solutions if equilibrium is reached with respect to hematite or goethite, although possibly only amorphous precipitates were observed at the earliest stages. These direct observations at the nanoscale may improve our understanding of phosphate immobilization in iron oxide-rich acid soils.

Graphical Abstract

1. Introduction

Phosphorus (P) is a limiting nutrient for plant growth [1,2] due to both its low P bioavailability in soils and the increasingly limited mineable resources of P-containing rocks [3]. The mineral interface-mediated P adsorption and precipitation are major mechanisms of P immobilization in calcite-rich alkaline soils [4] or (hydr)oxides of iron (Fe) and aluminium (Al)-rich acidic soils [5], and this leads to the lowering of its bioavailability following the application of P fertilizers. Therefore, a knowledge of the transformation and mobility of phosphate at the mineral interfaces at the nanoscale may improve our understanding of the fate of dissolved phosphate species in soils.
Despite the widely observed bulk P adsorption, especially from modeling of both non-specific and specific adsorption [6,7,8,9,10,11], and surface precipitation [12,13,14] at iron oxide mineral surfaces, the nanoscale surface reaction kinetics of solutions containing phosphate with iron oxides remain limited. Therefore, the objective of this study was to observe the kinetics of hematite and goethite dissolution and the coupled precipitation of new phases in the presence of aqueous solutions of phosphate. To achieve these goals, we used in situ atomic force microscopy (AFM) to image the real-time kinetics of hematite and goethite dissolution and the subsequent formation of new Fe-P phases. In the present study, we chose hematite (Fe2O3) and goethite (α-FeOOH) because they have been recognized as two of the most abundant of the naturally occurring iron oxides in soils [15,16]. We directly compared the surface nucleation rates of Fe-P phases on hematite and goethite under the same solution conditions and calculated solution speciation and thermodynamics of precipitating phases using PHREEQC modeling. These in situ observations may improve the mechanistic understanding of phosphate immobilization at the mineral interface in soils.

2. Materials and Methods

In situ dissolution experiments were performed using a Bruker Nanoscope IIIa AFM equipped with a fluid cell in contact mode. Natural Fe-bearing minerals, crystalline hematite, and goethite were chosen (Jackson Mine, MI, USA) as the most common Fe-bearing mineral sources in soils. Elongated small tabular crystals of goethite were cleaved in order to expose a fresh cleavage (010) surface immediately prior to their mounting in the fluid cell and contact with reaction solutions. A massive hematite crystal was parted along (001) to present a flat surface suitable for imaging. Ammonium dihydrogen phosphate solutions (50 mM NH4H2PO4 at pH 2.0 or 4.5, adjusted using 0.01 M HCl), in the absence and presence of 10 mM AlCl3 as background electrolytes, or 1–50 μM citrate as an organic additive, were passed through the fluid cell at a rate of 2 ml per 1.5 min. AFM images were collected in contact mode using Si3N4 tips (Bruker, tip model NP-S10, spring constants of 0.12 N/m and 0.58 N/m) and were recorded sequentially using a scan rate of 4 Hz and a resolution of 256 pixels (apart from occasional images when this was increased to 512 for some images chosen for reproduction). This imaging rate allows an image to be acquired approximately every 1 min 20 s and was used for all AFM experiments reported here. The scan angle is chosen to give the best trace and retrace output fits indicating a good imaging quality. This varies with each experiment and is dependent on the characteristic mineral surface topography. Images were analyzed using the NanoScope software (Version 5.31r1, Bruker).
Nucleation rates were measured from data collected shortly after the onset of precipitate formation [5]. All data with their mean values ± standard deviation (SD) of three independent sets of experiments are presented [5]. Ex situ dissolution experiments were performed following AFM experiments, and the sample was then removed from the AFM fluid cell and placed in a closed container filled with ca. 10 mL of the same reaction solutions for 3 days at room temperature [5]. The reacted crystal surfaces were coated with carbon and observed in a scanning electron microscope (SEM, JEOL JSM 6460 LV) equipped with an energy dispersive X-ray (EDX) detector (Oxford Instruments, UK) for the elemental analyses of precipitates formed on the hematite and goethite surfaces. SEM imaging and EDX analyses were made at an acceleration voltage of 20 kV [5].
The PHREEQC geochemical modeling software [17] was used to calculate solution speciation [5]. The PHREEQC model simulated the dissolution of either hematite or goethite into a given solution composition until equilibrium with the respective iron oxide was attained. The saturation index (SI = IAP/Ksp, where IAP is the actual ion activity product and Ksp is the solubility product for a given Fe-P phase) of the equilibrated solution with respect to the different iron phosphate (Fe-P) phases [18], including cacoxenite (Fe4(PO4)3(OH)3·12H2O), tinticite (Fe3(PO4)2(OH)3·3H2O), strengite (FePO4·2H2O), or an Al-P phase wavellite (Al3(PO4)2(OH)3·5H2O) [19] was calculated using the MINTEQ.v4 database. The equilibrium constants (logK) for cacoxenite, tinticite, and wavellite are not included in the database and were therefore taken from the literature [18,19].

3. Results and Discussion

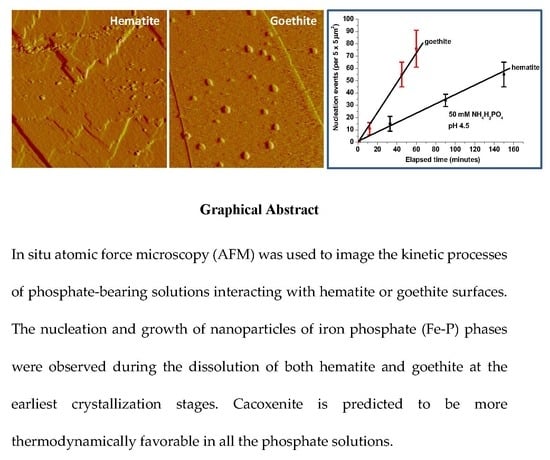
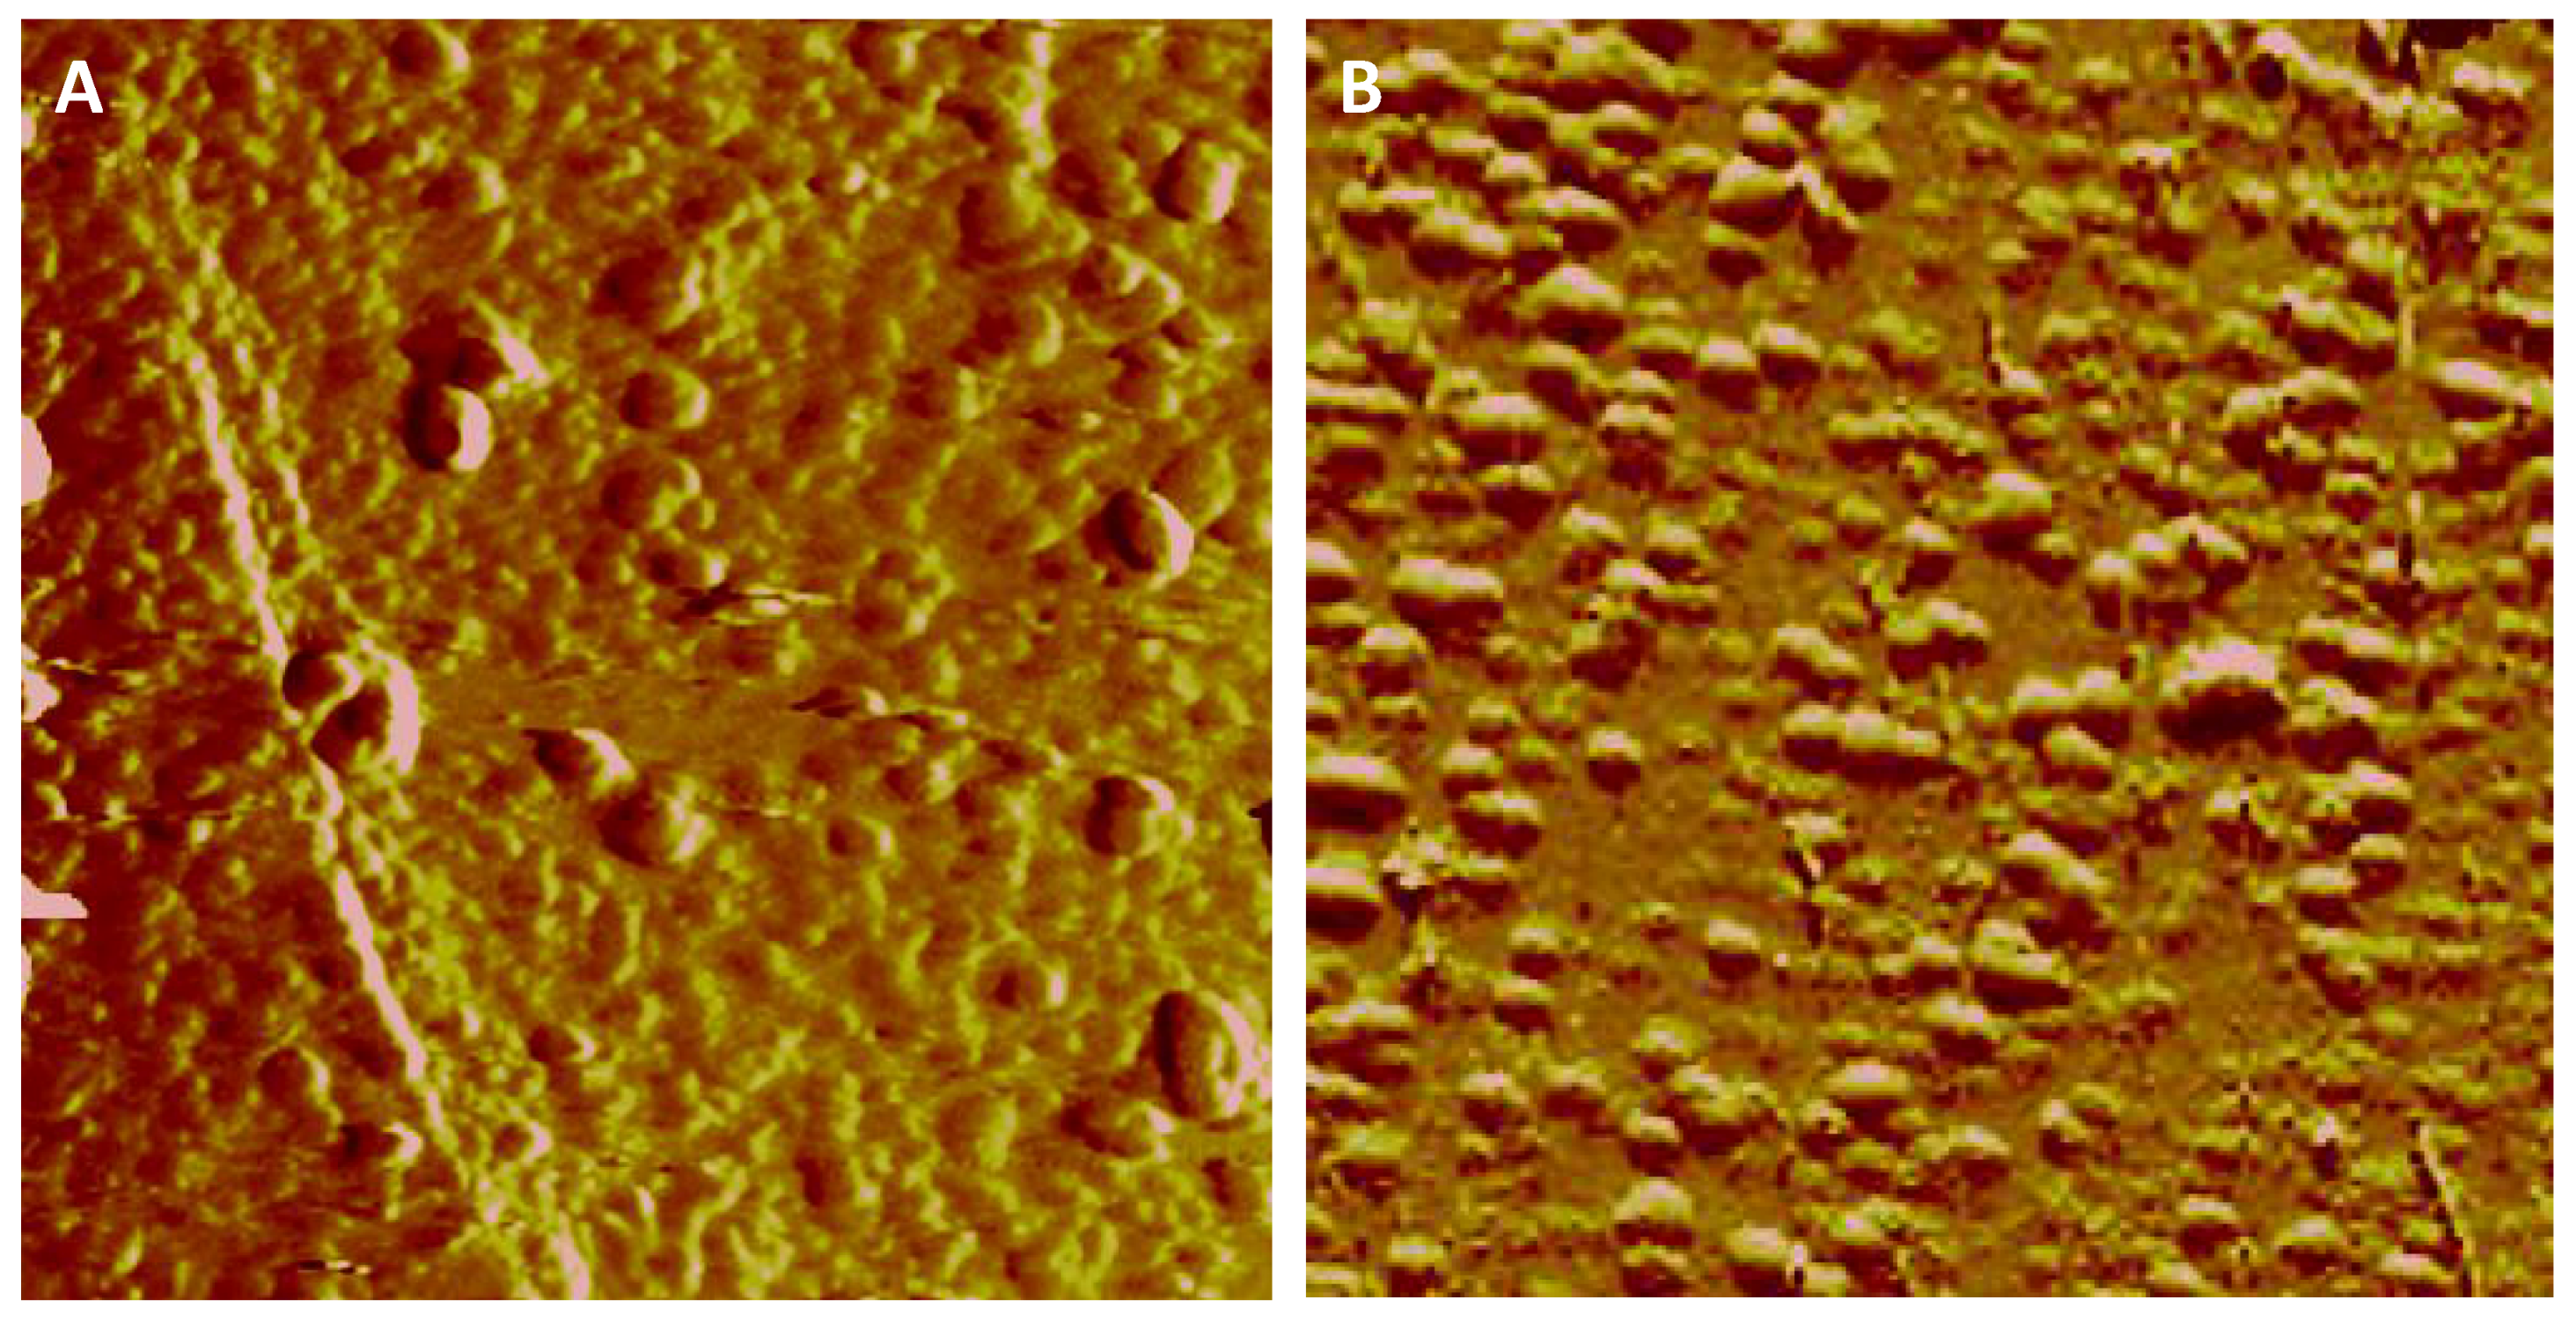
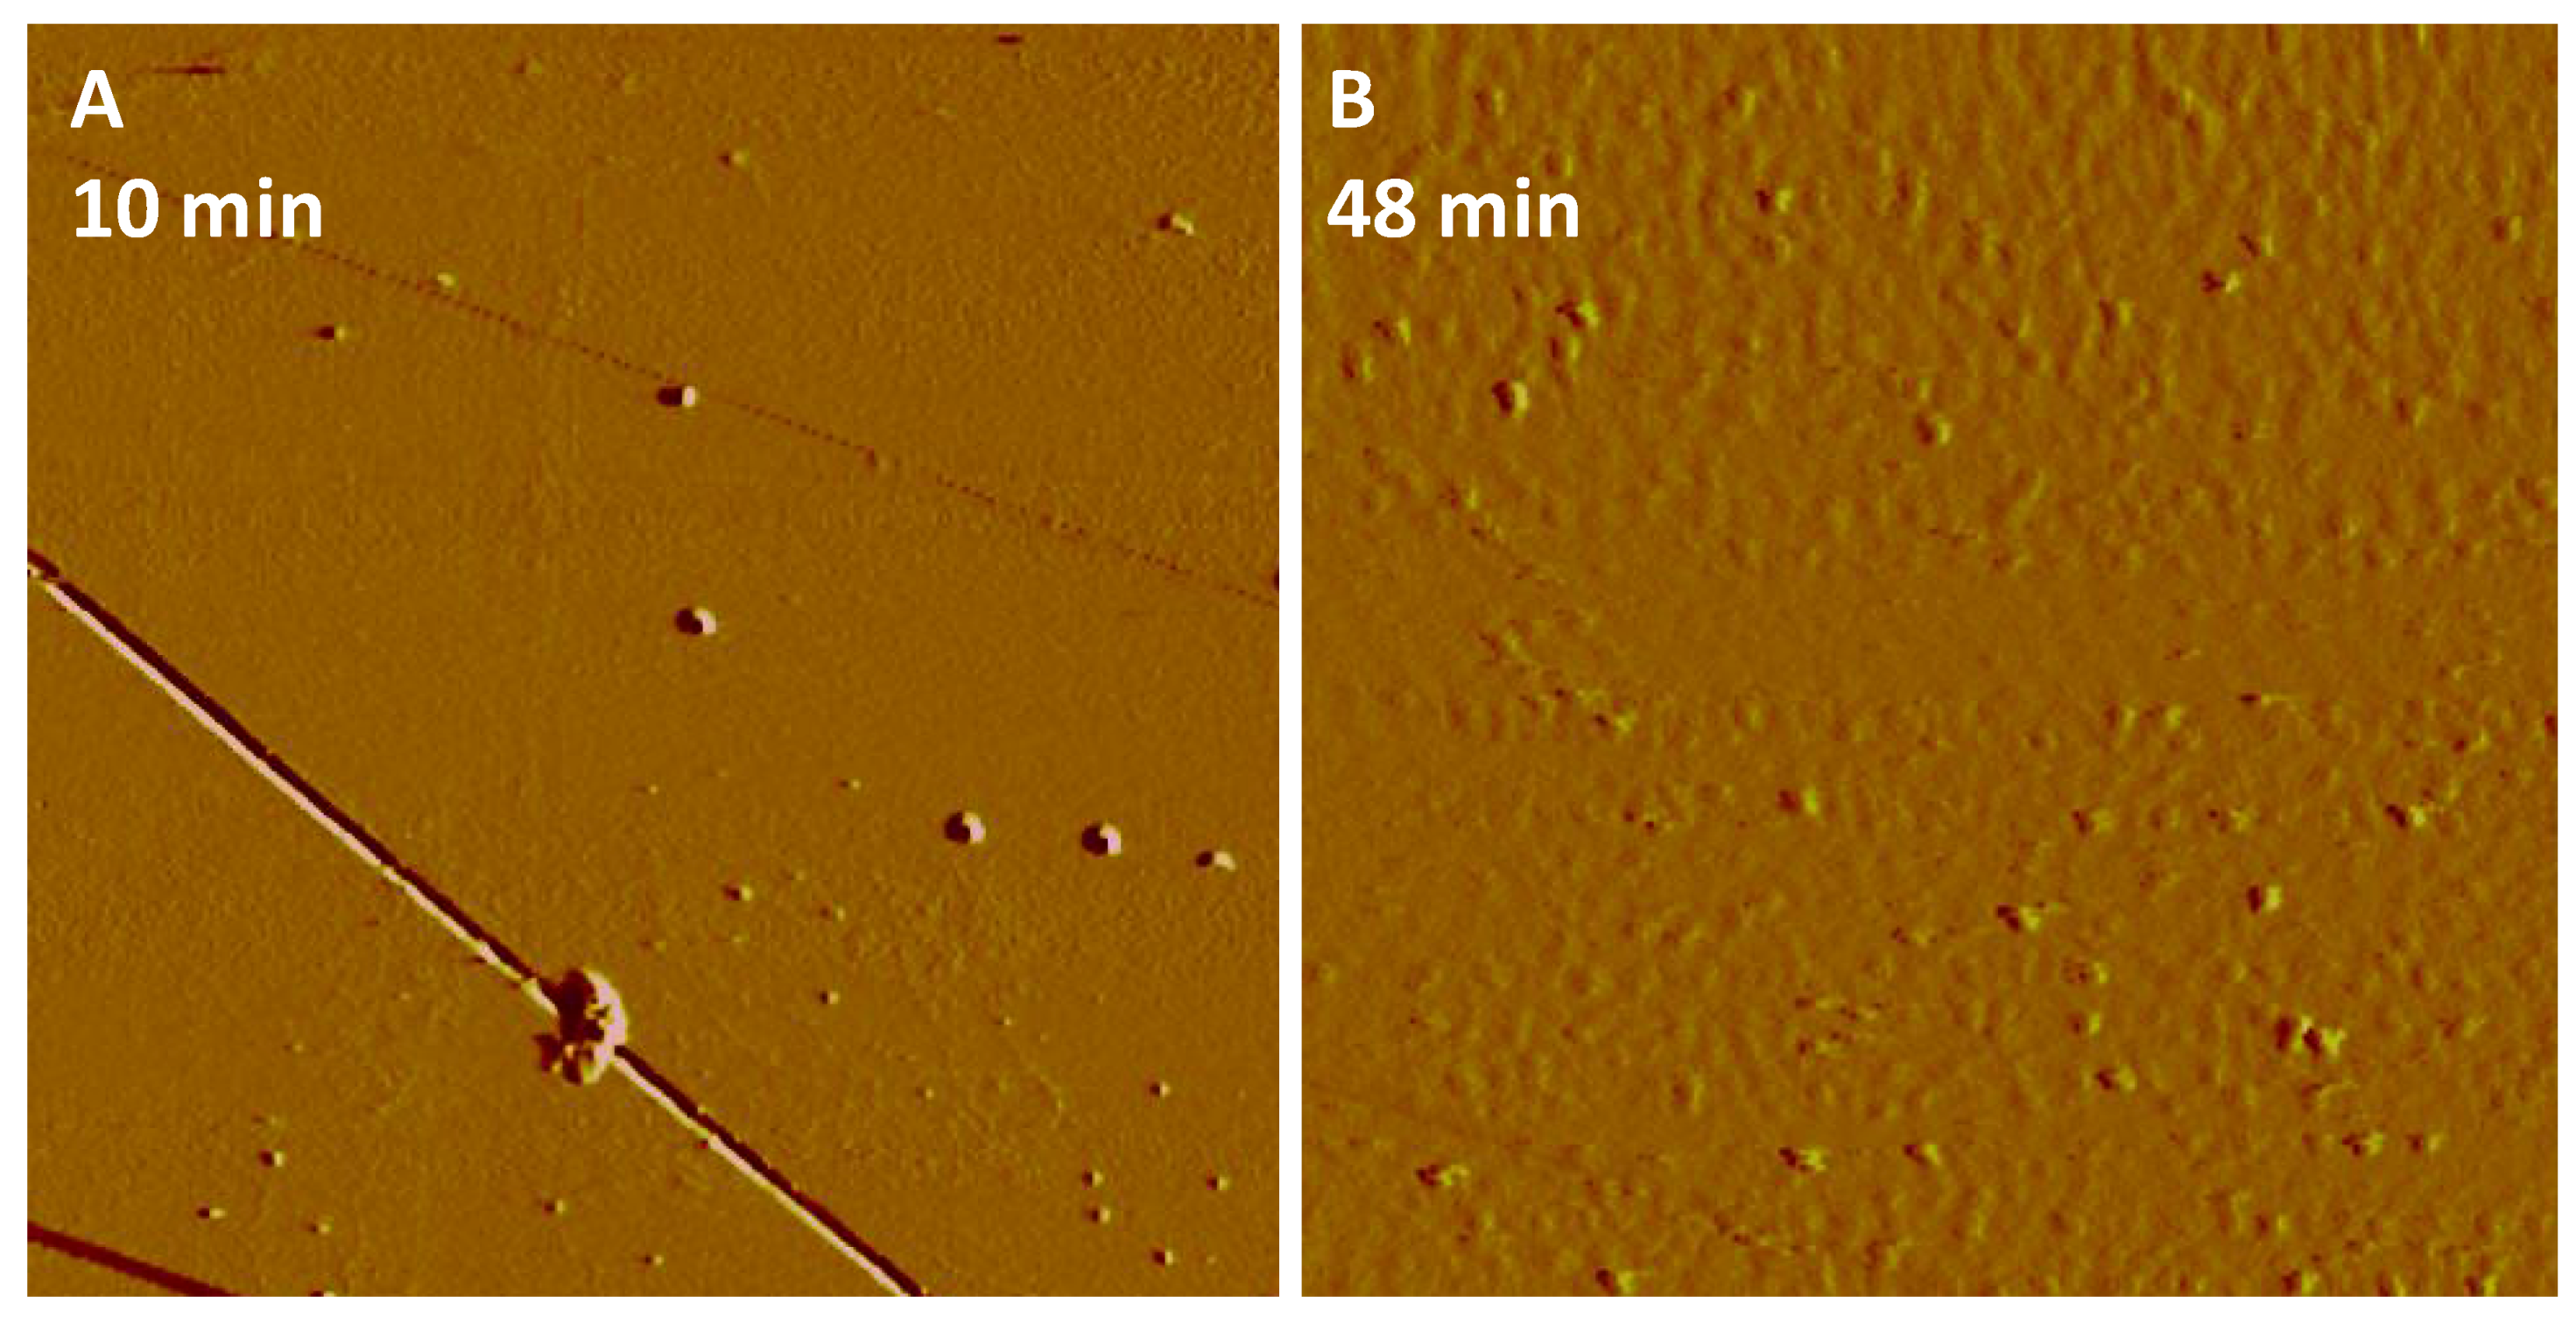
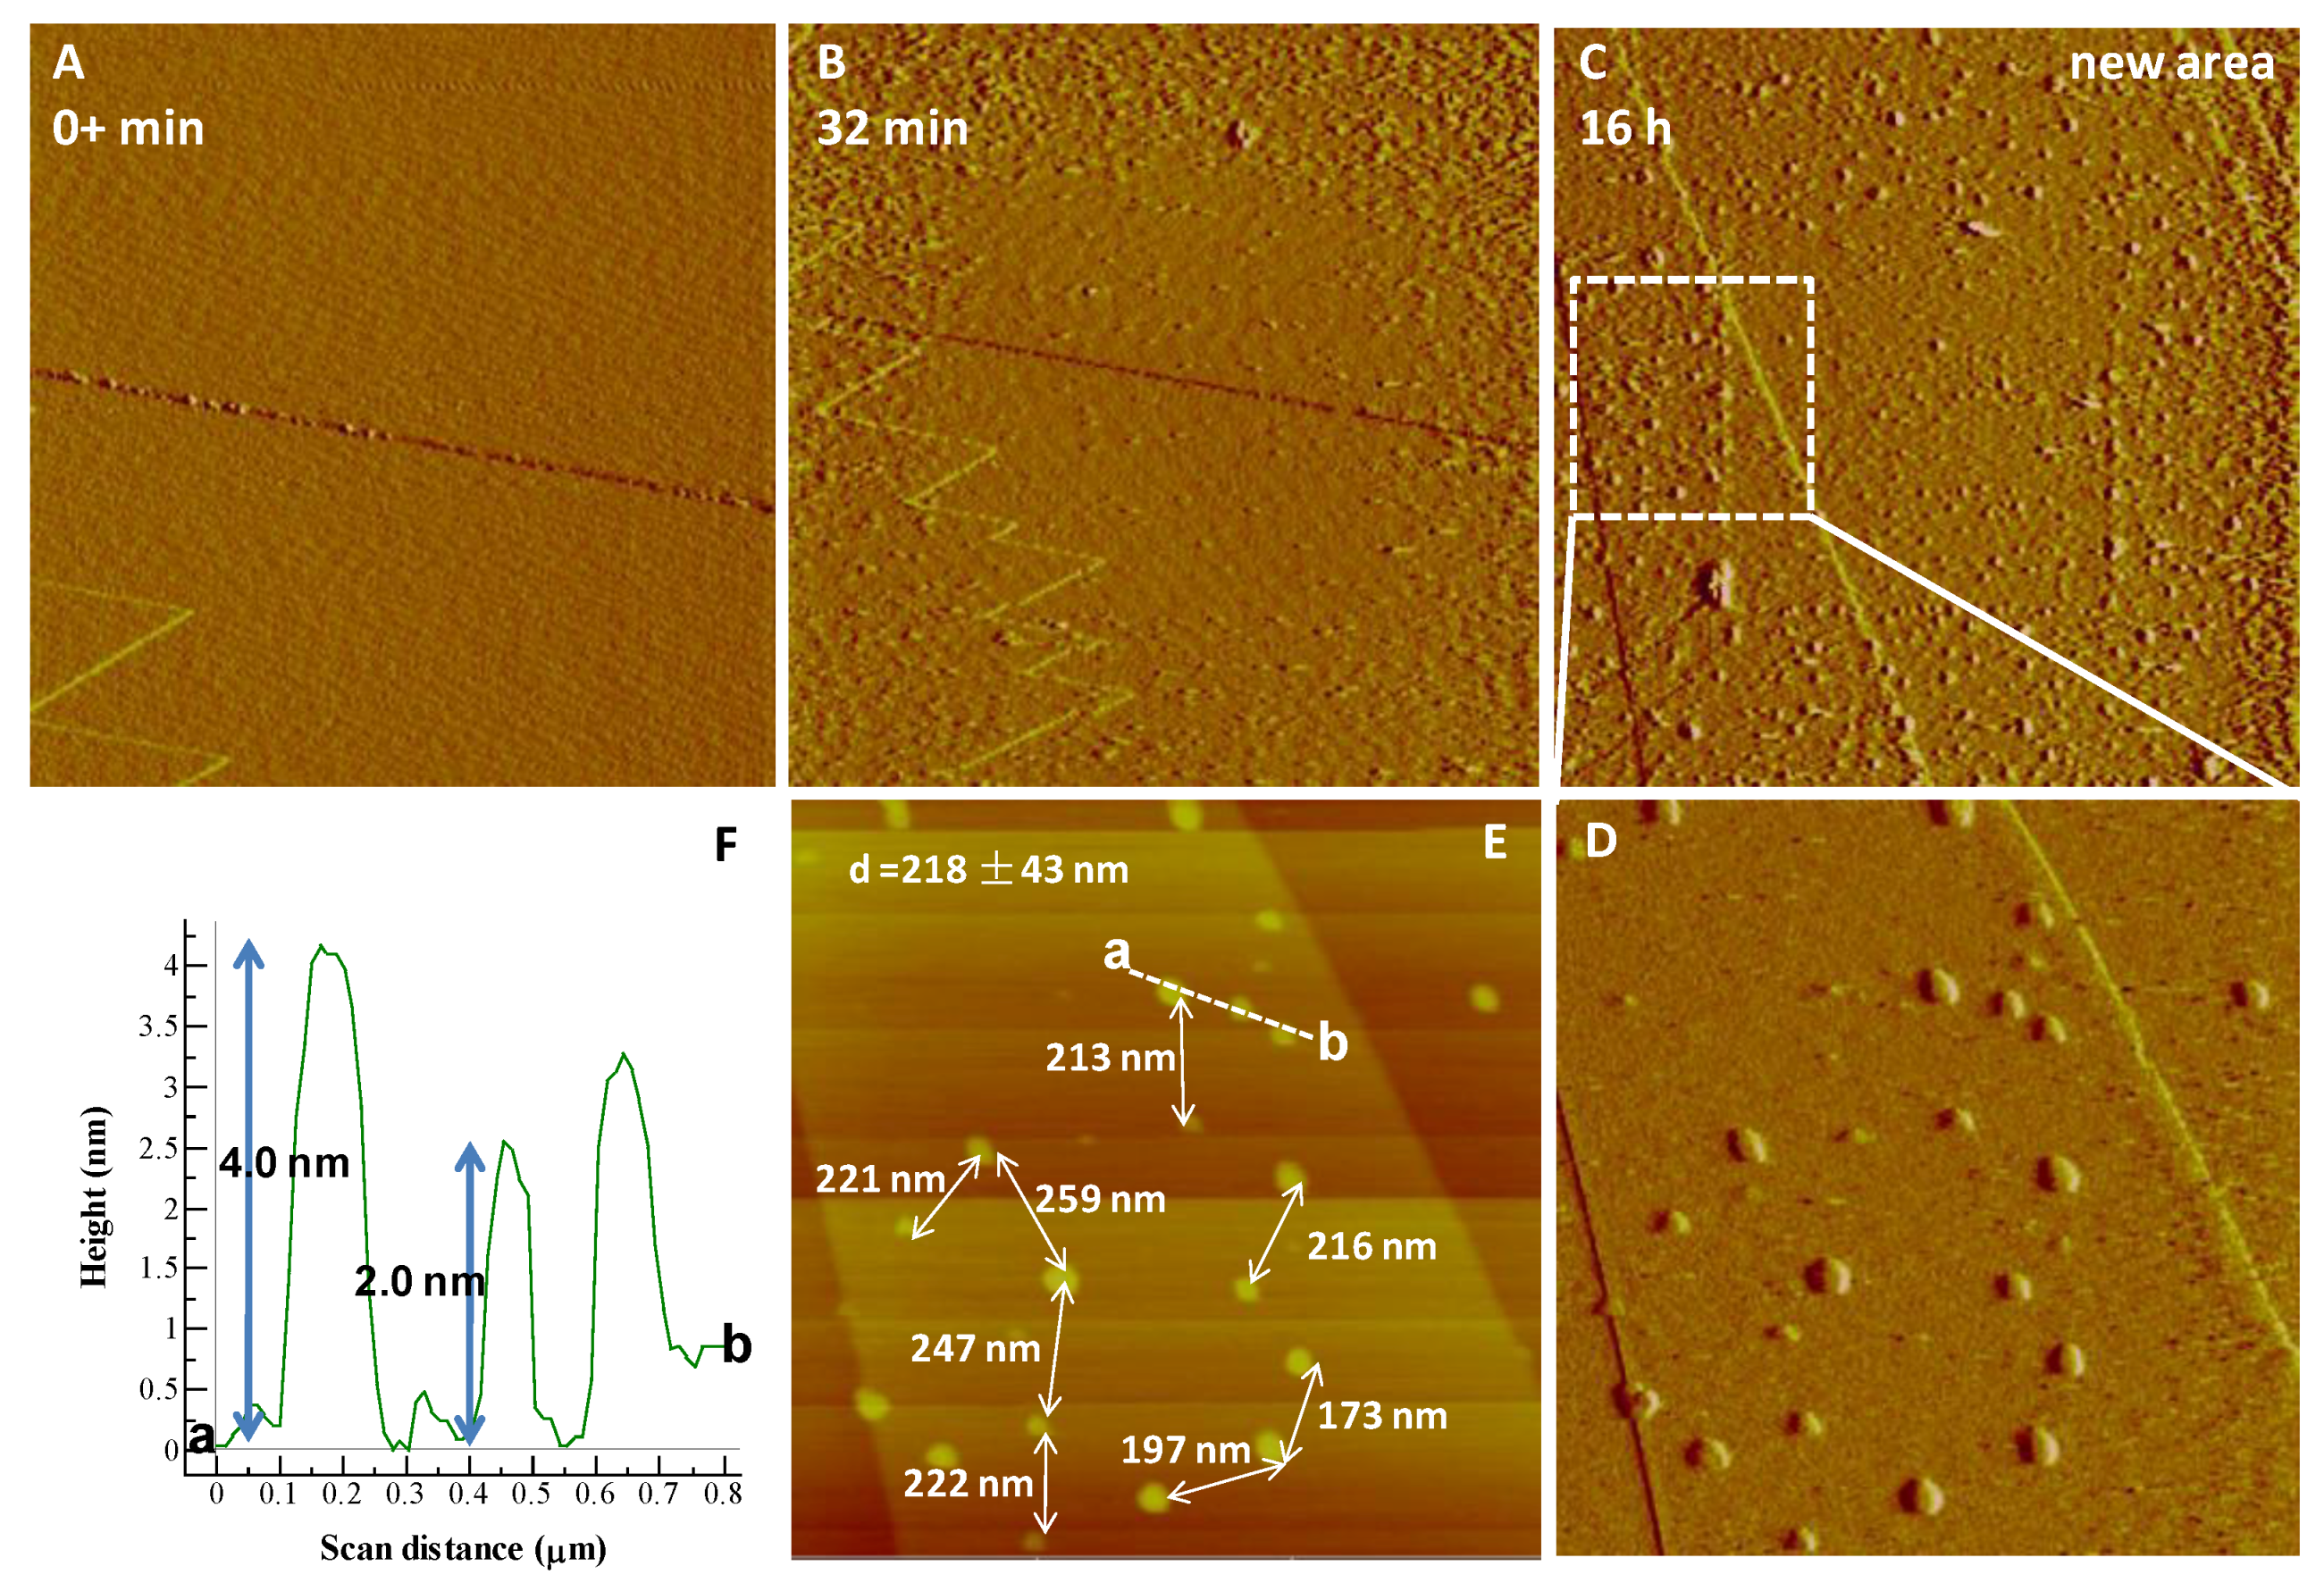
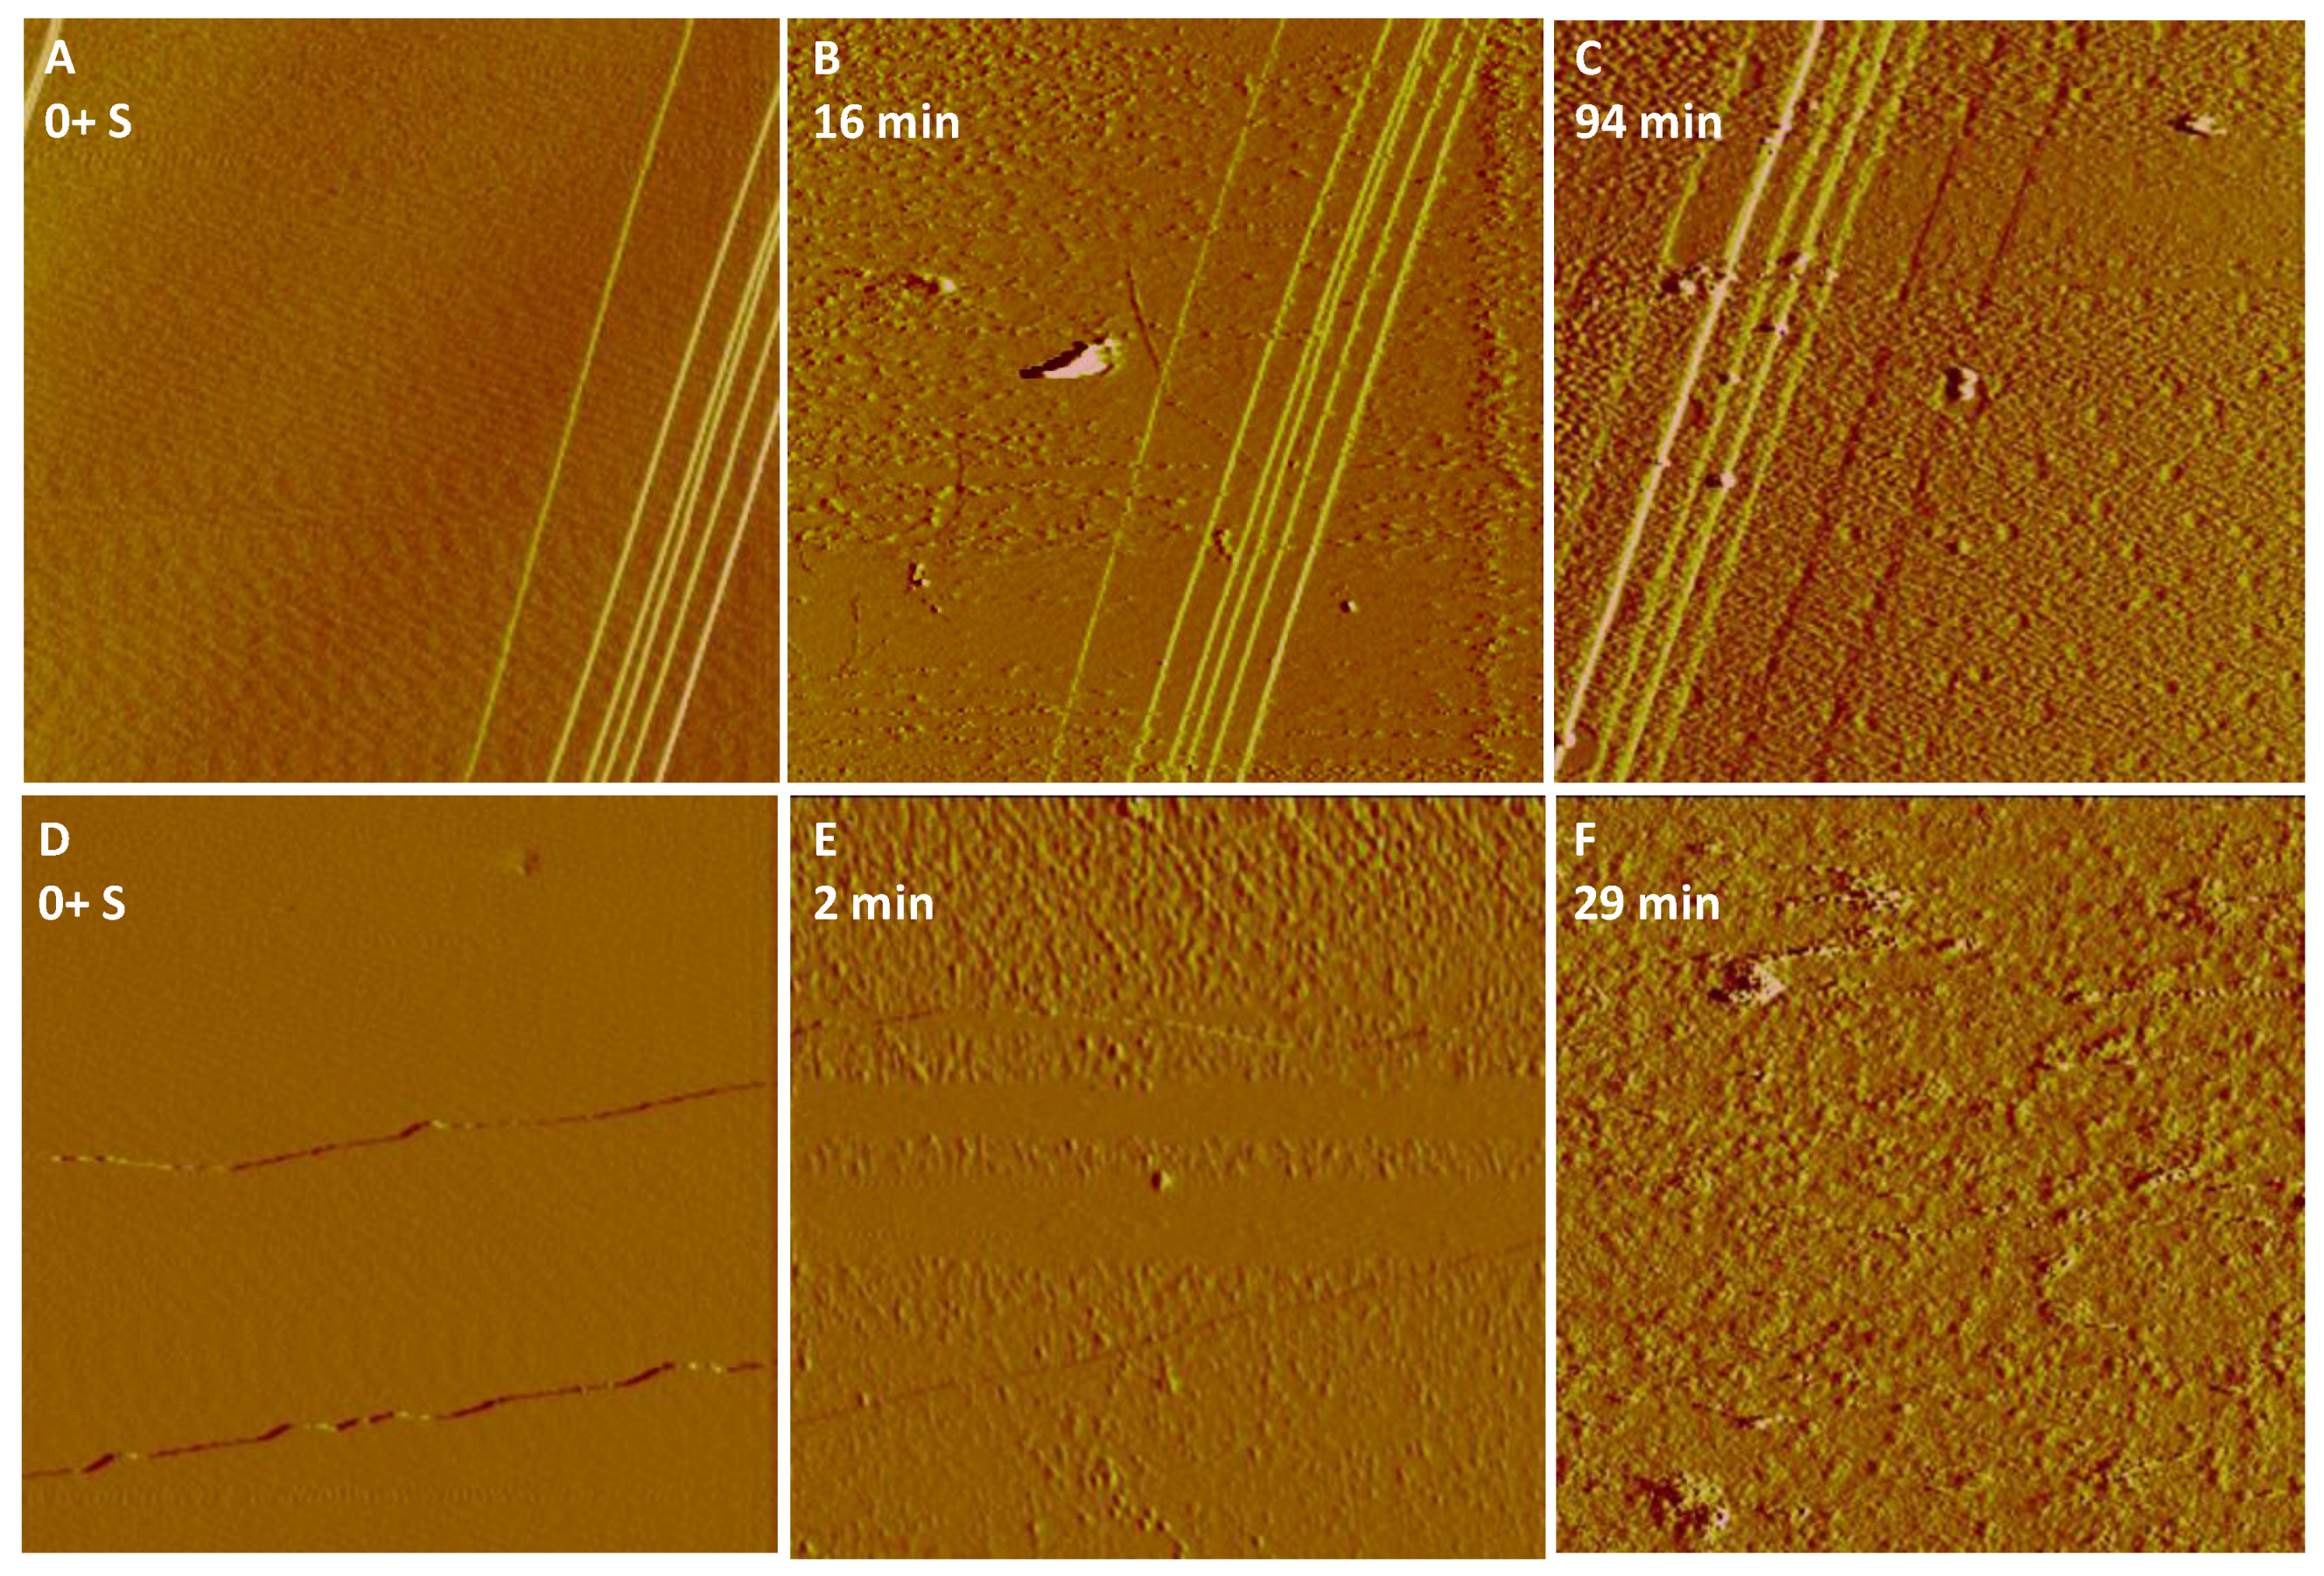
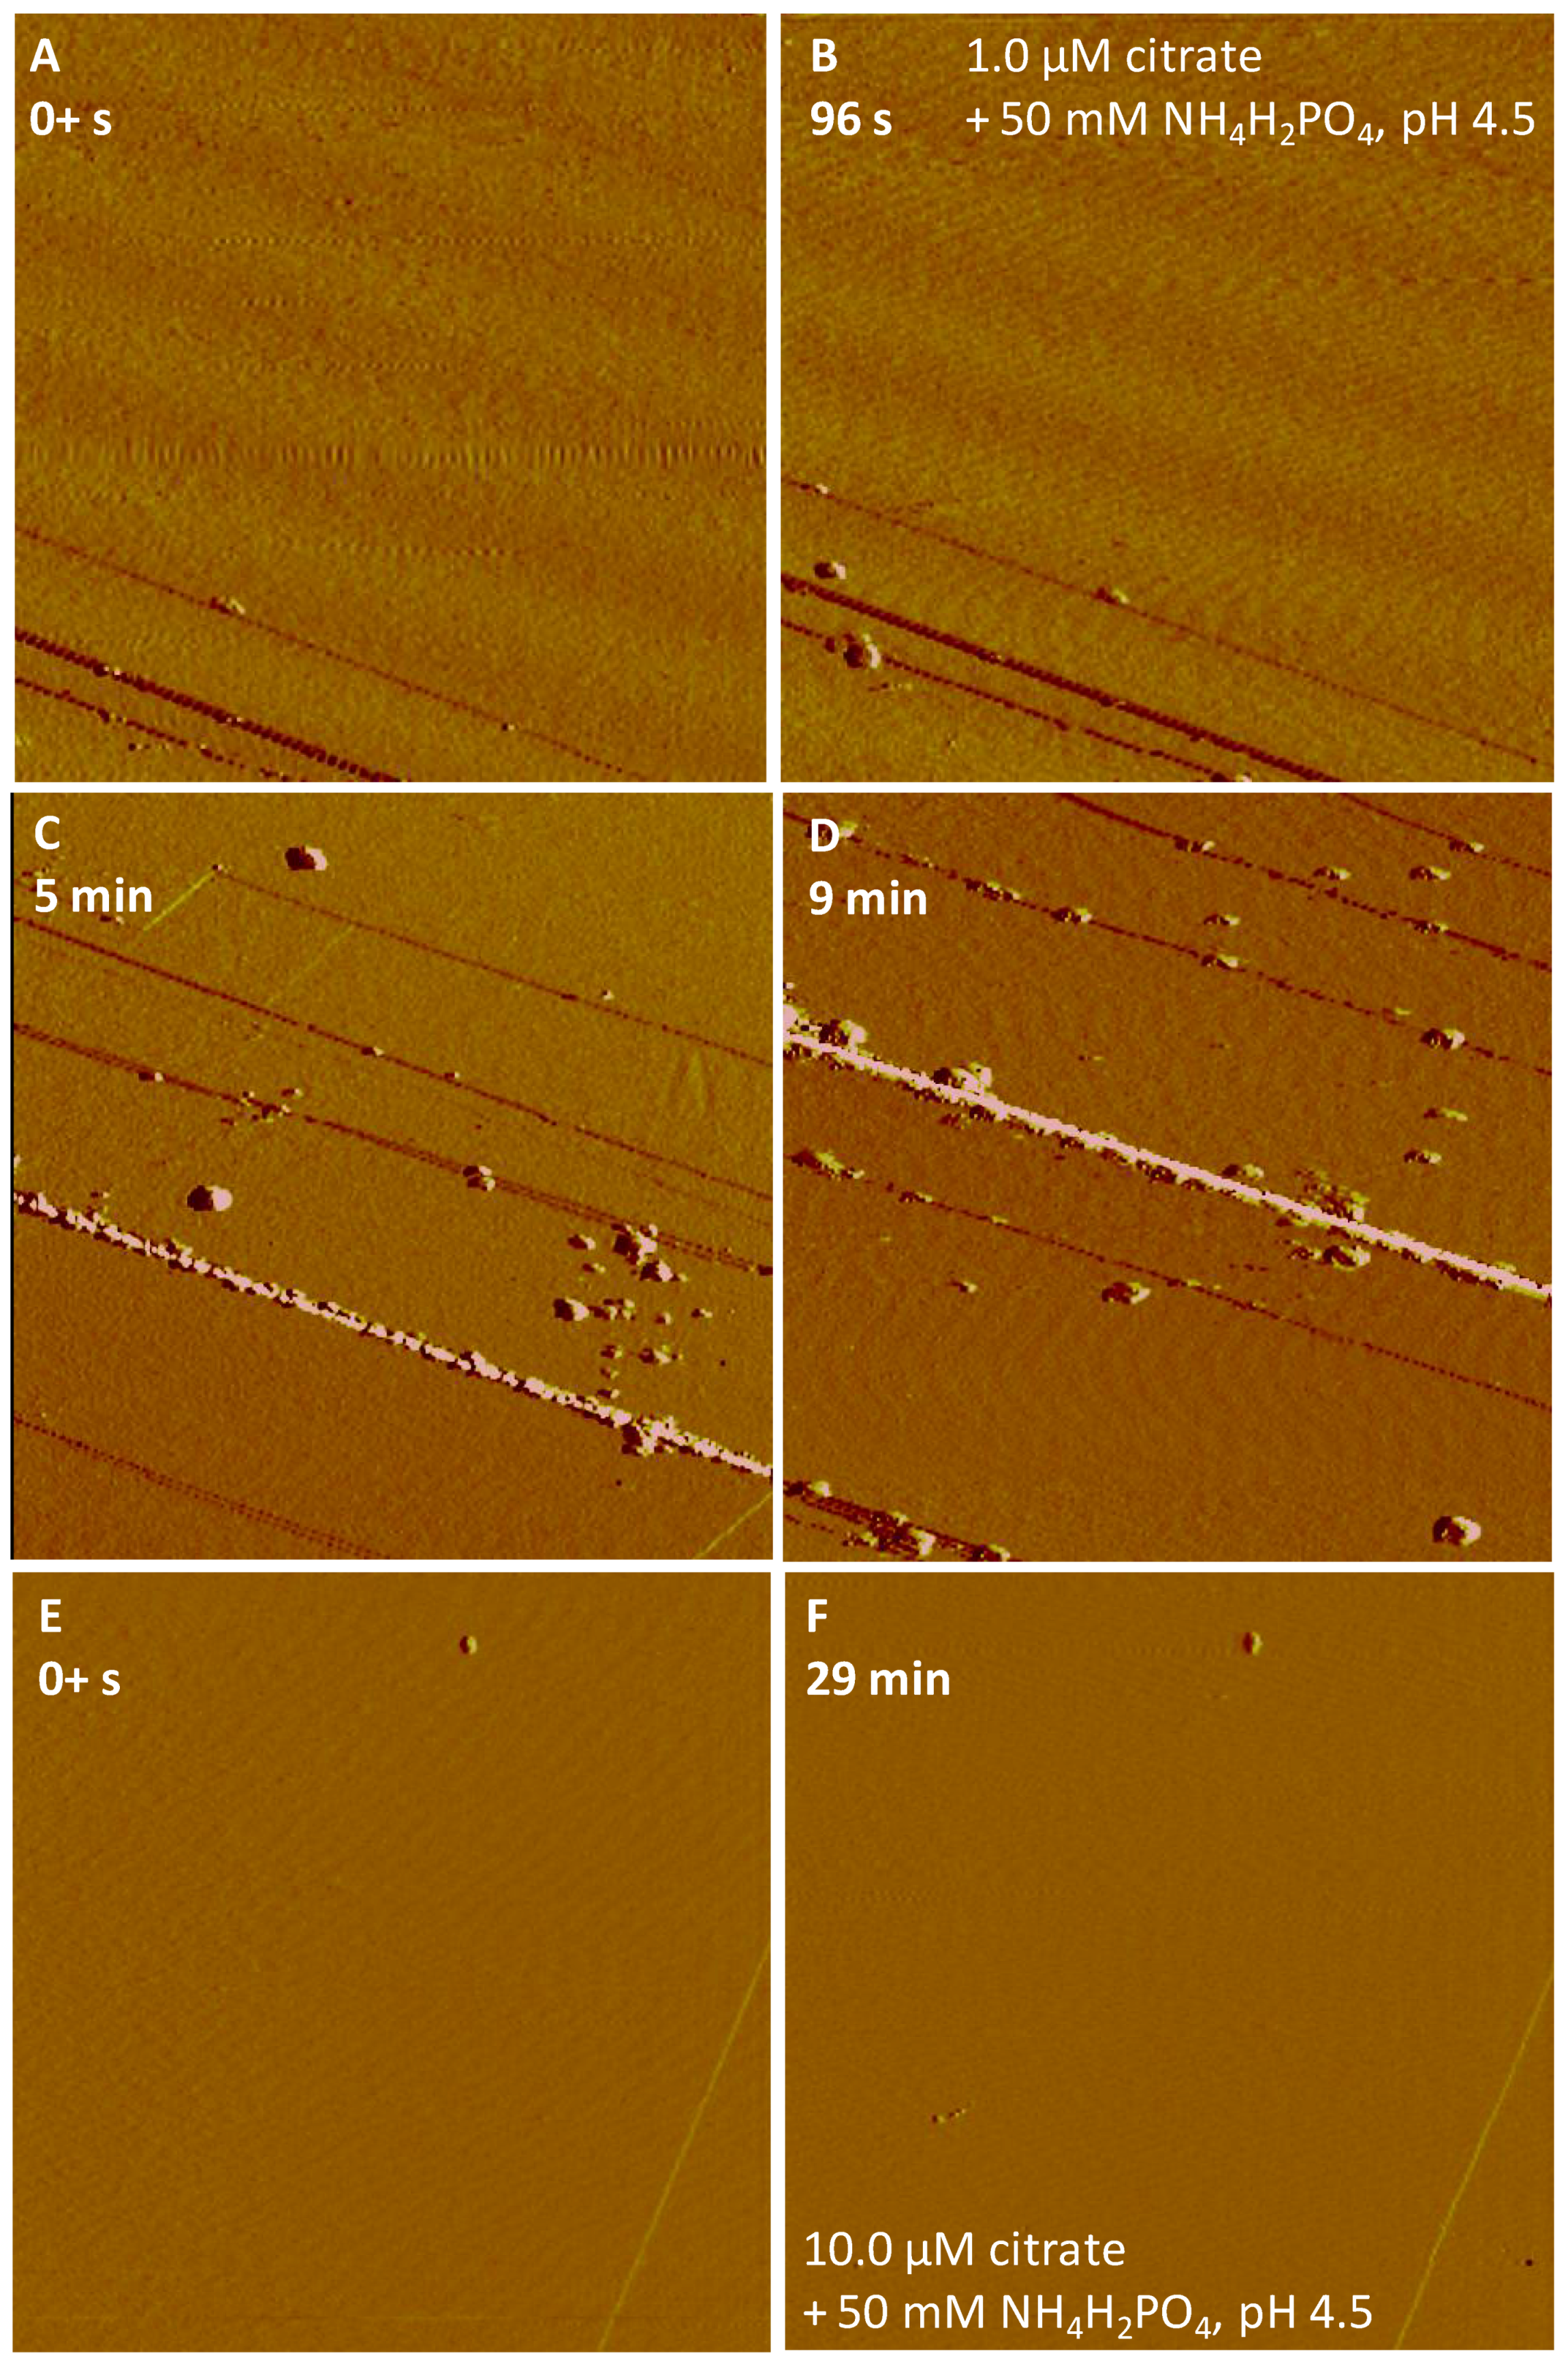
3.1. Iron Phosphate Nucleation and Growth on Hematite and Goethite

The dissolution of hematite or goethite in the presence of phosphate solutions provided a source of Fe3+ ions, which resulted in a supersaturation of the interfacial fluid with respect to a Fe-P phase and its nucleation on the dissolving hematite or goethite surfaces. In situ AFM imaging demonstrated that the observed nanoparticles/nanoclusters were present with a height of 1.0–4.0 nm and 2.0–3.0 nm on hematite (Figure 1A–C,G) and goethite (Figure 1D,F,H), respectively, at the earliest nucleation stages, i.e., within minutes of the phosphate solution contacting the mineral surfaces. The number of Fe-P nucleated nanoparticles increased linearly with time at 50 mM NH4H2PO4 (pH 4.5), and faster nucleation rates on goethite compared with hematite were observed (Figure 1I). However, after longer reaction times (3 days), the almost complete coverage of the reacting hematite surface by the deposition of Fe-P phases occurred (Figure 2A), whereas non-covered areas of the dissolving goethite substrate still remained (Figure 2B). The nucleation rates on both hematite (Figure 3) and goethite (Figure 4) increased when the pH was decreased to 2.0 from 4.5 in 50 mM NH4H2PO4 solutions.
For a given NH4H2PO4 concentration (50 mM, pH 4.5), in the presence of 10 mM AlCl3, faster nucleation rates were also observed on goethite than hematite (Figure 5), and both surfaces induced faster nucleation rates in the presence of AlCl3 than in the absence of AlCl3 (Figure 1). After 94 and 29 min, no further growth of nucleated crystals was observed on hematite and goethite, respectively. This could be related to the fact that both the hematite and goethite surfaces were rapidly covered by a layer of fine precipitates (Figure 5C,F), effectively passivating the surface so that no further Fe3+ ions could be released to the interfacial fluid layer. Similar phenomena could be observed in the presence of various concentrations of NaCl (10–100 mM) [5]. In the present study, passivation seems highly likely due to the slowing down of the reaction. However, it is quite difficult to know if the complete coverage was porous and therefore permeable to allow fluid access within the original crystal. This would be unlikely because, from considerations of the crystal’s structural characteristics, there is probably no epitaxy between the iron oxide surface and amorphous/polycrystalline Fe-P precipitates.
Upon the input of a 50 mM NH4H2PO4 solution in the presence of 1.0 μM citrate (pH 4.5), greater nucleation rates on hematite and goethite were observed than in the absence of citrate (Figure 6A–D and Figure 7A–C). Faster rapid growth of the nucleated particles with different sizes (height in nm) almost fully covered the goethite substrates in a short time period (16 min) (Figure 7C), compared to hematite (Figure 6D). When the citrate concentration was raised to 10 μM, the Fe-P nucleation on hematite was completely inhibited as no precipitation was seen under in situ AFM (Figure 6E,F), whereas a similar result only occurred on goethite surfaces at an increased citrate concentration of 50 μM (Figure 7D,E).

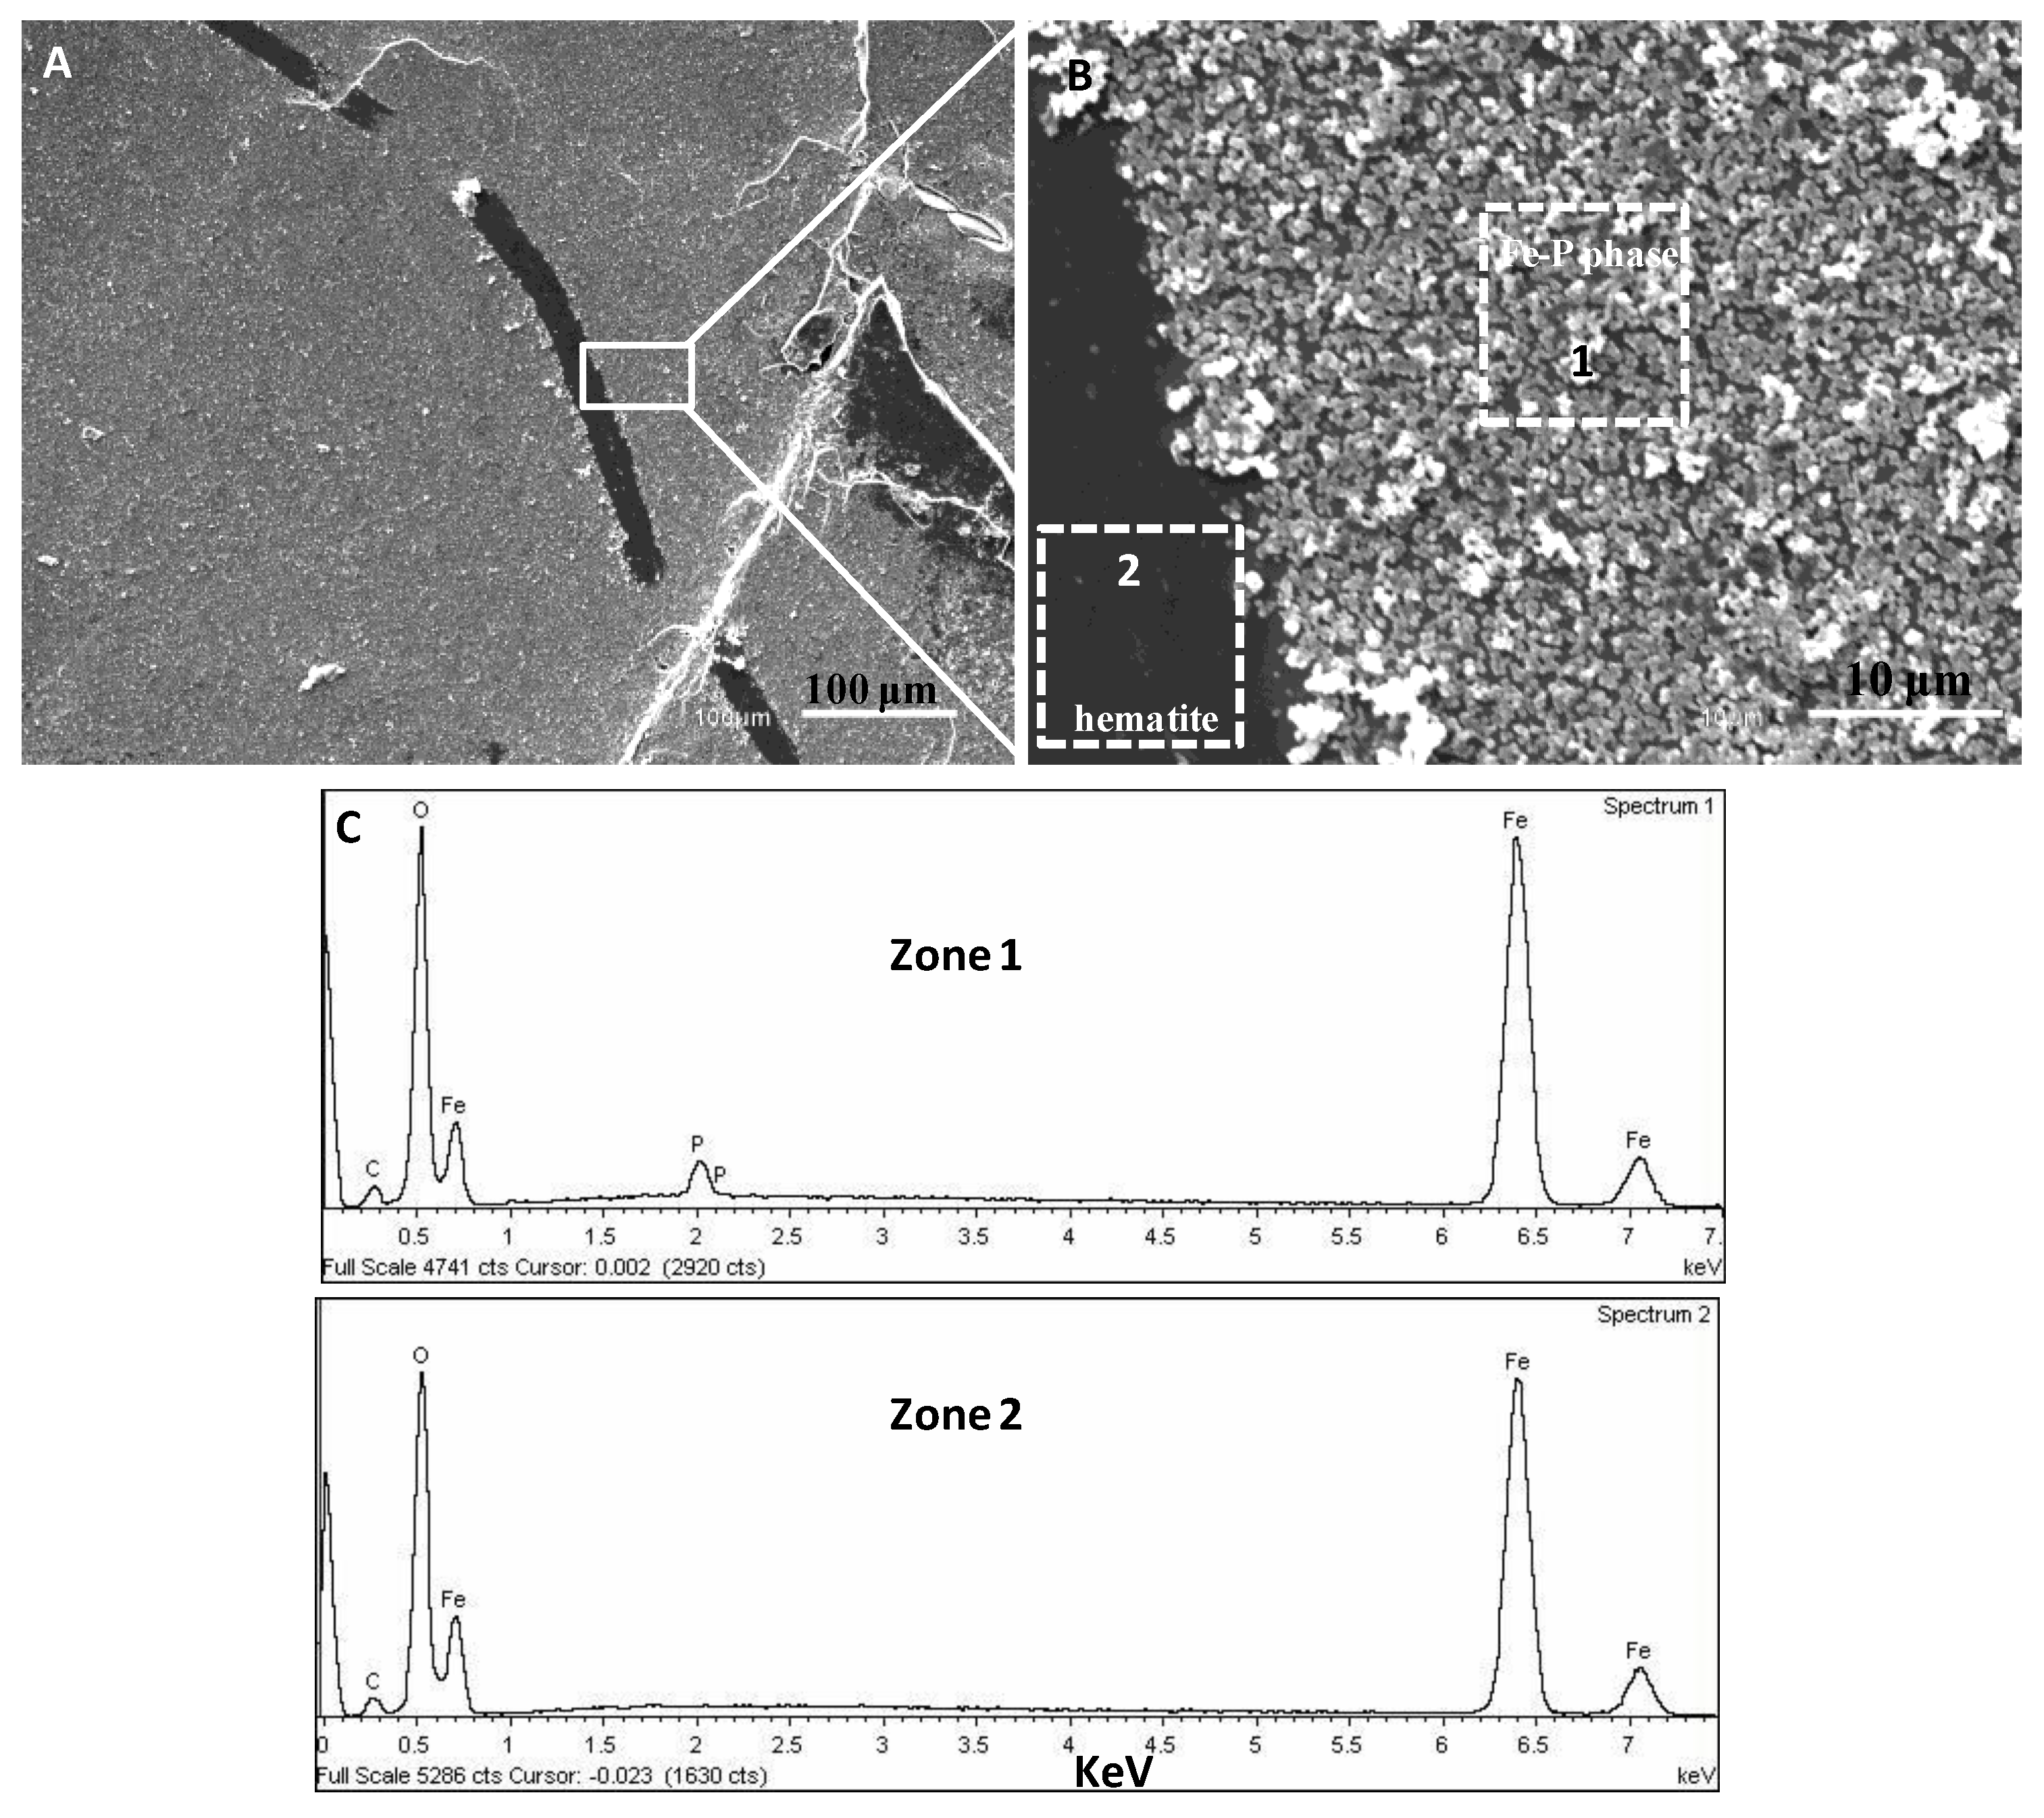
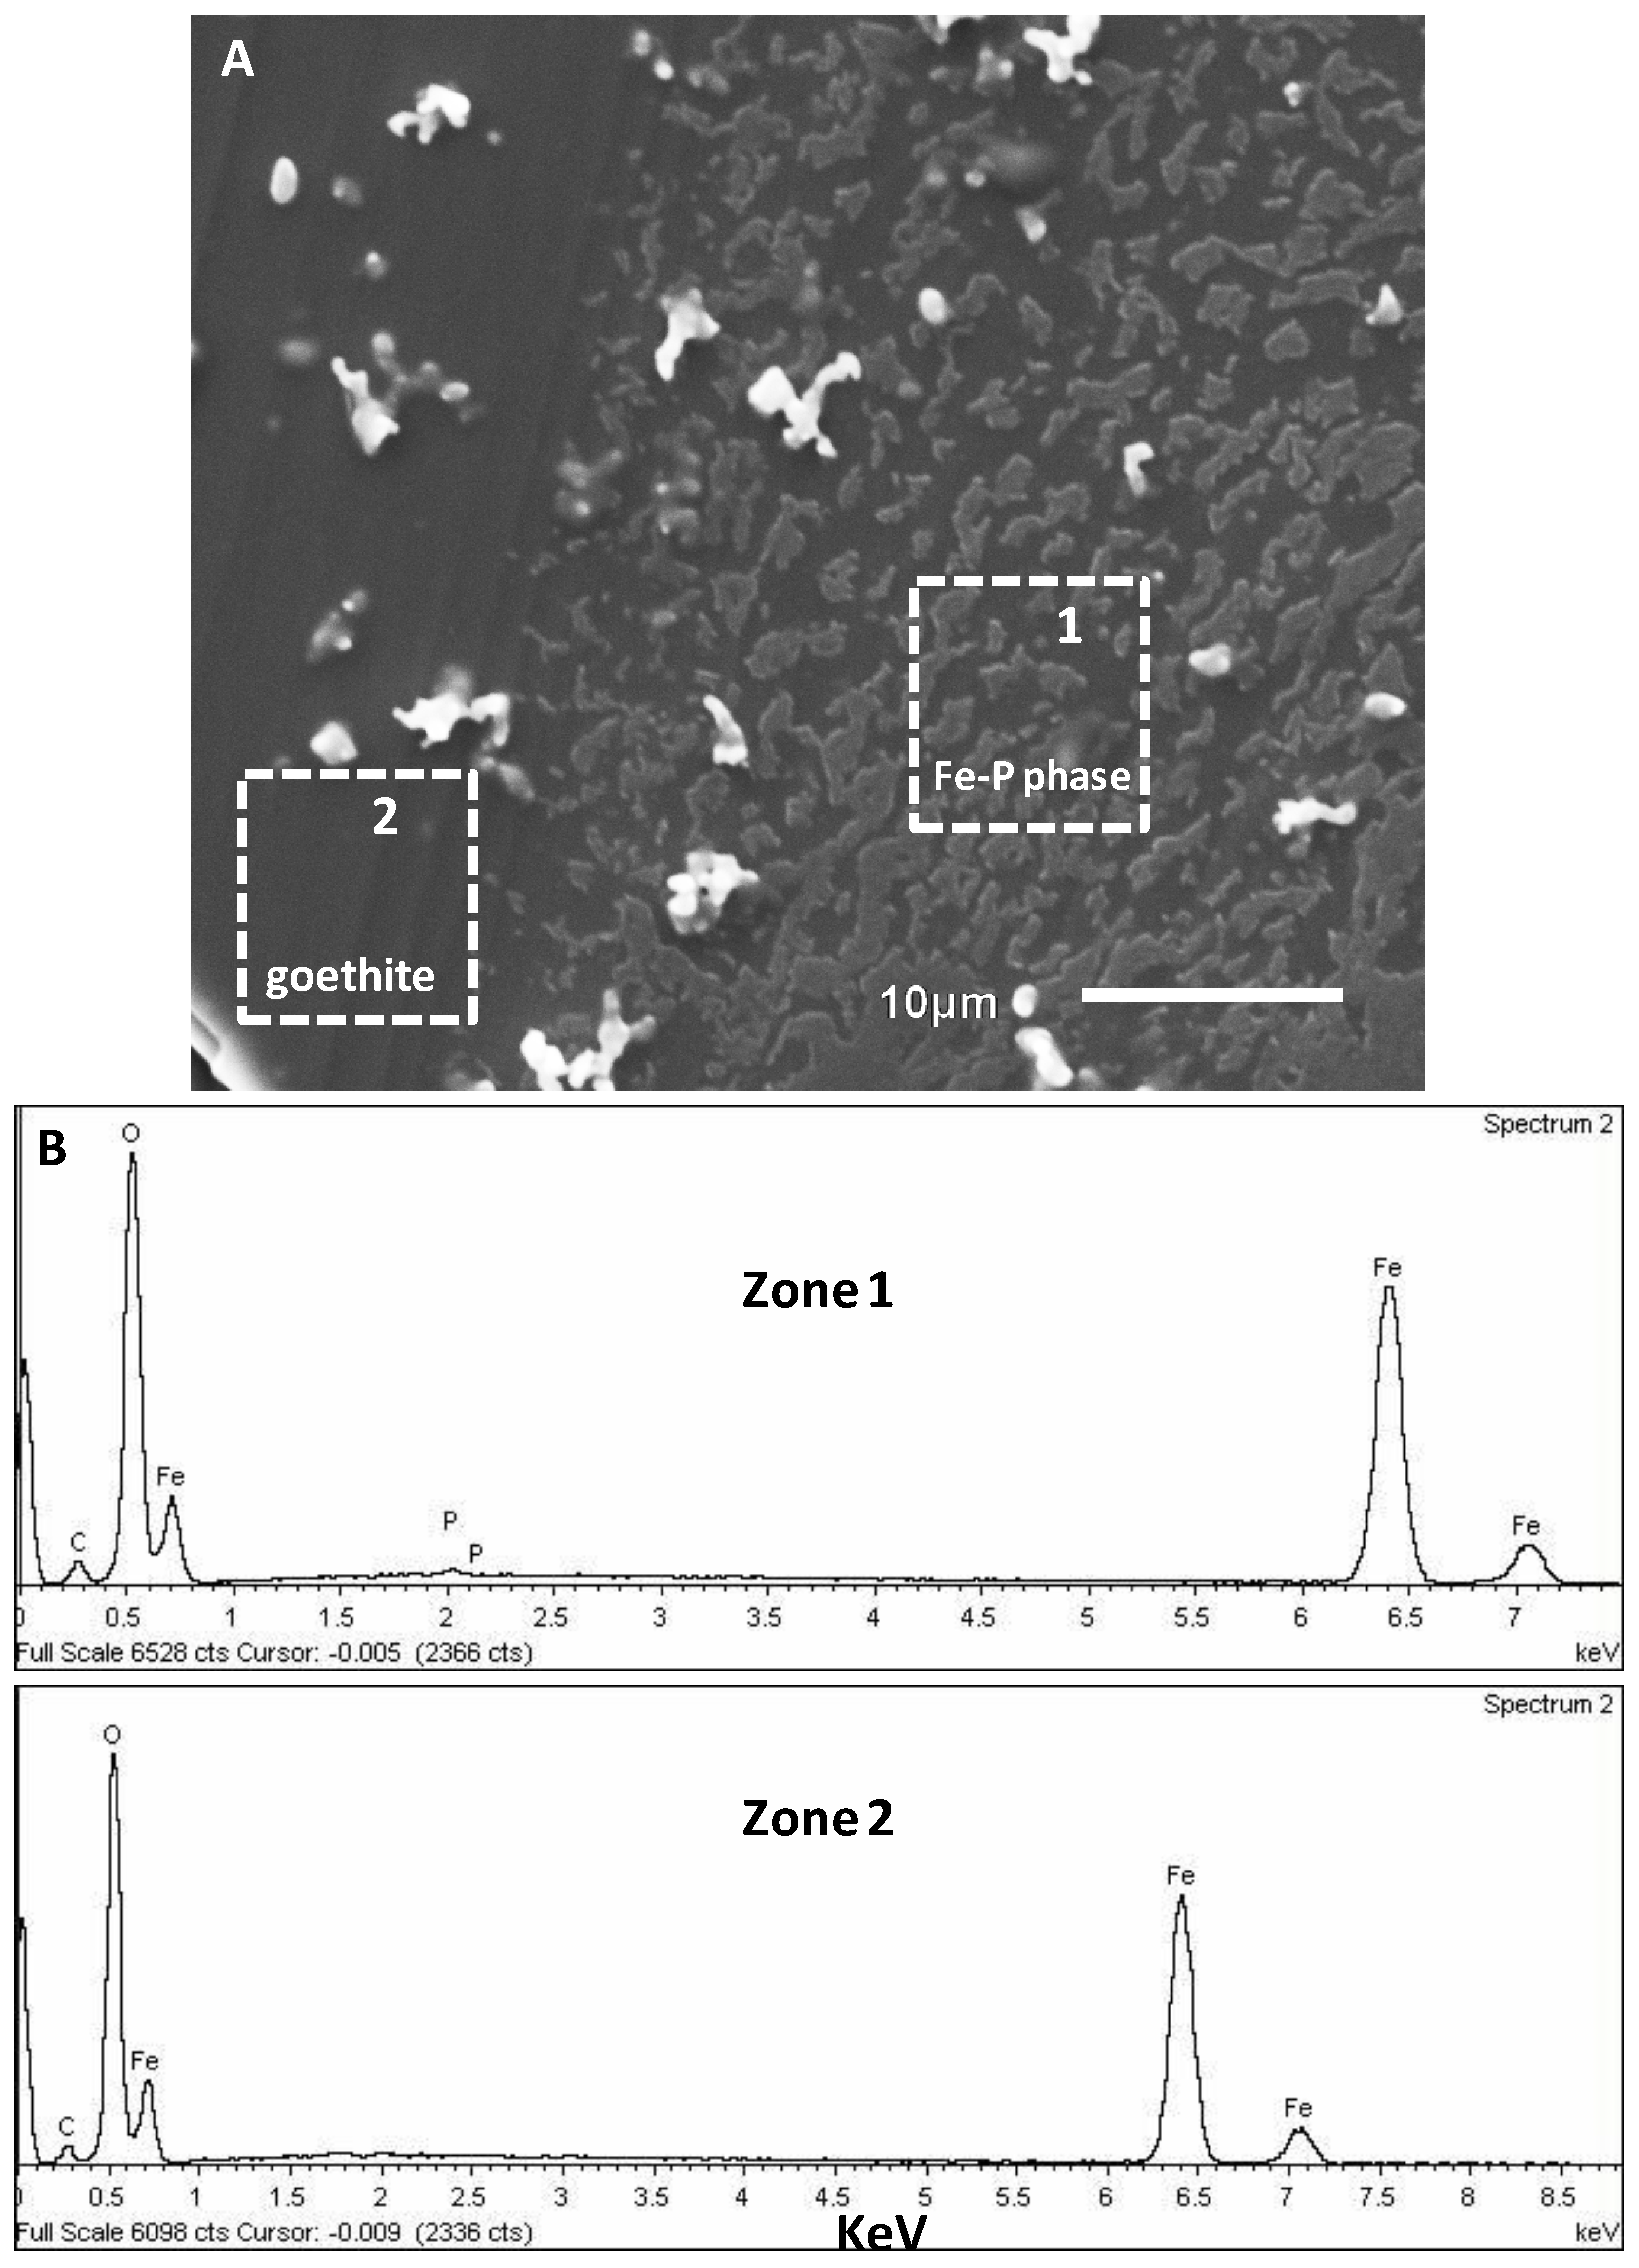
3.2. SEM-EDX Identification of Surface Precipitates on Hematite and Goethite Faces

After exposing cleaved hematite or goethite surfaces to 50 mM NH4H2PO4 solutions (pH 4.5) for 3 days, the hematite surfaces were almost completely covered by thicker layers (several tens of nanometers) of precipitates (Figure 8A,B), whereas thinner layers with scattered particles of precipitates were formed on goethite (Figure 9A). SEM-EDX analyses indicated these precipitates are composed of Fe, P, and O (Figure 8C and Figure 9B). The SEM analysis showing P present in the precipitate phases is an indication that a Fe-P phase is evident.

3.3. Kinetics and Thermodynamics of Coupled Dissolution-Precipitation at the Iron Oxide-Phosphate Solution Interface

In general, iron oxides dissolve slowly for in situ AFM study, but for both minerals, goethite, and hematite, dissolution features were evident on the exposed surfaces. Our previous results showed that dissolution of goethite surfaces exposed to NH4H2PO4 solutions (5.0 mM, pH 4.5), in the absence and presence of background electrolytes, occurs through a simple step retreat process by showing surfaces comprised of multiple straight-edged and non-straight preexisting steps without evidence of etch pit formation within the experimental time frame [5]. For hematite, we infer that dissolution in NH4H2PO4 solutions also proceeds by simple step retreat. This was based on the results that the nucleation of Fe-P nanoparticles, which occurred preferentially along the step edges of preexisting steps on a hematite surface (Figure 6A–D). For hematite or goethite surfaces (only preexisting straight-edged steps with no evidence of pitting) under far from equilibrium conditions (as is the case for our solution conditions), the dissolution rates increased with acidic pH (Figure 3 and Figure 4).
The dissolution of hematite or goethite in the presence of all phosphate solutions provided a continuous source of Fe3+ ions, increasing the driving force SI at the mineral interfacial layer with respect to several Fe-P phases, and eventually resulting in nucleation. Therefore, the dissolution of either hematite or goethite is coupled at the reaction interface with the precipitation of the new phase [20]. For nucleation to occur the solution at the mineral surface must become supersaturated with respect to the precipitating phase. In fact, some of the precipitating Fe-P phases have an extremely low solubility. For example, according to the PHREEQC calculations, you would only need to dissolve 3.3 × 10⁻¹¹ moles of FeOOH into 1 L of solution to saturate it with respect to cacoxenite. Therefore, the interfacial layer will become quickly saturated and this may lead to a strong interfacial coupling between dissolution and precipitation. This occurs despite the fact that the solutions flowing over the goethite or hematite surfaces were all highly undersaturated with respect to any possible phase [21], indicating the presence of a boundary fluid layer whose composition differs from the bulk solution. In effect, the nucleation and growth rates of the newly formed phases are controlled by the thermodynamic component of the interfacial energy and kinetic barriers associated with hydration, desolvation, degree of epitaxy with the parent surfaces, attachment/detachment, and diffusion [5,22]. In the present study, the flow rate of approximately 2 mL/1.5 min has been shown in previous studies [5] to make surface-control the rate determining step in the reaction, rather than diffusion through the fluid at the interface. However, we accept that the solution used may also play a role in the evolution of fluid concentration at the interface for certain AFM experimental conditions. A net increase in the dissolution rates of preexisting steps at low pH can increase the nucleation rate due to faster dissolution and therefore reach a higher SI at the mineral-fluid interface (Figure 4) in a shorter time. An almost constant inter-particle distance of 218 ± 43 nm (Figure 4E,D) is present during the formation of Fe-P nanoparticles on goethite. This implies that there is a fast build-up of ions in the interfacial solution until precipitation occurs. Transport via diffusion may also play a role in the interfacial solution chemistry.
At the initial nucleation stages, faster nucleation rates on goethite compared to hematite were observed (Figure 1I), most likely related to the faster dissolution (higher reactivity) of goethite surfaces compared to hematite, and hence the faster release of Fe3+ ions in the former case. On the contrary, after longer reaction times (3 days), the almost complete coverage of the reacting hematite surface by thicker layers of precipitates of possibly amorphous Fe(III)-P phases occurred (Figure 2A and Figure 8A,B), compared with the goethite substrate (Figure 9A). This may be due to the fact that the goethite surface was covered with a thin layer of Fe-P particles by a rapid initial reaction and was subsequently inhibited from further dissolution. We observed that goethite reacted faster than hematite in the presence of any phosphate solutions, however in the latter case perhaps a slower dissolution was kinetically favorable to form a thicker Fe-P layer. This also could be confirmed by the fact that the hematite surface was rapidly covered by a layer of fine precipitates (Supplementary Materials Figure S1) in the presence of 50 mM NH4H2PO4 at pH 2.0, effectively passivating the surface.
Using PHREEQC, calculated SI values show that the three most likely Fe-P phases on hematite and goethite are cacoxenite, tinticite, and strengite. Cacoxenite is predicted to be most favorable due to its higher SI in all the experimental solutions (Supplementary Materials Tables S1–S4), i.e., only very little hematite or goethite needs to be dissolved before the interfacial solution would become supersaturated with respect to cacoxenite. Saturation indices (SI) of possible Fe-P phases formed on goethite, in equilibrium with 50 mM NH4H2PO4 solution (pH 4.5), are 1.4, 19.8, and 28.2, in relation to strengite, tinticite, and cacoxenite, respectively, and for hematite, the SI are 0.2, 16.2, 23.4, respectively, under the same solution conditions (Table S1). As pH was decreased to 2.0 in 50 mM NH4H2PO4 solutions, the SI with respect to strengite, tinticite, or cacoxenite, formed on hematite or goethite, was significantly increased (Table S1), although all the observed precipitates may be amorphous at the initial stages. This suggests that the effect of pH is more favorable for both hematite and goethite dissolution, and subsequent Fe-P phase formation, than for the effect of ionic strength. As shown in Table S2, following the addition of 10 mM AlCl3 into a 50 mM NH4H2PO4 solution (pH 4.5), SI with respect to strengite, tinticite, and cacoxenite formed on hematite, was slightly raised to 0.6, 16.9, and 24.4, respectively. This suggests that the presence of background electrolytes enhances the mineral dissolution rate [5,23] because the electrolytes possibly modify water structure dynamics, as well as solute and surface hydration [5,24]. In addition, a new phase of wavellite (Al3(PO4)2(OH)3·5H2O) may become stable in the presence of Al3+ ions (Table S2).
Furthermore, calculated SI also predicts that low concentrations of citrate can promote the formation of strengite, tinticite, or cacoxenite formed on hematite or goethite [5] due to elevated SI (Tables S3 and S4). Organic acids in the soil solution typically range from 0.1 μM to 0.1 mM [5,25,26]. Our experiments also show that higher concentrations of citric acid retard Fe-P precipitation formation. Therefore, the presence of relatively high concentrations of citrate may increase P availability by suppressing the precipitation of Fe-P phases, for example, cacoxenite [5]. The role of citrate is very interesting in that small concentrations seem not to affect or even to enhance the sequestration of PO4, but high concentrations inhibit Fe-phosphate formation, i.e., prevent PO4 sequestration. This phenomenon is highly relevant to P-depleted soils when a higher citrate concentration will inhibit P-phosphate formation and hence allow for the availability of P for plant uptake. The citrate ion forms complexes with metallic cations, such as Fe. The stability constants for the formation of these complexes are quite large because of the chelate effect. Consequently, it forms complexes even with alkali metal cations. However, when a chelate complex is formed using all three carboxylate groups, the chelate rings have 7 and 8 members, which are generally less stable thermodynamically than smaller chelate rings. As a consequence, the hydroxyl group can be deprotonated, forming part of a more stable 5-membered ring, as in ammonium ferric citrate, denoted as (NH4)5Fe(C6H4O7)2·2H2O [27]. This is most likely to be the form present in our experiments [27].
The end effect is that Fe is bound as a ligand in solution with a strong chelation effect of citrate and therefore is not available to form Fe-phosphates. It is impossible to prove the likely citrate-binding mechanism. Within the limits of our analytical possibilities we can only reasonably suggest what may be the mechanism. Given the high chelate-binding nature of citrate, the above-mentioned mechanism is the best approach that satisfies thermodynamic considerations. Finally, since surface roughness modifications may be responsible for the local variability of surface charge, the potential impact of small-scale surface roughness and the resulting landscape of surface charge may be of critical importance to the efficiency of particle adsorption [28].

4. Conclusions

To summarize, Fe-P precipitation at the goethite-water or hematite-water interface is dependent on solution composition, including the activity of phosphate species, pH, ionic strength, and organic additives, thereby influencing the dissolution of hematite or goethite. An obvious decrease in the dissolved phosphate concentration in the soil solution is due to increased phosphate adsorption and subsequent precipitation on goethite or hematite. The bioavailability of phosphate will be rapidly reduced at high salt (AlCl3) concentrations due to phosphate immobilization. If there is complete coverage by surface precipitates, the hematite and goethite surfaces will be passivated, resulting in the inhibition of phosphate immobilization. In effect, the presence of Fe mineral phases such as goethite and hematite in acid soils will sequester phosphate and therefore reduce P availability for plant uptake, but this can be modified by the presence of other ionic species and additives, such as other background ions or organic additives like citrate. These in situ observations may improve our understanding of goethite and hematite (as typical sources of Fe in soils) mineral surface-induced Fe-P precipitation, with possible implications for P fertilizer application management.

Supplementary Materials

The following are available online at https://www.mdpi.com/2075-163X/8/5/207/s1, Figure S1: AFM time sequence (deflection images) showing in situ nucleation kinetics of Fe-P phases on a dissolving hematite surface in 50.0 mM NH4H2PO4 (pH 2.0) at (A) t = 10 min, (B) 48 min, (C) 127 min, and (D) 2 d, respectively. After 127 min reaction, the scan area was almost fully covered with the nucleating fine particles, which passivated the reacting surfaces. AFM images, 5 μm × 5 μm, Table S1: Main solution speciation of goethite and hematite in equilibrium with NH4H2PO4 reaction solutions at pH 2.0 and 4.5 and saturation indices (SI) with respect to different iron phosphate phases of various NH4H2PO4 reaction solutions after equilibration with goethite and hematite, Table S2: Main solution speciation of hematite and goethite in equilibrium with NH4H2PO4 reaction solutions in the presence of AlCl3 and saturation indices (SI) with respect to different iron phosphate phases of NH4H2PO4 reaction solutions after equilibration with hematite and goethite, Table S3: Main solution speciation of hematite in equilibrium with NH4H2PO4 reaction solutions in the presence of citrate and saturation indices (SI) with respect to different iron phosphate phases of NH4H2PO4 reaction solutions after equilibration with hematite, Table S4: Main solution speciation of goethite in equilibrium with NH4H2PO4 reaction solutions in the presence of citrate and saturation indices (SI) with respect to different iron phosphate phases of NH4H2PO4 reaction solutions after equilibration with goethite.

Author Contributions

L.W., and C.V.P. conceived and designed the experiments; L.W., C.V.P., and J.H. performed the experiments; L.W., J.H. and A.P. analyzed the data; L.W., and C.V.P. wrote the paper.

Acknowledgments

This work was supported by the National Natural Science Foundation of China (41471245 and 41071208), the Fundamental Research Funds for the Central Universities (2662015PY206 and 2662017PY061). C.V.P. and A.P. acknowledge funding through the EU seventh Framework Marie S. Curie ITNs: Minsc; CO2 react; and Flowtrans. J.H. acknowledges the financial support of the Helmholtz Recruiting Initiative to Liane G. Benning.

Conflicts of Interest

The authors declare no conflict of interest.

References

  1. Filippelli, G.M. The global phosphorous cycle: Past, present, and future. Elements 2008, 4, 89–95. [Google Scholar] [CrossRef]
  2. Shen, J.B.; Yuan, L.; Zhang, J.L.; Li, H.; Bai, Z.; Chen, X.; Zhang, W.; Zhang, F.S. Phosphorus dynamics: From soil to plant. Plant Physiol. 2011, 156, 997–1005. [Google Scholar] [CrossRef] [PubMed]
  3. Gilbert, N. The disappearing nutrient. Nature 2009, 461, 716–718. [Google Scholar] [CrossRef] [PubMed]
  4. Wang, L.J.; Ruiz-Agudo, E.; Putnis, C.V.; Menneken, M.; Putnis, A. Kinetics of calcium phosphate nucleation and growth on calcite: Implications for predicting the fate of dissolved phosphate species in alkaline soils. Environ. Sci. Technol. 2012, 46, 834–842. [Google Scholar] [CrossRef] [PubMed]
  5. Wang, L.J.; Putnis, C.V.; Ruiz-Agudo, E.; Hovelmann, J.; Putnis, A. In situ imaging of interfacial precipitation of phosphate on goethite. Environ. Sci. Technol. 2015, 49, 4184–4192. [Google Scholar] [CrossRef] [PubMed]
  6. Kwon, K.D.; Kubicki, J.D. Molecular orbital theory study on surface complex structures of phosphates to iron hydroxides: Calculation of vibrational frequencies and adsorption energies. Langmuir 2004, 20, 9249–9254. [Google Scholar] [CrossRef] [PubMed]
  7. Khare, N.; Hesterberg, D.; Martin, J.D. XANES investigation of phosphate sorption in single and binary systems of iron and aluminum oxide minerals. Environ. Sci. Technol. 2005, 39, 2152–2160. [Google Scholar] [CrossRef] [PubMed]
  8. Rahnemaie, R.; Hiemstra, T.; van Riemsdijk, W.H. Geometry, charge distribution, and surface speciation of phosphate on goethite. Langmuir 2007, 23, 3680–3689. [Google Scholar] [CrossRef] [PubMed]
  9. Weng, L.P.; Vega, F.A.; Van Riemsdijk, W.H. Competitive and synergistic effects in pH dependent phosphate adsorption in soils: LCD modeling. Environ. Sci. Technol. 2011, 45, 8420–8428. [Google Scholar] [CrossRef] [PubMed]
  10. Kim, J.; Li, W.; Philips, B.L.; Grey, C.P. Phosphate adsorption on the iron oxyhydroxides goethite, akaganeite, and lepidocrocite: A 31P NMR study. Energy Environ. Sci. 2011, 4, 4298–4305. [Google Scholar] [CrossRef]
  11. Liu, H.; Chen, T.; Frost, R.L. An overview of the role of goethite surfaces in the environment. Chemosphere 2014, 103, 1–11. [Google Scholar] [CrossRef] [PubMed] [Green Version]
  12. Jonasson, R.G.; Martin, R.R.; Giuliacci, M.E.; Tazaki, K. Surface reactions of goethite with phosphate. J. Chem. Soc. Faraday Trans. 1988, 1, 2311–2315. [Google Scholar] [CrossRef]
  13. Li, L.; Stanforth, R. Distinguishing adsorption and surface precipitation of phosphate on goethite (a-FeOOH). J. Colloid Interface Sci. 2000, 230, 12–21. [Google Scholar] [CrossRef] [PubMed]
  14. Ler, A.; Stanforth, R. Evidence for surface precipitation of phosphate on goethite. Environ. Sci. Technol. 2003, 37, 2694–2700. [Google Scholar] [CrossRef] [PubMed]
  15. Cornell, R.M.; Schwertmann, U. The Iron Oxides: Structure, Properties, Reactions, Occurrence and Uses, 2nd ed.; Wiley-VCH: Weinheim, Germany, 2003. [Google Scholar]
  16. Torrent, J. Interactions between phosphate and iron oxide. Adv. Geoecol. 1997, 30, 321–344. [Google Scholar]
  17. Parkhurst, D.L.; Appelo, C.A.J. Users Guide to PHREEQC (Version 2): A Computer Program for Speciation, Batch Reaction, One-Dimensional Transport, and Inverse Geochemical Calculations; Water-Resources Investigations Report 99-4259; US Geological Survey: Reston, VA, USA, 1999; 312p.
  18. Nriagu, J.O.; Dell, C.I. Diagenetic formation of iron phosphates in recent lake sediments. Am. Mineralogist 1974, 59, 934–946. [Google Scholar]
  19. Vieillard, P.; Tardy, Y. Stability fields of clays and aluminum phosphates: Parageneses in lateritic weathering of argillaceous phosphatic sediments. Am. Mineral. 1979, 64, 626–634. [Google Scholar]
  20. Putnis, A.; Putnis, C.V. The mechanism of reequilibration of solids in the presence of a fluid phase. J. Solid State Chem. 2007, 180, 1783–1786. [Google Scholar] [CrossRef]
  21. Putnis, A. Why mineral interfaces matter. Science 2014, 343, 1441–1442. [Google Scholar] [CrossRef] [PubMed]
  22. Giuffre, A.J.; Hamm, L.M.; Han, N.; De Yoreo, J.J.; Dove, P.M. Polysaccharide chemistry regulates kinetics of calcite nucleation through competition of interfacial energies. Proc. Natl. Acad. Sci. USA 2013, 110, 9261–9266. [Google Scholar] [CrossRef] [PubMed]
  23. Ruiz-Agudo, E.; Kowacz, M.; Putnis, C.V.; Putnis, A. The role of background electrolytes on the kinetics and mechanism of calcite dissolution. Geochim. Cosmochim. Acta 2010, 74, 1256–1267. [Google Scholar] [CrossRef]
  24. Stack, A.G. Molecular dynamics simulations of solvation and kink site formation at the {001} barite-water interface. J. Phys. Chem. C 2009, 113, 2104–2110. [Google Scholar] [CrossRef]
  25. Qin, L.H.; Zhang, W.J.; Lu, J.W.; Stack, A.G.; Wang, L.J. Direct imaging of nanoscale dissolution of dicalcium phosphate dihydrate by an organic ligand: Concentration matters. Environ. Sci. Technol. 2013, 47, 13365–13374. [Google Scholar] [CrossRef] [PubMed]
  26. Qin, L.H.; Wang, L.J.; Wang, B.S. Role of alcoholic hydroxyls of dicarboxylic acids in regulating nanoscale dissolution kinetics of dicalcium phosphate dihydrate. ACS Sustain. Chem. Eng. 2017, 5, 3920–3928. [Google Scholar] [CrossRef]
  27. Matzapetakis, M.; Raptopoulou, C.P.; Tsohos, A.; Papaefthymiou, V.; Moon, S.N.; Salifoglou, A. Synthesis, spectroscopic and structural characterization of the first mononuclear, water soluble iron-citrate complex, (NH4)5Fe(C6H4O7)2·2H2O. J. Am. Chem. Soc. 1998, 120, 13266–13267. [Google Scholar] [CrossRef]
  28. Fischer, C.; Karius, V.; Weidler, P.G.; Lüttge, A. Relationship between micrometer to submicrometer surface roughness and topography variations of natural iron oxides and trance element concentration. Langmuir 2008, 24, 3250–3266. [Google Scholar] [CrossRef] [PubMed]
Figure 1. AFM time sequence (deflection images) showing in situ nucleation kinetics of Fe-P phases and the growth evolution of precipitates on dissolving (AC) hematite and (DF) goethite surfaces in 50 mM NH4H2PO4 (pH 4.5). Images (AF), 5 μm × 5 μm. Height profile of the initially formed Fe-P nanoparticles (circled for clarity in (B or E)) on a (G) hematite along section a → b (dashed line in (C)) or (H) goethite face along section c → d (dashed line in (F)). The average height of Fe-P nanoparticles is about 1.0–4.0 nm, and was almost unchanged in a short period (150 min) of reaction time. (I) Kinetic analysis of surface nucleation of Fe-P phases on hematite and goethite substrates in short periods of reaction times in 50 mM NH4H2PO4 at pH 4.5, showing linear scaling of surface nucleation with time and dependence of the nucleation rate given by slopes of the lines (the solid line is a linear fit to the AFM data (the number of nucleated particles in a short time period)). Vertical error bars (the standard deviation of the mean) correspond to the variation in measured number of nucleated particles in three different areas in each experiment.
Minerals 08 00207 g001
Figure 2. Ex situ AFM images of the same (A) hematite and (B) goethite substrate as the above (Figure 1), reacting in solutions (50 mM NH4H2PO4, pH 4.5) for 3 days at room temperature.
Minerals 08 00207 g002
Figure 3. Following (A) 10 min, particles initially formed, and after (B) 48 min of injecting reaction solution (50 mM NH4H2PO4, pH 2.0), the scan area (5 μm × 5 μm) on hematite was covered with a larger number of the new nucleating particles, compared with 50 mM NH4H2PO4 reaction solution at pH 4.5 after the same reaction time in Figure 1I.
Minerals 08 00207 g003
Figure 4. AFM time sequence (deflection images) showing in situ nucleation kinetics of Fe-P phases on a dissolving goethite surface in 50 mM NH4H2PO4 (pH 2.0) at (A) t = 0 min, (B) 32 min, and (C) 16 h, respectively. (D) A zoom of a dotted rectangle in (C) showing Fe-P nanoparticles on a goethite (010) cleavage face and (E) inter-particle distances (218 ± 43 nm). (F) Height profile for Fe-P nanoparticles on a goethite (010) cleavage face along section a → b (dashed line in (E)). The average height of Fe-P nanoparticles is about 2.0–4.0 nm. AFM images, (A) 5 μm × 5 μm; (B,C) 10 μm × 10 μm; (D,E) 3 μm × 3 μm.
Minerals 08 00207 g004
Figure 5. AFM images of fast nucleation of Fe-P particles formed on (AC) hematite or (DF) goethite surfaces after injecting 50 mM NH4H2PO4 + 10 mM AlCl3 (pH 4.5). The scan area was almost fully covered with the nucleating fine nanoparticles following 29-min-reaction, passivating the reacting surface of goethite. AFM images, 5 μm × 5 μm.
Minerals 08 00207 g005
Figure 6. Nucleation kinetics of Fe-P phases on hematite in the presence of (AD) 1.0 μM citrate and (E,F) 10.0 μM citrate with 50 mM NH4H2PO4 at pH 4.5. AFM images, 5 μm × 5 μm.
Minerals 08 00207 g006
Figure 7. Nucleation kinetics of Fe-P phases on goethite in the presence of (AC) 1.0 μM citrate and (D,E) 50 μM citrate with 50 mM NH4H2PO4 at pH 4.5. AFM images, (A,B) 5 μm × 5 μm; (CE) 10 μm × 10 μm.
Minerals 08 00207 g007
Figure 8. (A,B) SEM images showing the ex situ formation of Fe-P precipitates on hematite after 3 days of interfacial reaction in a 50 mM NH4H2PO4 (pH 4.5) solution. The hematite substrate was almost fully covered with a thick layer of precipitates. The dotted rectangles in (B) indicate areas chosen for EDX analyses. (C) EDX spectra taken from zone 1 and 2 shown by dotted rectangles in (B), indicating an iron phosphate phase and a hematite substrate, respectively.
Minerals 08 00207 g008
Figure 9. (A) SEM image showing the ex situ formation of Fe-P precipitates on goethite after 3 days of interfacial reaction in a 50 mM NH4H2PO4 (pH 4.5) solution. The goethite substrate was covered with a thin layer of precipitates. The dotted rectangles in (A) indicate areas chosen for EDX analyses. (B) EDX spectra taken from zone 1 and 2 shown by dotted rectangles in (A), indicating an iron phosphate phase and a goethite substrate, respectively.
Minerals 08 00207 g009

