


Abstract
Pyrite is a common mineral with a higher density than most other minerals in the Eagle Ford Shale formation. Hence, if pyrite is not considered in the total organic carbon (TOC) estimation, based on density logs, it may lead to errors. In order to improve the accuracy of the TOC estimation, we propose an updated TOC estimation method that incorporates the concentration of pyrite and organic porosity. More than 15 m of Eagle Ford Shale samples were analyzed using Rock-Eval pyrolysis, X-ray fluorescence (XRF), and X-ray diffraction (XRD). TOC, elemental concentration, and mineralogical data were analyzed for a better understanding of the relationship between the concentration of TOC and pyrite content in the Eagle Ford formation. An updated petrophysical model—including parameters such as organic pores, solid organic matter, inorganic pores, pyrite, and inorganic rock matrix without pyrite—was built using the sample data from the Eagle Ford. The model was compared with Schmoker’s model and validated with the Eagle Ford field data. The results showed that the updated model had a lower root mean square error (RMSE) than Schmoker’s model. Therefore, it could be used in the future estimation of TOC in pyrite-rich formations.
1. Introduction
Total organic carbon (TOC) is a fundamental parameter that is critical in evaluating the hydrocarbon generating potential of source rocks [1]. TOC can be obtained directly from Rock-Eval pyrolysis or similar experiments in a laboratory, or it can be obtained indirectly from well logging techniques, such as density logs. Geophysical methods are possible because, in most cases, increasing concentrations of organic matter in a rock directly affects the rock’s physical properties by lowering density, slowing sonic velocity, increasing radioactivity (as several radioactive elements are associated with organic matter), and raising hydrogen contents. The geophysical TOC estimation methods can be divided into two categories: single-well log methods and multi-well logs methods, as shown in Table 1.
Table 1.
Summary of log-based total organic carbon (TOC) estimation methods.
Overall, the geophysical property that is most widely applied in identifying source rocks and estimating TOC is anomalously high gamma-ray values [2,3,4,5,6]. Schmoker [3] proposed a relationship between total gamma-ray intensity and organic richness in Devonian-age Appalachian shales. Although a valuable approach, it was concluded that the gamma ray method significantly underestimated organic richness in some intervals. Moreover, established relationships between TOC and gamma-ray intensity often changed from one region to the next. Fertl [4,5] summarized the potassium, thorium, and uranium distributions in shales, suggesting correlations between these elements and elemental ratios (U, Th, K, and Th/U), and organic richness. This approach is also valuable, but has to be calibrated for the region of interest. Estimating TOC with density logs is another well-accepted method [7,8,9,10,11]. Equations, including bulk density, have been derived in building petrophysical models containing different components of the shale formation. For example, Schmoker [7,8] estimated the organic carbon of the Bakken Formation, based on density data, with a four-component shale system assumption. Alfred and Vernik [11] took maturation-induced pores in kerogen and inorganic pores into consideration and estimated organic content and total porosity based on density data.
Zhao [12] established a clay indicator to reflect the clay content using density and neutron logs and then overlaid the scaled clay indicator curve on the gamma-ray curve to help estimate the TOC value. The Passey’s ΔlogR method [13] is a graphical porosity–resistivity overlay technique, which was developed in 1990 and is still widely used. It was originally developed using acoustic compressional slowness but also worked with density or compensated neutron measurements. Wang [14] and Zhao [15] improved the TOC estimation accuracy through a revised ΔlogR method. The revisions included replacing the level of maturity (LOM) with Tmax, making the slope and the values of resistivity and porosity of the baseline rock vary with depth, and so on. Autric [19] used resistivity and sonic logs to evaluate the organic richness. Since the presence of organic matter has had an impact on various petrophysical logs, Mendelson et al. [16] used a multivariate regression analysis to predict TOC with a combination of logs, including sonic, density, neutron, and gamma-ray logs. The derived equations could only be applied to specific wells or locations, since no similarities among multivariate equations were observed in the different wells [20]. The application of artificial intelligence techniques (neural networks, support vector machines, etc.) have also been successfully used in the prediction of TOC concentrations. Artificial intelligence techniques are more advanced than simple regression techniques or statistical correlations, but require large data sets with complicated regression computations [18].
It is challenging when many of the above mentioned methods are applied in shale formations with large amounts of heavy minerals, such as pyrite (FeS2). Pyrite becomes a problem in formation evaluation when it occurs in sufficiently large quantities and its distinctive physical properties influence downhole log responses [21,22]. Clavier [23] mentioned that the measured rock resistivity is influenced by the distribution of pyrite and the frequency of resistivity logging tools. Pyrite has a high mass and electron density, such that it can distort the readings of density and neutron logs, which are frequently calibrated to typical silicate or carbonate mineralogy [24]. Witkowsky [25] achieved a good correlation between TOC and sulfur in the Haynesville Shale and showed that the high volume percent of pyrite greatly affected the grain density and resistivity. To address this challenge, we used the Eagle Ford Shale as an example to develop an advanced method for estimating TOC, which considered pyrite concentration.
2. Experimental Methods
More than 15 m of the Eagle Ford core samples, including samples from the upper and lower Eagle Ford formation, were analyzed with X-ray fluorescence (XRF), X-ray diffraction (XRD), and Rock-Eval pyrolysis experiments. The top section of the underlying Buda Limestone was also tested since it could be seen as a boundary of limestone with the lowest TOC content.
Elemental concentrations of Mg, Al, Si, Ti, Cr, Mn, Fe, Zn, P, V, Ni, Ca, Cl, K, Rb, Sr, and Mo were measured using hand-held XRF Analyzers (Thermo Fisher Scientific, Waltham, MA, USA). Standard samples and replications of several points were tested to ensure the accuracy and repeatability of the XRF experimental results.
The mineralogy of the samples was identified using a MiniFlex 600 X-ray diffractometer (Rigaku, Tokyo, Japan) instrument. The bulk samples were ground into a fine powder by a ball mill and then filled in a sample holder. The X-ray tube was set at 40 kV and 15 mA and the sample powder was scanned over the range of 5–85°. The equipment performance was checked routinely with Standard Reference Material 640e (SRM 640e) silicon power and a Si setting jig.
Approximately 55 mg of the rock powder from each sample was used for analysis on the Rock-Eval 6 analyzer from Vinci Technologies (Nanterre, France). During pyrolysis, the crushed rock samples were heated from 300 °C to 650 °C at a rate of 25 °C/min in a helium atmosphere. The parameters, which included TOC, S1 (free oil and gas, mg HC/g rock), S2 (hydrocarbon generated during thermal cracking of the sample kerogen, mg HC/g rock), S3 (CO and CO2 from the thermal cracking of oxygen-bearing functional groups within the kerogen, mg CO2/g rock), and Tmax (temperature of the maximum hydrocarbon generation, °C), were measured and recorded. After pyrolysis, the samples were automatically transferred to an oxidation oven to measure the residual carbon and mineral carbon.
3. Pyrolysis Results of the Eagle Ford Shale Samples
The pyrolysis results of the Eagle Ford Shale samples are presented in Appendix A. These data were used for the interpretation of the kerogen type, source rock generative potential, and degree of maturation [26,27,28,29].
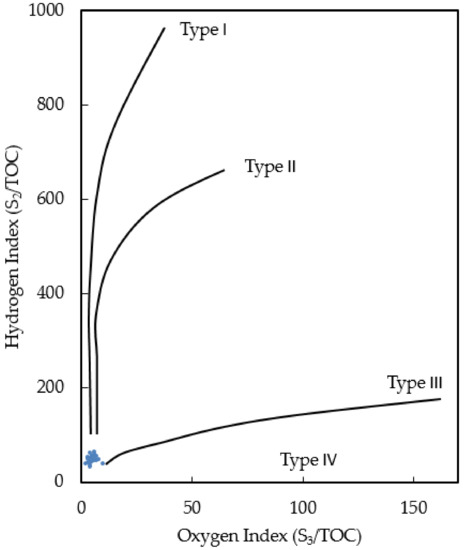
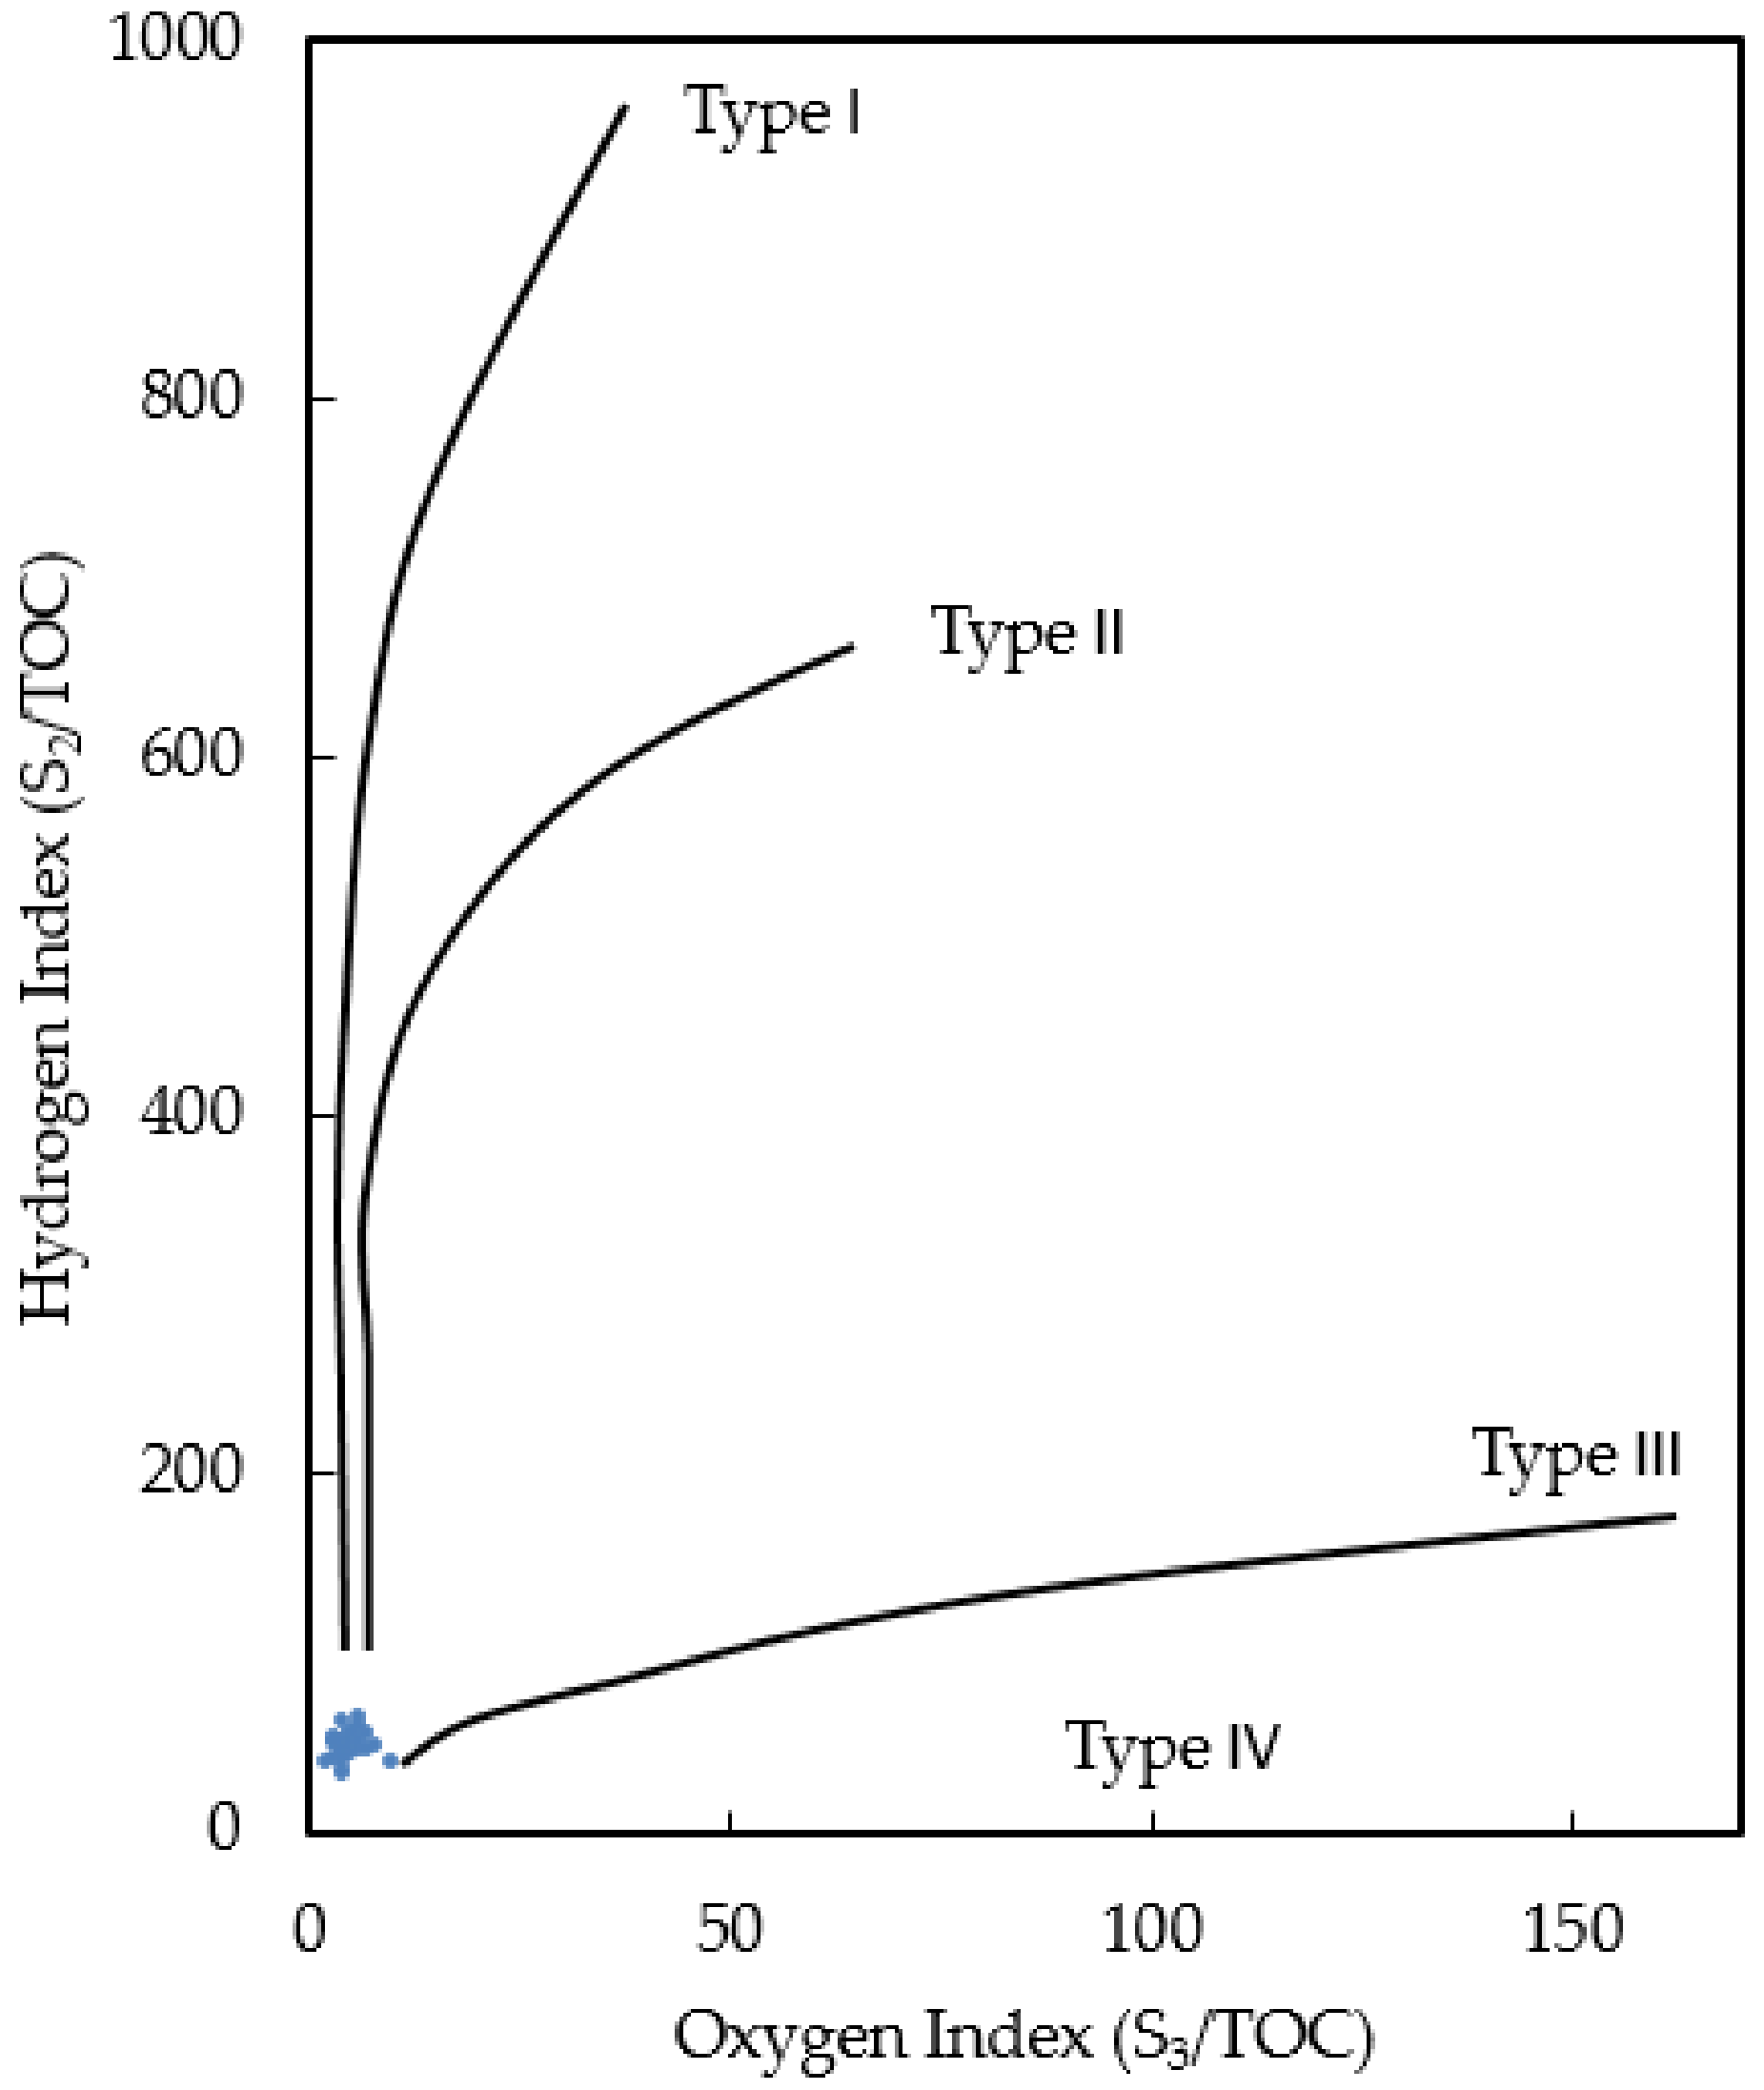
It can be seen from the modified van Krevelen diagram (Figure 1) that the hydrogen index (HI) and oxygen index (OI) of the measured Eagle Ford samples were very low. The Eagle Ford organic rich shales were originally dominated by Type II kerogen [30,31], but most of the generative potential of these samples was lost because they were overly mature [28,32]. With increasing maturation, HI and OI of kerogen decreased. During the maturation process, a large amount of hydrocarbon was produced and expelled from kerogen.
Figure 1.
Modified van Krevelen diagram of the Eagle Ford Shale samples.
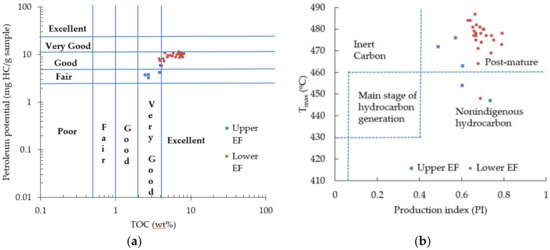
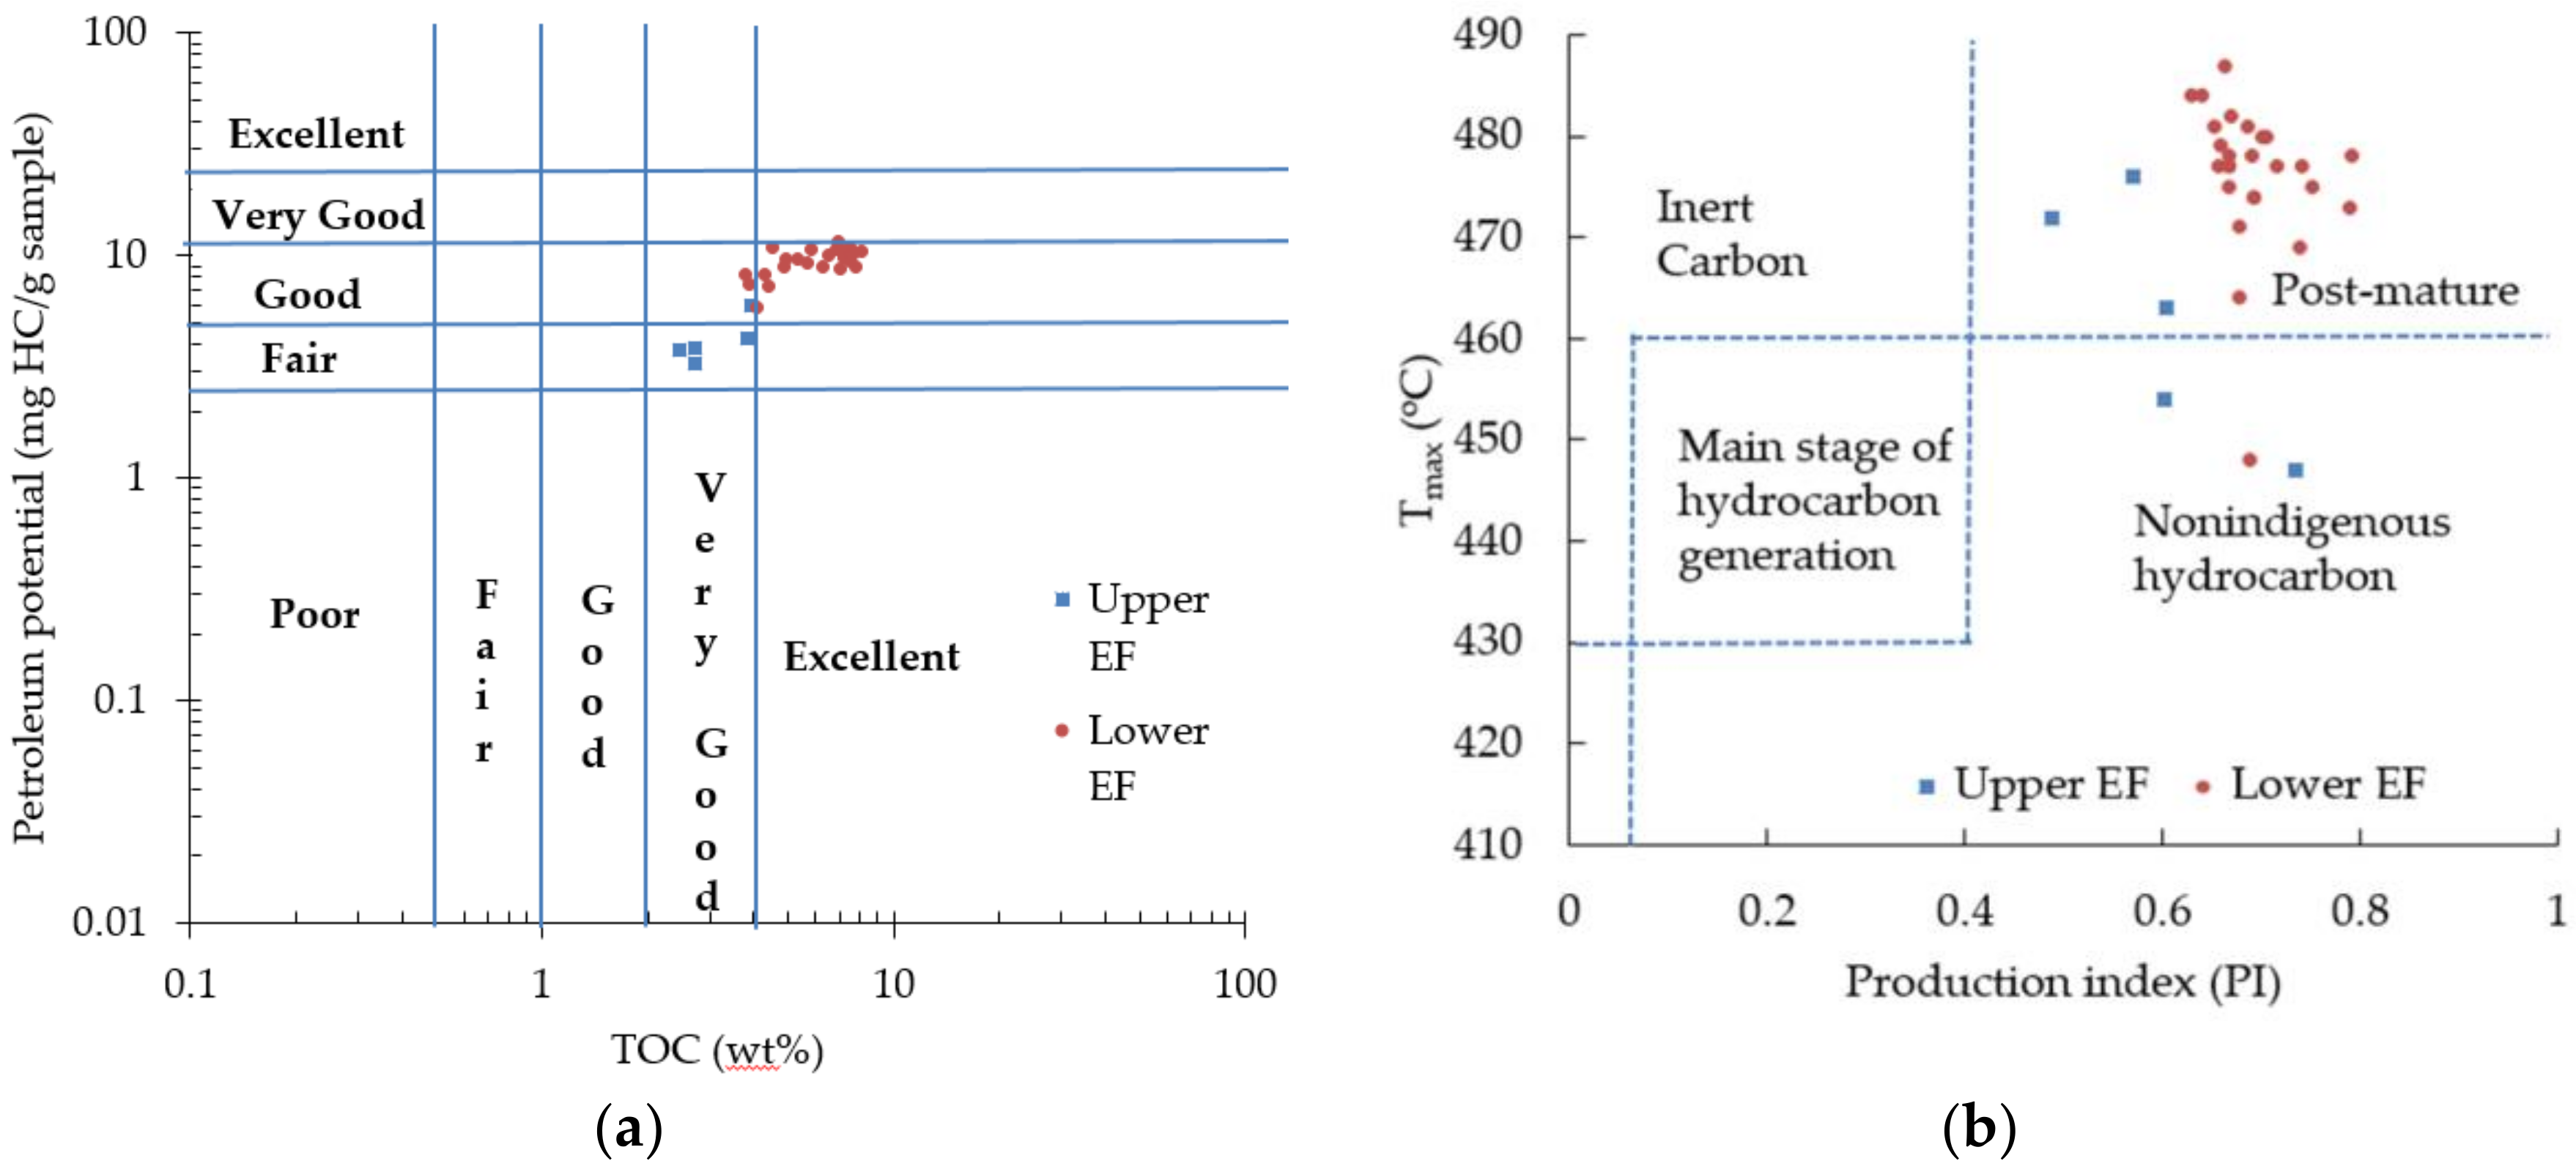
As is shown in Figure 2a, the lower Eagle Ford samples were excellent source rocks with good petroleum potential (i.e., high S1 + S2), while the upper Eagle Ford samples were very good source rocks with fair hydrocarbon generative potential. It is clear that these Eagle Ford samples had entered the post-mature zone for hydrocarbon generation (Figure 2b).
Figure 2.
Source rock potential and maturation of the Eagle Ford (EF) Shale. (a) Plot of total organic carbon (TOC) versus petroleum potential; (b) plot of production index versus Tmax.
4. Relationship between TOC and Pyrite in the Eagle Ford
Pyrite (FeS2) is a common heavy mineral that indicates reducing conditions. It is formed through the reaction between reactive iron and H2S that is produced by a bacterial sulfate reduction in anoxic water columns or in pore waters of sediments [33].
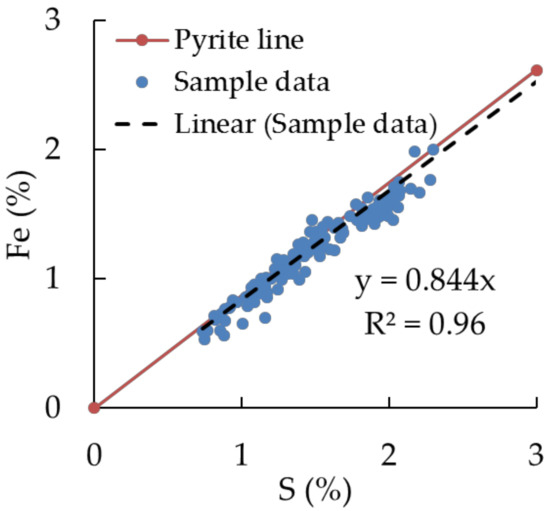
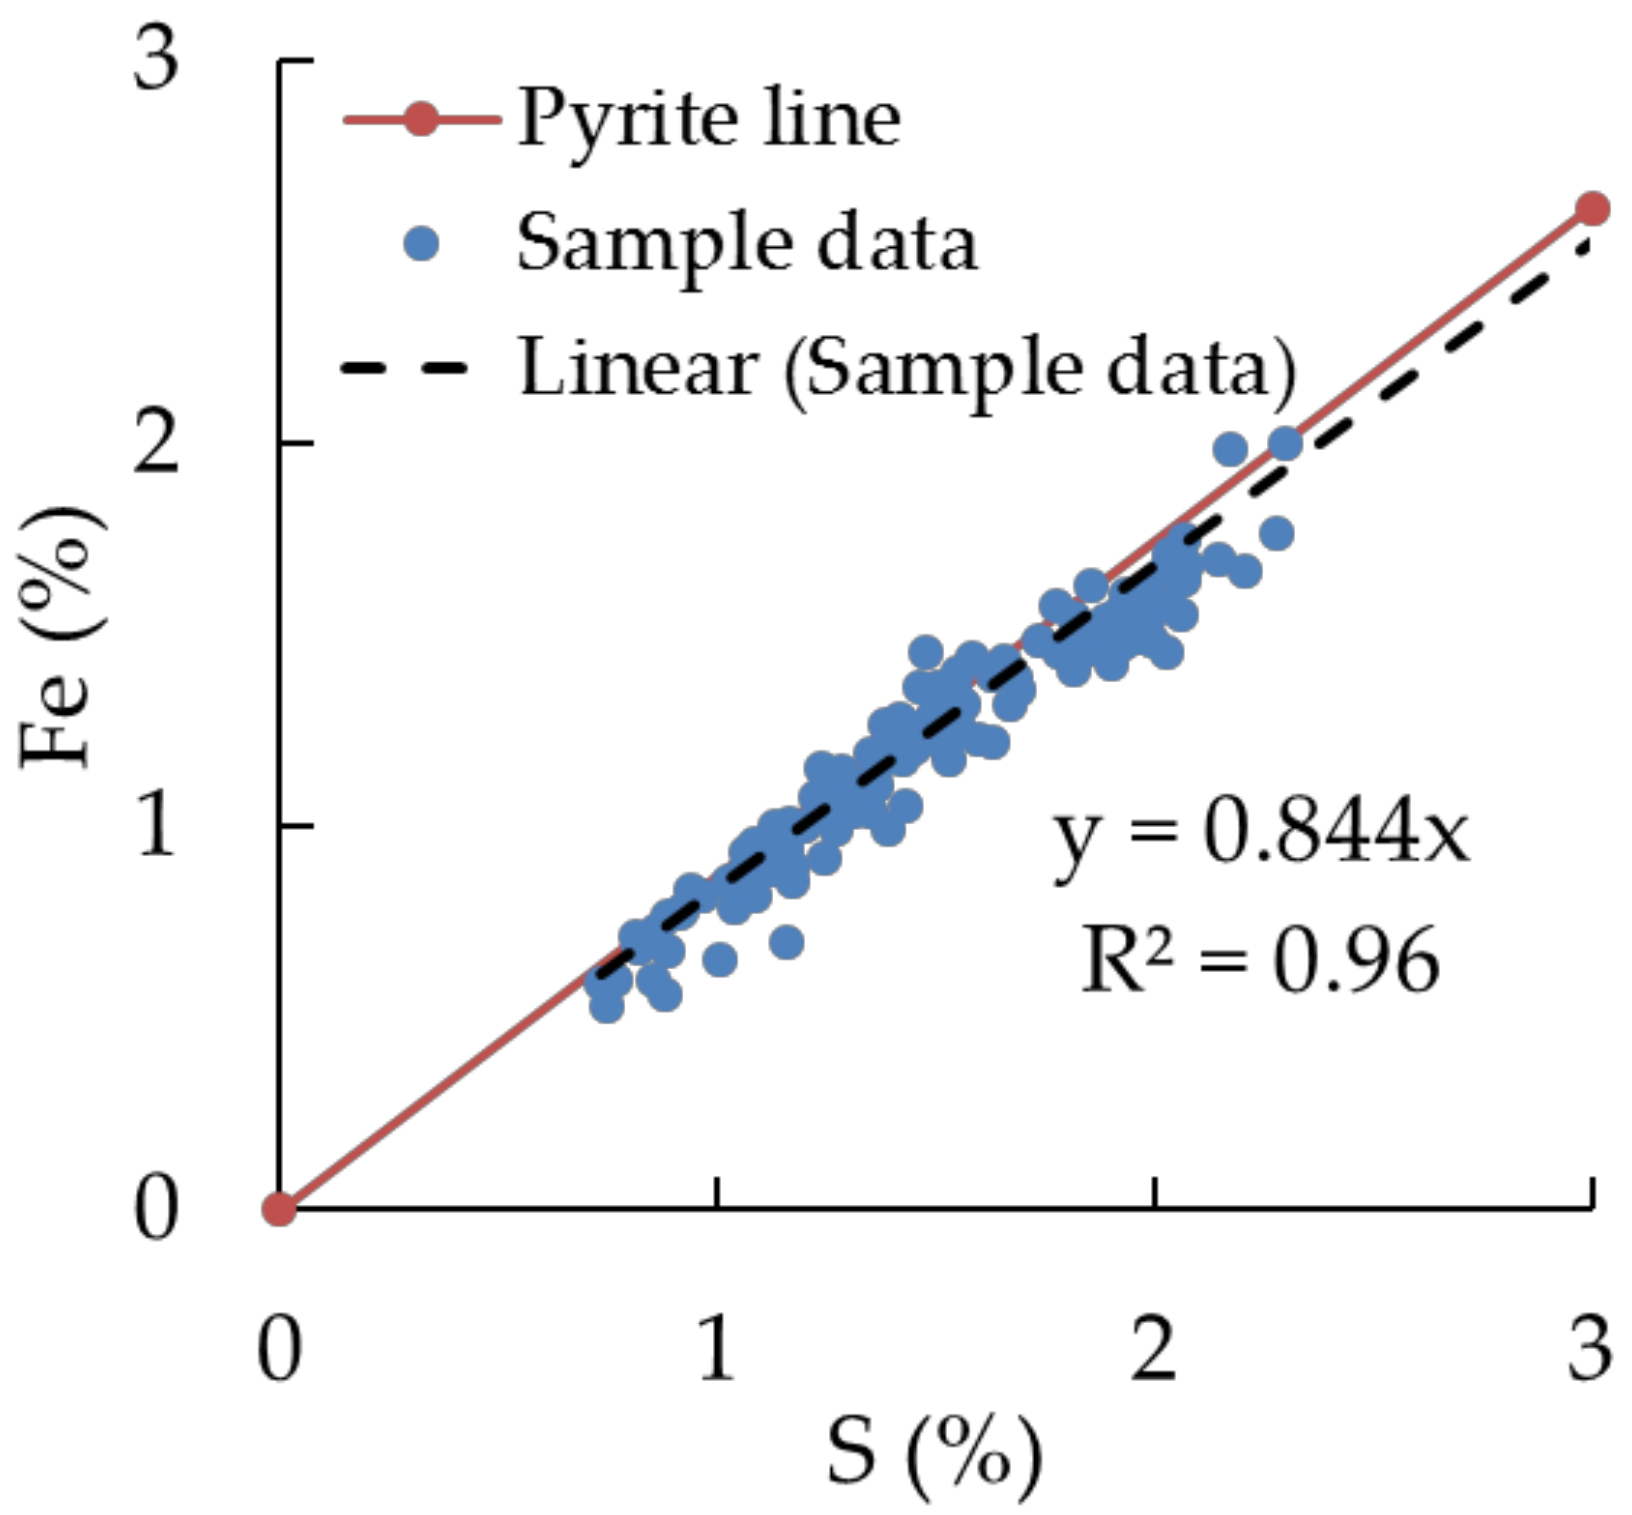
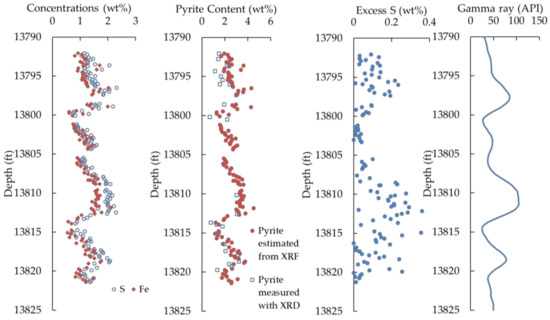
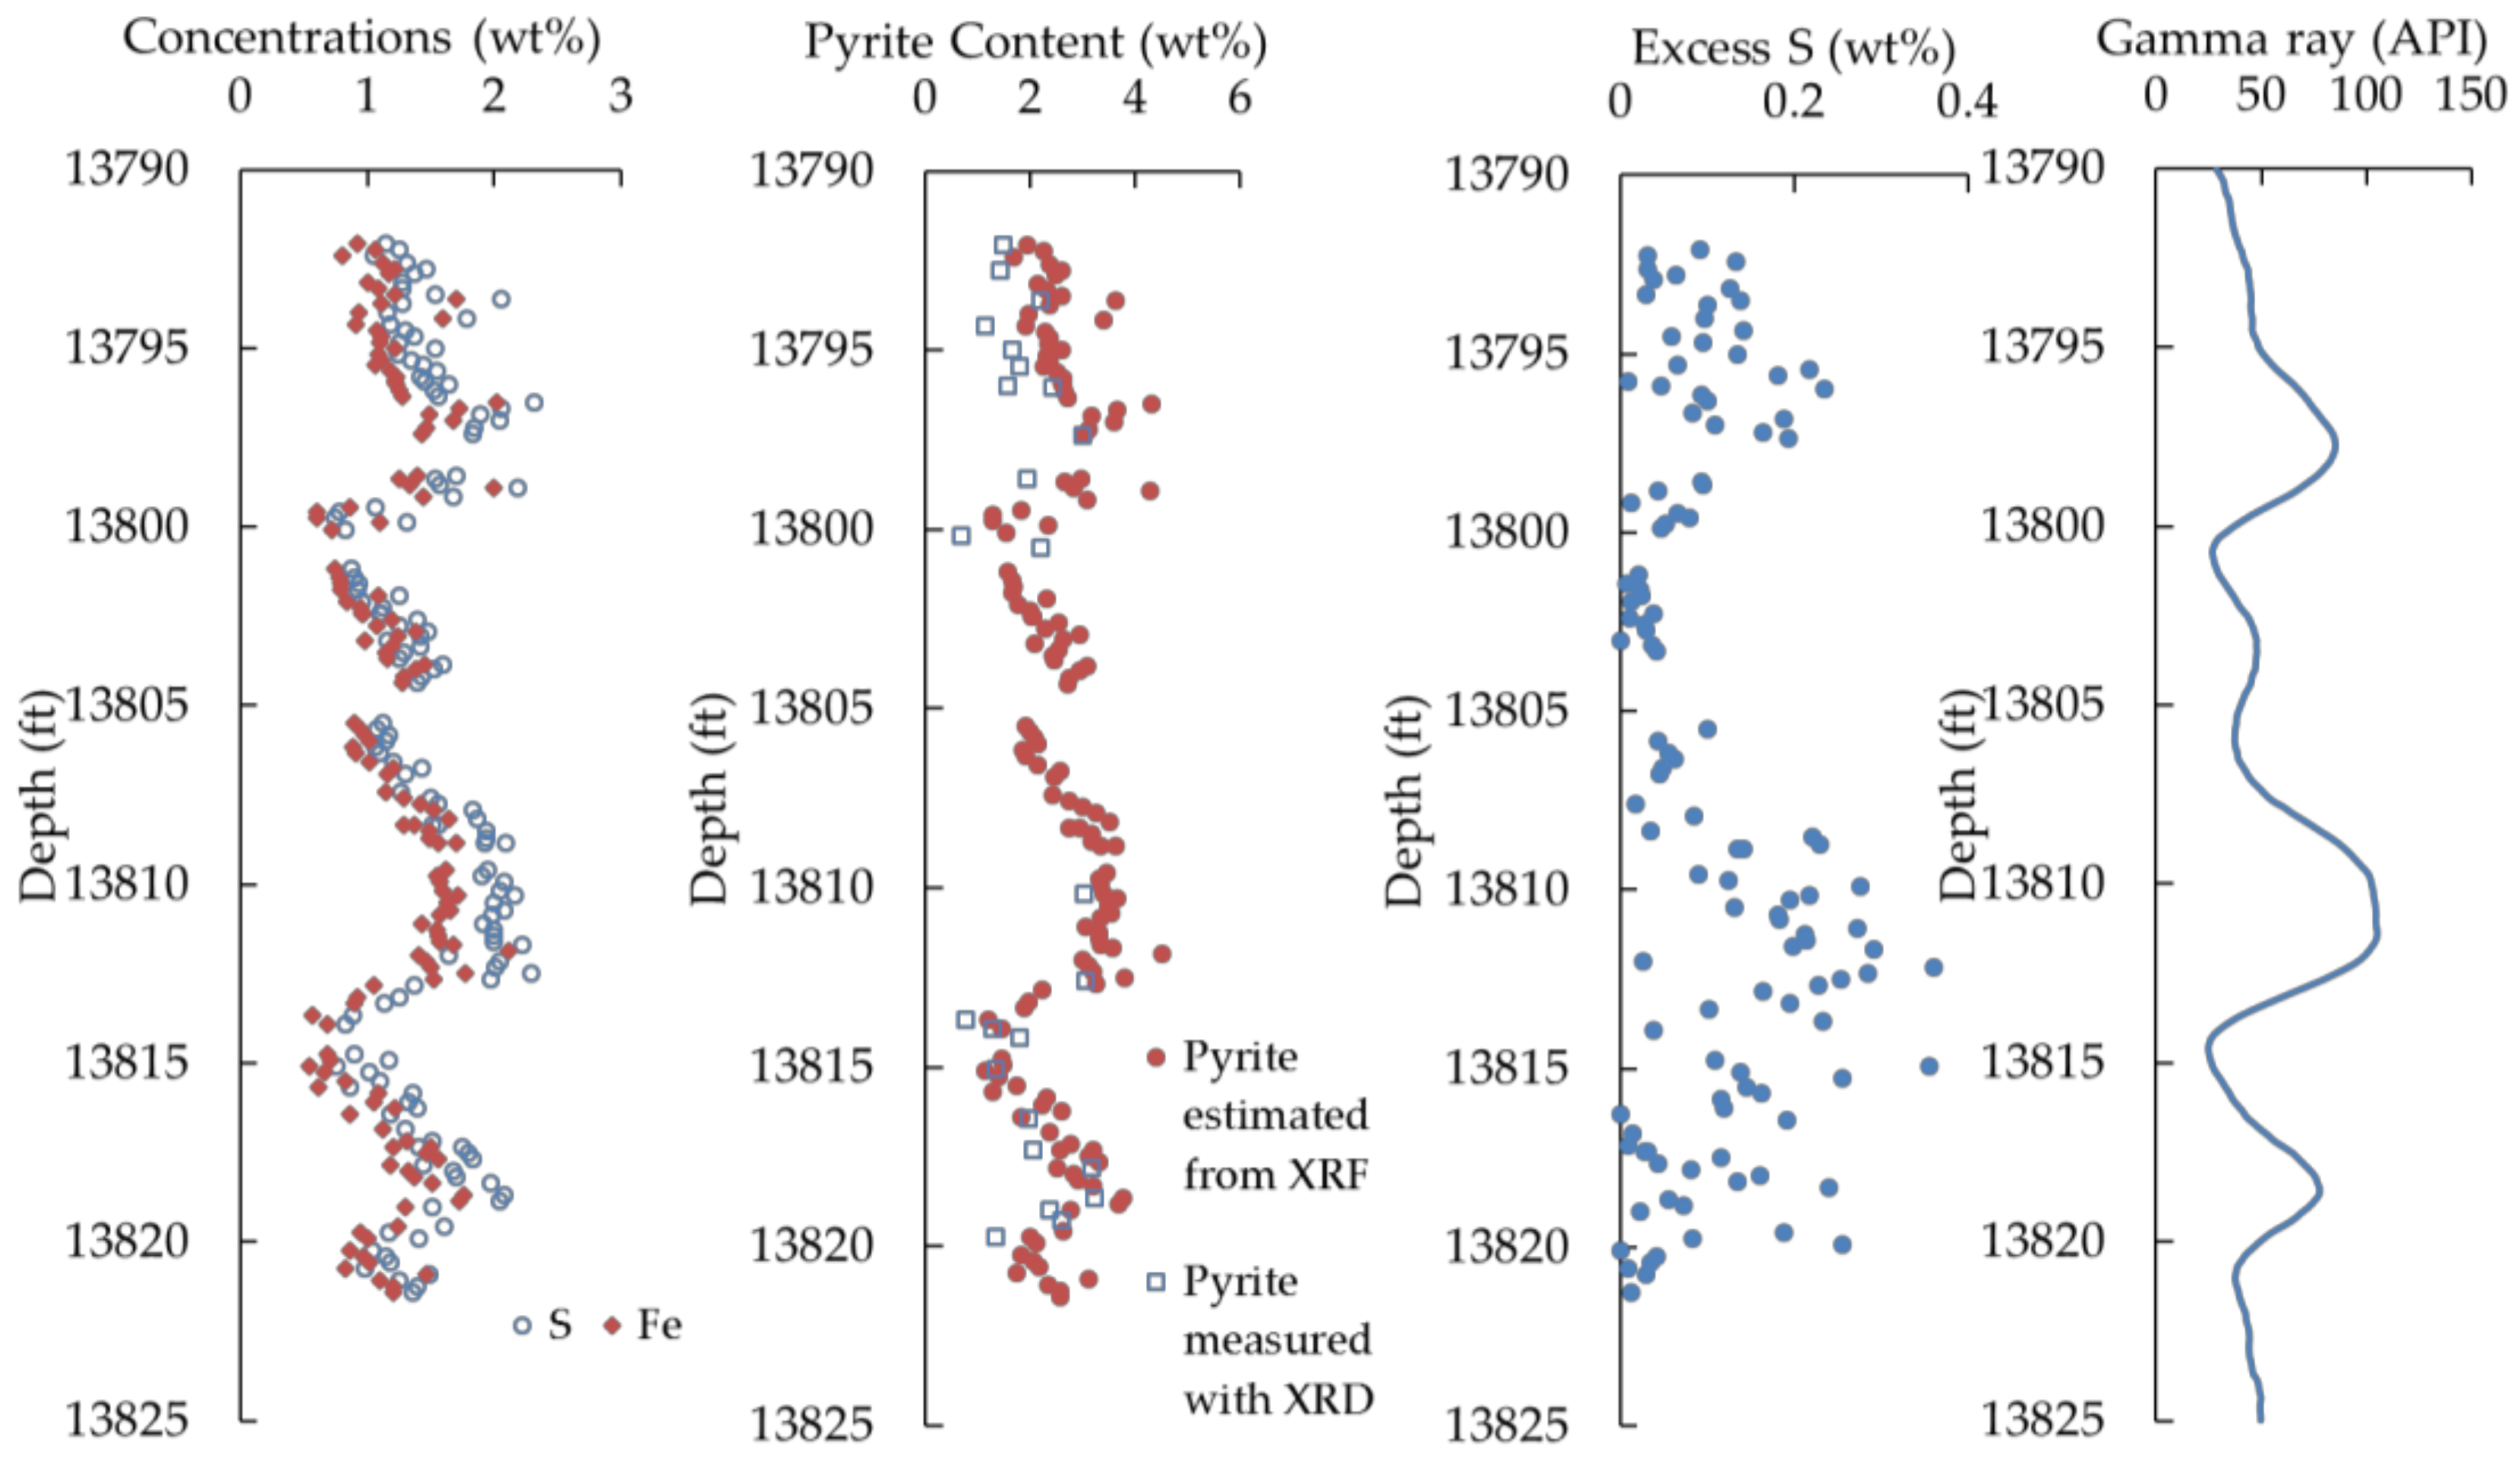
The correlation between Fe and S (determined via XRF) and the changes of concentrations of Fe and S with depth in shale samples are revealed in Figure 3 and Figure 4. It can be seen that there are some zones of excess S relative to Fe. The pyrite concentration can be estimated by assuming that all of the Fe is in the form of pyrite. This is a reasonable assumption because there is consistently more than enough S to combine with all of the Fe to form pyrite, and a strong correlation exists between the two elements that fit the pyrite formula (Figure 3). Figure 4 shows the obvious cyclic changes in Fe, S, and the estimated pyrite concentrations with regard to depth, corresponding to the changes of gamma-ray intensity. These cyclic changes of pyrite and residual S reflected the changing degrees of anoxia and regressive/transgressive ocean cycles [34]. Additionally, the measured pyrite content from the XRD analysis was close to the estimated pyrite content, based on Fe concentration, and showed a similar cyclic trend.
Figure 3.
Correlation between Fe and S concentrations in the Eagle Ford Shale (depth ranges from 13,790 ft to 13,825 ft).
Figure 4.
Changes of Fe and S concentrations, pyrite content, and residual S, corresponding to the gamma ray intensity changes in the Eagle Ford Shale (depth ranges from 13,790 ft to 13,825 ft). XRF—X-ray fluorescence.
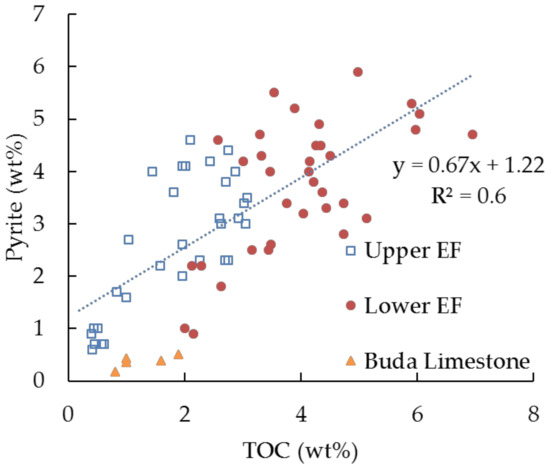
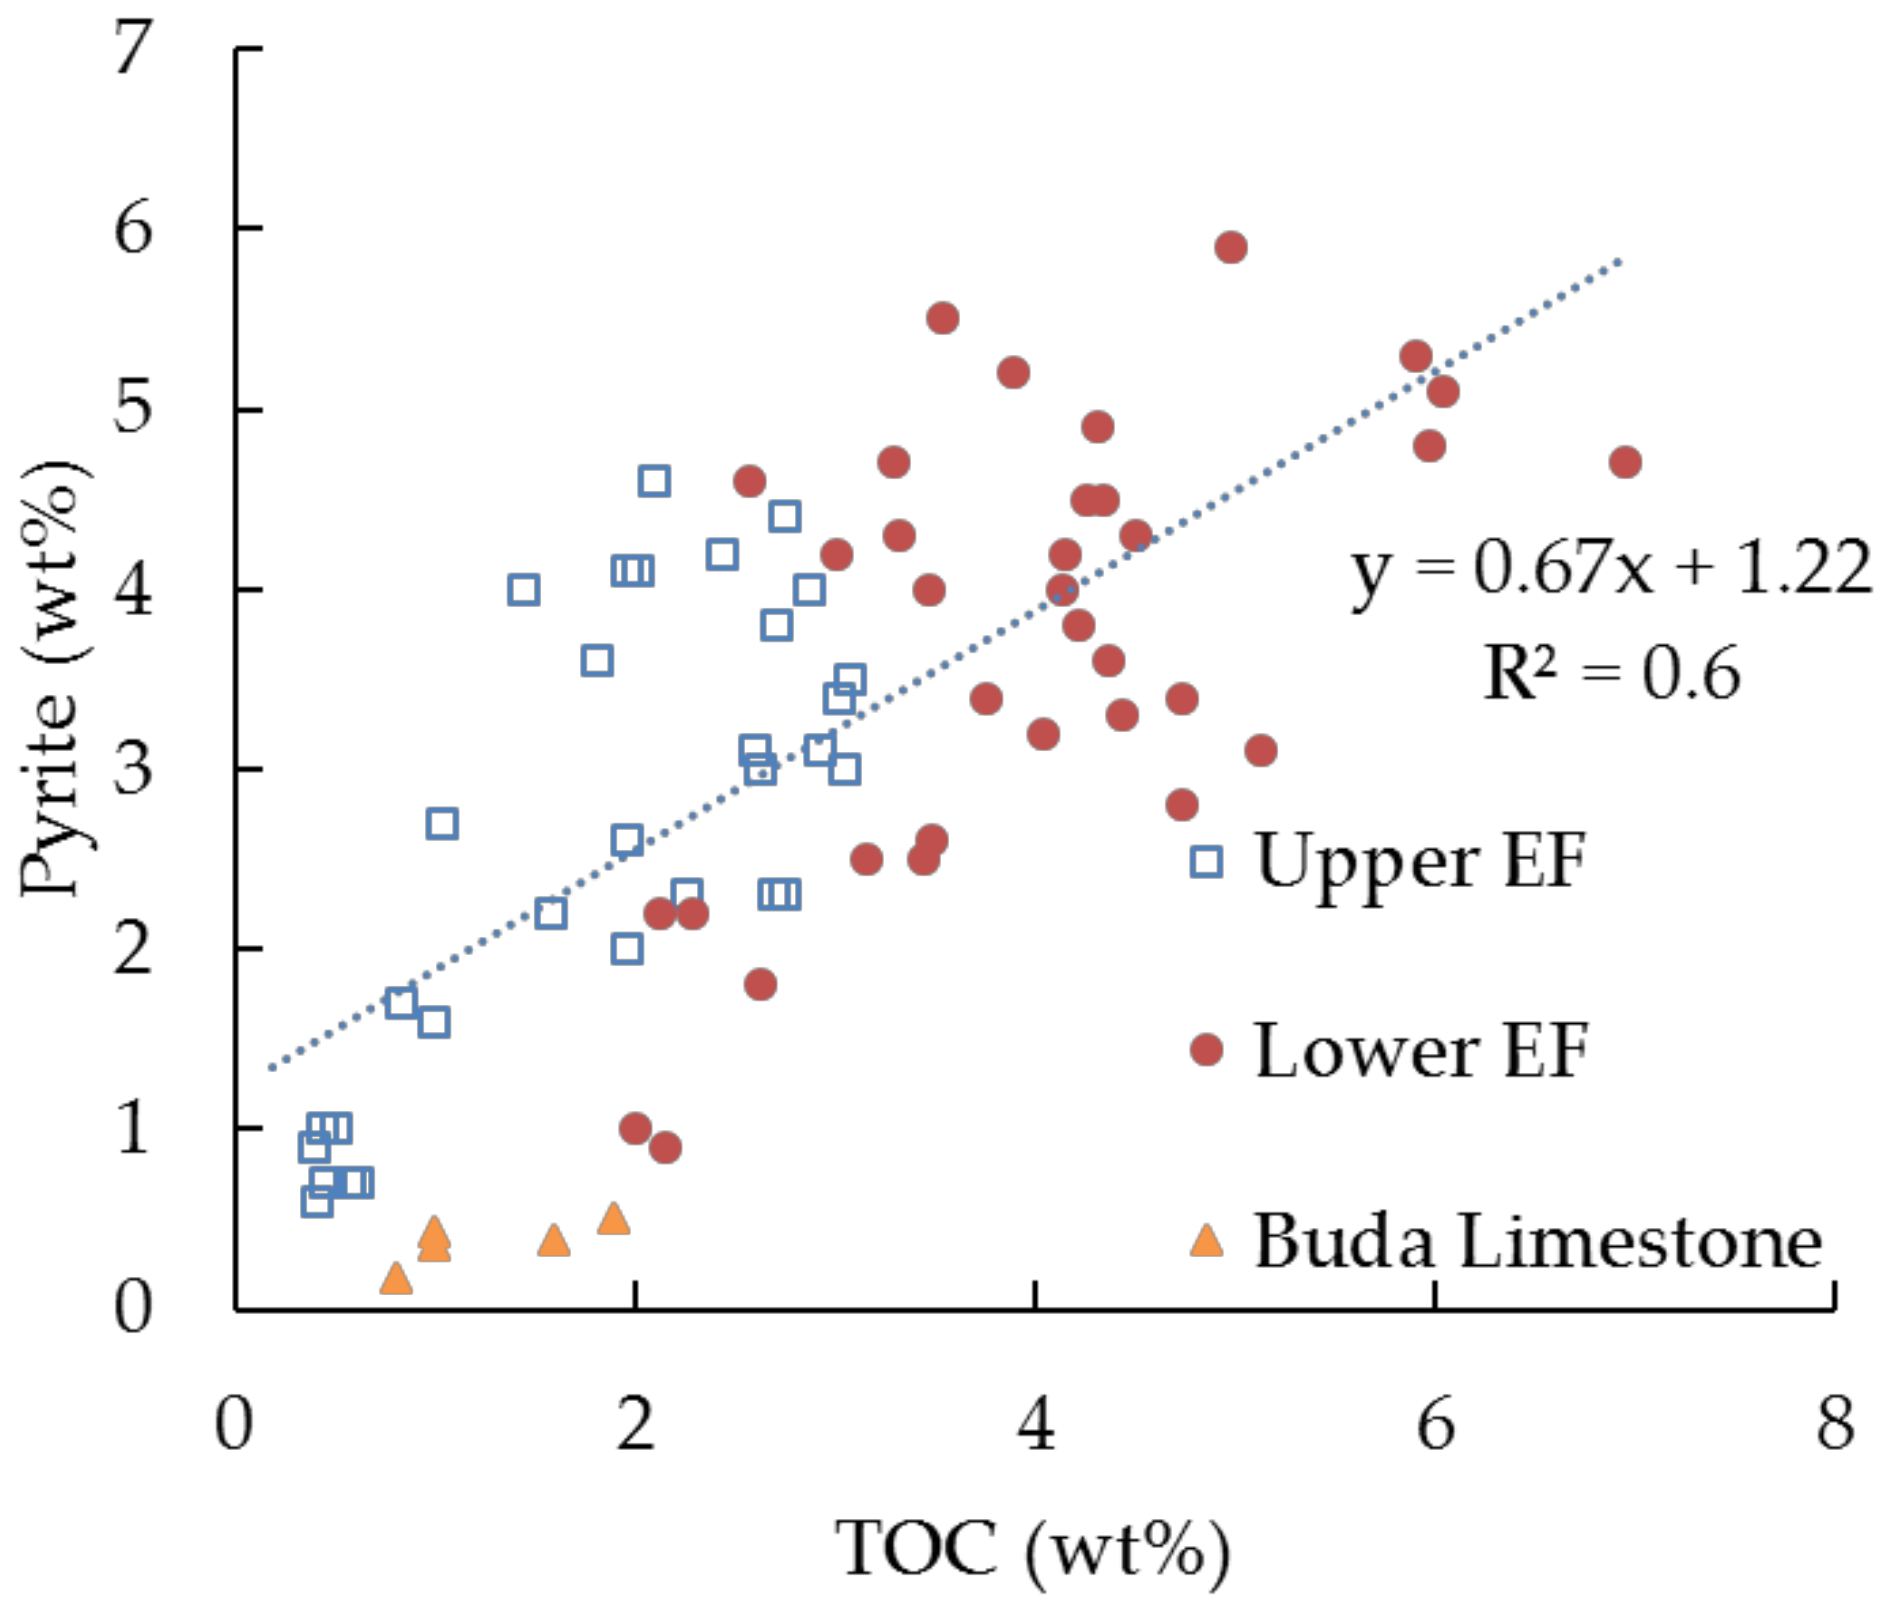
Through the XRD analyses, the pyrite content was measured in the upper and lower Eagle Ford Shale samples. It is illustrated in Figure 5 that there is a positive linear relationship between the amount of pyrite and TOC in the upper and lower Eagle Ford Shale formation. The top of the Buda Limestone section was also taken into consideration because it acted as the boundary with the lowest TOC content.
Figure 5.
Positive linear relationship between pyrite and TOC in the Eagle Ford Shale.
5. Petrophysical Model Considering Pyrite and Organic Porosity
Schmoker’s four-component system rock model [8] is a widely used model for estimating organic content using density logs. Schmoker’s model includes the following assumptions: (1) the volume-weighted average density of grain and pore fluid can be estimated accurately; (2) pore space includes all of the organic and inorganic pores in the rock matrix.
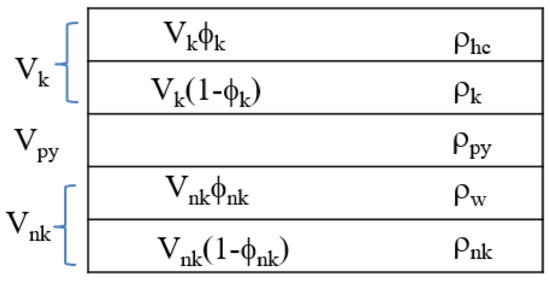
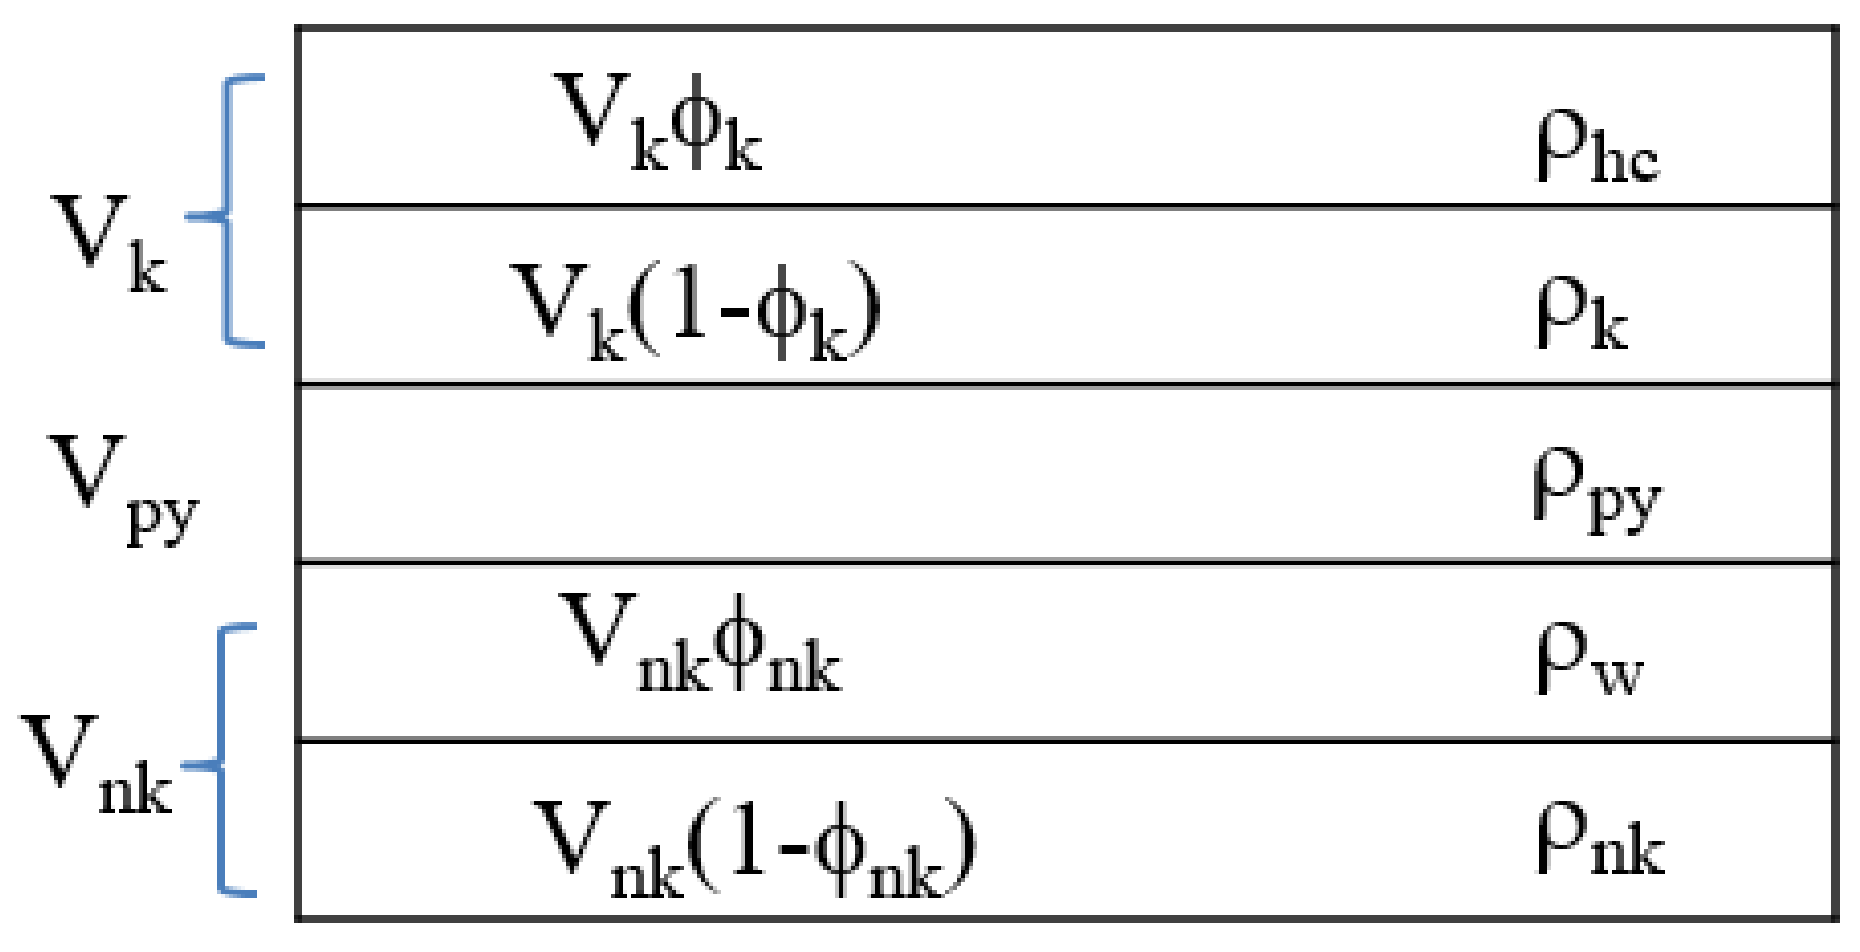
Here we developed an updated model where the rock was divided into five constituent parts, including organic pores, solid organic matter, pyrite, inorganic pores, and rock matrix without pyrite. Pyrite was broken out from the matrix since the pyrite content had a positive linear relationship with the TOC value, while other minerals in the rock matrix were not closely related to the concentration of TOC. This relationship was used to develop the updated model. With the assumption that the fluids in the organic and inorganic pores were hydrocarbons and water, respectively, the parameters of the petrophysical model were summarized (Figure 6).
where Vk, Vnk, and Vpy are the volume fractions of organic matter, inorganic rock without pyrite, and pyrite, respectively, dimensionless.
Figure 6.
Petrophysical model of the shale formation.
The bulk density can be expressed as follows:
where φk is the volume fraction of the organic pores in the organic matter, dimensionless; φnk is the volume fraction of the inorganic pores in the inorganic rock without pyrite, dimensionless; ρhc, ρk, ρpy, ρw, and ρnk are the densities of hydrocarbon in the organic pores, solid organic matter, pyrite, water in inorganic pores, and other rock matrix, respectively, g/cm3.
Parameter Vnk can be removed by substituting Equation (1) into Equation (2):
Equation (3) can be rearranged as follows:
Total organic carbon is expressed as follows:
where R is the ratio of the mass of organic matter to the mass of organic carbon, dimensionless.
The relationship between the pyrite content and TOC can be identified through laboratory experiments, as shown in Figure 5. When TOC and Wpy are expressed as fractions, the values of a and b are 0.67 and 0.0122 for the Eagle Ford formation, respectively.
Since Vpy is used in Equation (1) to Equation (4), the relationship between Vpy and Wpy needs to be derived to apply the correlation between pyrite content and TOC.
Combining Equation (6) and Equation (7) gives the following:
Finally, the relation between TOC and bulk density is achieved by substituting Vk in Equation (5) and Vpy in Equation (8) into Equation (4).
where
6. Discussion
The updated petrophysical model was compared with Schmoker’s model and validated with the Eagle Ford field data.
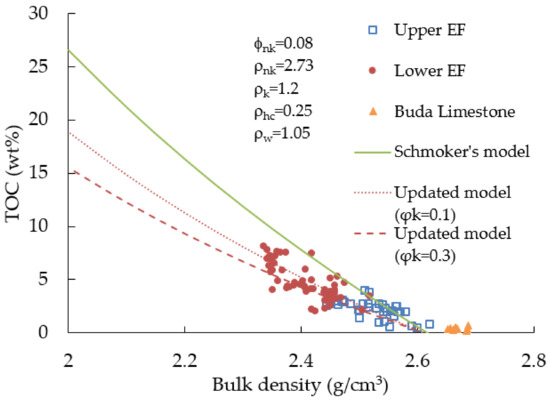
The average porosity of the Eagle Ford Shale in the condensate wet gas window and dry gas window was around 8% [35]. By plugging the porosity and density data, shown in Figure 7, into Equation (9), the organic content of the Eagle Ford Shale was estimated over the range of organic porosity from 10% to 30%. The calculated TOC value, based on the improved model, was then compared with the measured TOC.
Figure 7.
Comparison between the updated model and Schmoker’s model.
In Schmoker’s model, TOC was estimated with bulk density, organic density, and the volume-weighted average of grain and pore fluid density. The plot of Schmoker’s model was calculated based on Equation (14). The parameters that were used to calculate TOC included the organic matter density (1.2 g/cm3), matrix density (2.73 g/cm3), porosity (8%), and the R ratio between organic matter and organic carbon (1.3).
Figure 7 and Table 2 present a comparison of TOC results given by the Schmoker’s model and the updated model. The root mean square error (RMSE) was employed to evaluate the performance of these two models. The results showed that the updated model had a better estimation performance than Schmoker’s model, since the RMSE of the updated model was 0.983, which was 62% less than the RMSE value of the Schmoker’s model (2.572). In the TOC estimation of the upper Eagle Ford formation, the RMSE of the updated model was 53% lower than that of the Schmoker’s model. Meanwhile, the RMSE of the updated model was 64% lower than that of the Schmoker’s model in the lower Eagle Ford formation, showing that the updated model had a higher accuracy than the Schmoker’s model in the lower Eagle Ford.
Table 2.
Root mean square error (RMSE) analysis of TOC estimations based on Schmoker’s model and the updated model.
7. Conclusions
An updated model was developed in this study for predicting TOC from bulk density data. The results can be used in the evaluation of source rocks, especially in pyrite-rich formations. The following main conclusions have been drawn:
- Based on the Rock-Eval experimental results, the Eagle Ford samples in this study were in the post-mature zone. The samples were very good to excellent source rocks with fair to good potential for oil and gas generation.
- There were cyclic changes in Fe and S concentrations, as well as in the pyrite content, corresponding to the trend of gamma-ray log and reflecting changes in degrees of anoxia. A positive linear relationship between pyrite and TOC in the Eagle Ford Shale was identified.
- In the updated model for estimating TOC, pyrite content and organic porosity were taken into consideration. The shale rock was divided into five constituent parts, including organic pores, solid organic matter, pyrite, inorganic pores, and rock matrix without pyrite.
- Comparison between the TOC results calculated from the two models showed that the updated model had a better estimation performance than Schmoker’s model, as reflected by reduced RMSE.
Acknowledgments
We are grateful for the support from Statoil for their help in providing core samples and relevant data. We would also like to thank Yinfeng Xu for her help with the XRD, XRF, and pyrolysis experiments.
Author Contributions
M.M. and D.B. conceived and designed the experiments; S.J. performed the experiments and drafted the paper; J.L. revised the paper.
Conflicts of Interest
The authors declare no conflict of interest.
Nomenclature
| R | ratio of weight of organic matter to weight of organic carbon, dimensionless |
| Vk | volume fraction of organic matter in rock sample, dimensionless |
| Vnk | volume fraction of inorganic parts without pyrite in rock sample, dimensionless |
| Vpy | volume fraction of pyrite in rock sample, dimensionless |
| Wpy | weight percent of pyrite in rock sample, dimensionless |
Greek Terms
| φk | volume fraction of organic pores in organic matter, dimensionless |
| φnk | volume fraction of inorganic pores in inorganic rock without pyrite, dimensionless |
| ρb | bulk density, g/cm3 |
| ρpy | density of pyrite, g/cm3 |
| ρnk | density of inorganic rock matrix without pyrite, g/cm3 |
| ρk | density of solid organic matter, g/cm3 |
| ρhc | density of hydrocarbon, g/cm3 |
| ρw | density of water, g/cm3 |
Appendix A
Table A1.
Pyrolysis results of the Eagle Ford samples. HI—hydrogen index; OI—oxygen index; TOC—total organic carbon.
References
- Miles, J.A. Illustrated Glossary of Petroleum Geochemistry; Oxford University Press: New York, NY, USA, 1994; pp. 23–67. ISBN 0198548494. [Google Scholar]
- Beers, R.F. Radioactivity and organic content of some Paleozoic Shales. AAPG Bull. 1945, 29, 1–22. [Google Scholar]
- Schmoker, J.W. Determination of organic-matter content of appalachian devonian shales from gamma ray logs. AAPG Bull. 1981, 65, 1285–1298. [Google Scholar]
- Fertl, W.H.; Rieke, H.H. Gamma ray spectral evaluation techniques identify fractured shale reservoir and source-rock characteristics. J. Petrol. Technol. 1980, 32, 2053–2062. [Google Scholar] [CrossRef] [Scilit]
- Fertl, W.H.; Chilingar, G.V. Total organic carbon content determined from well logs. SPE Form. Eval. 1988, 3, 407–419. [Google Scholar] [CrossRef] [Scilit]
- Swanson, V.E. Geology and geochemistry of Uranium in marine black shales: A review. Geol. Surv. Prof. Pap. 1961, 365, 67–111. [Google Scholar]
- Schmoker, J.W. Determination of organic content of Appalachian Devonian shales from formation-density logs. AAPG Bull. 1979, 63, 1504–1537. [Google Scholar]
- Schmoker, J.; Hester, T. Organic carbon in Bakken formation, United States portion of Williston basin. AAPG Bull. 1983, 67, 2165–2174. [Google Scholar]
- Meyer, B.L.; Nederlof, M.H. Identification of source rocks on wireline logs by density/resistivity and sonic transit/resistivity crossplots. AAPG Bull. 1984, 68, 121–129. [Google Scholar]
- Decker, A.D.; Hill, D.G.; Wicks, D.E. Log-based gas content and resource estimates for the Antrim shale, Michigan Basin. In Proceedings of the Low Permeability Reservoirs Symposium, Denver, CO, USA, 26–28 April 1993. [Google Scholar]
- Alfred, D.; Vernik, L. A new petrophysical model for organic shales. Petrophysics 2013, 54, 240–247. [Google Scholar]
- Zhao, P.Q.; Mao, Z.Q.; Huang, Z.H.; Zhang, C. A new method for estimating total organic carbon content from well logs. AAPG Bull. 2016, 100, 1311–1327. [Google Scholar] [CrossRef] [Scilit]
- Passey, Q.R.; Creaney, S.; Kulla, J.B.; Moretti, F.J.; Stroud, J.D. A practical model for organic richness from porosity and resistivity Logs. AAPG Bull. 1990, 74, 1777–1794. [Google Scholar] [CrossRef] [Scilit]
- Wang, P.W.; Chen, Z.H.; Pang, X.Q.; Hu, K.Z.; Sun, M.L.; Chen, X. Revised models for determining TOC in shale play: Example from Devonian Duvernay shale, Western Canada sedimentary basin. Mar. Petrol. Geol. 2016, 70, 304–319. [Google Scholar] [CrossRef] [Scilit]
- Zhao, P.Q.; Ma, H.L.; Rasouli, V.; Liu, W.H.; Cai, J.C.; Huang, Z.H. An improved model for estimating the TOC in shale formations. Mar. Petrol. Geol. 2017, 83, 174–183. [Google Scholar] [CrossRef] [Scilit]
- Mendelzon, J.D.; Toksoz, M.N. Source rock characterization using multivariate analysis of log data. In Proceedings of the SPWLA 26th Annual Logging Symposium, Dallas, TX, USA, 17–20 June 1985. [Google Scholar]
- Heidari, Z.; Torres-Verdín, C.; Preeg, W.E. Quantitative method for estimating total organic carbon and porosity, and for diagnosing mineral constituents from well logs in shale-gas formations. In Proceedings of the SPWLA 52nd Annual Logging Symposium, Colorado Springs, CO, USA, 14–18 May 2011. [Google Scholar]
- Shi, X.; Wang, J.; Liu, G.; Ge, X.M.; Jiang, X. Application of extreme learning machine and neural networks in total organic carbon content prediction in organic shale with wire line logs. J. Nat. Gas Sci. Eng. 2016, 33, 687–702. [Google Scholar] [CrossRef] [Scilit]
- Autric, A.; Dumesnil, P. Resistivity radioactivity and sonic transit time logs to evaluate the organic content of low permeability rocks. Log Anal. 1985, 26, 37–45. [Google Scholar]
- Alqahtani, A.; Tutuncu, A. Quantification of total organic carbon content in shale source rocks: An eagle ford case study. In Proceedings of the Unconventional Resources Technology Conference, Denver, CO, USA, 25–27 August 2014. [Google Scholar]
- Klimentos, T. Pyrite volume estimation by well log analysis and petrophysical studies. Log Anal. 1995, 36, 11–17. [Google Scholar]
- Kennedy, M. Gold fool’s: Detecting, quantifying and accounting for the effects of pyrite in modern logs. In Proceedings of the SPWLA 45th Annual Logging Symposium, Noordwijk, The Netherlands, 6–9 June 2004. [Google Scholar]
- Clavier, C.; Heim, A.; Scala, C. Effect of pyrite on resistivity and other logging measurements. In Proceedings of the SPWLA 17th Annual Logging Symposium, Denver, CO, USA, 9–12 June 1976. [Google Scholar]
- Ellis, D.V.; Singer, J.M. Well Logging for Earth Scientists, 2nd ed.; Springer: Dordrecht, The Netherlands, 2007; pp. 17–62. [Google Scholar]
- Witkowsky, J.M.; Galford, J.E.; Quirein, J.A.; Truax, J.A. Predicting pyrite and total organic carbon from well logs for enhancing shale reservoir interpretation. In Proceedings of the SPE Eastern Regional Meeting, Lexington, KT, USA, 3–5 October 2012. [Google Scholar]
- Peters, K.E. Guidelines for evaluating petroleum source rock using programmed pyrolysis. AAPG Bull. 1986, 70, 318–329. [Google Scholar]
- Snowdon, L.R. Rock-Eval Tmax suppression: Documentation and amelioration. AAPG Bull. 1995, 79, 1337–1348. [Google Scholar]
- Dembicki, H. Three common source rock evaluation errors made by geologist during prospect or play appraisals. AAPG Bull. 2009, 93, 341–356. [Google Scholar] [CrossRef] [Scilit]
- Shalaby, M.R.; Hakimi, M.H.; Abdullah, W.H. Organic geochemical characteristics and interpreted depositional environment of the Khatatba Formation, northern Western Desert, Egypt. AAPG Bull. 2012, 696, 2019–2036. [Google Scholar] [CrossRef] [Scilit]
- Sun, X.; Zhang, T.; Sun, Y.; Milliken, K.L.; Sun, D. Geochemical evidence of organic matter source input and depositional environments in the lower and upper Eagle Ford Formation, south Texas. Org. Geochem. 2015, 98, 66–81. [Google Scholar] [CrossRef] [Scilit]
- VanHazebroeck, E.; Borrok, D.M. A new method for the inorganic geochemical evaluation of unconventional resources: An example from the Eagle Ford Shale. J. Nat. Gas Sci. Eng. 2016, 33, 1233–1243. [Google Scholar] [CrossRef] [Scilit]
- Chalmers, G.R.L.; Bustin, R.M. A multidisciplinary approach in determining the maceral (kerogen type) and mineralogical composition of Upper Cretaceous Eagle Ford Formation: Impact on pore development and pore size distribution. Int. J. Coal Geol. 2017, 171, 93–110. [Google Scholar] [CrossRef] [Scilit]
- Berner, R.A.; Raiswell, R. Burial of organic carbon and pyrite sulfur in sediments over Phanerozoic time: A new theory. Geochim. Cosmochim. Acta 1983, 47, 855–862. [Google Scholar] [CrossRef] [Scilit]
- Berner, R.A. Sedimentary pyrite formation: An update. Geochim. Cosmochim. Acta 1984, 48, 605–615. [Google Scholar] [CrossRef] [Scilit]
- Mullen, J. Petrophysical Characterization of the Eagle Ford Shale in South Texas. In Proceedings of the Canadian Unconventional Resources and International Petroleum Conference, Calgary, AB, Canada, 19–21 October 2010. [Google Scholar]

© 2018 by the authors. Licensee MDPI, Basel, Switzerland. This article is an open access article distributed under the terms and conditions of the Creative Commons Attribution (CC BY) license (http://creativecommons.org/licenses/by/4.0/).