Article

Non-Destructive Multi-Analytical Approach to Study the Pigments of Wall Painting Fragments Reused in Mortars from the Archaeological Site of Pompeii (Italy)

1
Department of Biology, Ecology and Earth Sciences, Università della Calabria, via P. Bucci Cubo 12B, 87036 Arcavacata di Rende, CS, Italy
2
Applied Research Laboratory of Archeological Park of Pompeii, via Plinio 4, 80045 Pompeii, NA, Italy
3
General Director of Archeological Park of Pompeii, via Plinio 4, 80045 Pompeii, NA, Italy
4
Laboratoire AOrOc Archéologie et Philologie d’Orient et d’Occident-UMR 8546, Ecole Normale Supérieure—PSL, 45 rue d’Ulm 75005 Paris, France
5
ERAAUB, Departament de Prehistòria i Arqueologia, Universitat de Barcelona, c. Montealegre 6-8, 08001 Barcelona, Spain
6
Technical planning secretariat of the Archeological Park of Pompeii, via Villa dei Misteri 2, 80045 Pompei, NA, Italy
*
Author to whom correspondence should be addressed.
Minerals 2018, 8(4), 134; https://doi.org/10.3390/min8040134
Submission received: 21 February 2018 / Revised: 14 March 2018 / Accepted: 23 March 2018 / Published: 27 March 2018
(This article belongs to the Special Issue Mineralogical Applications for Cultural Heritage)

Abstract

:
During the excavations carried out in Via di Mercurio (Regio VI, 9, 3) in Pompeii, in 2015, some red, green, black, and brown wall painting fragments were found in the preparatory layer of an ancient pavement which was probably built after the 62 AD earthquake. These fragments, derived from the rubble, were used as coarse aggregate to prepare the mortar for building the pavement. The wall painting fragments are exceptionally well preserved, which is an uncommon occurrence in the city of Pompeii. However, as they were enclosed in the mortar, the wall painting fragments were protected from the high temperatures (probably ranging between 180 °C and 380 °C) produced by the eruption in 79 AD. The pigmented outer surface of each sample was analyzed using a non-destructive multi-analytical approach, by combining spectrophotometric colorimetry and portable X-ray fluorescence with micro-Raman spectroscopy. The compositional characterization of the samples revealed the presence of cuprorivaite, goethite, and celadonite in the green pigments; hematite in the red pigments; goethite in the brown pigment; and charcoal in the black pigment. These data probably provide us with the most “faithful picture” of the various red, green, black, and brown pigments used in Pompeii prior to the 79 AD eruption.

1. Introduction

The archaeological site of Pompeii is located on a plateau produced by prehistoric lava flows, on the southern flank of Vesuvius [1] in Southern Italy.
The area has been inhabited since the Middle Neolithic period. In the late 7th to early 6th century BC it was ruled by the Etruscans, until the arrival of the Greeks in 474 BC. The city was later conquered by the Samnites and in the 4th century BC passed under Roman jurisdiction. The 62 AD earthquake destroyed most of the city which was then reconstructed, but Pompeii was once again completely destroyed and buried under the volcanic eruption of 79 AD [2,3,4]. For this reason, Pompeii offers a snapshot of Roman life in the 1st century AD as it has remained undisturbed since it was buried on 24 August 79 AD. The city remained hidden until the beginning of the 16th century, when during remediation works in the Sarno Valley, the first inscriptions of the city made with Roman materials were discovered [5]. The city covered an area of 66 hectares (of which 44 hectares have been excavated) with public buildings, temples, theatres, bath complexes, private houses, and shops enclosed within a circuit of defensive walls and guard towers as well as suburban villas and tombs just outside.
In recent years, there has been growing interest in ancient Roman technology which has led to the publication of several archaeometric studies on the raw materials used for the construction of buildings and on the artistic handicrafts made in the ancient city of Pompeii [6,7,8,9,10,11,12,13,14].
Despite the importance of this archaeological site, there is a paucity of literature on the composition of the pigments used for the wall paintings [15,16,17,18,19,20,21,22,23,24,25,26,27,28]. An opportunity for studying this topic arose during the excavations performed in Via di Mercurio (Regio VI, 9, 3) in 2015 by Pompeii Archaeological Park. The archeological excavations were carried out under the Great Pompeii Project “Pompei per tutti” [29]. In the pavement in front of house number 2 and the Centaur House, adjacent to a bend in the curb, a ditch (US 173) was found which was filled with a layer (US 162) of ancient material containing numerous plaster fragments as well as more recent material (please see Supplementary Materials Figure S1). The ditch, which is 60 cm deep, should have been excavated after the discovery of the road. However, US 173 could also have been an ancient open cavity at the time of the eruption. The preparatory layer (US 162—rudus) is composed of a peculiar lime mortar, made of a mixture of lime and large aggregates composed almost exclusively of ancient wall painting fragments, some of which are approximately 15 cm in size. From this preparatory layer, we extracted six samples of wall paintings (Figure 1) and, in order to study the composition of the pigments without damaging the samples, we used non-destructive multi-analytical techniques such as spectrophotometric colorimetry, portable X-ray fluorescence, and micro-Raman spectroscopy. The samples were kept in good condition, although it is hoped that other wall painting fragments present in the pavement can be recovered and recomposed in the near future. The compositional data of the pigments presented in this study can be used for planning future restoration works.

2. Materials and Methods

Six samples of wall painting fragments (Figure 1) were extracted from the preparatory layer (rudus) of the pavement in Via di Mercurio (Regio VI, 9, 3) in Pompeii. The fragments were not randomly selected, as they were chosen to obtain samples of all of the colors present in the wall paintings. The samples were cleaned thoroughly with a scalpel, immersed in an ultrasonic bath filled with demineralized water for 2 min, and then dried in a ventilated kiln at 24 °C for 12 h.
The wall painting fragments analyzed are: two samples of red color (Sample 1 and Sample 2); two samples of green color (Sample 3 and Sample 4); one sample of black color (Sample 5); and one sample of brown color (Sample 6) (Figure 1).
The non-destructive compositional analyses were only carried out on the external pigmented layer, while compositional characterization of the plaster preparation layer of the paintings was not performed. However, analyses are still underway and will be discussed in the near future.
Colorimetric analyses were carried out with a Konica Minolta Spectrophotometer CM-2600d under standard illuminant D65, including the specular component (measuring area: circular area with a diameter of 8 mm). Colorimetric data were presented using trichromatic colorimetric coordinates in the CIE-L*a*b* space (L* represents brightness: 0 = black, 100 = white; +a* = red; −a* = green; +b * = yellow; −b* = blue) as defined by the Commission International de l’Eclairage (CIE).
Portable X-ray fluorescence (p-XRF) was performed to determine the qualitative elemental composition of the external pigmented layer, using a p-XRF spectrometer “Bruker Tracer IV-SD” (Bruker, Billerica, MA, USA) equipped with a Rh X-ray tube; the following conditions were used for the analyses: acceleration voltage of 40 kV, current intensity of 35 µA, spectrum accumulation of 120 s, vacuum < 17 Torr, no filters, spot size of approximately 5 mm. The element assignments were defined using “Bruker AXS MA Artax 7.4” software. The peak intensities for the p-XRF spectra were indicated as counts per second (cps).
Micro-Raman analyses were performed using a Thermo Fisher DXR Raman microscope (Waltham, MA, USA), equipped with OMNICxi Raman Imaging software 1.0, an objective of 50×, a grating of 900 ln/mm (full width at half maximum, FWHM), and an electron multiplying charge-coupled device (EMCCD). The 532.0-nm line (solid state laser) was used at an incident power output ranging from 1.8 to 7 mW (Table 1). The spatial resolution of the laser beam was about 3–5 µm. The acquisition time of the spectra varied from 5 to 40 s.

3. Results and Discussion

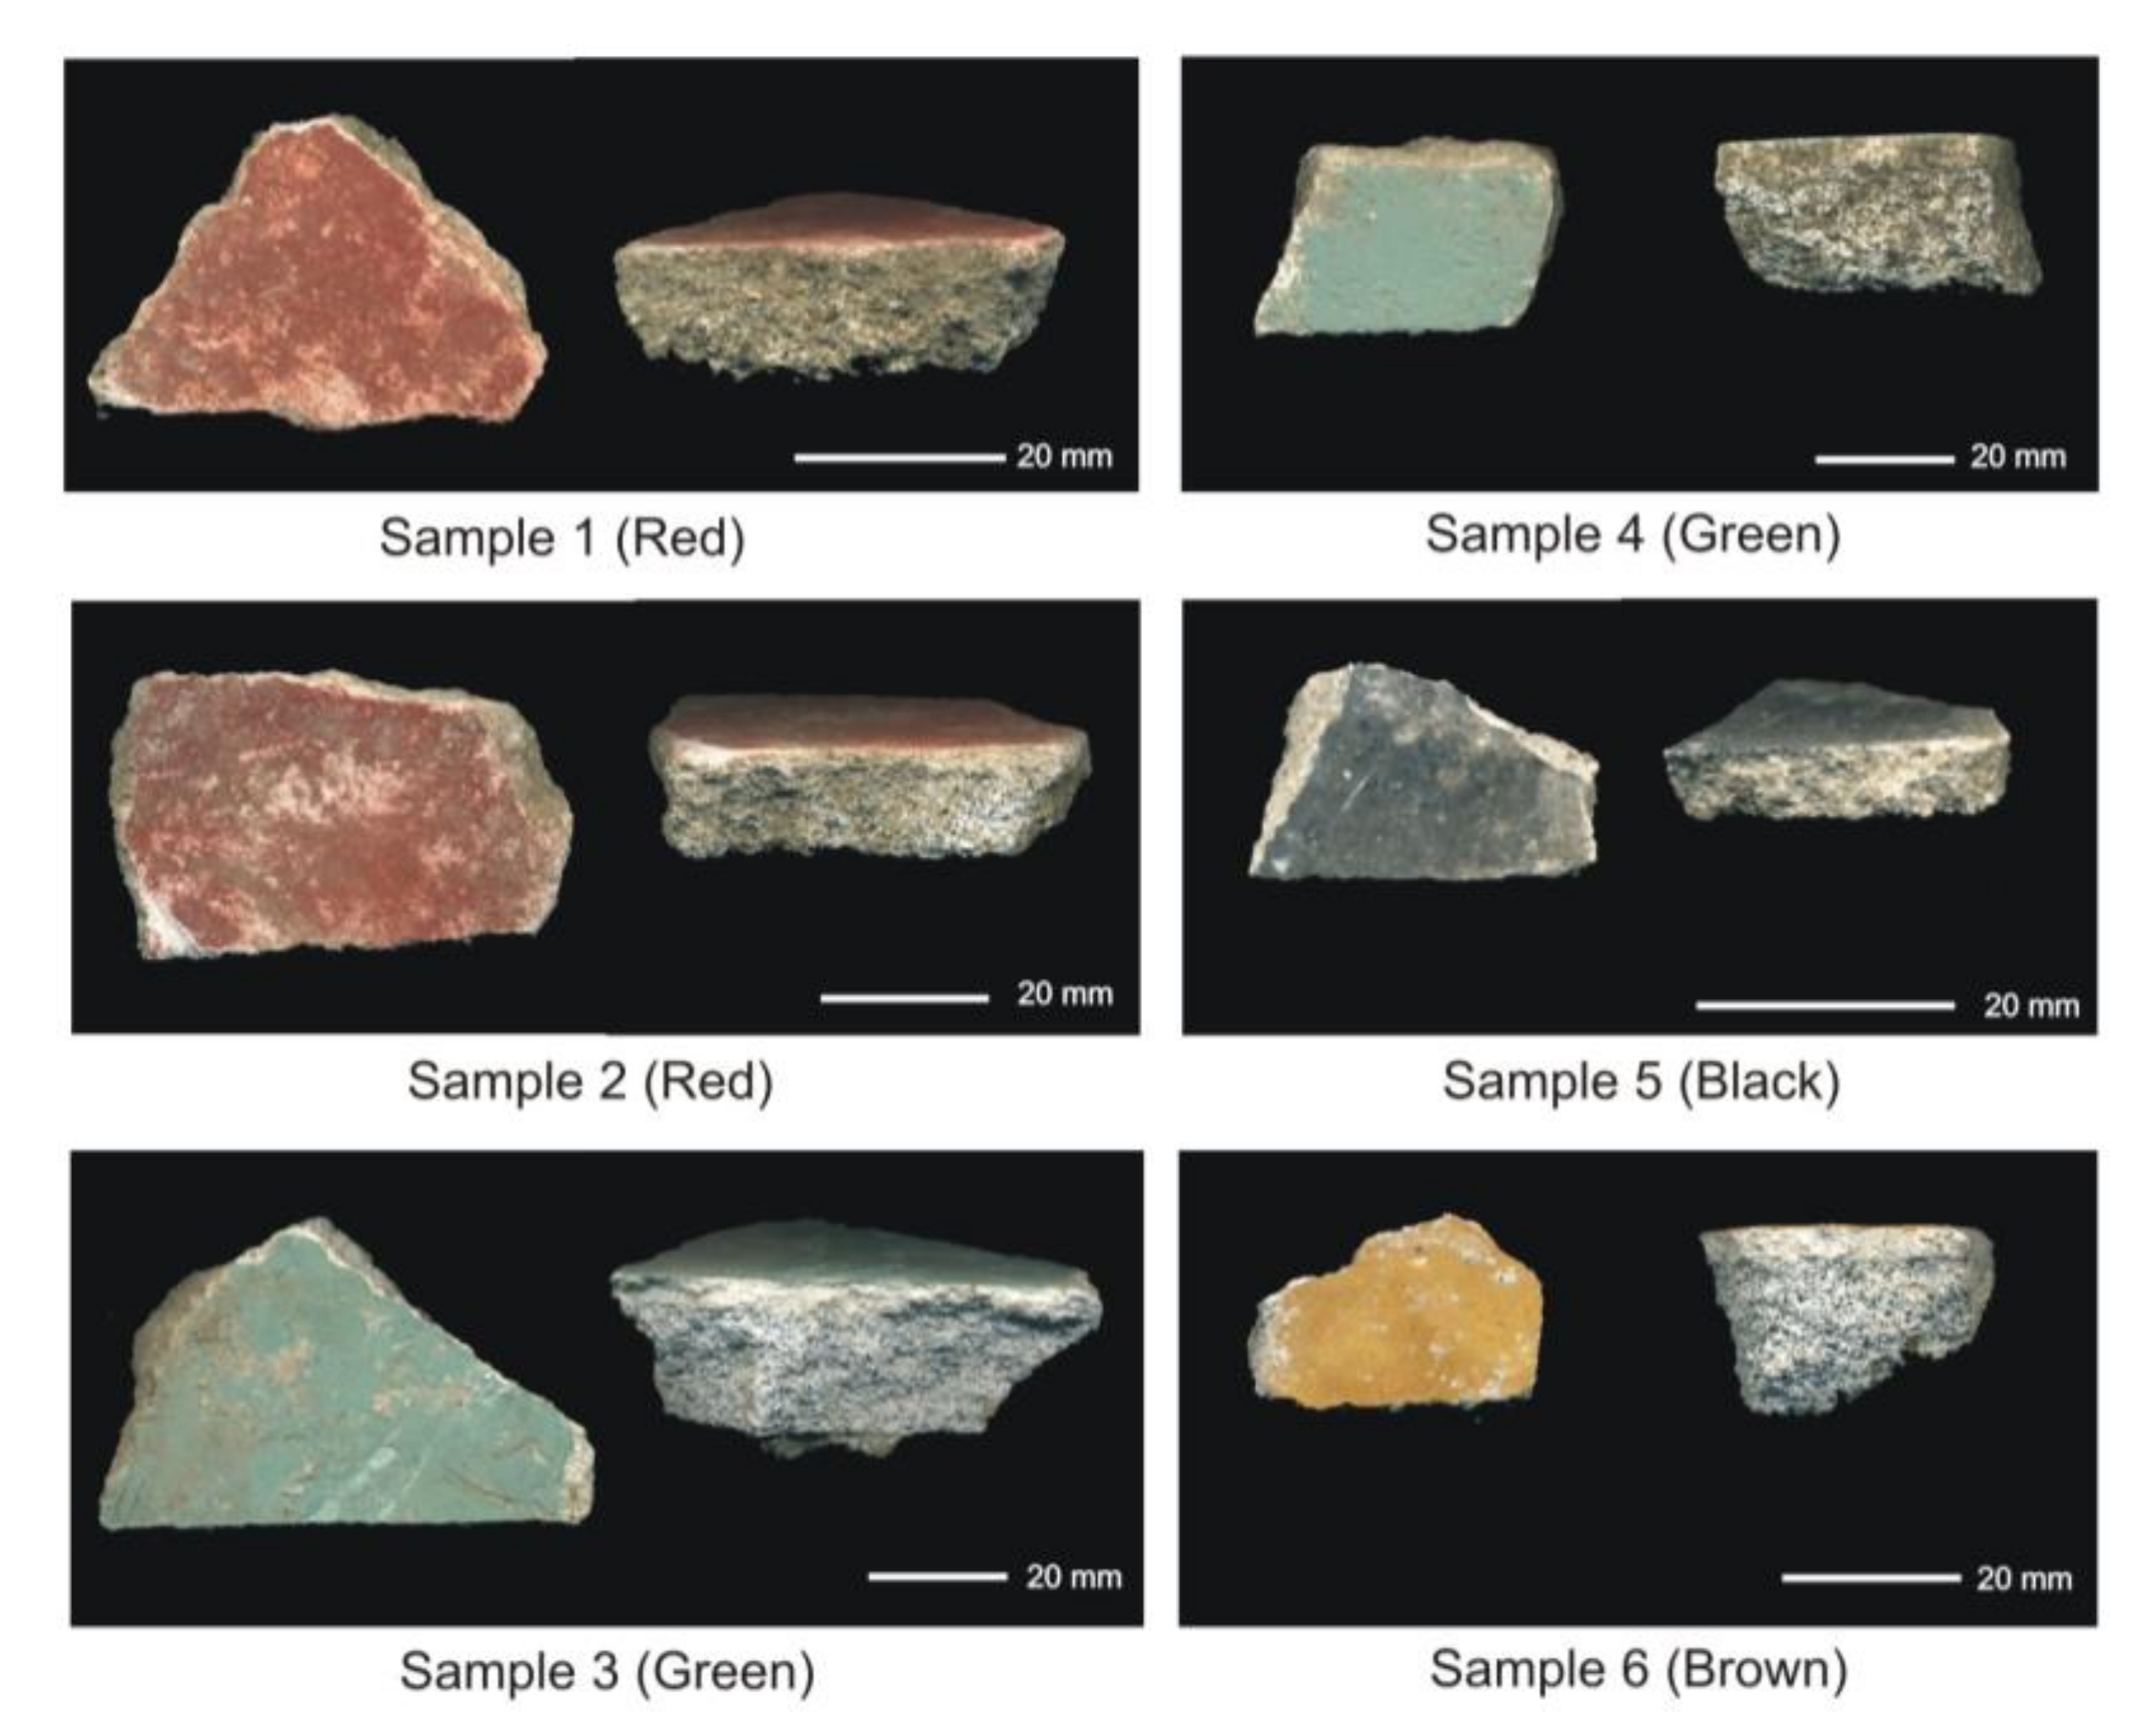
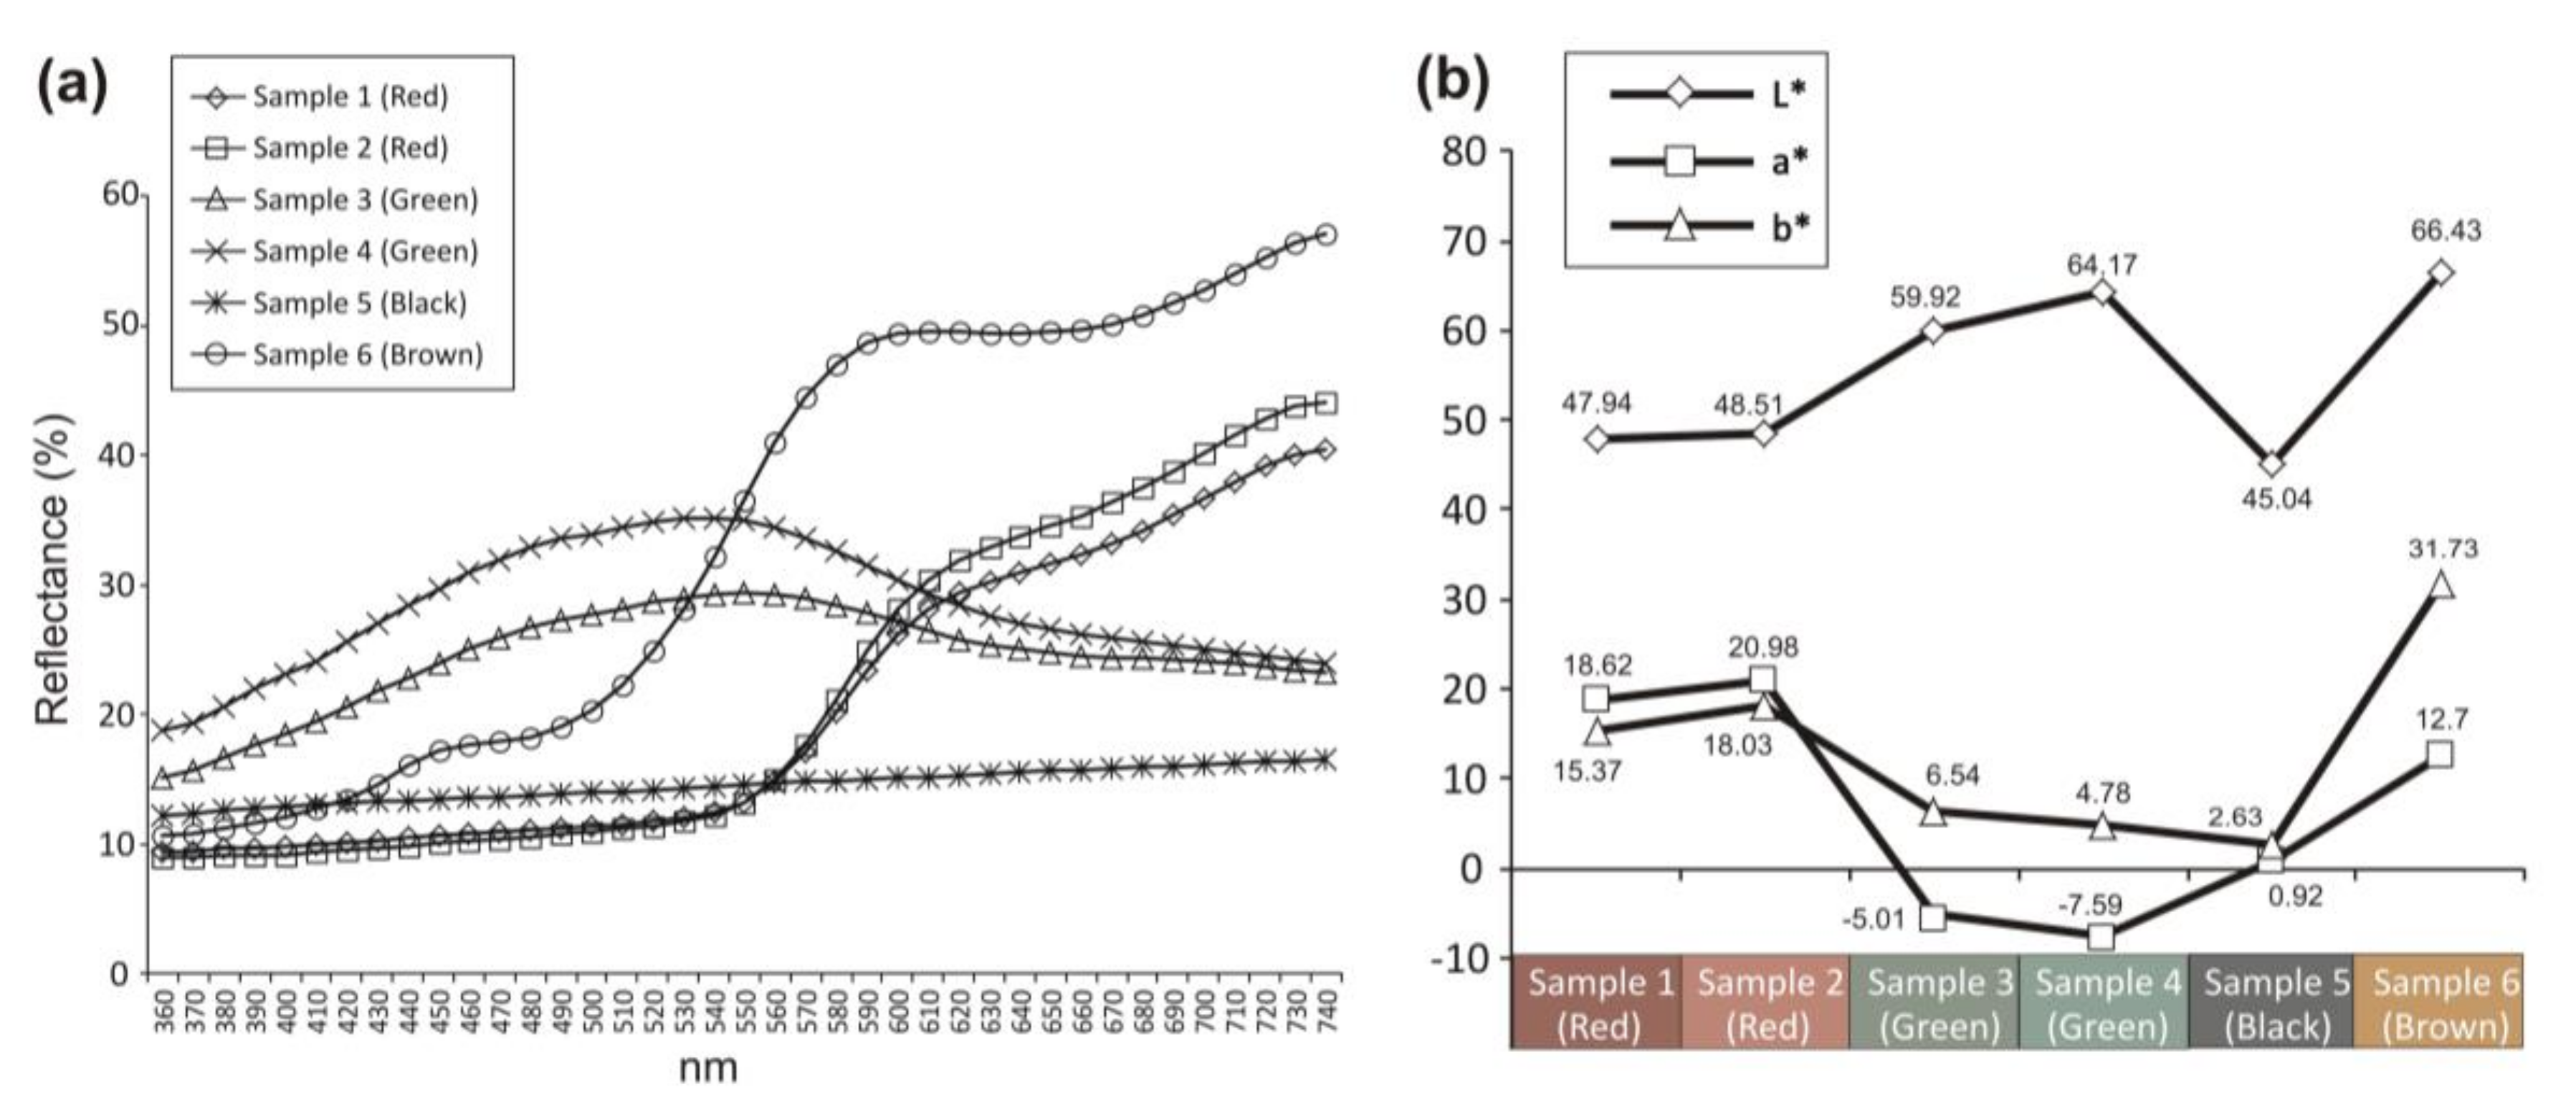
3.1. Macroscopic Features of the Samples and Colorimetric Analysis

The wall painting fragments taken from the preparatory layer (rudus) of the ancient pavement are very well preserved (Figure 1) and have important and unusual characteristics. In fact, as they had been incorporated into the binder of the preparatory mortar of the sidewalk, they were protected from the high temperatures, probably ranging between 180 °C and 380 °C [30], produced by the 79 AD eruption. Moreover, the external 2-cm thick layer of the pavement provided additional protection, which enabled us to study pigments used in Pompeian wall paintings that have not undergone mineralogical and chromatic changes during the eruption for the first time.
The samples have a very high cohesion and it is hard to break them apart with one’s hands. From the macroscopic point of view, all of the samples are composed of three layers, with the exception of Sample 5 (black) which only has two layers. In Samples 1, 2, 3, 4, and 6 (Figure 1), the innermost layer is between 10 mm (the red fragments) and 17.4 mm (the green fragments) thick, the intermediate layer is between 2.5 mm (the red fragments) and 3.5 mm (the green fragments) thick, and the external pigmented layer is less than 1 mm thick. As mentioned above, Sample 5 (Figure 1) is composed of only two layers: the innermost layer is approximately 5 mm thick, while the external pigmented layer is less than 1 mm thick.
Figure 2 shows the reflectance curves (Figure 2a) and the colorimetric coordinates (Figure 2b) of all samples. The reflectance curves for the red fragments (Samples 1 and 2) are very similar (Figure 2a); in fact, the curves overlap almost perfectly. The reflectance curves of the green fragments (Samples 3 and 4) are also similar (Figure 2a); however, the curve of Sample 4 is shifted upwards, because this sample has a higher reflectance and brightness than Sample 3.
As expected, the reflectance curve of the black fragment (Sample 5) is straight because its reflectance is very low (Figure 2a). Meanwhile, the brown fragment (Sample 6) shows the highest reflectance ranging between 540 and 740 nm (Figure 2a). However, some preliminary considerations can be made by comparing the reflectance curves for the red (Samples 1 and 2) and brown (Sample 6) pigments; in fact, the inflection points and the slopes of the reflectance curves of Samples 1 and 2 fit with those of hematite, while the reflectance curve of Sample 6 matches with those of goethite [31,32,33,34,35].
With regard to the colorimetric coordinates (Figure 2b), there are significant differences among all of the samples that can be seen with the naked eye and are due to their chemical and mineralogical composition, as shown in the following paragraphs.

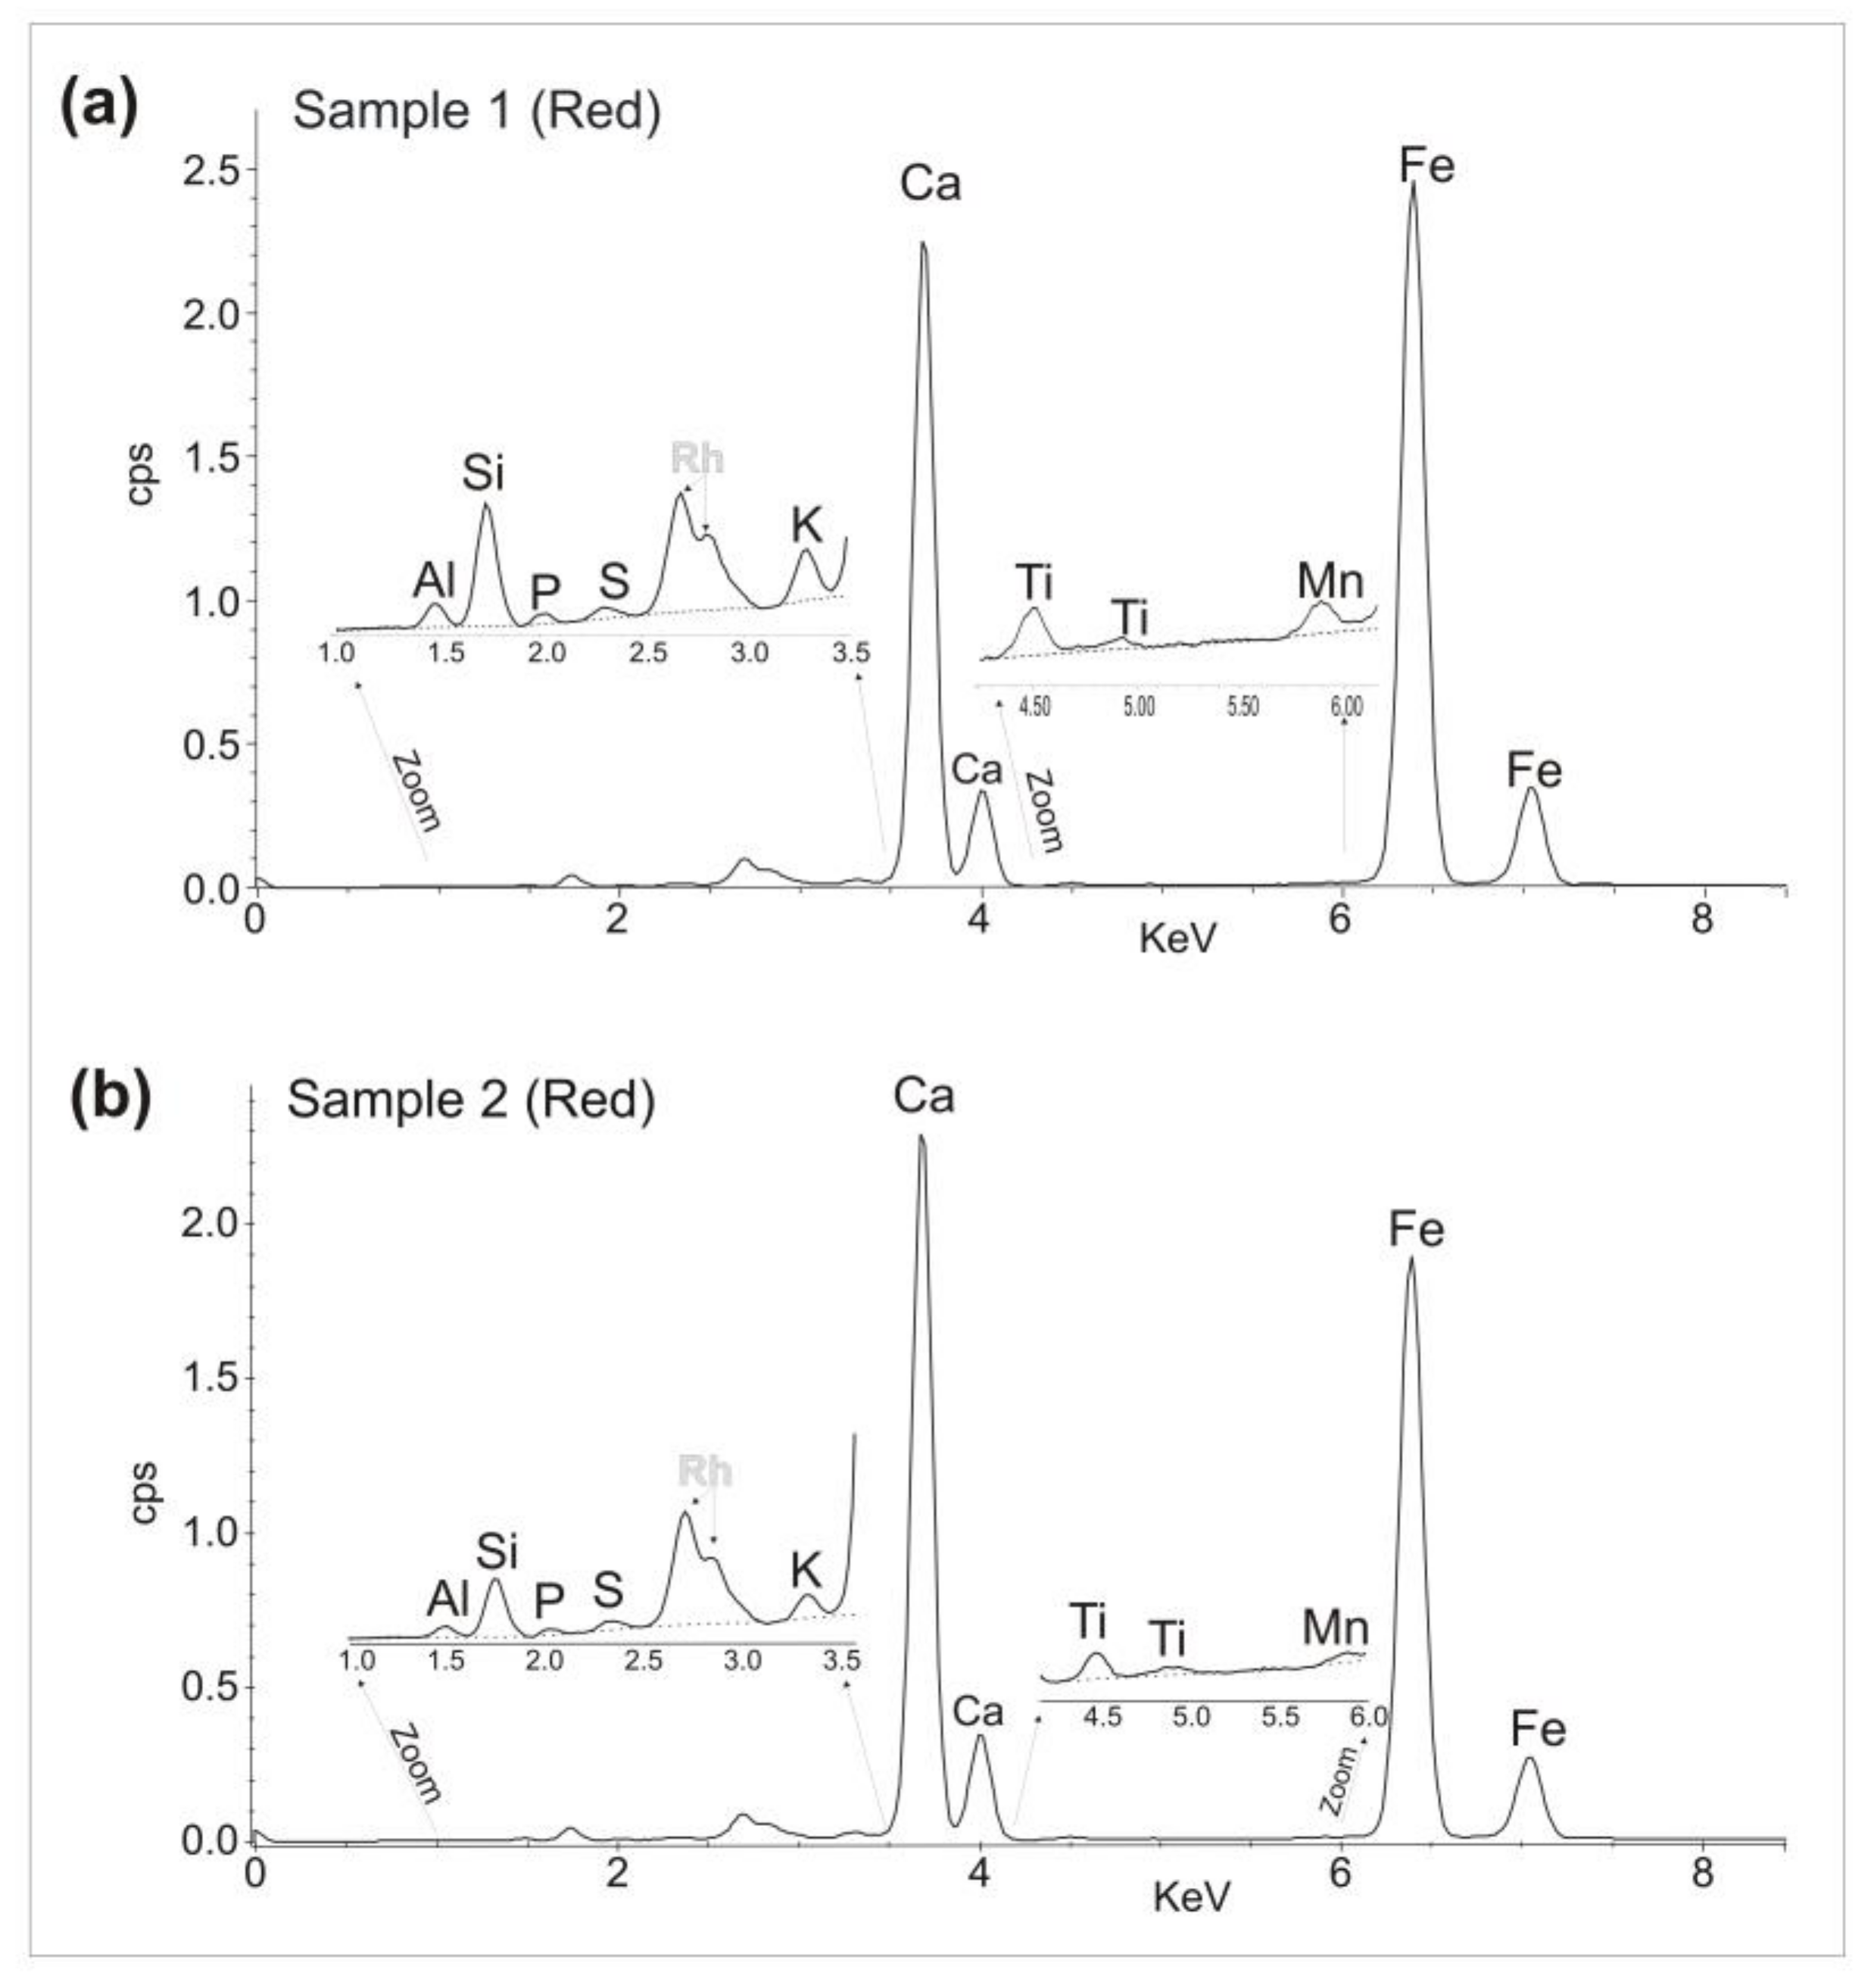
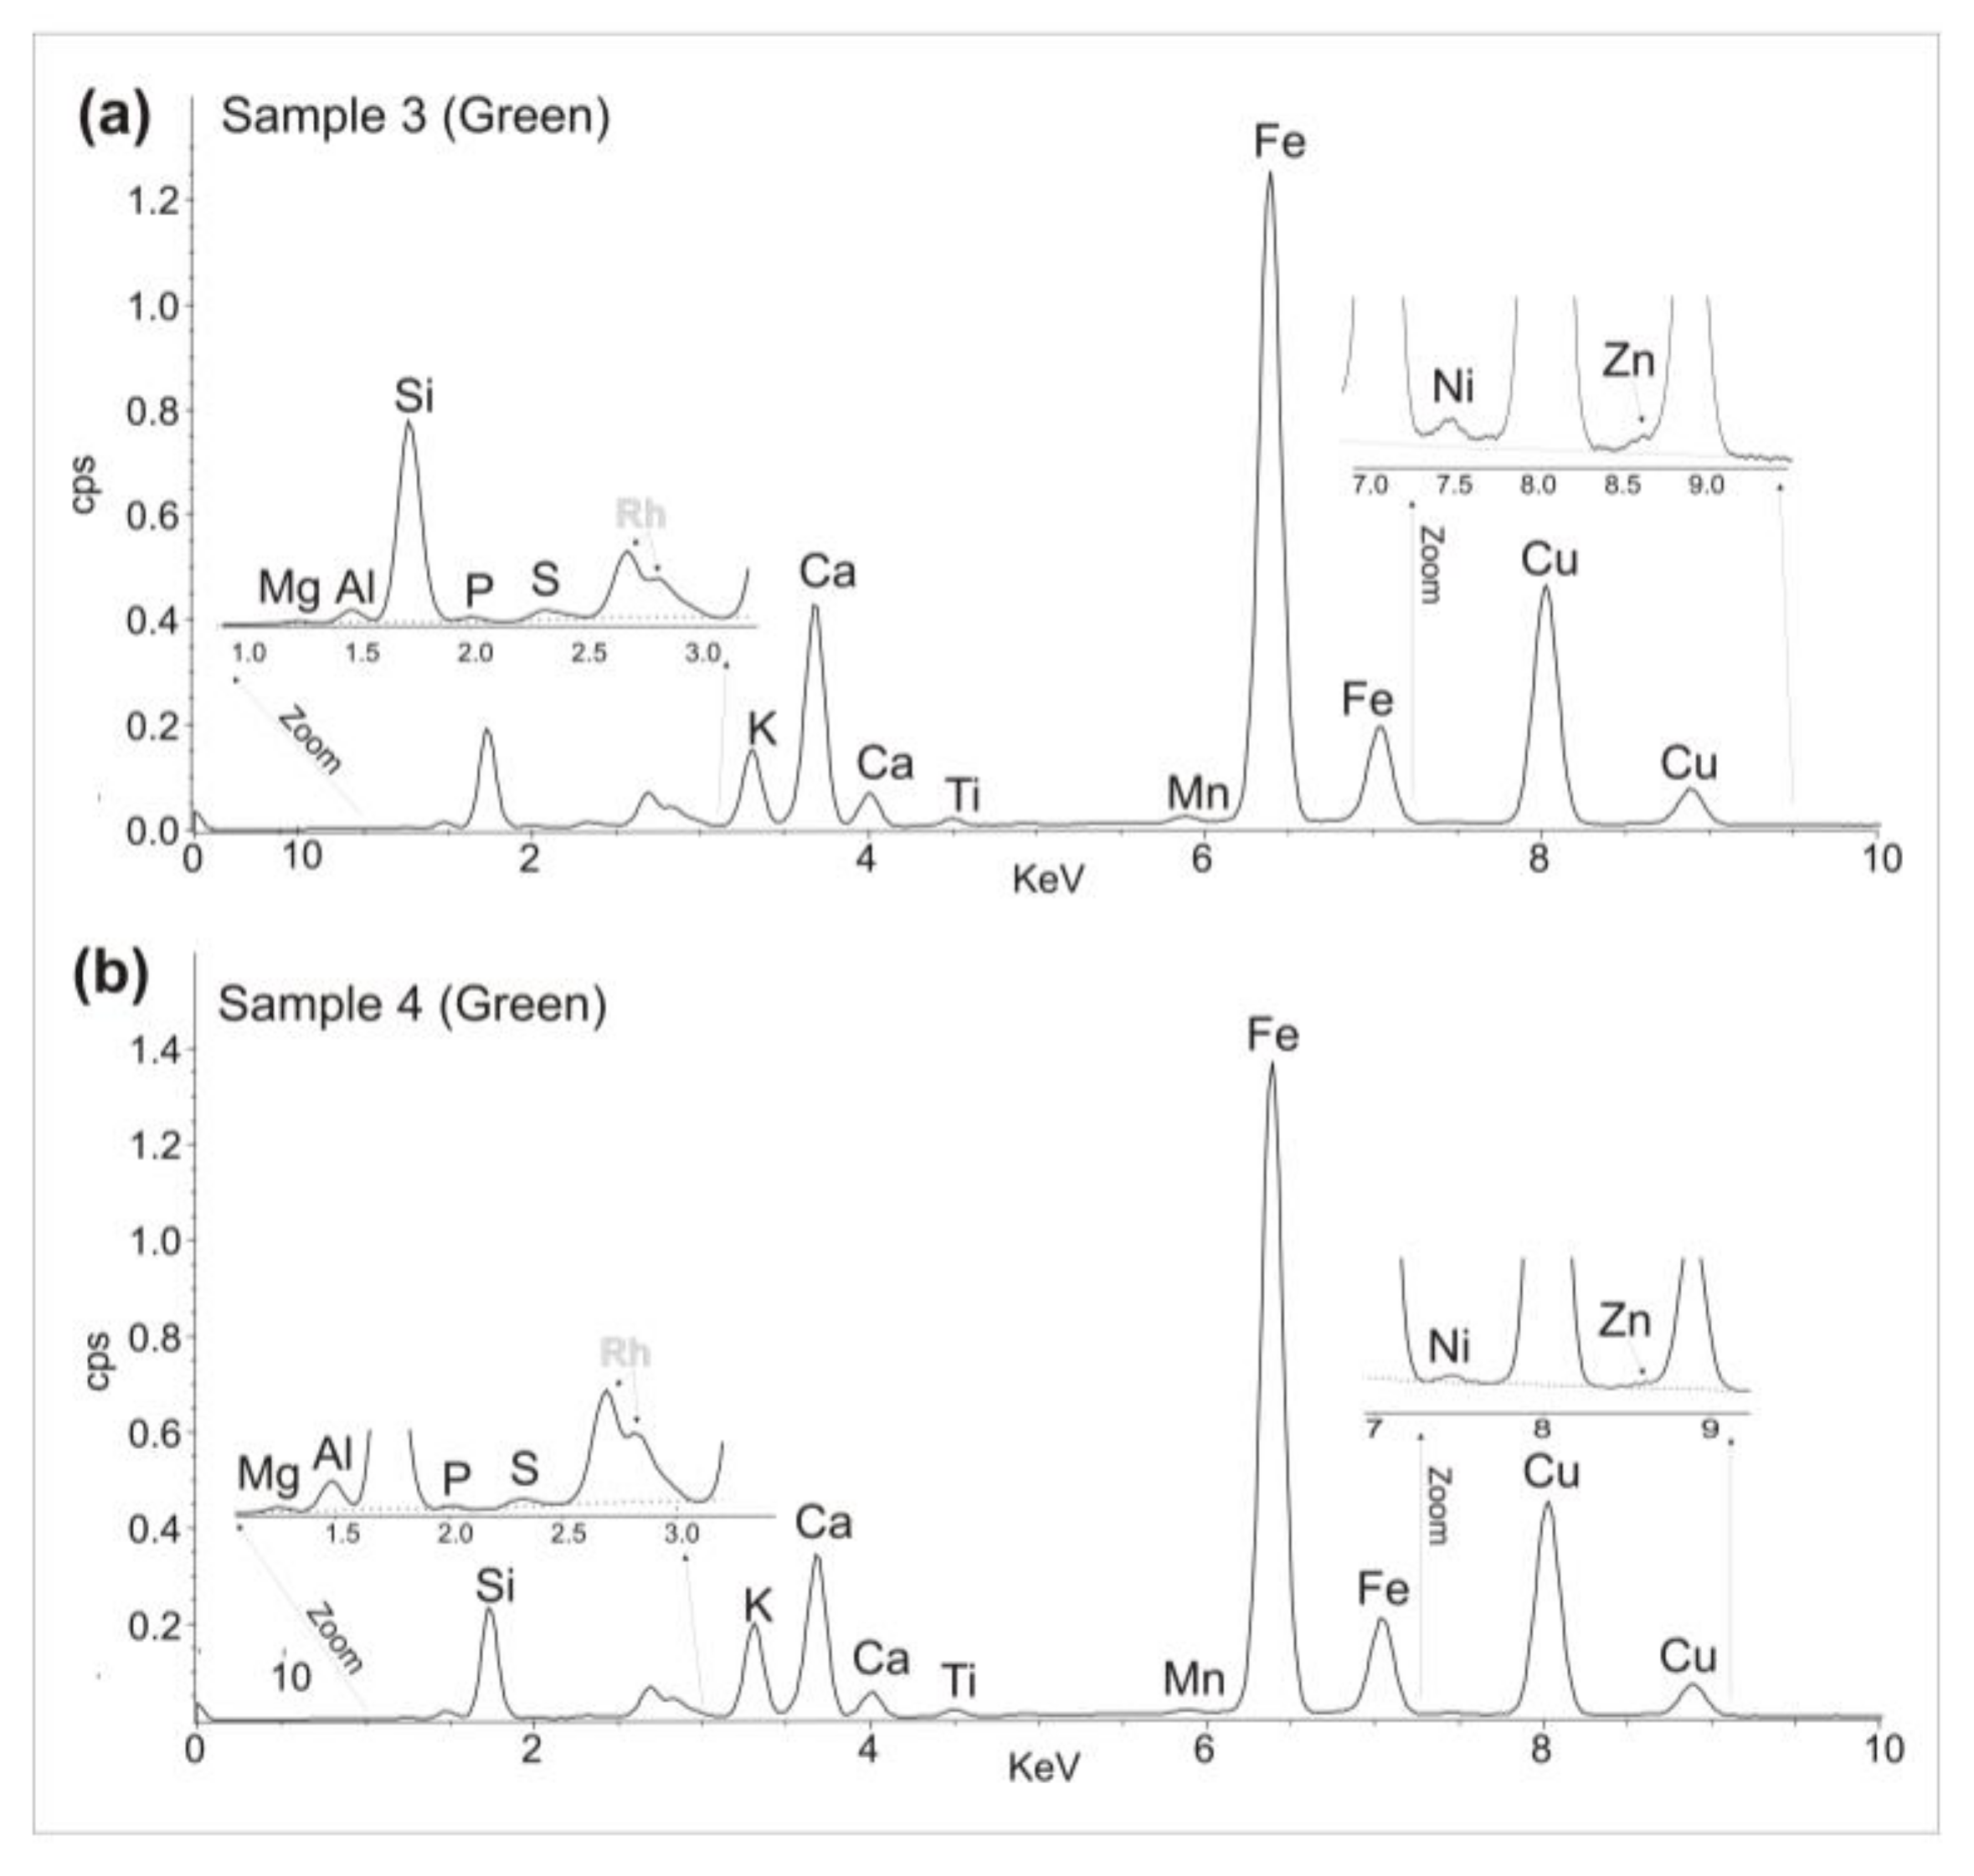
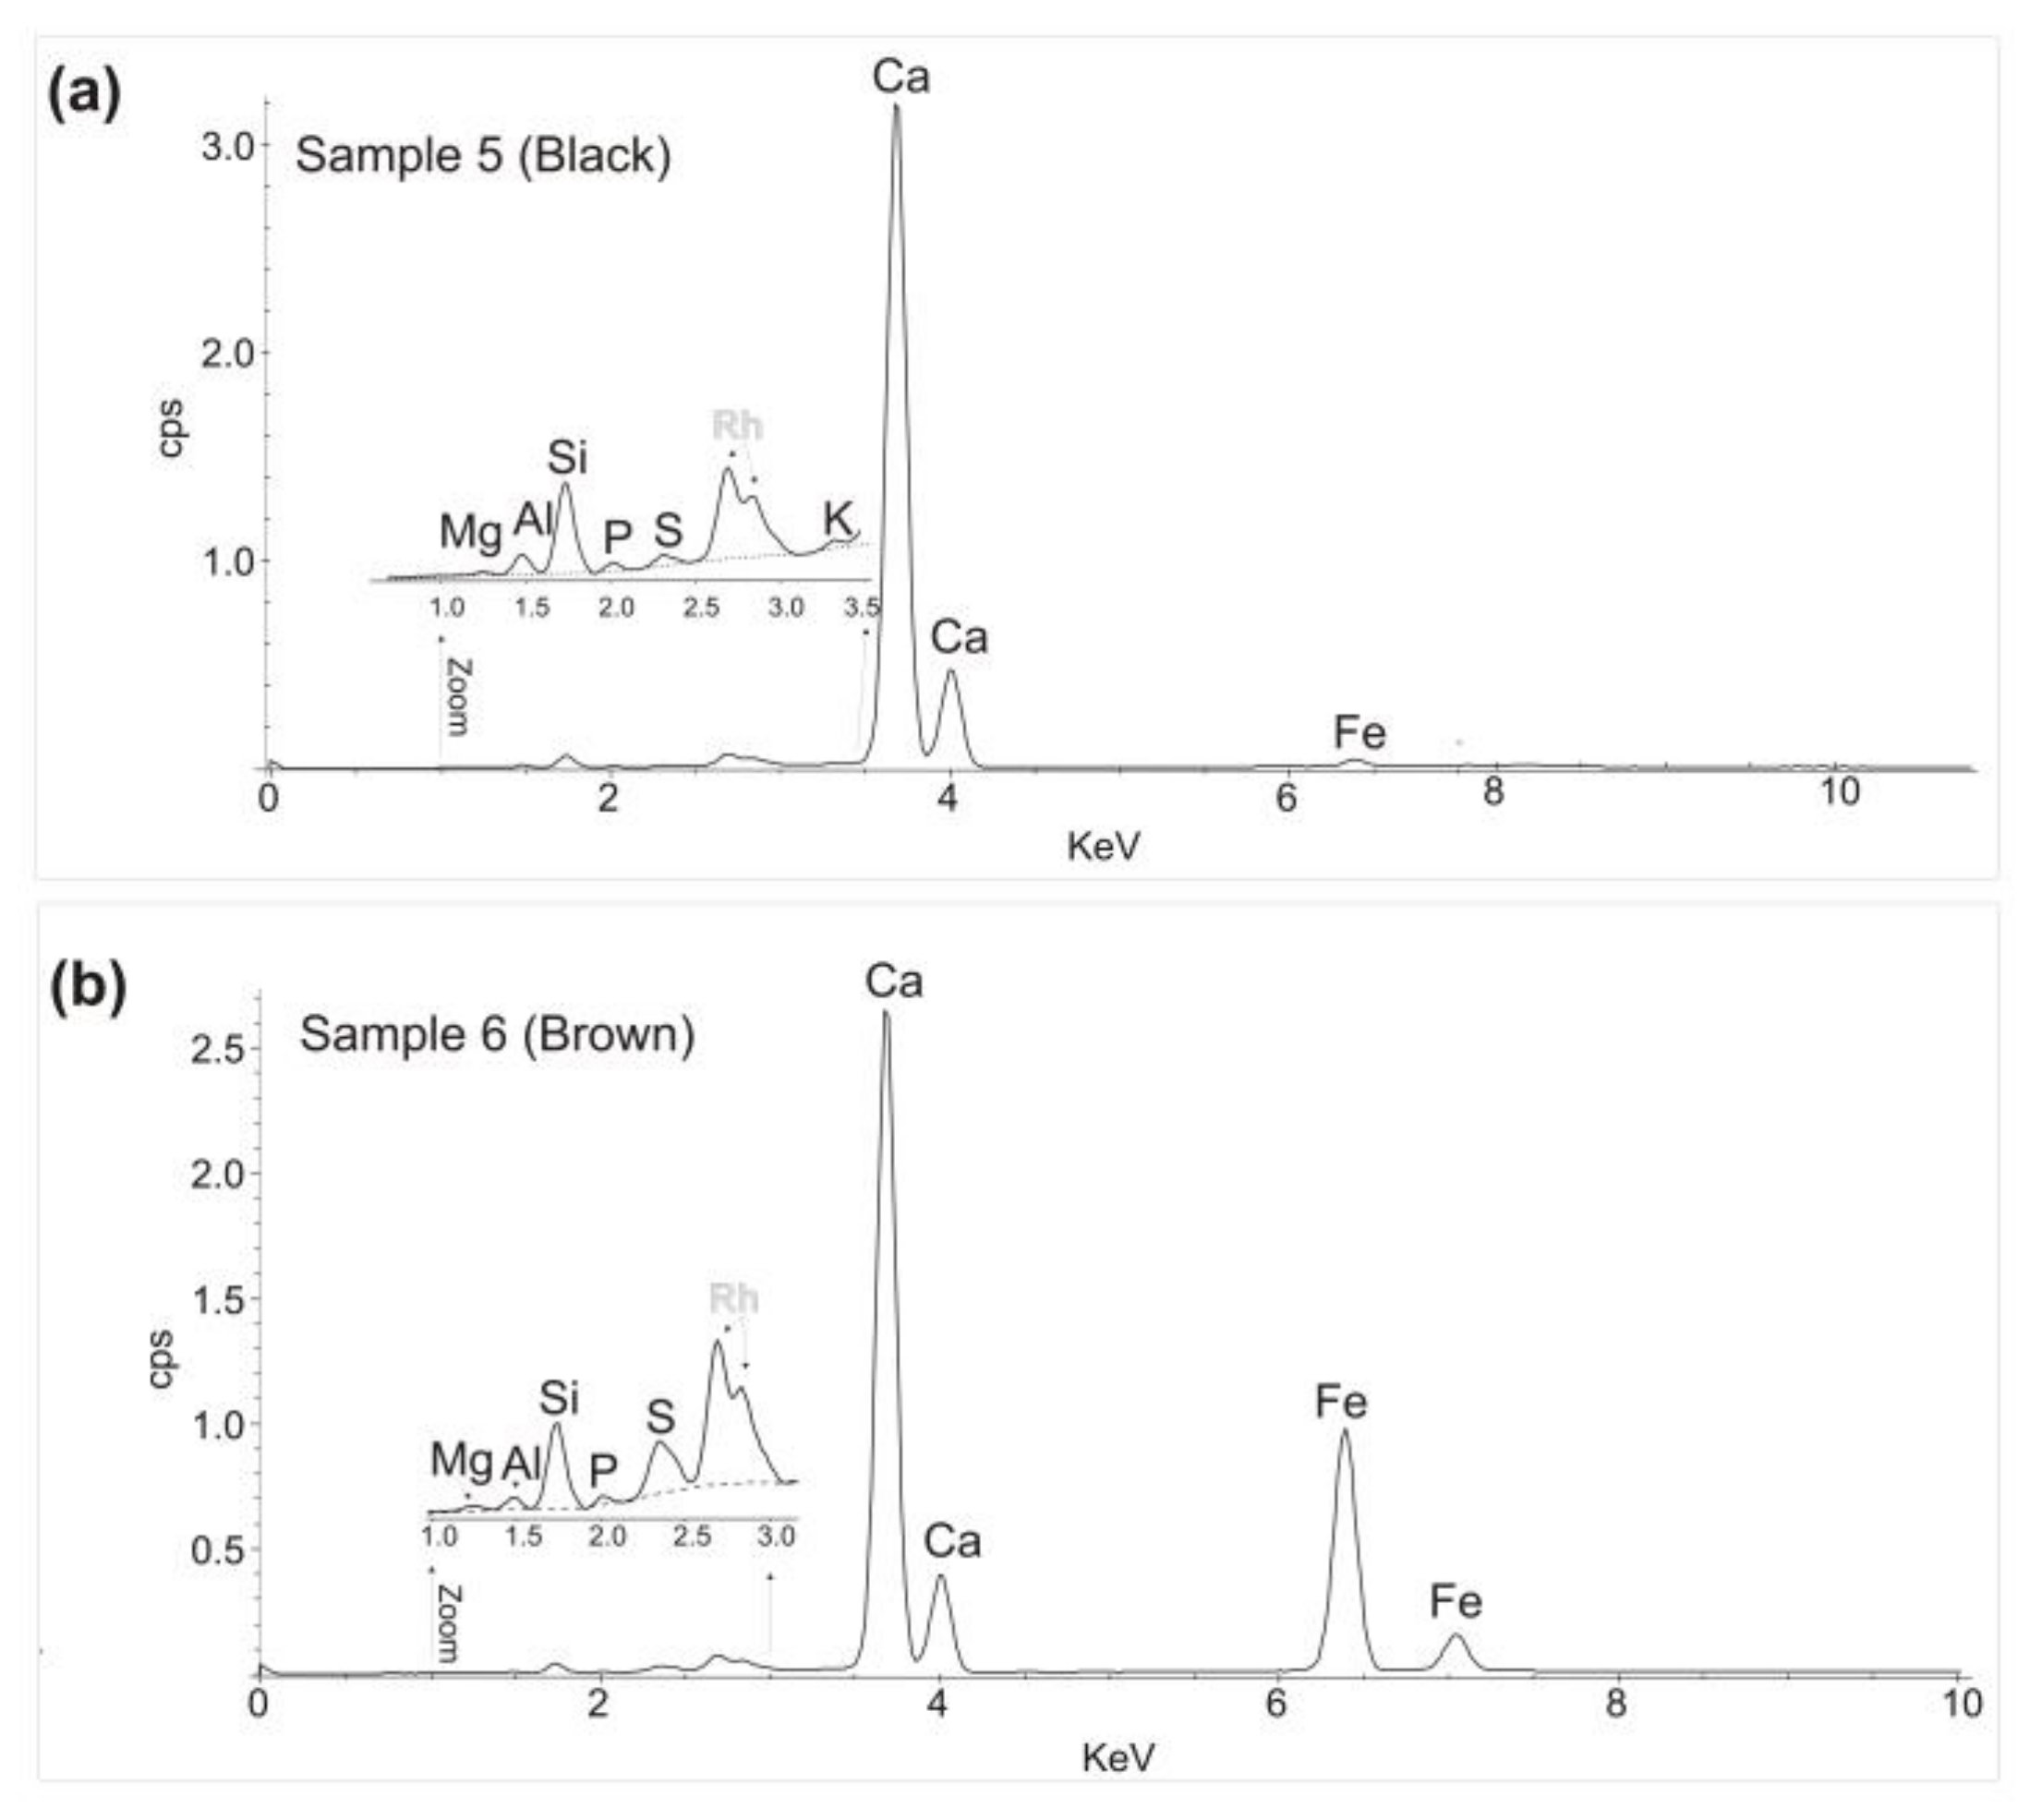
3.2. Portable X-ray Fluorescence

Portable X-ray fluorescence is one of the most frequently used techniques to obtain information on the elemental composition of the surfaces of Cultural Heritage artifacts. In the case of mural paintings, the presence of particular chemical elements or the combination of chemical elements, allows us to hypothesize the use of particular mineral pigments [36,37].
Figure 3a,b show the fluorescence spectra of the external layer of the red fragments (Samples 1 and 2). The spectra are very similar and reveal the presence of Al, Si, P, K, Ca, Ti, Mn, and Fe. The presence of rhodium (Rh) is not attributable to the layer analyzed, but comes from the source emission. In these conditions, without standard samples and calibration models, the data are not quantitative. However, the significant presence of Fe suggests that the fragments were composed of red iron oxides pigments, probably red ocher, mixed with lime.
Figure 4a,b show the fluorescence spectra of the external layers of the green fragments (Samples 3 and 4), which are also very similar. The chemical elements detected in both X-ray spectra are Mg, Al, Si, P, S, K, Ca, Ti, Mn, Fe, Ni, Cu, and Zn. The significant presence of copper and iron may be due to the use, in the pigment preparation process, of a mixture of iron hydroxides and minerals containing copper, such as malachite. In fact, Ni and Zn can be associated with the mineralization of malachite [38,39].
Figure 5 shows the X-ray spectra of the external layers of the black fragment (Sample 5—Figure 5a) and the brown fragment (Sample 6—Figure 5b). The chemical elements detected in the spectrum of the black fragment (Figure 5a) are Mg, Al, Si, P, S, K, Ca, and Fe. The high content of calcium is not due to its black coloration, but to the use of lime. The black coloration is probably due to the presence of a chemical element that cannot be detected using portable X-ray spectroscopy, such as carbon (C) derived from powdered charcoal.
The X-ray spectrum of the brown fragment (Figure 5b) shows the presence of Mg, Al, Si, P, S, K, Ca, and Fe. The significant presence of iron may indicate that iron hydroxides (mixed with lime) were used, which would explain its brown color.

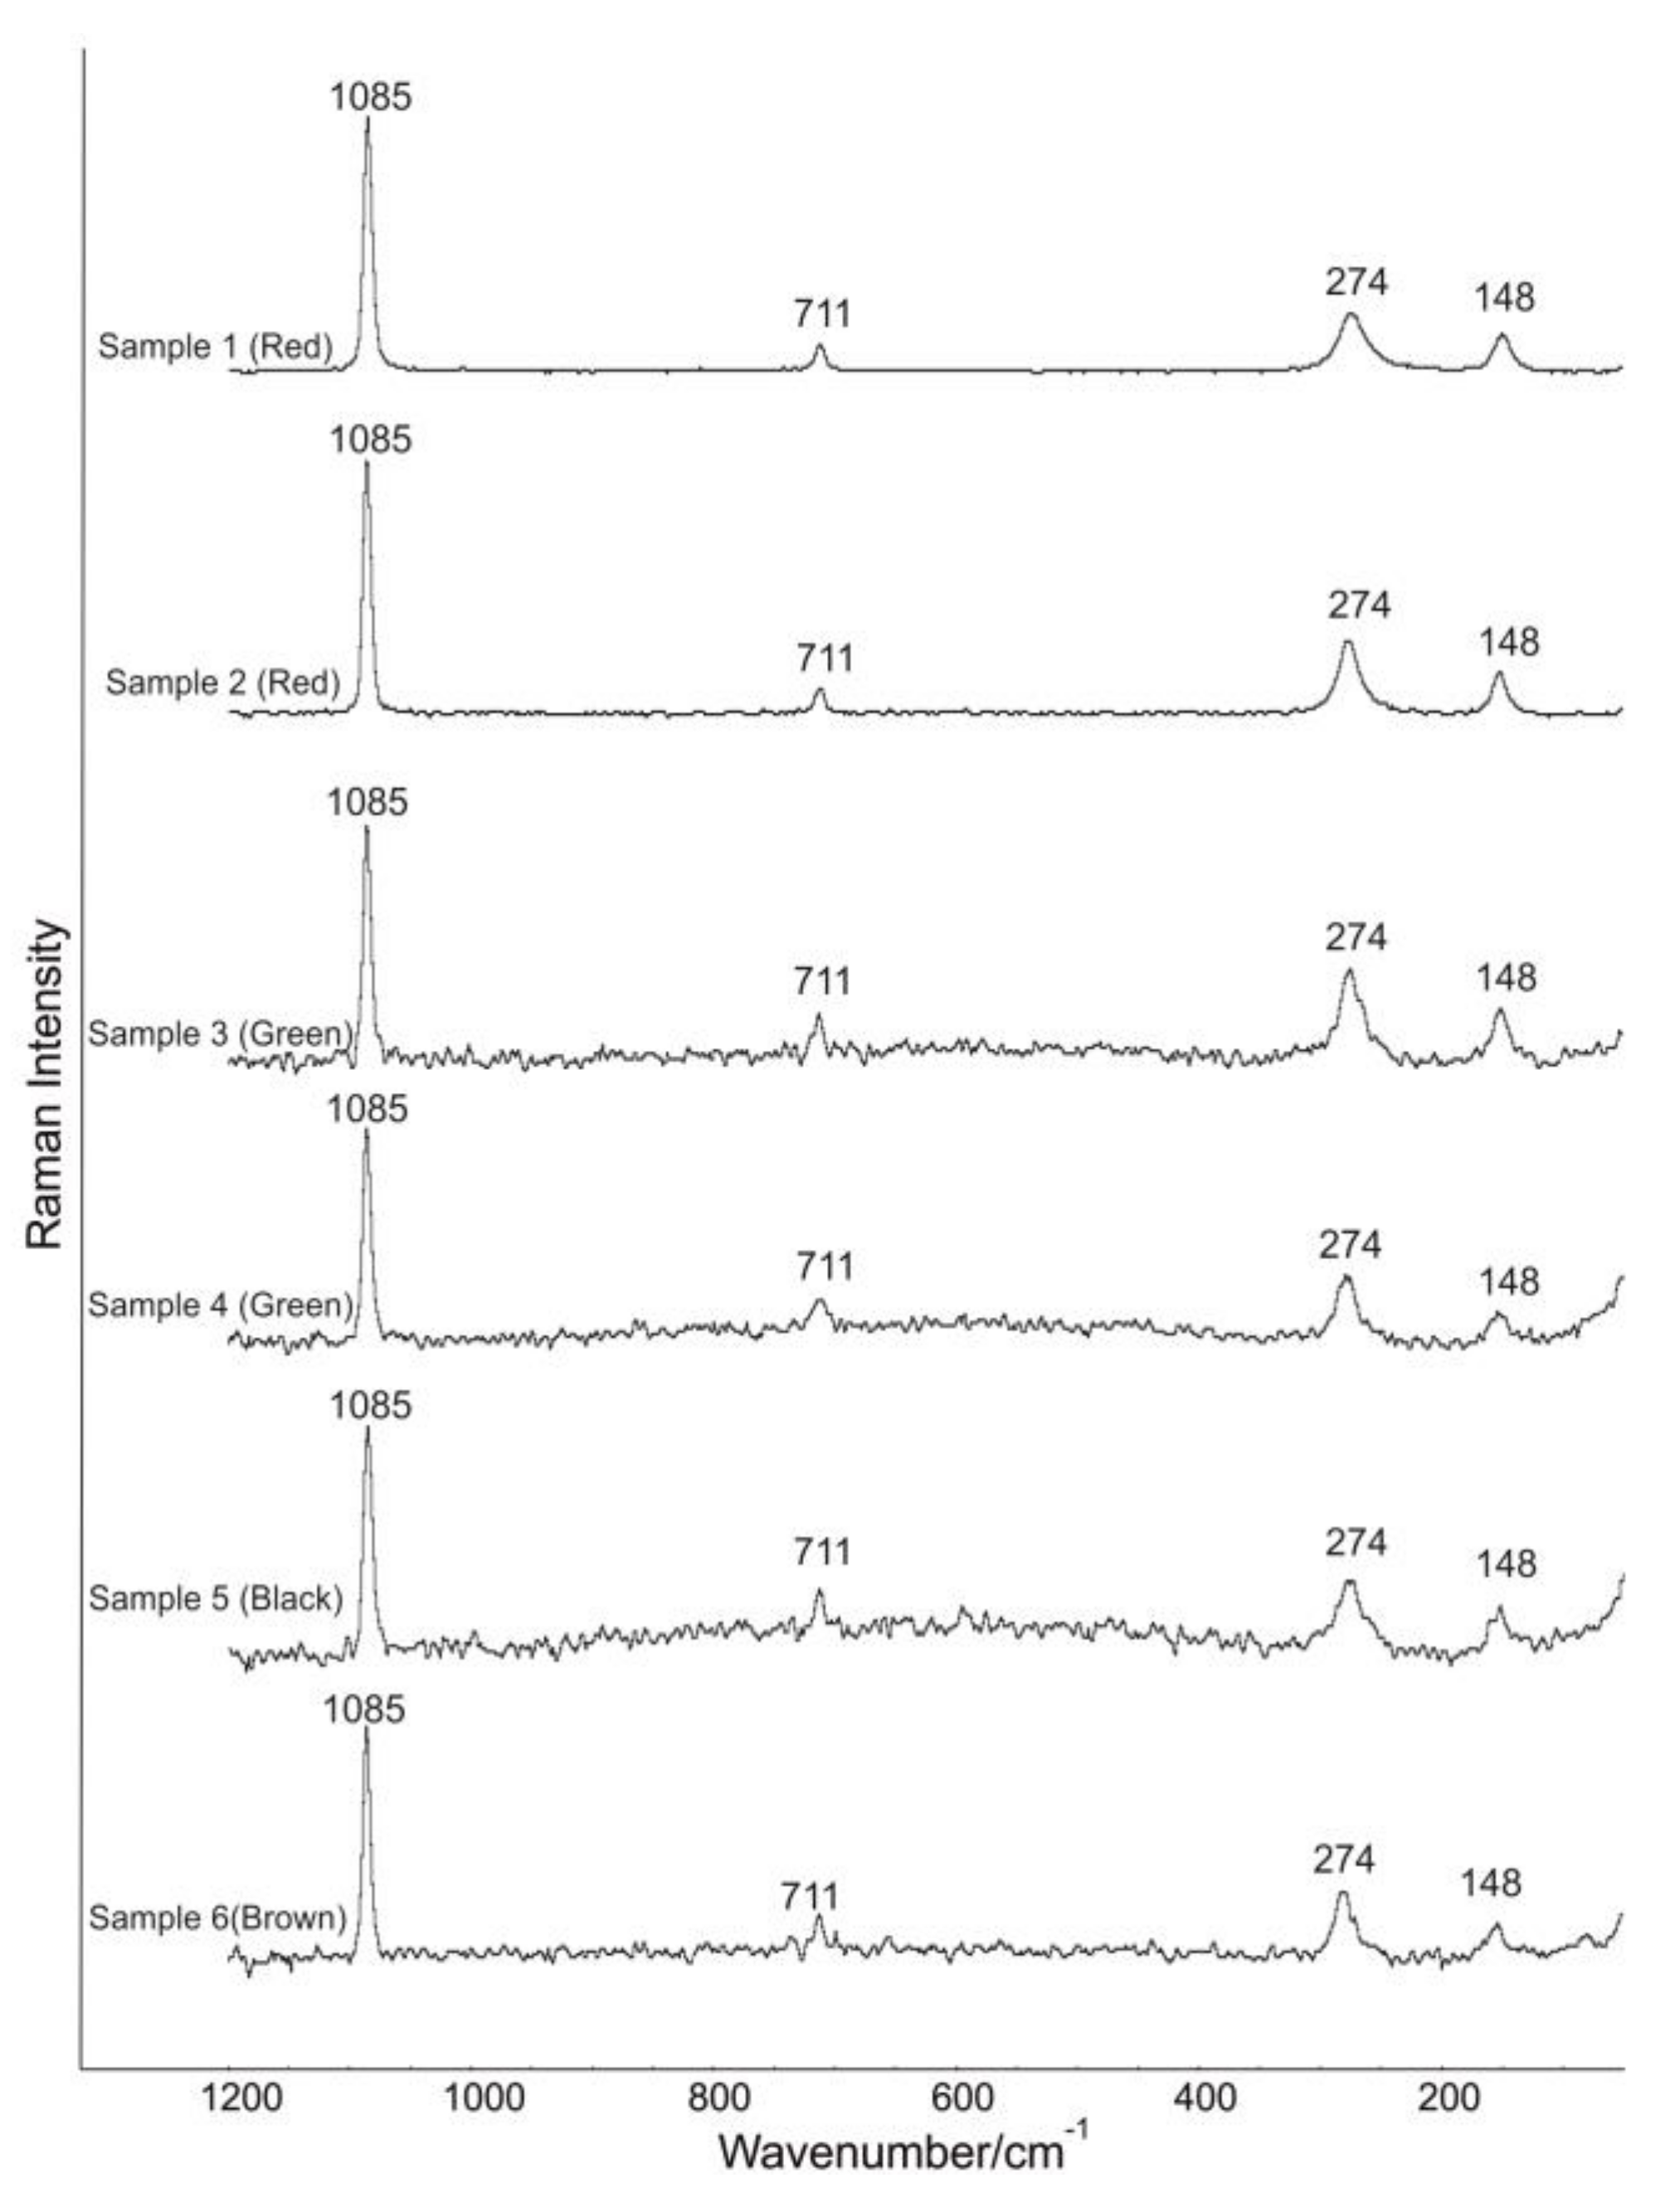
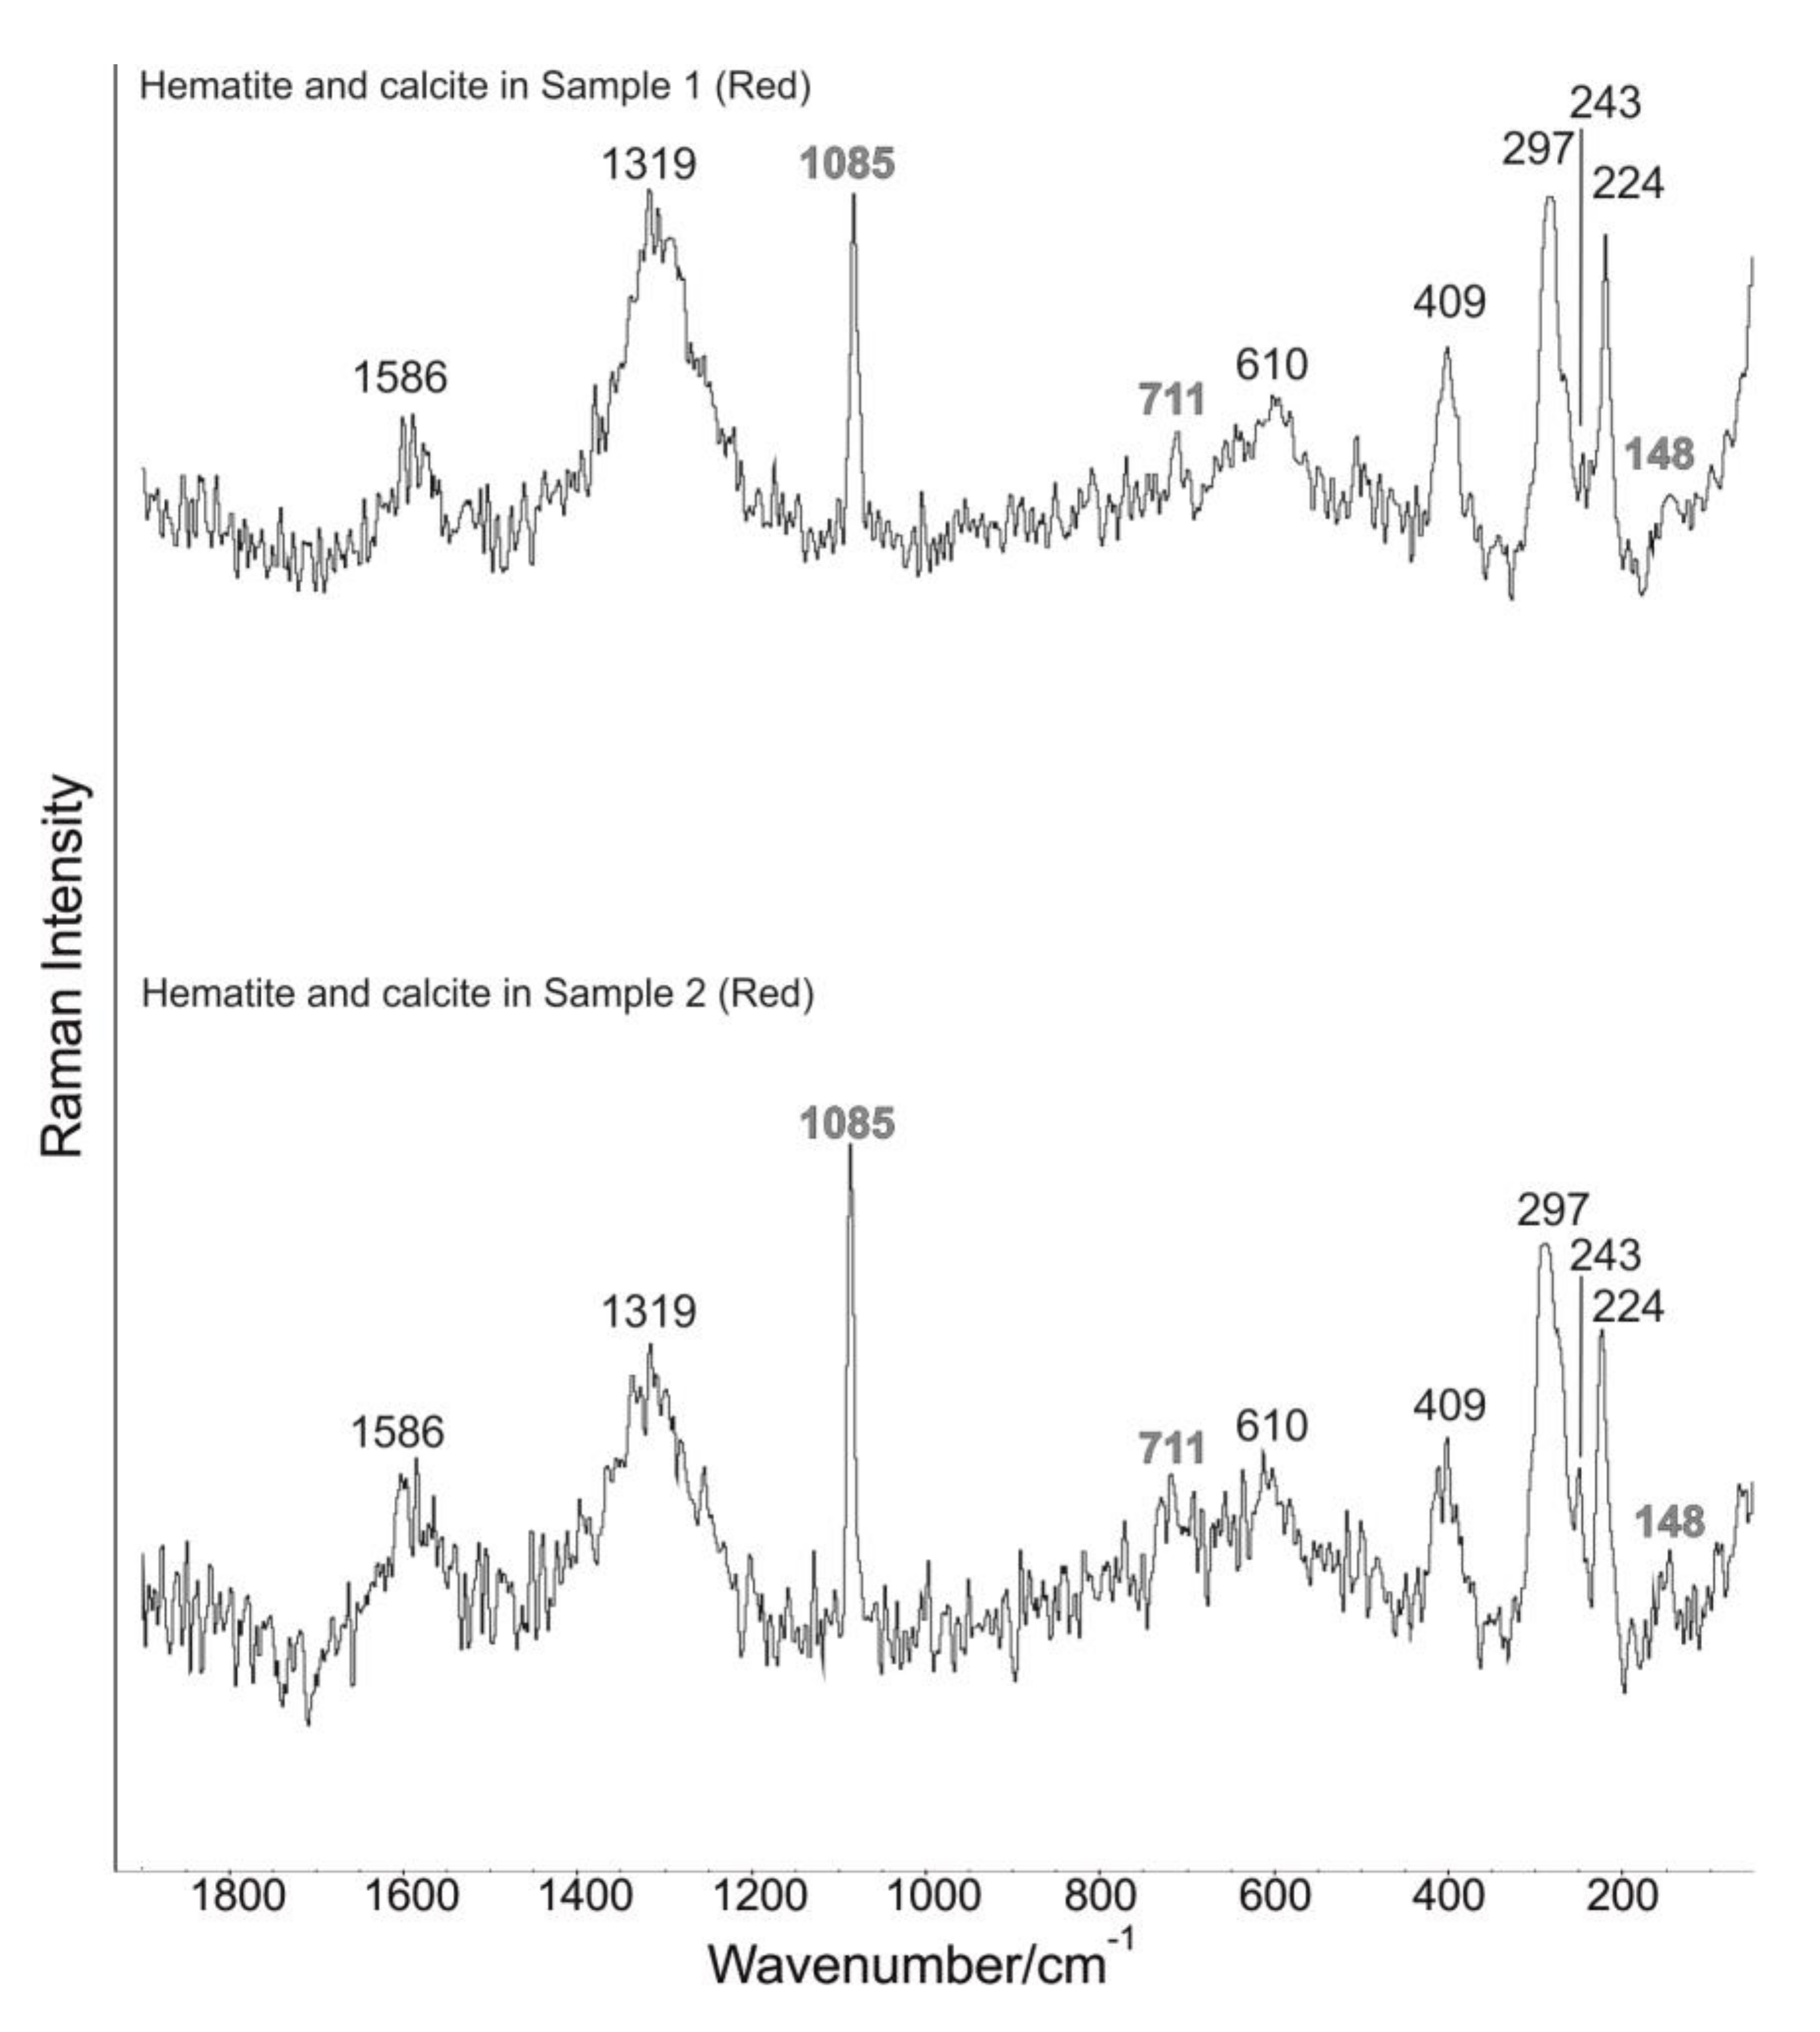
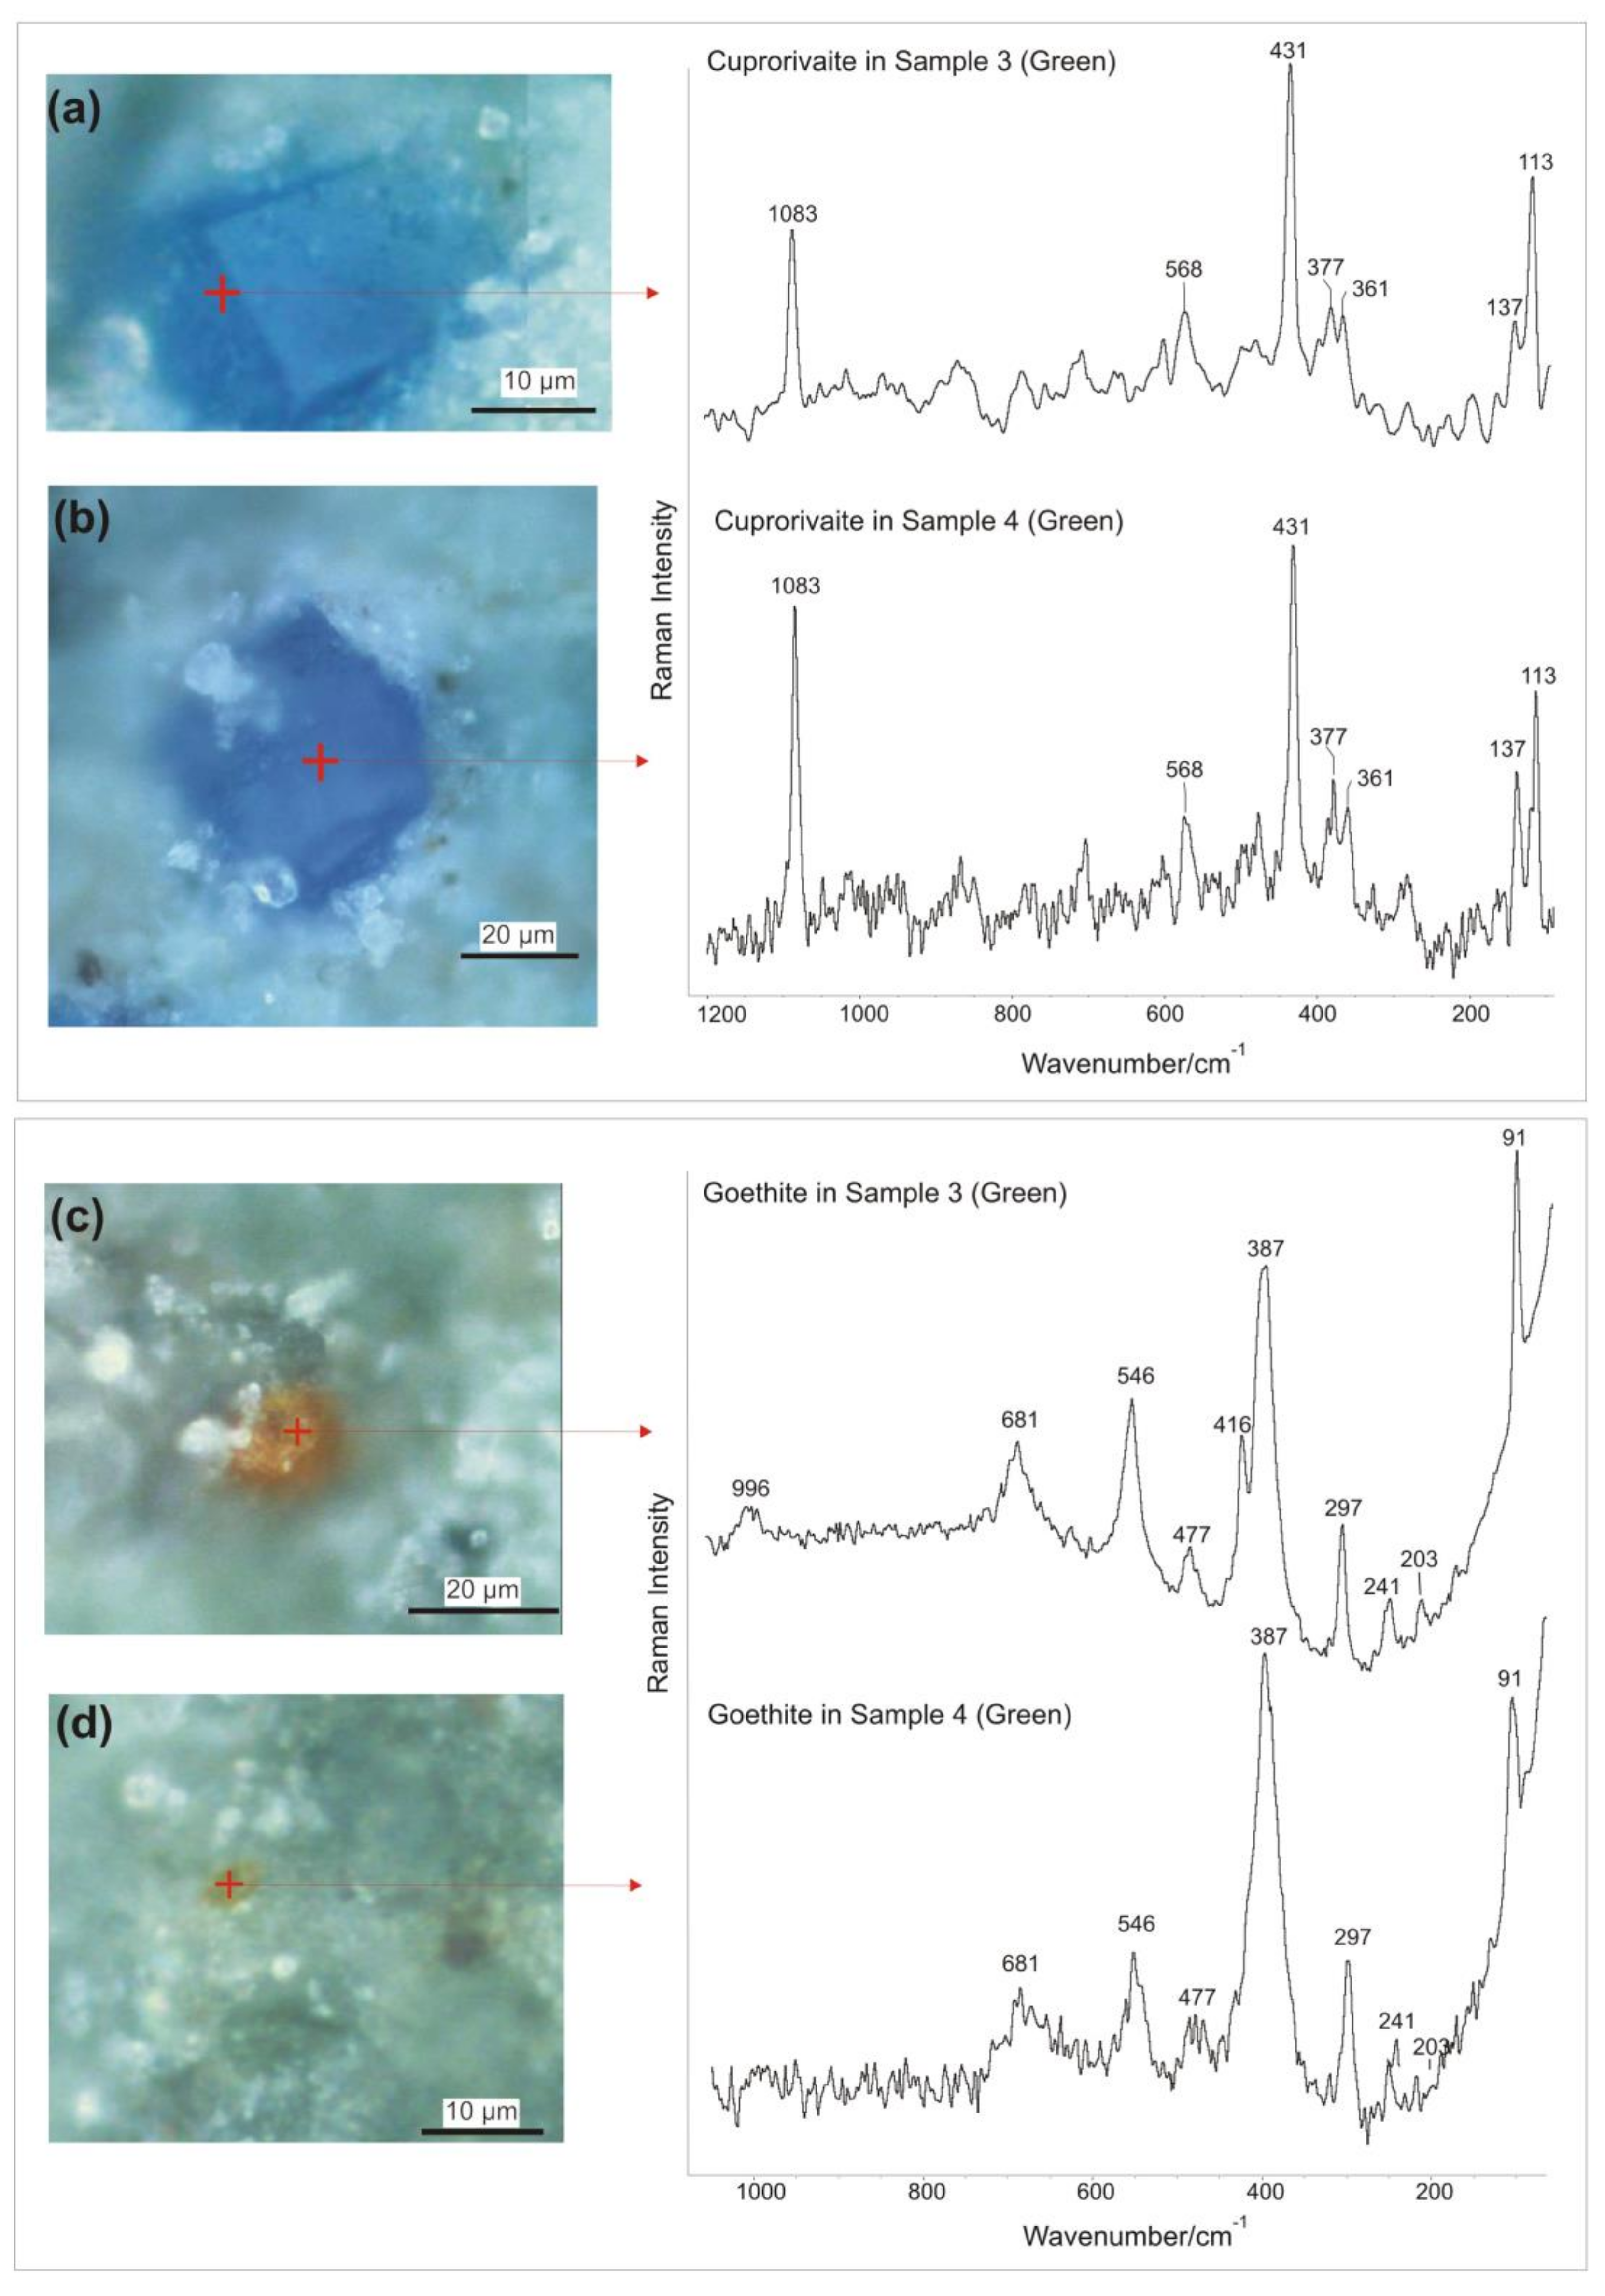
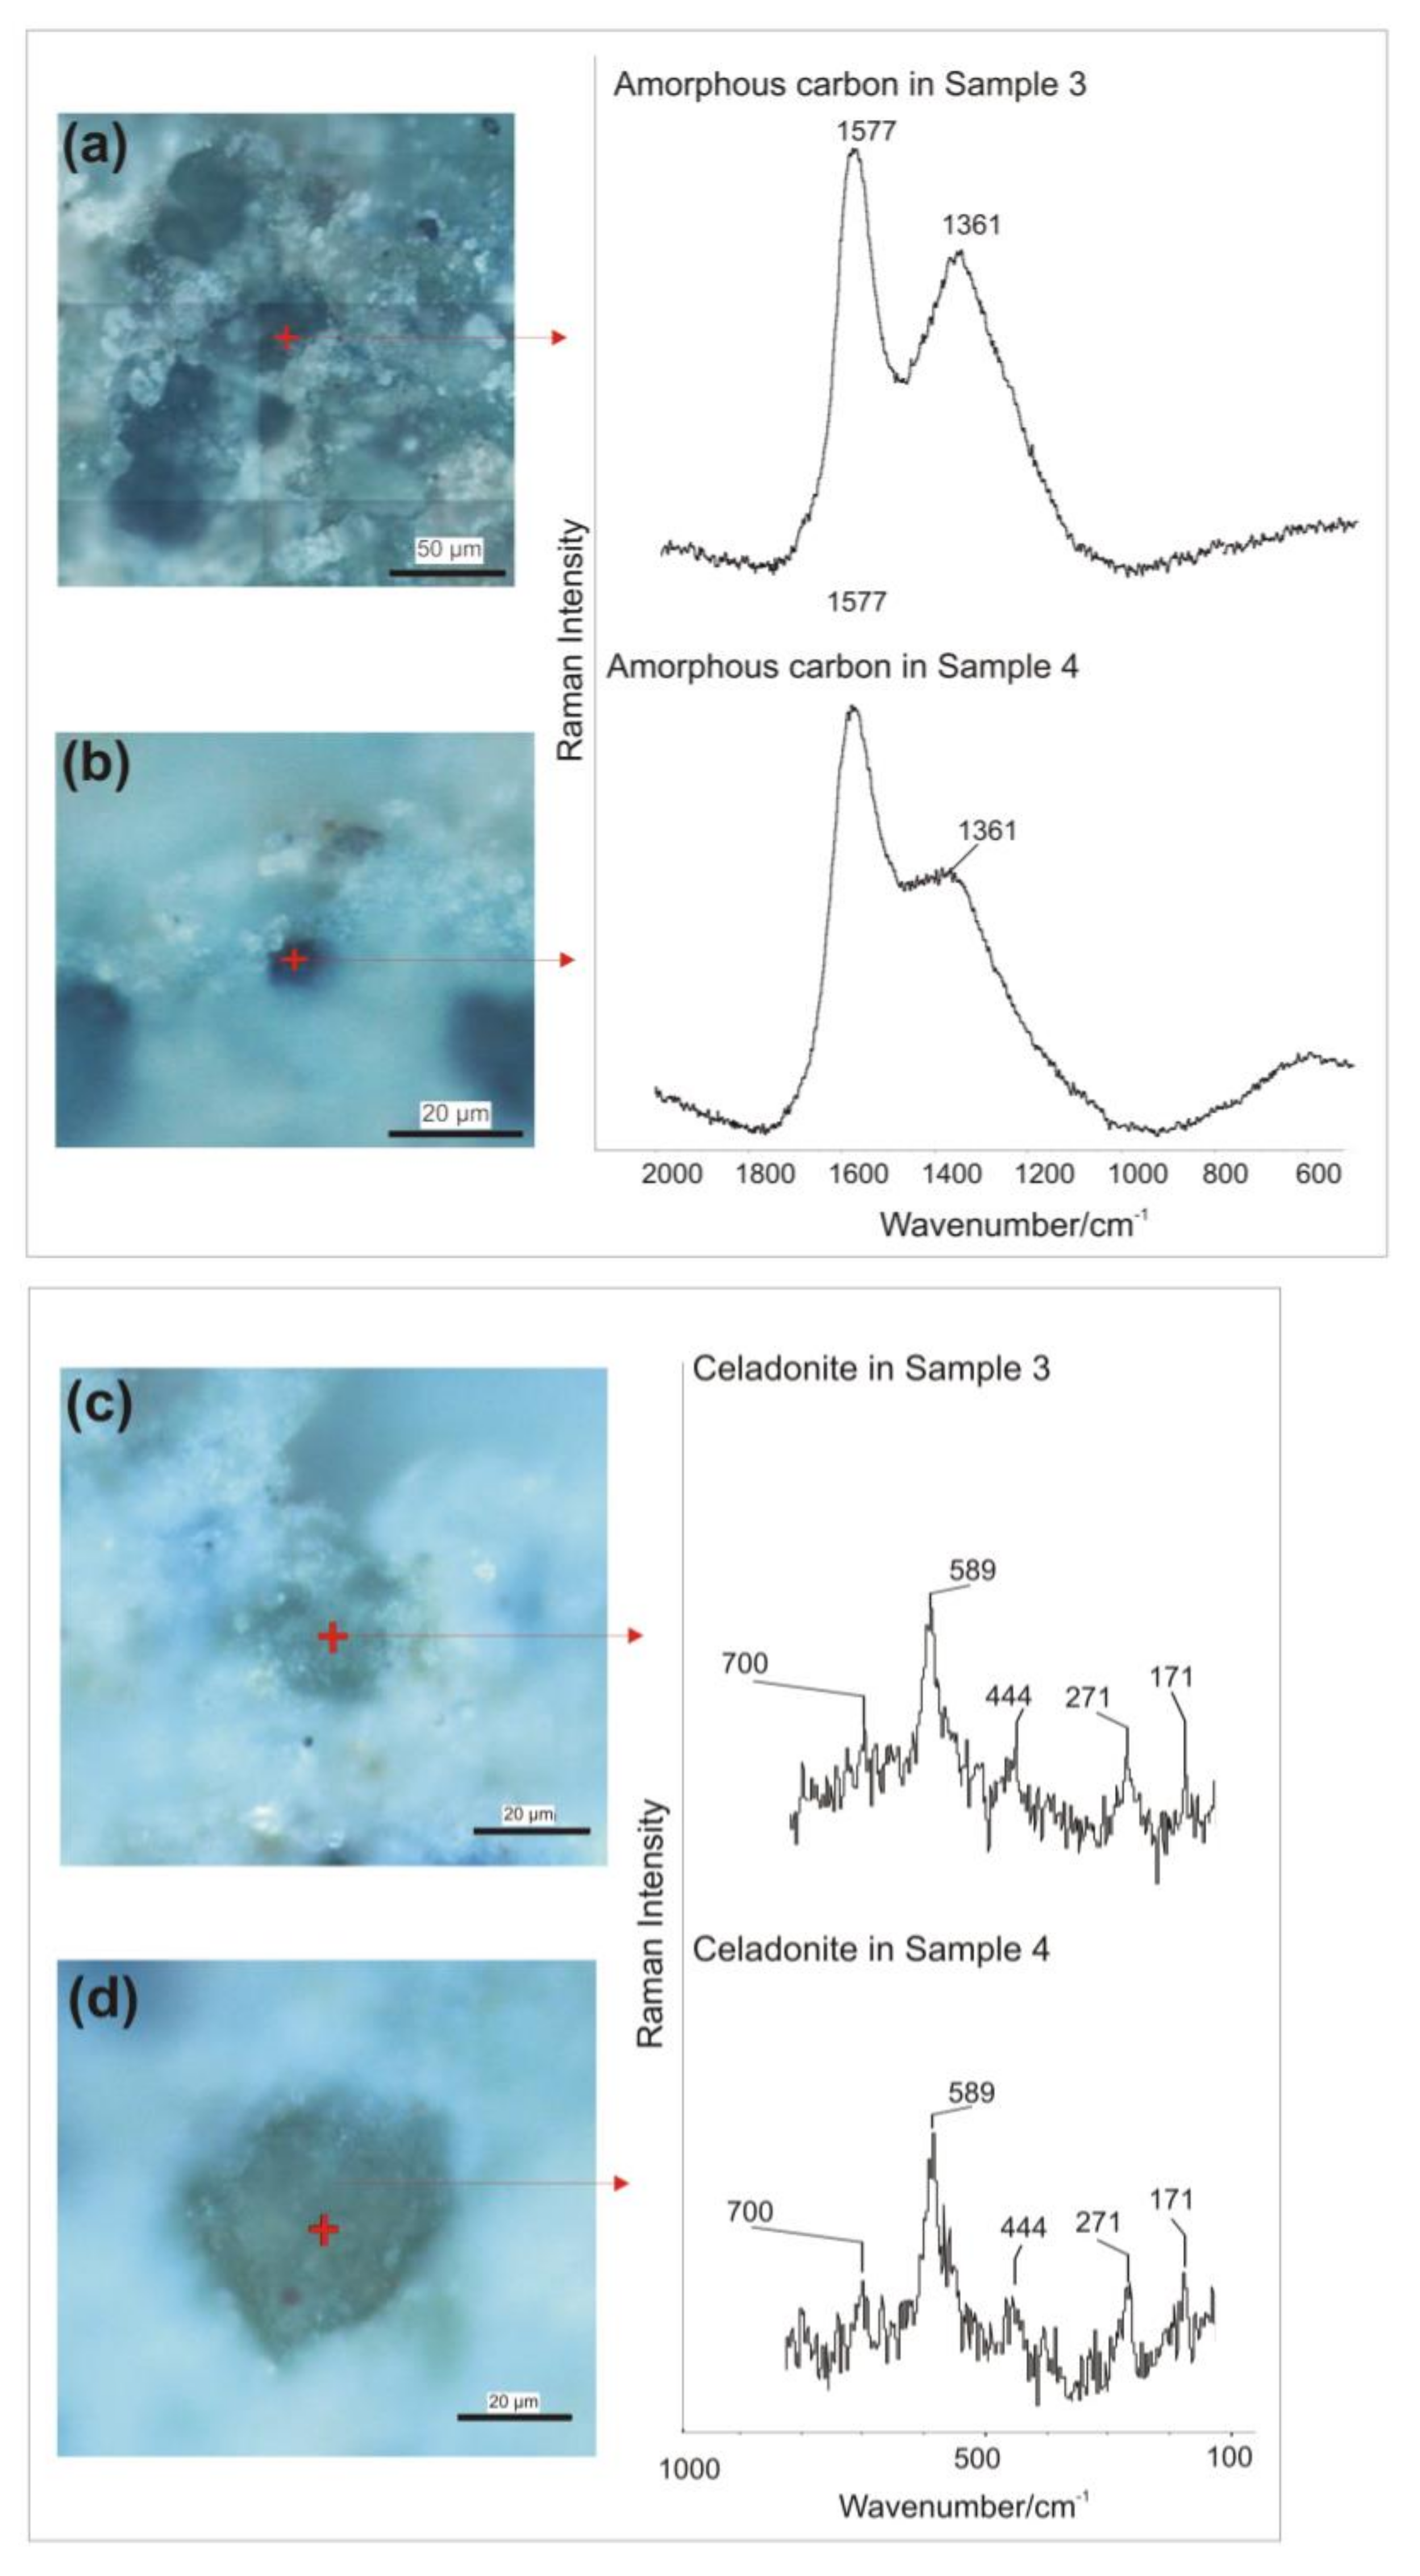
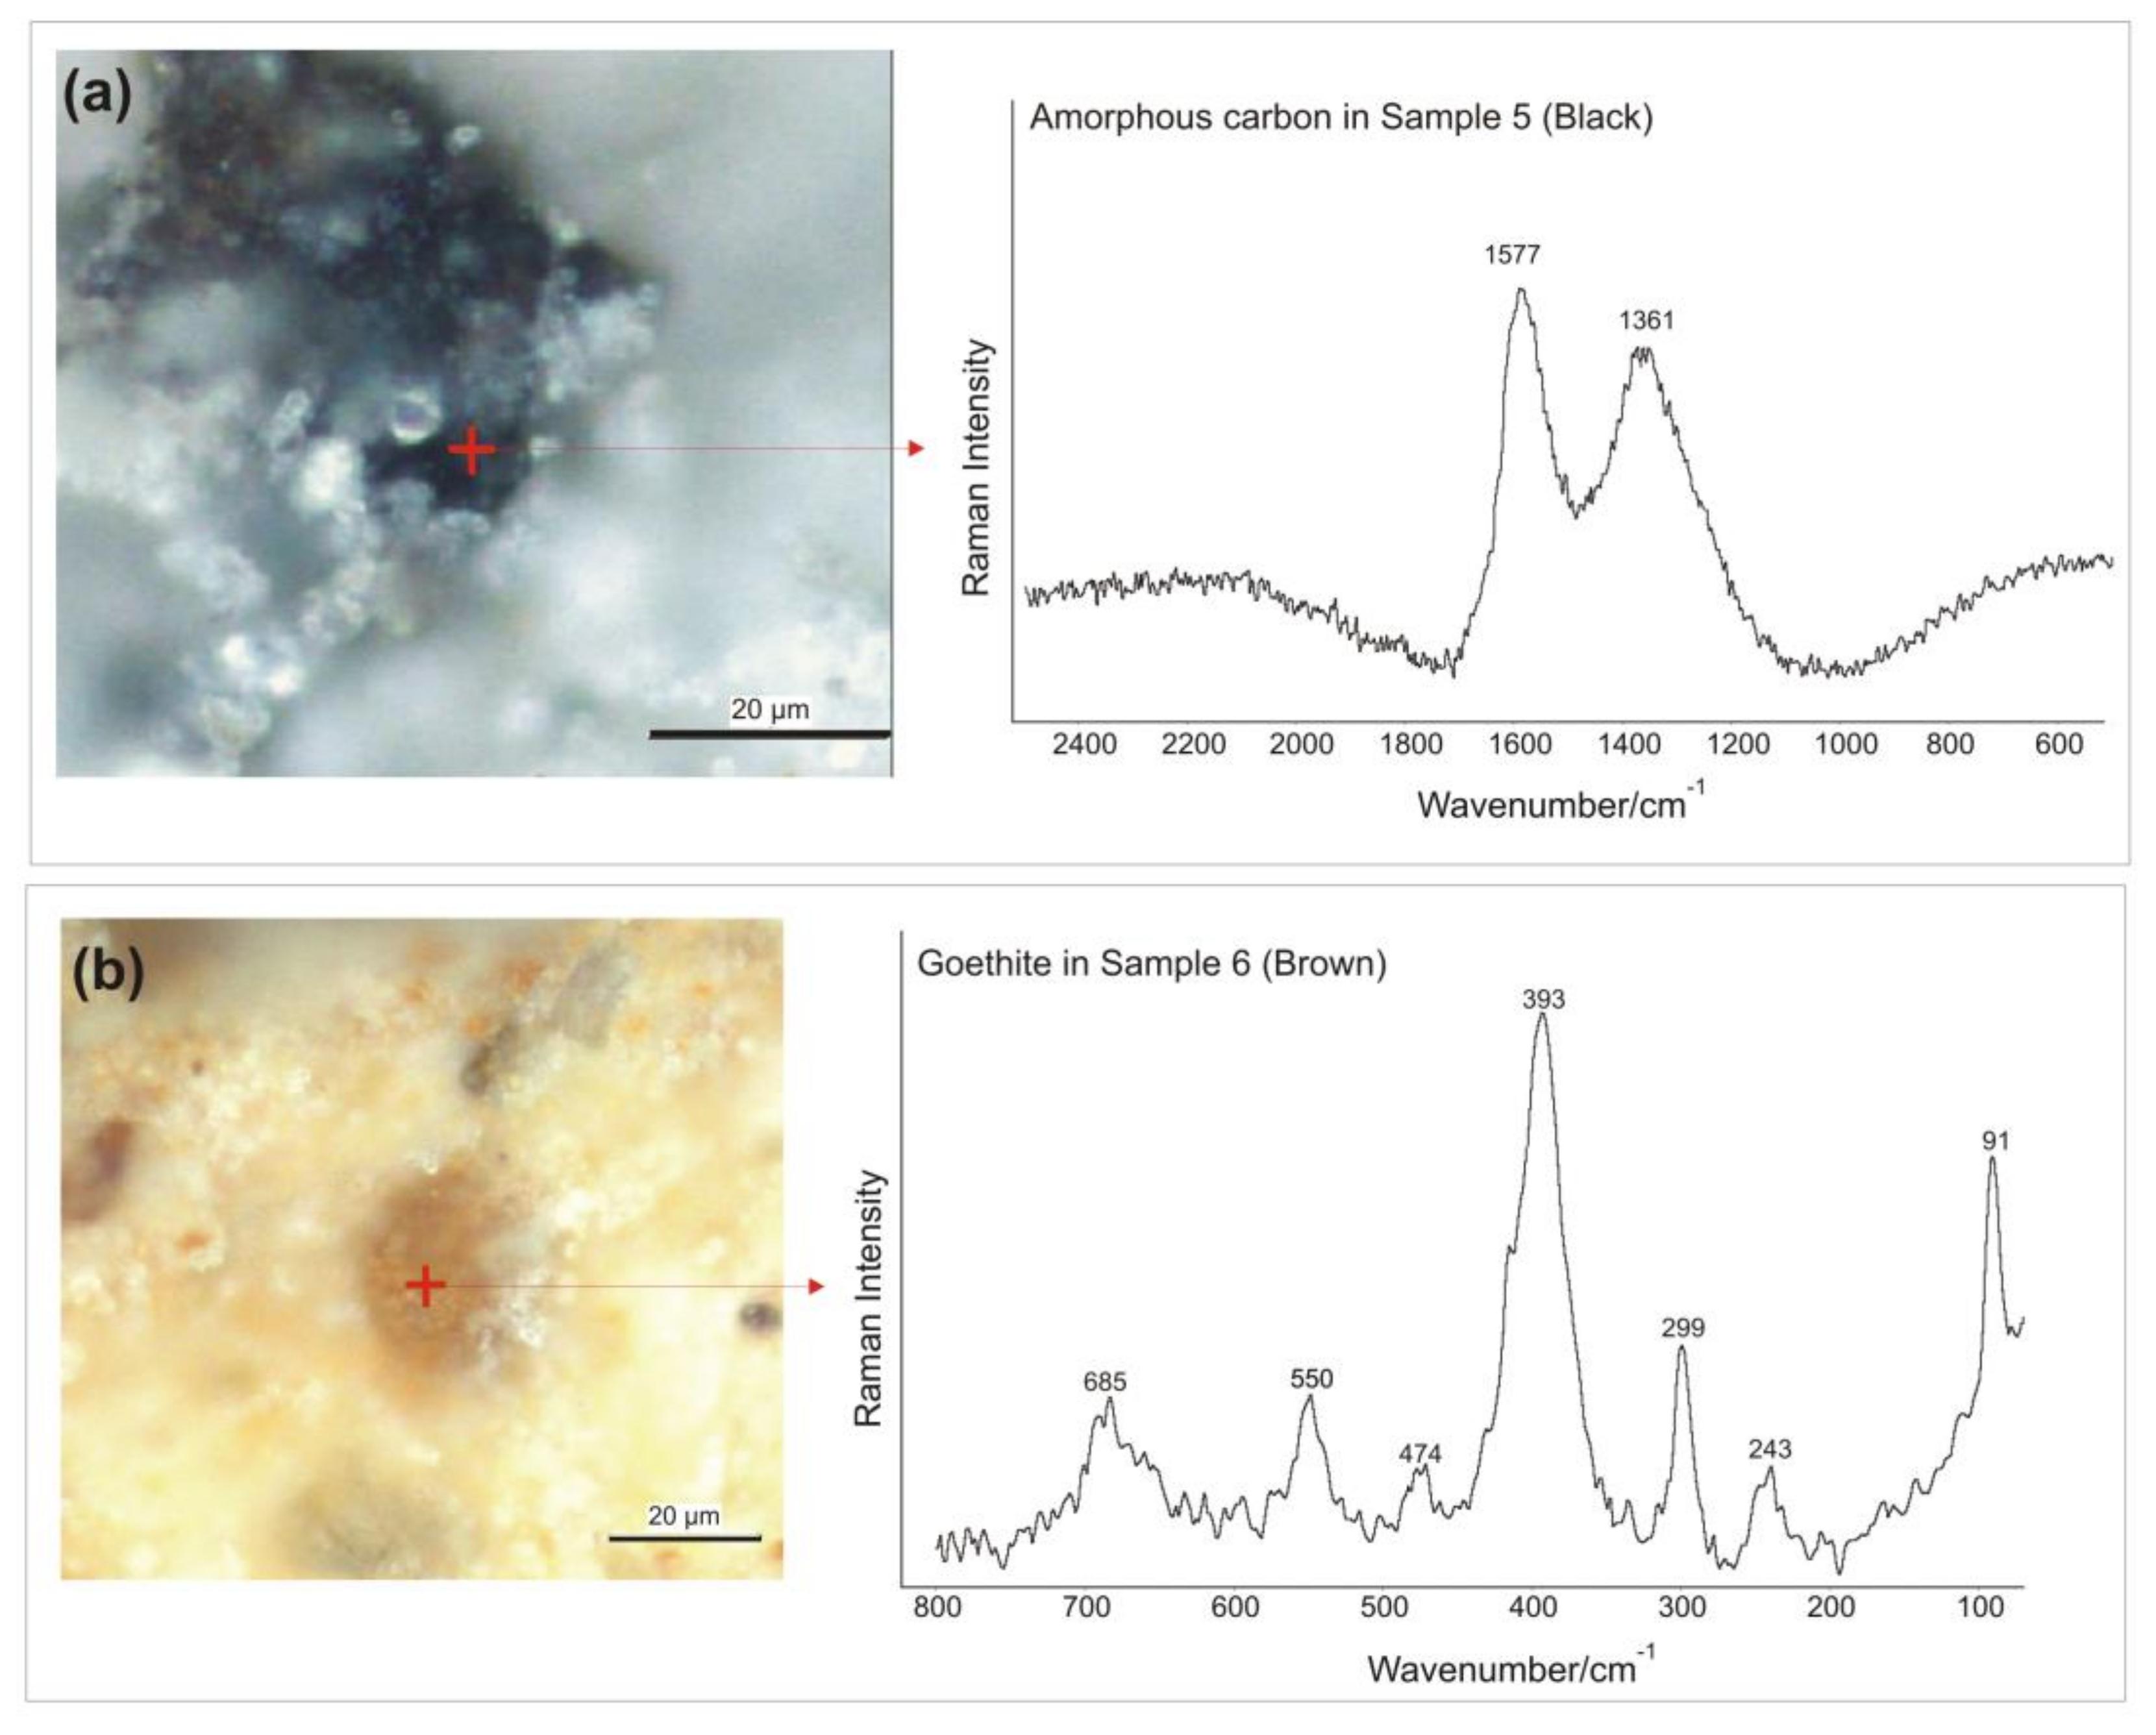
3.3. Micro-Raman Spectroscopy

Micro-Raman spectroscopy was used to check the validity of the previous hypotheses concerning the chemical composition of the samples.
Calcite was detected in all samples. Calcite (CaCO3) is due to the carbonation of lime, used as a binder to fix the mineral pigment. Figure 6 shows the Raman spectra of all samples analyzed by micro-Raman spectroscopy with the relative Raman bands typical of calcite at 148, 274, 711, and 1085 cm−1 [40].
The analysis of the red fragments (Sample 1 and Sample 2) confirmed the presence of iron oxide, in particular of hematite (Fe2O3) in both samples (Figure 7). In Figure 7, hematite bands at 224, 243, 297, 409, 610 cm−1 [41,42,43,44] can be seen as well as calcite bands. The bands at 1586 cm−1 and 1319 cm−1 are most probably also related to the presence of G and D bands of the amorphous carbon, which exhibits a strong shift [45,46]. In the past the use of pure hematite as a mineral pigment to obtain the red color was unlikely; the use of red ochre, where the red color is given by the presence of hematite [47,48], is much more likely; moreover, the Raman spectra of hematite and red ocher are very similar [49,50].
The mineralogical composition of the green fragments (Samples 3 and 4) is quite complex. Figure 8a,b show two blue euhedral cuprorivaite crystals (CaCuSi4O10) detected by Raman spectroscopy. Indeed, the relative spectra show typical cuprorivaite bands at 113, 137, 361, 377, 431, 568, and 1083 cm−1 [40,51,52,53,54,55,56]. Cuprorivaite, which is a calcium-copper tetrasilicate, is the main component of ancient Egyptian blue pigment [57], a synthetic pigment obtained by heating a mixture composed of calcite, siliceous sand, copper compounds, and natron or plant ash, to a temperature ranging between 850 °C and 950 °C [52,58,59]. Samples 3 and 4 also contain brown minerals, which can be seen in Figure 8c,d, which are goethite crystals (Fe+3O(OH)). In fact, the relative Raman spectra show typical bands at 91, 203, 241, 297, 387, 416, 477, 546, and 681 cm−1 [41,60,61].
Numerous charcoal fragments were detected in the green fragments (Figure 9a,b), as confirmed by the Raman spectra, where Raman bands of amorphous carbon at 1361 and 1577 cm−1 [45,46] were observed. Another mineral with a green hue present in Samples 3 and Sample 4 is celadonite (K[(Al, Fe3+), (Fe2+, Mg)](AlSi3, Si4)O10(OH)2) (Figure 9c,d), which was detected by the Raman bands at 171, 271, 444, 589, and 700 cm−1 [59]. In addition to glauconite, clayey micas celadonite is one of the main components of the “green earths”, which have been used as pigments since antiquity [62]. The coexistence of cuprorivaite, goethite, and celadonite in Pompeian green pigments has been highlighted by previous works [19]. As a matter of fact, Egyptian blue (cuprorivaite) and “yellow ocher” (goethite) were mixed together to obtain different green hues; while the “green earths” (celadonite) were added to the mixture in order to enhance the color brilliance of the green pigments [19]. Powdered charcoal was frequently added to various pigments to create darker shades and this is probably why it was found in Samples 3 and 4.
The black color of the black fragment (Sample 5) is due to the large amount of finely pulverized charcoal mixed with lime, as demonstrated by the Raman spectrum shown in Figure 10a, in which Raman bands of amorphous carbon at 1361 and 1577 cm−1 [45,46] can be seen.
In contrast, the brown fragment (Sample 6) is mainly composed of brown minerals mixed with lime, which are classified as goethite due to the presence of Raman bands at 91, 243, 299, 393, 474, 550, and 685 cm−1 [41,60,61] (Figure 10b).
A synthesis of the minerals identified by Raman spectroscopy with their typical Raman bands is shown in Table 1, describing the composition of each pigment.

4. Conclusions

In this study, we successfully applied a non-destructive multi-analytical approach to analyze exceptionally preserved wall painting fragments which had been reused as recycled coarse aggregate to make the preparatory layer (rudus) of an ancient Pompeian pavement. The compositional results obtained are very important, because they provided us with insight into the pigments used in Pompeian wall paintings, which had not undergone mineralogical and chromatic changes due to the increase in temperature during the 79 AD eruption. For this reason, the colorimetric data presented probably provide us with the most “faithful picture” of the various red, green, black, and brown pigments used in Pompeii prior to the 79 AD eruption.
The study highlighted the use of hematite as a primary mineral pigment for red paintings (as shown in Samples 1 and 2). The red color of these samples was the hue that the painters of that time really wished to use. As the samples were in a good state of preservation, we can confirm that their red color is original and not due to mineralogical transformation (dehydration) from goethite (yellow ochre with brown hues) to hematite (with red hues), caused by high temperatures of approximately 250 °C [63,64], as in the case of the Herculaneum wall paintings, where the original brown color may have changed to red following the 79 AD eruption [65]. Therefore, our data indicate that using hematite as a primary mineral to make red pigments was common practice in Pompeii, probably because it was less expensive than the precious cinnabar (HgS).
The results of analyses carried out on the green fragments (Samples 3 and 4) confirmed the findings of previous studies [19], in particular confirming that the Pompeians obtained green pigment by mixing Egyptian blue and yellow ochre and added “green earths” (celadonite) to enhance the color brilliance of the green pigments.
Powdered charcoal was used to obtain the black pigment (Sample 5) and to create darker shades of other pigments, such as green pigments (Samples 3 and 4).
The characterization of the brown fragment (Sample 6) detected the presence of goethite as the main mineral used to obtain the brown color, confirming that goethite was commonly used in the wall paintings of Pompeii [17,19].
This study shows the importance of combining different non-destructive analytical techniques (micro-Raman, p-XRF, and colorimetry) to obtain an exhaustive characterization of the mineral pigments without damaging the samples; as matter of fact, these techniques are complementary. Portable X-ray fluorescence (p-XRF) and colorimetry alone are not sufficient for solving the issues regarding the composition of the ancient wall paintings. P-XRF and colorimetry provide non-punctual information, working on spots ranging from about 25 to 50 mm2. Micro-Raman spectroscopy allows one to overcome this problem by punctual analyses with a spatial resolution of about 3–5 µm.

Supplementary Materials

The following are available online at https://www.mdpi.com/2075-163X/8/4/134/s1, Figure S1: Location of the wall painting fragments “in situ” in Via di Mercurio (Regio VI, 9, 3) in Pompeii.

Acknowledgments

We would like to thank the Archaeological Park of Pompeii and especially all of the experts who assisted us in the various stages of the study. This study is part of the “collaboration agreement” signed between the Applied Research Laboratory of Archeological Park of Pompeii and the Department of Biology, Ecology and Earth Science (DiBEST) of the University of Calabria. It is also part of the activities of A. Pecci’s Ramon y Cajal contract (RYC 2013-13369) and the ERAAUB Consolidated Group (2017 SGR 1043). The analyses were carried out at the XRF and Raman Laboratories of the University of Calabria. The archeological excavations were carried out from June 2015 to December 2016. Francesco Sirano was the Head of the Project and Gianluca Vitagliano was the Site Director. The archeological directors were Laura D’ Esposito, Marialaura Iadanza, and Alberta Martellone. In situ excavation investigations were carried out by the archaeologists Concetta Costa, Dora D’Auria, Alessandro Russo, Serenella Paola Scala, and Teresa Virtuoso.

Author Contributions

B.D.N., A.M., M.O., R.P., A.P. and N.R. contributed in the archaeological part; D.M., A.B., G.M.C. and R.D.L. performed the analyses and analyzed the data; D.M. wrote the paper.

Conflicts of Interest

The authors declare no conflict of interest.

References

  1. Senatore, M.R.; Ciarallo, A.; Stanley, J.D. Pompeii damaged by volcaniclastic debris flows triggered centuries prior to the 79 AD Vesuvius eruption. Geoarchaeology 2014, 29, 1–15. [Google Scholar] [CrossRef]
  2. Richardson, L.J.R. Pompeii: An Architectural History; Johns Hopkins University Press: Baltimore, MD, USA, 1988. [Google Scholar]
  3. Santini, L. Pompeii; Plurigraf: Sesto Fiorentino, Italy, 2004. [Google Scholar]
  4. Varone, A. Pompeii. I Misteri di una Città Sepolta-Storia e Segreti di un Luogo in Cui la Vita si è Fermata Duemila Anni fa; Newton Compton Editori: Roma, Italy, 2005. [Google Scholar]
  5. De Vos, A.; De Vos, M. Pompei, Ercolano e Stabia. Guide Archeologiche; Laterza: Bari, Italy, 1982. [Google Scholar]
  6. Castriota, M.; Cosco, V.; Barone, T.; De Santo, G.; Carafa, P.; Cazzanelli, E. Micro-Raman characterizations of Pompei’s mortars. J. Raman Spectrosc. 2008, 39, 295–301. [Google Scholar] [CrossRef]
  7. Kastenmeier, P.; Di Maio, G.; Balassone, G.; Boni, M.; Joachimski, M.; Mondillo, N. The source of stone building materials from the Pompeii archaeological area and its surroundings. Period. Mineral. 2010, 79, 39–58. [Google Scholar]
  8. Miriello, D.; Barca, D.; Bloise, A.; Ciarallo, A.; Crisci, G.M.; De Rose, T.; Gattuso, C.; Gazineo, F.; La Russa, M.F. Characterisation of archaeological mortars from Pompeii (Campania, Italy) and identification of construction phases by compositional data analysis. J. Archaeol. Sci. 2010, 37, 2207–2223. [Google Scholar] [CrossRef]
  9. Maguregui, M.; Knuutinen, U.; Trebolazabala, J.; Morillas, H.; Castro, K.; Martinez-Arkarazo, I.; Madariaga, J.M. Use of in situ and confocal Raman spectroscopy to study the nature and distribution of carotenoids in brown patinas from a deteriorated wall painting in Marcus Lucretius House (Pompeii). Anal. Bioanal. Chem. 2012, 402, 1529–1539. [Google Scholar] [CrossRef] [PubMed]
  10. Grifa, C.; De Bonis, A.; Langella, A.; Mercurio, M.; Soricelli, G.; Morra, V. A Late Roman ceramic production from Pompeii. J. Archaeol. Sci. 2013, 40, 810–826. [Google Scholar] [CrossRef]
  11. Piovesan, R.; Dalconi, M.C.L.; Maritan, C.; Mazzoli, C. X-ray powder diffraction clustering and quantitative phase analysis on historic mortars. Eur. J. Mineral. 2013, 25, 165–175. [Google Scholar] [CrossRef]
  12. Scarpelli, R.; Clark, R.J.H.; De Francesco, A.M. Archaeometric study of black-coated pottery from Pompeii by different analytical techniques. Spectrochim. Acta A 2014, 120, 60–66. [Google Scholar] [CrossRef] [PubMed]
  13. De Luca, R.; Miriello, D.; Pecci, A.; Domínguez-Bella, S.; Bernal-Casasola, D.; Cottica, D.; Bloise, A.; Crisci, G.M. Archaeometric study of mortars from the Garum Shop at Pompeii, Campania, Italy. Geoarchaeology 2015, 30, 330–351. [Google Scholar] [CrossRef]
  14. Scarpelli, R.; De Francesco, A.M.; Gaeta, M.; Cottica, D.; Toniolo, L. The provenance of the Pompeii cooking wares: Insights from LA–ICP-MS trace element analyses. Microchem. J. 2015, 119, 93–101. [Google Scholar] [CrossRef]
  15. Augusti, S. I Colori Pompeiani, Studi e Documentazioni I; Ministero della Pubblica Istruzione, Direzione Generale delle Antichità e Belle Arti, De Luca Editori: Roma, Italy, 1967. [Google Scholar]
  16. Zanella, E.; Gurioli, L.; Chiari, G.; Ciarallo, A.; Cioni, R.; De Carolis, E.; Lanza, R. Archaeomagnetic results from mural paintings and pyroclastic rocks in Pompeii and Herculaneum. Phys. Earth Planet. Inter. 2000, 118, 227–240. [Google Scholar] [CrossRef]
  17. Cotte, M.; Susini, J.; Metrich, N.; Moscato, A.; Gratziu, C.; Bertagnini, A.; Pagano, M. Blackening of Pompeian cinnabar paintings: X-ray microspectroscopy analysis. Anal. Chem. 2006, 78, 7484–7492. [Google Scholar] [CrossRef] [PubMed]
  18. Welcomme, E.; Walter, P.; Van Elslande, E.; Tsoucaris, G. Investigation of white pigments used as make-up during the Greco-Roman period. Appl. Phys. A 2006, 83, 551–556. [Google Scholar] [CrossRef]
  19. Aliatis, I.; Bersani, D.; Campani, E.; Casoli, A.; Lottici, P.P.; Mantovan, S.; Marino, I.G.; Ospitali, F. Green pigments of the Pompeian artists’ palette. Spectrochim. Acta A 2009, 73, 532–538. [Google Scholar] [CrossRef] [PubMed]
  20. Piovesan, R.; Siddall, R.; Mazzoli, C.; Nodari, L. The Temple of Venus (Pompeii): A study of the pigments and painting techniques. J. Archaeol. Sci. 2011, 38, 2633–2643. [Google Scholar] [CrossRef]
  21. Aliatis, I.; Bersani, D.; Campani, E.; Casoli, A.; Lottici, P.P.; Mantovan, S.; Marino, I.G. Pigments used in Roman wall paintings in the Vesuvian area. J. Raman Spectrosc. 2010, 41, 1537–1542. [Google Scholar] [CrossRef]
  22. Caneve, L.; Diamanti, A.; Grimaldi, F.; Palleschi, G.; Spizzichino, V.; Valentini, F. Analysis of fresco by laser induced breakdown spectroscopy. Spectrochim. Acta B 2010, 65, 702–706. [Google Scholar] [CrossRef]
  23. Duran, A.; Jimenez De Haro, M.C.; Perez-Rodriguez, J.L.; Franquelo, M.L.; Herrera, L.K.; Justo, A. Determination of pigments and binders in Pompeian wall paintings using synchrotron radiation—High-resolution X-ray powder diffraction and conventional spectroscopy–chromatography. Archaeometry 2010, 52, 286–307. [Google Scholar] [CrossRef]
  24. Gelzo, M.; Grimaldi, M.; Vergara, A.; Severino, V.; Chambery, A.; Russo, A.D.; Piccioli, C.; Corso, G.; Arcari, P. Comparison of binder compositions in Pompeian wall painting styles from Insula Occidentalis. Chem. Cent. J. 2014, 8, 65. [Google Scholar] [CrossRef] [PubMed]
  25. Marcaida, I.; Maguregui, M.; Morillas, H.; García-Florentino, C.; Knuutinen, U.; Carrero, J.A.; de Vallejuelo, S.F.O.; Pitarch Martí, A.; Castro, K; Madariaga, J.M. Multispectroscopic and Isotopic Ratio Analysis to Characterize the Inorganic Binder Used on Pompeian Pink and Purple Lake Pigments. Anal. Chem. 2016, 88, 6395–6402. [Google Scholar] [CrossRef] [PubMed]
  26. Marcaida, I.; Maguregui, M.; de Vallejuelo, S.F.O.; Morillas, H.; Prieto-Taboada, N.; Veneranda, M.; Castro, K.; Madariaga, J.M. In situ X-ray fluorescence-based method to differentiate among red ochre pigments and yellow ochre pigments thermally transformed to red pigments of wall paintings from Pompeii. Anal. Bioanal. Chem. 2017, 409, 3853–3860. [Google Scholar] [CrossRef] [PubMed]
  27. Maguregui, M.; Castro, K.; Morillas, H.; Trebolazabala, J.; Knuutinen, U.; Wiesinger, R.; Schreinerd, M.; Madariaga, J.M. Multianalytical approach to explain the darkening process of hematite pigment in paintings from ancient Pompeii after accelerated weathering experiments. Anal. Methods 2014, 6, 372–378. [Google Scholar] [CrossRef]
  28. Giachi, G.; De Carolis, E.; Pallecchi, P. Raw materials in Pompeian paintings: Characterization of some colors from the archaeological site. Mater. Manuf. Processes. 2009, 24, 1015–1022. [Google Scholar] [CrossRef]
  29. D’Esposito, L.; Iadanza, M. Pompei per Tutti; Sirano, F., Ed.; Arte’m: Napoli, Italy, 2016; pp. 37–38. [Google Scholar]
  30. Cioni, R.; Gurioli, L.; Lanza, R.; Zanella, E. Temperatures of the AD 79 pyroclastic density current deposits (Vesuvius, Italy). J. Geophys. Res. 2004, 109, B02207. [Google Scholar] [CrossRef]
  31. Gonçalves, Í.G.; Petter, C.O.; Machado, J.L. Quantification of hematite and goethite concentrations in kaolin using diffuse reflectance spectroscopy: A new approach to Kubelka-Munk theory. Clays Clay Miner. 2012, 60, 473–483. [Google Scholar] [CrossRef]
  32. Liu, Q.S.; Torrent, J.; Barrón, V.; Duan, Q.Z.; Bloemendal, J. Quantification of hematite from the visible diffuse reflectance spectrum: Effects of aluminium substitution and grain morphology. Clay Miner. 2011, 46, 137–147. [Google Scholar] [CrossRef]
  33. Torrent, J.; Barrón, V. The visible diffuse reflectance in relation to the color and crystal properties of hematite. Clays Clay Miner. 2003, 51, 309–317. [Google Scholar] [CrossRef]
  34. Ji, J.; Balsam, W.; Chen, J.; Liu, L. Rapid and quantitative measurement of hematite and goethite in the Chinese loess-paleosol sequence by diffuse reflectance spectroscopy. Clays Clay Miner. 2002, 50, 208–216. [Google Scholar] [CrossRef]
  35. Scheinost, A.C.; Chavernas, A.; Barrón, V.; Torrent, J. Use and limitations of second-derivative diffuse reflectance spectroscopy in the visible to near-infrared range to identify and quantify Fe oxide minerals in soils. Clays Clay Miner. 1998, 46, 528–536. [Google Scholar] [CrossRef]
  36. Moioli, P.; Seccaroni, C. Analysis of art objects using a portable X-ray fluorescence spectrometer. X-ray Spectrom. 2000, 29, 48–52. [Google Scholar] [CrossRef]
  37. Seccaroni, C.; Moioli, P.; Fluorescenza, X. Prontuario per L’analisi XRF Portatile Applicata a Superfici Policrome; Nardini Editore: Firenze, Italy, 2001. [Google Scholar]
  38. Driscoll, R.; Hageman, P.; Benzel, W.; Diehl, S.; Adams, D.; Morman, S.; Choate, L.D. Assessment of the Geoavailability of Trace Elements from Minerals in Mine Wastes: Analytical Techniques and Assessment of Selected Copper Minerals; Denver Science Publishing Network: Denver, CO, USA, 2011. [Google Scholar]
  39. EL-Nafaty, J.M. Geology and Trace Element Geochemistry of the Barite-Copper Mineralization in Gulani Area, NE Nigeria. Iosr. Jagg. 2017, 5, 1–16. [Google Scholar] [CrossRef]
  40. Burgio, L.; Clark, R.J. Library of FT-Raman spectra of pigments, minerals, pigment media and varnishes, and supplement to existing library of Raman spectra of pigments with visible excitation. Spectrochim. Acta A 2001, 57, 1491–1521. [Google Scholar] [CrossRef]
  41. Bouchard, M.; Smith, D.C. Catalogue of 45 reference Raman spectra of minerals concerning research in art history or archaeology, especially on corroded metals and coloured glass. Spectrochim. Acta A 2003, 59, 2247–2266. [Google Scholar] [CrossRef]
  42. Giarola, M.; Mariotto, G.; Ajò, D. Micro-Raman investigations on inclusions of unusual habit in a commercial tanzanite gemstone. J. Raman Spectrosc. 2012, 43, 556–558. [Google Scholar] [CrossRef]
  43. Veiga, A.; Teixeira, D.M.; Candeias, A.J.; Mirão, J.; Manhita, A.; Miguel, C.; Rodrigues, P.; Teixeira, J.G. Micro-analytical study of two 17th century gilded miniature portraits on copper. Microchem. J. 2015, 123, 51–61. [Google Scholar] [CrossRef]
  44. Caggiani, M.C.; Cosentino, A.; Mangone, A. Pigments Checker version 3.0, a handy set for conservation scientists: A free online Raman spectra database. Microchem. J. 2016, 129, 123–132. [Google Scholar] [CrossRef]
  45. Kawakami, M.; Karato, T.; Takenaka, T.; Yokoyama, S. Structure analysis of coke, wood charcoal and bamboo charcoal by Raman spectroscopy and their reaction rate with CO2. ISIJ Int. 2005, 45, 1027–1034. [Google Scholar] [CrossRef]
  46. Cohen-Ofri, I.; Weiner, L.; Boaretto, E.; Mintz, G.; Weiner, S. Modern and fossil charcoal: Aspects of structure and diagenesis. J. Archaeol. Sci. 2006, 33, 428–439. [Google Scholar] [CrossRef]
  47. Gil, M.; Carvalho, M.L.; Seruya, A.; Candeias, A.E.; Mirão, J.; Queralt, I. Yellow and red ochre pigments from southern Portugal: Elemental composition and characterization by WDXRF and XRD. Nucl. Instrum. Methods Phys. Res. A 2007, 580, 728–731. [Google Scholar] [CrossRef]
  48. Kingery-Schwartz, A.; Popelka-Filcoff, R.S.; Lopez, D.A.; Pottier, F.; Hill, P.; Glascock, M. Analysis of geological ochre: Its geochemistry, use, and exchange in the US Northern Great Plains. Open J. Archaeom. 2013, 1, 15. [Google Scholar] [CrossRef]
  49. Bikiaris, D.; Daniilia, S.; Sotiropoulou, S.; Katsimbiri, O.; Pavlidou, E.; Moutsatsou, A.P.; Chryssoulakis, Y. Ochre-differentiation through micro-Raman and micro-FTIR spectroscopies: Application on wall paintings at Meteora and Mount Athos, Greece. Spectrochim. Acta A 2000, 56, 3–18. [Google Scholar] [CrossRef]
  50. Froment, F.; Tourni, A.; Colomban, P. Raman identification of natural red to yellow pigments: Ochre and iron-containing ores. J. Raman Spectrosc. 2008, 39, 560–568. [Google Scholar] [CrossRef]
  51. Bordignon, F.; Postorino, P.; Dorel, P.; Trojsi, G. Raman identification of green and blue pigments in Etruscan polychromes on architectural terracotta panels. J. Raman Spectrosc. 2007, 38, 255–259. [Google Scholar] [CrossRef]
  52. Pagès-Camagna, S.; Colinart, S.; Coupry, C. Fabrication processes of archaeological Egyptian blue and green pigments enlightened by Raman microscopy and scanning electron microscopy. J. Raman Spectrosc. 1999, 30, 313–317. [Google Scholar] [CrossRef]
  53. Bloise, A.; El Salam, S.A.; De Luca, R.; Crisci, G.M.; Miriello, D. Flux growth and characterization of cuprorivaite: The influence of temperature, flux, and silica source. Appl. Phys. A Mater. 2016, 122, 650. [Google Scholar] [CrossRef]
  54. Baraldi, P.; Baraldi, C.; Curina, R.; Tassi, L.; Zannini, P. A micro-Raman archaeometric approach to Roman wall paintings. Vib. Spectrosc. 2007, 43, 420–426. [Google Scholar] [CrossRef]
  55. Bruni, S.; Cariati, F.; Casadio, F.; Toniolo, L. Spectrochemical characterization by micro-FTIR spectroscopy of blue pigments in different polychrome works of art. Vib. Spectrosc. 1999, 20, 15–25. [Google Scholar] [CrossRef]
  56. Rosalie David, A.; Edwards, H.G.M.; Farwell, D.W.; De Faria, D.L.A. Raman spectroscopic analysis of ancient Egyptian pigments. Archaeometry 2001, 43, 461–473. [Google Scholar] [CrossRef]
  57. Schiegl, S.; Weiner, K.L.; El Goresy, A. The diversity of newly discovered deterioration patterns in ancient Egyptian pigments: Consequences to entirely new restoration strategies and to the Egyptological colour symbolism. MRS Proc. 1992, 267, 831. [Google Scholar] [CrossRef]
  58. Bianchetti, P.; Talarico, F.; Vigliano, M.G.; Ali, M.F. Production and characterization of Egyptian blue and Egyptian green frit. J. Cult. Herit. 2000, 1, 179–188. [Google Scholar] [CrossRef]
  59. Mazzocchin, G.A.; Rudello, D.; Bragato, C.; Agnoli, F. A short note on Egyptian blue. J. Cult. Herit. 2004, 5, 129–133. [Google Scholar] [CrossRef]
  60. De Faria, D.L.A.; Venâncio Silva, S.; De Oliveira, M.T. Raman microspectroscopy of some iron oxides and oxyhydroxides. J. Raman Spectrosc. 1997, 28, 873–878. [Google Scholar] [CrossRef]
  61. Oh, S.J.; Cook, D.C.; Townsend, H.E. Characterization of iron oxides commonly formed as corrosion products on steel. Hyperfine Inter. 1998, 112, 59–66. [Google Scholar] [CrossRef]
  62. Ospitali, F.; Bersani, D.; Di Lonardo, G.; Lottici, P.P. ‘Green earths’: Vibrational and elemental characterization of glauconites, celadonites and historical pigments. J. Raman Spectrosc. 2008, 39, 1066–1073. [Google Scholar] [CrossRef]
  63. Pomies, M.P.; Morin, G.; Vignaud, C. XRD study of the goethite-hematite transformation: Application to the identification of heated prehistoric pigments. Eur. J. Solid State Inorg. Chem. 1998, 35, 9–25. [Google Scholar] [CrossRef]
  64. Pomiès, M.P.; Menu, M.; Vignaud, C. Red palaeolithic pigments: Natural hematite or heated goethite? Archaeometry 1999, 41, 275–285. [Google Scholar] [CrossRef]
  65. Omarini, S. Notes on colours and pigments in the ancient world. JAIC 2012, 8, 61. [Google Scholar]
Figure 1. Macroscopic photos of the wall painting fragments analyzed in this study.
Minerals 08 00134 g001
Figure 2. (a) Reflectance curves of the painted surface of the samples; (b) CIE-L*a*b* colorimetric coordinates of the painted surface of the samples analyzed.
Minerals 08 00134 g002
Figure 3. Portable X-ray fluorescence (P-XRF) spectra of the red painted surfaces of Samples 1 (a) and 2 (b).
Minerals 08 00134 g003
Figure 4. P-XRF spectra of the green painted surfaces of Samples 3 (a) and 4 (b).
Minerals 08 00134 g004
Figure 5. P-XRF spectra of the painted surfaces of Samples 5 (a) and 6 (b).
Minerals 08 00134 g005
Figure 6. Raman spectra of calcite for all samples.
Minerals 08 00134 g006
Figure 7. Raman spectra of hematite for Samples 1 and 2.
Minerals 08 00134 g007
Figure 8. Optical microscope (OM) images of cuprorivaite under reflected light on the painted surfaces of Samples 3 (a) and 4 (b) with relative Raman spectra; OM images of goethite under reflected light on the painted surfaces of Samples 3 (c) and 4 (d) with relative Raman spectra.
Minerals 08 00134 g008
Figure 9. OM images of amorphous carbon under reflected light on the painted surfaces of Samples 3 (a) and 4 (b) with relative Raman spectra. OM images of celadonite under reflected light on the painted surfaces of Samples 3 (c) and 4 (d) with relative Raman spectra.
Minerals 08 00134 g009
Figure 10. (a) OM images of amorphous carbon under reflected light on the painted surface of Sample 5 (black) with relative Raman spectrum; (b) OM images of goethite under reflected light on the painted surface of Sample 6 (brown) with relative Raman spectrum.
Minerals 08 00134 g010
Table 1. Micro-Raman and p-XRF results for the compounds detected on the painted surfaces of all of the samples analyzed in this study.
Band Wavenumber/cm−1 and Compounds Identification by Micro-Raman SpectroscopyP-XRF
SampleColorCalcite: 148, 274, 711, 1085 cm−1 [40].
Power output of the laser beam: 7 mW
Hematite: 224, 243, 297, 409, 610, 1319 cm−1 [41,42,43,44].
Power output of the laser beam: 2.6 mW
Cuprorivaite: 113, 137, 361, 377, 431, 568, 1083 cm−1 [40,51,52,53,54,55,56].
Power output of the laser beam: 5 mW
Goethite: 91, 203, 241, 297, 387, 416, 477, 546, 681 cm−1 [41,60,61].
Power output of the laser beam: 1.8 mW
Celadonite: 171, 271, 444, 589, 700 cm−1 [62].
Power output of the laser beam: 1.8 mW
Amorphous carbon: 1361, 1577 cm−1 [45,46].
Power output of the laser beam: 6 mW
Chemical elements identified by p-XRF
Sample 1RedYesYesNoNoNoYesAl, Si, P, K, Ca, Ti, Mn, Fe.
Sample 2RedYesYesNoNoNoYesAl, Si, P, K, Ca, Ti, Mn, Fe.
Sample 3GreenYesNoYesYesYesYesMg, Al, Si, P, S, K, Ca, Ti, Mn, Fe, Ni, Cu, Zn.
Sample 4GreenYesNoYesYesYesYesMg, Al, Si, P, S, K, Ca, Ti, Mn, Fe, Ni, Cu, Zn.
Sample 5BlackYesNoNoNoNoYesMg, Al, Si, P, S, K Ca, Fe.
Sample 6BrownYesNoNoYesNoNoMg, Al, Si, P, S, K, Ca, Fe.

