Experimental Study of CO2-Water-Mineral Interactions and Their Influence on the Permeability of Coking Coal and Implications for CO2-ECBM


Abstract
:1. Introduction
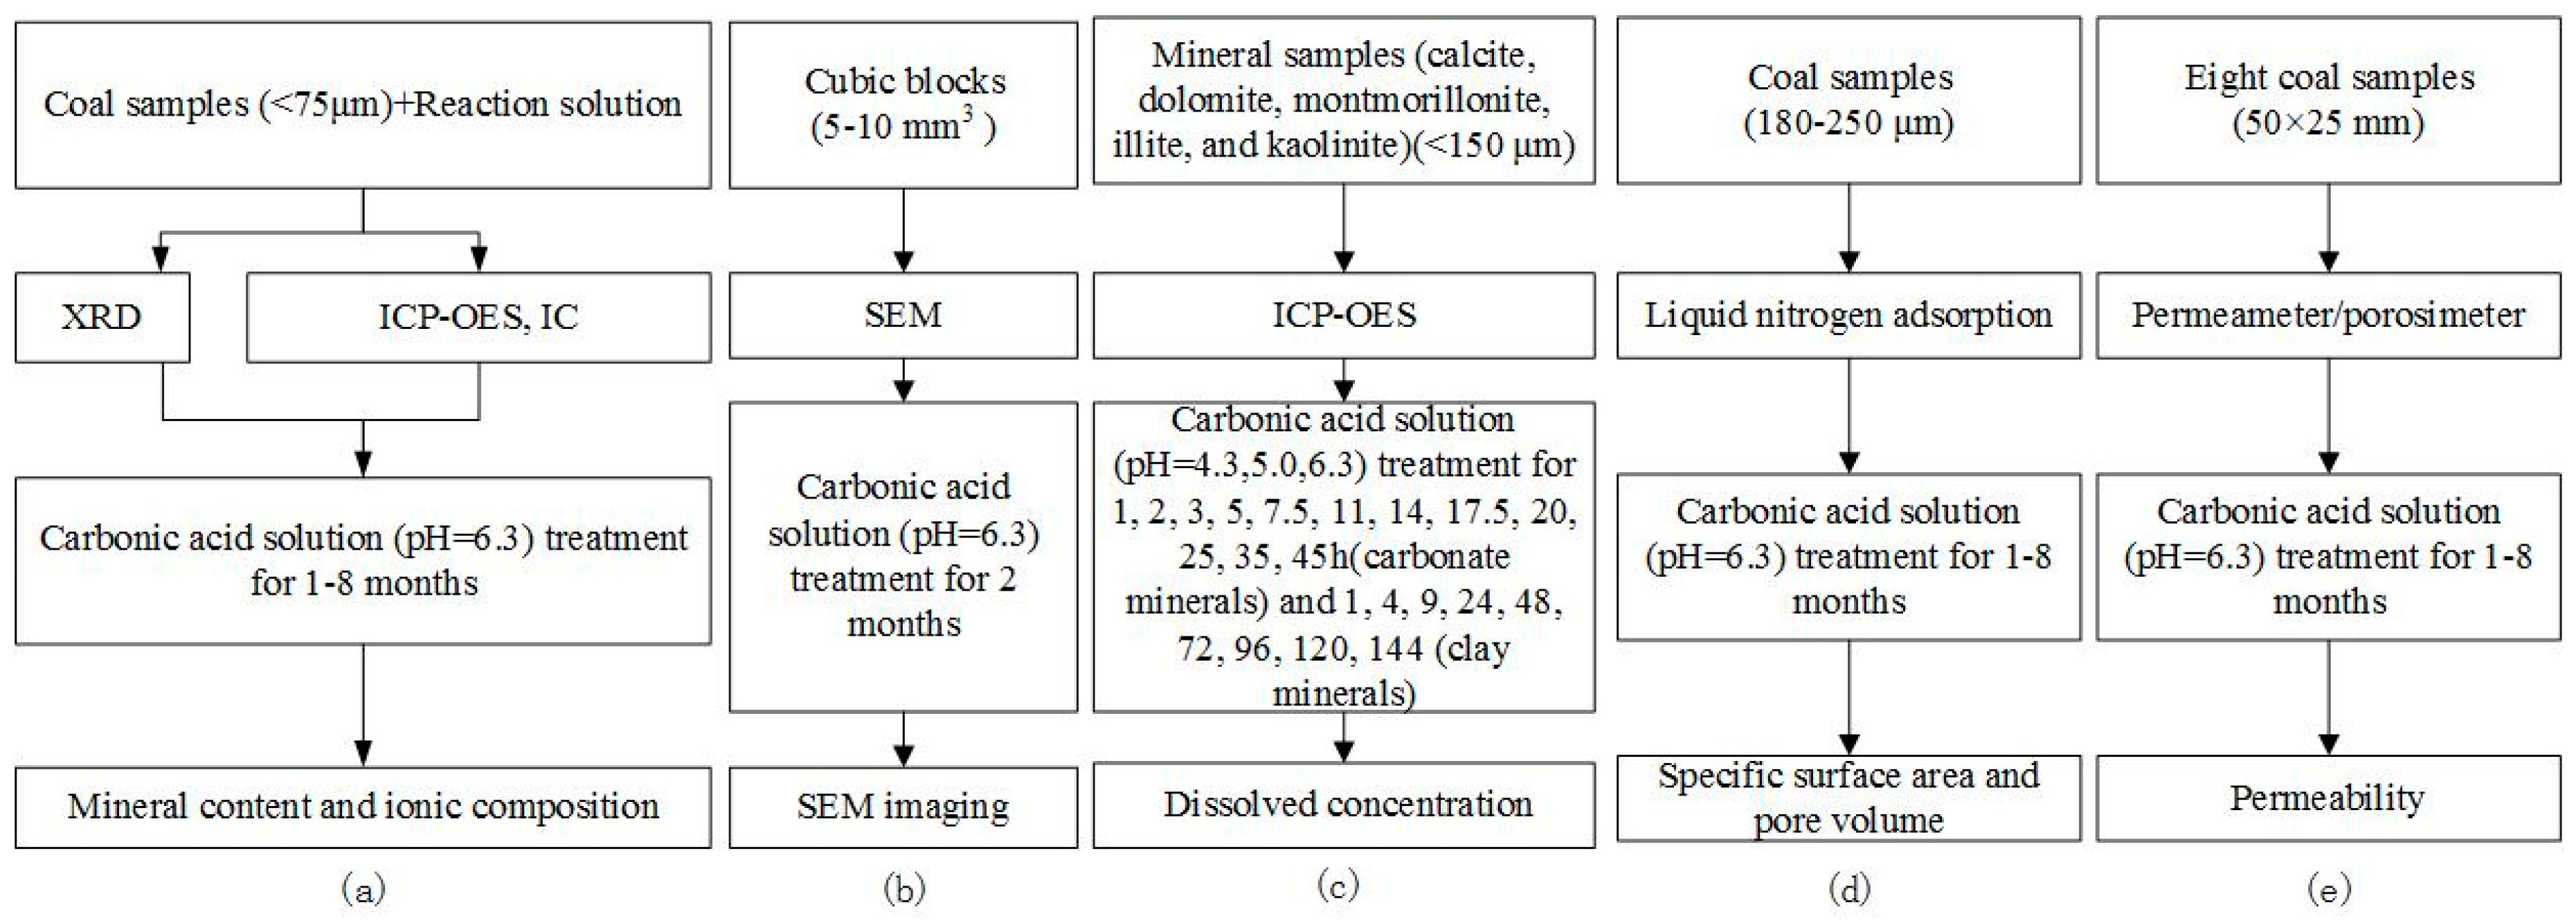
2. Experimental Methodology
2.1. Mineral Composition and Ion Content
2.2. Scanning Electron Microscopy
2.3. Mineral Reaction Kinetic Studies
2.4. Low-Pressure Nitrogen Gas Adsorption Studies
2.5. Permeability Testing
3. Results
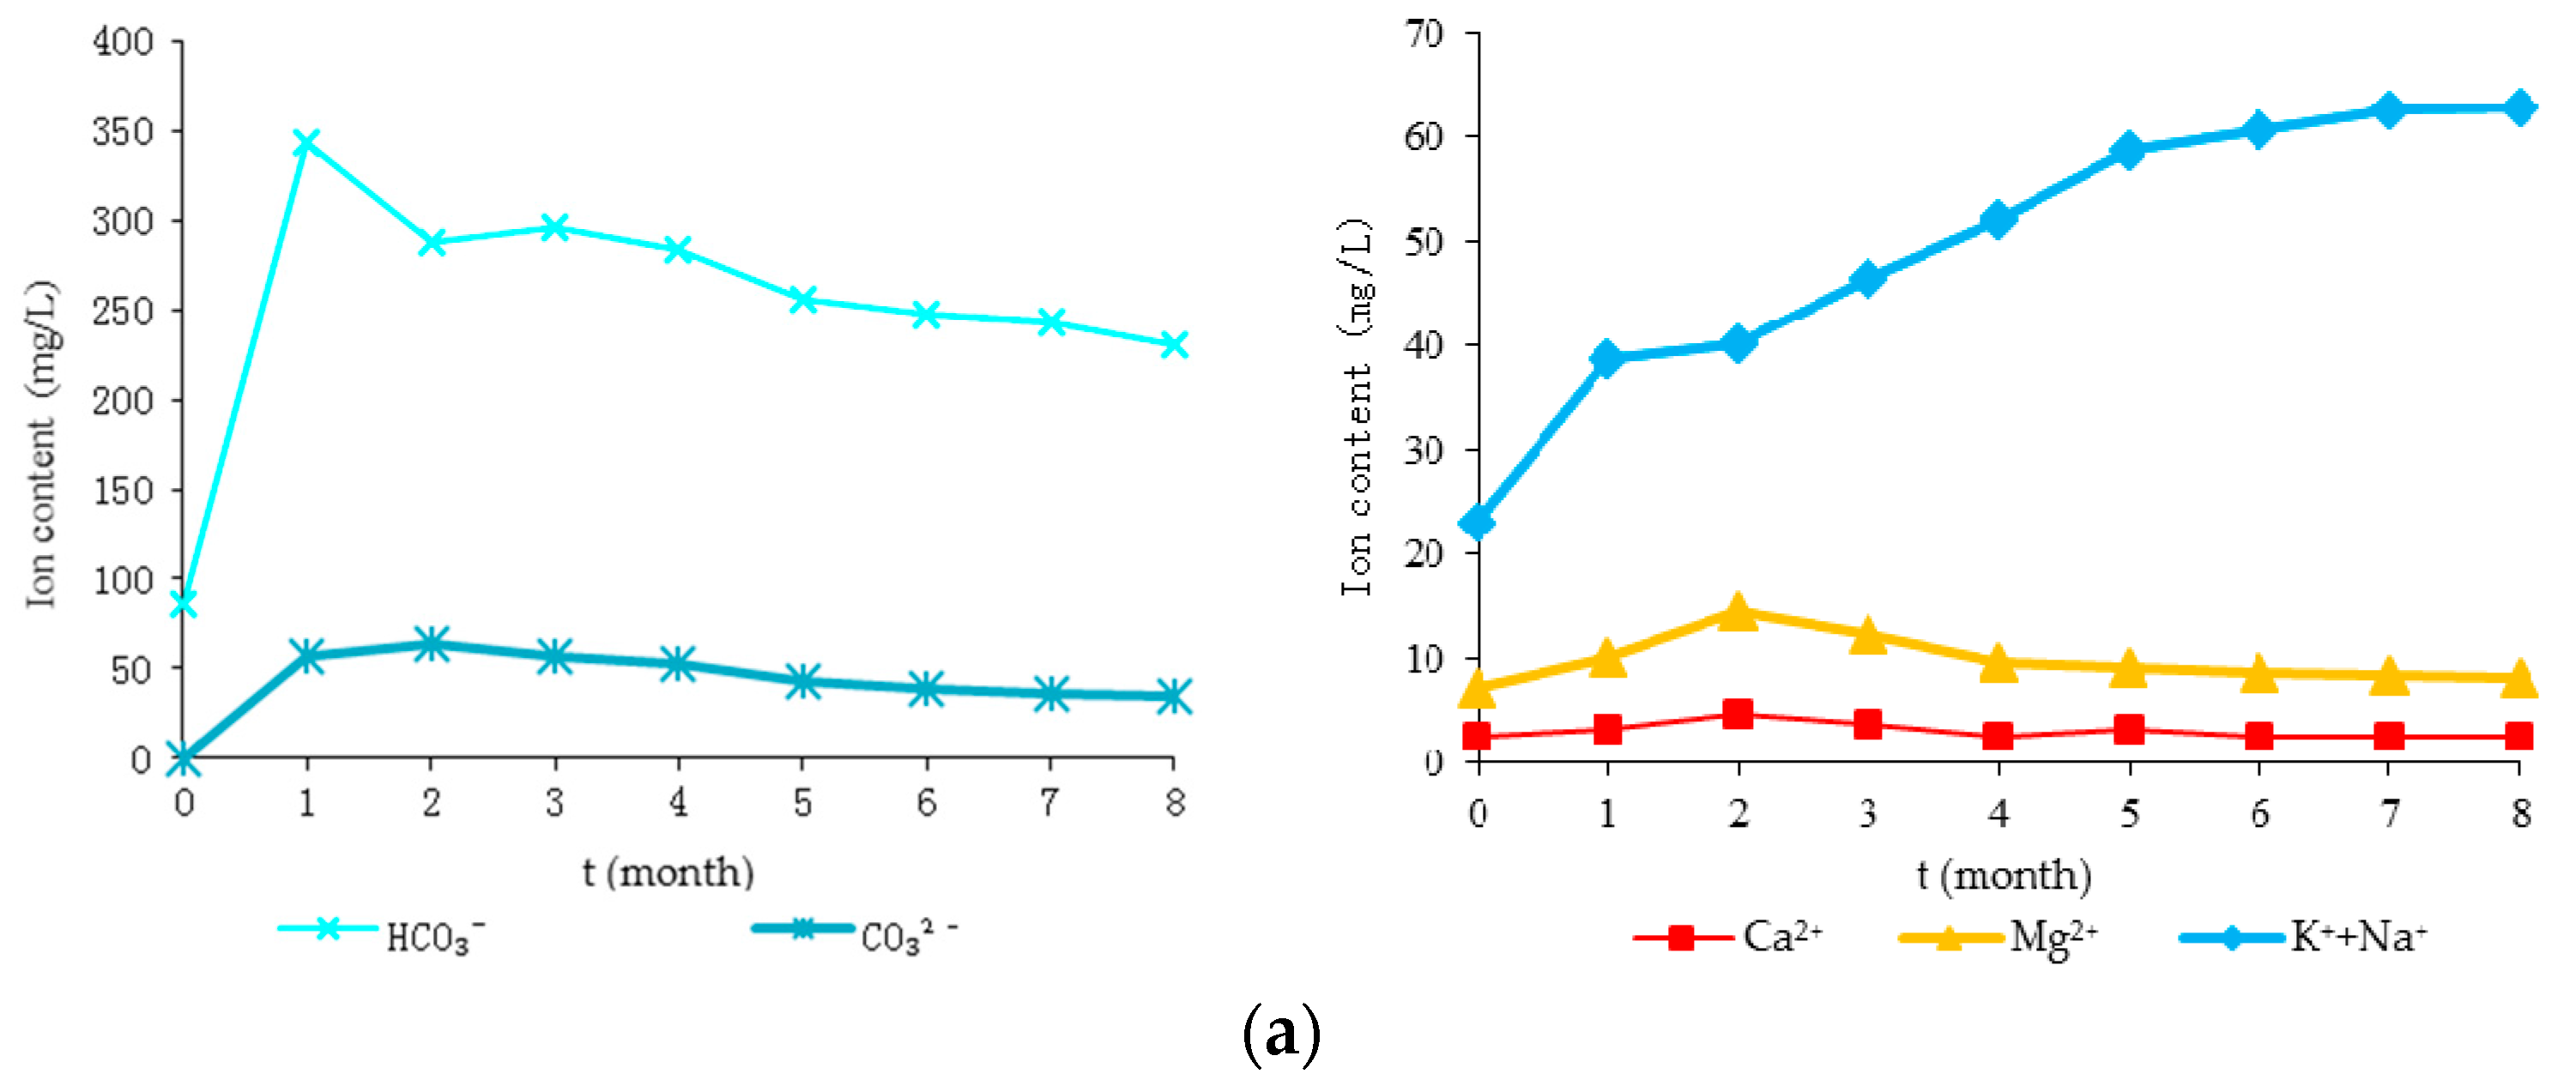
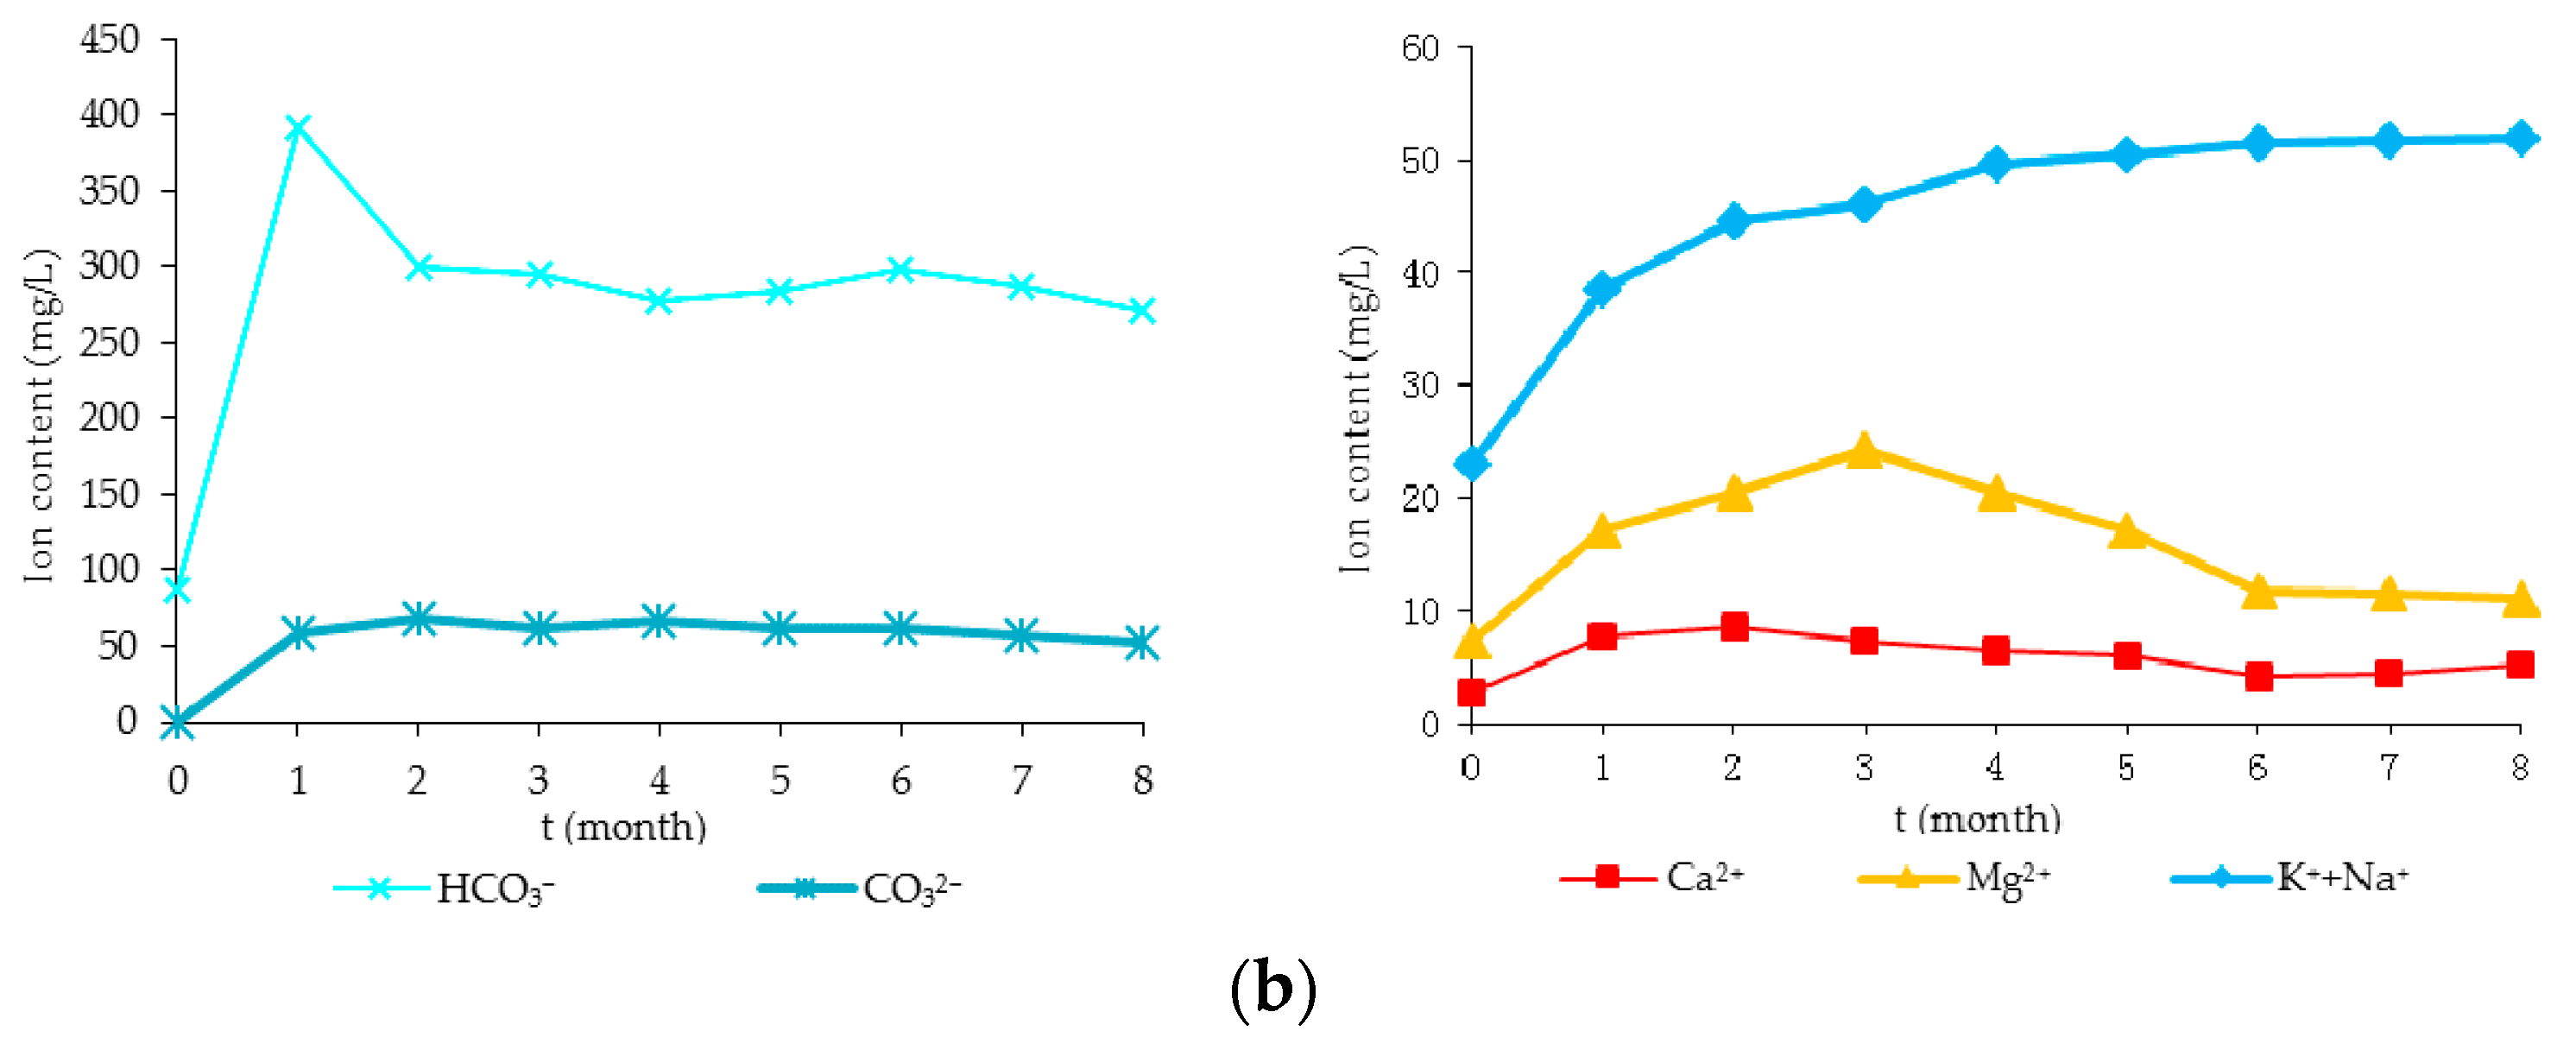
3.1. Ion Content
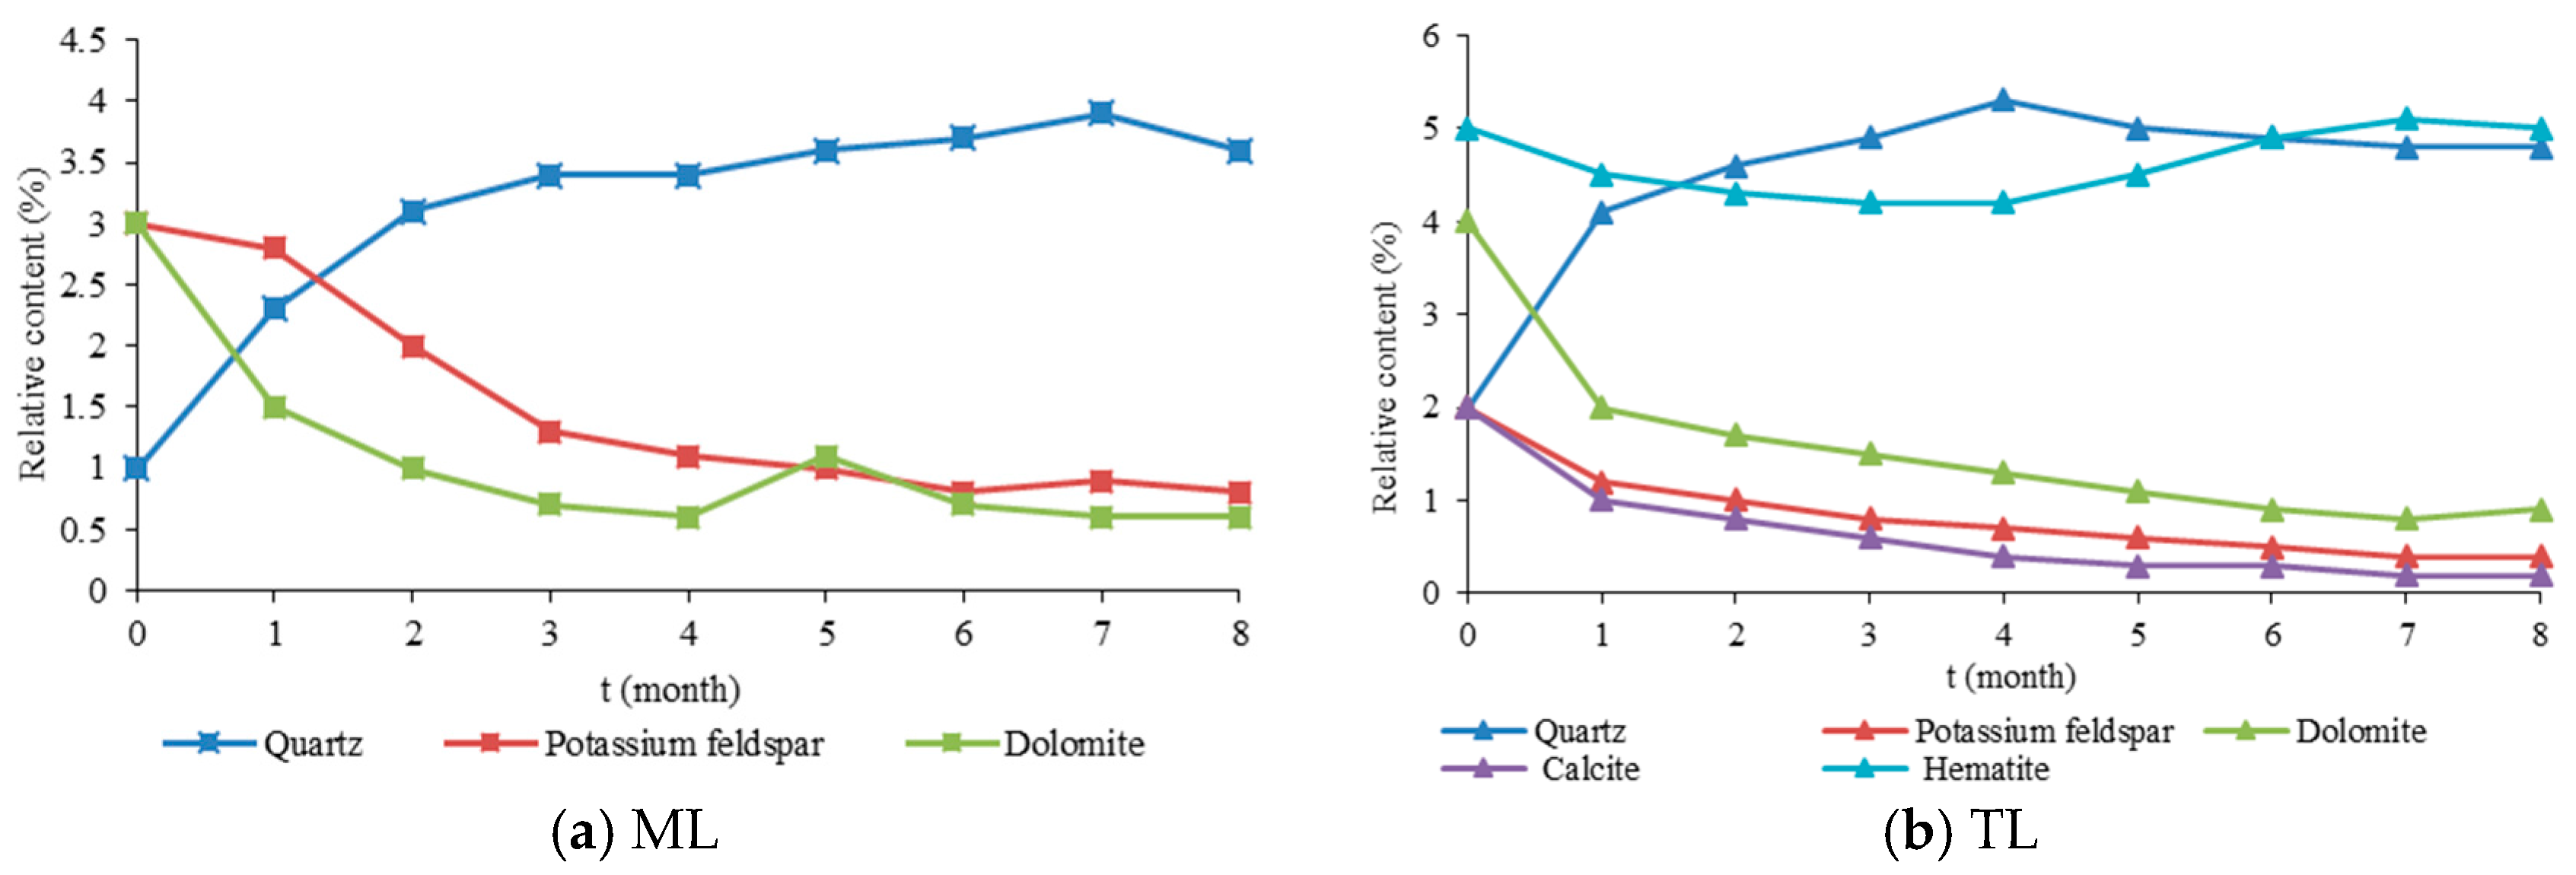
3.2. Mineral Composition
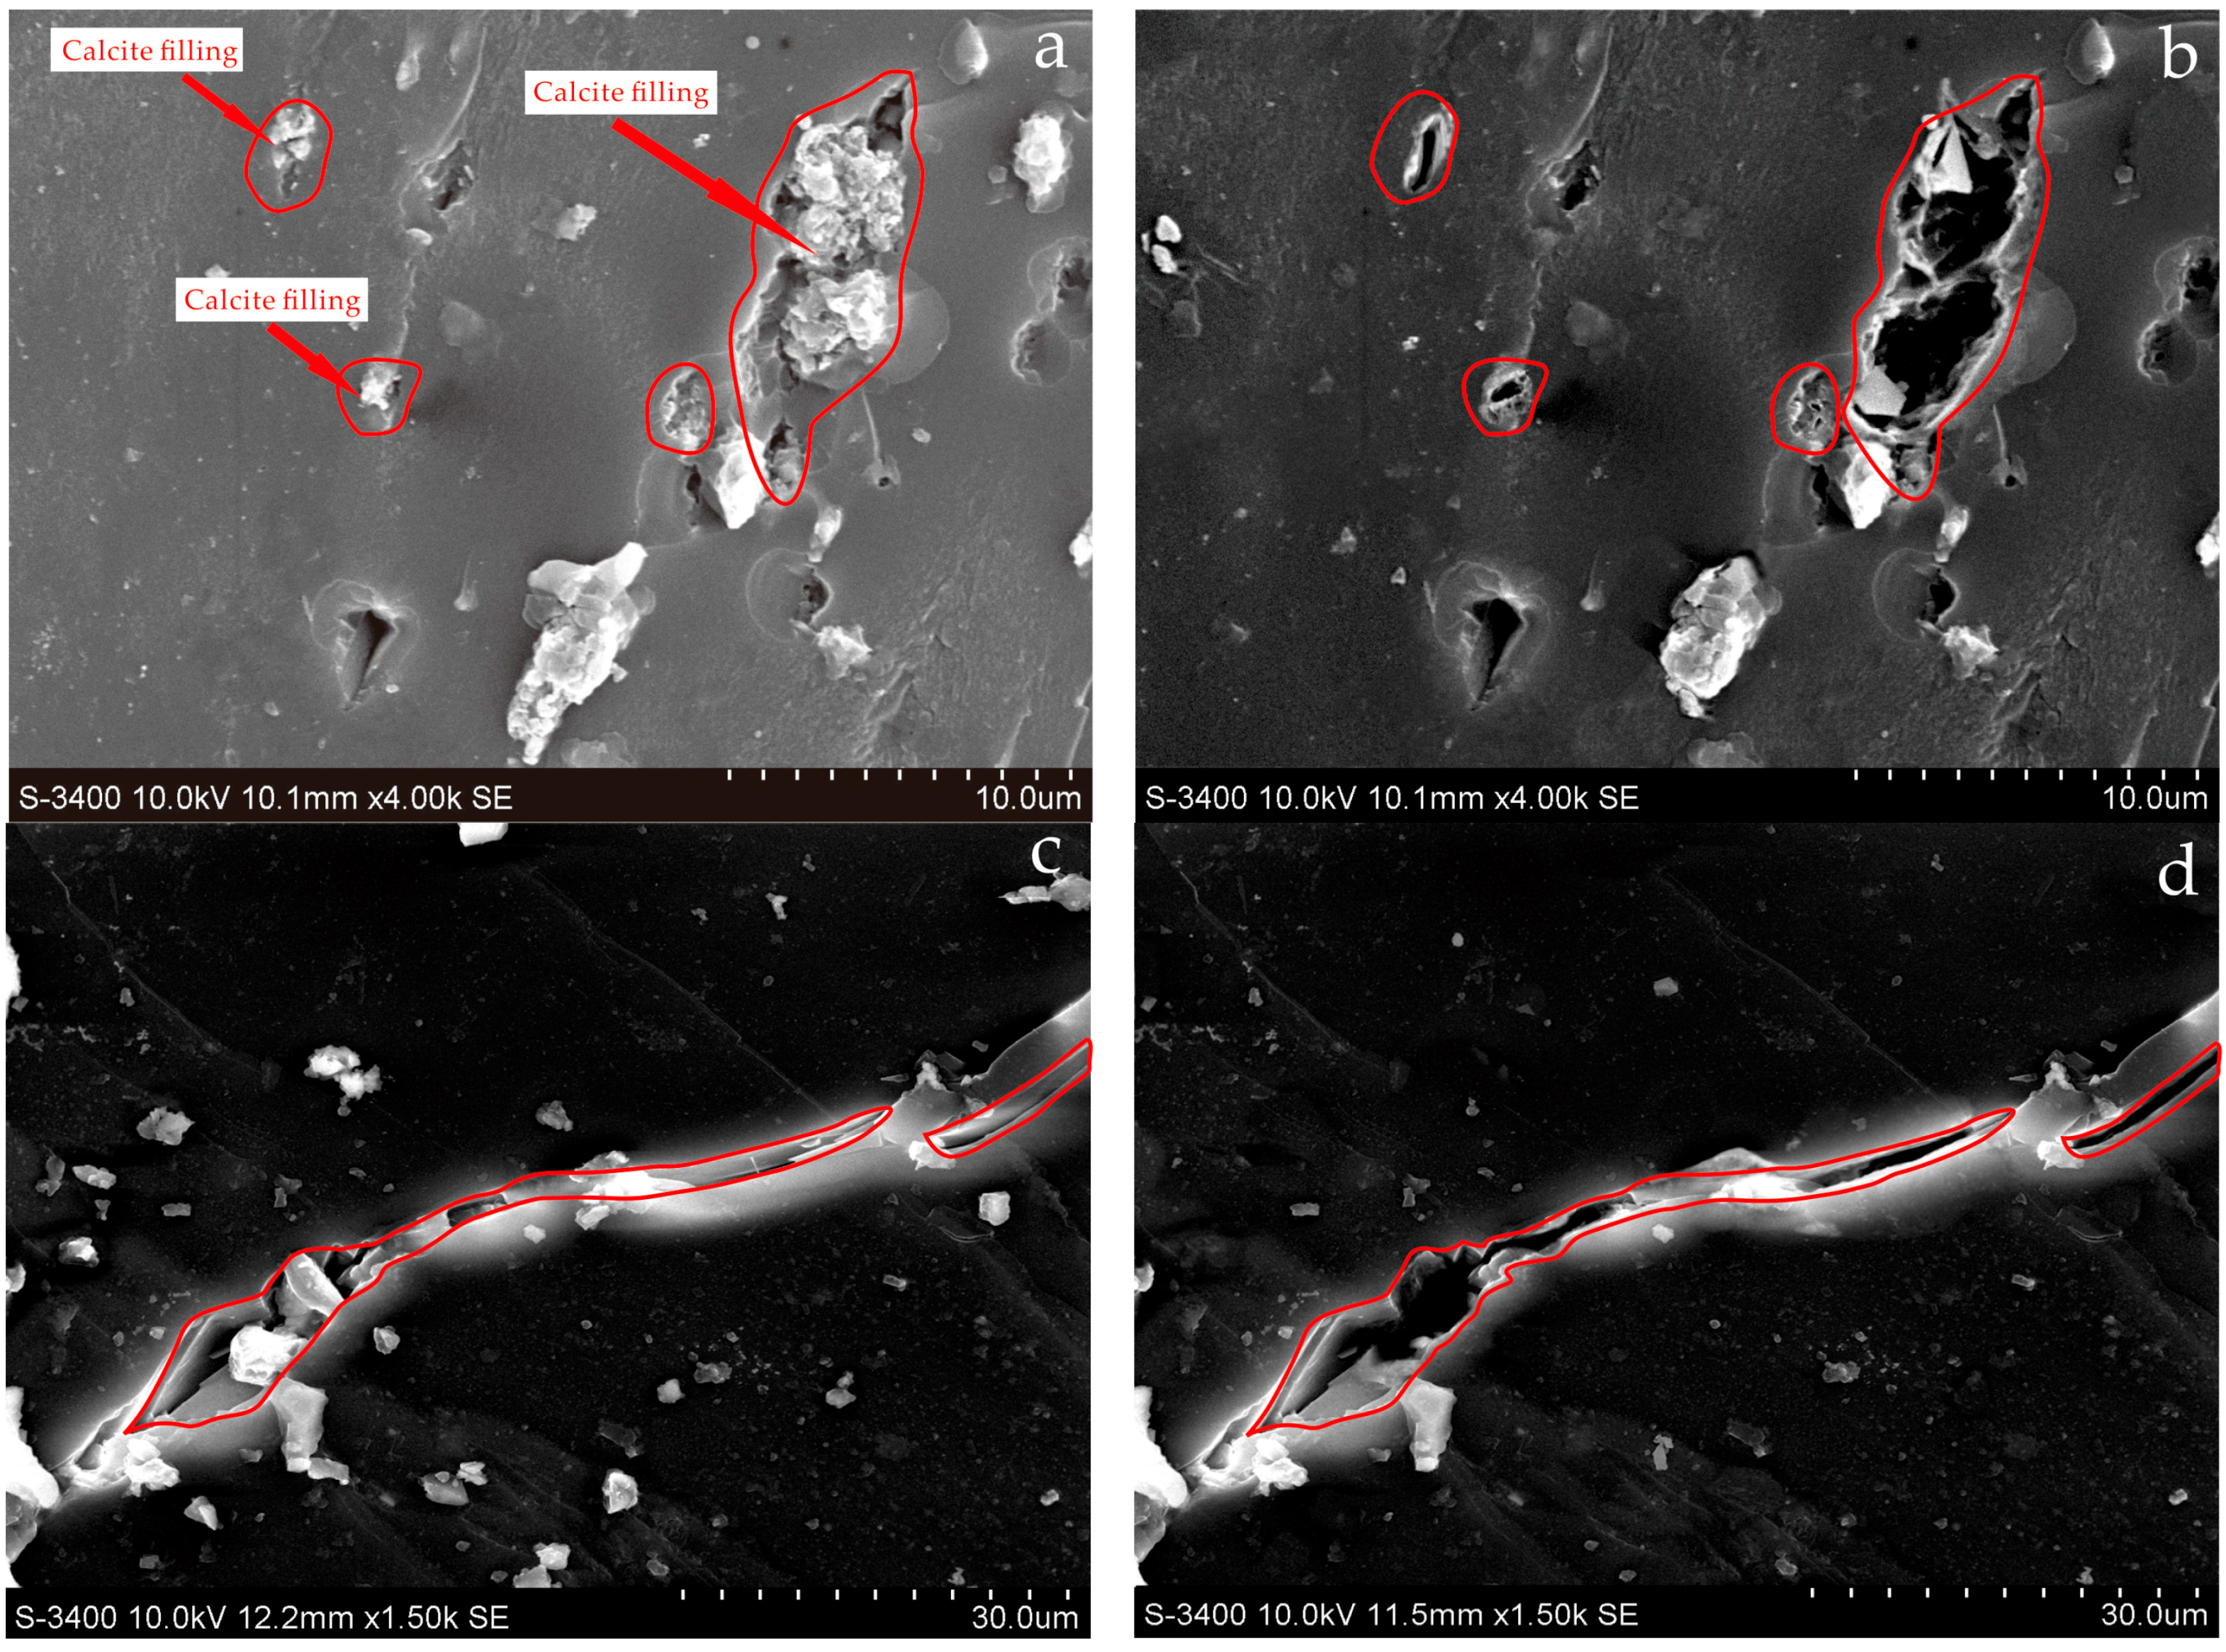
3.3. Variable Features of Pores and Microfractures
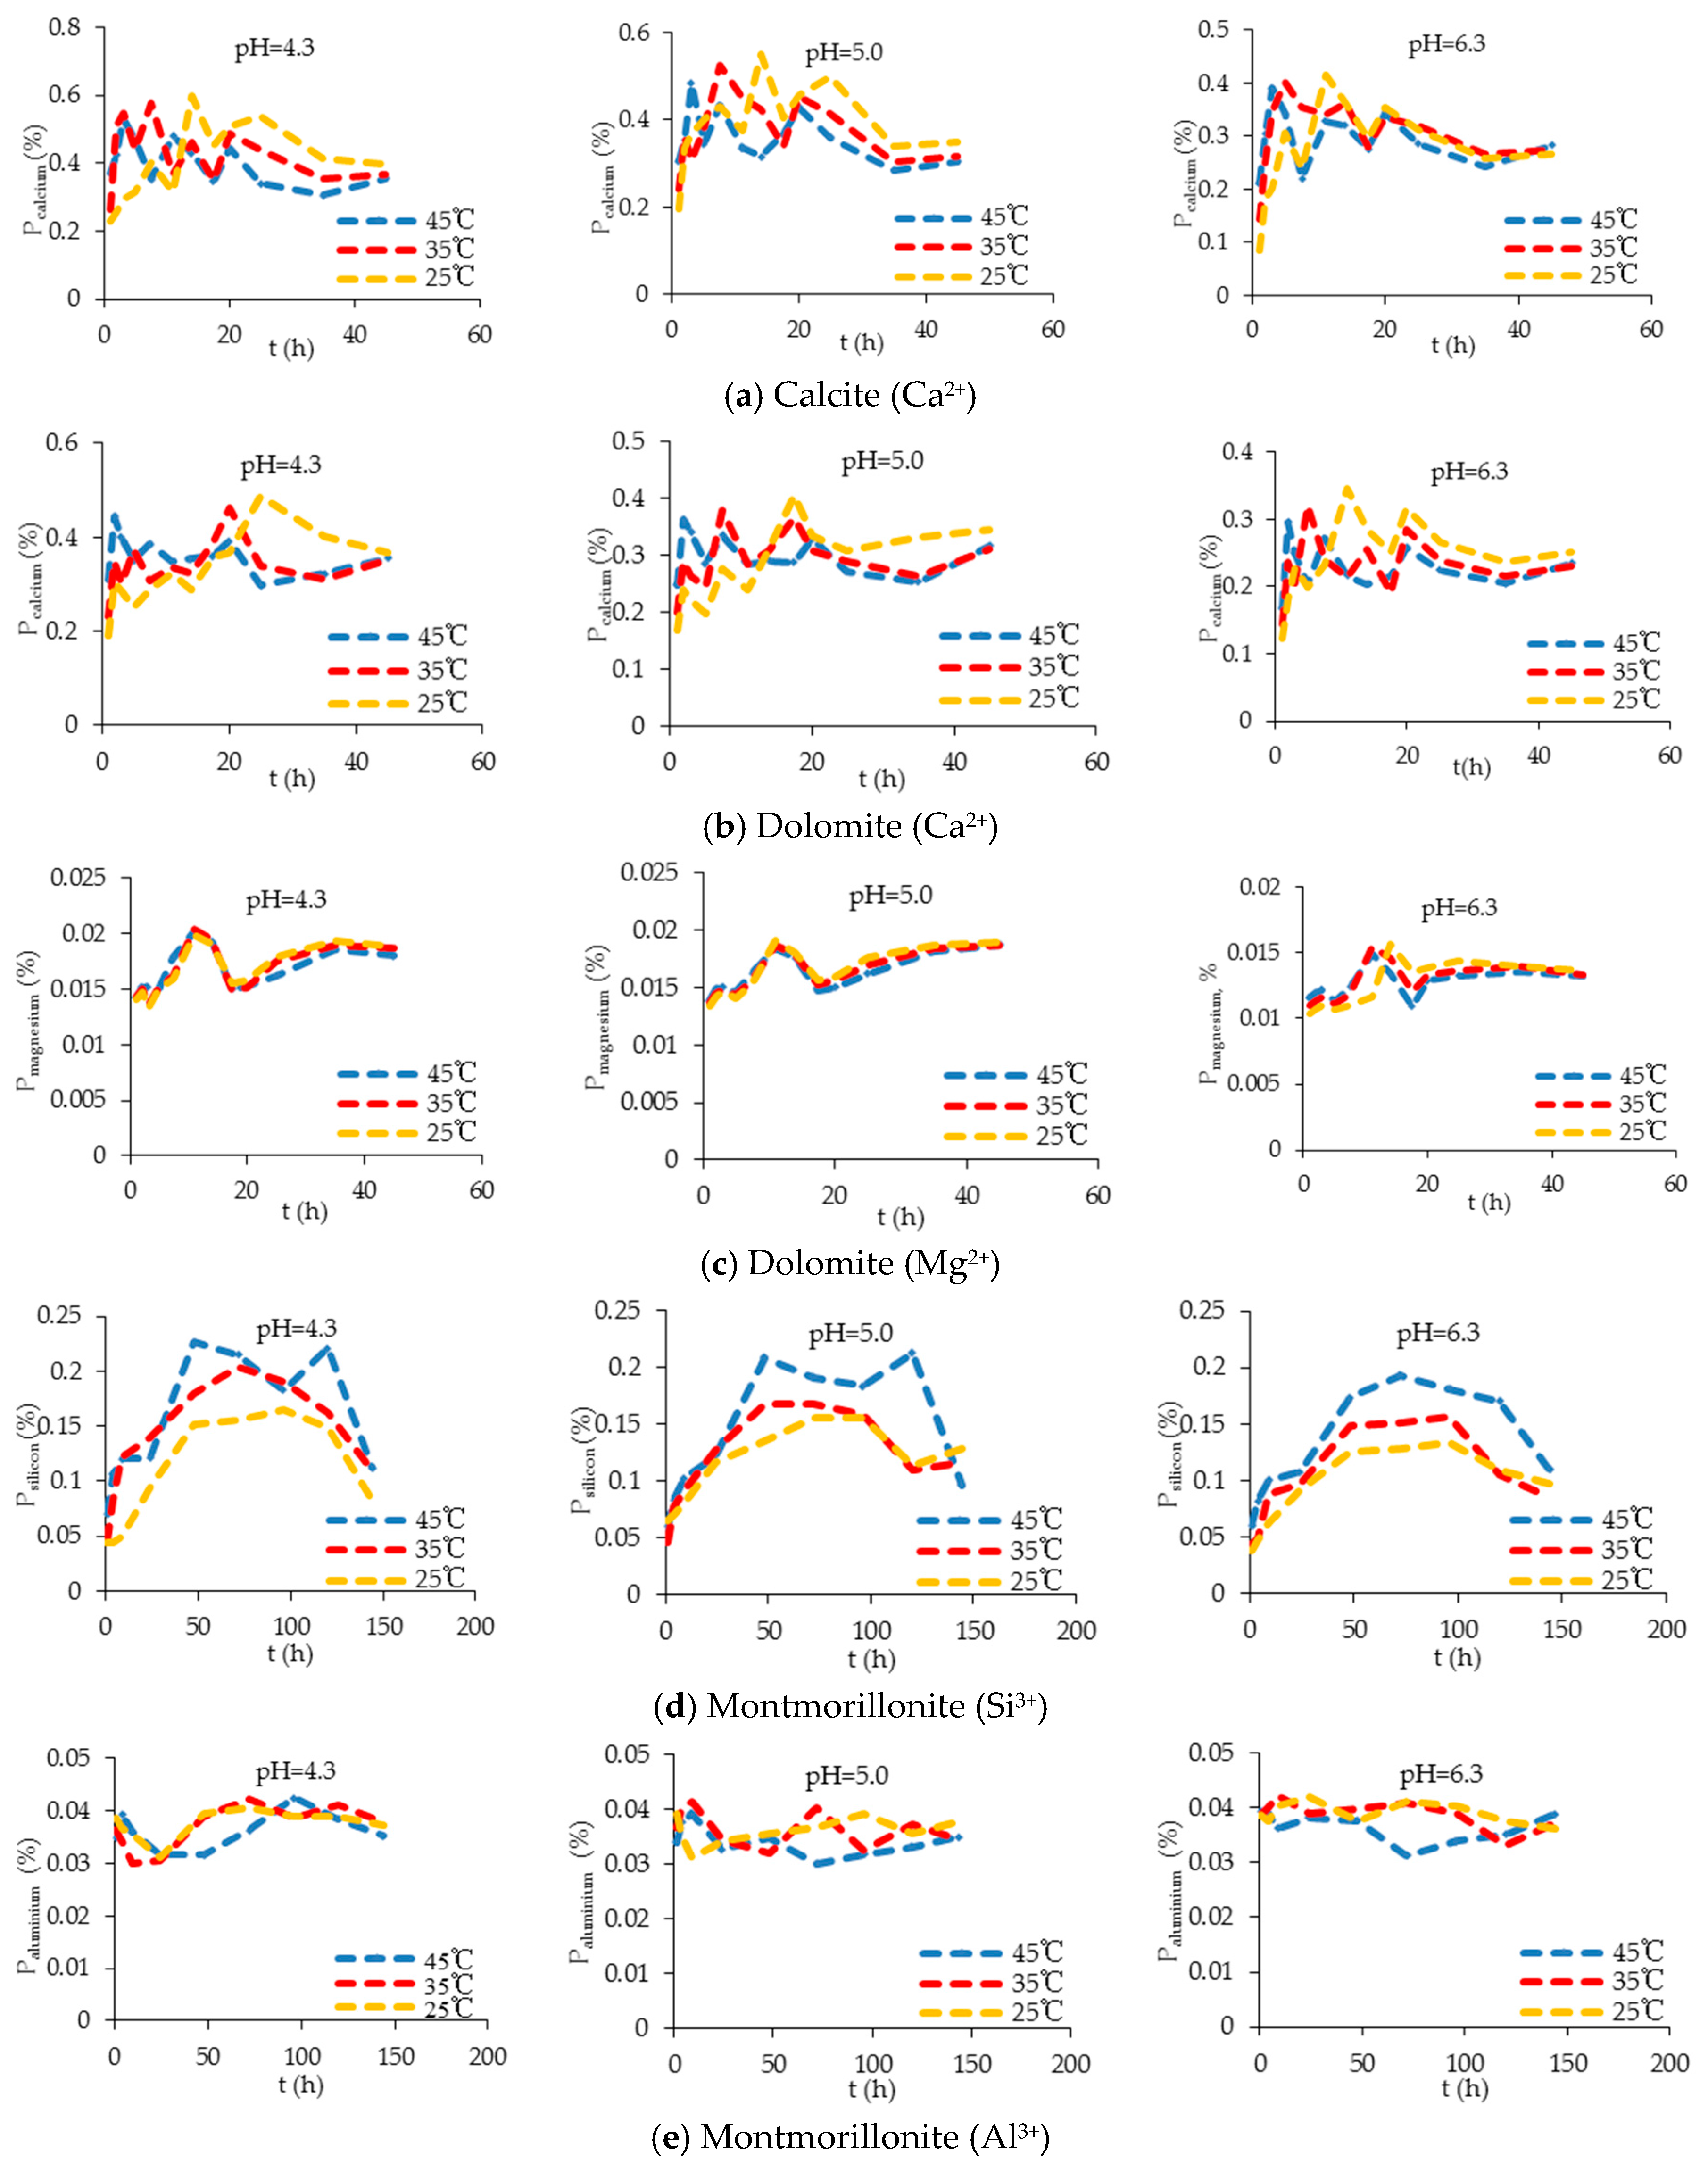
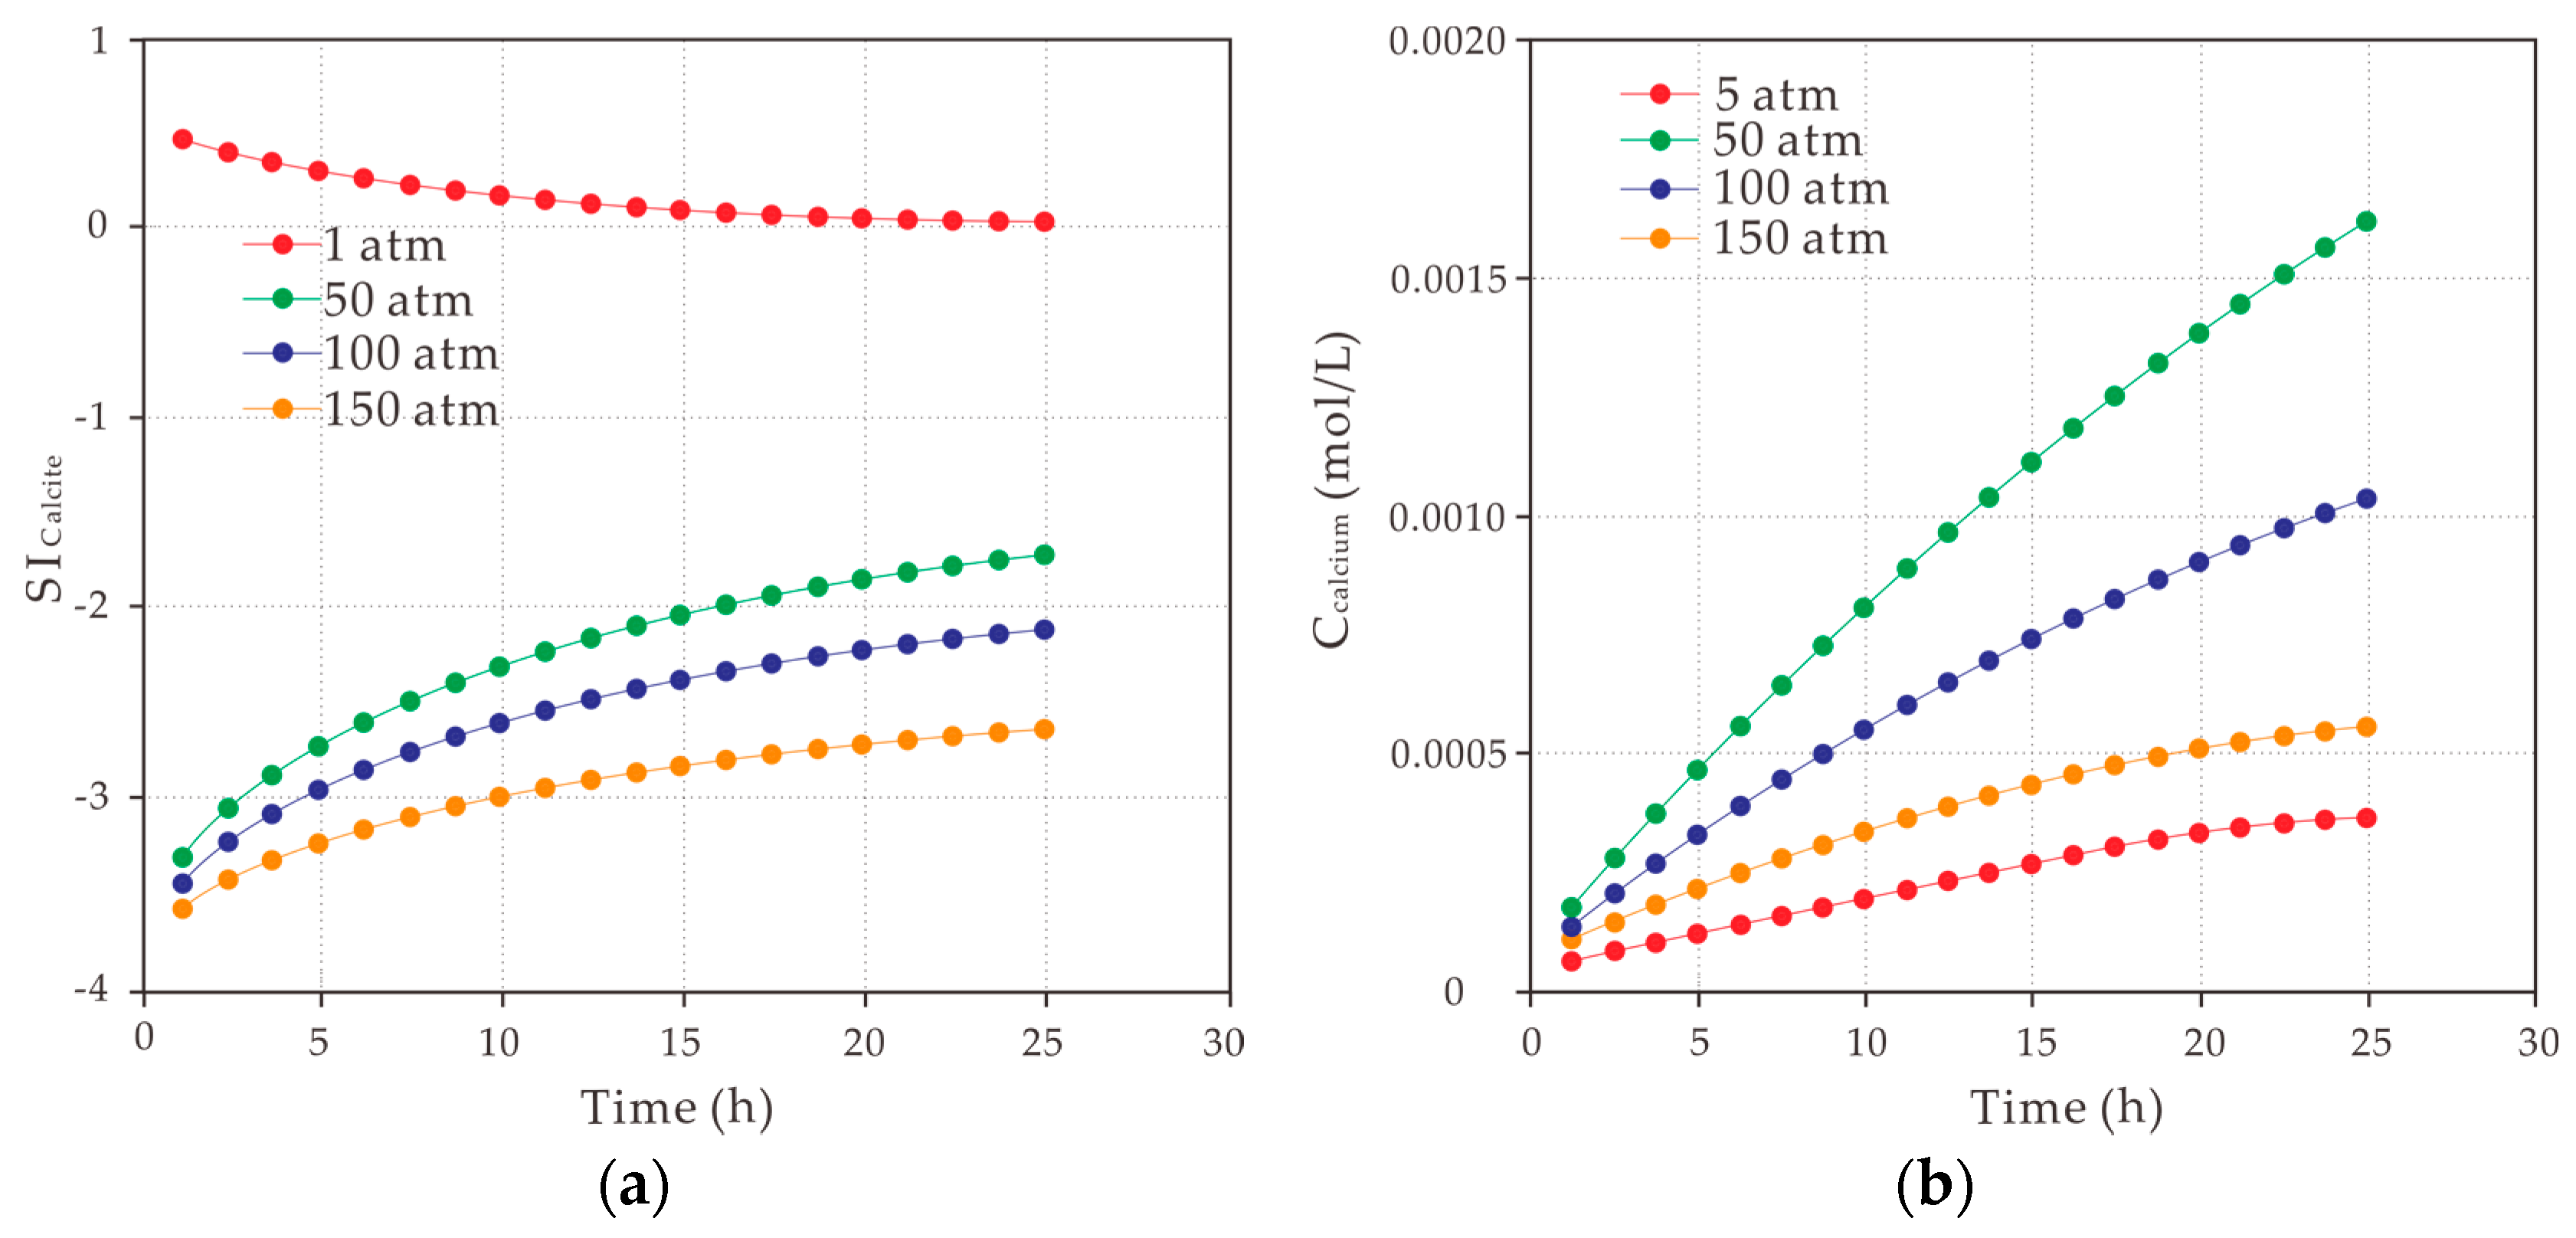
3.4. Dissolution Rates of Ion
3.5. Changes in Specific Surface Area and Pore Volume
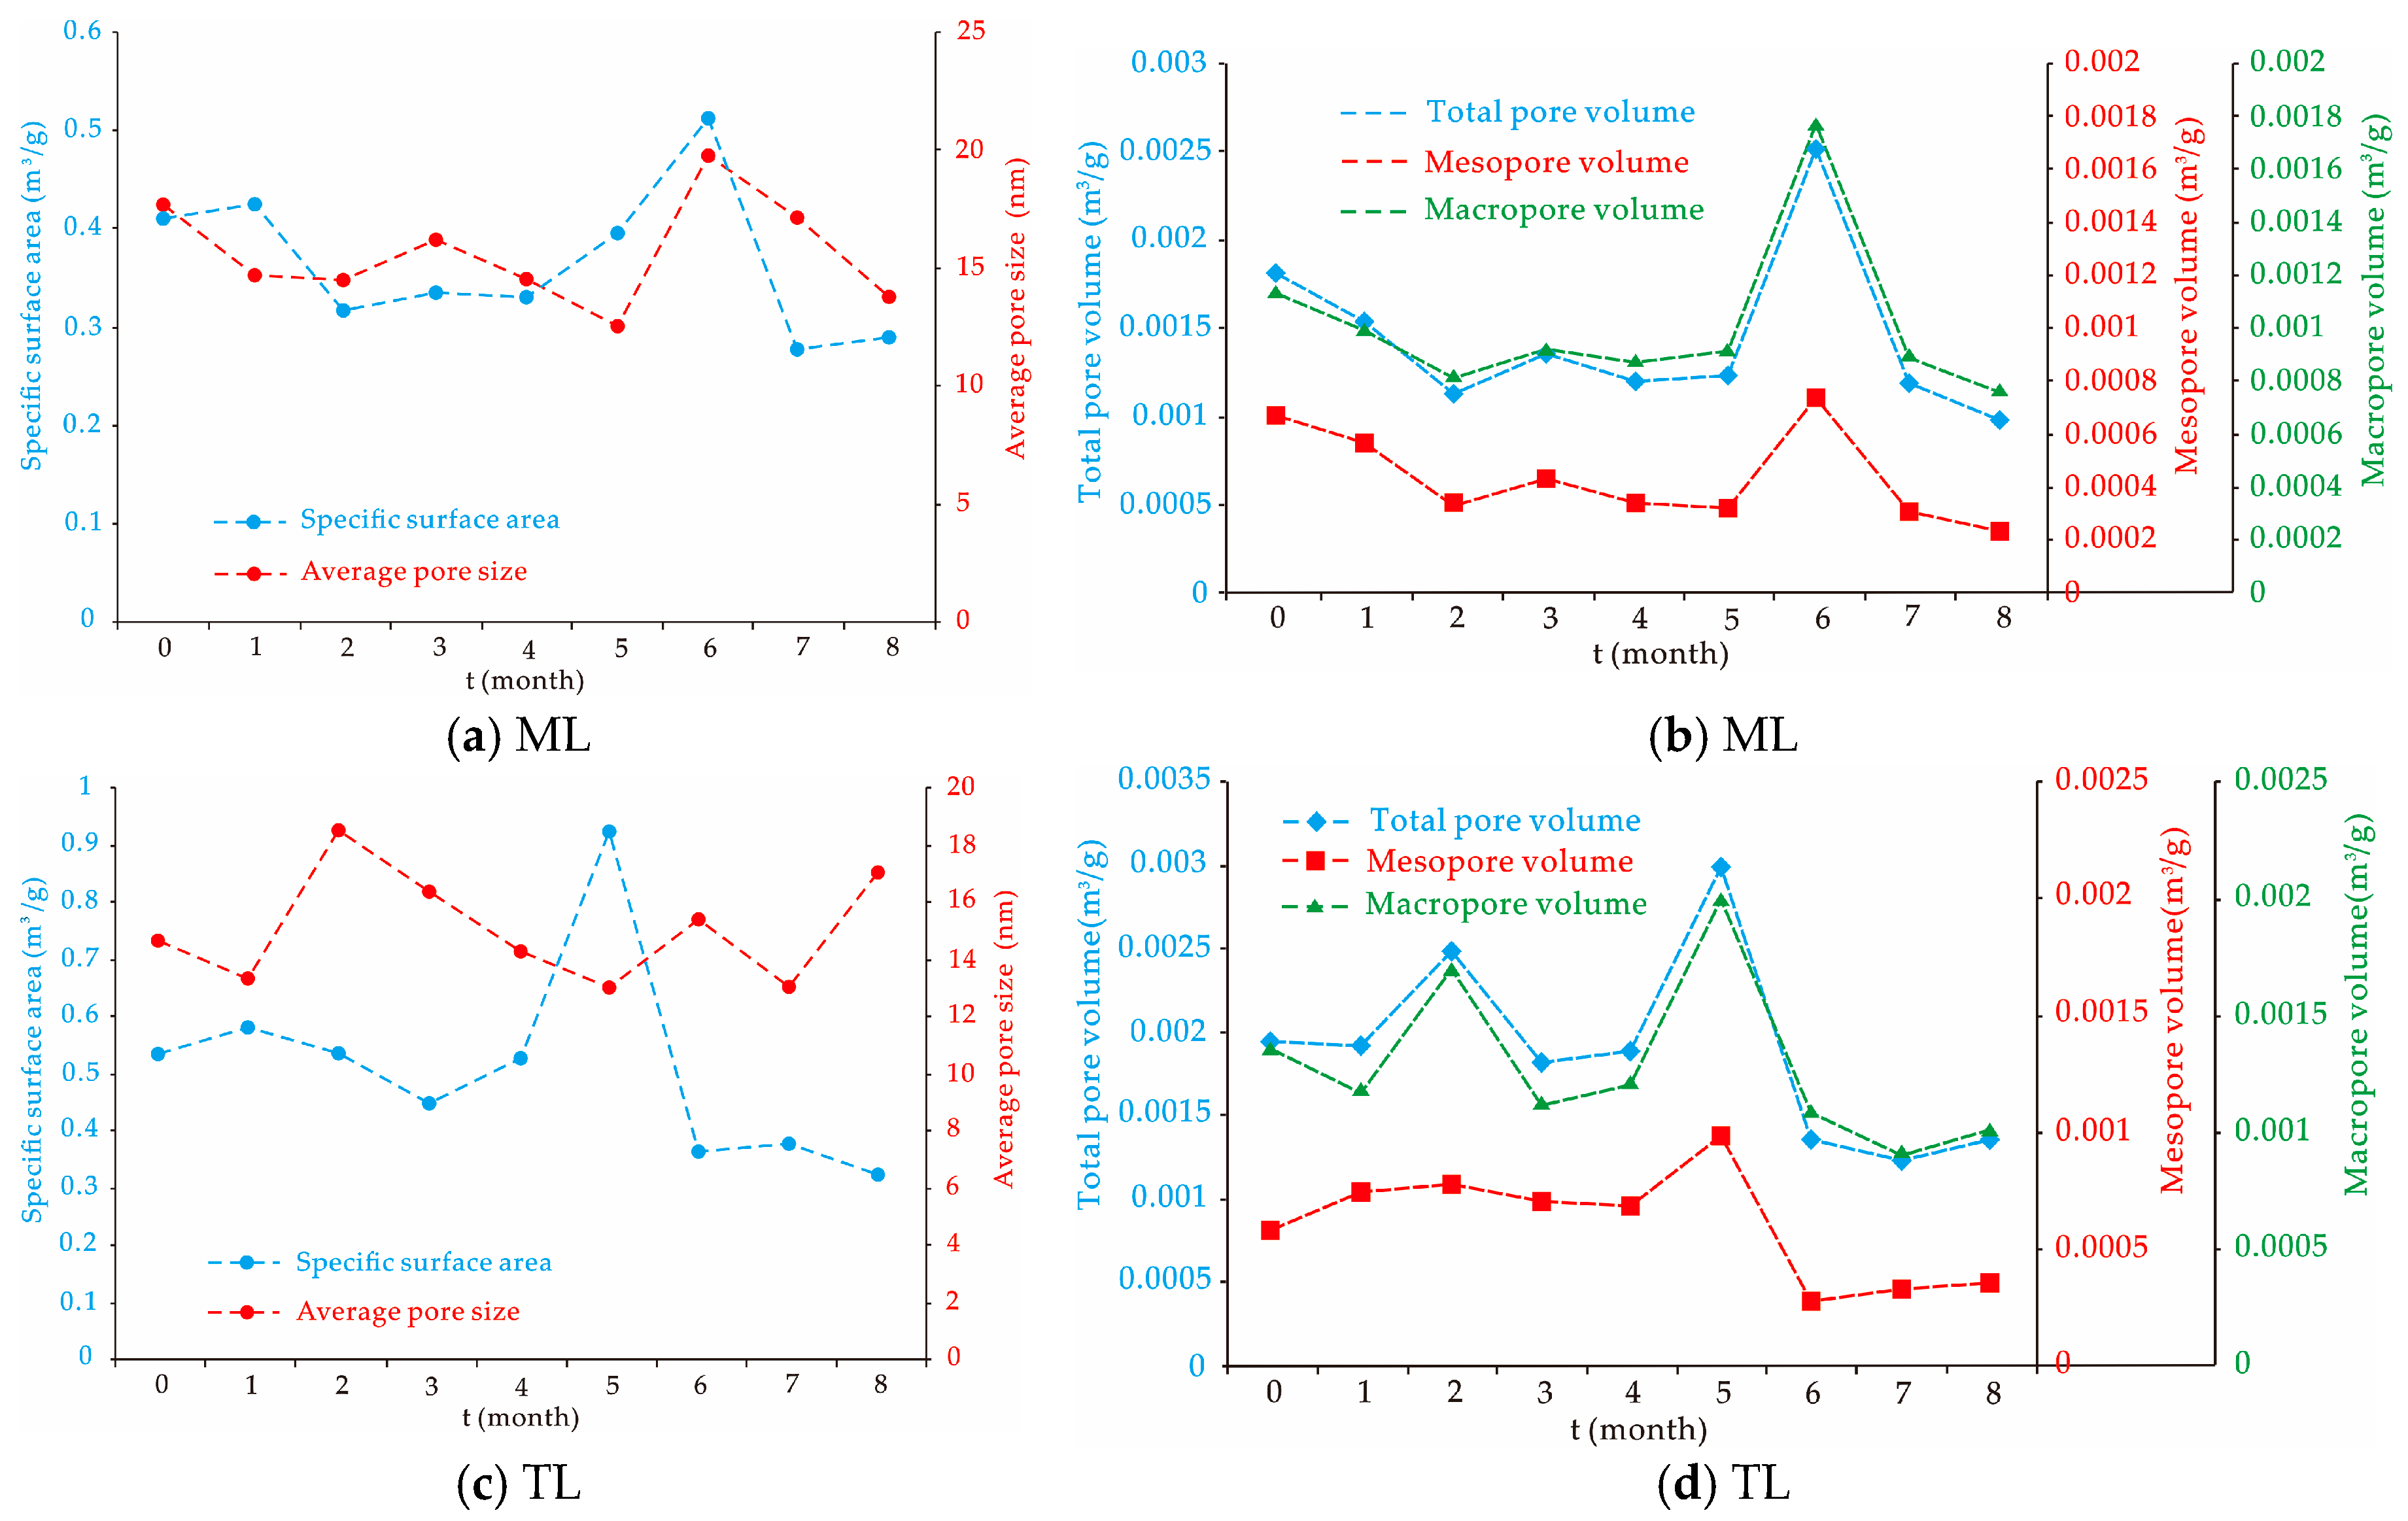
3.5.1. Variations of Specific Surface Area and Pore Volume
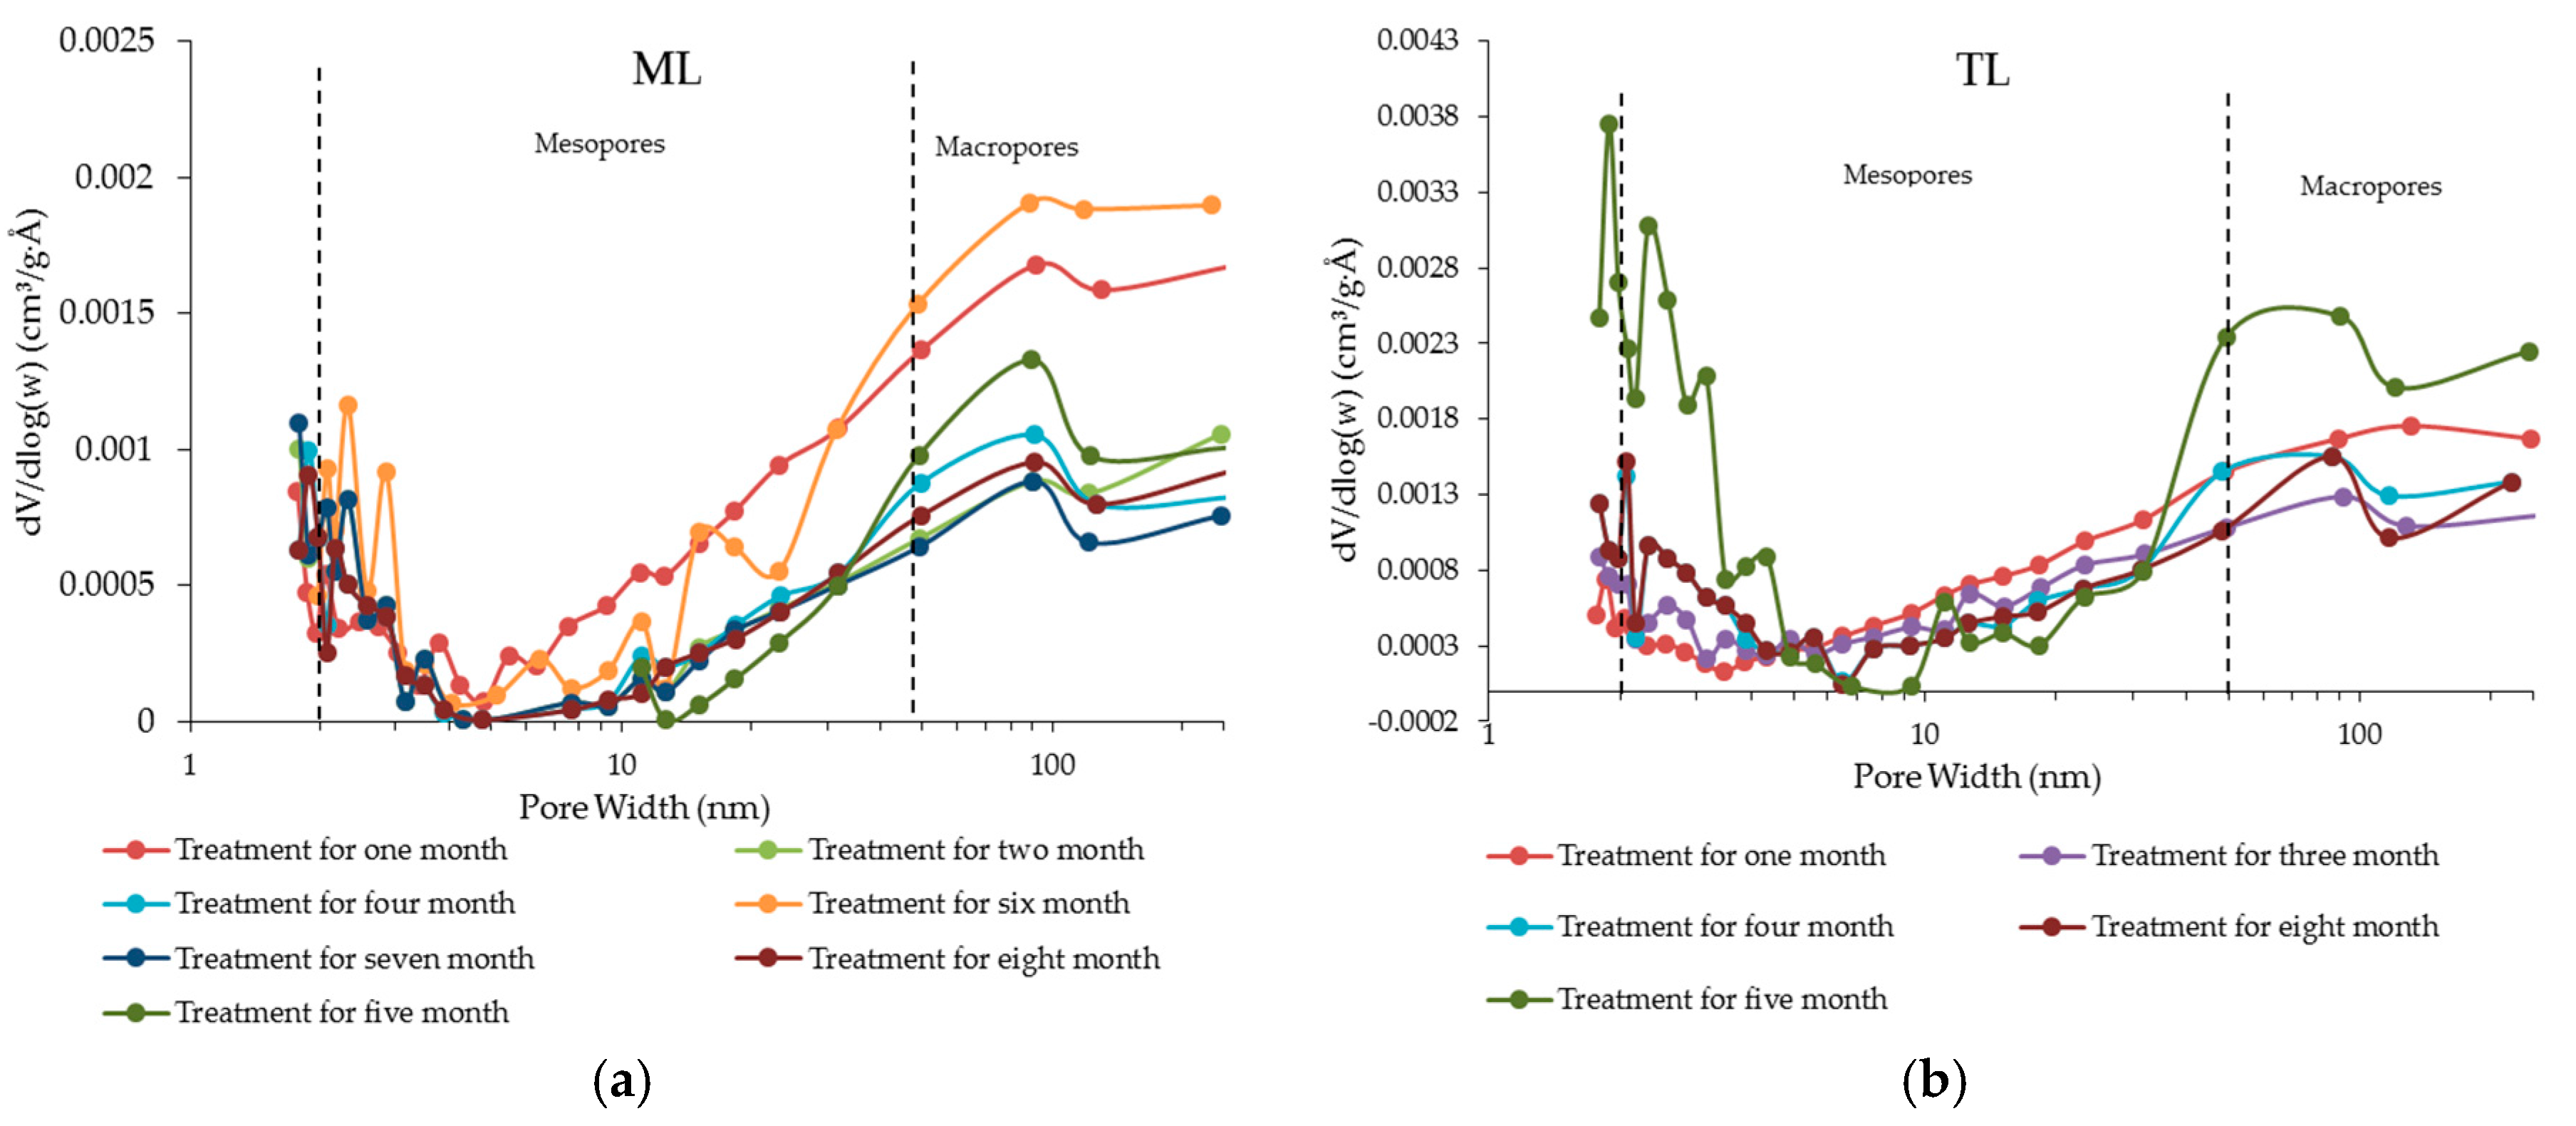
3.5.2. Variations of Pore Size Distribution
3.6. Variation of Coal Permeability
4. Discussion
4.1. Variation Analysis of Ion Content Dissolution Rates
4.1.1. Variation of Ion Content
4.1.2. Ion Dissolution of the Pure Minerals
Variation Analysis of Dissolution Rates
Kinetic Models
4.2. Variation of Mineral Composition
4.3. Influence of Minerals Reaction on Pore Structure
4.4. Effects of CO2 Injection on Coal Permeability
4.4.1. Influence of Minerals Reaction on Permeability
4.4.2. Influence of Pore Structure on Permeability
5. Implication for CO2-ECBM
6. Conclusions
- (1)
- After the reaction of coal samples with the carbonic acid solution, the relative carbonate mineral content decreased with time, while the relative clay mineral content increased. The contents of various ions in solution increased as well, indicating the occurrence of the ion exchange between the reaction solution and the minerals inside the coal samples.
- (2)
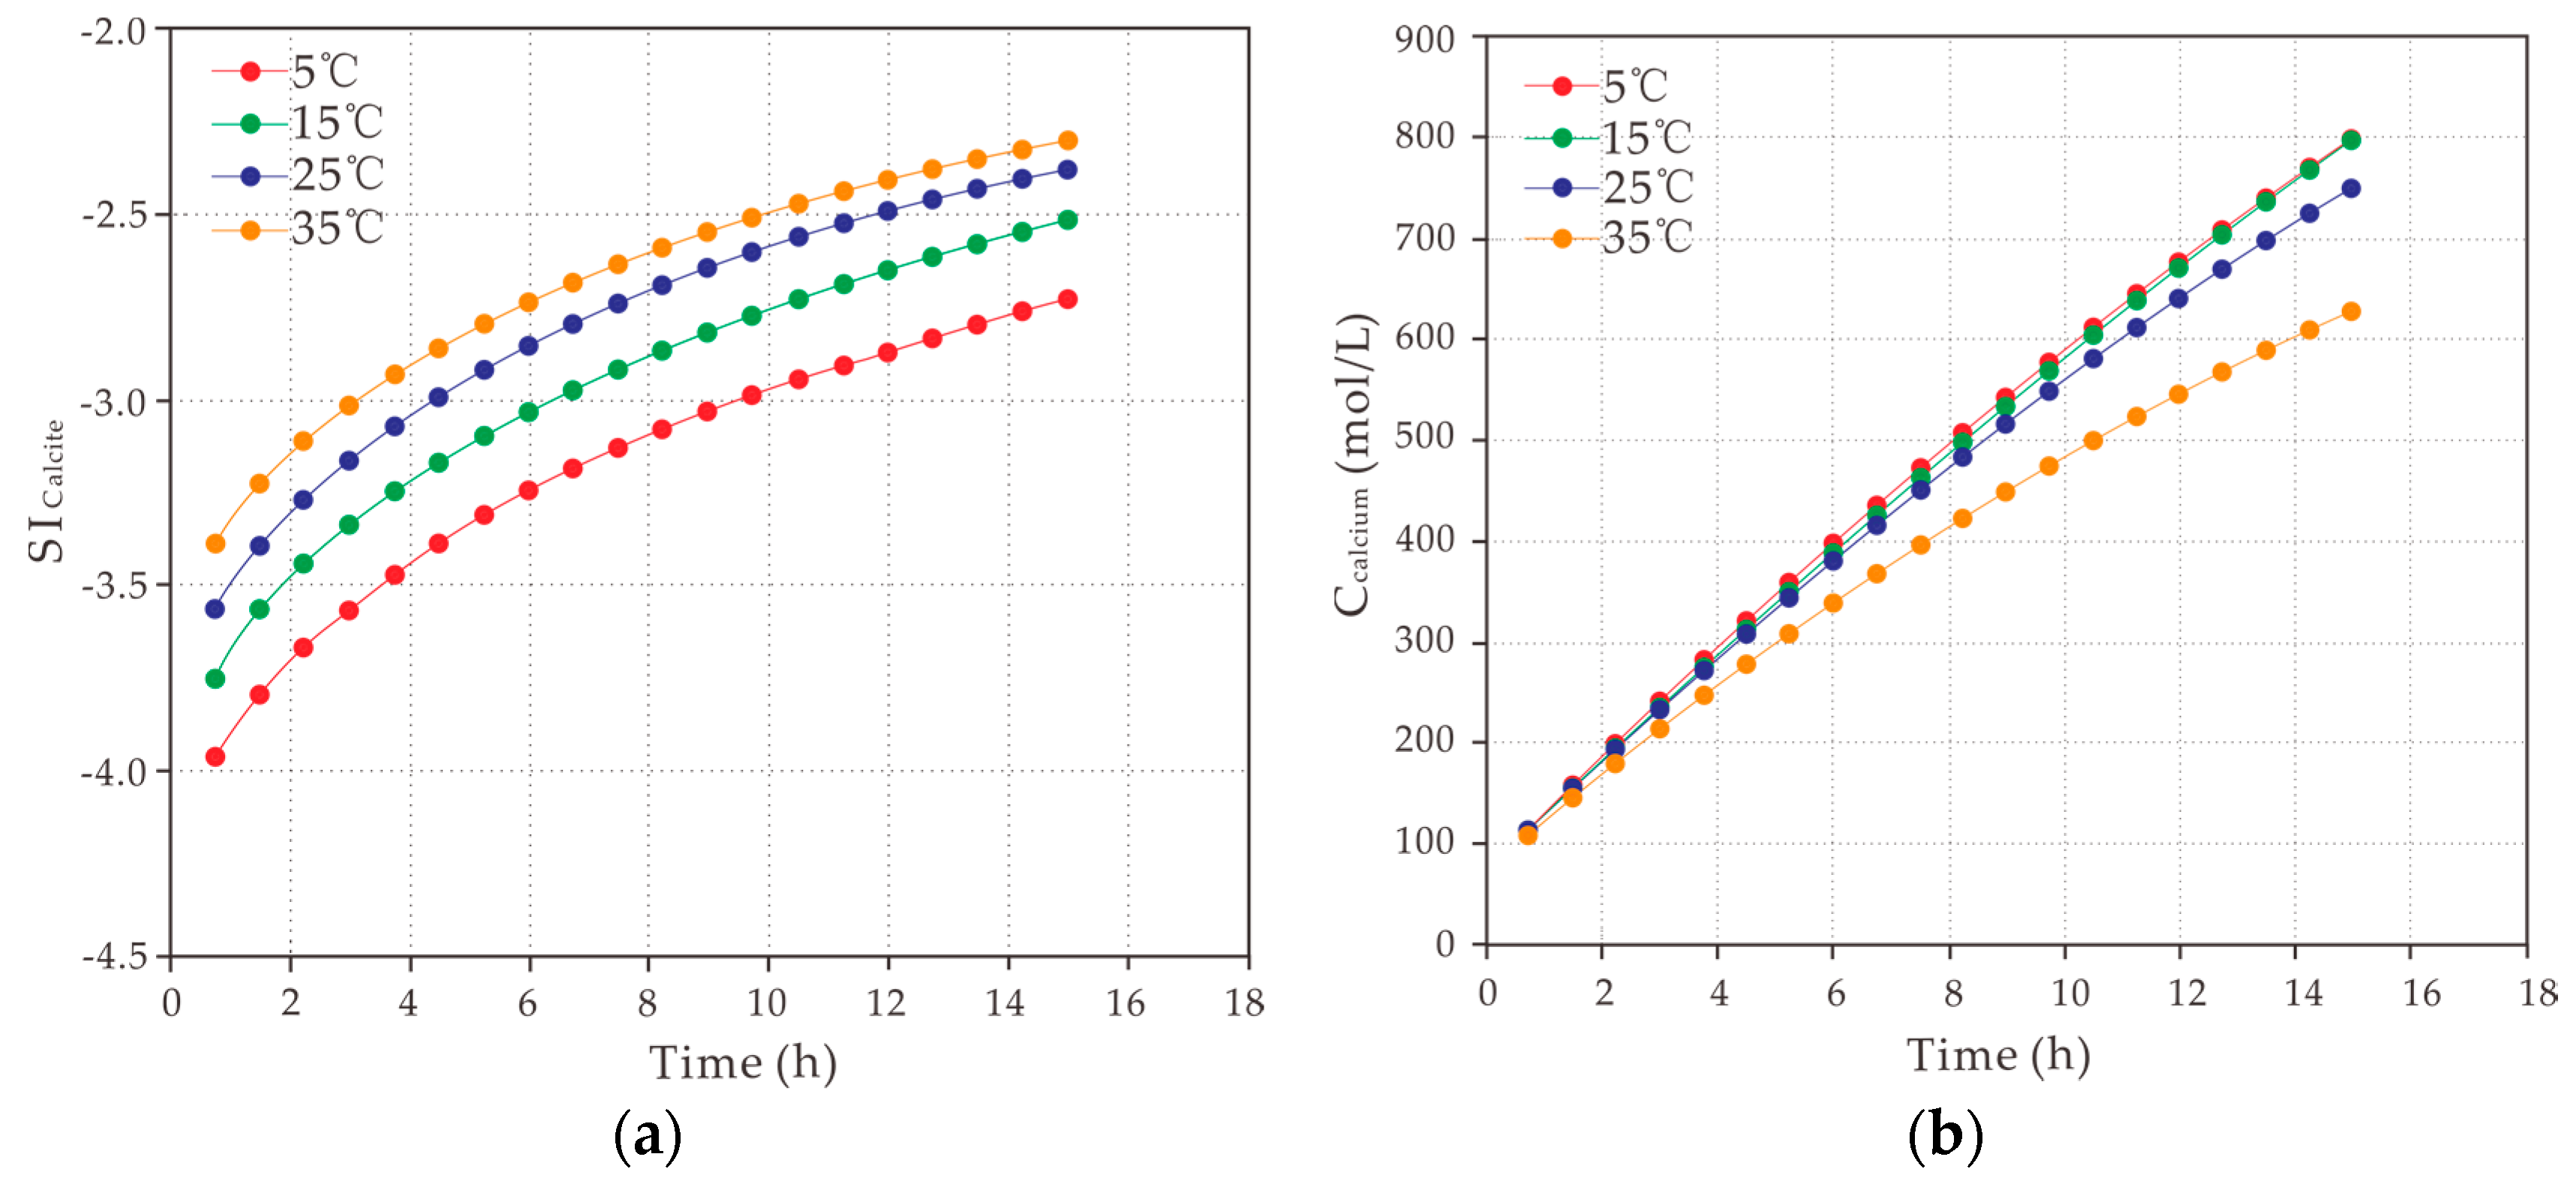
- The dissolution rates of Ca2+, Mg2+, and Si4+ ions first increase and then decrease with time. The dissolution rate of Ca2+ ions in calcite is higher than that in dolomite, and the dissolution rate of Mg2+ ions in dolomite is smaller than that of Ca2+. The amount of silicon species dissolved in clay minerals is greater than the content of aluminum ions. The ion solubility of different clay minerals follows the order of montmorillonite > illite > kaolinite. The dissolution of Si4+ ions in clay minerals can be satisfactorily described by the interfacial diffusion-controlled model, and the dissolution rate of carbonate minerals can be characterized by the Plummer formula.
- (3)
- As indicated by the results of low-pressure nitrogen gas (N2) adsorption, the interaction of the Malan and Tunlan coal samples with CO2 and water can promote the transformation of micropores to mesopores and macropores and thus improve their pore size distributions. The BET specific surface areas and pore volumes of these samples first increase and then decrease with time. Thus, the BET specific surface area and total pore volume of the Malan coal sample reached their maximum values after six months of acidification (the corresponding rates of change were 30% and 40%, respectively). The Tunlan coal sample reached its maximum BET specific surface area and total pore volume with the corresponding rates of change of 73% and 54%, respectively, after five months of acidification.
- (4)
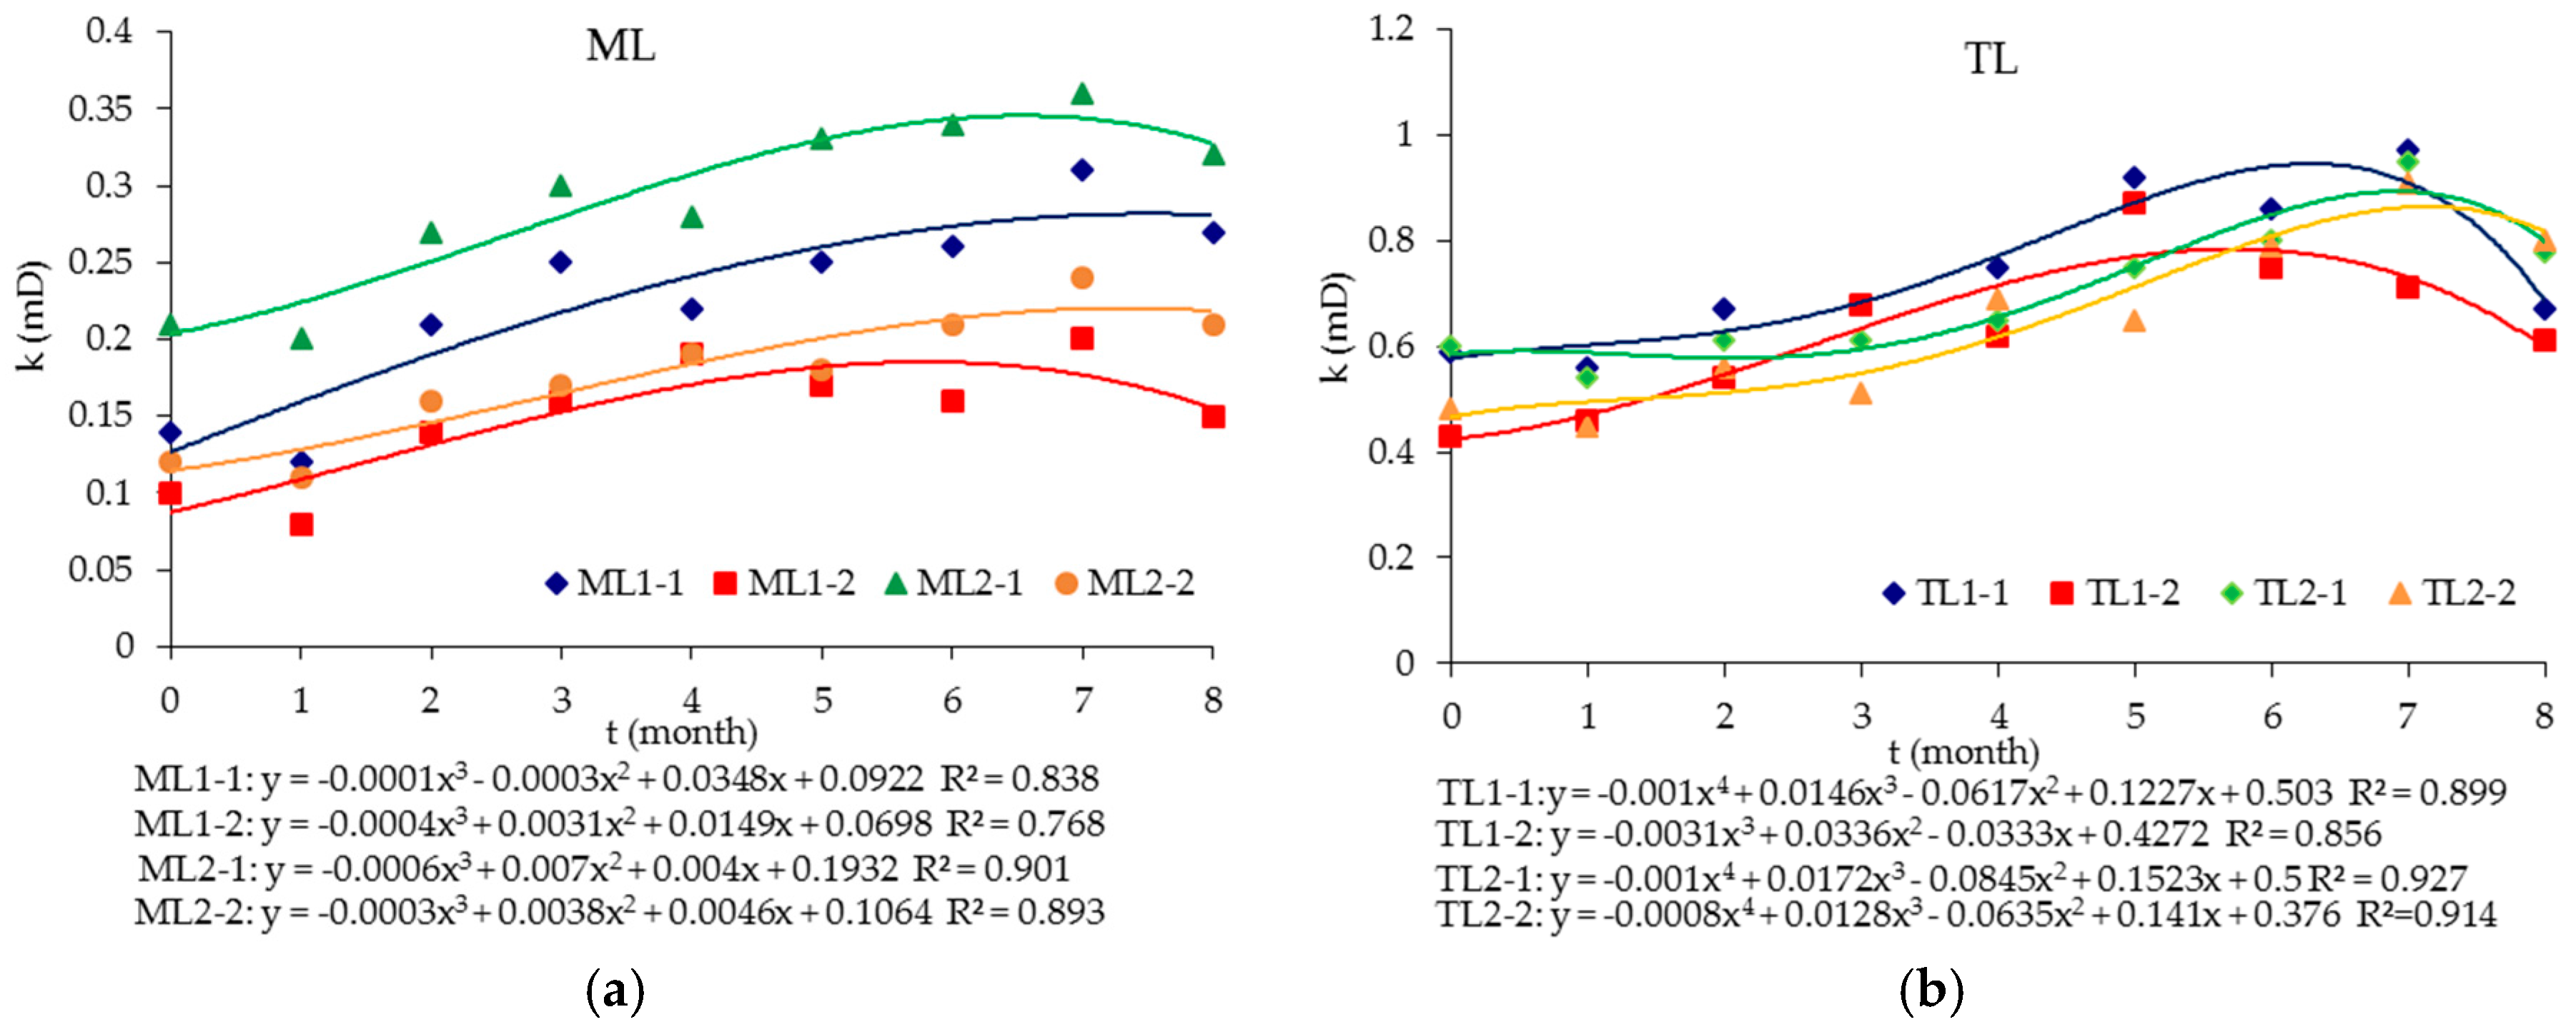
- The conducted permeability tests confirmed the increase in permeability for the Malan and Tunlan coal samples from their initial average values of 0.14 × 10⁻³ μm2 and 0.56 × 10⁻³ μm2 to 0.28 × 10⁻³ μm2 and 0.86 × 10⁻³ μm2, respectively, owing to the dissolution of carbonate minerals, which created additional seepage channels. Since carbonate minerals constitute a larger fraction of the Tunlan coal sample, they exhibited a greater increase in permeability as compared to that of the Malan coal sample.
Acknowledgments
Author Contributions
Conflicts of Interest
References
- Saghafi, A. Potential for ECBM and CO2 storage in mixed gas Australian coals. Int. J. Coal Geol. 2010, 82, 240–251. [Google Scholar] [CrossRef]
- Tian, L.; Cao, Y.; Chai, X.; Liu, T.; Feng, P.; Feng, H.; Zhou, D.; Shi, B.; Oestreich, R.; Rodvelt, G. Best practices for the determination of low-pressure/permeability coalbed methane reservoirs, Yuwu Coal Mine, Luan mining area, China. Fuel 2015, 160, 100–107. [Google Scholar] [CrossRef]
- Wang, G.; Ren, T.; Wang, K.; Zhou, A. Improved apparent permeability models of gas flow in coal with Klinkenberg effect. Fuel 2014, 128, 53–61. [Google Scholar] [CrossRef]
- Zhang, L.; Zhang, H.; Guo, H. A case study of gas drainage to low permeability coal seam. Int. J. Min. Sci. Technol. 2017, 27, 687–692. [Google Scholar] [CrossRef]
- Keshavarz, A.; Badalyan, A.; Johnson, R.; Bedrikovetsky, P. Productivity enhancement by stimulation of natural fractures around a hydraulic fracture using micro-sized proppant placement. J. Nat. Gas Sci. Eng. 2016, 33, 1010–1024. [Google Scholar] [CrossRef]
- Ranathunga, A.S.; Perera, M.S.A.; Ranjith, P.G.; Wei, C.H. An experimental investigation of applicability of CO2 enhanced coal bed methane recovery to low rank coal. Fuel 2016, 189, 391–399. [Google Scholar] [CrossRef]
- Sayyafzadeh, M.; Keshavarz, A. Optimisation of gas mixture injection for enhanced coalbed methane recovery using a parallel genetic algorithm. J. Nat. Gas Sci. Eng. 2016, 33, 942–953. [Google Scholar] [CrossRef]
- Sayyafzadeh, M.; Keshavarz, A.; Alias, A.R.M.; Dong, K.A.; Manser, M. Investigation of varying-composition gas injection for coalbed methane recovery enhancement: A simulation-based study. J. Nat. Gas Sci. Eng. 2015, 27, 1205–1212. [Google Scholar] [CrossRef]
- Wang, H.; Ran, Q.; Liao, X.; Zhao, X.; Xu, M.; Fang, P. Study of the CO2 ECBM and sequestration in coalbed methane reservoirs with SRV. J. Nat. Gas Sci. Eng. 2016, 33, 678–686. [Google Scholar] [CrossRef]
- Balucan, R.D.; Turner, L.G.; Steel, K.M. Acid-induced mineral alteration and its influence on the permeability and compressibility of coal. J. Nat. Gas Sci. Eng. 2016, 33, 973–987. [Google Scholar] [CrossRef]
- Mito, S.; Xue, Z.; Ohsumi, T. Case study of geochemical reactions at the Nagaoka CO2 injection site, Japan. Int. J. Greenh. Gas Control 2008, 2, 309–318. [Google Scholar] [CrossRef]
- Varre, S.B.K.; Siriwardane, H.J.; Gondle, R.K.; Bromhal, G.S.; Chandrasekar, V.; Sams, N. Influence of geochemical processes on the geomechanical response of the overburden due to CO2 storage in saline aquifers. Int. J. Greenh. Gas Control 2015, 42, 138–156. [Google Scholar] [CrossRef]
- Yang, Q.; Matter, J.; Takahashi, T.; Stute, T.; O’Mullan, G.; Clauson, K.; Umemoto, K.; Goldberg, D. Groundwater geochemistry in bench experiments simulating CO2 leakage from geological storage in the Newark Basin. Int. J. Greenh. Gas Control 2015, 42, 98–108. [Google Scholar] [CrossRef]
- Yu, Z.; Liu, L.; Liu, K.; Yang, S.; Yang, Y. Petrological characterization and reactive transport simulation of a high-water-cut oil reservoir in the Southern Songliao Basin, Eastern China for CO2 sequestration. Int. J. Greenh. Gas Control 2015, 37, 191–212. [Google Scholar] [CrossRef]
- Cui, G.; Zhang, L.; Tan, C.; Ren, S.; Zhuang, Y.; Enechukwu, C. Injection of supercritical CO2 for geothermal exploitation from sandstone and carbonate reservoirs: CO2-water-rock interactions and their effects. J. CO2 Util. 2017, 20, 113–128. [Google Scholar] [CrossRef]
- Ozdemir, E. Role of pH on CO2 sequestration in coal seams. Fuel 2016, 172, 130–138. [Google Scholar] [CrossRef]
- Hou, P.; Gao, F.; Ju, Y.; Cheng, H.; Gao, Y.; Xue, Y.; Yang, Y. Changes in pore structure and permeability of low permeability coal under pulse gas fracturing. J. Nat. Gas Sci. Eng. 2016, 34, 1017–1026. [Google Scholar] [CrossRef]
- Liu, C.; Wang, G.X.; Sang, S.; Rudolph, V. Changes in pore structure of anthracite coal associated with CO2 sequestration process. Fuel 2010, 89, 2665–2672. [Google Scholar] [CrossRef]
- Zhang, K.; Cheng, Y.; Li, W.; Wu, D.; Liu, Z. Influence of supercritical CO2 on pore structure and functional groups of coal: Implications for CO2 sequestration. J. Nat. Gas Sci. Eng. 2017, 40, 288–298. [Google Scholar] [CrossRef]
- Li, J.; Zhuang, X.; Yuan, W.; Liu, W.; Liu, B.; Querol, X.; Font, O.; Moreno, N.; Li, J.; Gang, T.; et al. Mineral composition and geochemical characteristics of the Li-Ga-rich coals in the Buertaohai-Tianjiashipan mining district, Jungar Coalfield, Inner Mongolia. Int. J. Coal Geol. 2016, 167, 157–175. [Google Scholar] [CrossRef]
- Determination of the Specific Surface Area of Solids by Gas Adsorption Using the BET Method; Chinese National Standards, General Administration of Quality Supervision, Inspection and Quarantine of the People’s Republic of China/Standardization Administration of the People’s Republic of China: Beijing, China, 2004.
- Pore size Distribution and Porosity of Solid Materials by Mercury Porosimetry and Gas Adsorption; Chinese National Standards, General Administration of Quality Supervision, Inspection and Quarantine of the People’s Republic of China/Standardization Administration of the People’s Republic of China: Beijing, China, 2008.
- Xiong, J.; Liu, X.; Liang, L. Experimental study on the pore structure characteristics of the Upper Ordovician Wufeng Formation shale in the southwest portion of the Sichuan Basin, China. J. Nat. Gas Sci. Eng. 2015, 22, 530–539. [Google Scholar] [CrossRef]
- Zhao, J.; Xu, H.; Tang, D.; Mathews, J.P.; Li, S.; Tao, S. A comparative evaluation of coal specific surface area by CO2 and N2 adsorption and its influence on CH4 adsorption capacity at different pore sizes. Fuel 2016, 183, 420–431. [Google Scholar] [CrossRef]
- Brunauer, S.; Emmett, P.H.; Teller, E. Adsorption of gases in multimolecular layers. J. Am. Chem. Soc. 1938, 60, 309–319. [Google Scholar] [CrossRef]
- De Boer, J.H.; Lippens, B.C.; Linsen, B.G.; Broekhoff, J.C.P.; van den Heuvel, A.; Osinga, T.J. The t-curve of multimolecular N2-adsorption. J. Colloid Interface Sci. 1966, 21, 405–414. [Google Scholar] [CrossRef]
- Feng, R.; Harpalani, S.; Pandey, R. Laboratory measurement of stress-dependent coal permeability using pulse-decay technique and flow modeling with gas depletion. Fuel 2016, 177, 76–86. [Google Scholar] [CrossRef]
- Wen, H.; Li, Z.; Deng, J.; Shu, C.M.; Laiwang, B.; Wang, Q.; Ma, L. Influence on coal pore structure during liquid CO2-ECBM process for CO2 utilization. J. CO2 Util. 2017, 21, 543–552. [Google Scholar] [CrossRef]
- Rouquerol, J.; Avnir, D.; Fairbridge, C.W.; Everett, D.H.; Haynes, J.H.; Pernicone, N.; Ramsay, J.D.F.; Sing, K.S.W.; Unger, K.K. Recommendations for the characterization of porous solids. Pure Appl. Chem. 1994, 66, 1739–1758. [Google Scholar] [CrossRef]
- Sing, K.S.W. Reporting physisorption data for gas/solid systems with special reference to the determination of surface area and porosity. Pure Appl. Chem. 1984, 57, 603–619. [Google Scholar] [CrossRef]
- Kuila, U.; Prasad, M. Specific surface area and pore-size distribution in clays and shales. Geophys. Prospect. 2013, 61, 341–362. [Google Scholar] [CrossRef]
- Tian, H.; Pan, L.; Xiao, X.; Wilkins, R.W.T.; Meng, Z.; Huang, Z. A preliminary study on the pore characterization of Lower Silurian black shales in the Chuandong thrust fold belt, southwestern China using low pressure N2 adsorption and FE-SEM methods. Mar. Pet. Geol. 2013, 48, 8–19. [Google Scholar] [CrossRef]
- Plummer, L.N.; Wigley, T.M.L.; Parkhurst, D.L. The kinetics of calcite dissolution in CO2-water systems at 5° to 60 °C and 0.0 to 1.0 atm CO2. Am. J. Sci. 1978, 278, 179–216. [Google Scholar] [CrossRef]
- Cheng, P.; Crawshaw, J.P.; Maitland, G.C.; Trusler, J.P.M. Kinetics of calcite dissolution in CO2-saturated water at temperatures between (323 and 373) K and pressures up to 13.8 MPa. Chem. Geol. 2015, 403, 74–85. [Google Scholar]
- Chou, L.; Garrels, R.M.; Wollast, R. Comparative study of the kinetics and mechanisms of dissolution of carbonate minerals. Chem. Geol. 1989, 78, 269–282. [Google Scholar] [CrossRef]
- Pokrovsky, O.S.; Golubev, S.V.; Schott, J.; Castillo, A. Calcite, dolomite and magnesite dissolution kinetics in aqueous solutions at acid to circumneutral pH, 25 to 150 °C and 1 to 55 atm pCO2: New constraints on CO2 sequestration in sedimentary basins. Chem. Geol. 2009, 265, 20–32. [Google Scholar] [CrossRef]
- Finneran, D.W.; Morse, J.W. Calcite dissolution kinetics in saline waters. Chem. Geol. 2009, 268, 137–146. [Google Scholar] [CrossRef]
- Shi, P.; Zhang, B.; Jiang, M. Kinetics of the Carbonate Leaching for Calcium Metavanadate. Minerals 2016, 6, 102. [Google Scholar] [CrossRef]
- Wang, H.; Fu, X.; Jian, K.; Li, T.; Luo, P. Changes in coal pore structure and permeability during N2 injection. J. Nat. Gas Sci. Eng. 2015, 27, 1234–1241. [Google Scholar] [CrossRef]


| Reaction | Mineral | Equation |
|---|---|---|
| Dissolution | Calcite | |
| Dolomite | ||
| Precipitation | Chlorite | |
| Potassium feldspar |
| Sample | wt % | ||||||||
|---|---|---|---|---|---|---|---|---|---|
| Kaolinite | Illite | Chlorite | Montmorillonite | Quartz | Potassium Feldspar | Calcite | Dolomite | Hematite | |
| Malan | 16.5 | 45.3 | 1.9 | 29.3 | 1 | 3 | 0 | 3 | 0 |
| Tunlan | 34.1 | 31.6 | 2.6 | 16.7 | 2 | 2 | 2 | 4 | 5 |
| Items | pH | Positive Ion (mg/L) | Negative Ion (mg/L) | ||||||
|---|---|---|---|---|---|---|---|---|---|
| K+ + Na+ | Mg2+ | Ca2+ | Total Content | HCO3− | SO42− | Cl− | Total Content | ||
| Ion content | 7.12 | 23.05 | 7.32 | 2.65 | 33.02 | 86.62 | 1.03 | 1.89 | 89.54 |
| Samples | Specific Surface Area a, m²/g | Sext b | Smic c, m²/g | Specific Surface Area Contributed by Micropores, % | Total Pore Volume d, cm³/g | Vmic e, cm³/g | Total Pore Volume Contributed by Micropores, % | Average Pore Size f, nm |
|---|---|---|---|---|---|---|---|---|
| Malan | 0.41 | 0.34 | 0.07 | 17.07 | 0.0018 | 0.000043 | 2.39 | 17.66 |
| Tunlan | 0.53 | 0.34 | 0.19 | 35.85 | 0.0019 | 0.000106 | 5.58 | 14.58 |
| Models | Items | Temperature | Ea, kJ·mol−1 | Judgement Value of Ea, kJ·mol−1 | If the Results Meet the Adopted Model | |||
|---|---|---|---|---|---|---|---|---|
| 25 °C | 35 °C | 45 °C | ||||||
| Interfacial diffusion-controlled model 1 − 3(1 − X)2/3 + 2(1 − X) | pH = 4.3 | k(10−12) | 3.59 | 5.09 | 6.23 | 21.79 | <42.0 | Yes |
| R2 | 0.95 | 0.95 | 0.86 | |||||
| pH = 5.0 | k(10−12) | 2.87 | 3.77 | 5.23 | 23.63 | <42.0 | Yes | |
| R2 | 0.96 | 0.91 | 0.85 | |||||
| pH = 6.3 | k(10−12) | 1.79 | 2.45 | 3.46 | 25.97 | <42.0 | Yes | |
| R2 | 0.91 | 0.89 | 0.88 | |||||
| R2 | - | - | - | |||||
© 2018 by the authors. Licensee MDPI, Basel, Switzerland. This article is an open access article distributed under the terms and conditions of the Creative Commons Attribution (CC BY) license (http://creativecommons.org/licenses/by/4.0/).
Share and Cite
Guo, H.; Ni, X.; Wang, Y.; Du, X.; Yu, T.; Feng, R. Experimental Study of CO2-Water-Mineral Interactions and Their Influence on the Permeability of Coking Coal and Implications for CO2-ECBM. Minerals 2018, 8, 117. https://doi.org/10.3390/min8030117
Guo H, Ni X, Wang Y, Du X, Yu T, Feng R. Experimental Study of CO2-Water-Mineral Interactions and Their Influence on the Permeability of Coking Coal and Implications for CO2-ECBM. Minerals. 2018; 8(3):117. https://doi.org/10.3390/min8030117
Chicago/Turabian StyleGuo, Hui, Xiaoming Ni, Yanbin Wang, Xiaomin Du, Tengteng Yu, and Ruimin Feng. 2018. "Experimental Study of CO2-Water-Mineral Interactions and Their Influence on the Permeability of Coking Coal and Implications for CO2-ECBM" Minerals 8, no. 3: 117. https://doi.org/10.3390/min8030117
APA StyleGuo, H., Ni, X., Wang, Y., Du, X., Yu, T., & Feng, R. (2018). Experimental Study of CO2-Water-Mineral Interactions and Their Influence on the Permeability of Coking Coal and Implications for CO2-ECBM. Minerals, 8(3), 117. https://doi.org/10.3390/min8030117