Gem-Quality Tourmaline from LCT Pegmatite in Adamello Massif, Central Southern Alps, Italy: An Investigation of Its Mineralogy, Crystallography and 3D Inclusions
Abstract
1. Introduction
2. Background Information
3. Geological Setting
4. Materials and Methods
5. Results
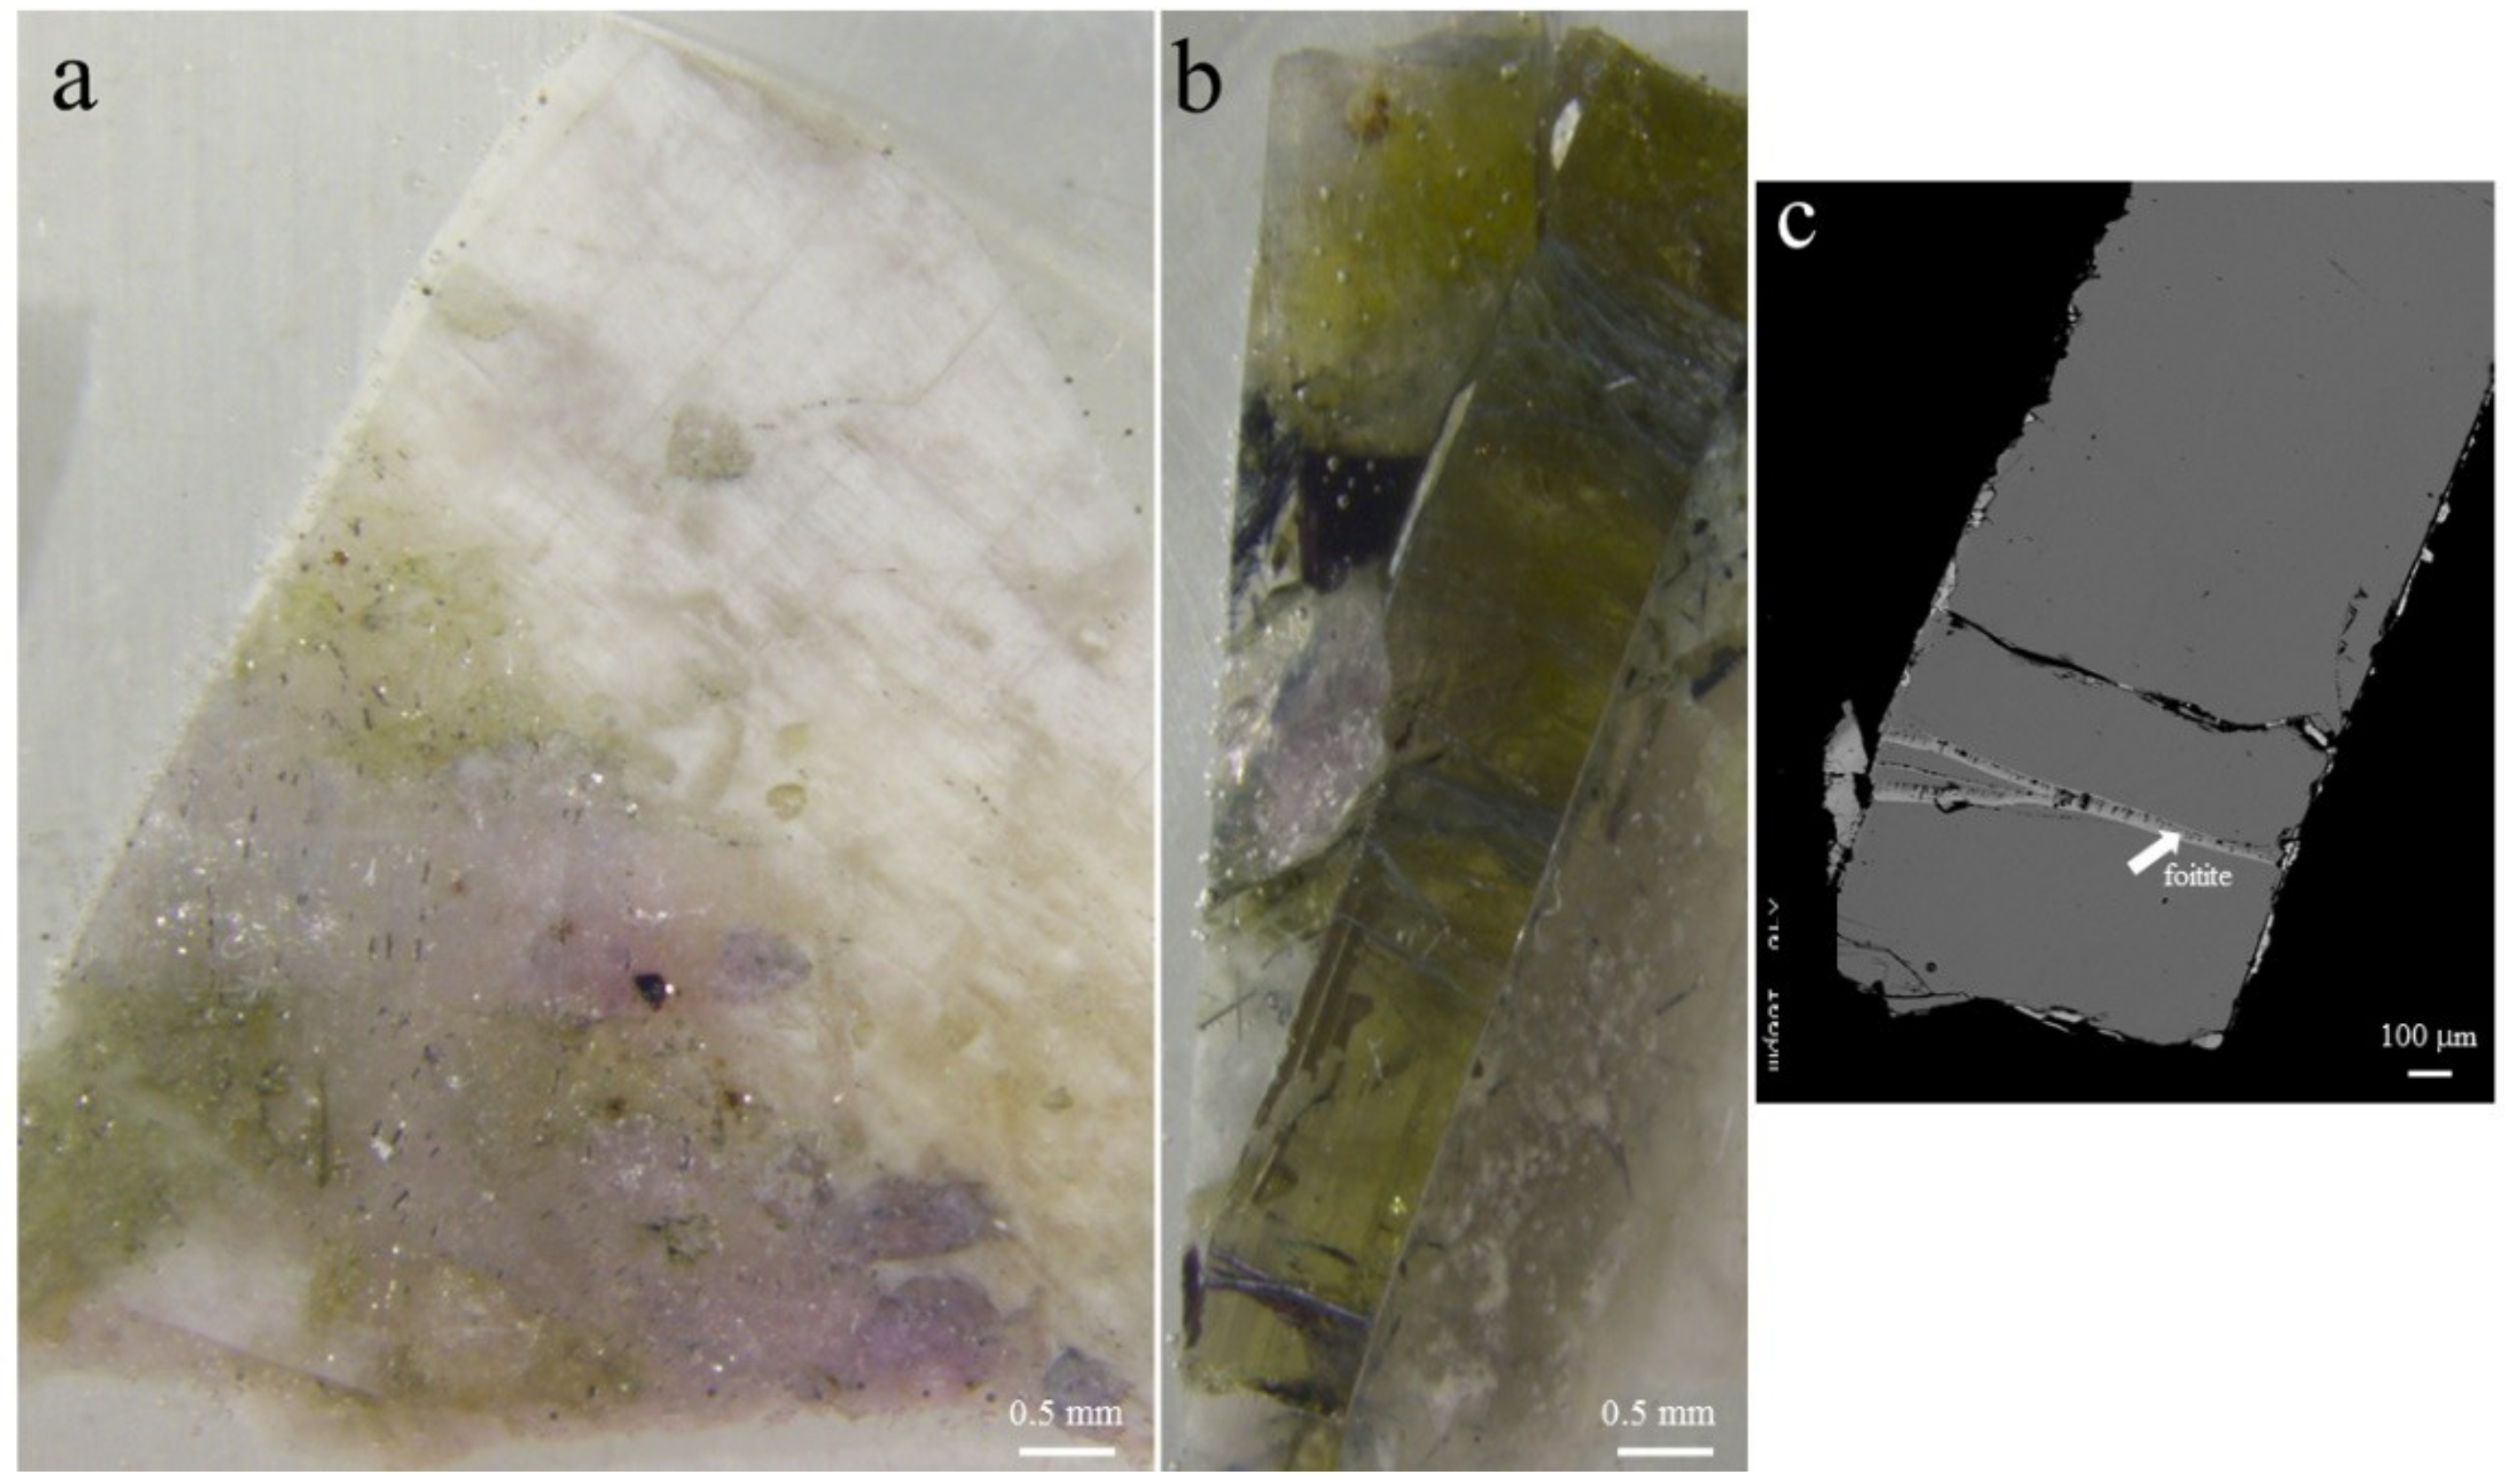
5.1. Gemmological Properties and 3D Visualisation of the Tourmaline Inclusions
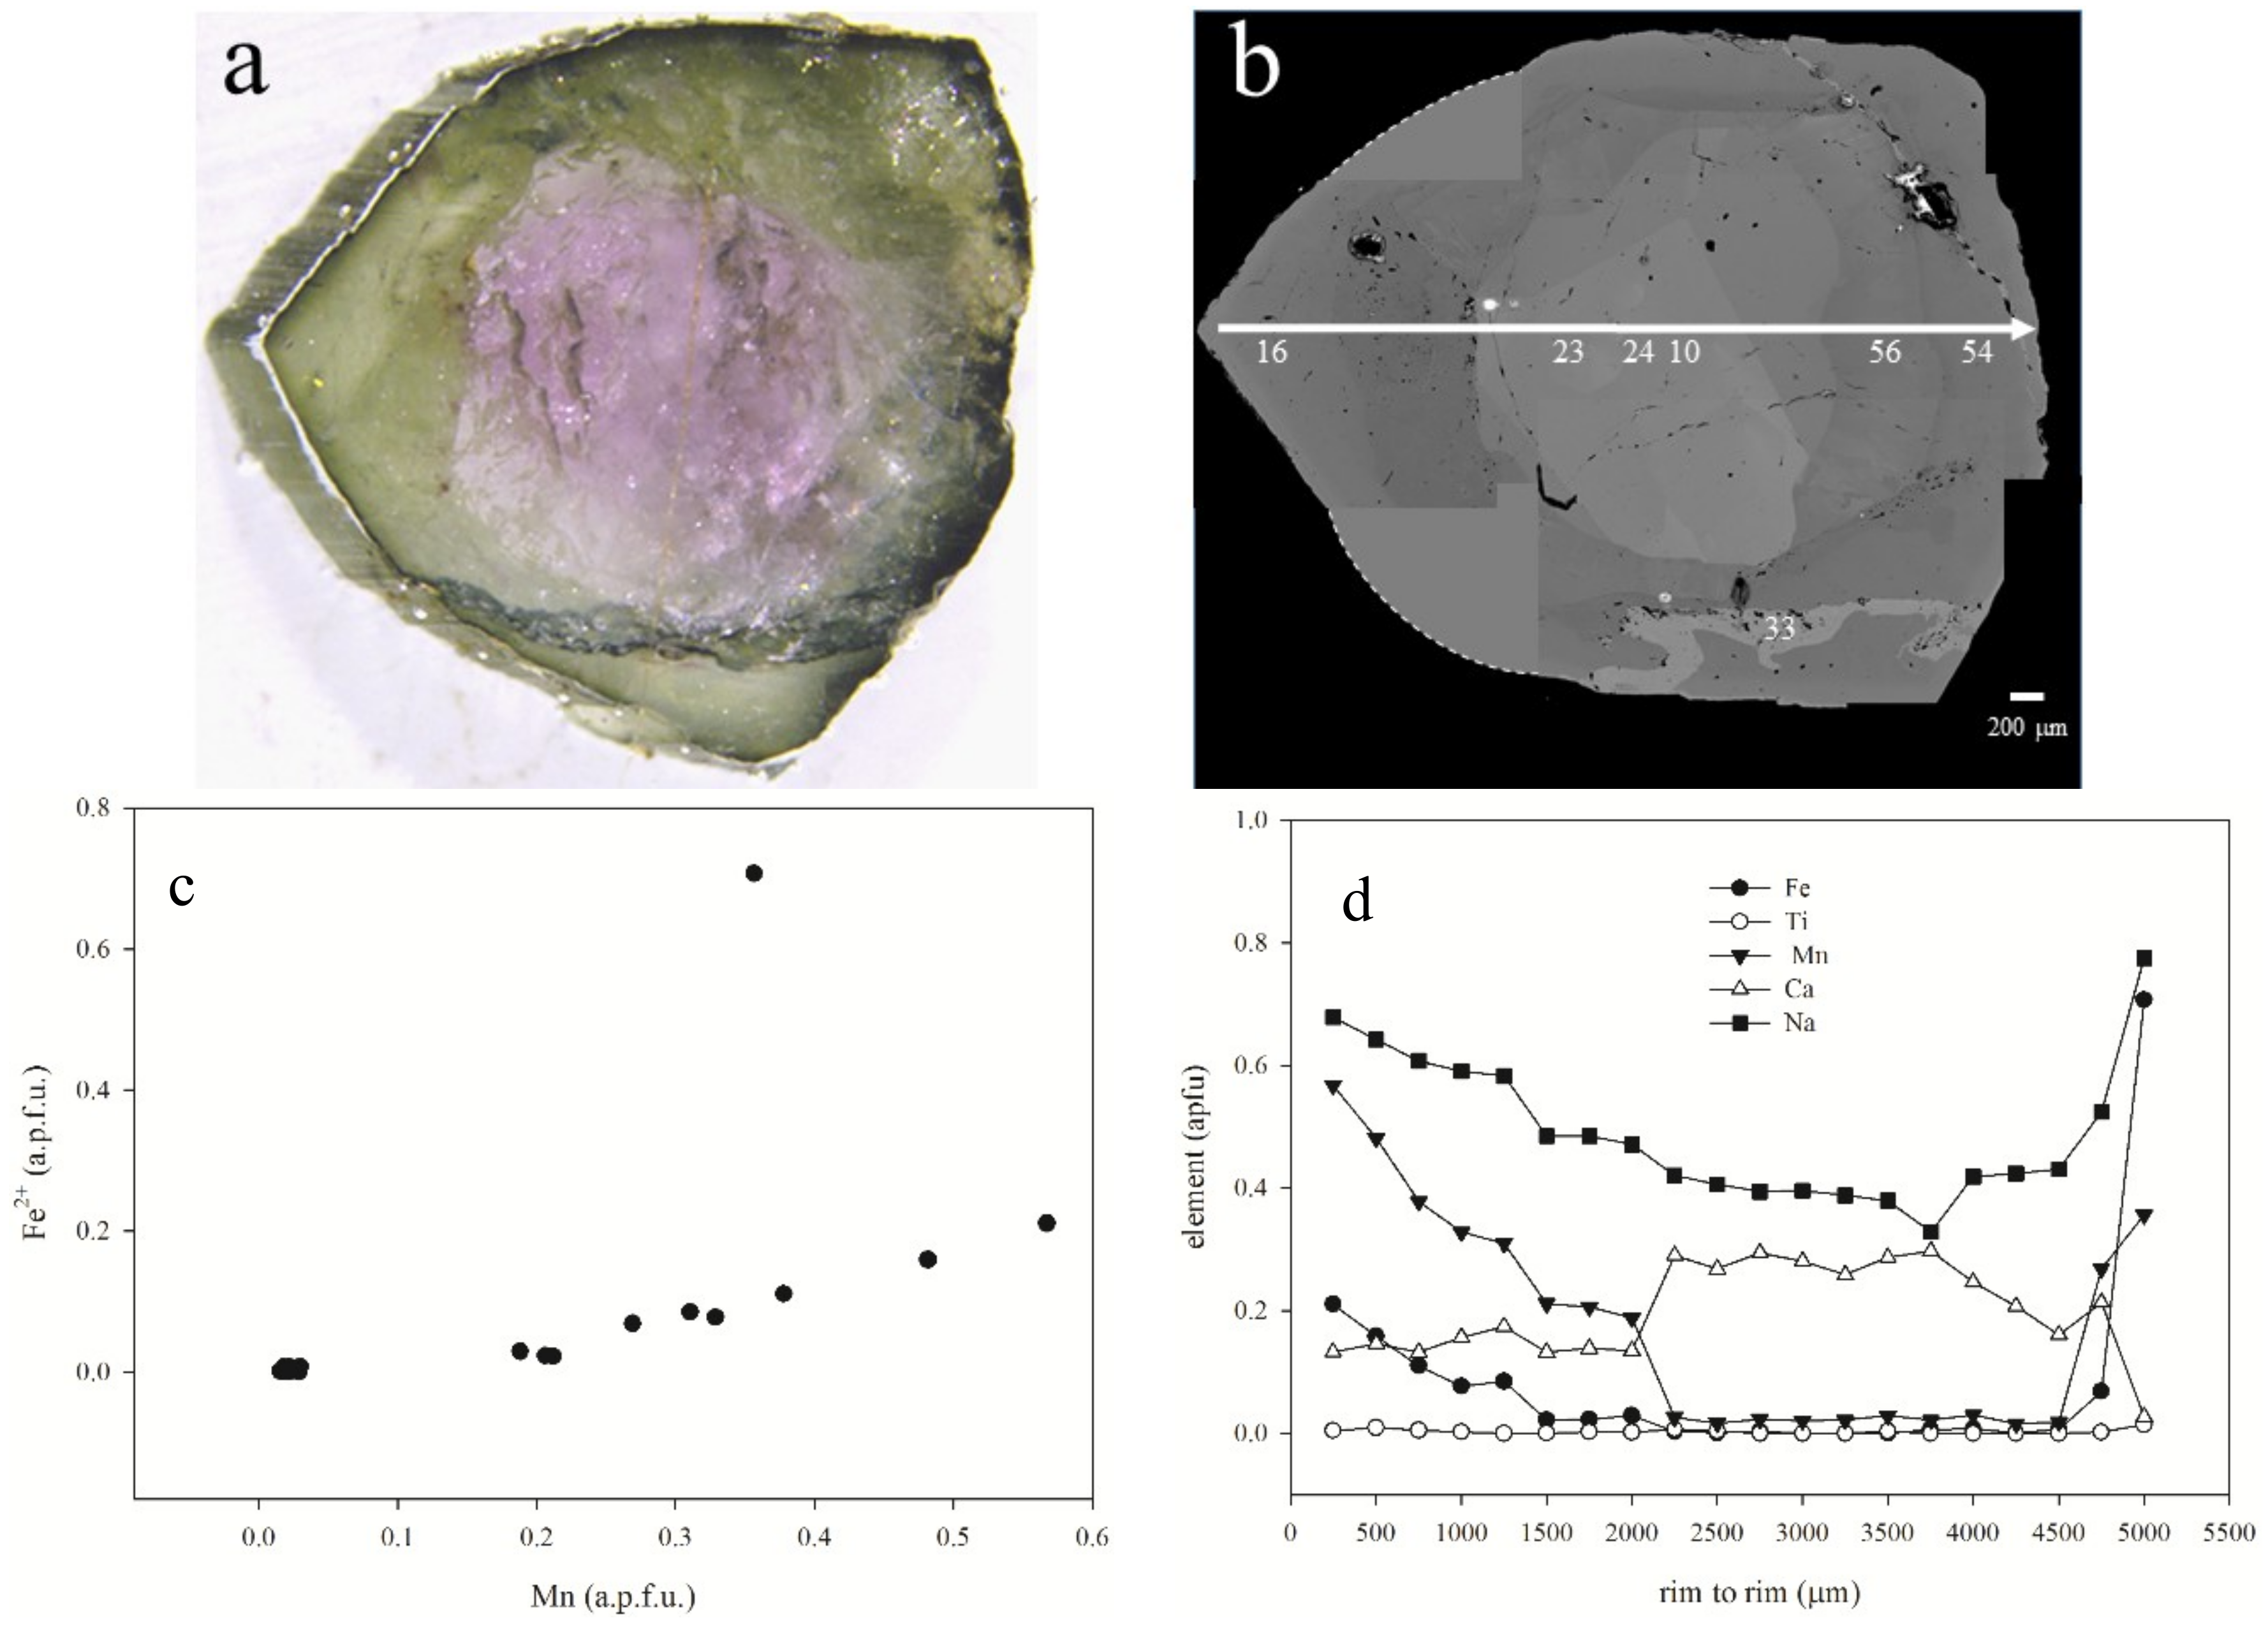
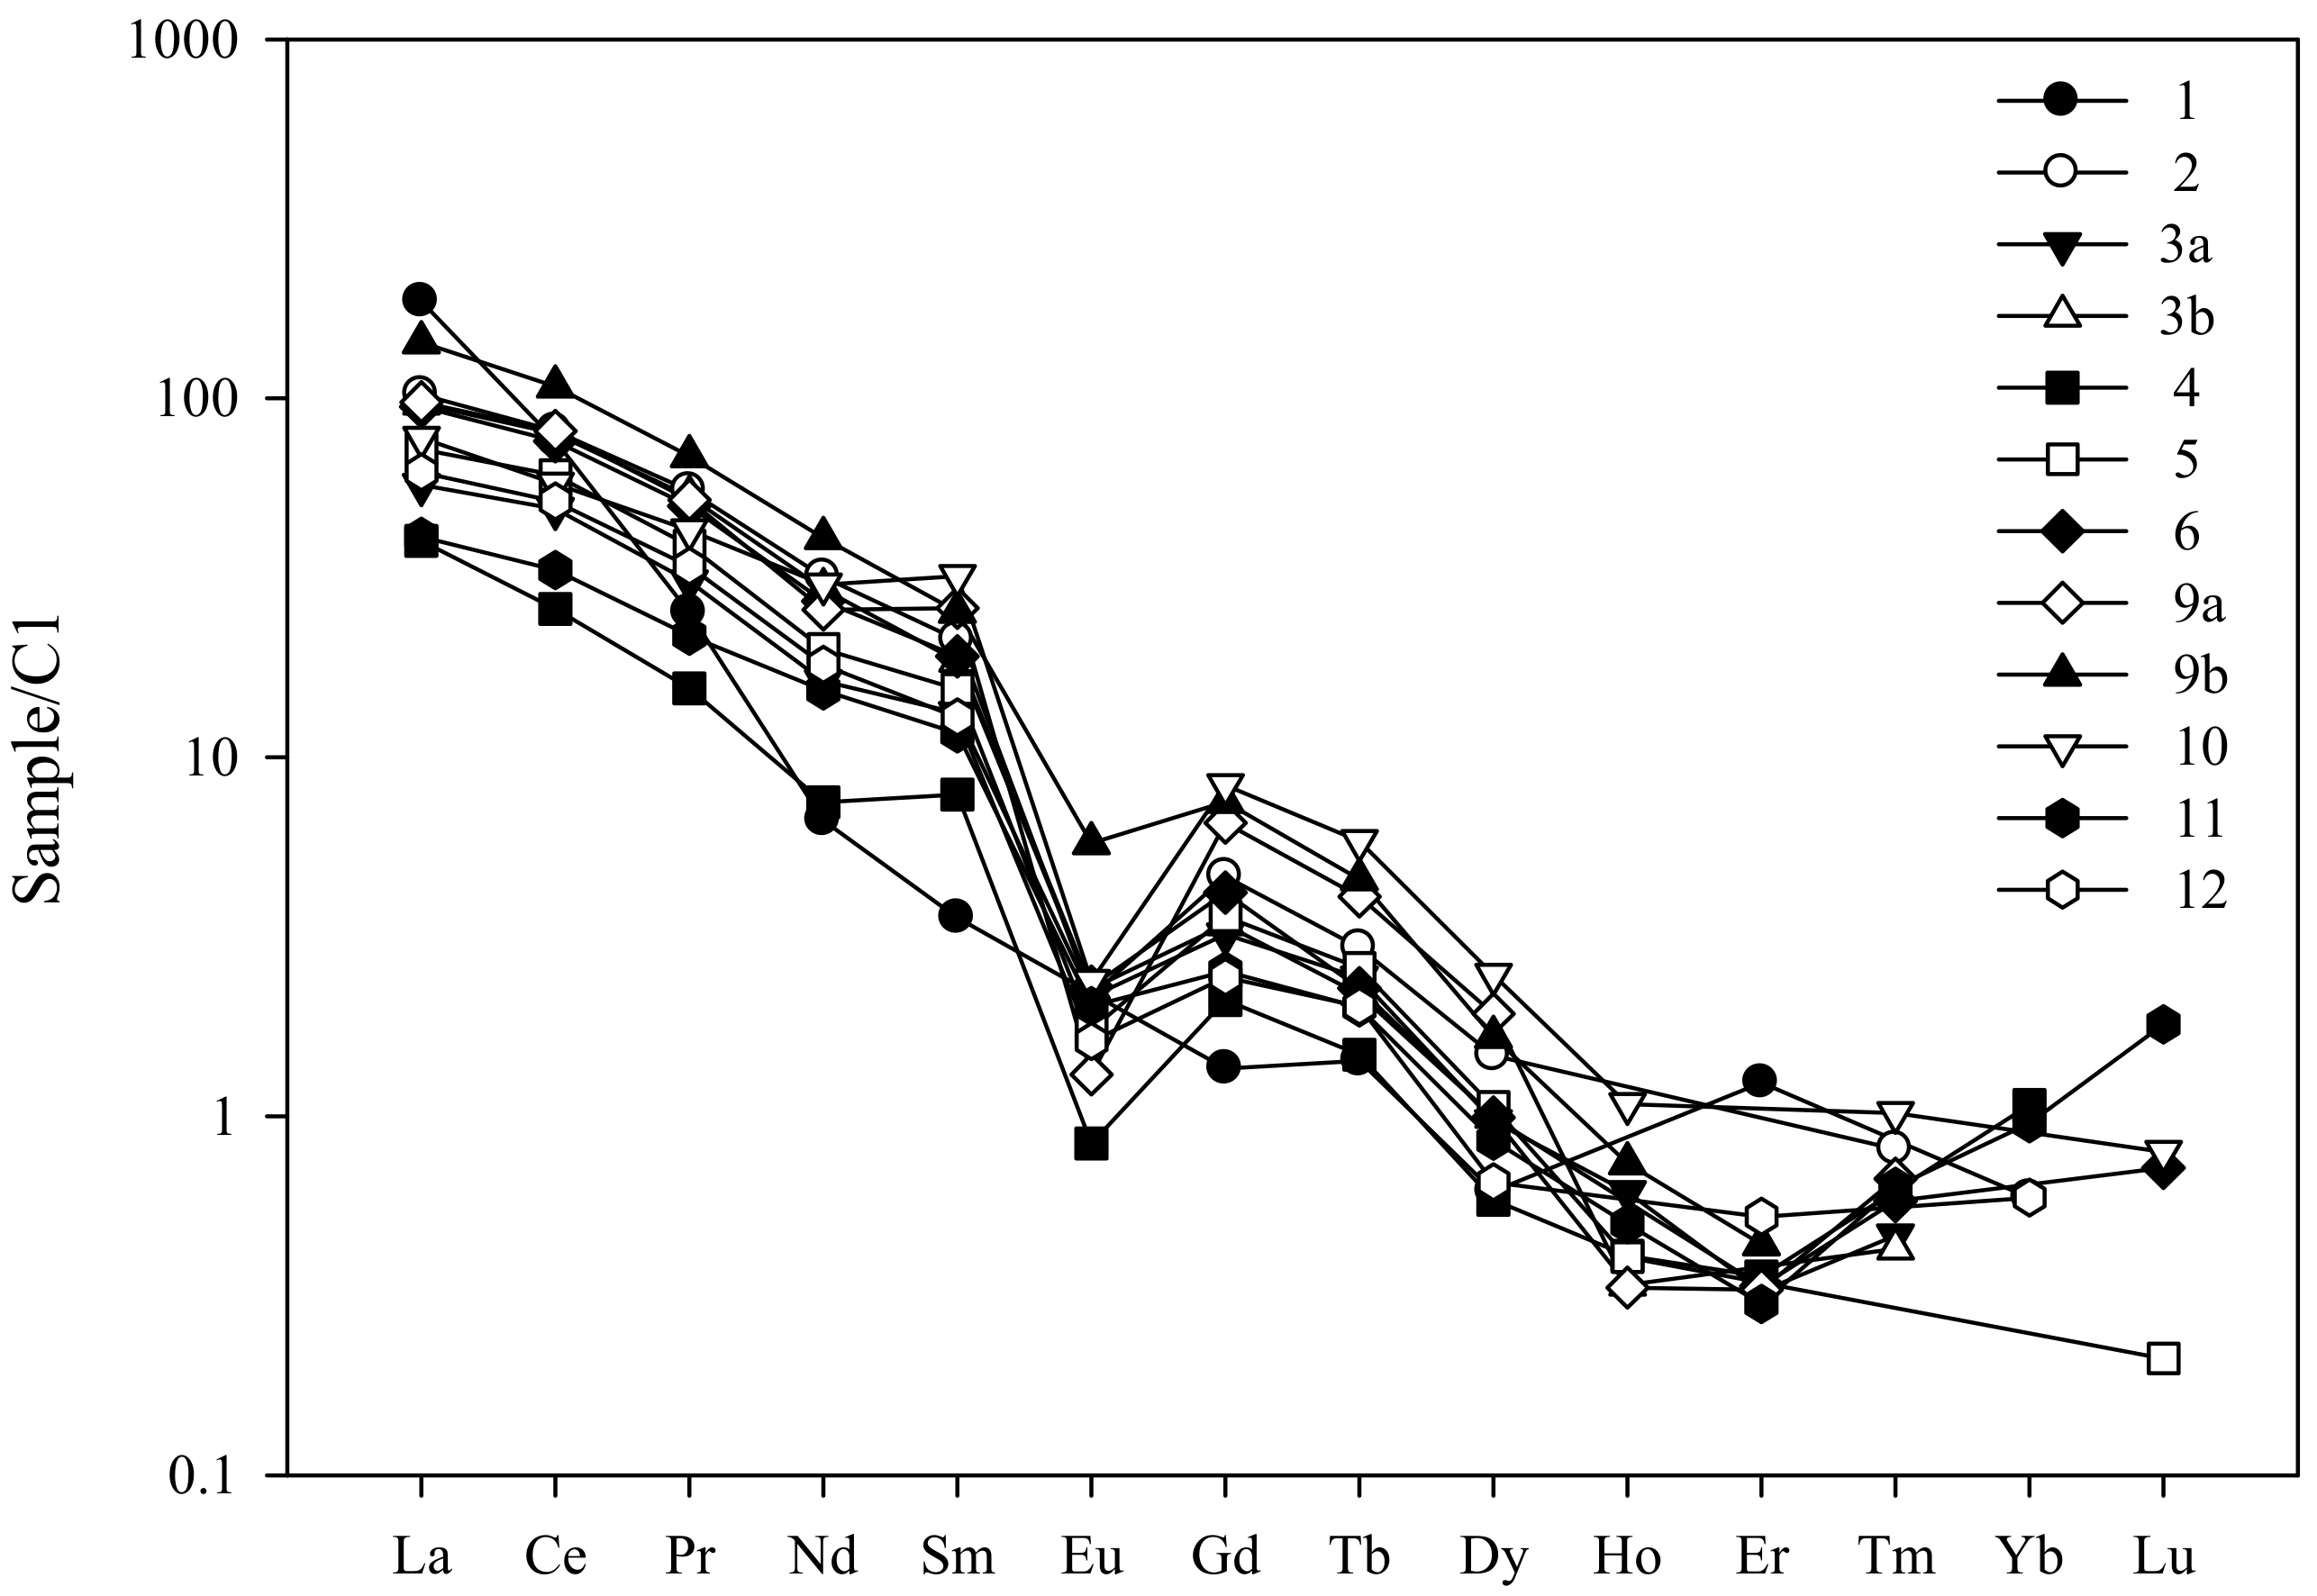
5.2. Chemical Composition
5.3. X-Ray Crystal Structure Refinement
6. Discussion and Conclusions
Supplementary Materials
Author Contributions
Funding
Acknowledgments
Conflicts of Interest
References
- Pezzotta, F.; Laurs, B.M. Tourmaline: The kaleidoscopic gemstone. Elements 2011, 7, 333–338. [Google Scholar] [CrossRef]
- Henry, D.J.; Novák, M.; Hawthorne, F.C.; Ertl, A.; Dutrow, B.L.; Uher, O.; Pezzotta, F. Nomenclature of the tourmaline-supergroup minerals. Am. Mineral. 2011, 96, 895–913. [Google Scholar] [CrossRef]
- Pezzotta, F.; Guastoni, A. Adamello: La pegmatite LCT della valle Adamè. Riv. Mineral. Ital. 2002, 3, 127–142. [Google Scholar]
- Mercurio, M.; Rossi, M.; Izzo, F.; Cappelletti, P.; Germinario, C.; Grifa, C.; Petrelli, M.; Vergara, A.; Langella, A. The characterization of natural gemstones using non-invasive FT-IR spectroscopy: New data on tourmalines. Talanta 2018, 178, 147–159. [Google Scholar] [CrossRef]
- Van Hinsberg, V.J.; Henry, D.J.; Marschall, H.R. Tourmaline: An ideal indicator of its host environment. Can. Mineral. 2011. [Google Scholar] [CrossRef]
- Marinoni, N.; Voltolini, N.; Mancini, L.; Vignola, P.; Pagani, A.; Pavese, A. An investigation of mortars affected by alkali-silica reaction by X-ray synchrotron microtomography: A preliminary study. J. Mater. Sci. 2009, 44, 5815–5823. [Google Scholar] [CrossRef]
- Marinoni, N.; Voltolini, N.; Broekmans, M.A.T.M.; Mancini, L.; Monteiro, P.J.M.; Rotiroti, N.; Ferrari, E.; Bernasconi, A. A combined synchrotron radiation micro computed tomography and micro X-ray diffraction study on deleterious alkali-silica reaction. J. Mater. Sci. 2015, 50, 7985–7997. [Google Scholar] [CrossRef]
- Hawthorne, F.C.; Henry, D.J. Classification of the minerals of the tourmaline group. Eur. J. Mineral. 1999, 11, 201–215. [Google Scholar] [CrossRef]
- Bosi, F.; Andreozzi, G.B.; Skogby, H.; Lussier, A.J.; Abdu, Y.; Hawthorne, F.C. Fluor-elbaite, Na(Li1.5Al1.5)Al6(Si6O18)(BO3) 3(OH) 3F, a new mineral species of the tourmaline supergroup. Am. Mineral. 2013, 98, 297–303. [Google Scholar] [CrossRef]
- Bosi, F.; Skogby, H.; Ciriotti, M.E.; Gadas, P.; Novák, M.; Cempírek, J.; Všianský, D.; Filip, J. Lucchesiite, CaFe32+ Al6(Si6O18)(BO3)3(OH)3O, a new mineral species of the tourmaline supergroup. Miner. Mag. 2017. [Google Scholar] [CrossRef]
- Bosi, F. Tourmaline crystal chemistry. Am. Mineral. 2018, 103, 298–306. [Google Scholar] [CrossRef]
- Dupuy, C.; Dostal, J.; Fratta, M. Geochemistry of the Adamello Massif (Northern Italy). Contrib. Mineral. Pet. 1982, 80, 41–48. [Google Scholar] [CrossRef]
- Zhang, C.; Gieré, R.; Stünitz, H.; Brack, P.; Ulmer, P. Garnet-quartz intergrowths in granitic pegmatites from Bergell and Adamello, Italy. Schweiz. Mineral. Petrogr. Mitt. 2001, 81, 89–113. [Google Scholar] [CrossRef]
- Fiedrich, A.M.; Bachmann, O.; Ulmer, P.; Deering, C.D.; Kunze, K.; Leuthold, J. Mineralogical, geochemical, and textural indicators of crystal accumulation in the Adamello Batholith (Northern Italy). Am. Mineral. 2017, 102, 2467–2483. [Google Scholar] [CrossRef]
- Brun, F.; Mancini, L.; Kasae, P.; Favretto, S.; Dreossi, D.; Tromba, G. Pore 3D: A software library for quantitative analysis of porous media. Nucl. Inst. Methods Phys. Res. A 2010, 615, 326–332. [Google Scholar] [CrossRef]
- Brun, F.; Massimi, L.; Fratini, M.; Dreossi, D.; Billé, F.; Accardo, A.; Pugliese, R.; Cedola, A. SYRMEP Tomo Project: A graphical user interface for customizing CT reconstruction workflows. Adv. Struct. Chem. Imag. 2017, 3, 1–9. [Google Scholar] [CrossRef]
- Herman, G.T. Image Reconstruction from Projections; Academic Press: New York, NY, USA, 1980. [Google Scholar]
- Kak, A.C.; Slaney, M. Principles of Computerized Tomographic Imaging; IEEE, Institute for Electrical and Electronic Engineers Press: Piscataway, NY, USA, 1988. [Google Scholar]
- Paganin, D.; Mayo, S.C.; Gureyev, T.E.; Miller, P.R.; Wilkins, S.W. Simultaneous phase and amplitude extraction from a single defocused image of a homogeneous object. J. Microsc. 2002, 206, 33–40. [Google Scholar] [CrossRef]
- Agilent CrysAlis Computer Program, Agilent Technologies, XRD Products 2012. Available online: http://www.agilent.com/chem (accessed on 11 December 2018).
- Sheldrick, G.M. Crystal structure refinement with SHELXL. Acta Crystallogr. 2015, C71, 3–8. [Google Scholar]
- O’Donoghue, M. Gems, 6th ed.; Butterworth-Heinemann: Oxford, UK, 2006. [Google Scholar]
- Gübelin, E.J.; Koivula, J.I. Photo Atlas of Inclusions in Gemstones; Opinio Publishers: Basel, Switzerland, 2005; Volume 2. [Google Scholar]
- Voltolini, M.; Marinoni, N.; Mancini, L. Synchrotron X-ray computed microtomography investigation of a mortar affected by alkali silica reaction: A quantitative characterization of its microstructural features. J. Mater. Sci. 2011, 46, 6633–6641. [Google Scholar] [CrossRef]
- MacDonald, D.J.; Hawthorne, F.C.; Grice, J.D. Foitite, a new alkali deficient tourmaline: Description and crystal structure. Am. Mineral. 1993, 78, 1299–1303. [Google Scholar]
- Brown, C.D.; Wise, M.A. Internal zonation and chemical evolution of the Black Mountain granitic pegmatite, Maine. Can. Mineral. 2001, 39, 45–55. [Google Scholar] [CrossRef]
- Anders, E.; Grevesse, N. Abundances of the elements: Meteoritic and solar. Geochim. Cosmochim. Acta 1989, 53, 197–214. [Google Scholar] [CrossRef]
- Bosi, F.; Andreozzi, G.B. A critical comment on Ertl et al. (2012): “Limitations of Fe2+ and Mn2+ site occupancy in tourmaline: Evidence from Fe2+- and Mn2+-rich tourmaline”. Am. Mineral. 2013, 98, 2183–2192. [Google Scholar] [CrossRef]
- Burns, P.C.; MacDonald, D.J.; Hawthorne, F.C. The crystal-chemistry of manganese-bearing elbaite. Can. Mineral. 1994, 32, 31–41. [Google Scholar]
- Čopjaková, R.; Škoda, R.; Vašinová Galiová, M.; Novák, M. Distributions of Y + REE and Sc in tourmaline and their implications for the melt evolution; examples from NYF pegmatites of the Třebíč Pluton, Moldanubian Zone, Czech Republic. J. Geosci. 2013, 58, 113–131. [Google Scholar] [CrossRef]
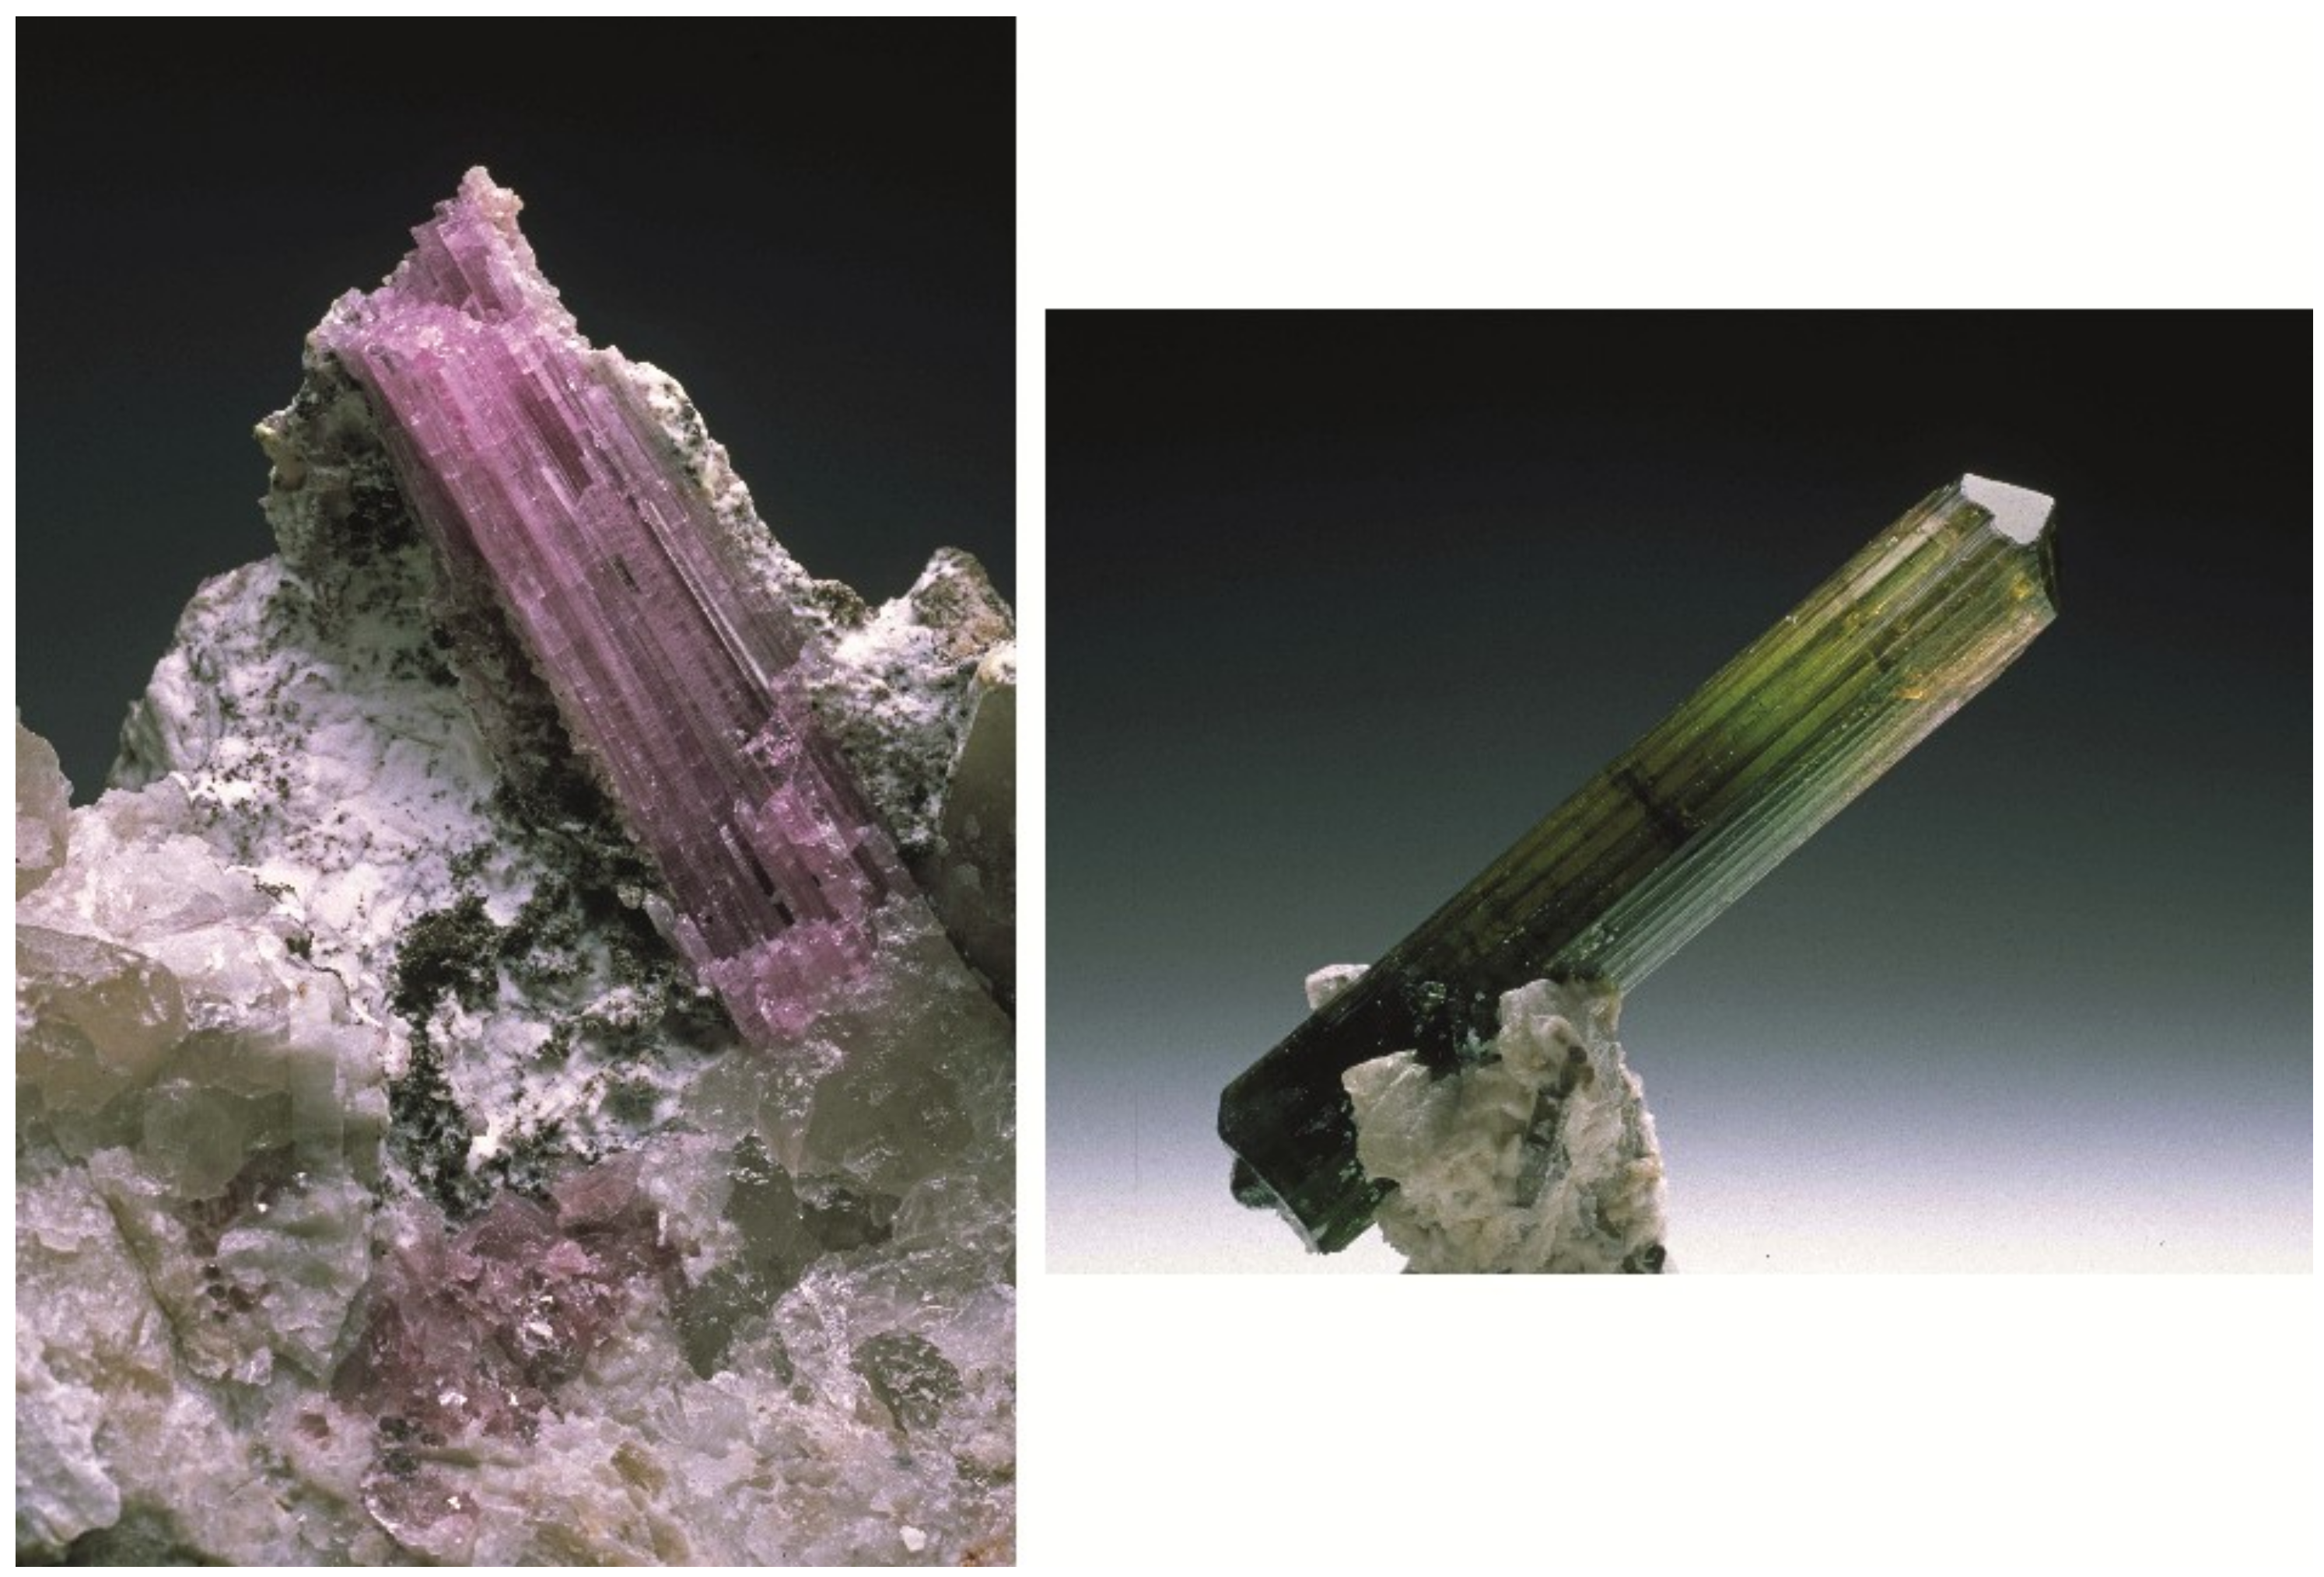
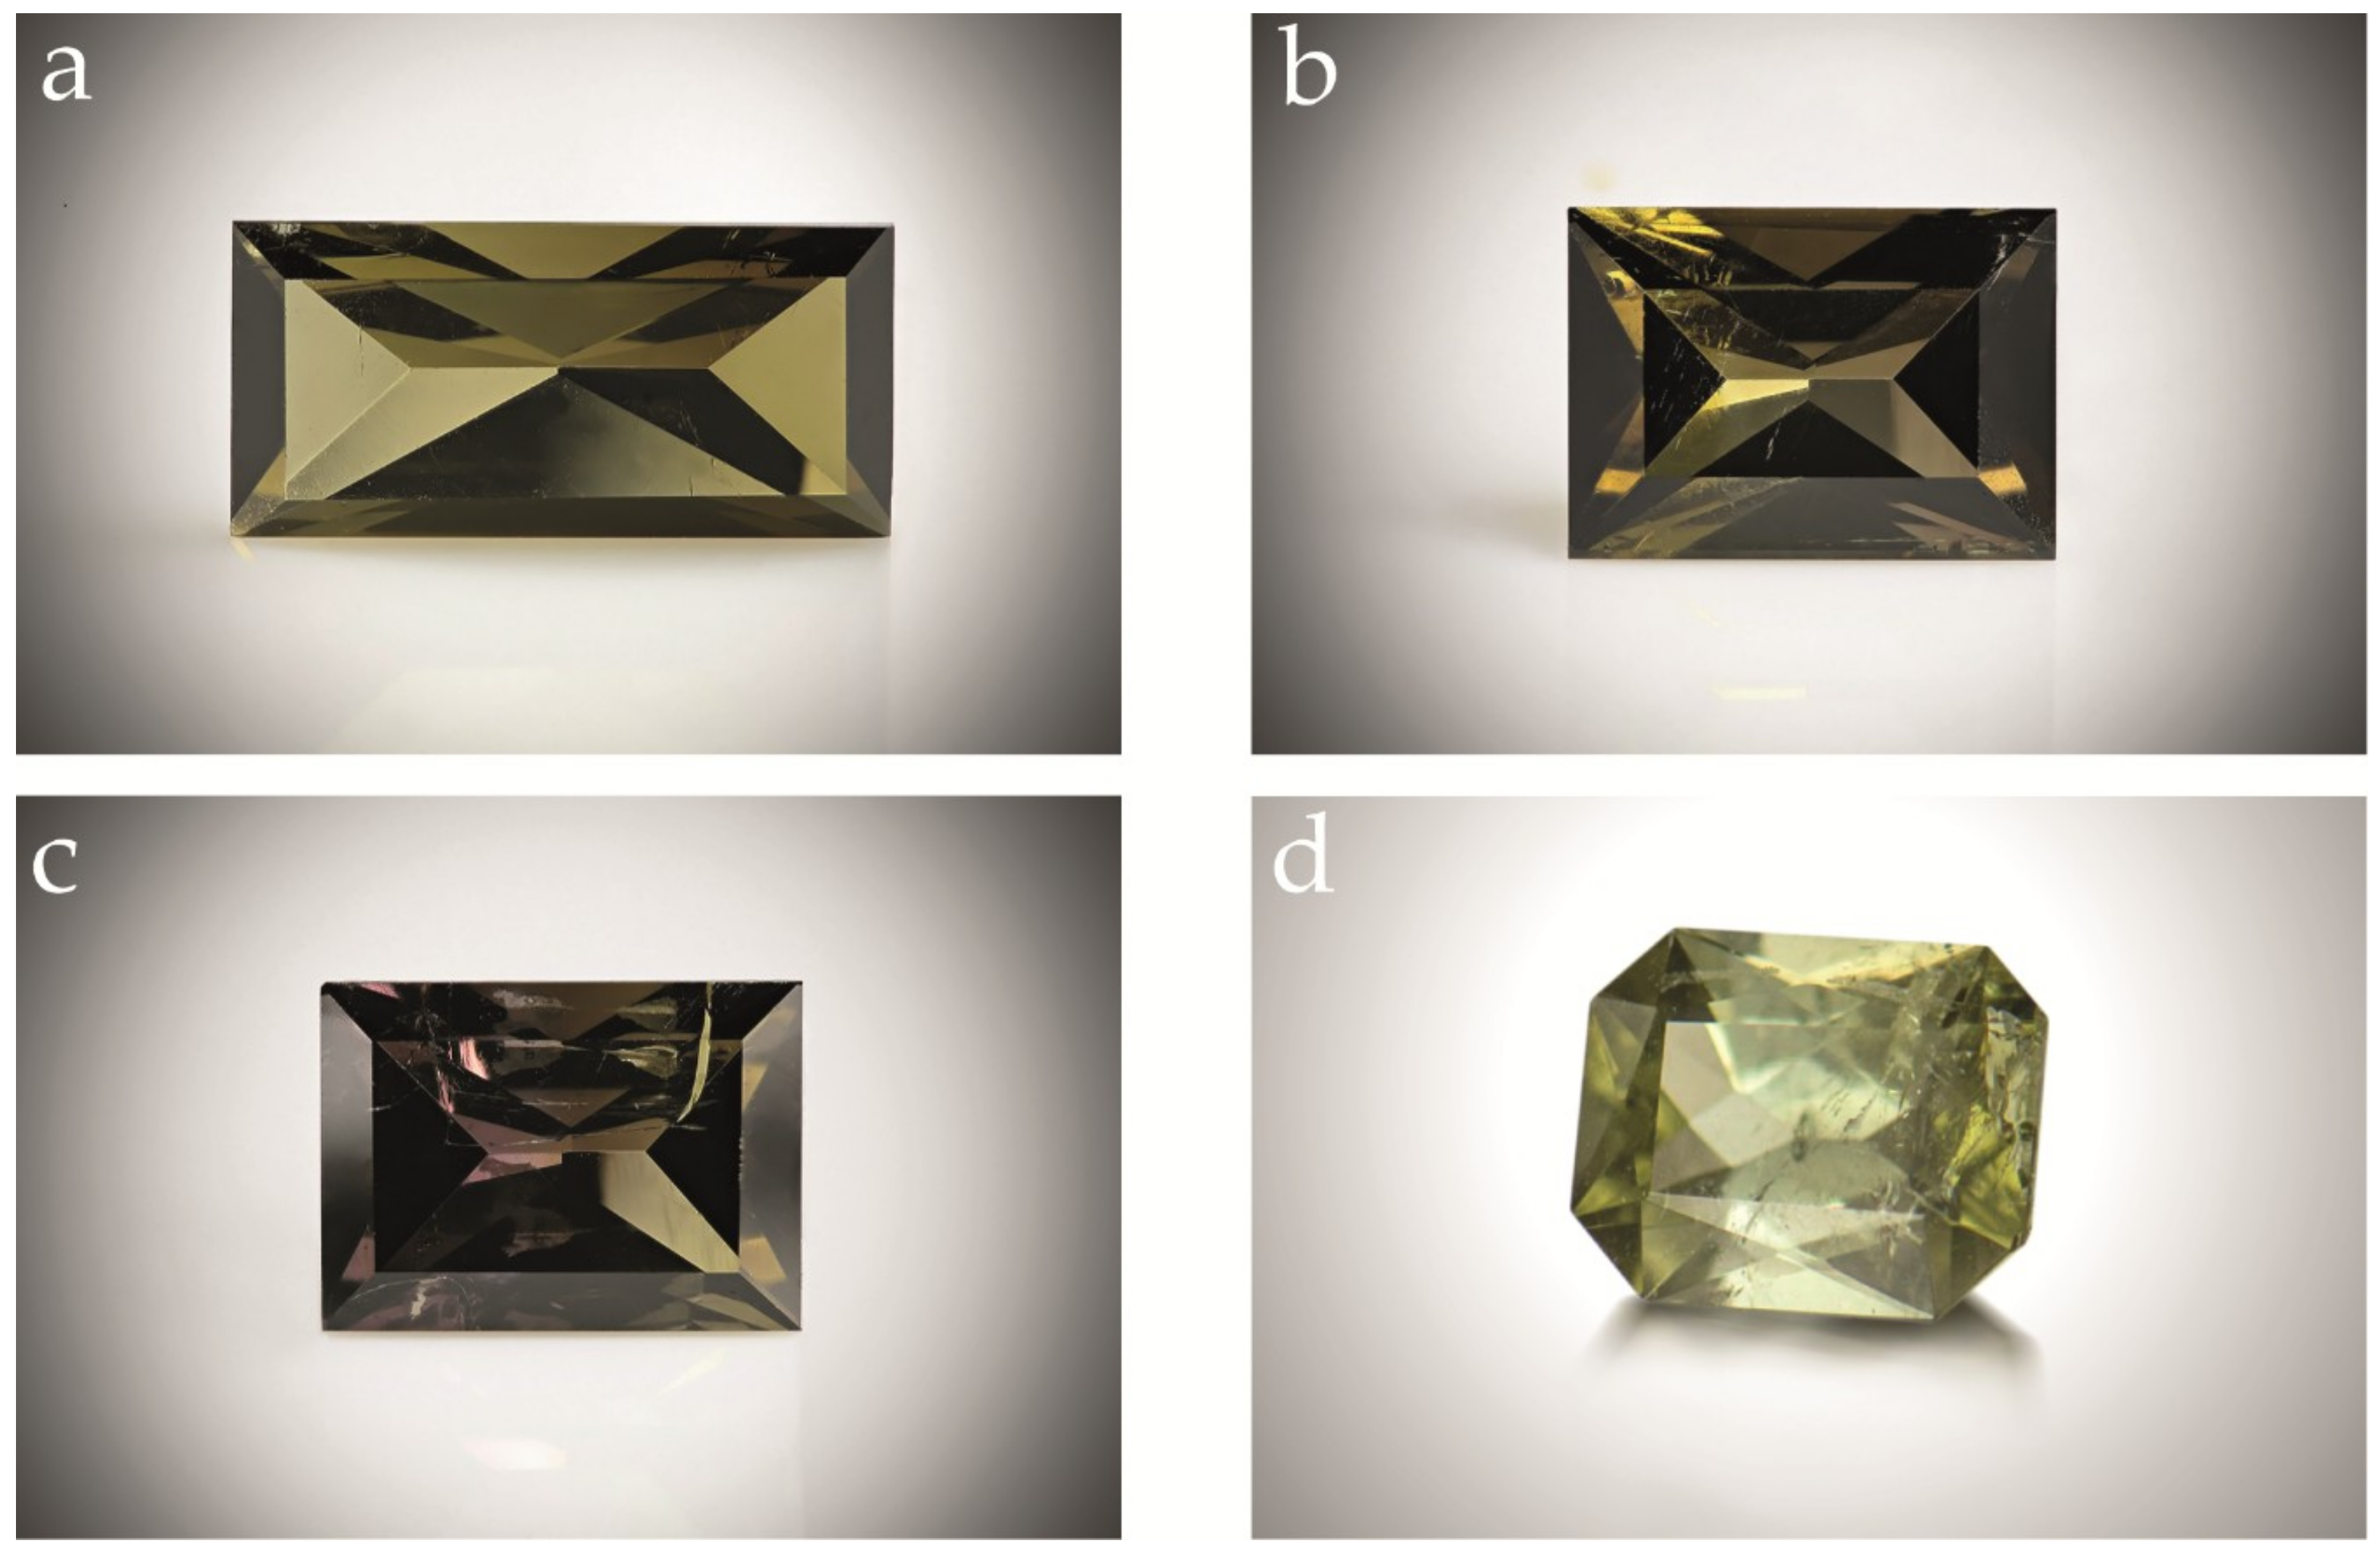
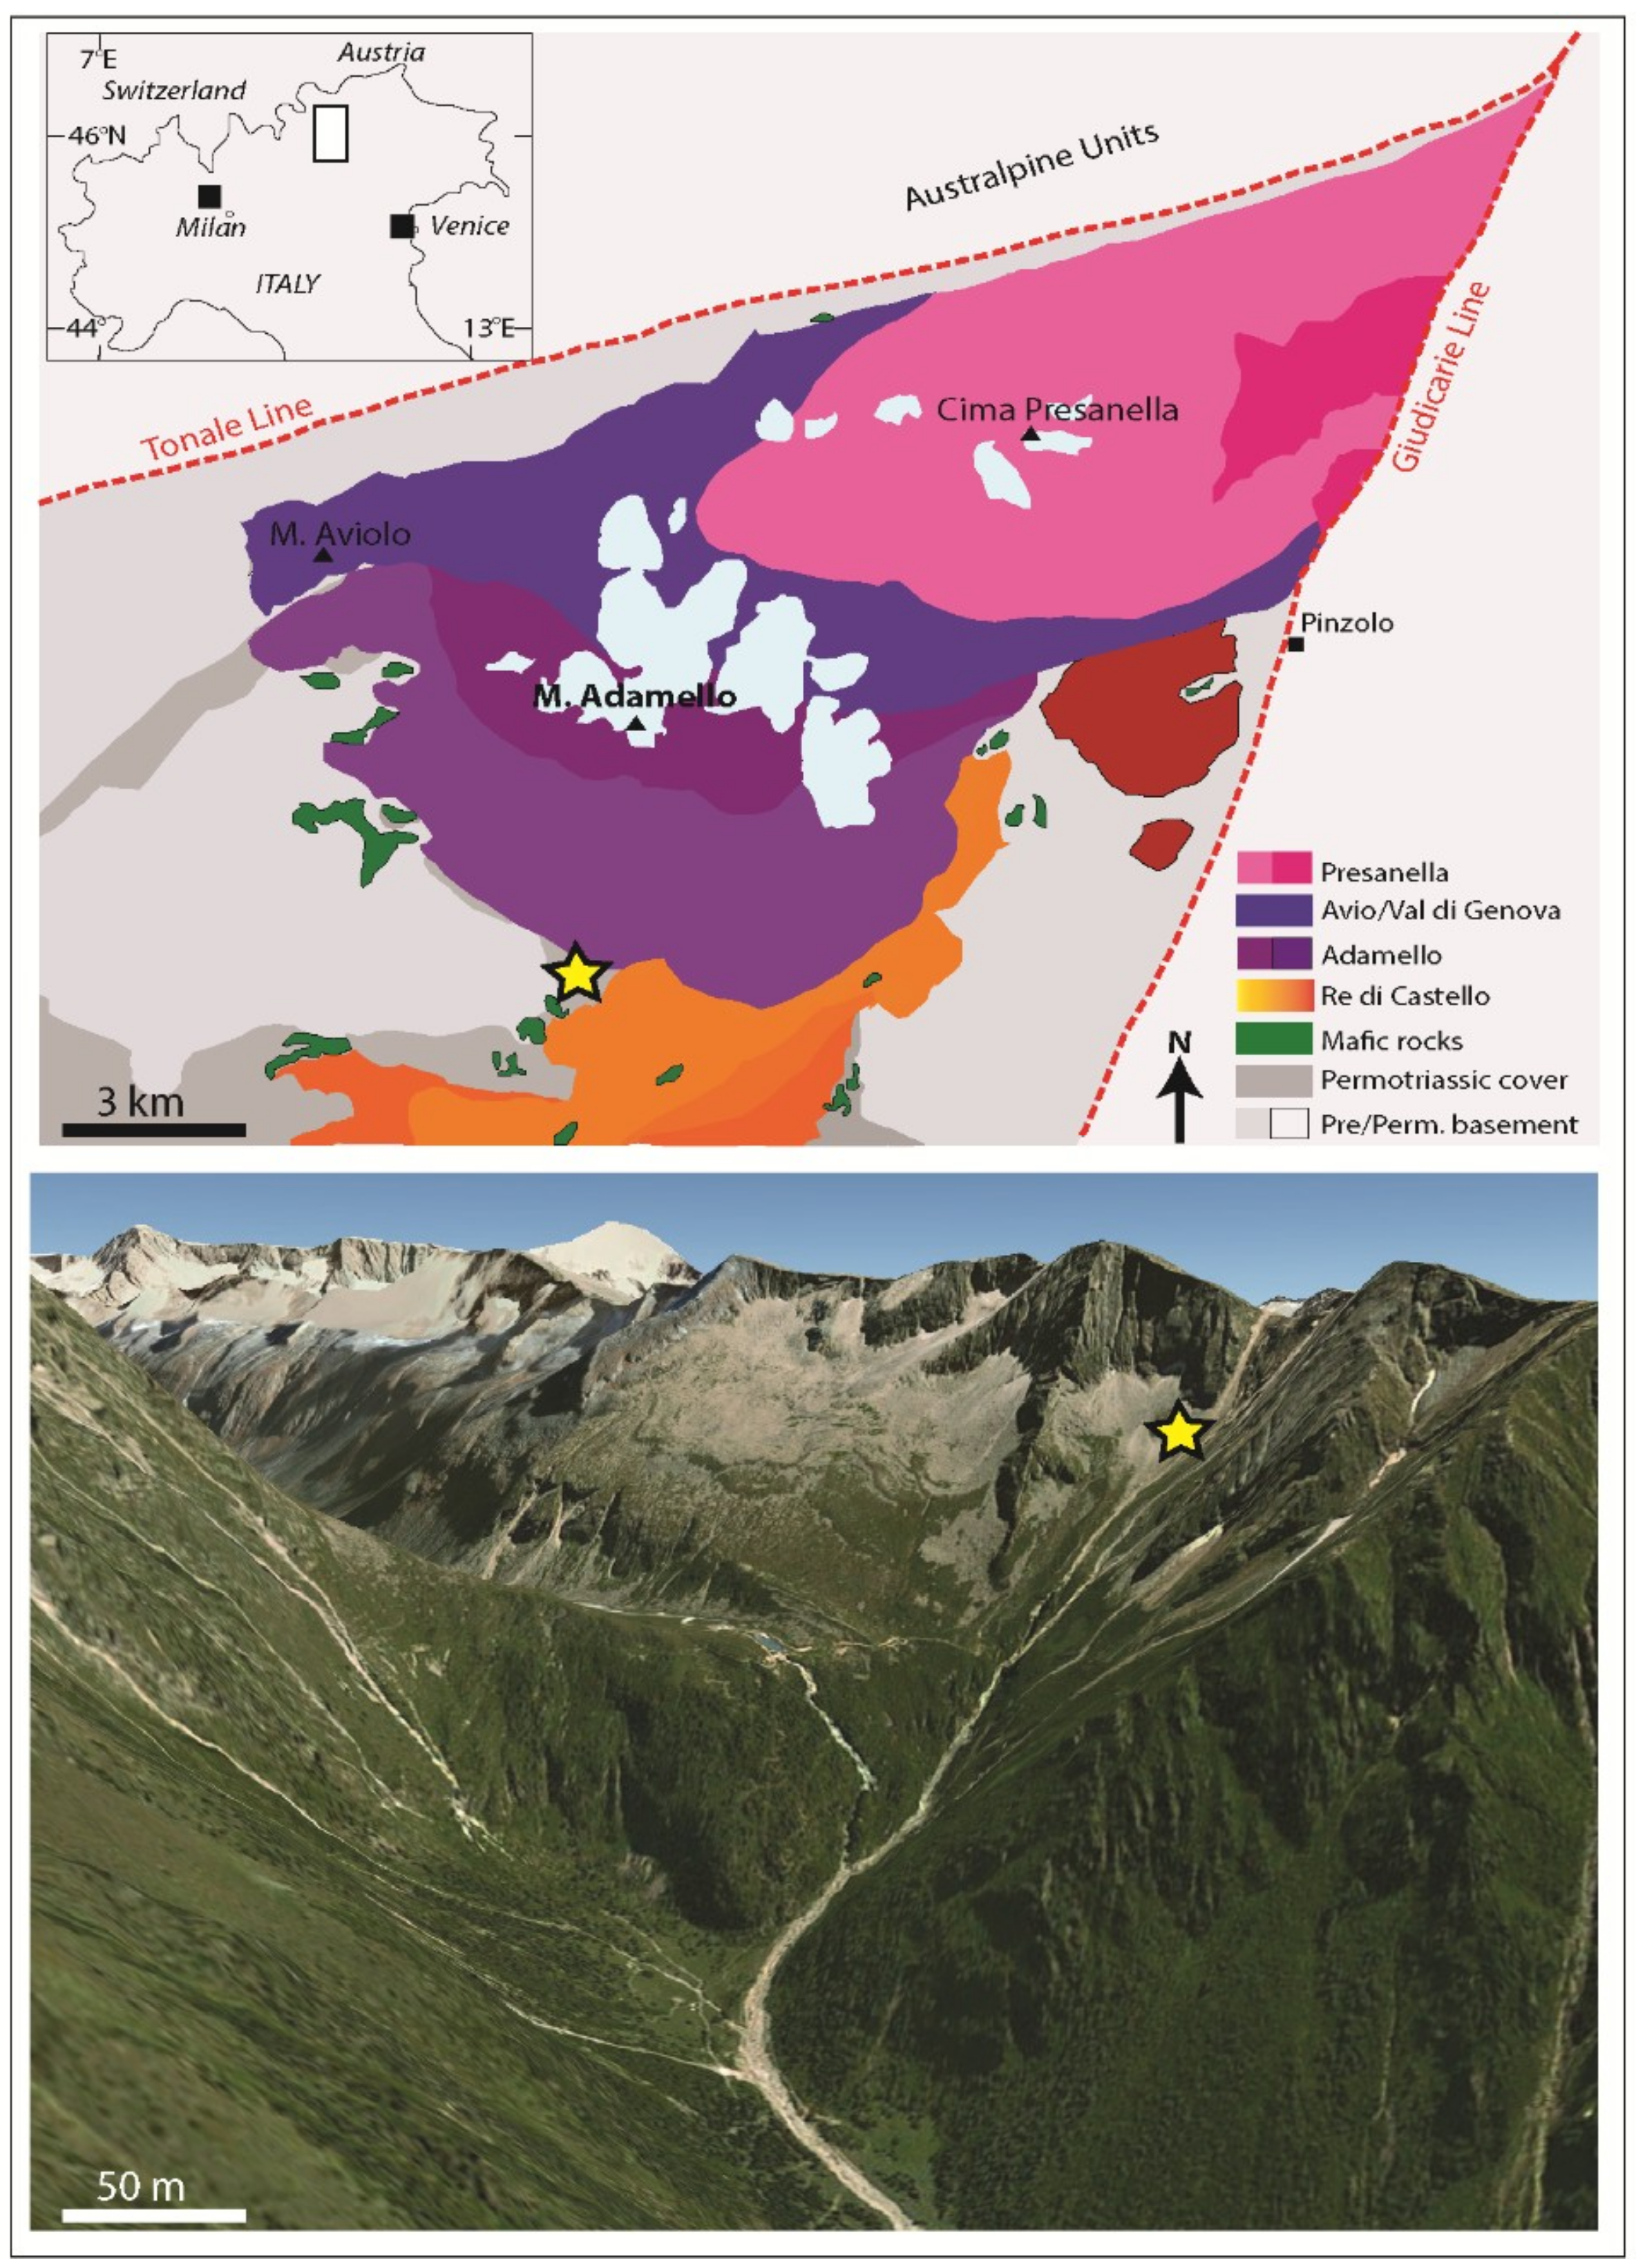
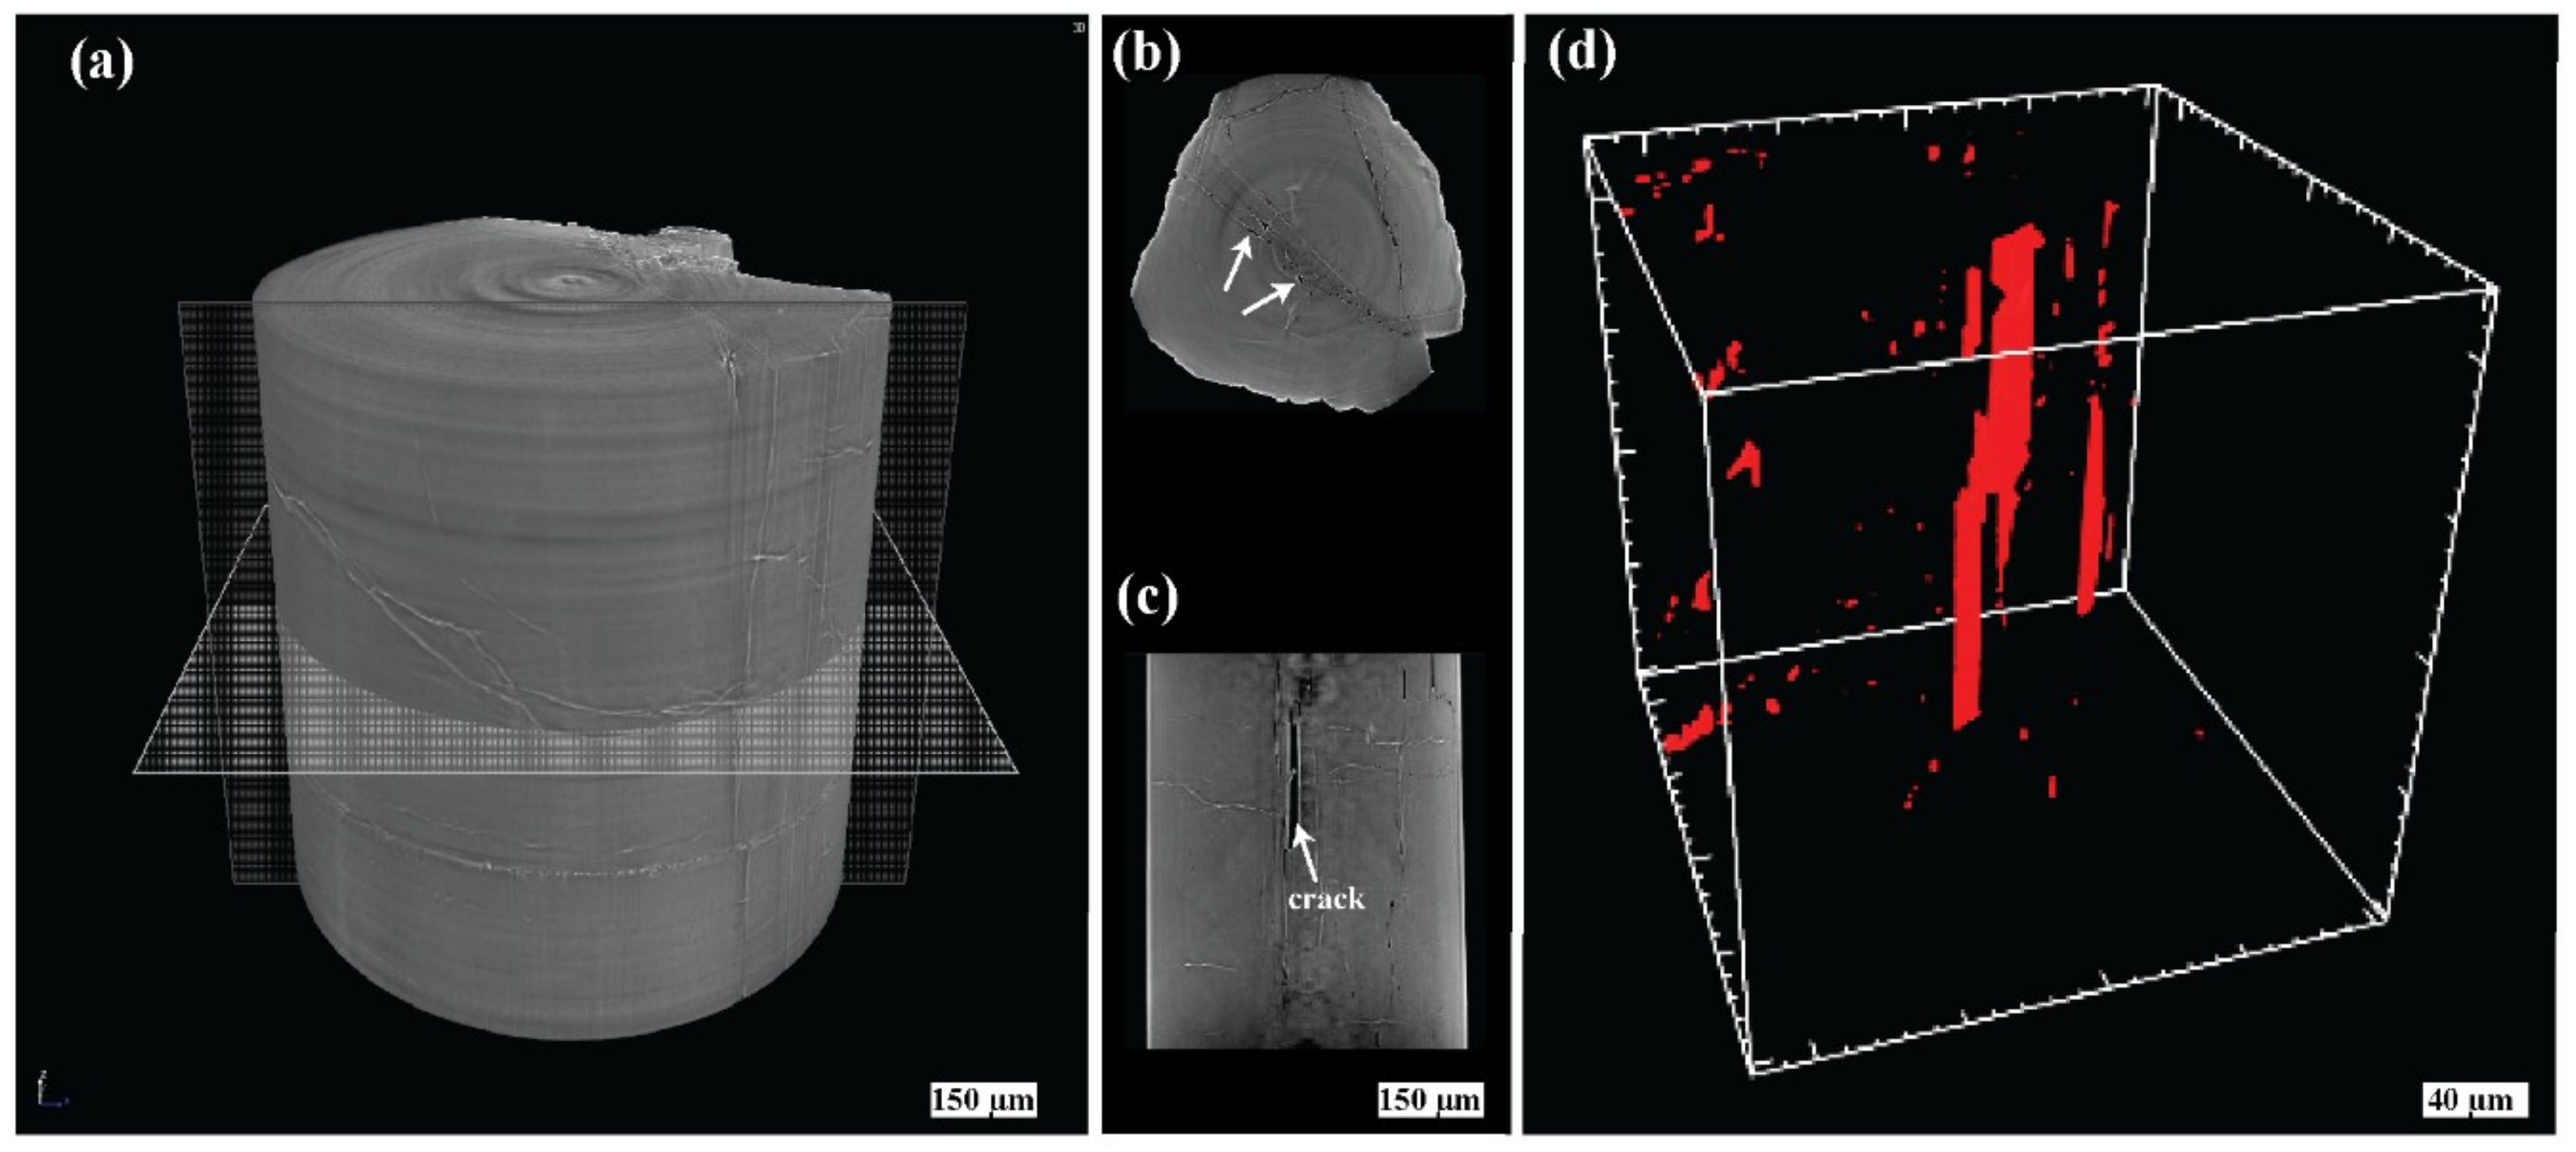
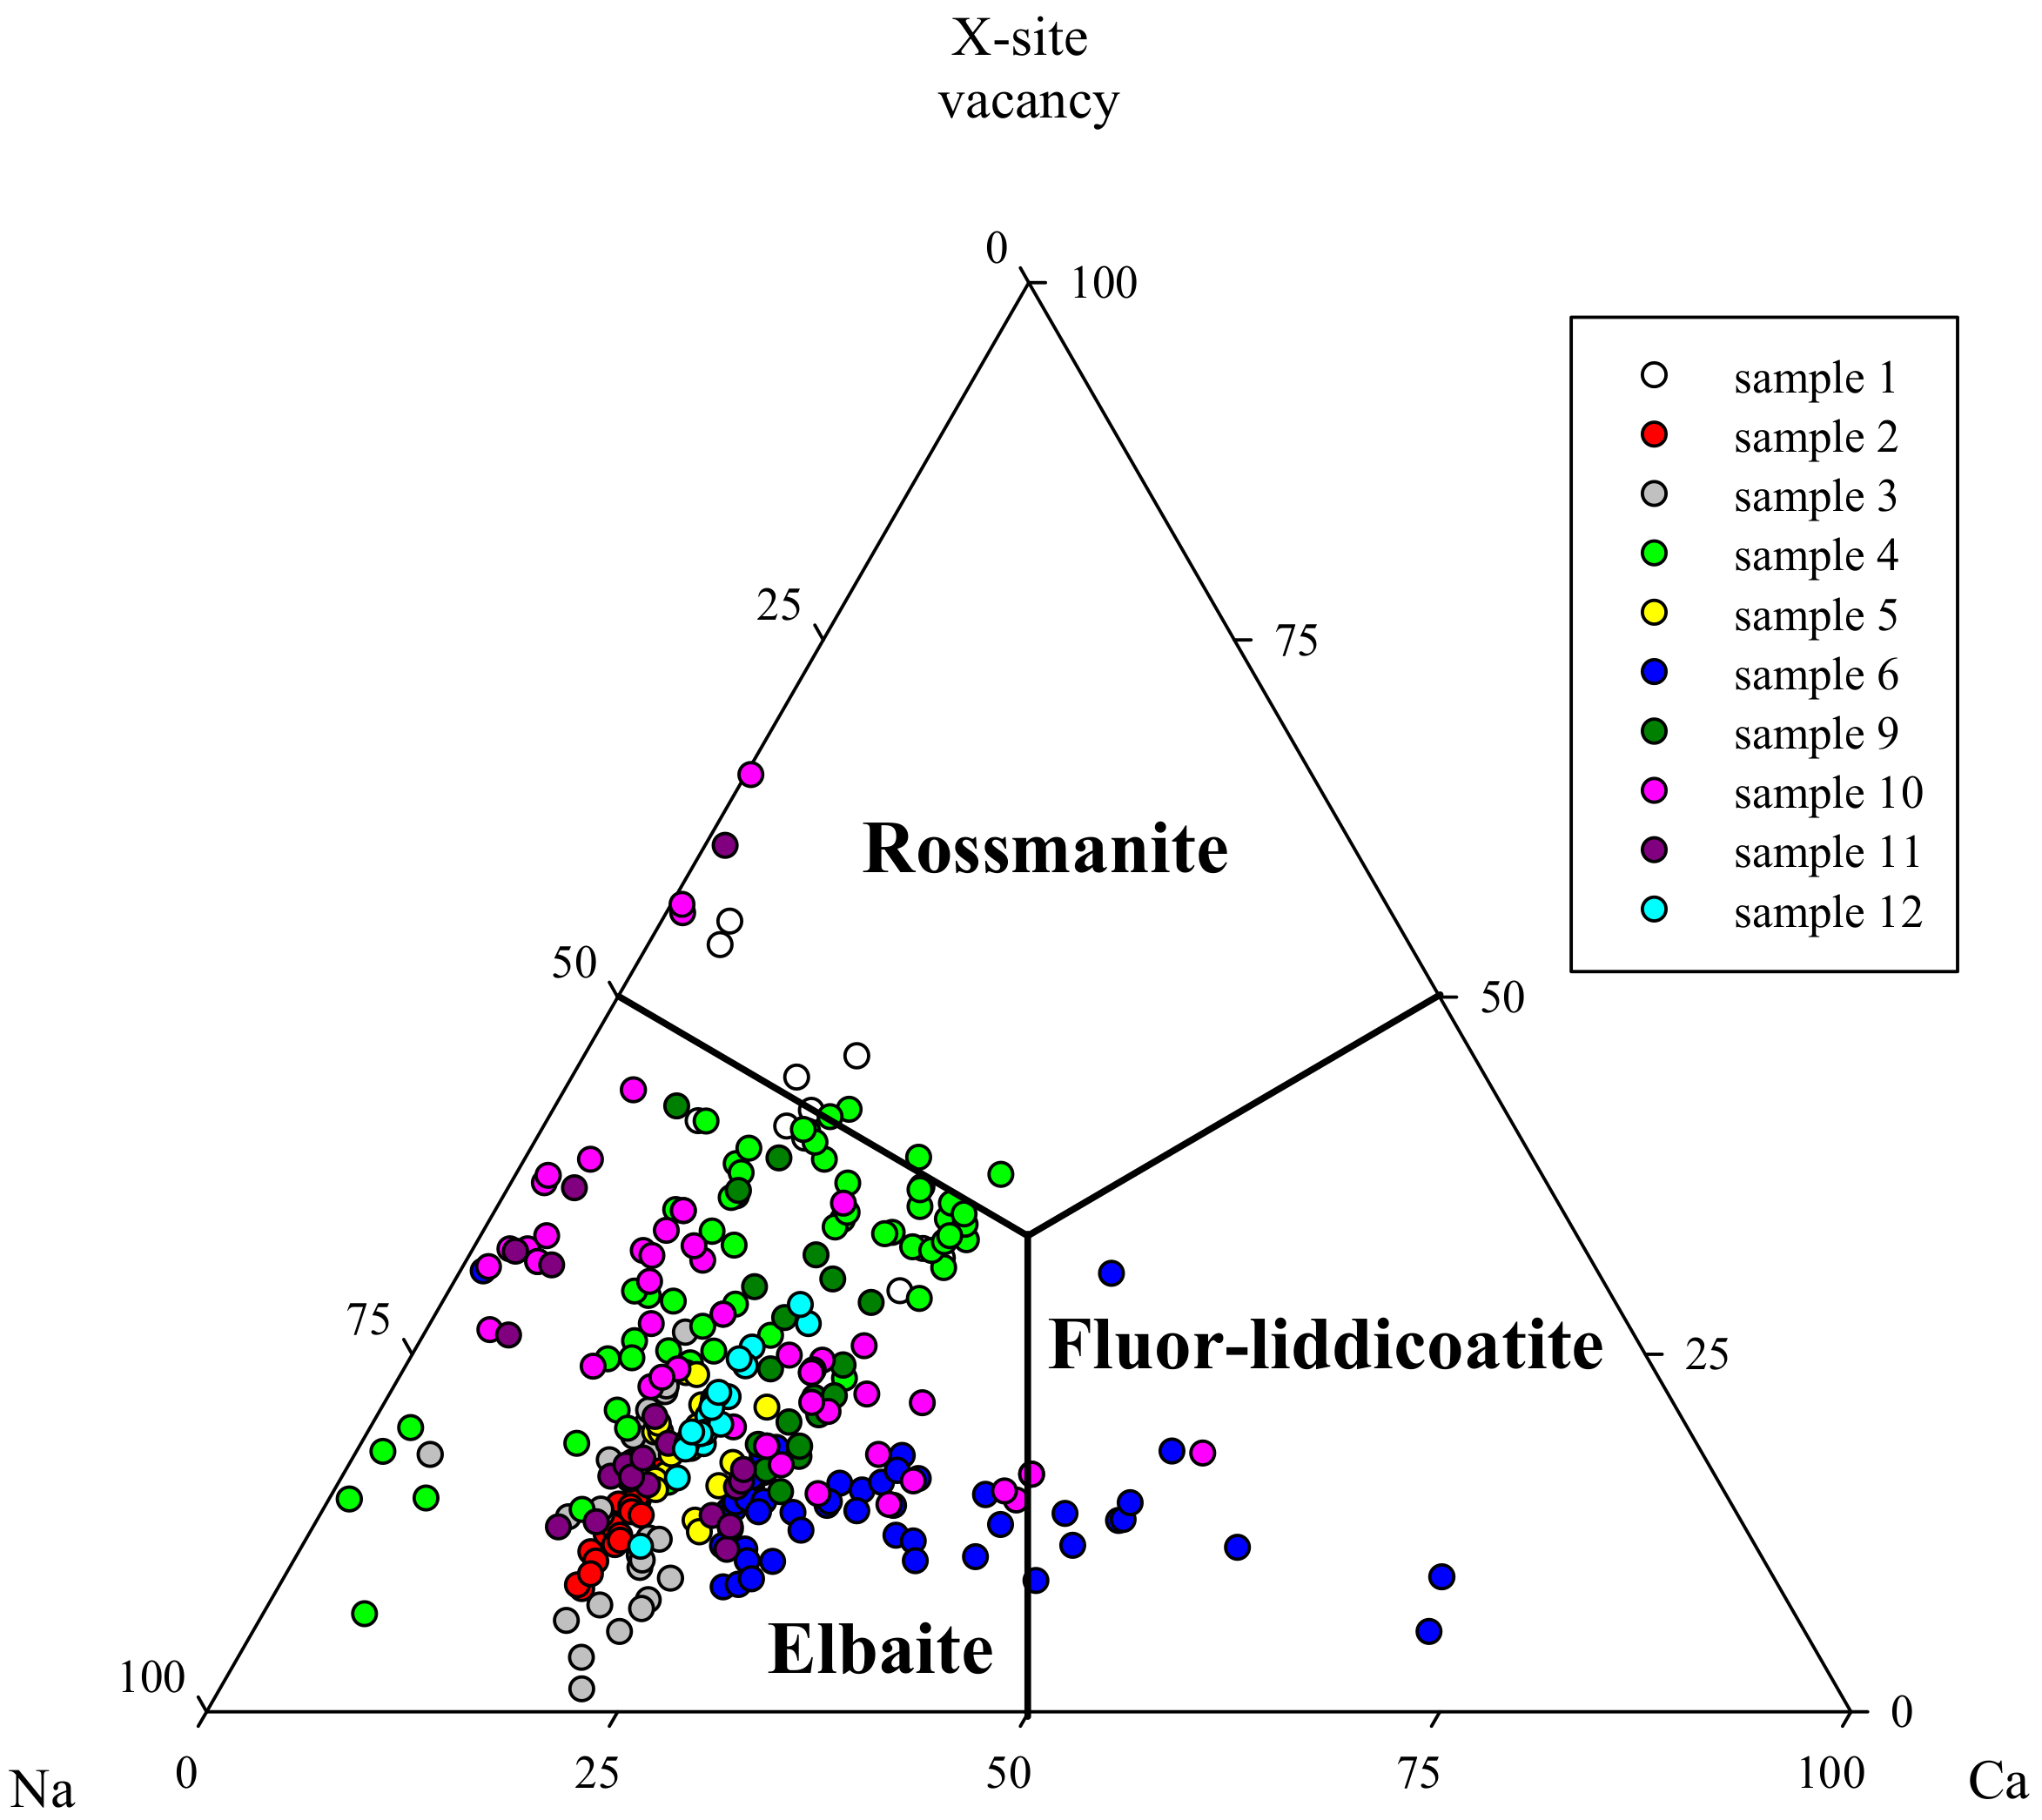
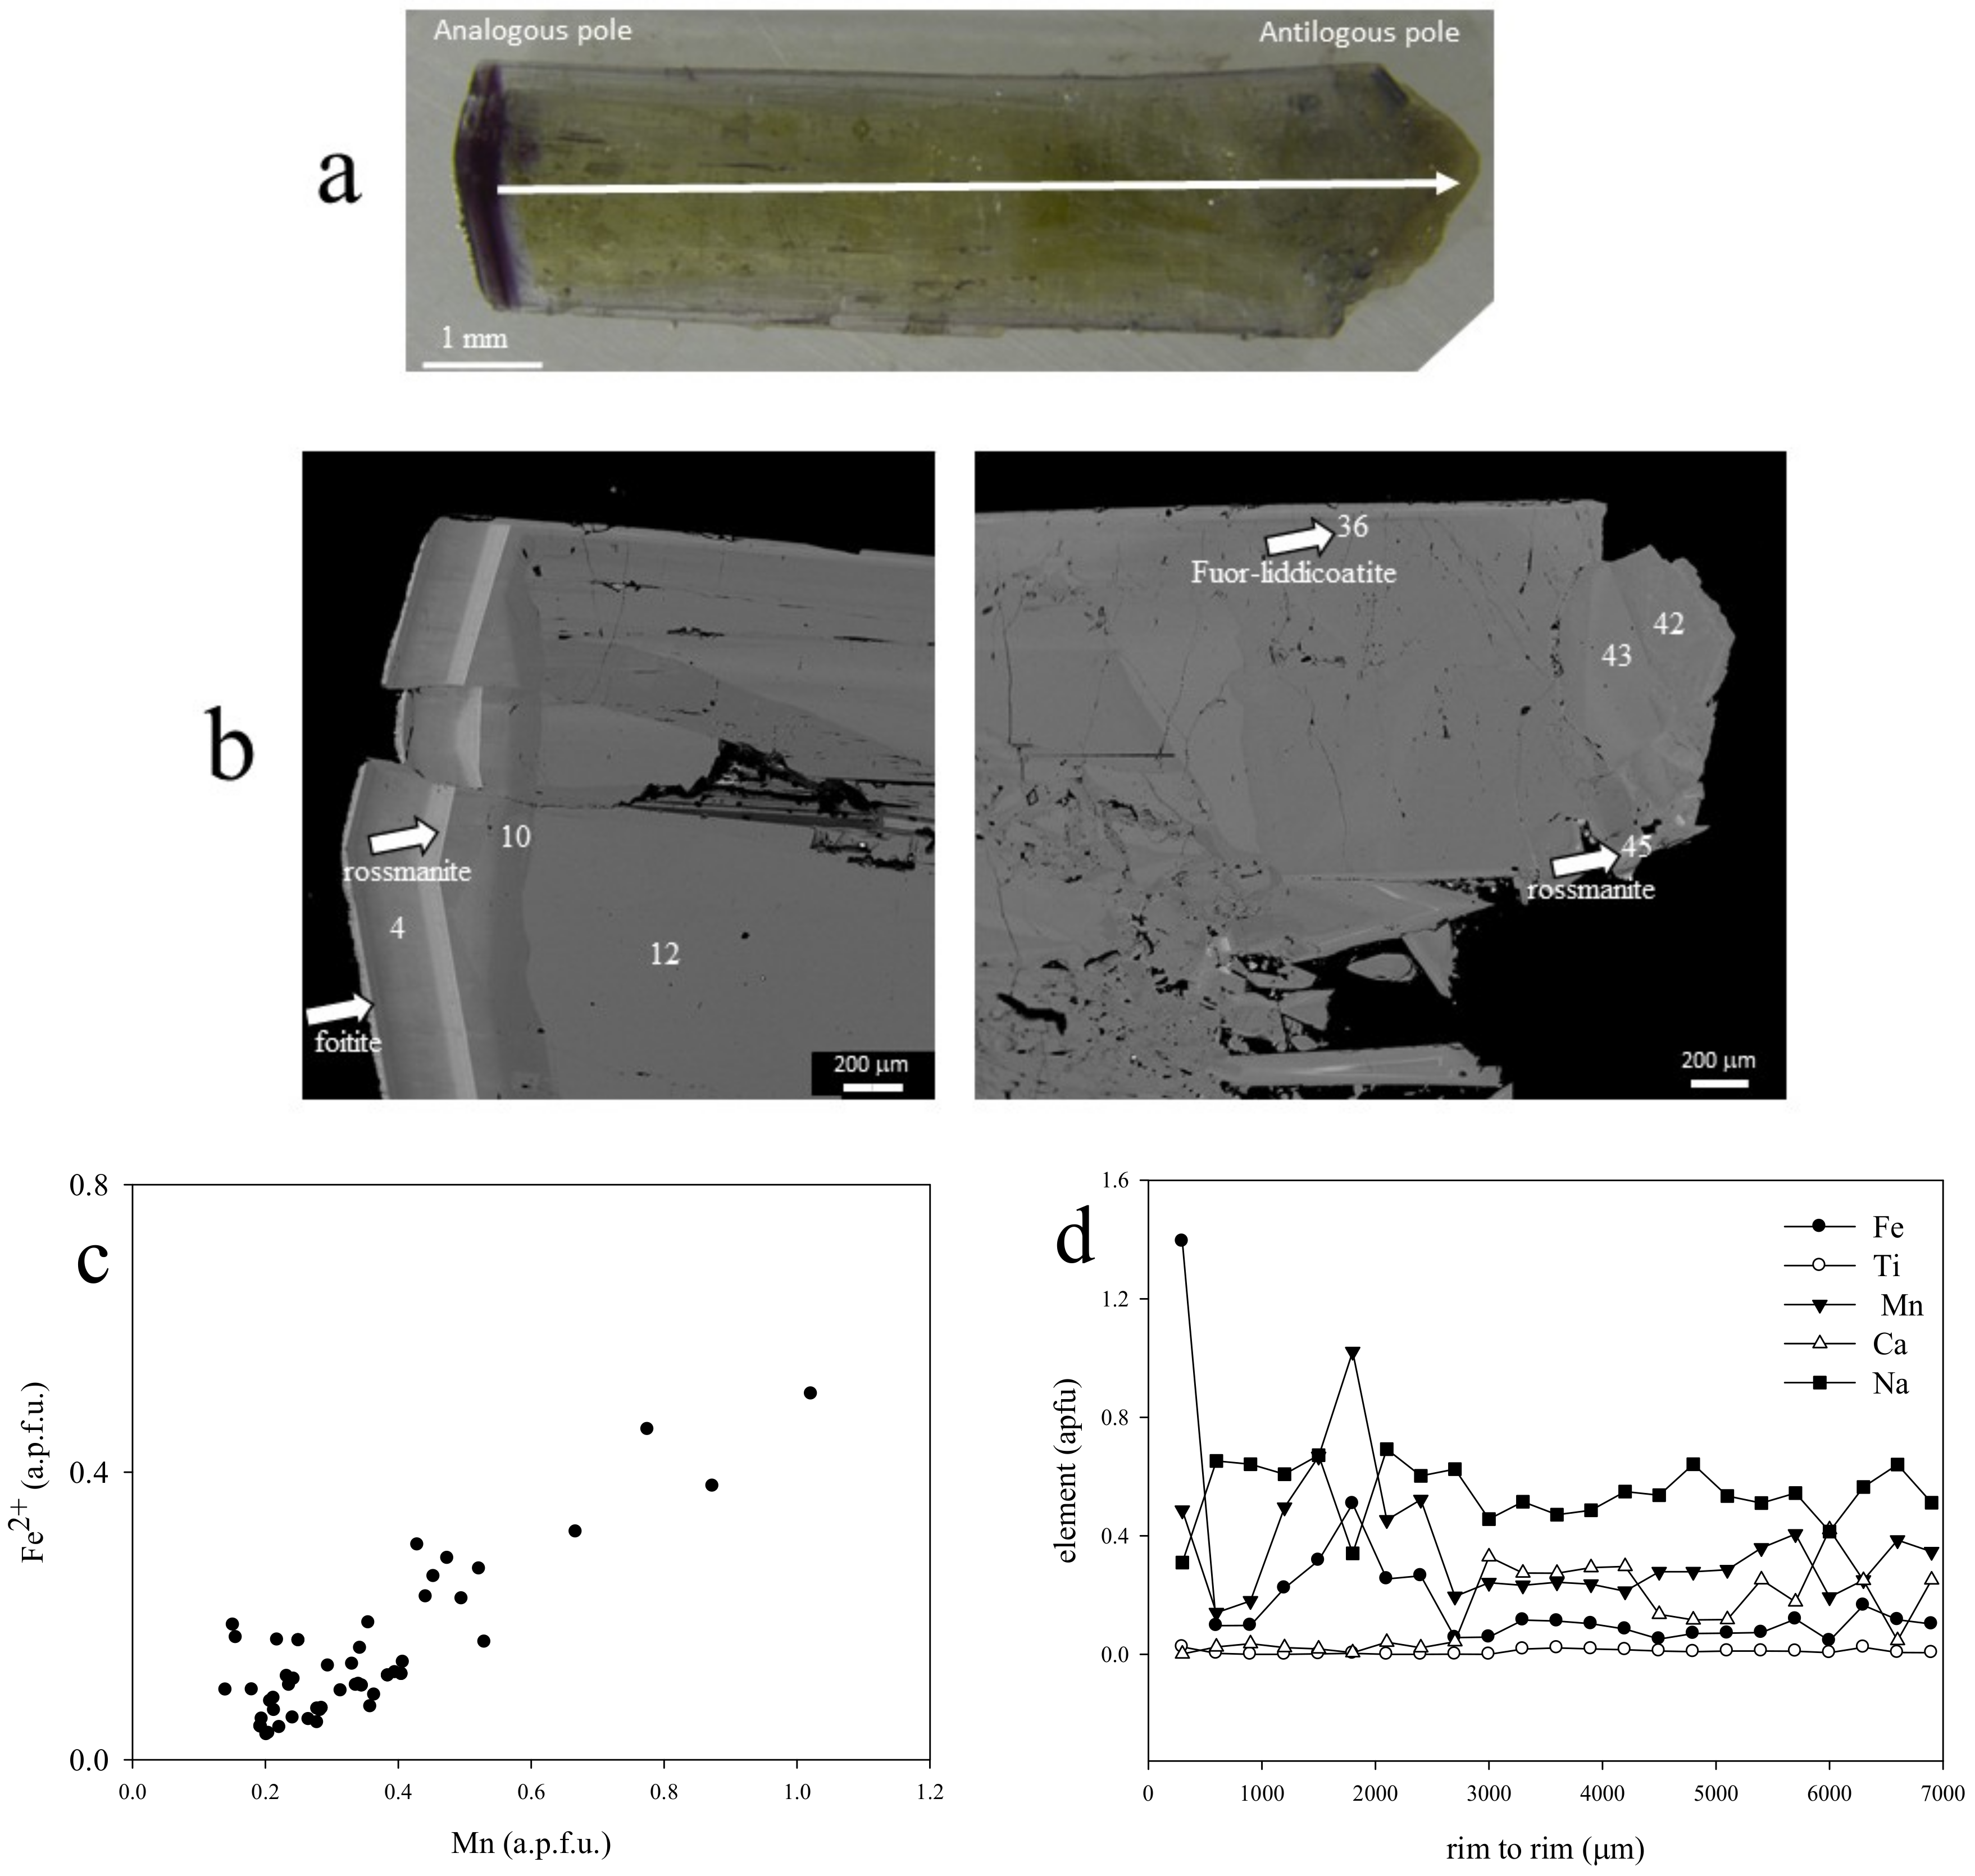
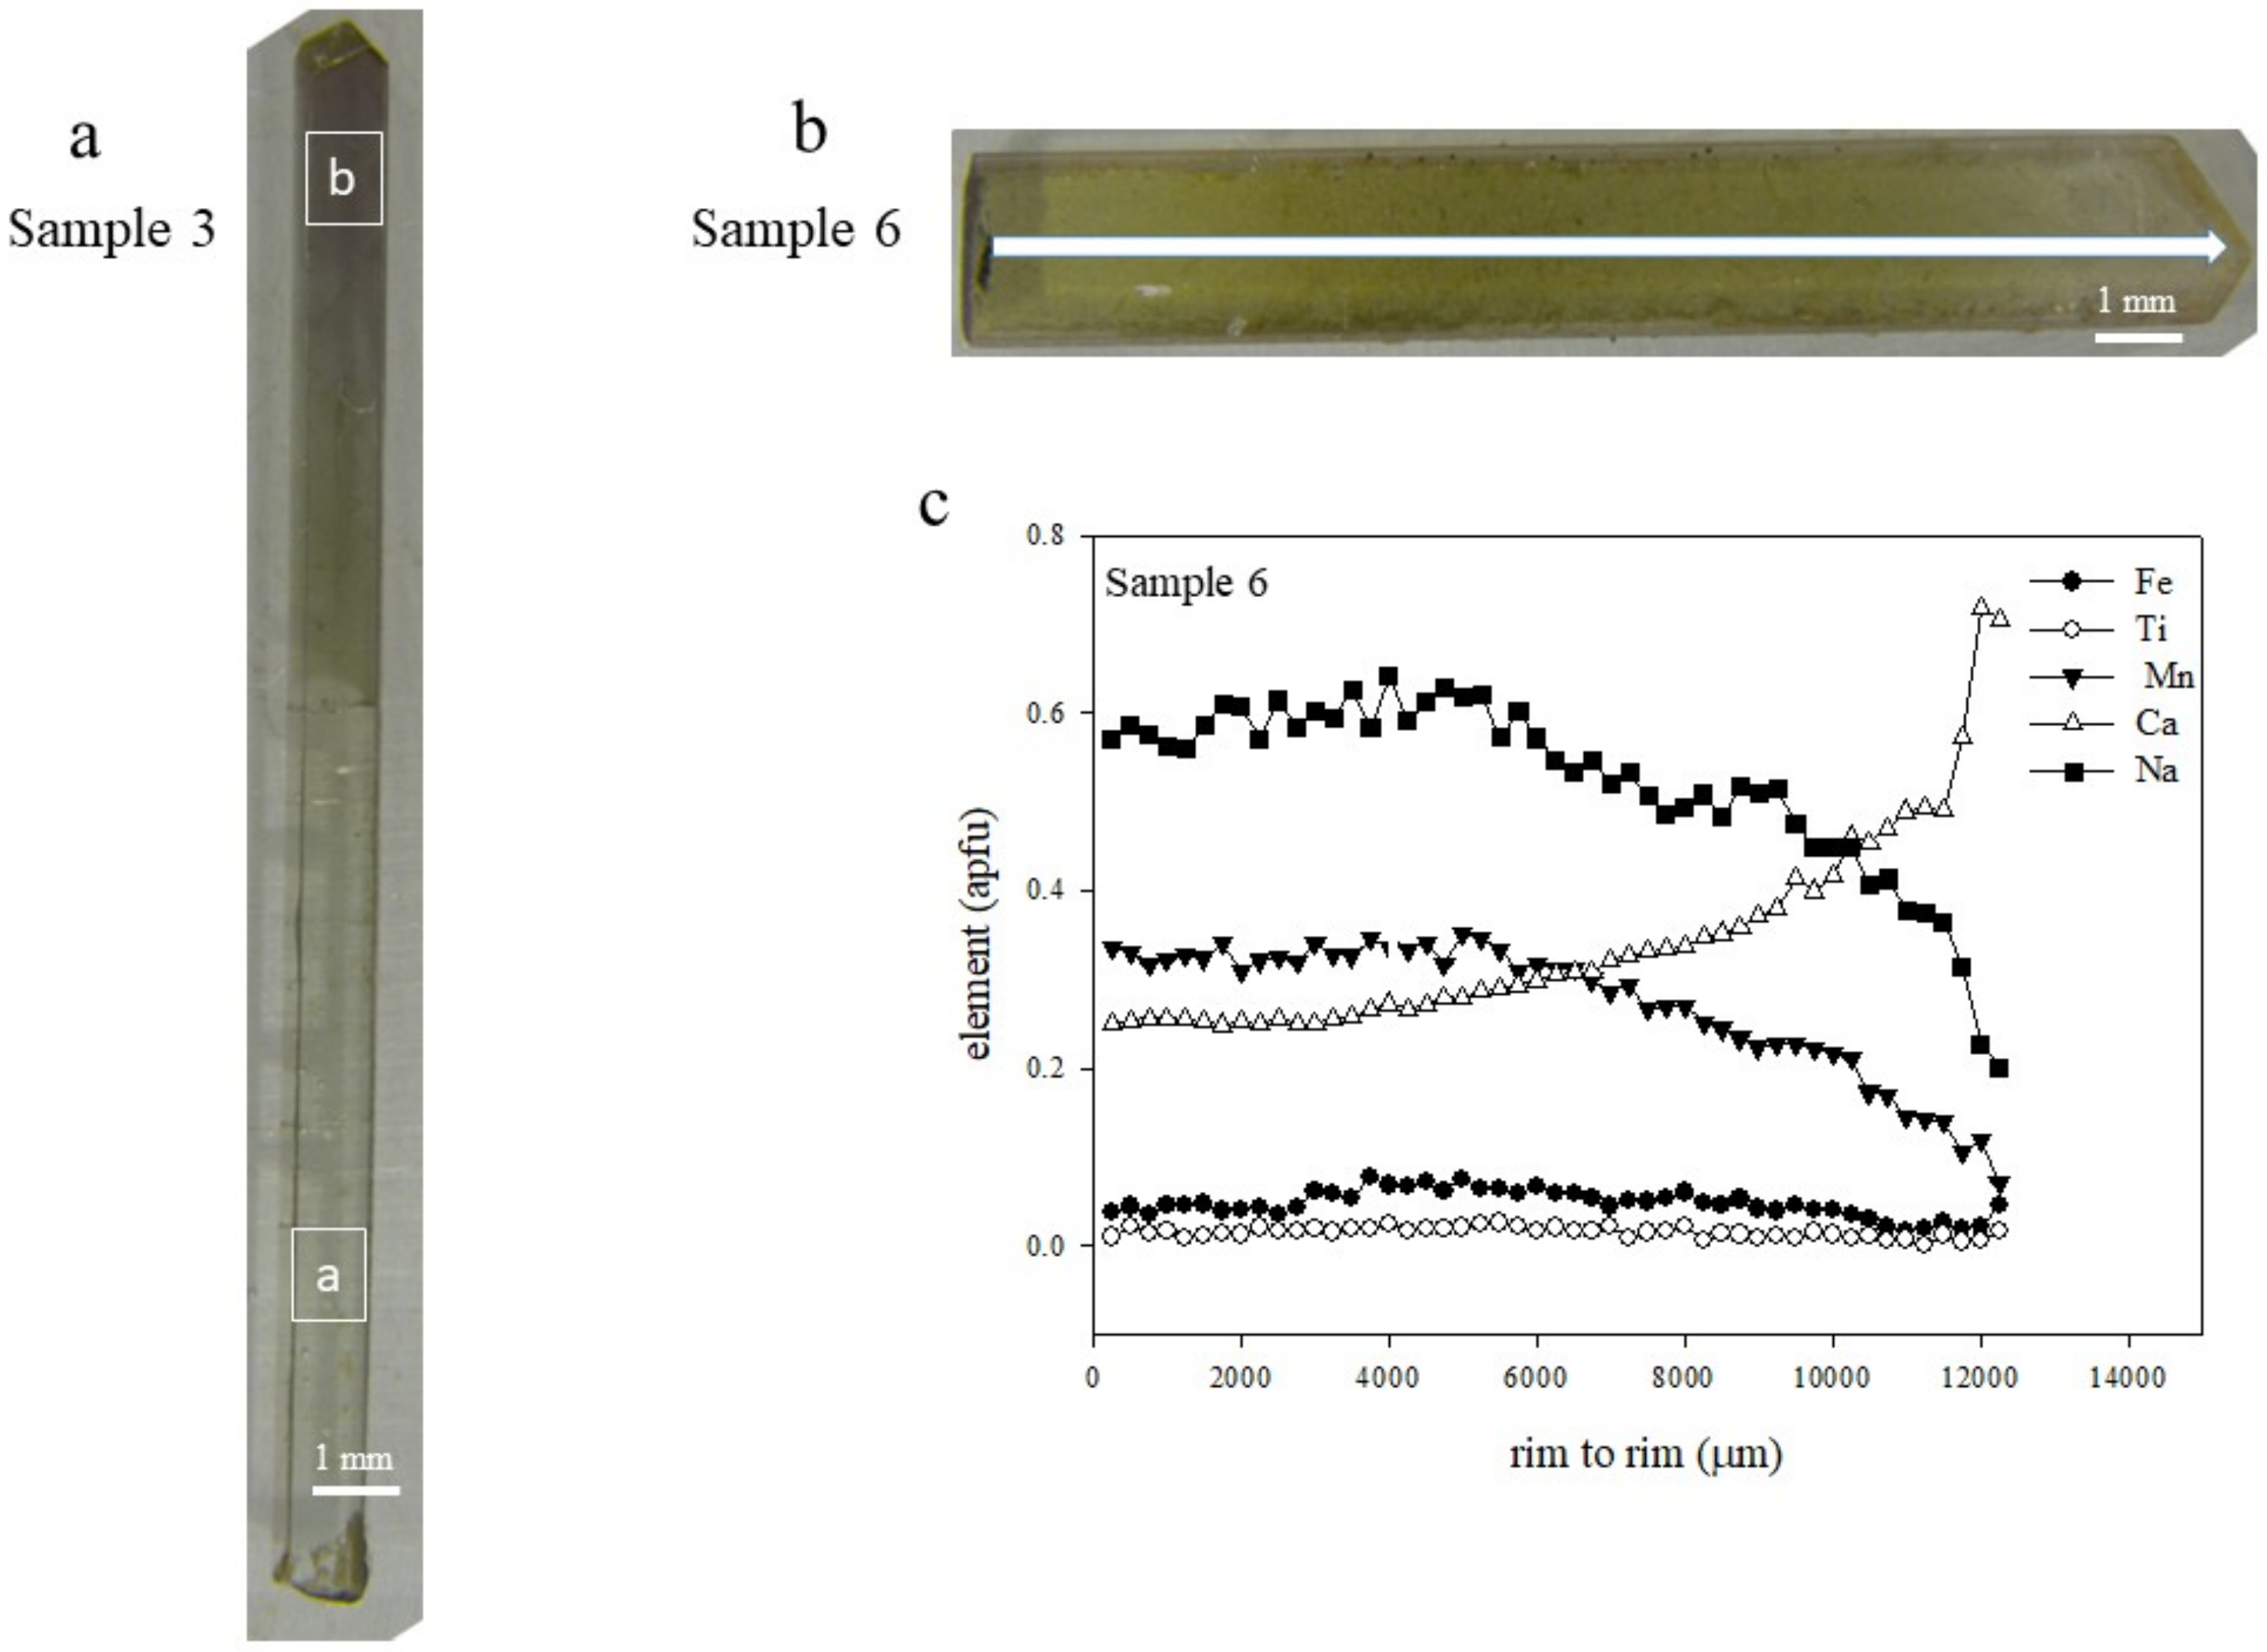
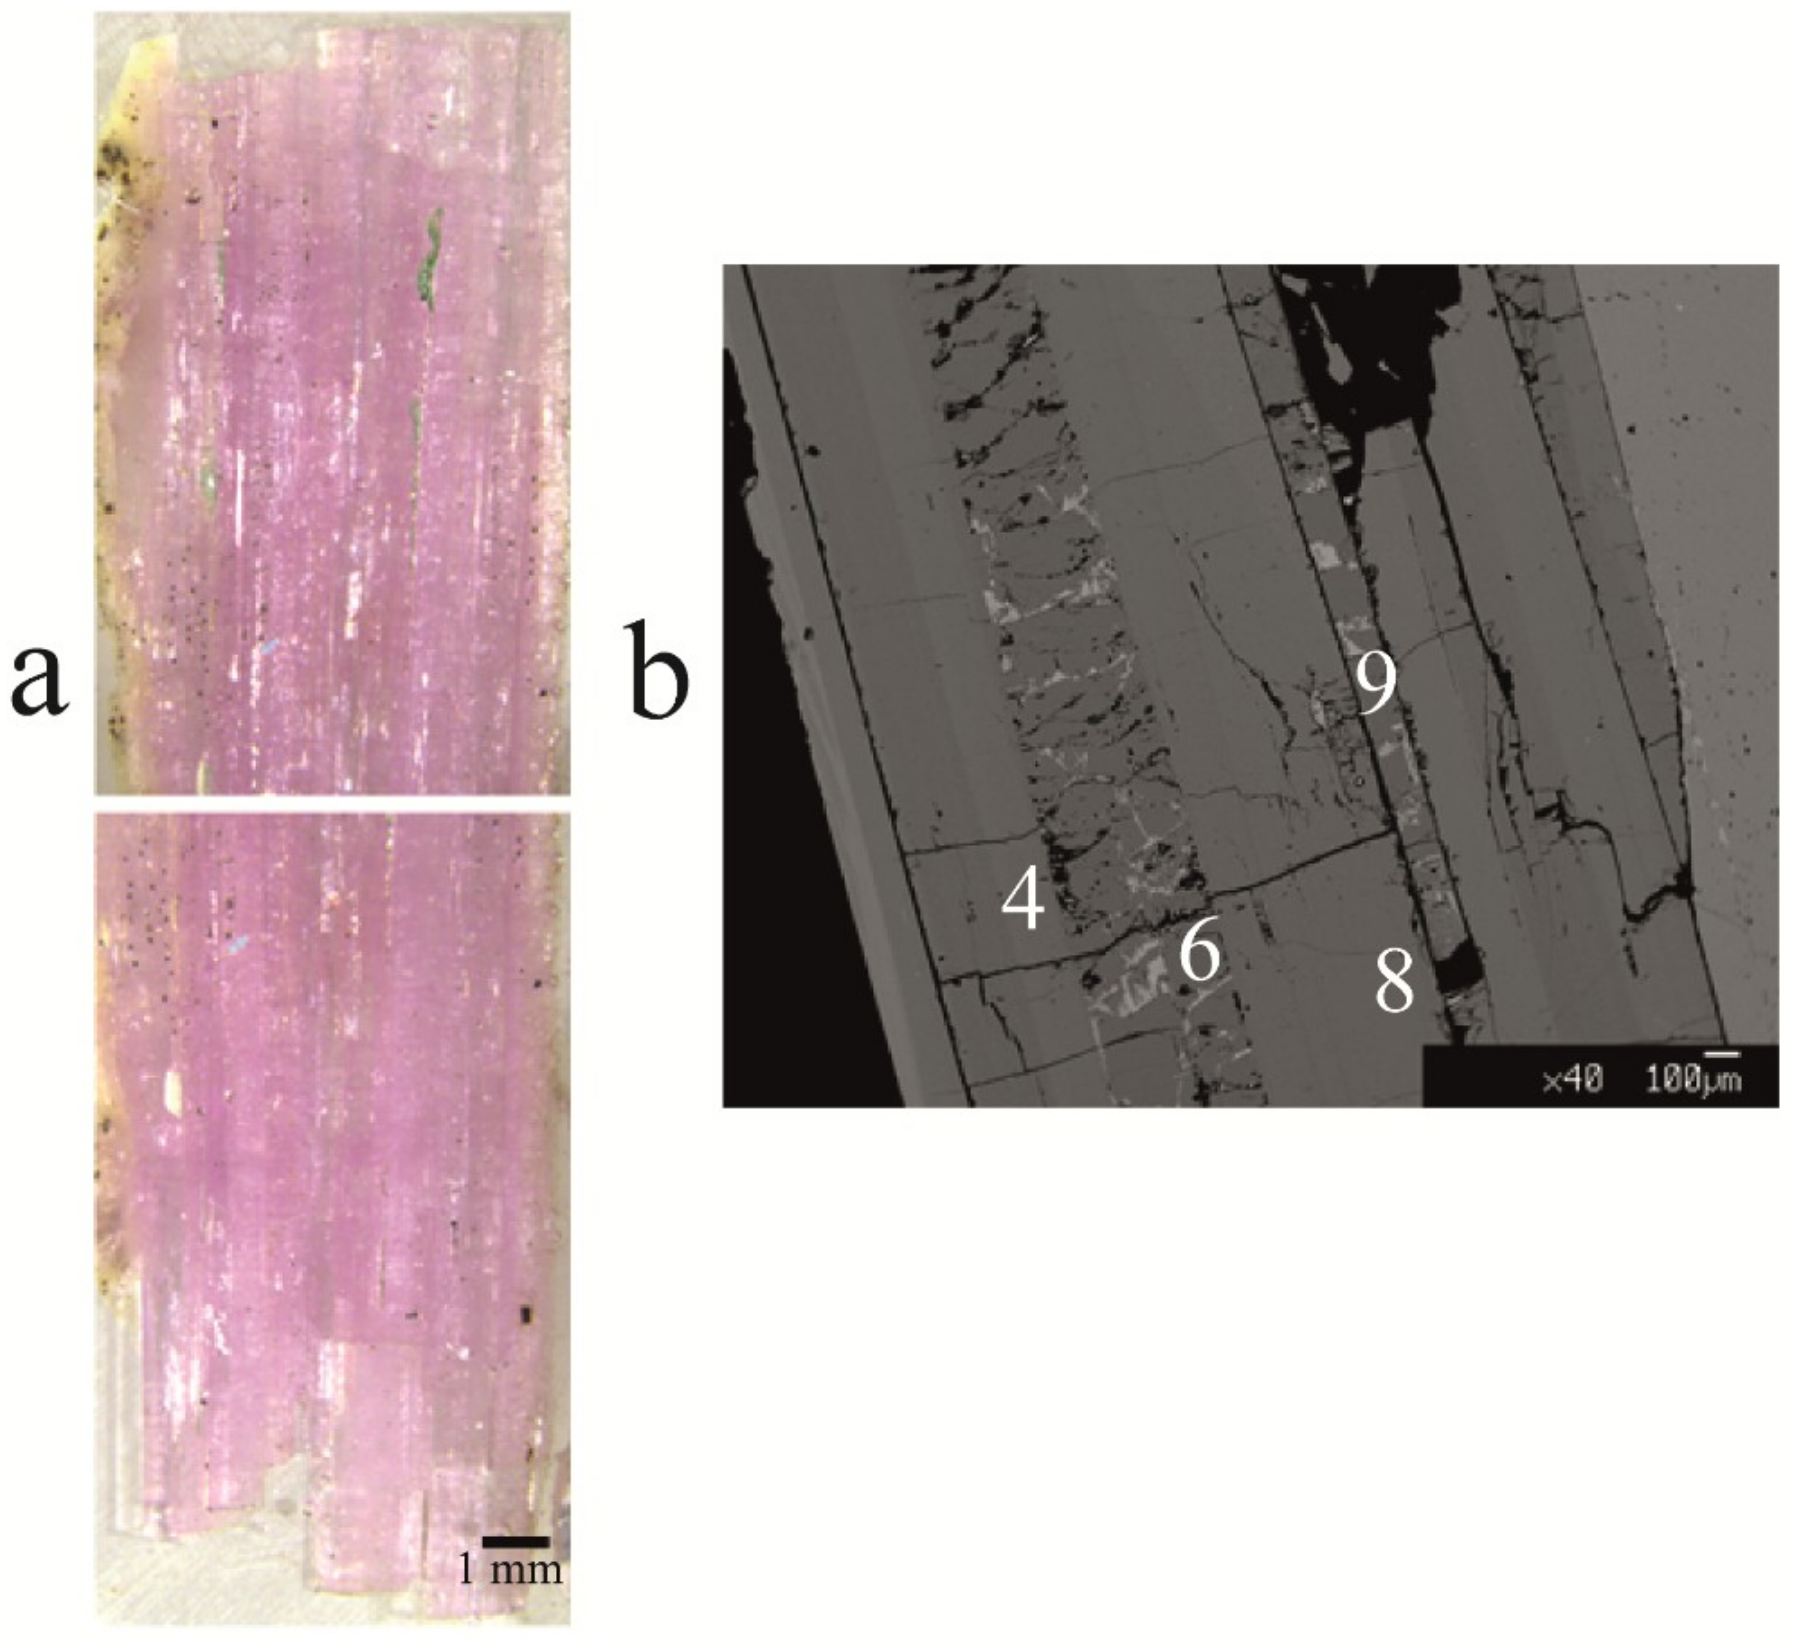

| Sample | Cavity Name/Description * | Colour | Analytical Techniques | |
|---|---|---|---|---|
| 1 | Cavity 1 | Pink | Electron microprobe (WDS) (°) | Single crystal XRD (°) |
| 2 | Cavity boulder 2 | Light blue | Electron microprobe (WDS) (°) | Single crystal XRD (°) |
| 3 | Pizio cavity | Colourless to brown | Electron microprobe (WDS) (°) | |
| 4: sample cut perpendicular to the c-axis | Pizio cavity | Pink green | Electron microprobe (WDS) (°) | |
| 5 | Cavity 3 | Light green yellow | Electron microprobe (WDS) (°) | |
| 6 | Cavity 4 | Yellow to colourless | Electron microprobe (WDS) (°) | |
| 7 | Cavity 5 | Synchrotron X-ray computed μ-tomography | ||
| 8 | Cavity 6 | Synchrotron X-ray computed μ-tomography | ||
| 9 | “Black quartz” cavity | Pink green | Electron microprobe (WDS) (°) | |
| 10: double terminated sample | Inv.# M36742 cavity | Browm green | Electron microprobe (WDS) (°) | |
| 11: homologous terminated sample | Inv.# M36742 cavity | Green to colourless | Electron microprobe (WDS) (°) | |
| 12: sample cut perpendicular to the c-axis | Inv.# M36742 cavity | Blue | Electron microprobe (WDS) (°) | Single crystal XRD (°) |
| 13 | Cut stone (0.731 ct) from pocket | Green brown | Specific gravity | Refractive index |
| 14 | Cut stone (0.848 ct) from pocket | Green brown | Specific gravity | Refractive index |
| 15 | Cut stone (0.838 ct) from pocket | Green brown | Specific gravity | Refractive index |
| 16 | Cut stone (1.225 ct) from pocket | Pale green | Specific gravity | Refractive index |
| Sample | 1 | 2 | 3a | 3b | 4 | 5 | ||||||||||
| Pink Elbaite | Pink Rossmanite | Pink Elbaite | Pink Rossmanite | Light Blue Elbaite | Colourless Elbaite | Brown Elbaite | Rim-Green Elbaite | Core-Pink Elbaite | Core-Pink Elbaite | Core-Pink Elbaite | Inter-Pink Elbaite | Rim-Green Elbaite | Elbaite | Light Green Elbaite | ||
| Average (20 pts) | Average (10 pts) | Average (15 pts) | Average (20 pts) | |||||||||||||
| Point Number ° | 4 | 6 | 8 | 9 | 16 | 10 | 24 | 23 | 56 | 54 | 33 | |||||
| SiO2 (wt %) | 36.34 | 36.63 | 36.28 | 37.06 | 36.2 | 36.17 | 36.54 | 36.99 | 36.79 | 36.67 | 36.59 | 37.04 | 37.28 | 36.71 | 36.29 | |
| TiO2 | bdl | bdl | 0.06 | bdl | 0.03 | 0.03 | 0.07 | 0.04 | bdl | bdl | 0.04 | bdl | 0.02 | 0.24 | 0.03 | |
| B2O3 * | 11.06 | 11.18 | 11.02 | 11.27 | 10.78 | 10.87 | 10.77 | 10.98 | 10.94 | 10.93 | 10.91 | 11.04 | 11.05 | 10.64 | 10.9 | |
| Al2O3 | 43.3 | 44.73 | 42.95 | 44.91 | 38.83 | 40.28 | 37.86 | 40.32 | 41.41 | 41.36 | 41.34 | 42.14 | 40.72 | 36.01 | 40.16 | |
| V2O3 | 0.02 | bdl | bdl | bdl | 0.01 | bdl | 0.02 | 0.02 | 0.02 | bdl | bdl | 0.01 | bdl | 0.04 | 0.01 | |
| Cr2O3 | bdl | bdl | bdl | bdl | 0.02 | 0.01 | bdl | bdl | bdl | 0.03 | 0.01 | 0.03 | bdl | 0.01 | bdl | |
| FeO | 0.02 | bdl | bdl | 0.03 | 1.00 | 0.73 | 1.43 | 0.83 | bdl | bdl | 0.01 | 0.01 | 0.52 | 4.75 | 0.77 | |
| MgO | 0.03 | bdl | bdl | 0.01 | 0.02 | 0.02 | 0.01 | 0.01 | bdl | 0.01 | 0.01 | 0.01 | bdl | bdl | 0.01 | |
| MnO | 0.52 | 0.21 | 0.55 | 0.27 | 3.79 | 2.79 | 3.99 | 2.82 | 0.16 | 0.16 | 0.13 | 0.12 | 2.02 | 2.45 | 2.93 | |
| ZnO | 0.09 | bdl | bdl | bdl | 0.05 | 0.03 | 0.08 | bdl | 0.14 | 0.08 | 0.05 | 0.03 | 0.10 | 0.50 | 0.05 | |
| CaO | 0.95 | 0.28 | 0.98 | 0.27 | 1.08 | 0.98 | 1.23 | 0.78 | 1.52 | 1.65 | 1.57 | 1.23 | 1.27 | 0.36 | 1.18 | |
| Li2O * | 1.87 | 1.74 | 1.91 | 1.75 | 1.73 | 1.77 | 1.76 | 1.76 | 2.12 | 2.16 | 2.15 | 2.09 | 1.95 | 1.5 | 1.80 | |
| Na2O | 1.38 | 1.39 | 1.42 | 1.35 | 2.19 | 2.05 | 2.25 | 1.98 | 1.26 | 1.29 | 1.31 | 1.39 | 1.72 | 2.73 | 1.98 | |
| K2O | 0.01 | bdl | 0.01 | 0.01 | 0.02 | 0.02 | 0.01 | 0.01 | 0.01 | 0.01 | 0.02 | bdl | bdl | 0.03 | 0.01 | |
| H2O* | 3.53 | 3.83 | 3.53 | 3.78 | 3.12 | 3.27 | 3.13 | 3.24 | 3.22 | 3.24 | 3.17 | 3.34 | 3.26 | 3.00 | 3.24 | |
| F | 0.61 | 0.07 | 0.57 | 0.24 | 1.27 | 1.00 | 1.25 | 1.16 | 1.17 | 1.11 | 1.25 | 0.98 | 1.16 | 1.41 | 1.10 | |
| Total | 99.73 | 100.07 | 99.27 | 100.94 | 100.13 | 100.02 | 100.48 | 100.95 | 98.77 | 98.7 | 98.57 | 99.45 | 101.08 | 100.39 | 100.47 | |
| O=F | 0.26 | 0.03 | 0.24 | 0.1 | 0.53 | 0.42 | 0.53 | 0.49 | 0.49 | 0.47 | 0.53 | 0.41 | 0.49 | 0.59 | 0.46 | |
| Total * | 99.47 | 100.04 | 99.03 | 100.84 | 99.6 | 99.6 | 99.96 | 100.46 | 98.27 | 98.23 | 98.04 | 99.04 | 100.59 | 99.79 | 100 | |
| Structural formula based on 31 anions (O, OH, F) | ||||||||||||||||
| Si | 5.71 | 5.692 | 5.723 | 5.714 | 5.835 | 5.783 | 5.905 | 5.856 | 5.846 | 5.831 | 5.829 | 5.831 | 5.864 | 5.996 | 5.788 | |
| Al | 0.29 | 0.308 | 0.277 | 0.286 | 0.165 | 0.217 | 0.097 | 0.144 | 0.154 | 0.169 | 0.171 | 0.169 | 0.136 | 0.004 | 0.212 | |
| T sum | 6.000 | 6.000 | 6.000 | 6.000 | 6.000 | 6.000 | 6.000 | 6.000 | 6.000 | 6.000 | 6.000 | 6.000 | 6.000 | 6.000 | 6.000 | |
| B | 3.000 | 3.000 | 3.000 | 3.000 | 3.000 | 3.000 | 3.000 | 3.000 | 3.000 | 3.000 | 3.000 | 3.000 | 3.000 | 3.000 | 3.000 | |
| Al (Z) | 6.000 | 6.000 | 6.000 | 6.000 | 6.000 | 6.000 | 6.000 | 6.000 | 6.000 | 6.000 | 6.000 | 6.000 | 6.000 | 6.000 | 6.000 | |
| Cr | - | - | - | - | - | - | - | - | - | - | - | - | - | - | - | |
| Al | 1.727 | 1.884 | 1.709 | 1.875 | 1.211 | 1.373 | 1.081 | 1.379 | 1.601 | 1.583 | 1.59 | 1.65 | 1.413 | 0.928 | 1.336 | |
| Ti | - | - | 0.007 | 0.001 | 0.004 | 0.004 | 0.012 | 0.005 | - | - | 0.004 | - | 0.002 | 0.03 | 0.004 | |
| V | 0.003 | - | - | - | 0.001 | 0.001 | 0.002 | 0.002 | 0.003 | - | - | 0.001 | - | 0.006 | 0.001 | |
| Cr | - | - | - | - | 0.002 | 0.001 | 0.001 | - | bdl | 0.004 | 0.002 | 0.003 | - | 0.001 | - | |
| Mg | 0.007 | 0.001 | - | 0.002 | 0.004 | 0.004 | 0.003 | 0.003 | bdl | 0.003 | 0.003 | 0.002 | - | - | 0.003 | |
| Mn | 0.069 | 0.028 | 0.073 | 0.035 | 0.518 | 0.377 | 0.527 | 0.378 | 0.022 | 0.021 | 0.017 | 0.016 | 0.269 | 0.339 | 0.396 | |
| Fe2+ | 0.003 | - | - | 0.003 | 0.134 | 0.097 | 0.231 | 0.11 | 0.001 | - | 0.001 | 0.001 | 0.069 | 0.649 | 0.102 | |
| Zn | 0.01 | - | - | - | 0.006 | 0.004 | 0.013 | - | 0.016 | 0.009 | 0.006 | 0.003 | 0.012 | 0.061 | 0.006 | |
| Li * | 1.181 | 1.087 | 1.212 | 1.084 | 1.12 | 1.139 | 1.129 | 1.122 | 1.358 | 1.38 | 1.375 | 1.325 | 1.235 | 0.987 | 1.151 | |
| Y sum | 3.000 | 3.000 | 3.000 | 3.000 | 3.000 | 3.000 | 3.000 | 3.000 | 3.000 | 3.000 | 3.000 | 3.000 | 3.000 | 3.000 | 3.000 | |
| Ca | 0.159 | 0.046 | 0.165 | 0.044 | 0.187 | 0.168 | 0.201 | 0.132 | 0.259 | 0.281 | 0.268 | 0.207 | 0.214 | 0.064 | 0.202 | |
| Na | 0.42 | 0.419 | 0.434 | 0.404 | 0.684 | 0.635 | 0.707 | 0.608 | 0.388 | 0.396 | 0.406 | 0.424 | 0.525 | 0.865 | 0.613 | |
| K | 0.002 | - | 0.002 | 0.003 | 0.004 | 0.003 | 0.003 | 0.003 | 0.002 | 0.002 | 0.004 | - | - | 0.005 | 0.002 | |
| Vacancy | 0.418 | 0.535 | 0.399 | 0.55 | 0.125 | 0.194 | 0.089 | 0.257 | 0.351 | 0.32 | 0.322 | 0.368 | 0.261 | 0.066 | 0.183 | |
| X sum | 1.000 | 1.000 | 1.000 | 1.000 | 1.000 | 1.000 | 1.000 | 1.000 | 1.000 | 1.000 | 1.000 | 1.000 | 1.000 | 1.000 | 1.000 | |
| OH | 3.695 | 3.967 | 3.715 | 3.884 | 3.353 | 3.492 | 3.363 | 3.419 | 3.412 | 3.442 | 3.37 | 3.512 | 3.423 | 3.272 | 3.445 | |
| F | 0.305 | 0.033 | 0.285 | 0.116 | 0.647 | 0.508 | 0.637 | 0.581 | 0.588 | 0.558 | 0.63 | 0.488 | 0.577 | 0.728 | 0.555 | |
| Sample | 6 | 9a | 9b | 10 | 11 | 12 | ||||||||||
| Analogous Green | Antilogous Dark Green | |||||||||||||||
| Light Yellow Elbaite | Light Yellow Elbaite | Light Yellow Fluor-Liddicoatite | Colourless Flour-Liddicoatite | Pink Elbaite | Green Elbaite | Foitite | Elbaite | Elbaite | Elbaite | Fluor-Liddicoatite | Elbaite | Elbaite | Rossmanite | Green Elbaite | Blue Elbaite | |
| Average (9 pts) | Average (10 pts) | Average (21 pts) | Average (20 pts) | |||||||||||||
| Point Number ° | 4 | 10 | 12 | 36 | 42 | 43 | 45 | |||||||||
| SiO2 (wt %) | 35.70 | 36.00 | 36.71 | 37.50 | 37.12 | 37.32 | 35.82 | 37.38 | 38.13 | 37.51 | 37.60 | 37.82 | 37.13 | 37.06 | 36.95 | 37.10 |
| TiO2 | 0.14 | 0.17 | 0.09 | 0.09 | 0.01 | 0.17 | bdl | bdl | bdl | 0.18 | 0.03 | 0.05 | 0.20 | 0.07 | 0.18 | 0.17 |
| B2O3 * | 10.84 | 10.83 | 10.94 | 10.99 | 11.07 | 11.00 | 10.39 | 10.92 | 11.09 | 11.02 | 10.99 | 11.04 | 10.98 | 10.76 | 10.96 | 10.93 |
| Al2O3 | 40.53 | 39.68 | 39.90 | 39.43 | 41.59 | 39.78 | 33.55 | 39.33 | 39.60 | 39.74 | 39.03 | 40.09 | 39.60 | 37.57 | 39.86 | 39.30 |
| V2O3 | 0.01 | 0.04 | 0.01 | bdl | 0.01 | 0.02 | bdl | 0.03 | bdl | 0.10 | 0.02 | bdl | 0.04 | bdl | 0.01 | bdl |
| Cr2O3 | bdl | bdl | bdl | 0.01 | 0.01 | 0.01 | 0.01 | 0.01 | bdl | bdl | 0.02 | bdl | 0.05 | bdl | 0.01 | 0.01 |
| FeO | 0.34 | 0.54 | 0.22 | 0.16 | 0.08 | 0.71 | 11.52 | 1.68 | 0.44 | 0.85 | 0.34 | 0.88 | 1.25 | 3.40 | 1.18 | 0.66 |
| MgO | 0.01 | 0.01 | 0.01 | bdl | 0.01 | 0.01 | 2.57 | 0.03 | 0.01 | 0.01 | 0.02 | 0.05 | 0.04 | 0.02 | 0.03 | 0.03 |
| MnO | 2.38 | 2.51 | 1.29 | 0.99 | 1.60 | 2.05 | 0.17 | 3.68 | 1.82 | 1.82 | 1.45 | 2.89 | 1.87 | 5.67 | 2.31 | 3.10 |
| ZnO | bdl | bdl | 0.08 | bdl | 0.03 | 0.06 | 0.10 | 0.12 | 0.12 | 0.02 | 0.08 | 0.09 | 0.19 | 0.18 | 0.02 | 0.03 |
| CaO | 1.49 | 1.58 | 2.67 | 2.94 | 1.16 | 1.53 | 0.02 | 0.13 | 1.96 | 1.62 | 3.05 | 0.27 | 1.47 | 0.07 | 1.00 | 1.21 |
| Li2O * | 1.90 | 1.97 | 2.31 | 2.44 | 1.96 | 2.05 | 0.14 | 1.45 | 2.20 | 2.05 | 2.38 | 1.71 | 1.98 | 0.91 | 1.87 | 1.88 |
| Na2O | 1.81 | 1.97 | 1.32 | 1.05 | 1.59 | 1.77 | 1.48 | 1.97 | 1.50 | 1.54 | 0.99 | 2.10 | 1.84 | 1.37 | 2.08 | 1.88 |
| K2O | bdl | 0.02 | 0.01 | bdl | 0.01 | 0.01 | 0.01 | 0.01 | bdl | 0.01 | 0.01 | bdl | 0.01 | 0.02 | 0.02 | 0.02 |
| H2O * | 3.29 | 3.17 | 3.23 | 3.21 | 3.39 | 3.25 | 3.58 | 3.77 | 3.45 | 3.22 | 3.18 | 3.81 | 3.28 | 3.71 | 3.33 | 3.22 |
| F | 0.95 | 1.19 | 1.16 | 1.23 | 0.91 | 1.14 | bdl | bdl | 0.79 | 1.23 | 1.29 | bdl | 1.08 | bdl | 0.95 | 1.17 |
| Total | 99.39 | 99.67 | 99.94 | 100.03 | 100.54 | 100.88 | 99.37 | 100.52 | 101.11 | 100.90 | 100.49 | 100.81 | 101.00 | 100.82 | 100.77 | 100.70 |
| O=F | 0.40 | 0.50 | 0.49 | 0.52 | 0.38 | 0.48 | bdl | bdl | 0.33 | 0.52 | 0.54 | bdl | 0.45 | bdl | 0.40 | 0.49 |
| Total * | 98.99 | 99.17 | 99.46 | 99.52 | 100.16 | 100.40 | 99.37 | 100.52 | 100.78 | 100.38 | 99.95 | 100.81 | 100.55 | 100.82 | 100.37 | 100.21 |
| Structural formula based on 31 anions (O, OH, F) | ||||||||||||||||
| Si | 5.726 | 5.779 | 5.831 | 5.931 | 5.830 | 5.894 | 5.994 | 5.948 | 5.978 | 5.918 | 5.946 | 5.952 | 5.875 | 5.985 | 5.858 | 5.898 |
| Al | 0.274 | 0.221 | 0.169 | 0.069 | 0.170 | 0.106 | 0.006 | 0.052 | 0.022 | 0.082 | 0.054 | 0.048 | 0.125 | 0.015 | 0.142 | 0.102 |
| T sum | 6.000 | 6.000 | 6.000 | 6.000 | 6.000 | 6.000 | 6.000 | 6.000 | 6.000 | 6.000 | 6.000 | 6.000 | 6.000 | 6.000 | 6.000 | 6.000 |
| B | 3.000 | 3.000 | 3.000 | 3.000 | 3.000 | 3.000 | 3.000 | 3.000 | 3.000 | 3.000 | 3.000 | 3.000 | 3.000 | 3.000 | 3.000 | 3.000 |
| Al (Z) | 6.000 | 6.000 | 6.000 | 6.000 | 6.000 | 6.000 | 6.000 | 6.000 | 6.000 | 6.000 | 6.000 | 6.000 | 6.000 | 6.000 | 6.000 | 6.000 |
| Cr | - | - | - | - | - | - | - | - | - | - | - | - | - | - | - | - |
| Al | 1.387 | 1.287 | 1.301 | 1.282 | 1.528 | 1.299 | 0.612 | 1.323 | 1.296 | 1.307 | 1.220 | 1.387 | 1.260 | 1.136 | 1.305 | 1.263 |
| Ti | 0.017 | 0.020 | 0.011 | 0.010 | 0.001 | 0.020 | - | - | - | 0.021 | 0.004 | 0.006 | 0.024 | 0.008 | 0.022 | 0.020 |
| V | 0.002 | 0.005 | 0.001 | - | 0.001 | 0.002 | - | 0.004 | - | 0.012 | 0.003 | - | 0.005 | - | 0.001 | 0.001 |
| Cr | - | - | - | 0.001 | 0.001 | 0.001 | 0.002 | 0.001 | - | - | 0.003 | - | 0.006 | - | 0.001 | 0.001 |
| Mg | 0.004 | 0.003 | 0.003 | 0.001 | 0.001 | 0.003 | 0.641 | 0.008 | 0.002 | 0.002 | 0.005 | 0.012 | 0.009 | 0.006 | 0.008 | 0.007 |
| Mn | 0.323 | 0.341 | 0.173 | 0.133 | 0.213 | 0.275 | 0.024 | 0.496 | 0.242 | 0.243 | 0.194 | 0.385 | 0.251 | 0.776 | 0.310 | 0.417 |
| Fe2+ | 0.046 | 0.072 | 0.029 | 0.021 | 0.010 | 0.093 | 1.612 | 0.224 | 0.058 | 0.112 | 0.045 | 0.116 | 0.165 | 0.459 | 0.157 | 0.087 |
| Zn | - | - | 0.010 | - | 0.004 | 0.007 | 0.013 | 0.014 | 0.014 | 0.002 | 0.010 | 0.010 | 0.022 | 0.022 | 0.003 | 0.003 |
| Li * | 1.223 | 1.271 | 1.473 | 1.552 | 1.240 | 1.299 | 0.096 | 0.930 | 1.389 | 1.300 | 1.517 | 1.083 | 1.259 | 0.594 | 1.193 | 1.200 |
| Y sum | 3.000 | 3.000 | 3.000 | 3.000 | 3.000 | 3.000 | 3.000 | 3.000 | 3.000 | 3.000 | 3.000 | 3.000 | 3.000 | 3.000 | 3.000 | 3.000 |
| Ca | 0.256 | 0.272 | 0.454 | 0.498 | 0.195 | 0.259 | 0.003 | 0.022 | 0.329 | 0.274 | 0.517 | 0.046 | 0.249 | 0.012 | 0.171 | 0.207 |
| Na | 0.563 | 0.613 | 0.407 | 0.321 | 0.485 | 0.542 | 0.480 | 0.608 | 0.456 | 0.471 | 0.303 | 0.641 | 0.564 | 0.429 | 0.640 | 0.581 |
| K | 0.001 | 0.003 | 0.002 | 0.000 | 0.002 | 0.002 | 0.002 | 0.002 | - | 0.001 | 0.002 | - | 0.003 | 0.003 | 0.003 | 0.004 |
| Vacancy | 0.181 | 0.112 | 0.137 | 0.180 | 0.317 | 0.197 | 0.515 | 0.368 | 0.214 | 0.254 | 0.179 | 0.313 | 0.184 | 0.555 | 0.187 | 0.209 |
| X sum | 1.000 | 1.000 | 1.000 | 1.000 | 1.000 | 1.000 | 1.000 | 1.000 | 1.000 | 1.000 | 1.000 | 1.000 | 1.000 | 1.000 | 1.000 | 1.000 |
| OH | 3.519 | 3.396 | 3.417 | 3.385 | 3.547 | 3.429 | 4.000 | 4.000 | 3.608 | 3.386 | 3.355 | 4.000 | 3.460 | 4.000 | 3.522 | 3.412 |
| F | 0.481 | 0.604 | 0.583 | 0.615 | 0.453 | 0.571 | - | - | 0.392 | 0.614 | 0.645 | - | 0.540 | - | 0.478 | 0.588 |
| Sample | 1 | 2 | 3a | 3b | 4 | 5 | |||||||
| Average (4 pts) | st dev | Average (4 pts) | st dev | Average (4 pts) | st dev | Average (5 pts) | st dev | Average (8 pts) | st dev | Average (5 pts) | st dev | ||
| Li | 8546.20 | 463.86 | 7985.55 | 182.95 | 7859.06 | 75.06 | 7919.98 | 324.03 | 8899.59 | 1020.41 | 8073.58 | 322.46 | |
| Be | 52.19 | 14.18 | 37.62 | 2.83 | 28.92 | 2.96 | 21.29 | 8.82 | 99.38 | 122.07 | 31.05 | 9.50 | |
| Sc | 3.03 | 0.55 | 1.83 | 0.28 | 1.82 | 0.35 | 2.79 | 0.45 | 1.63 | 0.52 | 2.12 | 0.16 | |
| V | 0.38 | 0.32 | 1.08 | 0.20 | 0.82 | 0.12 | 13.95 | 7.92 | 8.56 | 5.26 | 3.17 | 4.77 | |
| Cu | 196.20 | 27.01 | 19.23 | 1.05 | 16.10 | 1.41 | 16.04 | 12.69 | 71.89 | 62.62 | 22.16 | 3.19 | |
| Ga | 181.73 | 28.06 | 40.83 | 2.51 | 45.27 | 1.04 | 59.90 | 13.21 | 78.28 | 26.48 | 44.19 | 6.70 | |
| Ge | 9.11 | 2.22 | 20.47 | 1.68 | 19.85 | 1.52 | 15.65 | 2.90 | 15.91 | 2.78 | 21.57 | 2.77 | |
| Sr | 0.73 | 0.23 | 31.66 | 1.23 | 19.88 | 1.72 | 231.22 | 390.52 | 93.98 | 234.91 | 29.42 | 3.66 | |
| Y | 0.25 | 0.17 | 0.46 | 0.05 | 0.35 | 0.03 | 0.24 | 0.15 | 0.22 | 0.08 | 0.39 | 0.20 | |
| Ta | 4.63 | 3.57 | 1.07 | 0.14 | 0.28 | 0.01 | 0.56 | 0.31 | 3.18 | 5.43 | 0.44 | 0.40 | |
| Pb | 11.94 | 4.76 | 43.78 | 2.22 | 35.05 | 1.19 | 2882.66 | 3775.66 | 184.51 | 453.38 | 163.22 | 71.23 | |
| Th | 3.58 | 2.95 | 0.79 | 0.06 | 0.55 | 0.06 | 0.16 | 0.14 | 6.98 | 15.66 | 0.52 | 0.32 | |
| U | 0.36 | 0.29 | 0.02 | 0.00 | bdl | 0.01 | 0.01 | 0.79 | 1.15 | 0.03 | |||
| La | 44.13 | 18.50 | 24.29 | 1.46 | 13.58 | 0.35 | 22.86 | 14.36 | 9.50 | 4.54 | 17.07 | 4.19 | |
| Ce | 46.68 | 19.98 | 49.72 | 3.99 | 30.16 | 0.30 | 48.87 | 26.13 | 15.89 | 8.20 | 37.41 | 11.14 | |
| Pr | 2.35 | 1.08 | 5.13 | 0.38 | 2.87 | 0.10 | 4.94 | 2.44 | 1.44 | 0.85 | 3.60 | 1.08 | |
| Nd | 3.05 | 1.40 | 14.54 | 1.49 | 7.46 | 0.24 | 13.43 | 6.78 | 3.42 | 2.55 | 9.15 | 2.88 | |
| Sm | 0.53 | 0.36 | 3.14 | 0.69 | 1.96 | 0.17 | 2.74 | 1.23 | 1.17 | 0.41 | 2.29 | 0.95 | |
| Eu | bdl | 0.12 | 0.03 | 0.12 | 0.04 | 0.13 | 0.05 | 0.05 | 0.02 | 0.10 | 0.04 | ||
| Gd | 0.27 | 0.02 | 0.93 | 0.19 | 0.64 | 0.13 | 0.68 | 0.40 | 0.42 | 0.16 | 0.72 | 0.38 | |
| Tb | 0.05 | 0.04 | 0.11 | 0.02 | 0.09 | 0.02 | 0.08 | 0.05 | 0.05 | 0.02 | 0.09 | 0.04 | |
| Dy | 0.15 | 0.17 | 0.36 | 0.11 | 0.24 | 0.05 | 0.24 | 0.17 | 0.14 | 0.04 | 0.26 | 0.17 | |
| Ho | bdl | bdl | 0.03 | 0.02 | 0.02 | 0.01 | 0.02 | 0.01 | 0.02 | 0.01 | |||
| Er | 0.20 | 0.26 | bdl | 0.05 | 0.001 | bdl | 0.06 | 0.03 | bdl | ||||
| Tm | bdl | 0.02 | 0.005 | 0.01 | 0.005 | 0.01 | 0.00 | bdl | bdl | ||||
| Yb | 0.10 | 0.10 | bdl | bdl | 0.17 | 0.15 | bdl | ||||||
| Lu | bdl | bdl | bdl | bdl | bdl | 0.01 | |||||||
| Σ REE | 97.50 | 98.36 | 57.21 | 94.00 | 32.34 | 70.72 | |||||||
| Sample | 6 | 9a | 9b | 10 | 11 | 12 | |||||||
| Average (7 pts) | st dev | Average (3 pts) | st dev | Average (3 pts) | st dev | Average (8 pts) | st dev | Average (5 pts) | st dev | Average (4 pts) | st dev | ||
| Li | 9993.23 | 1095.08 | 8494.71 | 249.68 | 8767.86 | 145.96 | 8444.96 | 1786.74 | 7175.63 | 2373.44 | 8271.11 | 399.03 | |
| Be | 20.20 | 5.78 | 23.17 | 2.81 | 27.37 | 7.68 | 22.63 | 13.36 | 14.62 | 11.00 | 19.95 | 2.56 | |
| Sc | 1.96 | 0.40 | 2.96 | 0.25 | 3.09 | 0.24 | 2.26 | 0.46 | 3.47 | 0.84 | 1.65 | 0.47 | |
| V | 0.37 | 0.09 | 0.48 | 0.18 | 8.88 | 3.03 | 0.84 | 0.63 | 1.21 | 0.54 | 0.54 | 0.09 | |
| Cu | 21.30 | 9.49 | 148.85 | 58.16 | 31.74 | 3.36 | 24.96 | 16.28 | 17.92 | 12.74 | 30.46 | 6.96 | |
| Ga | 68.20 | 25.78 | 121.62 | 49.09 | 35.29 | 1.08 | 104.43 | 26.62 | 91.33 | 12.88 | 45.58 | 5.77 | |
| Ge | 12.01 | 2.63 | 7.05 | 0.84 | 16.59 | 1.50 | 6.97 | 2.13 | 7.10 | 1.54 | 11.74 | 3.80 | |
| Sr | 104.28 | 95.41 | 4.37 | 1.46 | 168.96 | 25.82 | 30.01 | 25.73 | 175.48 | 356.03 | 16.88 | 4.55 | |
| Y | 0.36 | 0.05 | 0.46 | 0.08 | 0.48 | 0.20 | 0.65 | 0.62 | 0.31 | 0.11 | 0.21 | 0.12 | |
| Ta | 1.11 | 0.36 | 1.06 | 0.39 | 1.02 | 0.43 | 1.04 | 1.47 | 0.16 | 0.10 | 0.56 | 0.25 | |
| Pb | 135.44 | 129.63 | 13.36 | 1.50 | 64.72 | 10.31 | 40.34 | 60.43 | 881.33 | 710.51 | 27.57 | 6.20 | |
| Th | 0.23 | 0.09 | 1.07 | 0.40 | 0.49 | 0.16 | 1.55 | 1.67 | 0.52 | 0.25 | 0.32 | 0.12 | |
| U | 0.03 | 0.02 | 0.06 | 0.01 | bdl | 0.06 | 0.02 | 0.06 | 0.06 | 0.02 | 0.02 | ||
| La | 22.46 | 4.14 | 23.09 | 7.25 | 33.99 | 10.92 | 18.37 | 19.28 | 9.75 | 8.73 | 14.74 | 5.05 | |
| Ce | 46.61 | 14.32 | 49.63 | 12.21 | 66.11 | 21.77 | 35.44 | 44.29 | 20.35 | 18.36 | 31.63 | 11.11 | |
| Pr | 4.65 | 1.67 | 4.84 | 0.58 | 6.41 | 2.04 | 3.98 | 5.18 | 2.03 | 1.80 | 3.15 | 1.06 | |
| Nd | 12.45 | 5.70 | 11.78 | 0.79 | 18.64 | 5.80 | 13.82 | 16.80 | 7.01 | 4.65 | 8.26 | 2.74 | |
| Sm | 2.83 | 1.40 | 3.86 | 0.57 | 3.76 | 1.18 | 4.74 | 5.45 | 1.73 | 1.19 | 1.91 | 0.70 | |
| Eu | 0.13 | 0.05 | 0.07 | 0.03 | 0.32 | 0.05 | 0.13 | 0.16 | 0.11 | 0.03 | 0.09 | 0.02 | |
| Gd | 0.84 | 0.44 | 1.31 | 0.35 | 1.49 | 0.59 | 1.66 | 1.44 | 0.50 | 0.38 | 0.49 | 0.16 | |
| Tb | 0.08 | 0.02 | 0.15 | 0.02 | 0.17 | 0.02 | 0.21 | 0.18 | 0.07 | 0.05 | 0.07 | 0.03 | |
| Dy | 0.24 | 0.12 | 0.48 | 0.17 | 0.41 | 0.14 | 0.61 | 0.61 | 0.21 | 0.10 | 0.16 | 0.05 | |
| Ho | bdl | 0.02 | 0.01 | 0.04 | 0.02 | 0.06 | 0.04 | 0.03 | 0.03 | bdl | |||
| Er | 0.05 | 0.03 | 0.05 | 0.04 | 0.07 | 0.03 | bdl | 0.05 | 0.02 | 0.08 | 0.04 | ||
| Tm | 0.01 | 0.01 | 0.02 | 0.01 | bdl | 0.03 | 0.01 | 0.02 | bdl | bdl | |||
| Yb | bdl | bdl | bdl | bdl | 0.15 | 0.20 | 0.10 | 0.01 | |||||
| Lu | 0.02 | 0.01 | bdl | bdl | 0.02 | 0.01 | 0.04 | 0.05 | bdl | ||||
| Σ REE | 90.37 | 95.29 | 131.42 | 79.06 | 42.06 | 60.67 | |||||||
| Sample | 1 | 2 | 12 |
|---|---|---|---|
| Temperature | 293(2) K | 293(2) K | 293(2) K |
| Wavelength | 0.71073 Å | 0.71073 Å | 0.71073 Å |
| Crystal system | Trigonal | Trigonal | Trigonal |
| Space group | R3m | R3m | R3m |
| Unit cell dimensions | a = 15.8283(3) Å | a = 15.8951(8) Å | a = 15.8909(2) Å |
| c = 7.09392(18) Å | c = 7.1216(4) Å | c = 7.1163(3) Å | |
| Volume | 1539.16(5) Å3 | 1558.22(15) Å3 | 1556.26(7) Å3 |
| Z | 3 | 3 | 3 |
| Absorption coefficient | 1.004 mm−1 | 1.056 mm−1 | 1.020 mm−1 |
| F(000) | 1395 | 1430 | 1422 |
| Crystal size (mm3) | 0.29 × 0.61 × 0.47 | 0.35 × 0.51 × 0.65 | 0.40 × 0.53 × 0.70 |
| θ range for data collection | 3.23 to 36.11°. | 3.22 to 29.04°. | 3.22 to 35.95°. |
| Index ranges | −26 ≤ h ≤ 26, | −16 ≤ h ≤ 13, | −25 ≤ h ≤ 26, |
| −24 ≤ k ≤ 24, | −20 ≤ k ≤ 20, | −25 ≤ k ≤ 25, | |
| −9 ≤ l ≤ 9 | −9 ≤ l ≤ 9 | −9 ≤ l ≤ 9 | |
| Reflections collected | 14,418 | 3806 | 14,500 |
| Independent reflections | 1571 | 914 | 1261 |
| R(int) | 0.0277 | 0.0216 | 0.0334 |
| Completeness to θ = 35.95° | 89.30% | 95.20% | 72.70% |
| Refinement method | Full-matrix least-squares on F2 | Full-matrix least-squares on F2 | Full-matrix least-squares on F2 |
| Data/restraints/parameters | 1571/1/97 | 914/1/97 | 1261/1/97 |
| Goodness-of-fit on F2 | 1.161 | 1.076 | 1.09 |
| Final R indices [I > 2σ (I)] | R1 = 0.0159 | R1 = 0.0175 | R1 = 0.0179 |
| wR2 = 0.0400 | wR2 = 0.0452 | wR2 = 0.0448 | |
| R indices (all data) | R1 = 0.0168 | R1 = 0.0177 | R1 = 0.0186 |
| wR2 = 0.0403 | wR2 = 0.0453 | wR2 = 0.0451 | |
| Absolute structure parameter | 0.04(7) | 0.01(11) | −0.10(10) |
| Extinction coefficient | 0.0049(3) | 0.0041(3) | 0.0024(2) |
| Largest diff. peak and hole | 0.461 and | 0.530 and | 0.889 and |
| −0.439 e.Å−3 | −0.497 e.Å−3 | −0.709 e.Å−3 |
| Sample | 1 | 2 | 12 |
|---|---|---|---|
| T–O(6) | 1.6092(9) | 1.6049(15) | 1.6021(14) |
| T–O(7) | 1.6103(7) | 1.6134(13) | 1.6110(10) |
| T–O(4) | 1.6208(5) | 1.6263(8) | 1.6260(7) |
| T–O(5) | 1.6363(5) | 1.6412(9) | 1.6389(8) |
| <T–O> | 1.619 | 1.621 | 1.62 |
| V (Å3) | 2.173 | 2.181 | 2.173 |
| TQE | 1.0017 | 1.0023 | 1.0022 |
| TAV | 6.812 | 9.502 | 9.0511 |
| B–O(2) | 1.3630(18) | 1.352(4) | 1.361(3) |
| B–O(8) (×2) | 1.3798(10) | 1.386(2) | 1.3850(15) |
| <B–O> | 1.374 | 1.375 | 1.377 |
| X–O(2) (×3) | 2.4570(18) | 2.426(3) | 2.425(2) |
| X–O(5) (×3) | 2.7422(13) | 2.748(2) | 2.7492(17) |
| X–O(4) (×3) | 2.8095(13) | 2.810(2) | 2.8078(18) |
| <X–O> | 2.67 | 2.661 | 2.661 |
| V (Å3) | 31.14 | 31.419 | 31.086 |
| Y–O(2) (×2) | 1.9620(9) | 1.9824(15) | 1.9812(14) |
| Y–O(6) (×2) | 1.9591(9) | 2.0150(15) | 2.0129(13) |
| Y–O(1) | 1.9577(14) | 2.028(2) | 2.024(2) |
| Y–O(3) | 2.1346(14) | 2.171(2) | 2.1678(19) |
| <Y–O> | 1.989 | 2.032 | 2.03 |
| V (Å3) | 10.125 | 10.796 | 10.759 |
| OQE | 1.0252 | 1.0253 | 1.0253 |
| OAV | 79.39 | 79.54 | 79.7 |
| Z–O(6) | 1.8643(8) | 1.8506(15) | 1.8514(12) |
| Z–O(7) | 1.8816(8) | 1.8823(14) | 1.8834(12) |
| Z–O(8) | 1.8877(8) | 1.8865(14) | 1.8847(11) |
| Z–O(8) | 1.9008(8) | 1.9114(14) | 1.9098(11) |
| Z–O(7) | 1.9415(7) | 1.9551(14) | 1.9551(11) |
| Z–O(3) | 1.9647(6) | 1.9617(11) | 1.9612(10) |
| <Z–O> | 1.907 | 1.908 | 1.908 |
| V (Å3) | 9.039 | 9.079 | 9.075 |
| OQE | 1.0154 | 1.0137 | 1.0137 |
| OAV | 52.08 | 45.82 | 45.75 |
| O(3) –H(3) | 0.80(3) | 0.71(4) | 0.72(4) |
| Site | (Electrons Per Site, eps) for Tourmalines 1, 2, 12 | ||
|---|---|---|---|
| 1 | 2 | 12 | |
| X (obs) | 8.73 | 12.43 | 11.81 |
| X (calc) | 7.95 | 11.34 | 10.61 |
| Y (obs) | 9.49 | 11.98 | 11.26 |
| Y (calc) | 9.25 | 11.97 | 11.12 |
| Z (obs) | 12.96 | 12.83 | 12.85 |
| Z (calc) | 13 | 13 | 13 |
© 2018 by the authors. Licensee MDPI, Basel, Switzerland. This article is an open access article distributed under the terms and conditions of the Creative Commons Attribution (CC BY) license (http://creativecommons.org/licenses/by/4.0/).
Share and Cite
Diella, V.; Pezzotta, F.; Bocchio, R.; Marinoni, N.; Cámara, F.; Langone, A.; Adamo, I.; Lanzafame, G. Gem-Quality Tourmaline from LCT Pegmatite in Adamello Massif, Central Southern Alps, Italy: An Investigation of Its Mineralogy, Crystallography and 3D Inclusions. Minerals 2018, 8, 593. https://doi.org/10.3390/min8120593
Diella V, Pezzotta F, Bocchio R, Marinoni N, Cámara F, Langone A, Adamo I, Lanzafame G. Gem-Quality Tourmaline from LCT Pegmatite in Adamello Massif, Central Southern Alps, Italy: An Investigation of Its Mineralogy, Crystallography and 3D Inclusions. Minerals. 2018; 8(12):593. https://doi.org/10.3390/min8120593
Chicago/Turabian StyleDiella, Valeria, Federico Pezzotta, Rosangela Bocchio, Nicoletta Marinoni, Fernando Cámara, Antonio Langone, Ilaria Adamo, and Gabriele Lanzafame. 2018. "Gem-Quality Tourmaline from LCT Pegmatite in Adamello Massif, Central Southern Alps, Italy: An Investigation of Its Mineralogy, Crystallography and 3D Inclusions" Minerals 8, no. 12: 593. https://doi.org/10.3390/min8120593
APA StyleDiella, V., Pezzotta, F., Bocchio, R., Marinoni, N., Cámara, F., Langone, A., Adamo, I., & Lanzafame, G. (2018). Gem-Quality Tourmaline from LCT Pegmatite in Adamello Massif, Central Southern Alps, Italy: An Investigation of Its Mineralogy, Crystallography and 3D Inclusions. Minerals, 8(12), 593. https://doi.org/10.3390/min8120593


