2.1. Methodology
In order to clarify the rates and requirements of metal, and the environmental impacts of alternative metal production, material flow analysis and life cycle assessment are utilized as key methods. Through this methodology, the material flow of five alternative copper supply options have been analyzed. Reduction of material intensity, shifting production patterns or economic sectoral restructure, or use of substitute materials are all potential demand-side strategies to improve resource security; however, this study focuses on the supply-side alternatives, and assume no overall decrease in copper requirement for the economy. Options addressed are: (A) conventional process; (B) deep ocean mining; (C) recycling. A limited-scope life cycle assessment is used to evaluate energy consumption, waste output and CO2 emissions, which are compared on the basis of one tonne of copper.
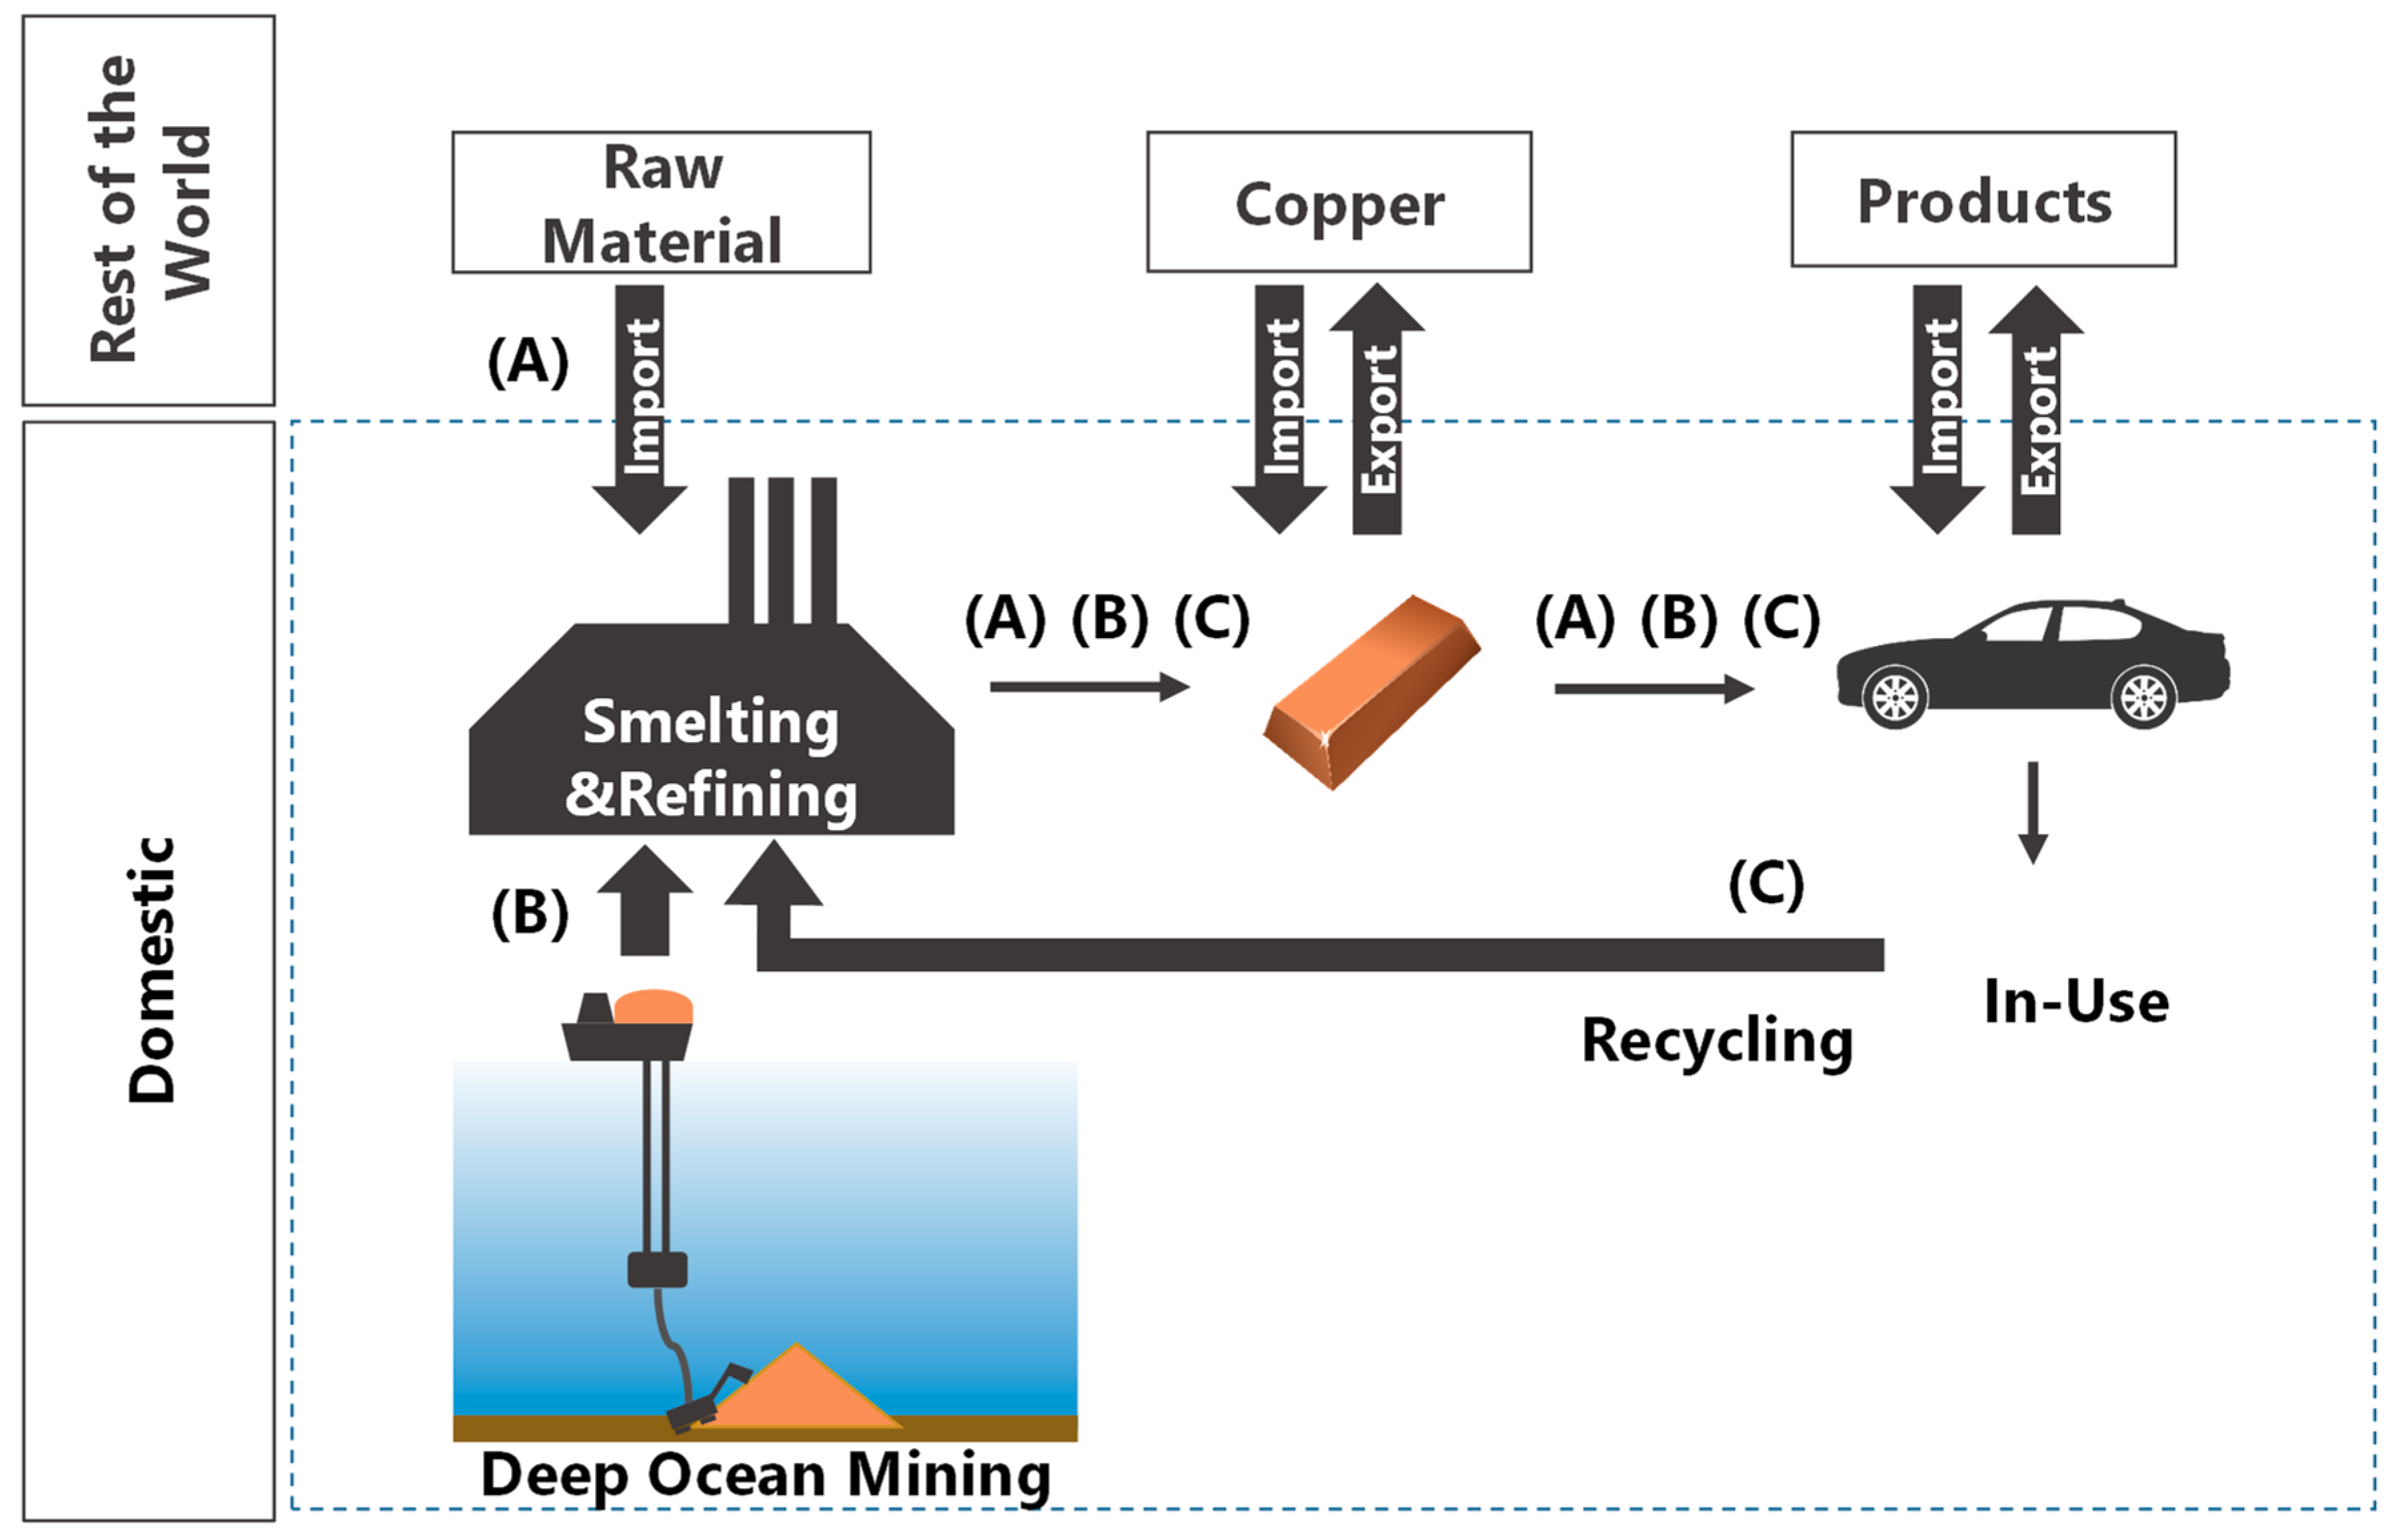
Figure 1 shows the overall system boundaries used in this study. The blue dashed box delineates the domestic processes and flows within Japan. Streams marked (A) occur only or primarily in the conventional copper processing situation; (B) occur in the deep ocean mining situation and (C) is the recycling scenario. Combined copper processing scenarios (discussed in
Section 3.2) for identifying the optimum mix of copper from each process consisted effectively of combinations of (A) + (B) + (C). As discussed later in more detail, the potential collectable copper material for recycling is limited as the amount used in domestic demand (domestic production and imports minus exports). Import of concentrate is considered to be used to fill the remainder of demand.
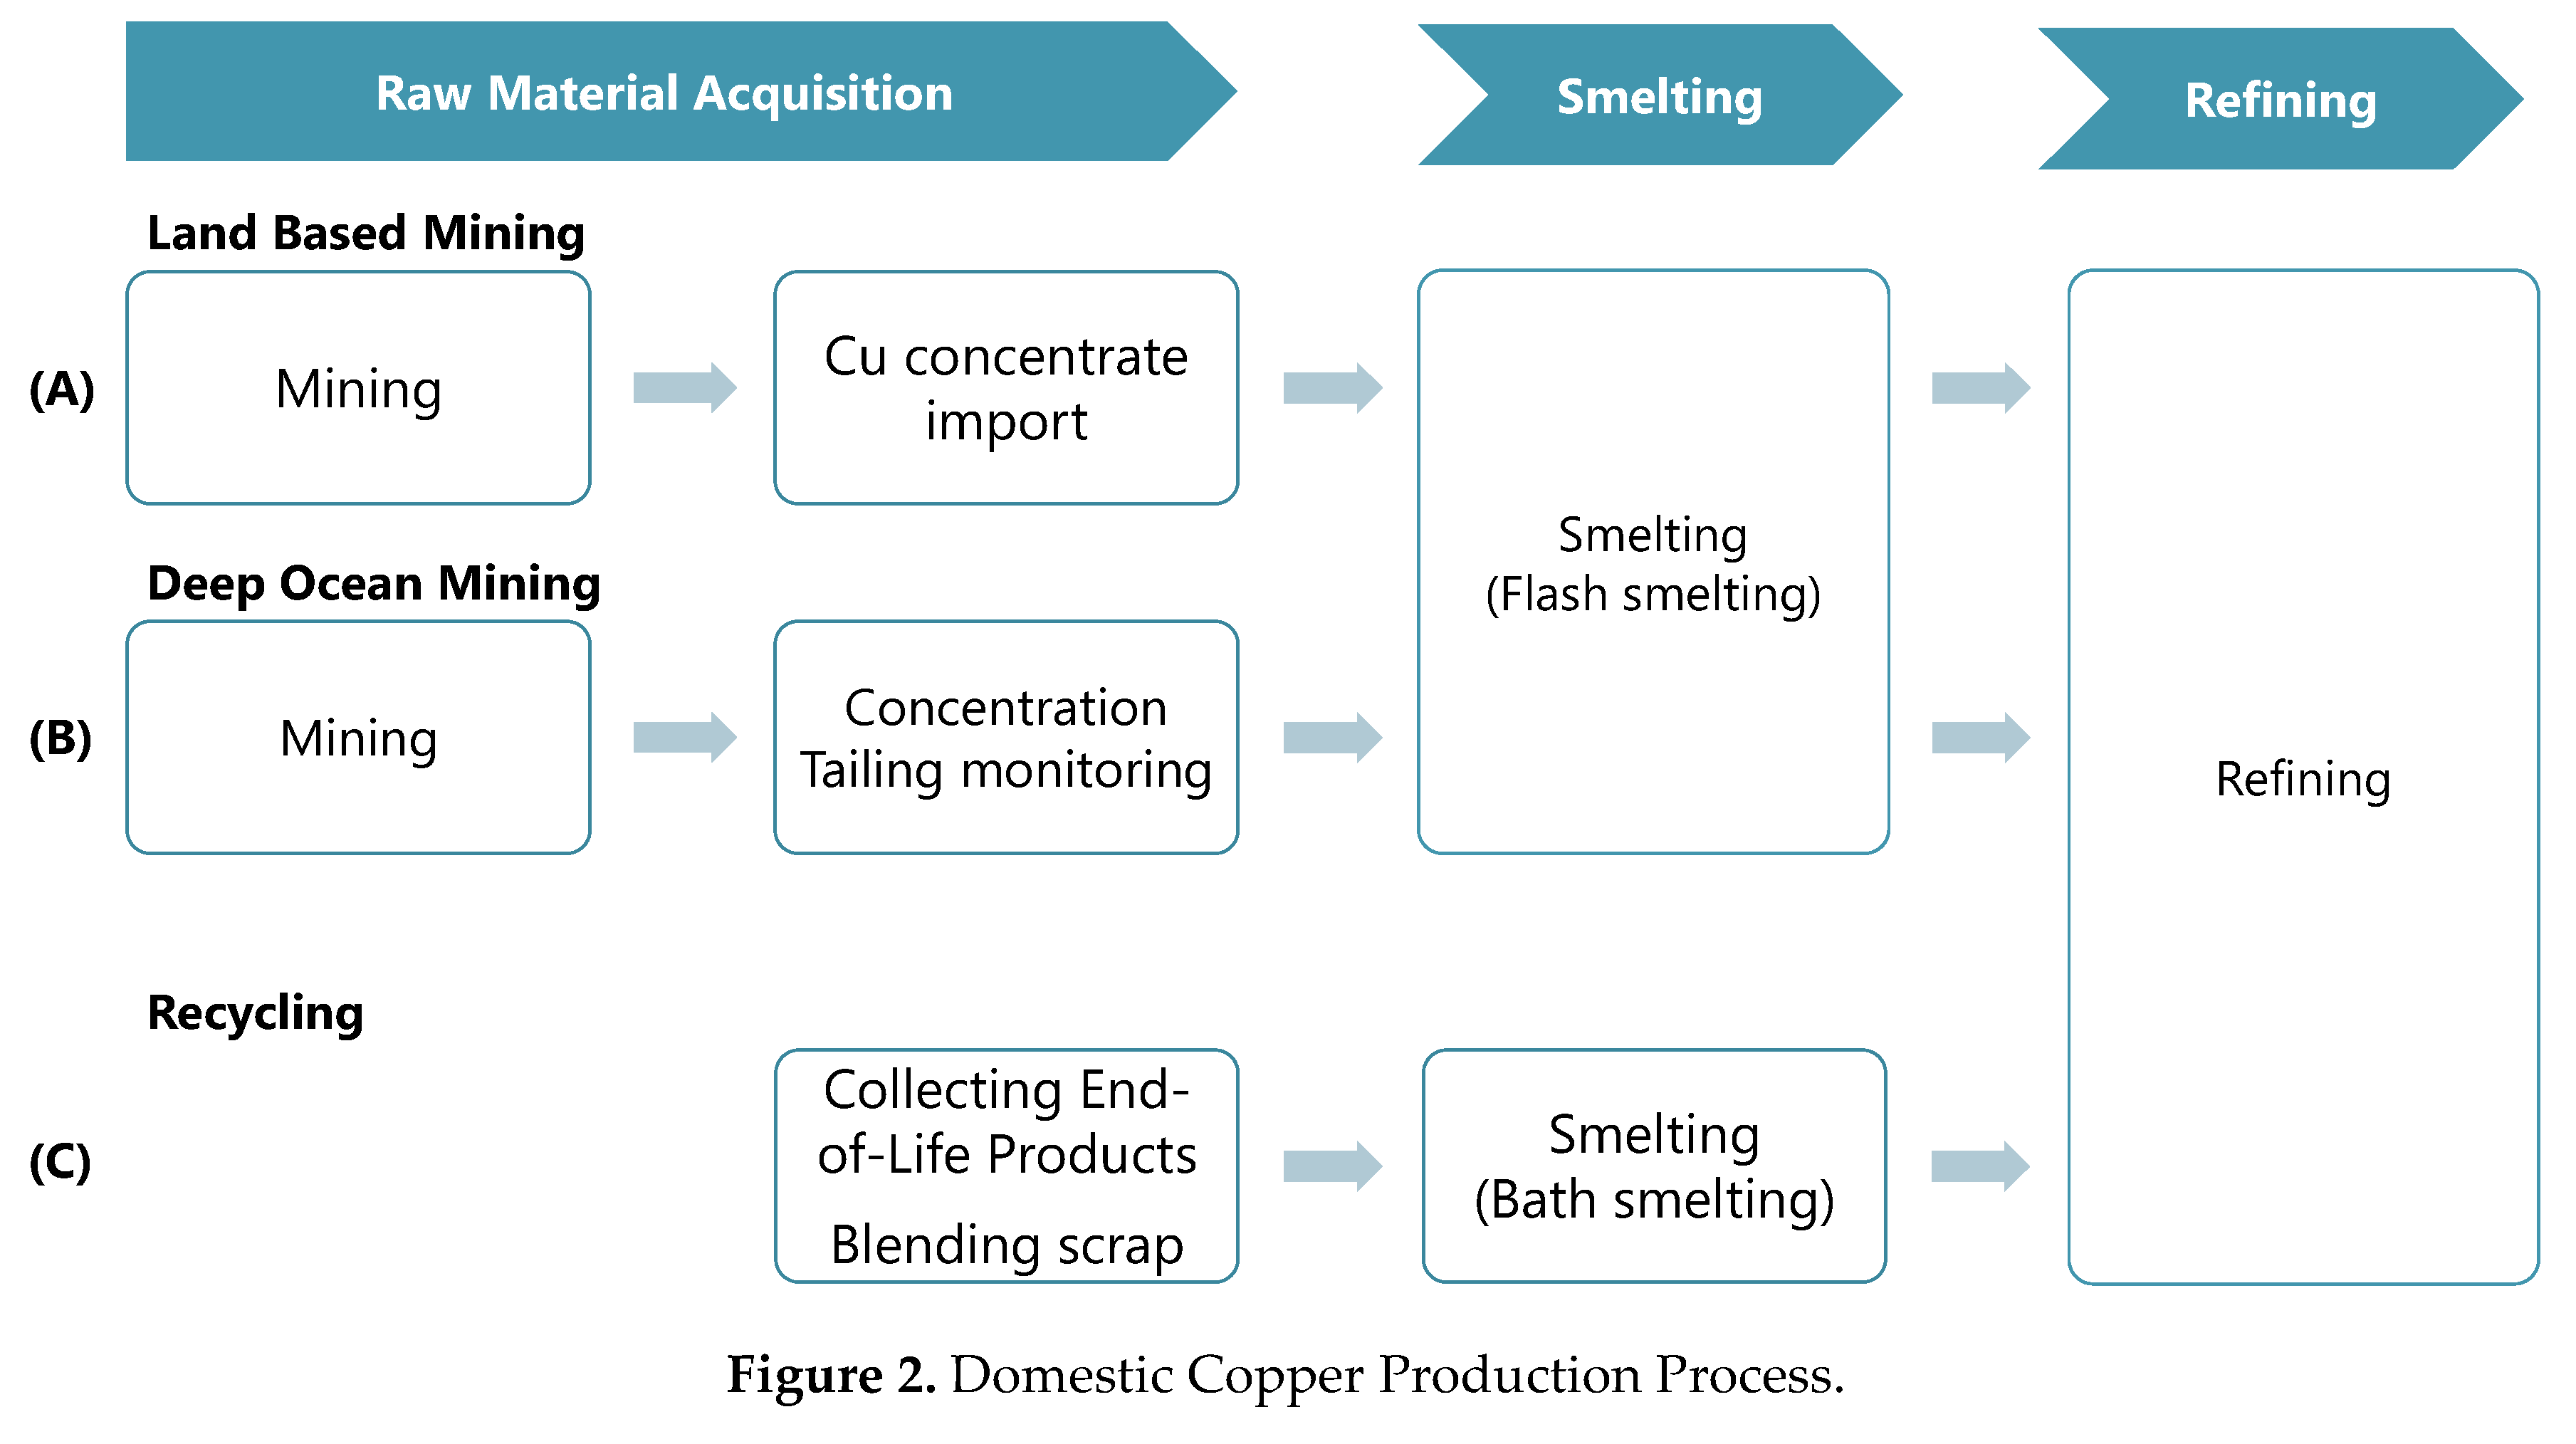
Figure 2 shows the copper processes evaluated in this study. The conventional copper process uses concentrate that is mined from land-based mines in other countries (Japanese mines are no longer operating). Concentrate is typically produced at or close to the mine site by processing the ore. Concentrate is then shipped to Japan (in this case) and electrolytic copper is produced by flash smelting and electro refining. On the contrary, deep ocean mining copper processing uses ore from the ocean around Japan (within its Exclusive Economic Zone, EEZ). Ore from the deep ocean requires concentration facilities and dams to store tailings, both of which are expected to operate domestically. Deep ocean mining and land-based mining are assumed to use the same type of facilities for smelting and refining. The recycling process for copper requires end-of-life products as raw material. End-of-life product is defined as end-of-life households’ electrical and electronic equipment in this article. Since the composition of raw materials for recycling is different from primary ore, an alternative type of smelting facility has typically been used [
52]. Conventional smelters cannot typically absorb massive amount of scrap because the feed material should be very dry and fine [
52]; therefore, recycling processes use bath smelting rather than flash smelting. The recycling process requires end-of-life product collection and sorting, and in this study estimates have been made for the latter using the energy for crushing and magnetic sorting processes, which were considered to have the largest impact. The impacts of land-based mining (mining and concentration stages) in resource exporting countries are included as well. The following sections provide more detailed descriptions of each of the copper supply alternatives.
(A) Conventional Process (CONV)
The conventional copper production process used for comparison here is from mining to electro-refining using a flash furnace and converting furnace. Although the energy and material consumed in Japan is only considered to be from transportation to refining, the impacts of mining and concentration processes are also evaluated for comparison with deep ocean mining. The distance between resource exporting countries and Japan is the total copper content weighted average of distances from major ports in source countries and is based on Japan’s imports from 2017 [
53]. Electricity usage in mining, CO
2 emissions intensity in mining and concentration processes are based on a Chilean case in this study, since Chile shares 44% on a mass basis, and 38% on a monetary basis of Japanese copper concentrate imports in 2017 [
38]. Summary data for the conventional process route are shown in
Table 1.
It should be noted that energy for crushing is generally included in the concentration process, but in deep ocean mining it is categorized as a mining process, as most crushing is done on the seafloor. This leads to some difference when comparing on a stage-by-stage basis but does not affect the overall values.
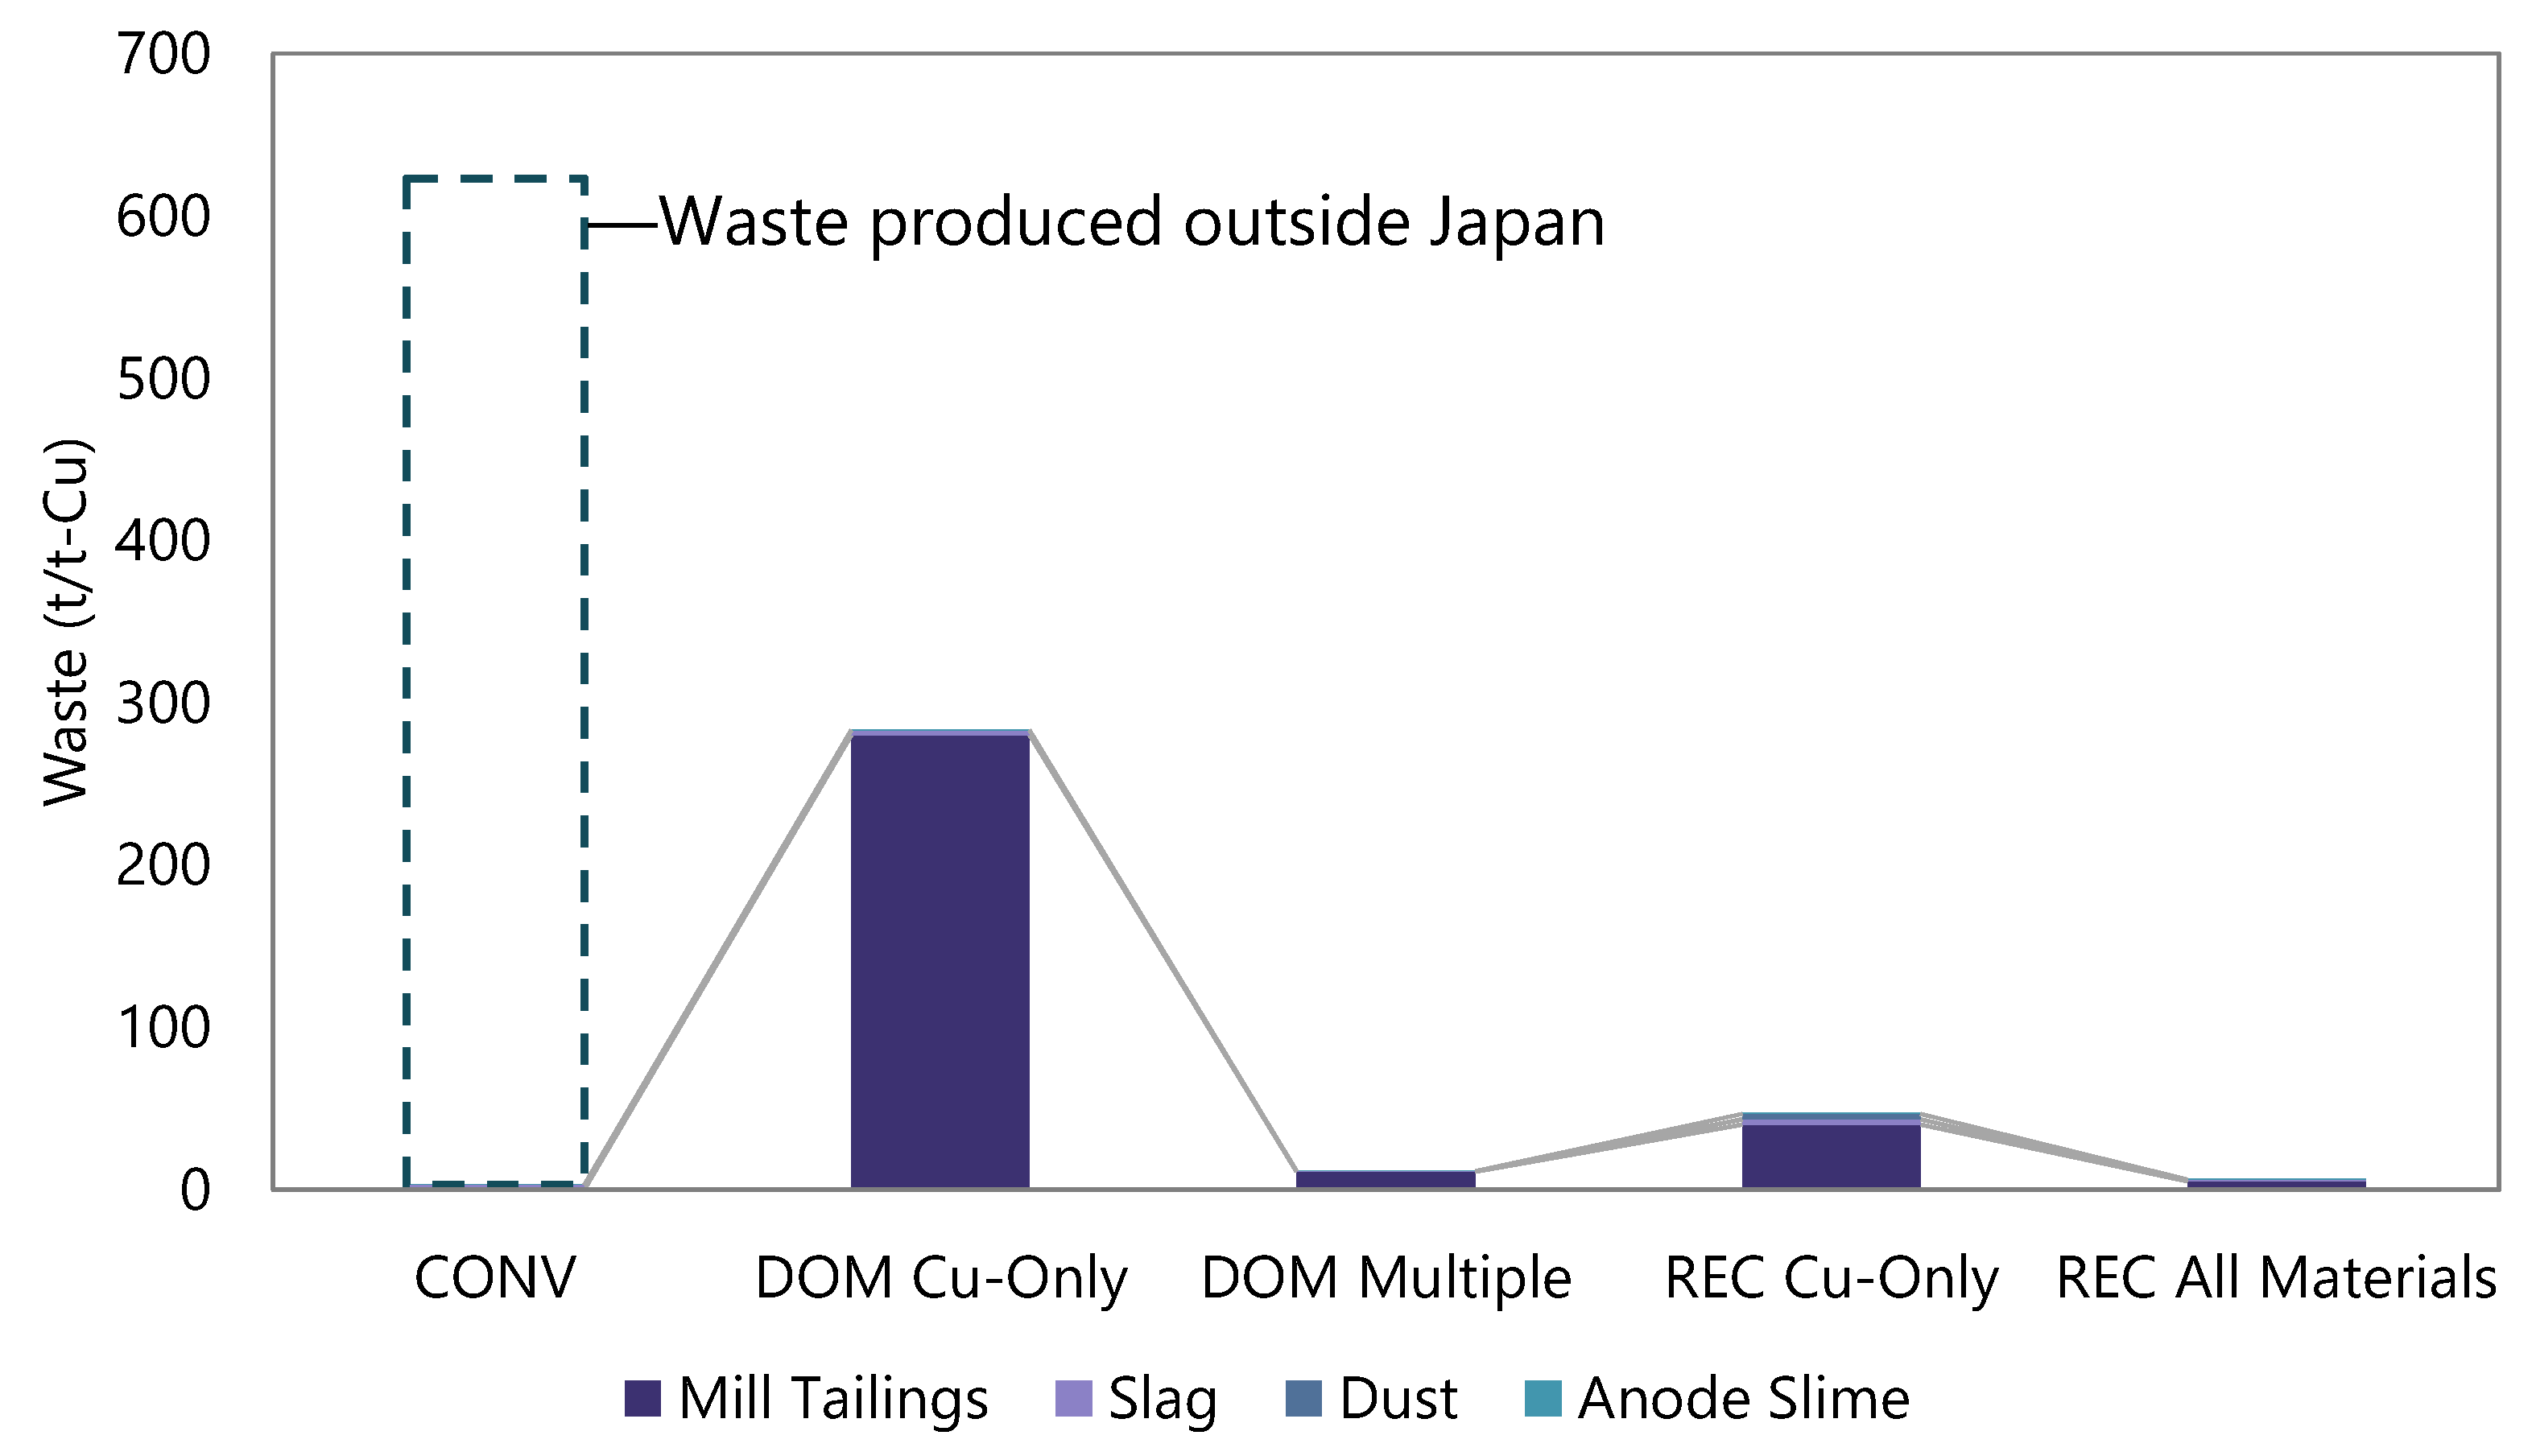
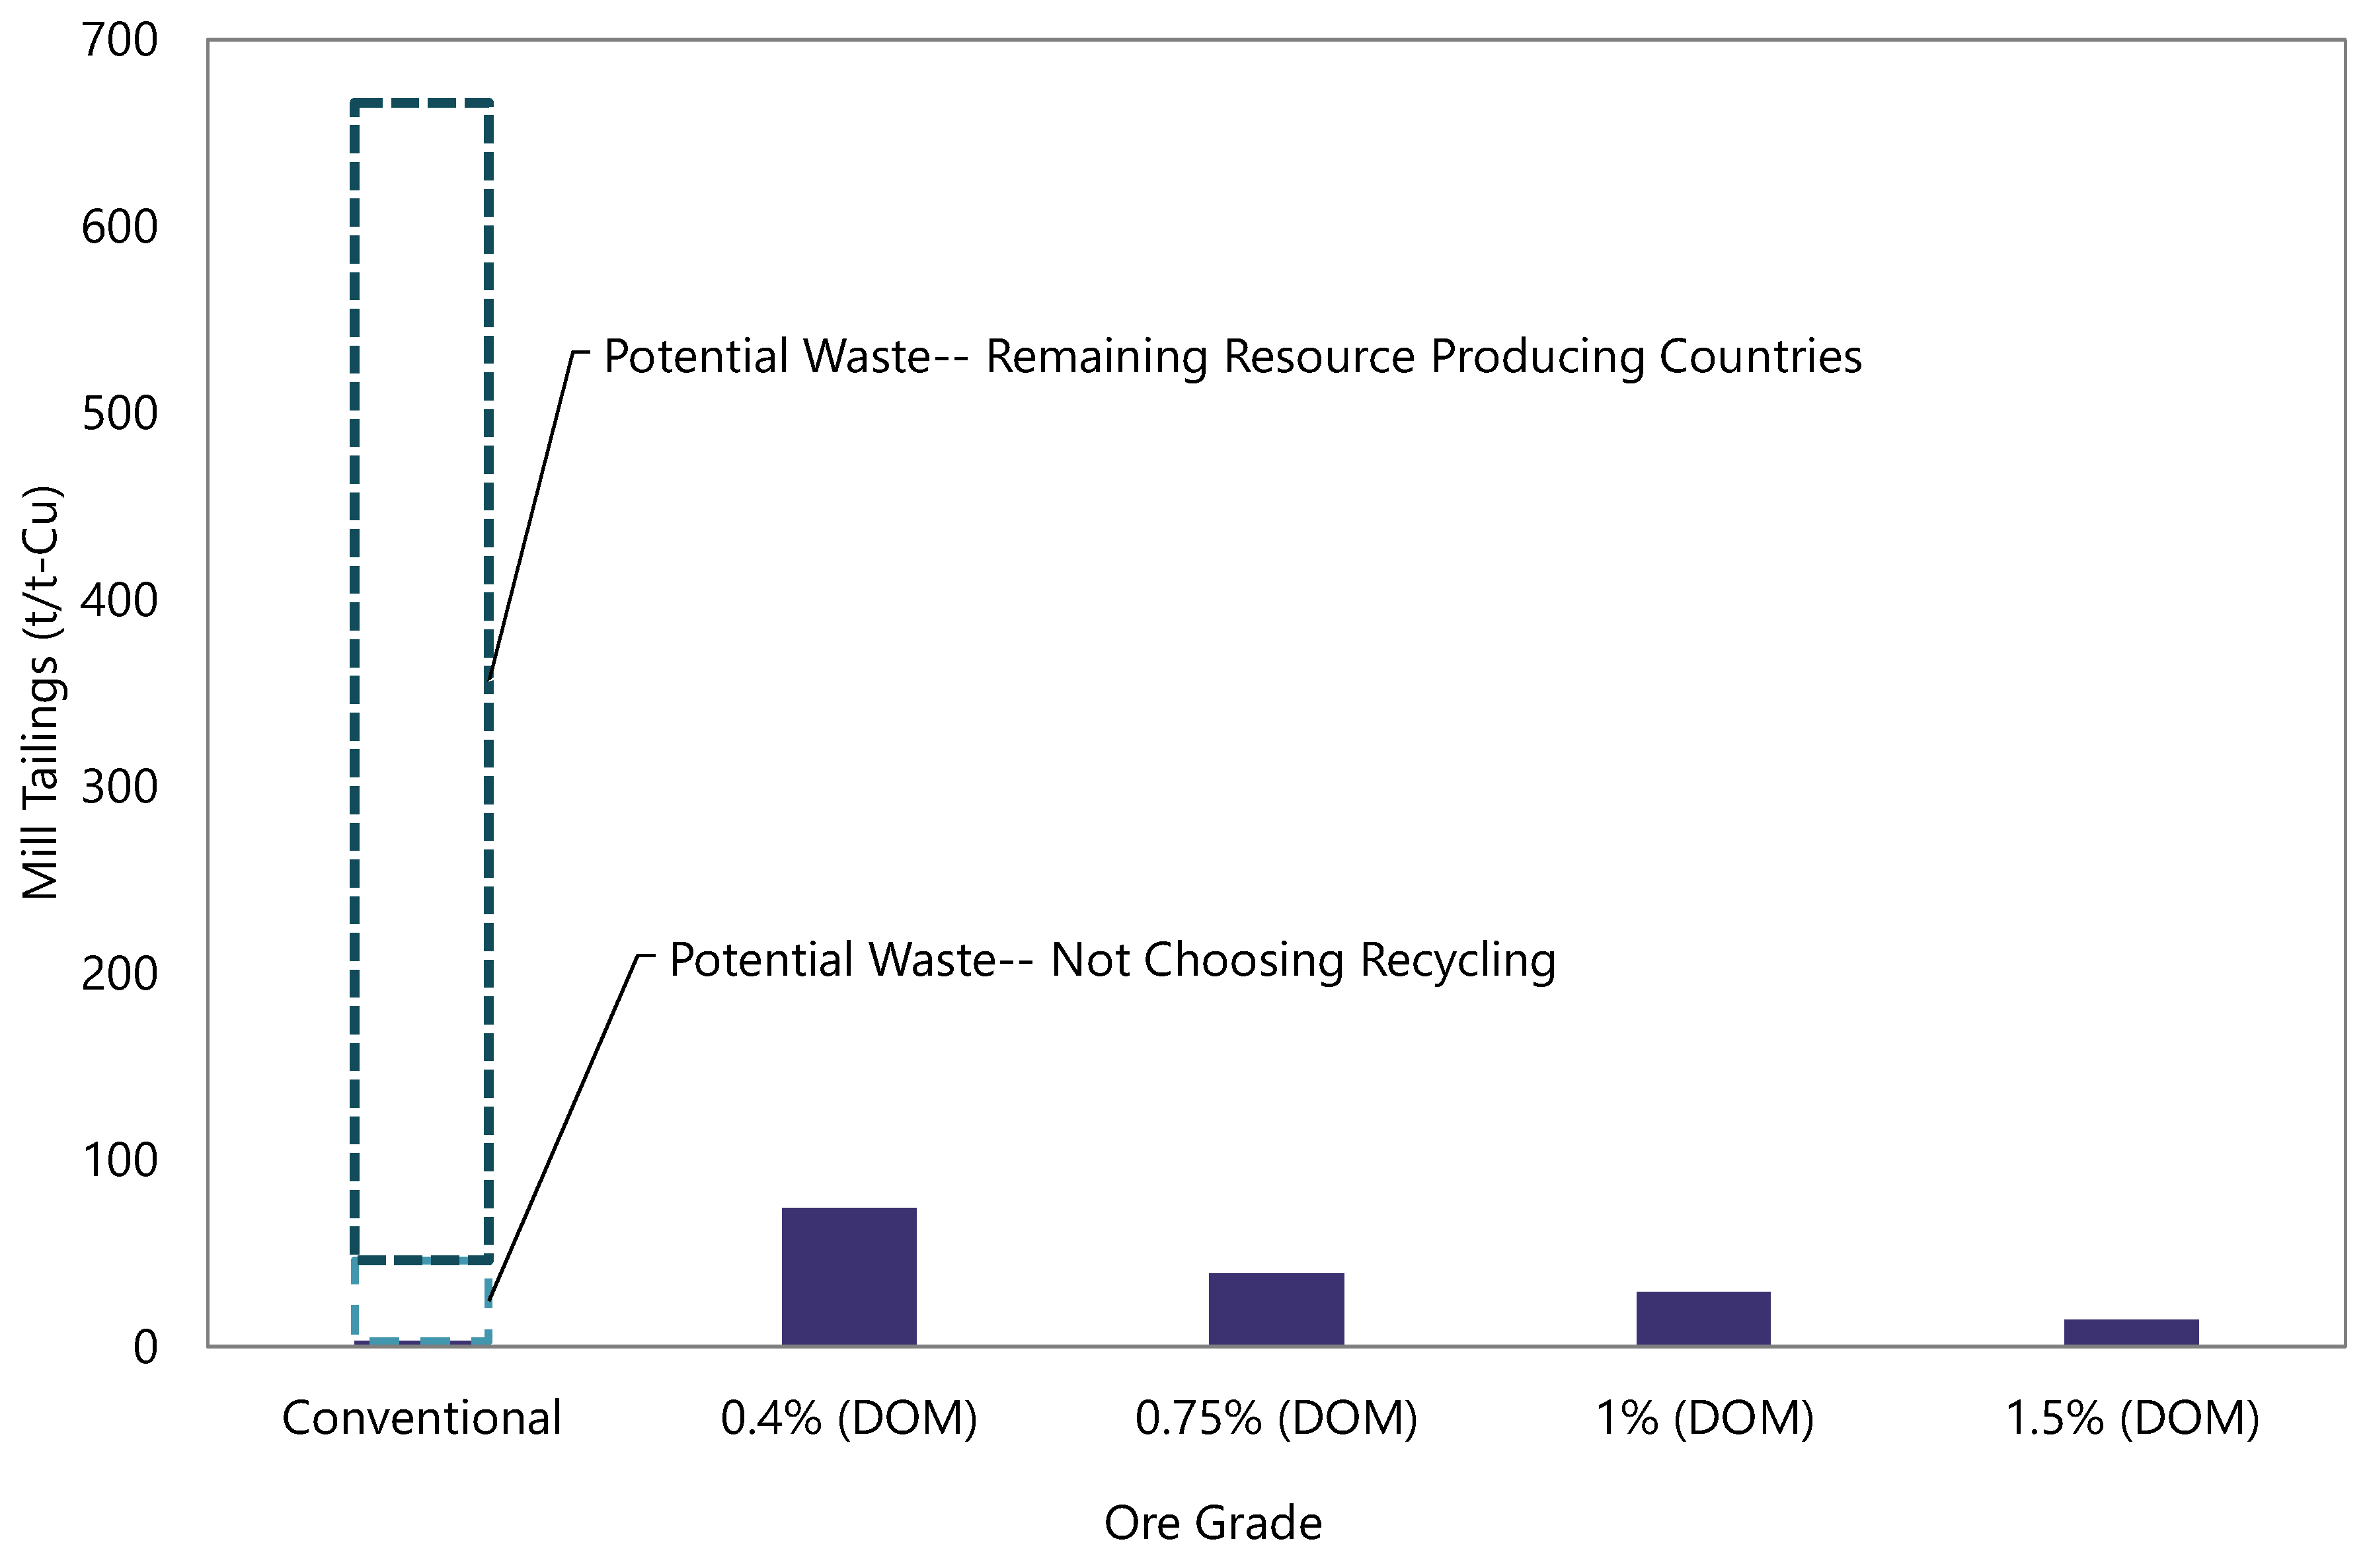
Waste from the conventional mining and concentration process, which is produced outside Japan, can be estimated by the following equations [
17]. On the basis of 1 tonne of unmined ore;
where
W is the stripping ratio,
RM is the recovery rate for mining,
GO is ore grade,
RC is recovery rate for concentration,
GC is the concentrate grade. These parameters are determined from reference [
17].
(B) Deep Ocean Mining (DOM)
Deep ocean mining will provide virgin material from seafloor massive sulfide (SMS) ore, with initial focus on deposits within Japan’s EEZ. The ore produced by deep ocean mining will then be beneficiated and processed through to metal in Japan.
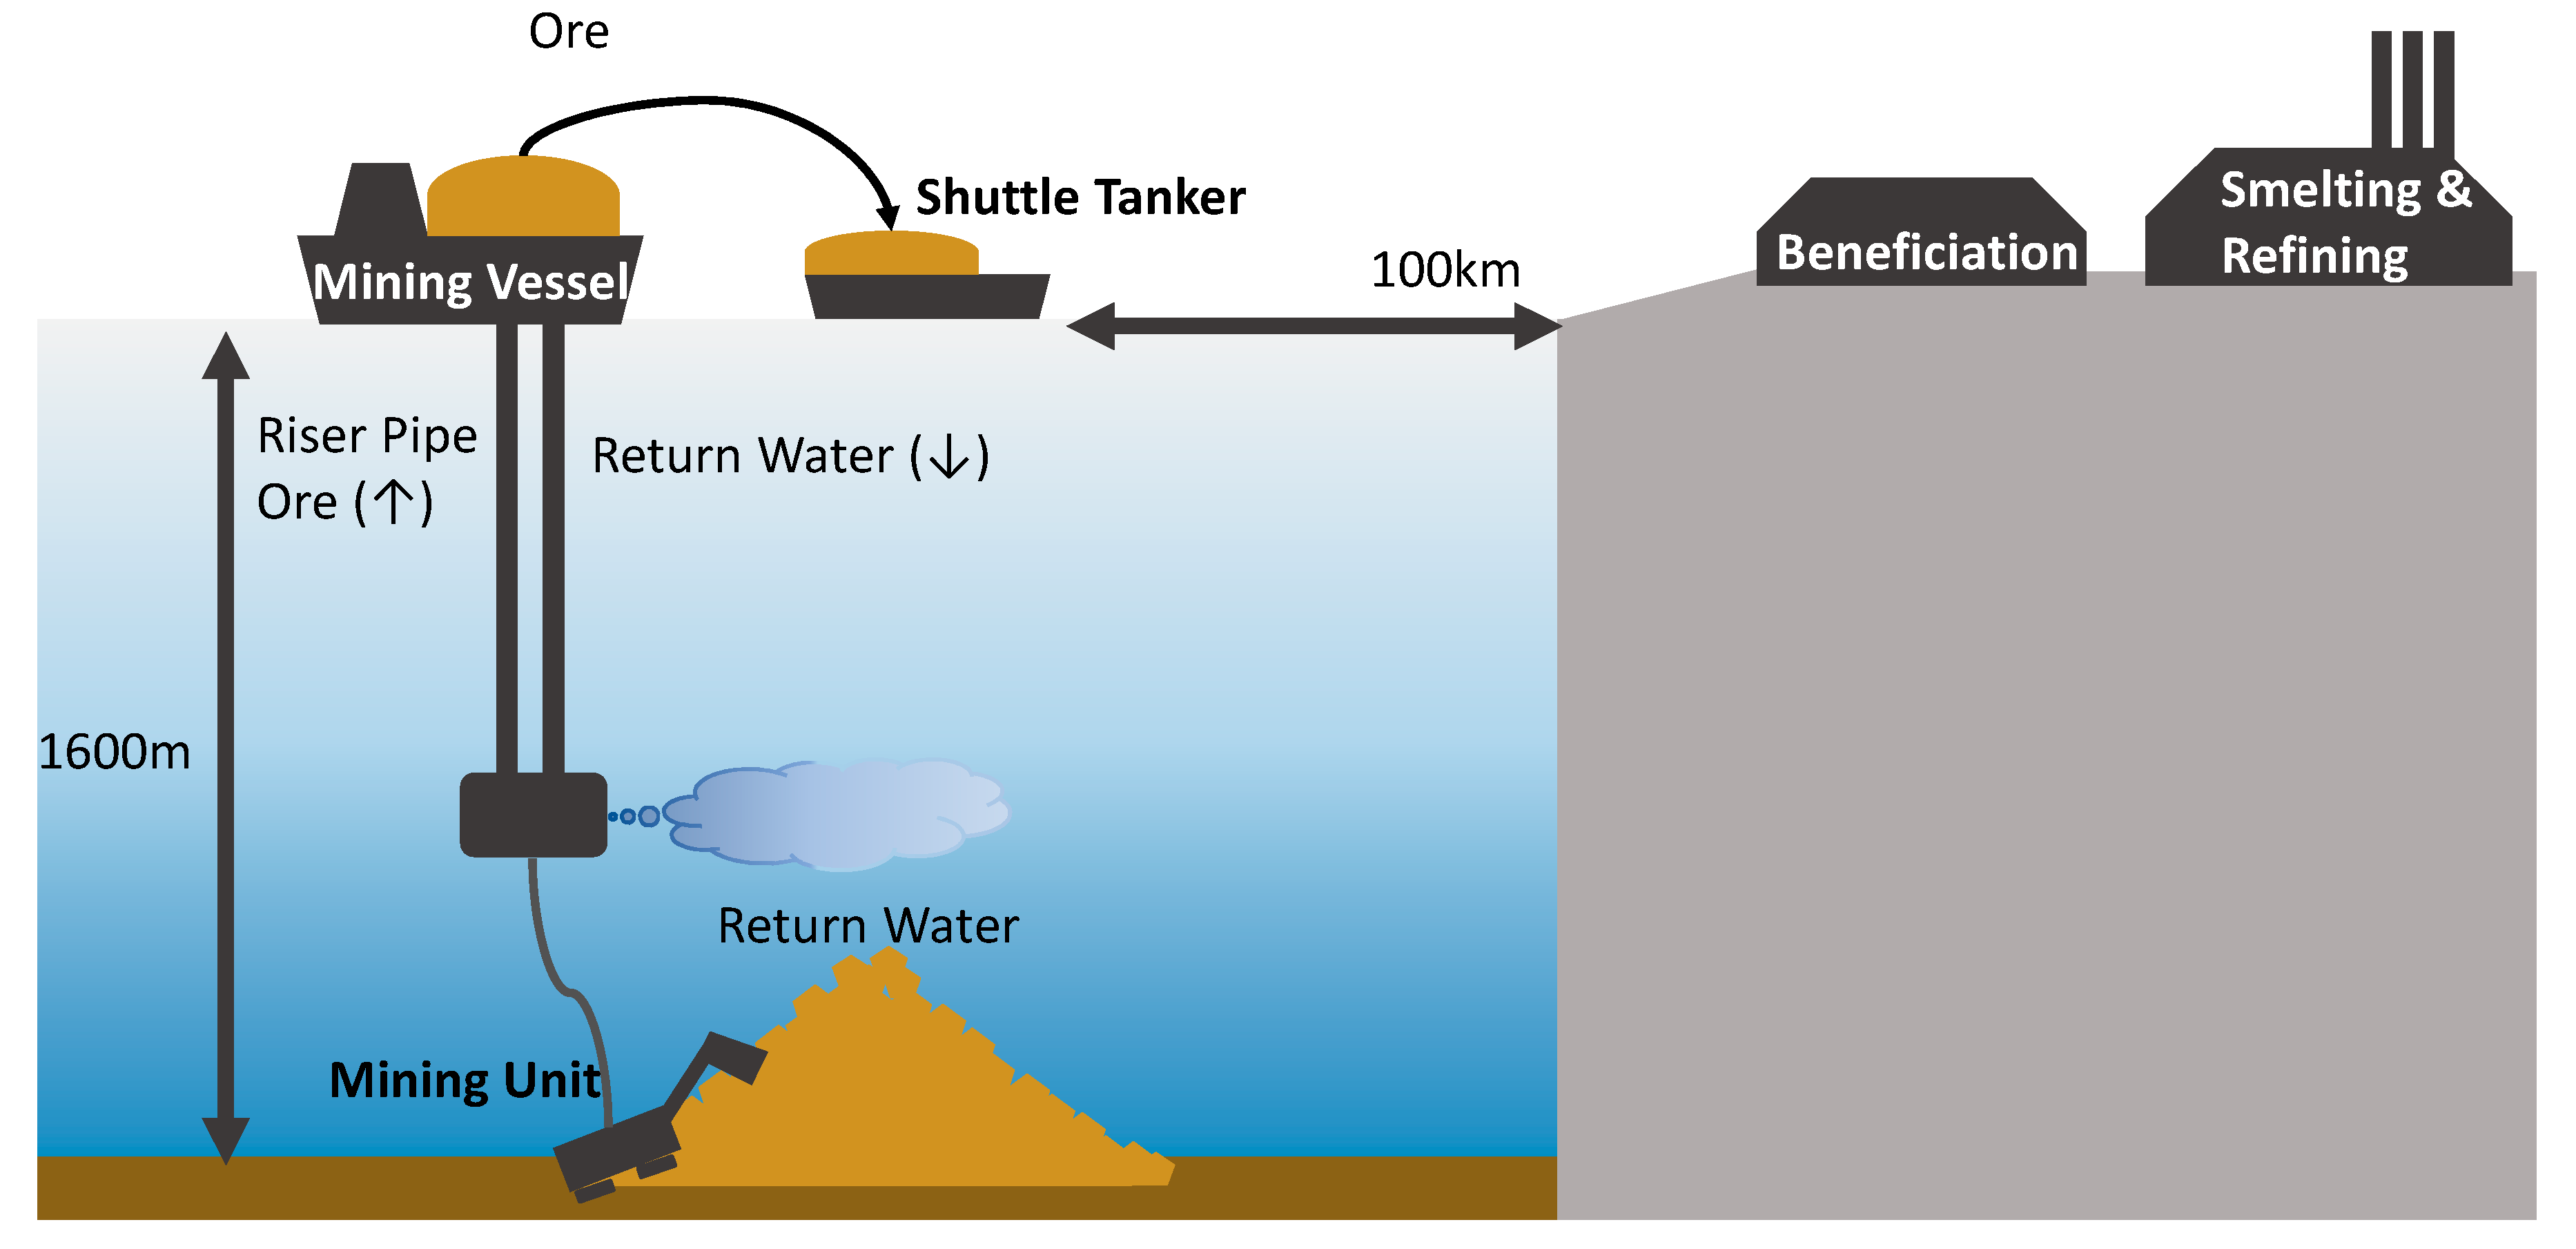
Figure 3 shows the deep ocean mining process considered in this study, which is modelled on the basis of examples from the Agency for Natural Resources and Energy [
59]. The SMS deposit lies at a depth of 1600 m of water [
59]. Ore is mined by a mining unit, crushed and lifted to the surface through a riser pipe. On the mining vessel, ore is dewatered and transferred to a shuttle tanker. Dewatered ore is shipped to a concentration facility where copper concentrate is produced. Copper concentrate is then shipped to the smelting and refining facility and cathode copper is produced. Transportation between the concentration plant and smelting/refining plant is not considered in this study, as the locations are not certain. Water lifted up to the mining vessel with the ore is returned to the deep ocean as return water. Deep ocean mining may affect marine ecosystems in a variety of ways; mining activity may disturb benthos, and return water may be hazardous to marine animals due to the content of particulates, hazardous metals and dissolved oxygen and temperature differences that may affect deep water life [
60,
61,
62]. However, these impacts are extremely different to quantify, as well as being very location-specific, making comparison with onshore mining difficult. This study therefore focuses on quantifiable global environmental impacts.
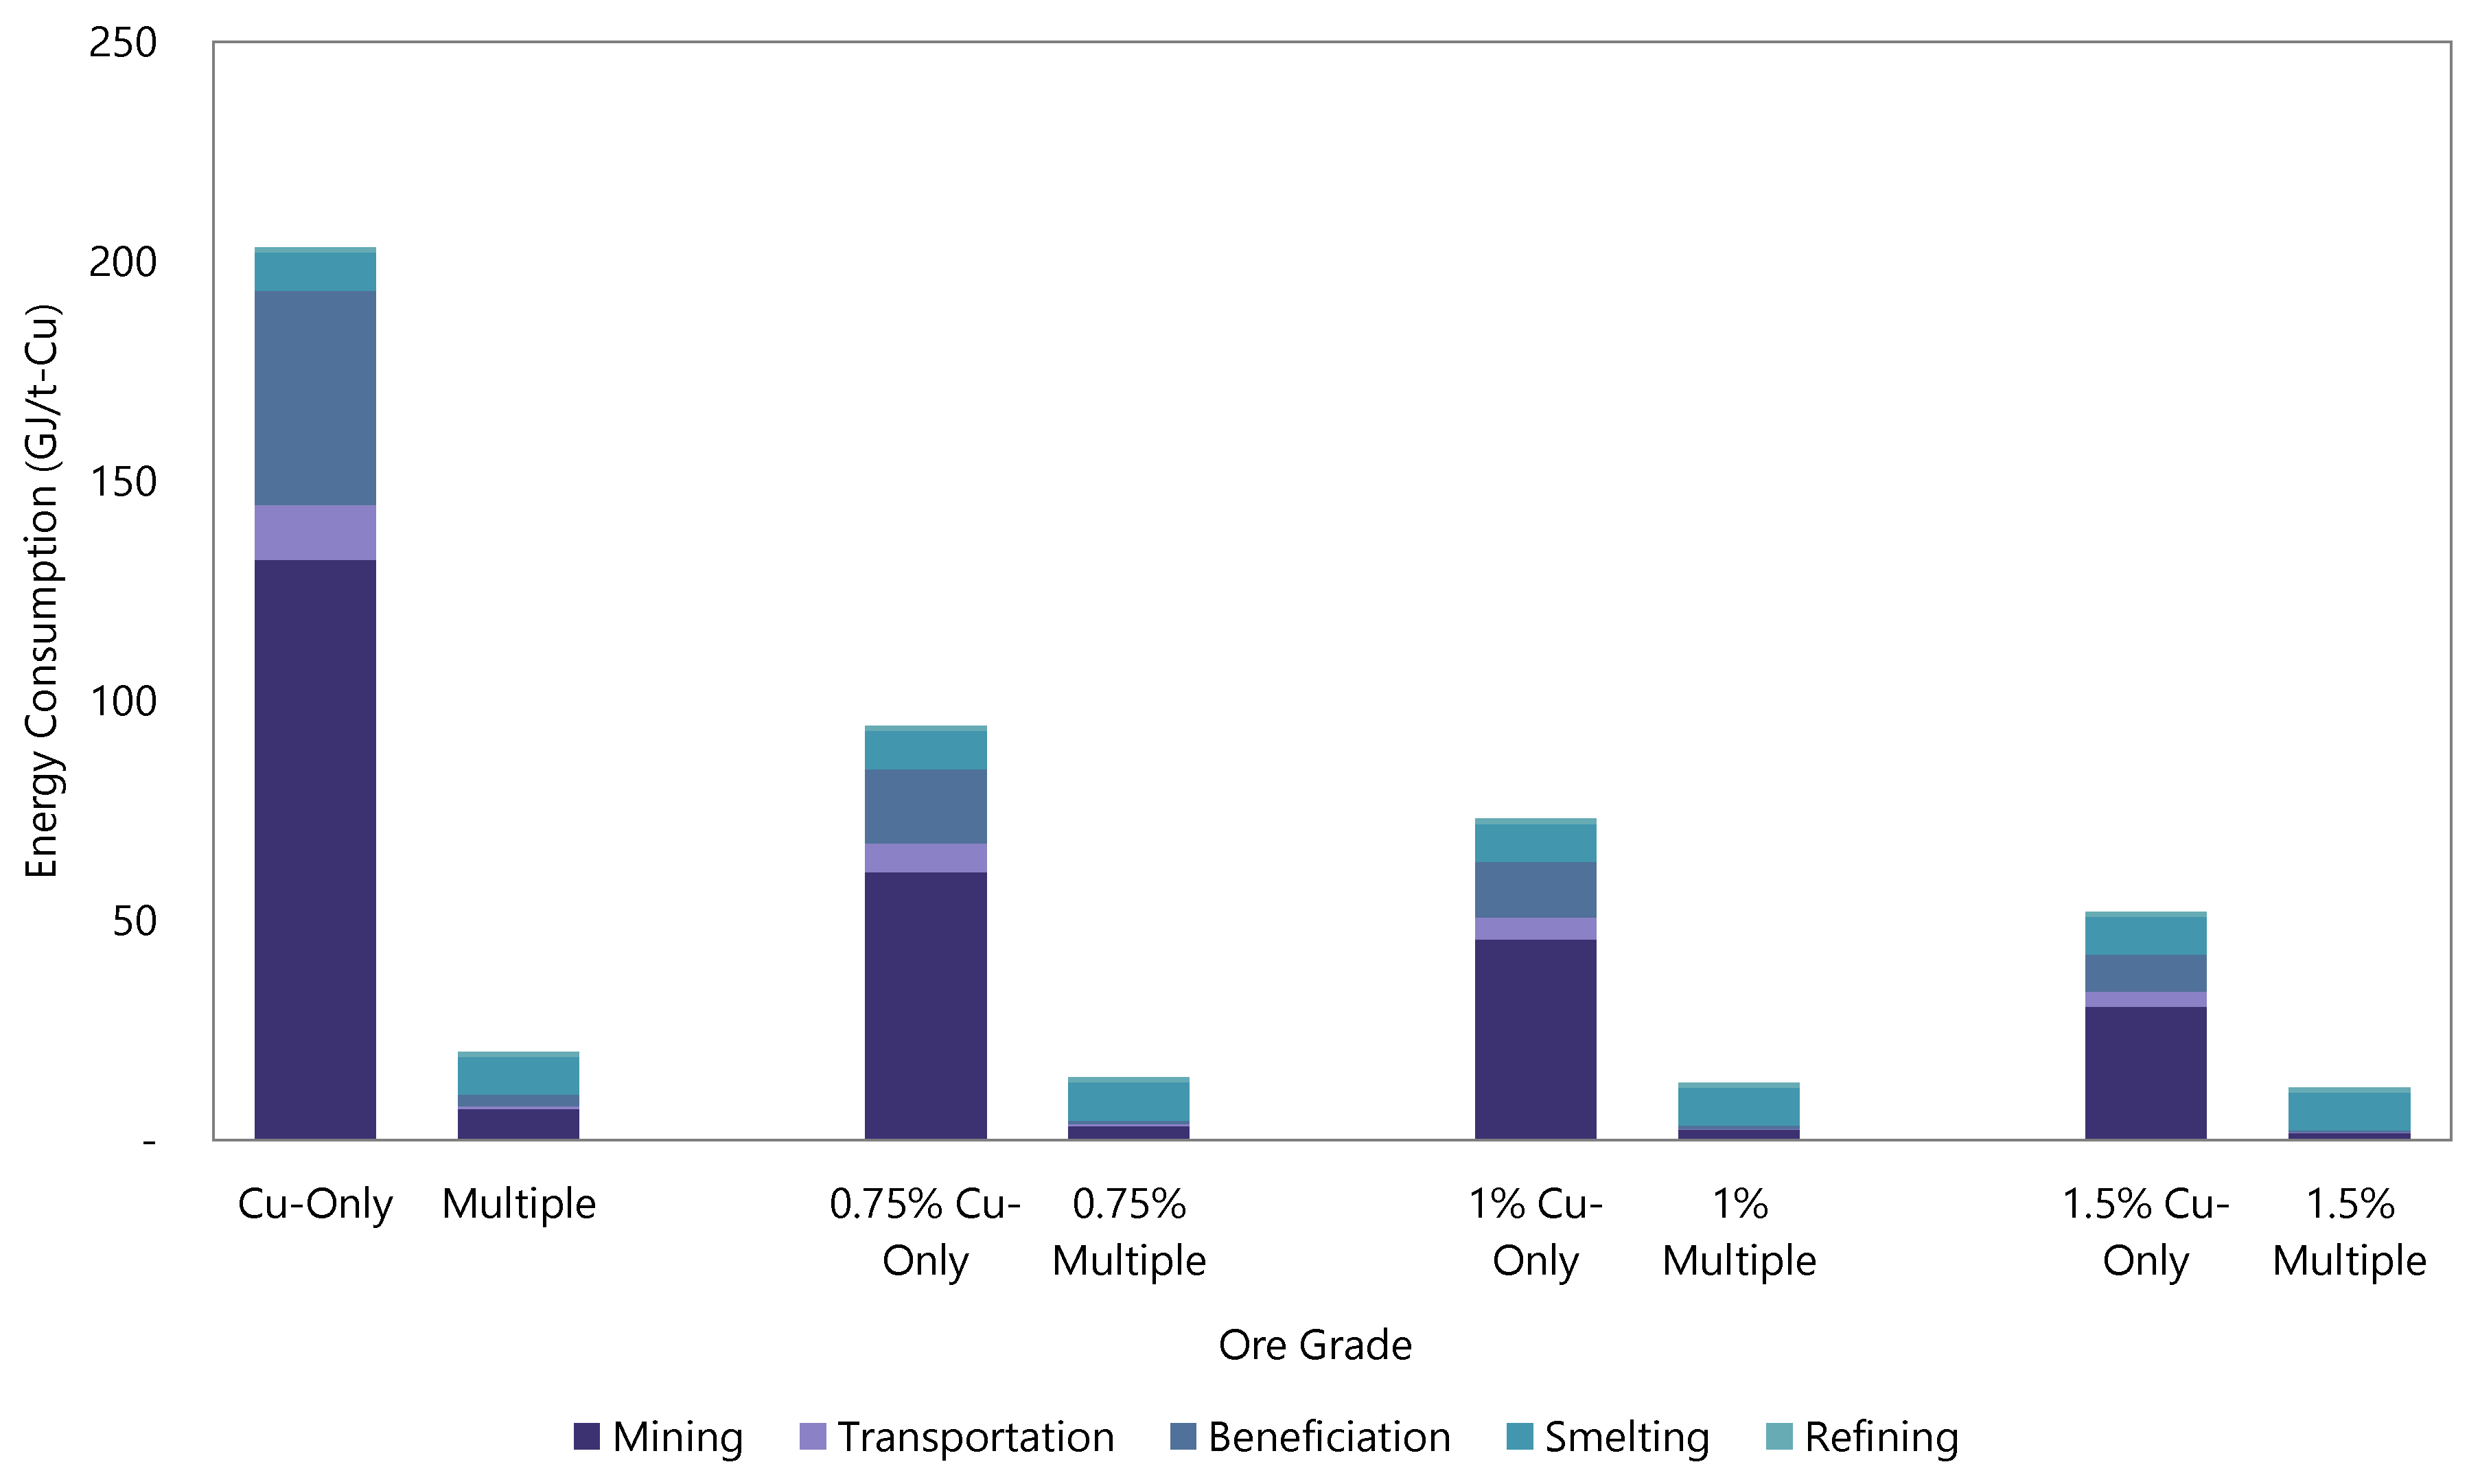
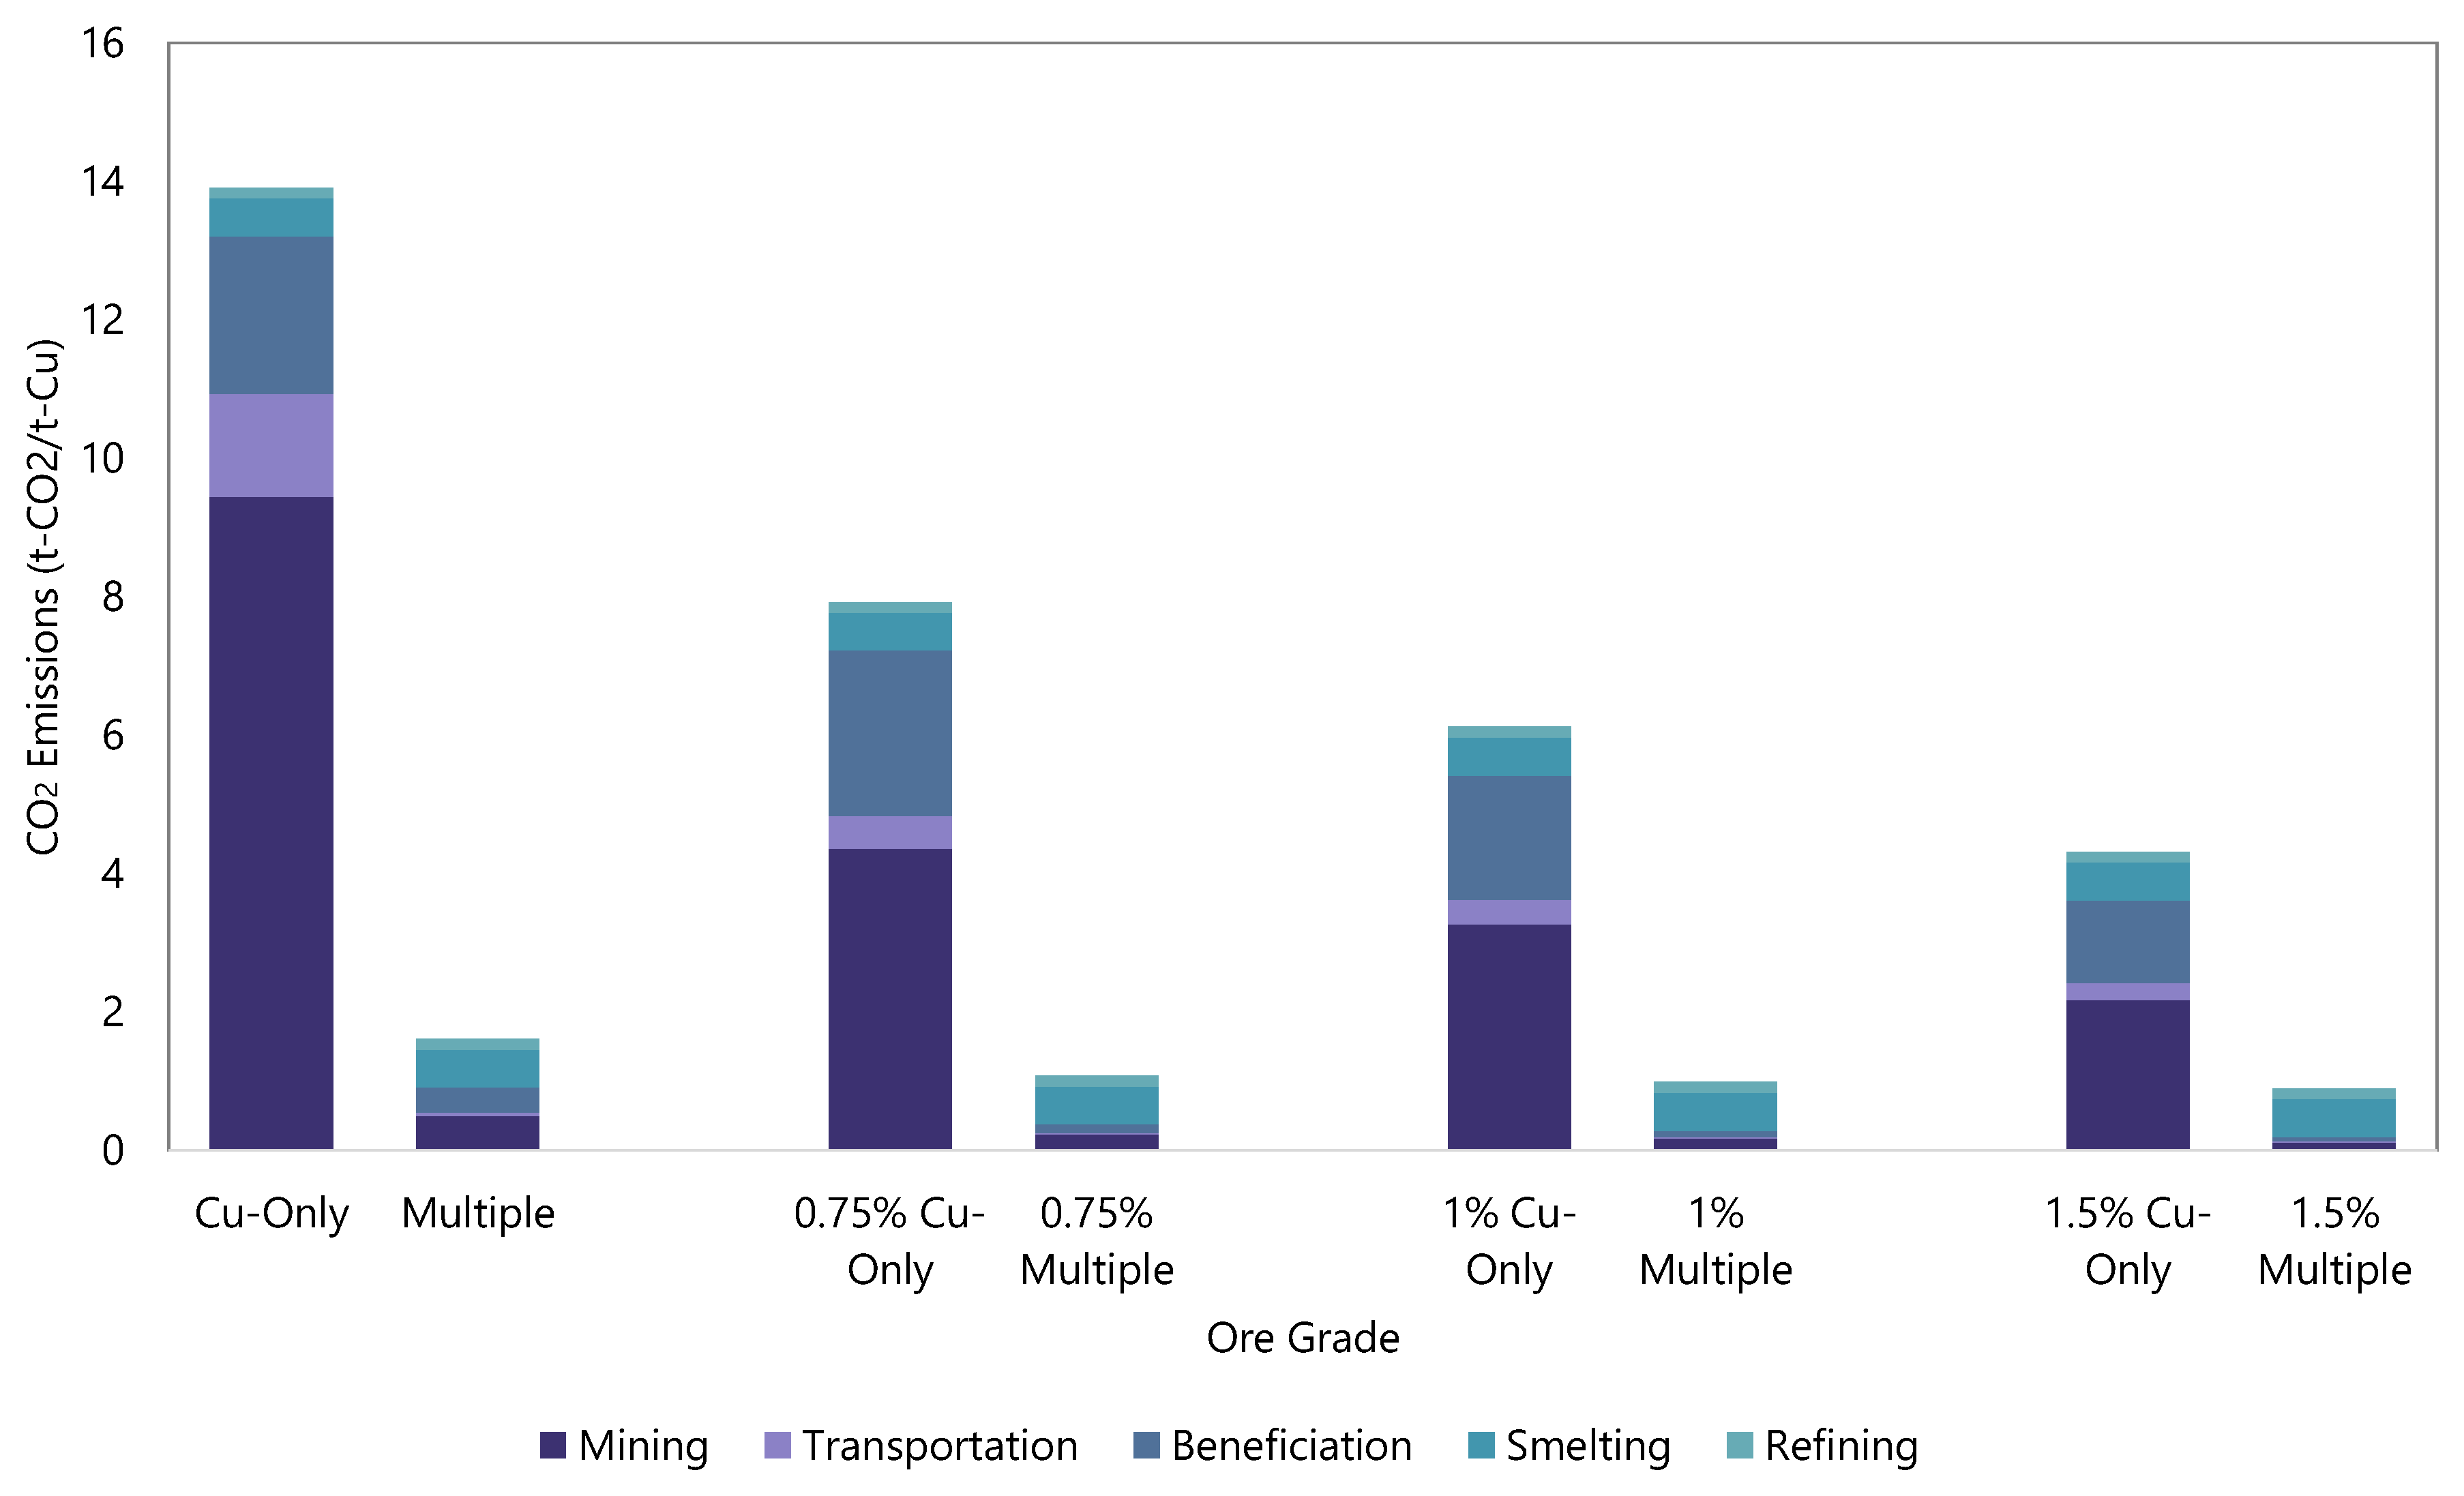
As SMS deposits are polymetallic, it is possible that mining can be specifically for copper recovery or for multiple mineral recovery—in fact, in many cases copper is more likely to be a coproduct. This article focuses on copper production, but we consider the allocation of mining and other processing activities that are shared across various potential mineral streams as per standard LCA procedures. In the ‘DOM Cu-Only’ case, all the impacts (energy consumed, etc.) are allocated to copper recovery, with no other metals assumed to be produced. This applies to the energy for mining, and transportation, as from concentration onwards, the energy for each metal is for dedicated processes so there is no need to consider allocation. In the smelting and refining stages, by-products produced from copper concentrate are produced (including other base metals as well as minor elements and slag). These are potentially of commercial interest, but are not considered as main product streams in this study, where the value of recovered metals is used, it is only for the purpose of allocation of shared processing stages. In the ‘DOM Multiple’ case, copper is produced in conjunction with zinc and lead as shown in
Table 2. Energy for mining and transportation, and wastes are allocated according to mass balance. Energy for smelting and refining is also allocated considering by-products.
In both cases, energy for concentration is estimated as being composed of two parts: grinding and froth flotation. Energy for grinding can be estimated by using the Bond work index of 13.9 kwh/t-ore. This index is estimated as the average of the work index of grinding ores which contain pyrite, sphalerite and galena previously produced in Japan, and which have been considered to be similar to deep ocean sulfide ores [
63]. Feed size and product size are 40 mm and 5 μm, respectively [
64]. Froth flotation is assumed to consume 7.5 kwh/t-ore [
27].
Ore from the deep ocean will be processed in pyro-metallurgical process plants which already exist in Japan. On the other hand, mining and concentration processes require new facilities since base metal mining ended decades ago in Japan. Reference data were obtained from literature [
27,
34,
55,
57,
59,
65].
Table 2 shows the energy requirement for concentration processes for deep ocean mining in this study. It should be noted that the literature on which this is based uses an initial copper ore grade of 0.5% although the actual surveyed DOM ore grade is closer to 0.4%. It is assumed that the energy requirement is not significantly different between 0.4% and 0.5%.
(C) Recycling (REC)
Materials considered for recycling in this study are copper scrap obtained from end-of-life home appliances. In this article, in order to avoid degradation of the quality of copper produced, all materials are processed to make copper cathode. No brass or wire will be produced in this recycling process. Product-to-product type recycling, or component reuse, is also not considered. The process flow is shown in
Figure 1. In order to give a fair comparison, collection of end-of-life products through to refining copper is included. Data for the industrial processing steps are obtained from references [
66,
67,
68].
Table 3 lists the materials and assumptions used to estimate the material flows in the recycling process.
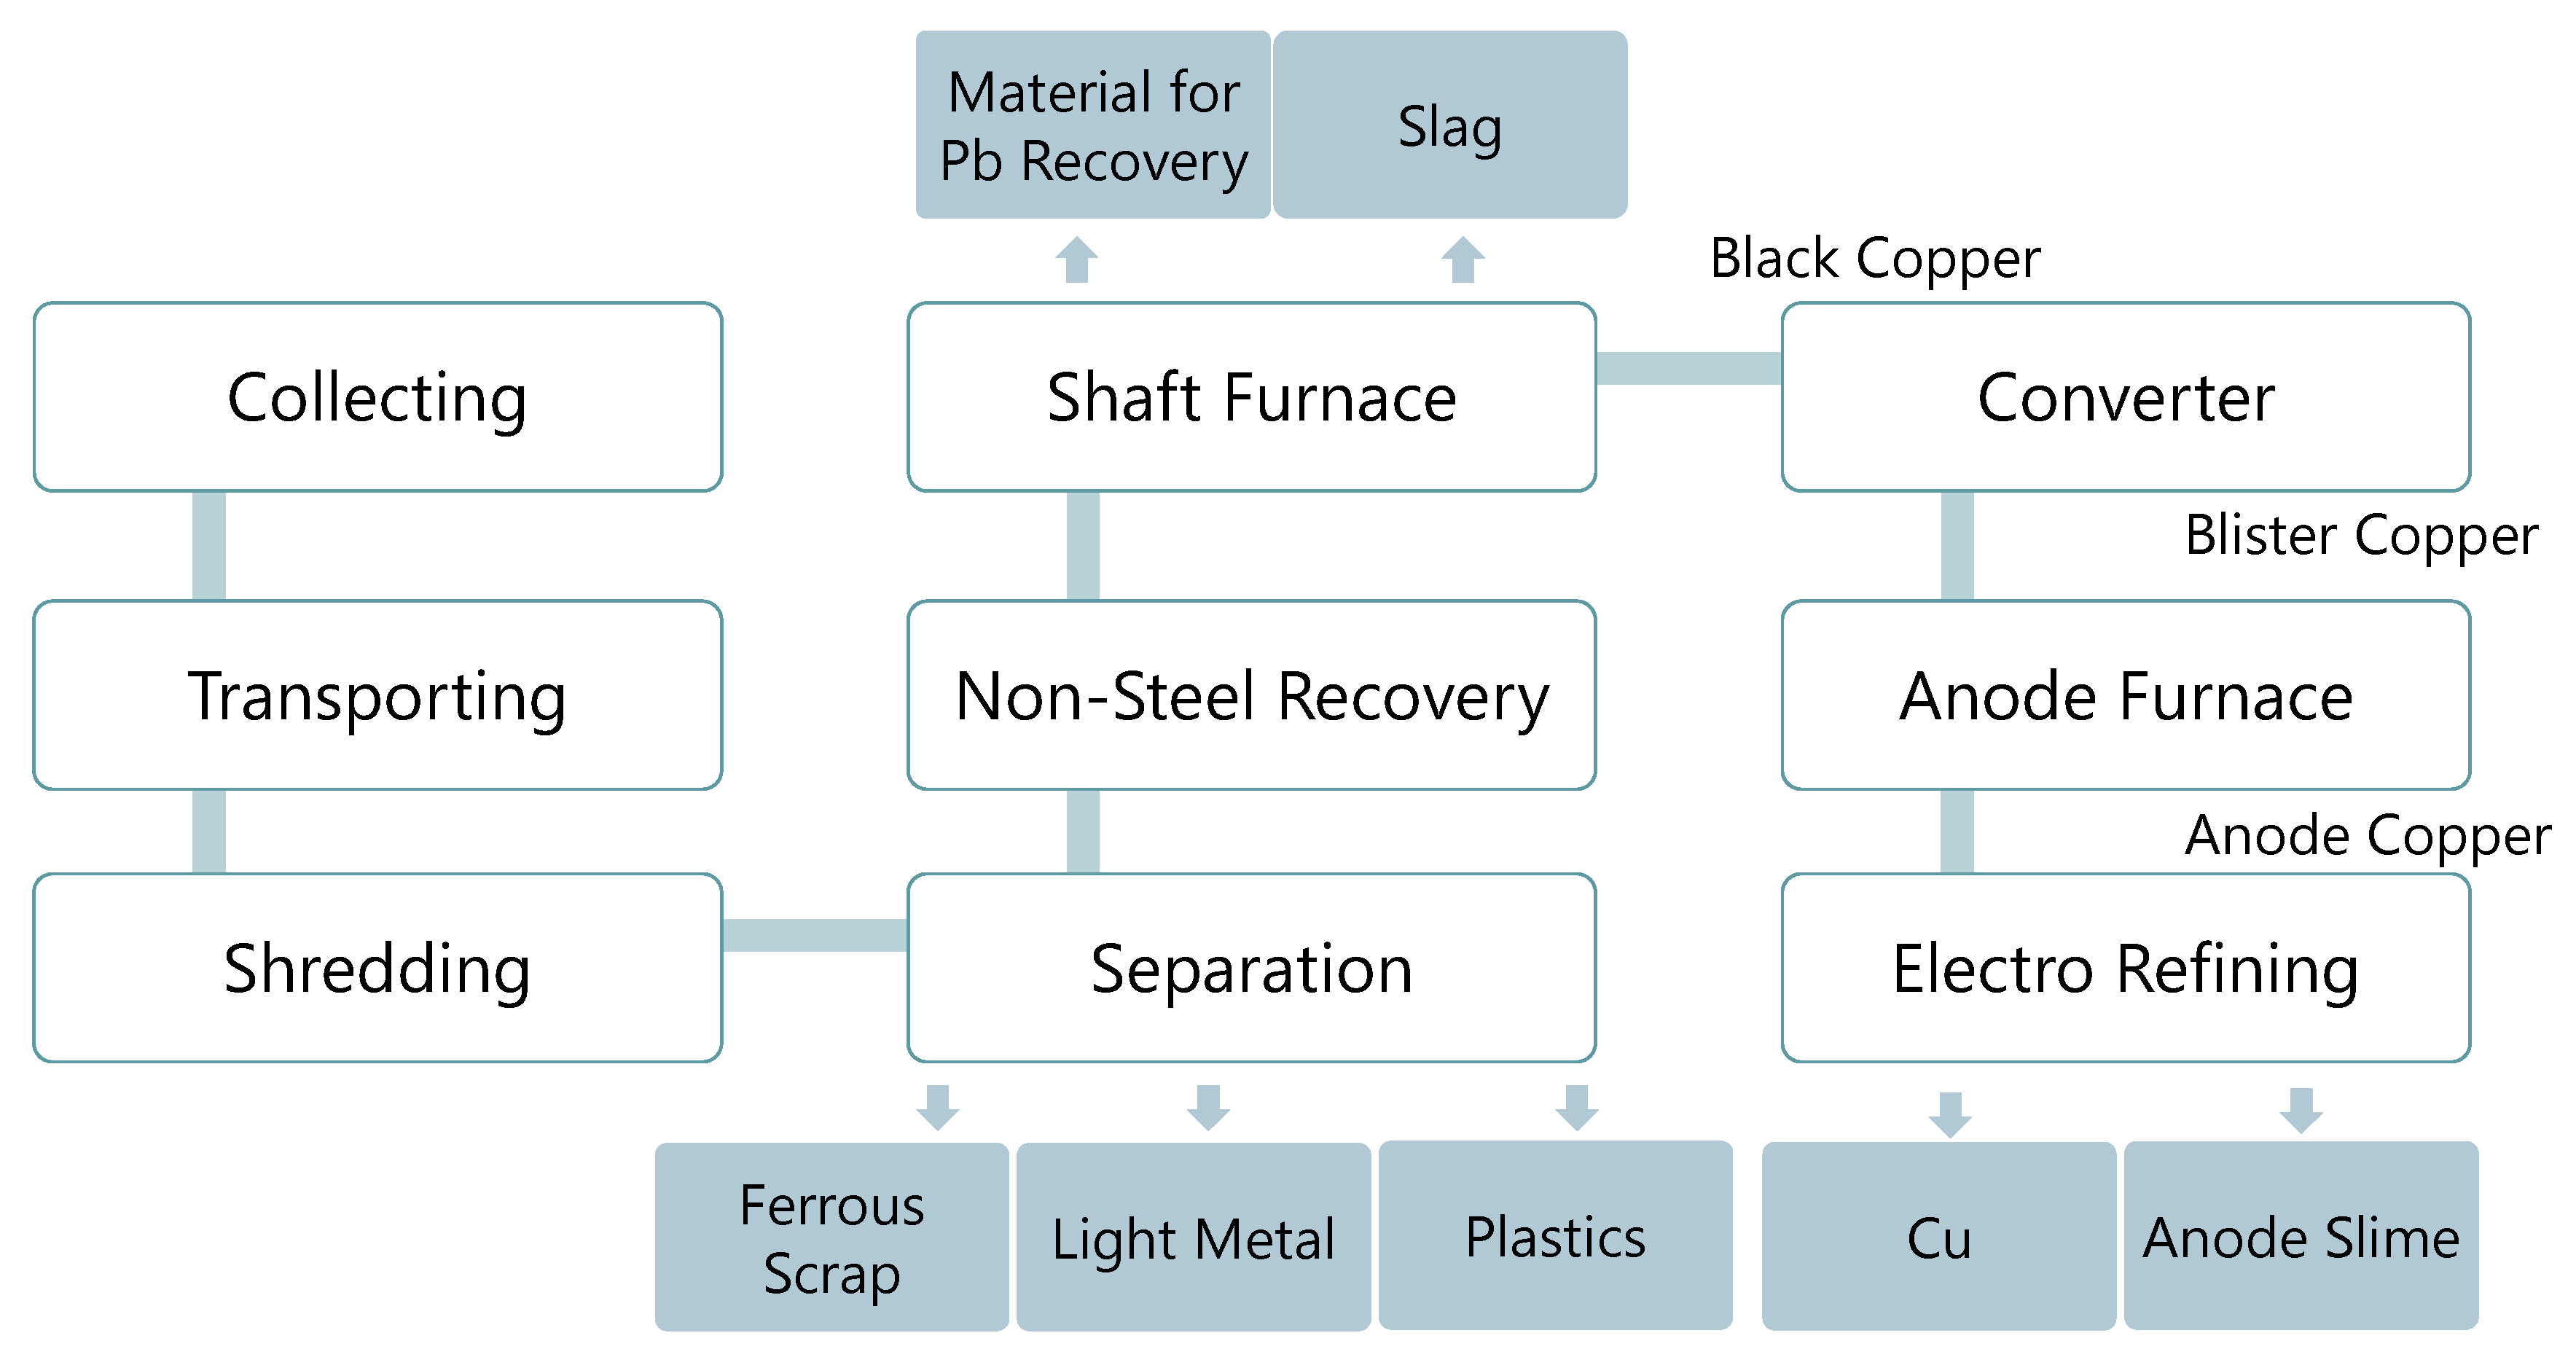
Figure 4 shows the recycling process modelled in this study. End-of-life products are assumed to be collected as follows: end-of-life products will be brought in by consumers to household appliance retail stores around Japan. Retailers will then transport these items to the closest smelter where they are recycled to produce electric copper. This process flow is similar to the practical recycling process that operates under extended producer responsibility regulations in Japan. The smelting facility information is acquired from corporate websites [
69,
70,
71,
72,
73,
74,
75]. The smelting facilities are not always copper smelters, but are treated as such for the initial estimation. In real recycling processes, separation is an important component in ensuring quality and in terms of the energy and labor costs associated with the recycling process. According to the Ministry of Environment, end-of-life products contain a large amount of steel [
67]. To remove steel from scrap, magnetic separation process is applied. Then non-ferrous metals and plastics are separated by air separation. Finally, light metals such as aluminum and heavy metals such as copper are separated by density separation [
68]. Although the data in this reference are for construction and demolition waste, it is assumed that separating ferrous and non-ferrous materials use the same operations, which have been observed at recycling facilities.
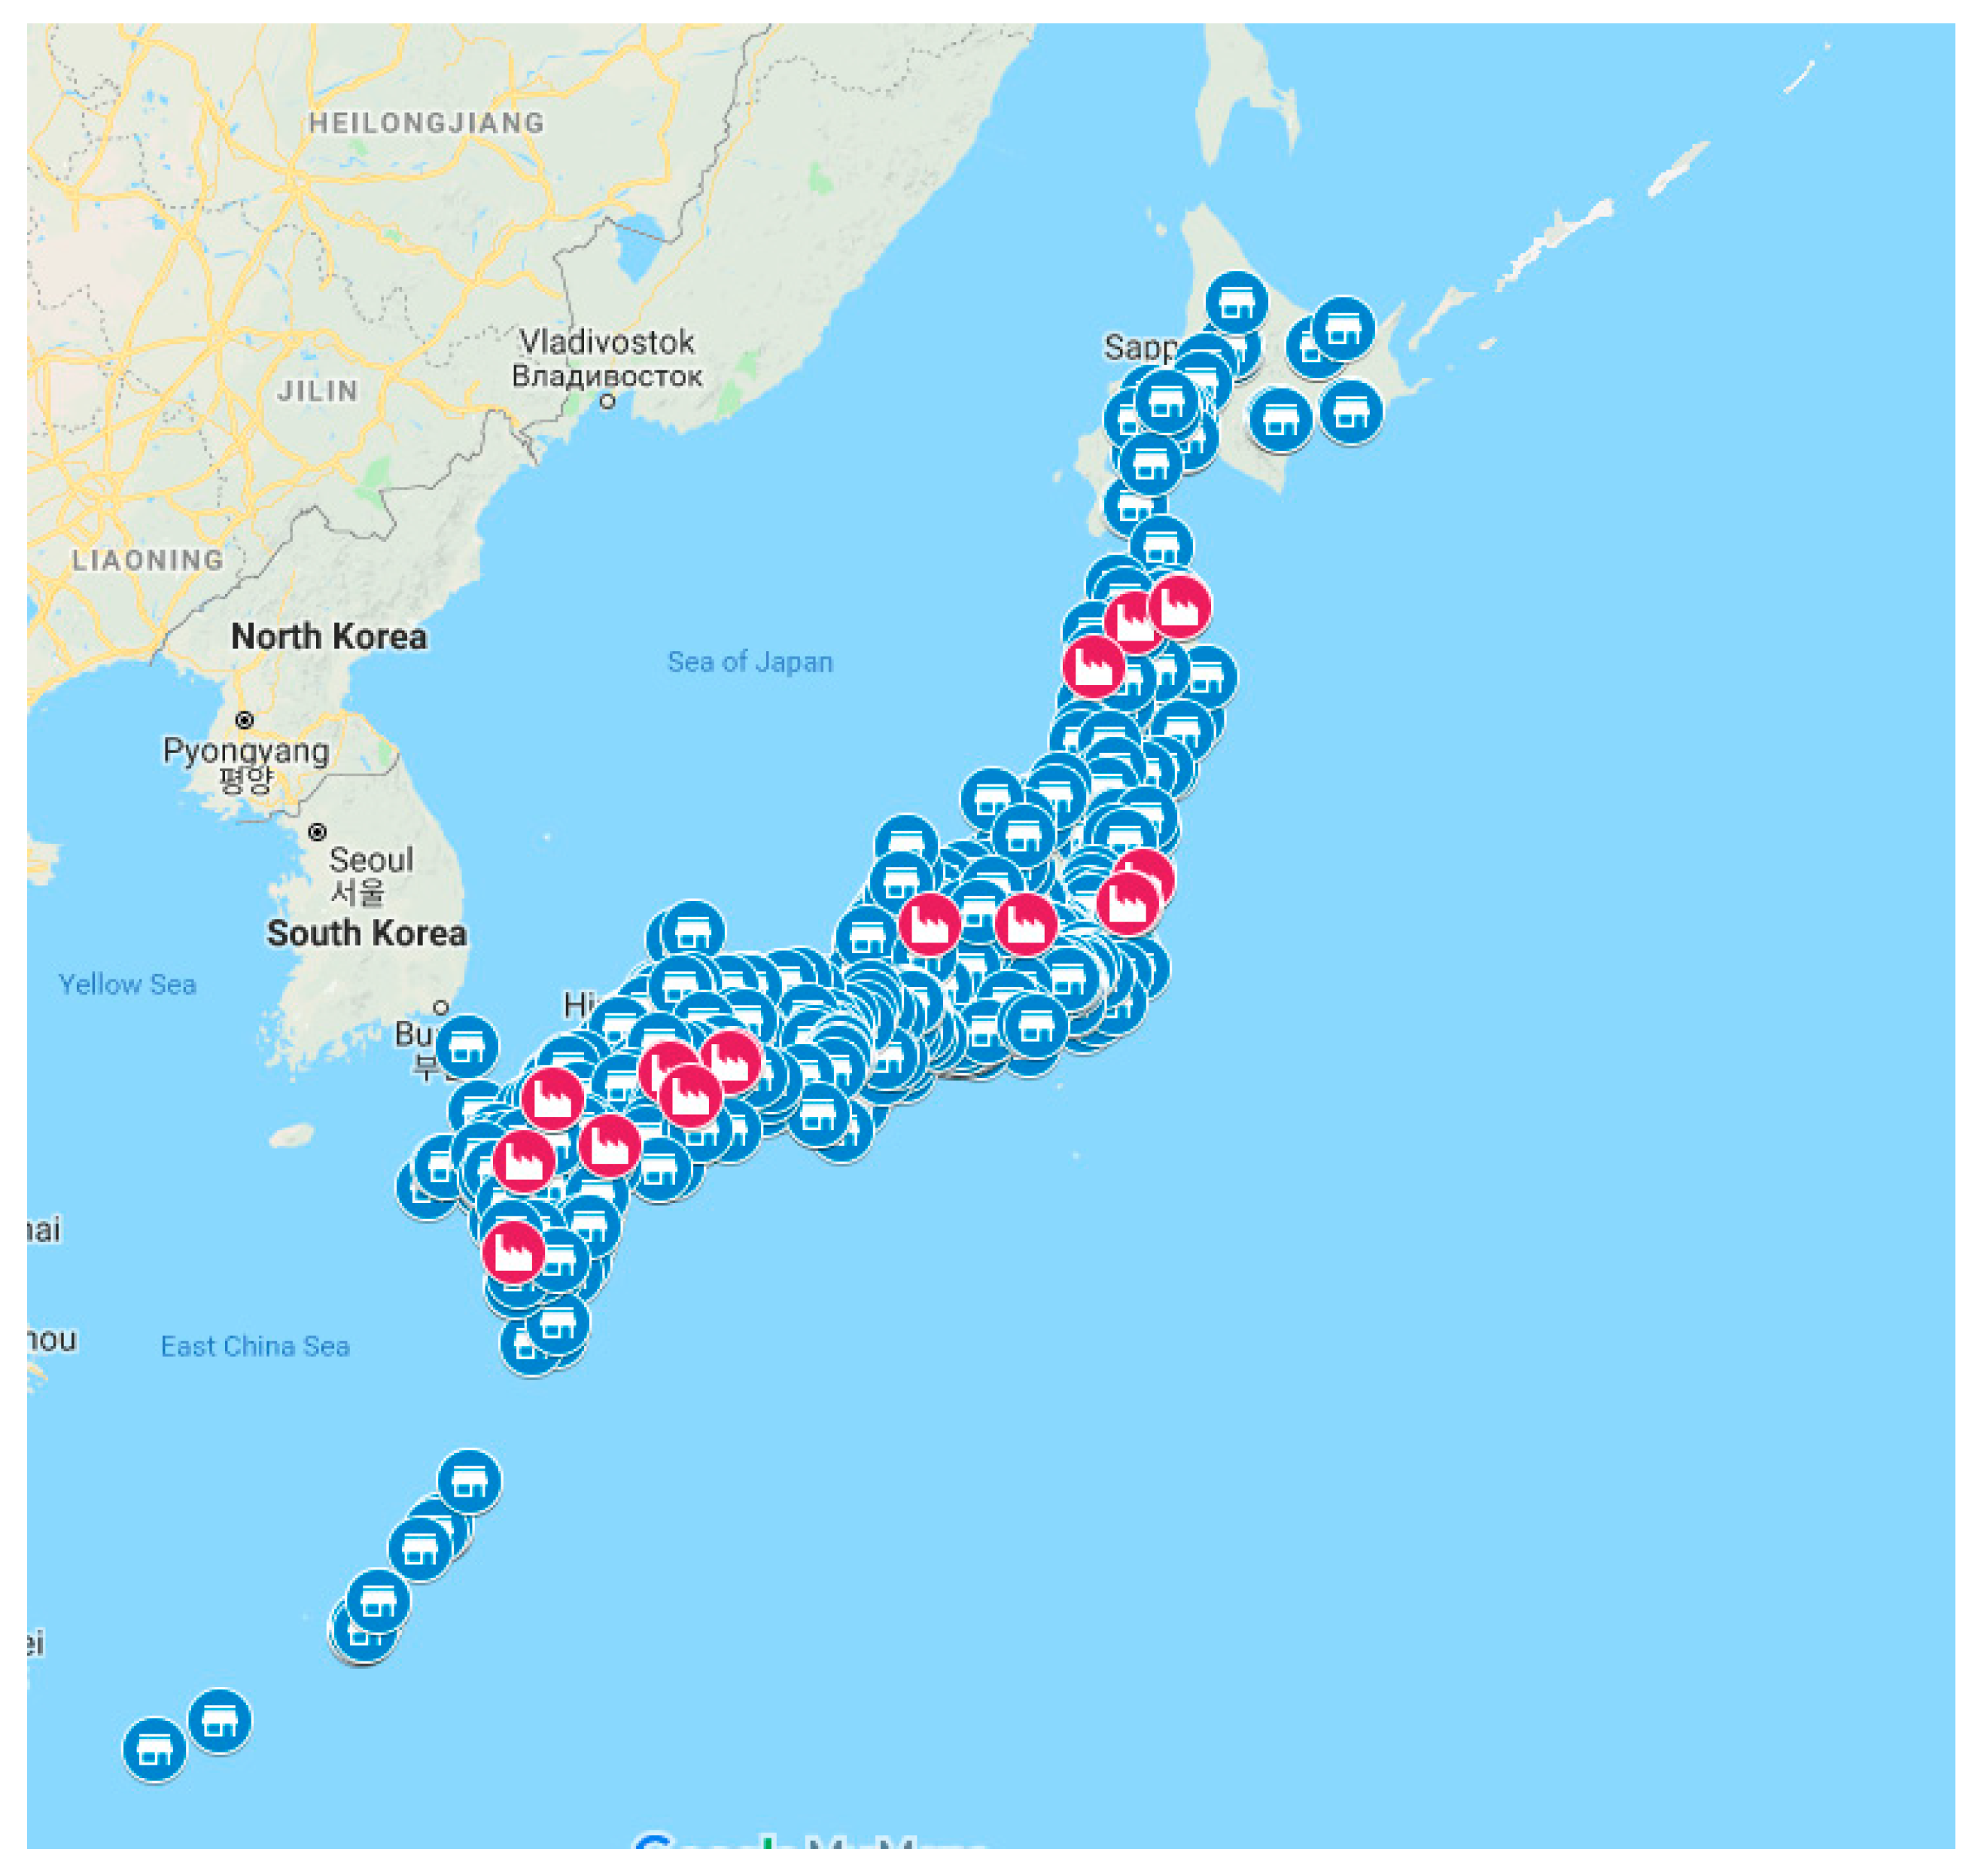
The average minimum distance (
dmin) between retail shops and smelters across Japan. The distance between smelters and retailers was estimated using the Google Maps API Directions Matrix. This distance indicates actual road transportation. In total, 245 retail shops were sampled randomly (from over 4000 national shops) from the major cities in Japan. The closest smelters from each retailer were chosen and the average minimum distance calculated. These major cities are home to most of the population, thus the estimated distances are considered to be indicative (but not precise measures) of the actual weighted average of transportation. Non-ferrous metal processing smelters were chosen in this article. Smelters and retailers in Japan are shown in
Figure A1.
Energy for transportation is estimated by applying energy consumption factors on the basis of net ton-kilometers (ntk). All transportation is assumed to be conducted by road using 4 t diesel trucks, and specific instances where sea transport would be a practical requirement (such as Okinawa) are not considered. Energy consumption for transportation is estimated by Equation (3):
where e is energy consumption, w is weight of end-of-life products,
dmin is distance from retailer to the closest smelter,
f is fuel use per unit (L/t-km). In this study, 0.0686 (L/t-km) which is typical of a 4 ton diesel truck with 80% loading rate is applied, while the fuel heating value per unit,
h, is 38.2 GJ/kL with these values being based on Japan’s standard ton-kilometer method [
76]. Energy consumption for households bringing their end-of-life products to the retail shop is not considered, as the variability in potential transportation modes and distances is very diverse. Actual energy consumption is therefore likely to be greater than this estimation, making it an optimistic estimate. It is assumed that copper is contained in end-of-life product by 2.5%, thus 40 t of end-of-life products need to be collected to produce 1 t of recycled copper (at 100% recovery rate) [
67].
The recycling scenarios, like polymetallic ores, can be divided into two categories: copper recovery only (REC Cu Only) and all material recovery (REC All Materials). The two scenarios require different allocation of the environmental impacts, whereby in the former case all materials other than copper are categorized as waste, and thus have no energy or environmental impact allocated to them, with 100% of energy for transportation and concentration consumed for copper recovery. Energy for smelting and refining is used entirely for the production of copper since this study considered slag and anode slimes to be wastes. The REC All Materials scenario indicates the situation in which all materials will be recovered. Energy for all processes are therefore allocated according to the mass in the relevant feed stream. Recovered plastics are used as fuel and coke [
66], and no material will be counted as waste in raw material collection. The heat value shown in
Table 3 is calculated based on Japan’s plastic production in 2017 [
77,
78]. On the other hand, downstream energy for smelting and refining will not change due to allocation.
In both cases, the work referenced here assumed a copper content of 12.9%. In this case study, however, copper in the feed material is 7.8% after separating other materials [
67]. This study assumes the material compositions of not only copper but also other materials are as per the referred work for input streams, thus some additional processes to concentrate copper content would practically be required, although these are not evaluated as it is assumed that they will not contribute significantly to overall energy consumption. The additional mass stream from this theoretical separation process is allocated as waste.


