Elemental Geochemical Evidence for Depositional Conditions and Organic Matter Enrichment of Black Rock Series Strata in an Inter-Platform Basin: The Lower Carboniferous Datang Formation, Southern Guizhou, Southwest China

Abstract
:1. Introduction
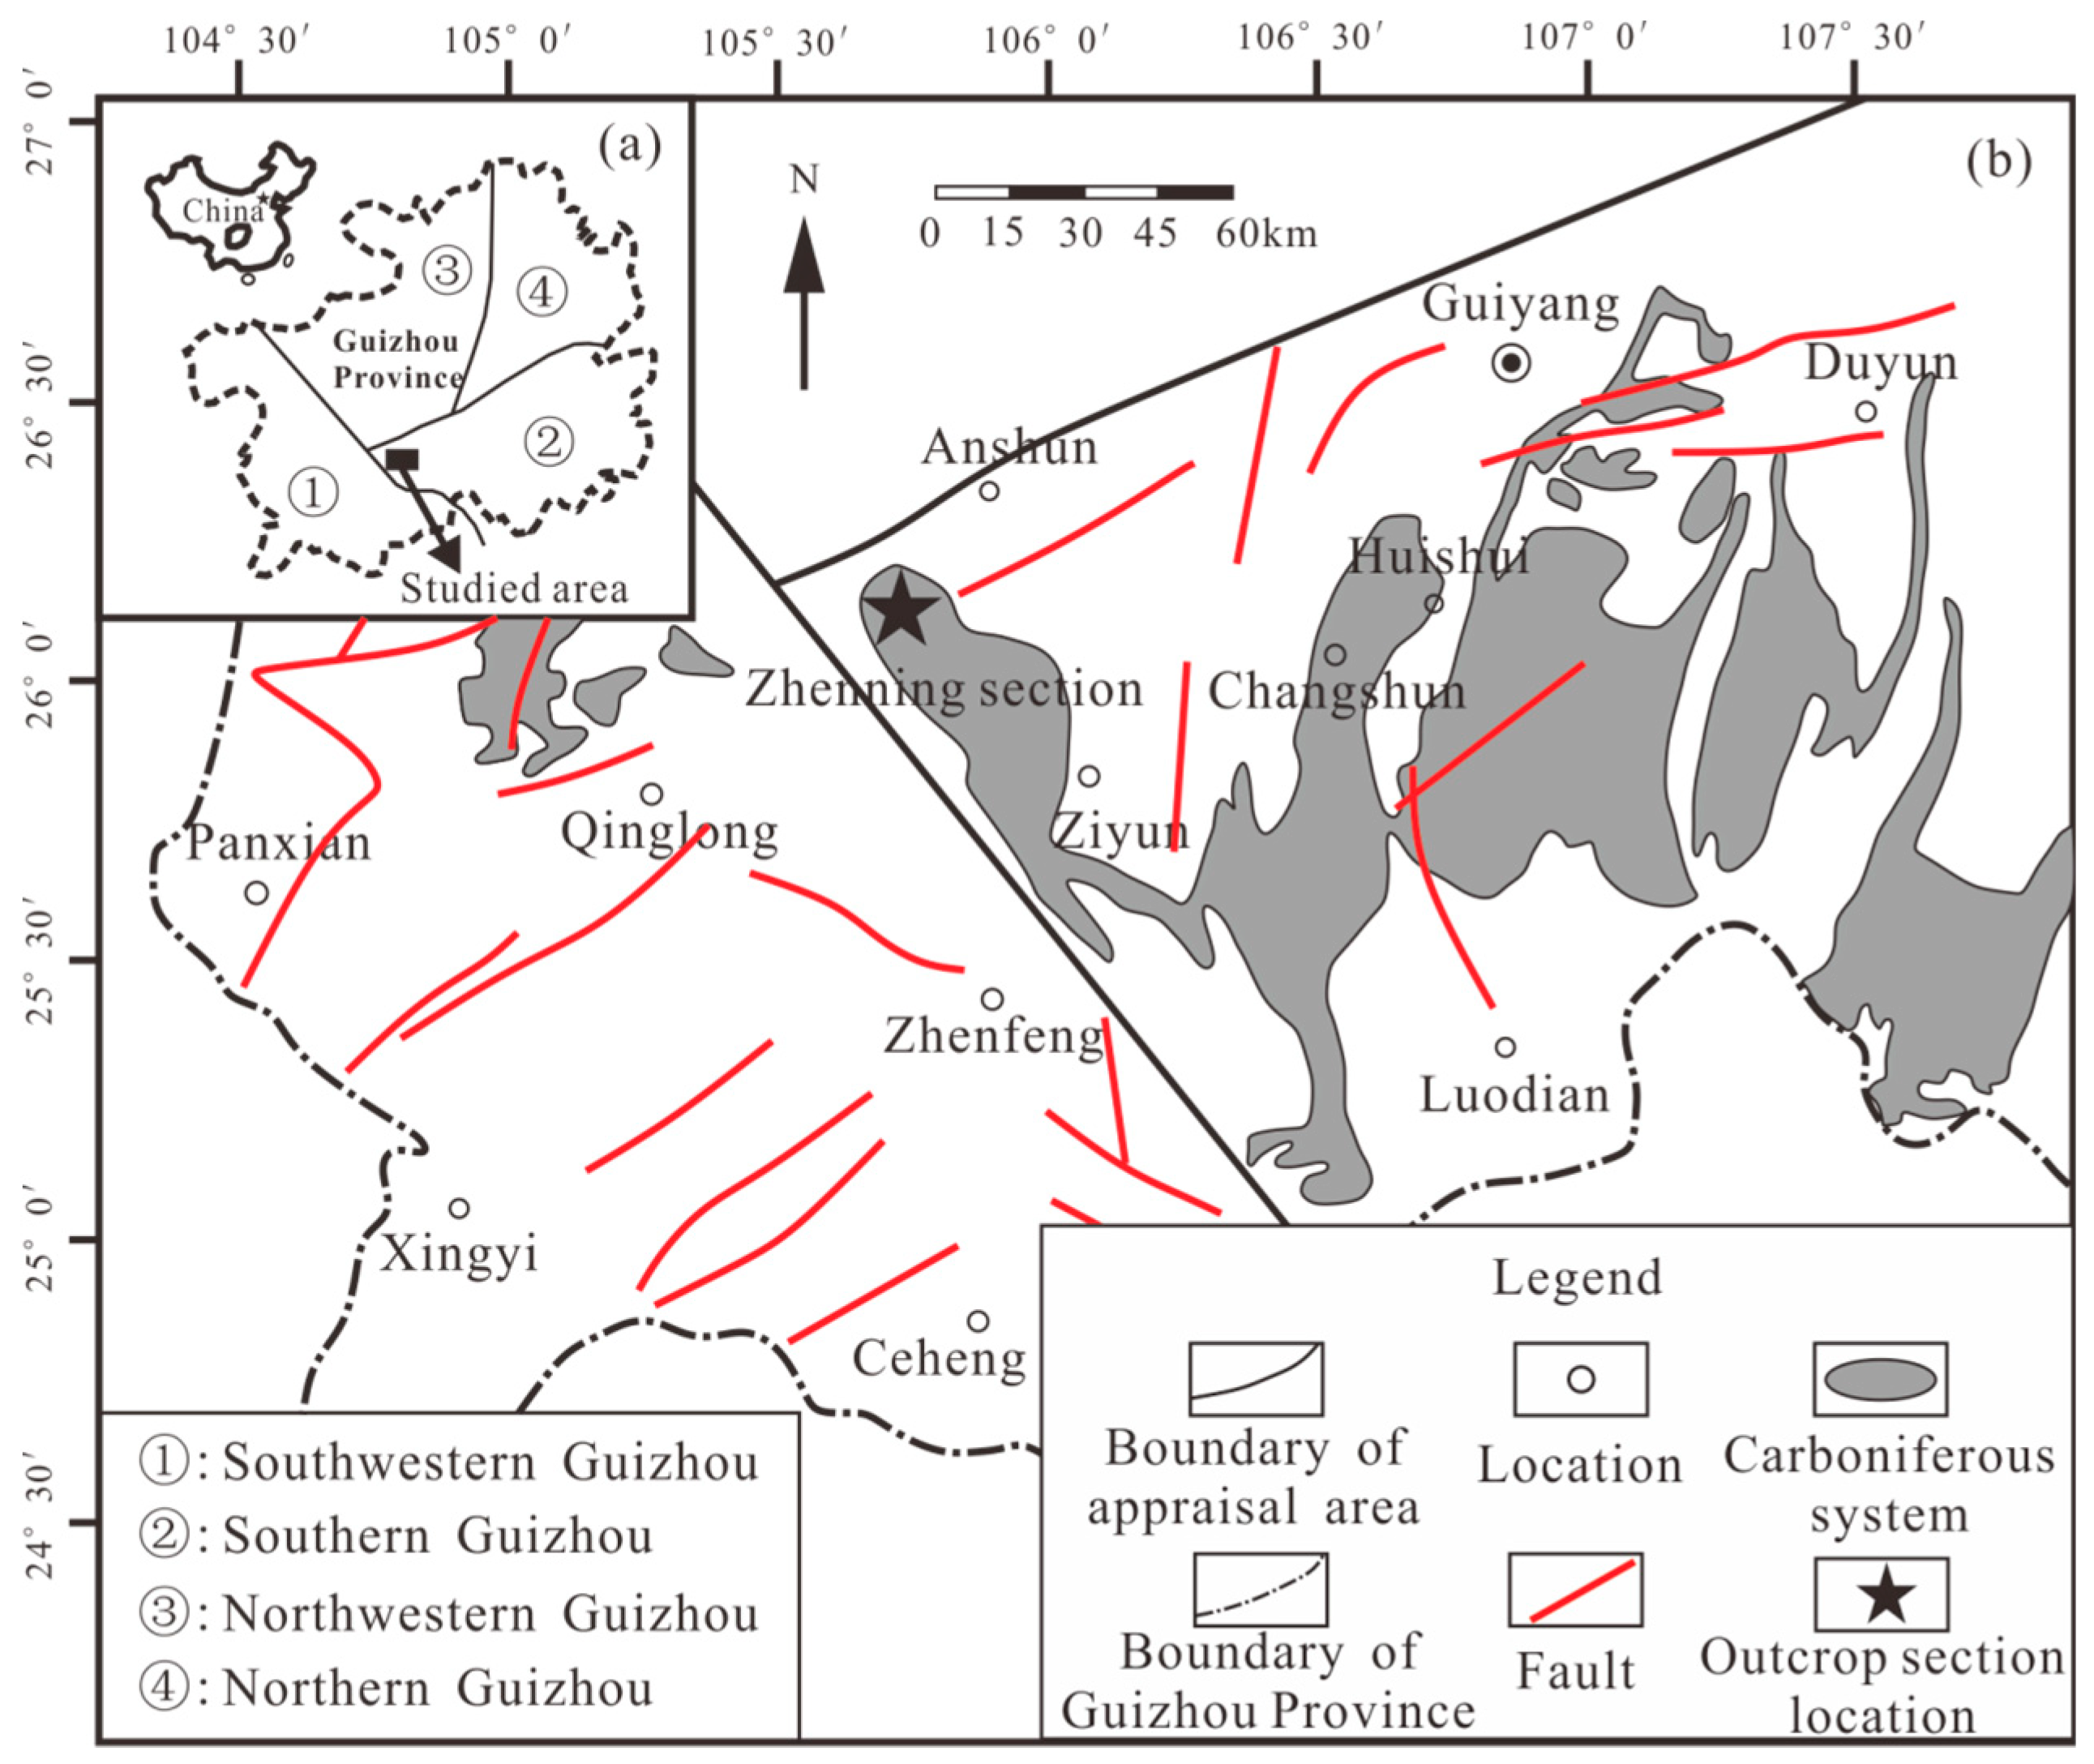
2. Geological Setting
3. Samples and Methods
3.1. Samples
3.2. Methods
4. Results
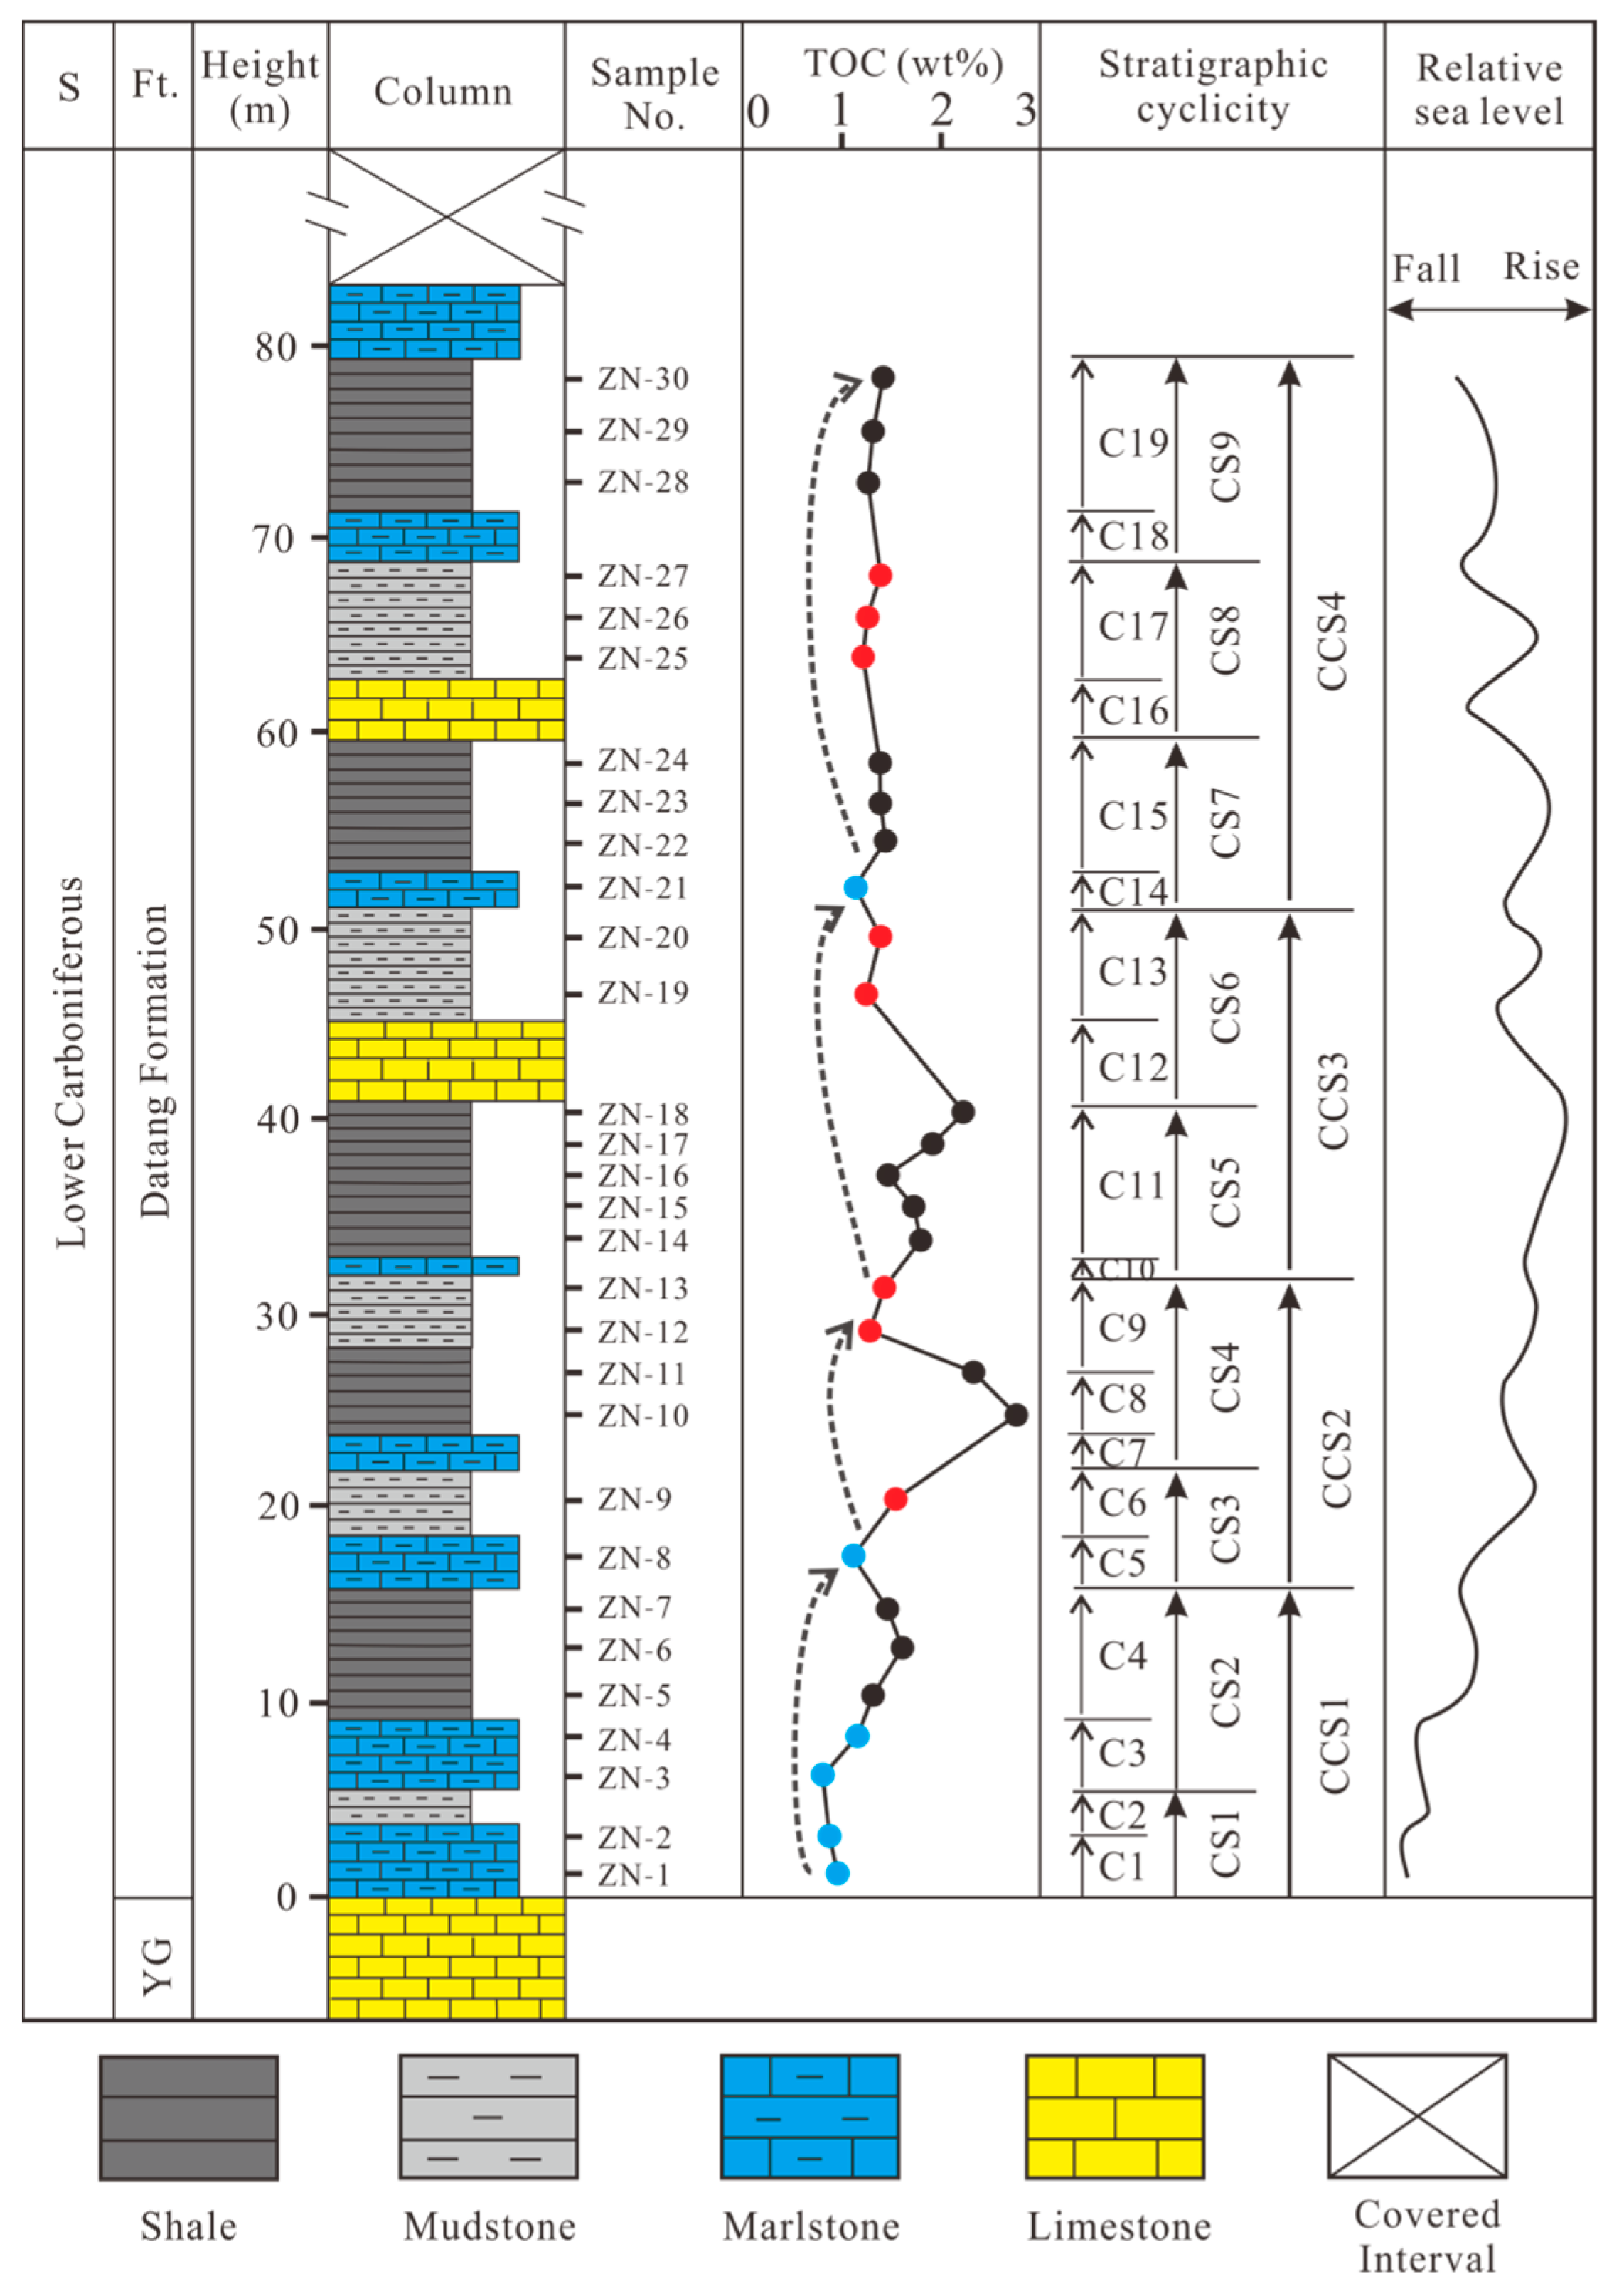
4.1. TOC
4.2. Major Elements
4.3. Trace Elements
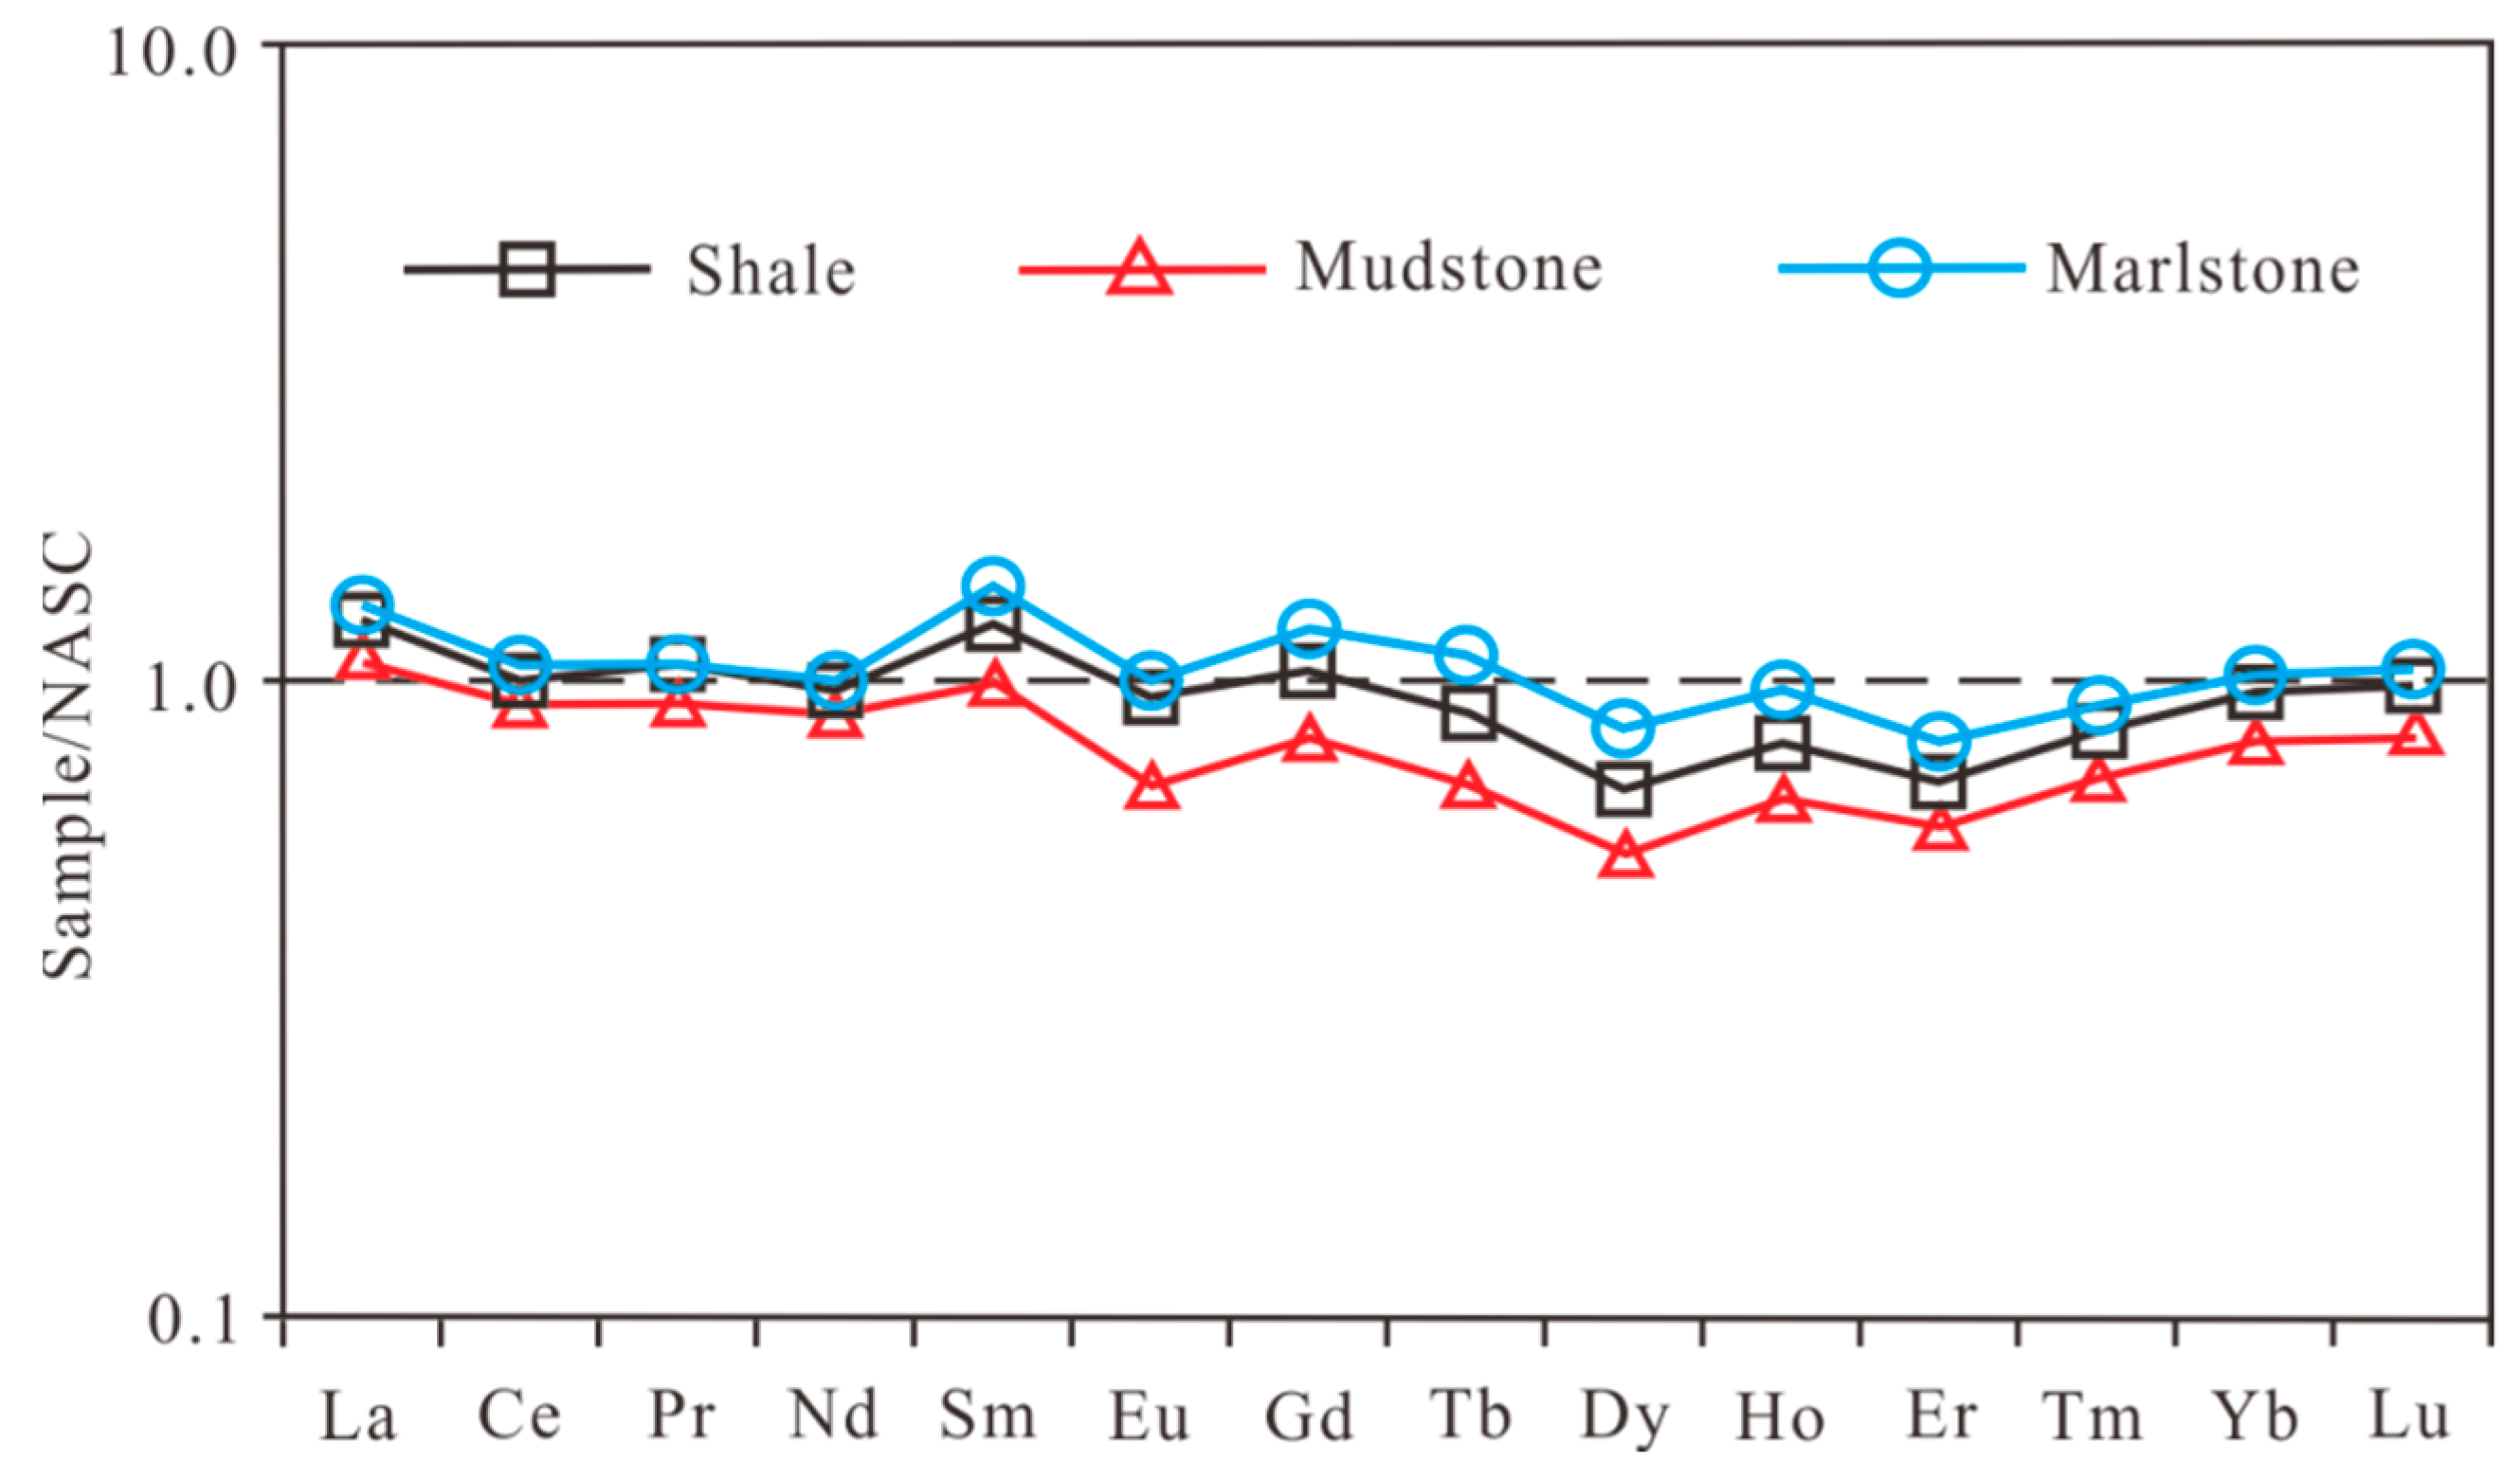
4.4. Rare Earth Elements
4.5. Mineralogical Compositions
5. Discussion
5.1. Weathering Degree
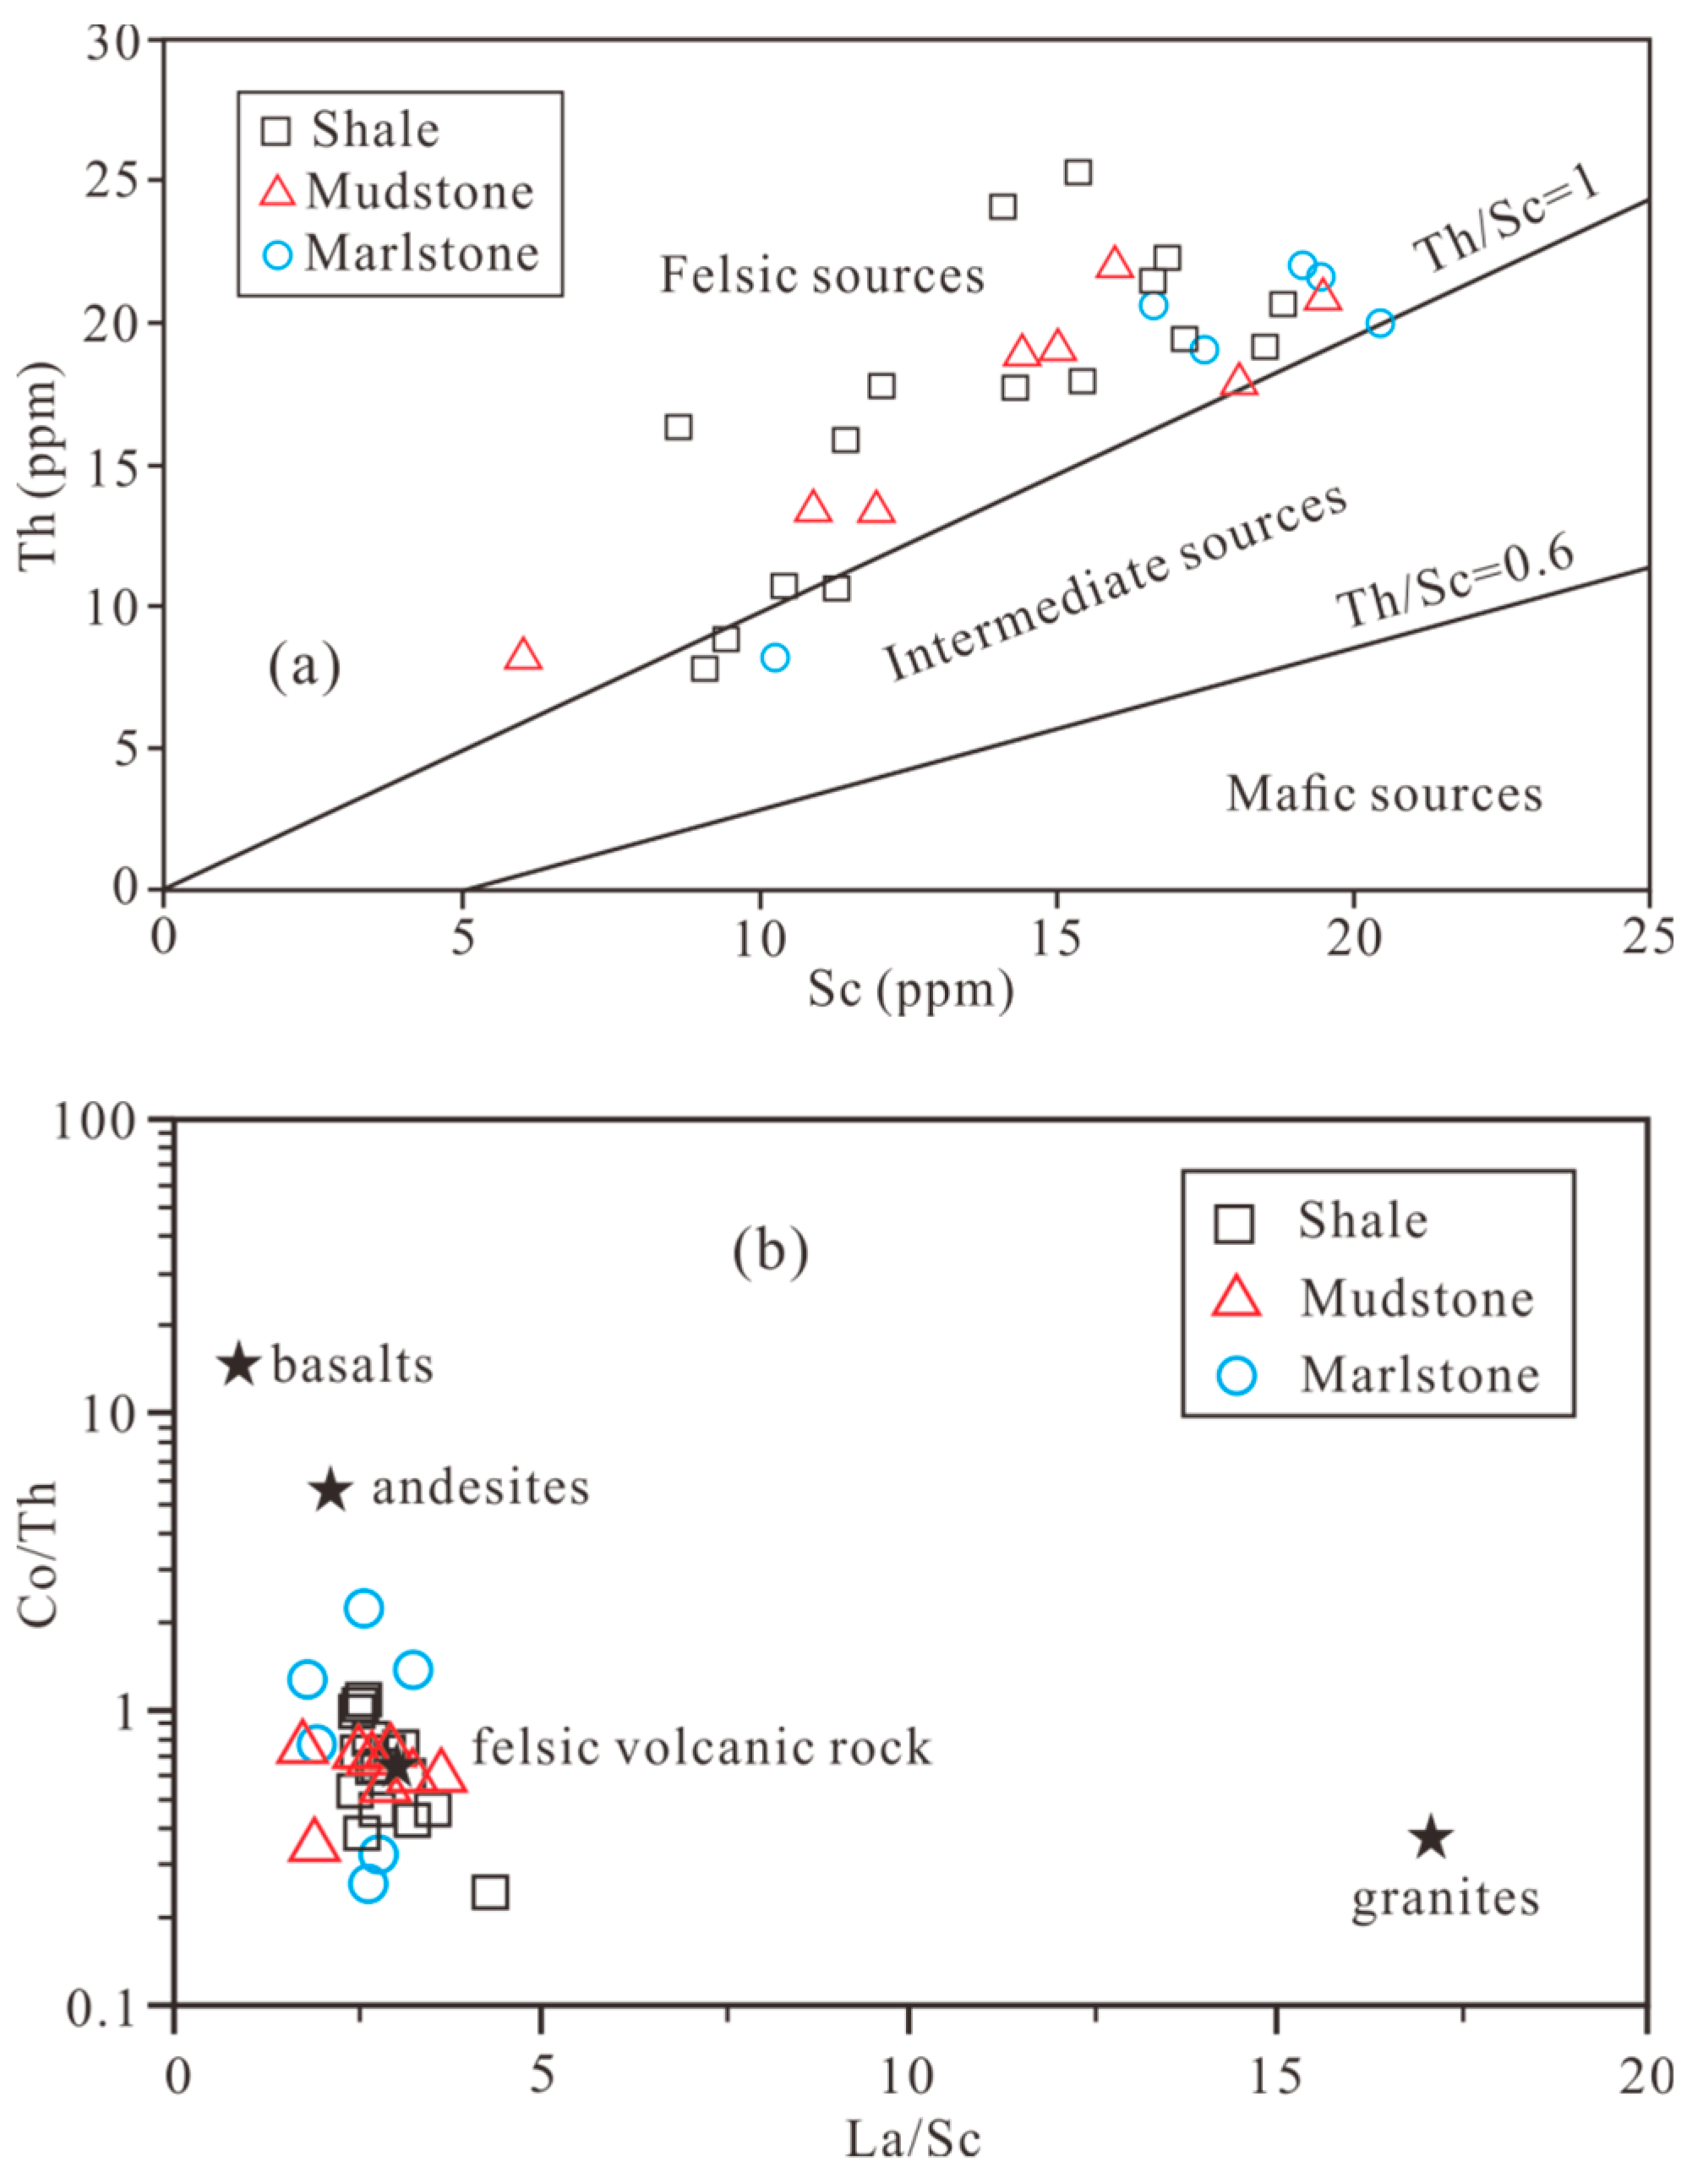
5.2. Provenance
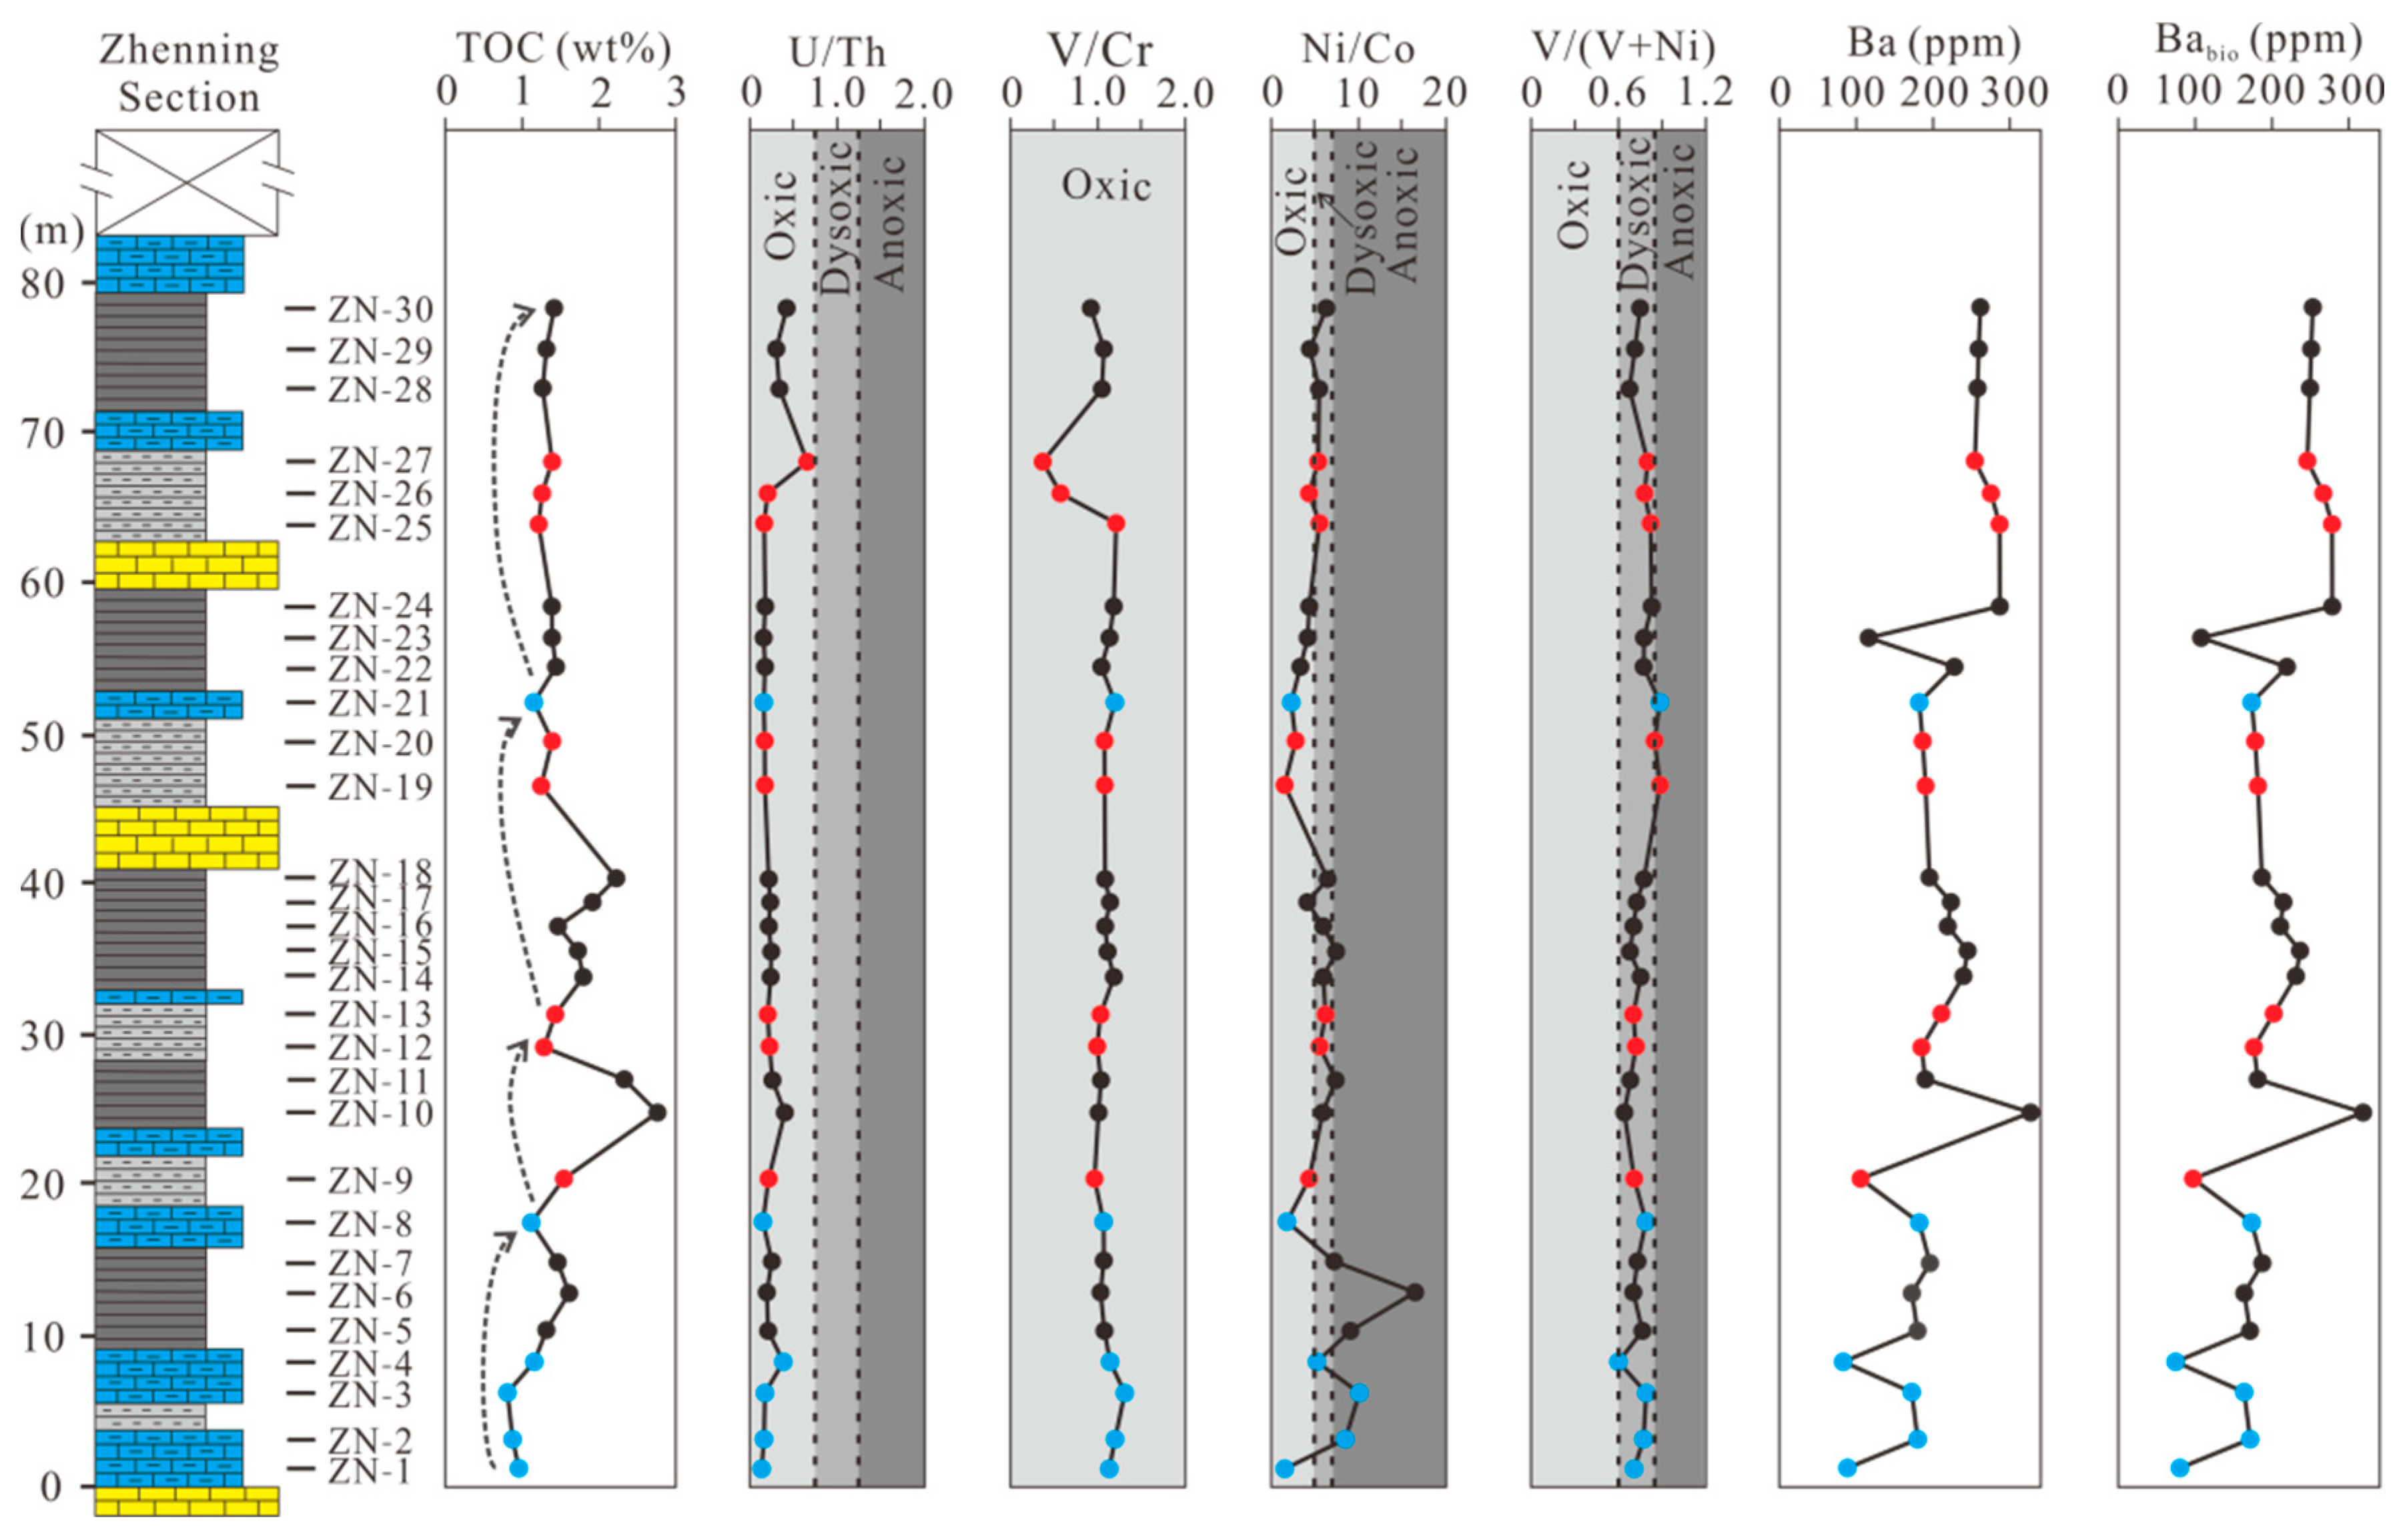
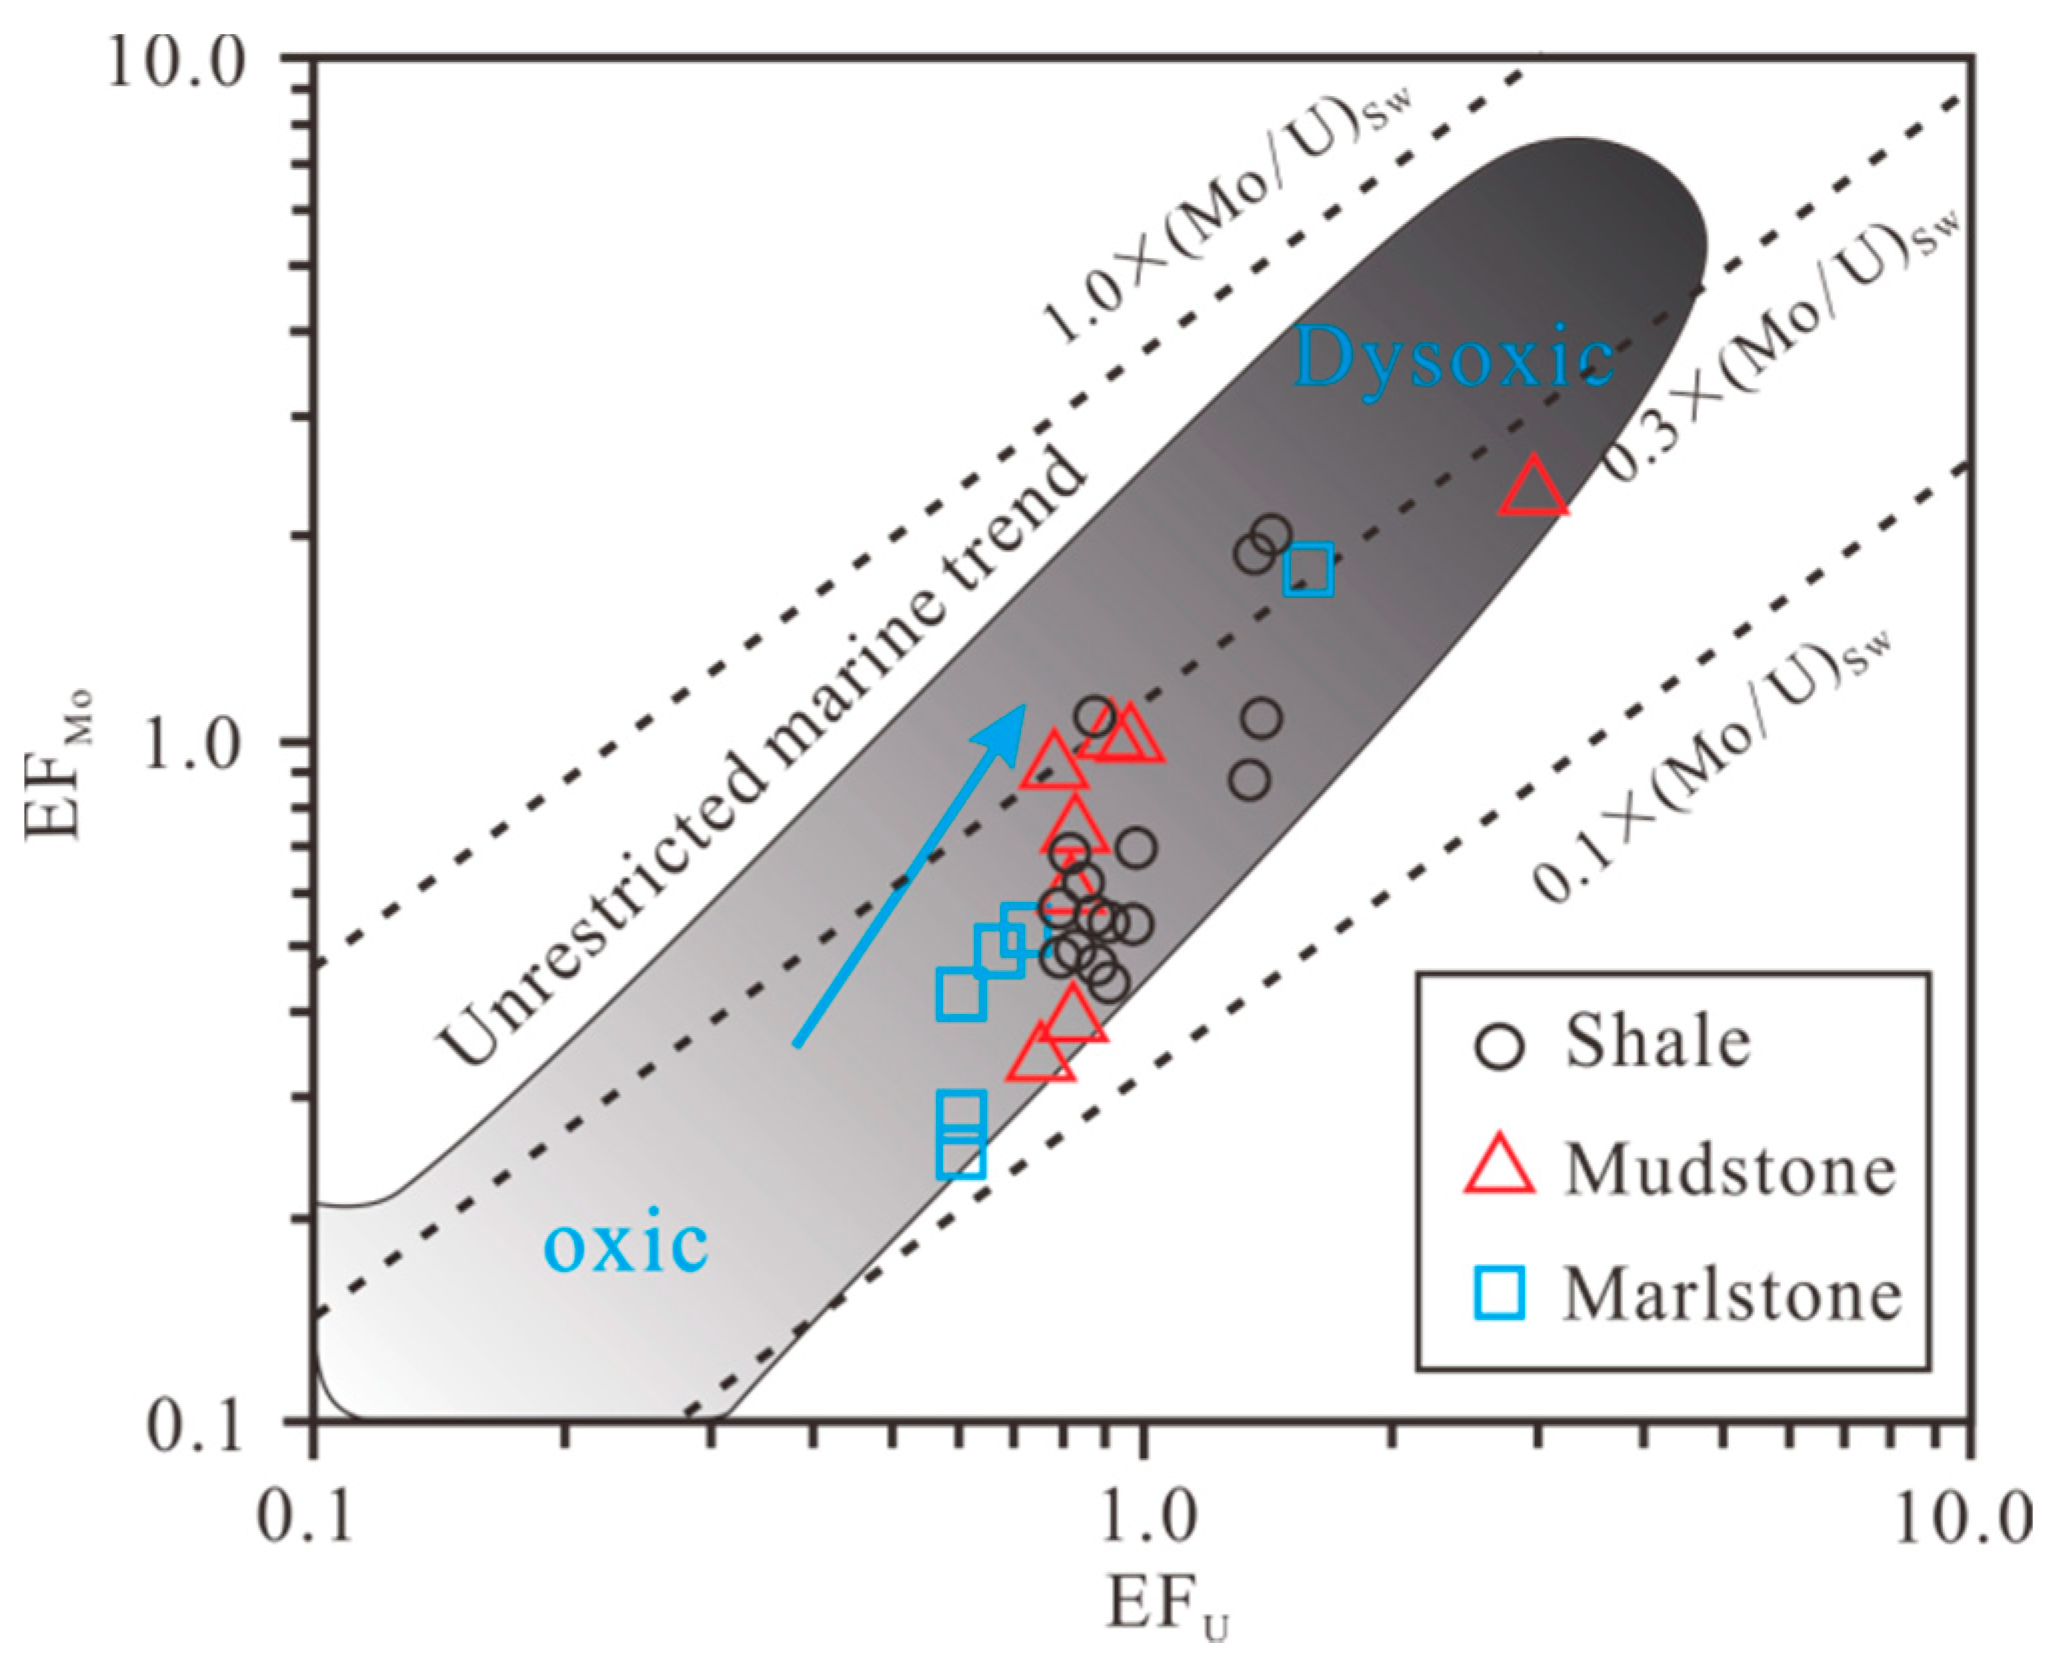
5.3. Paleoredox Conditions
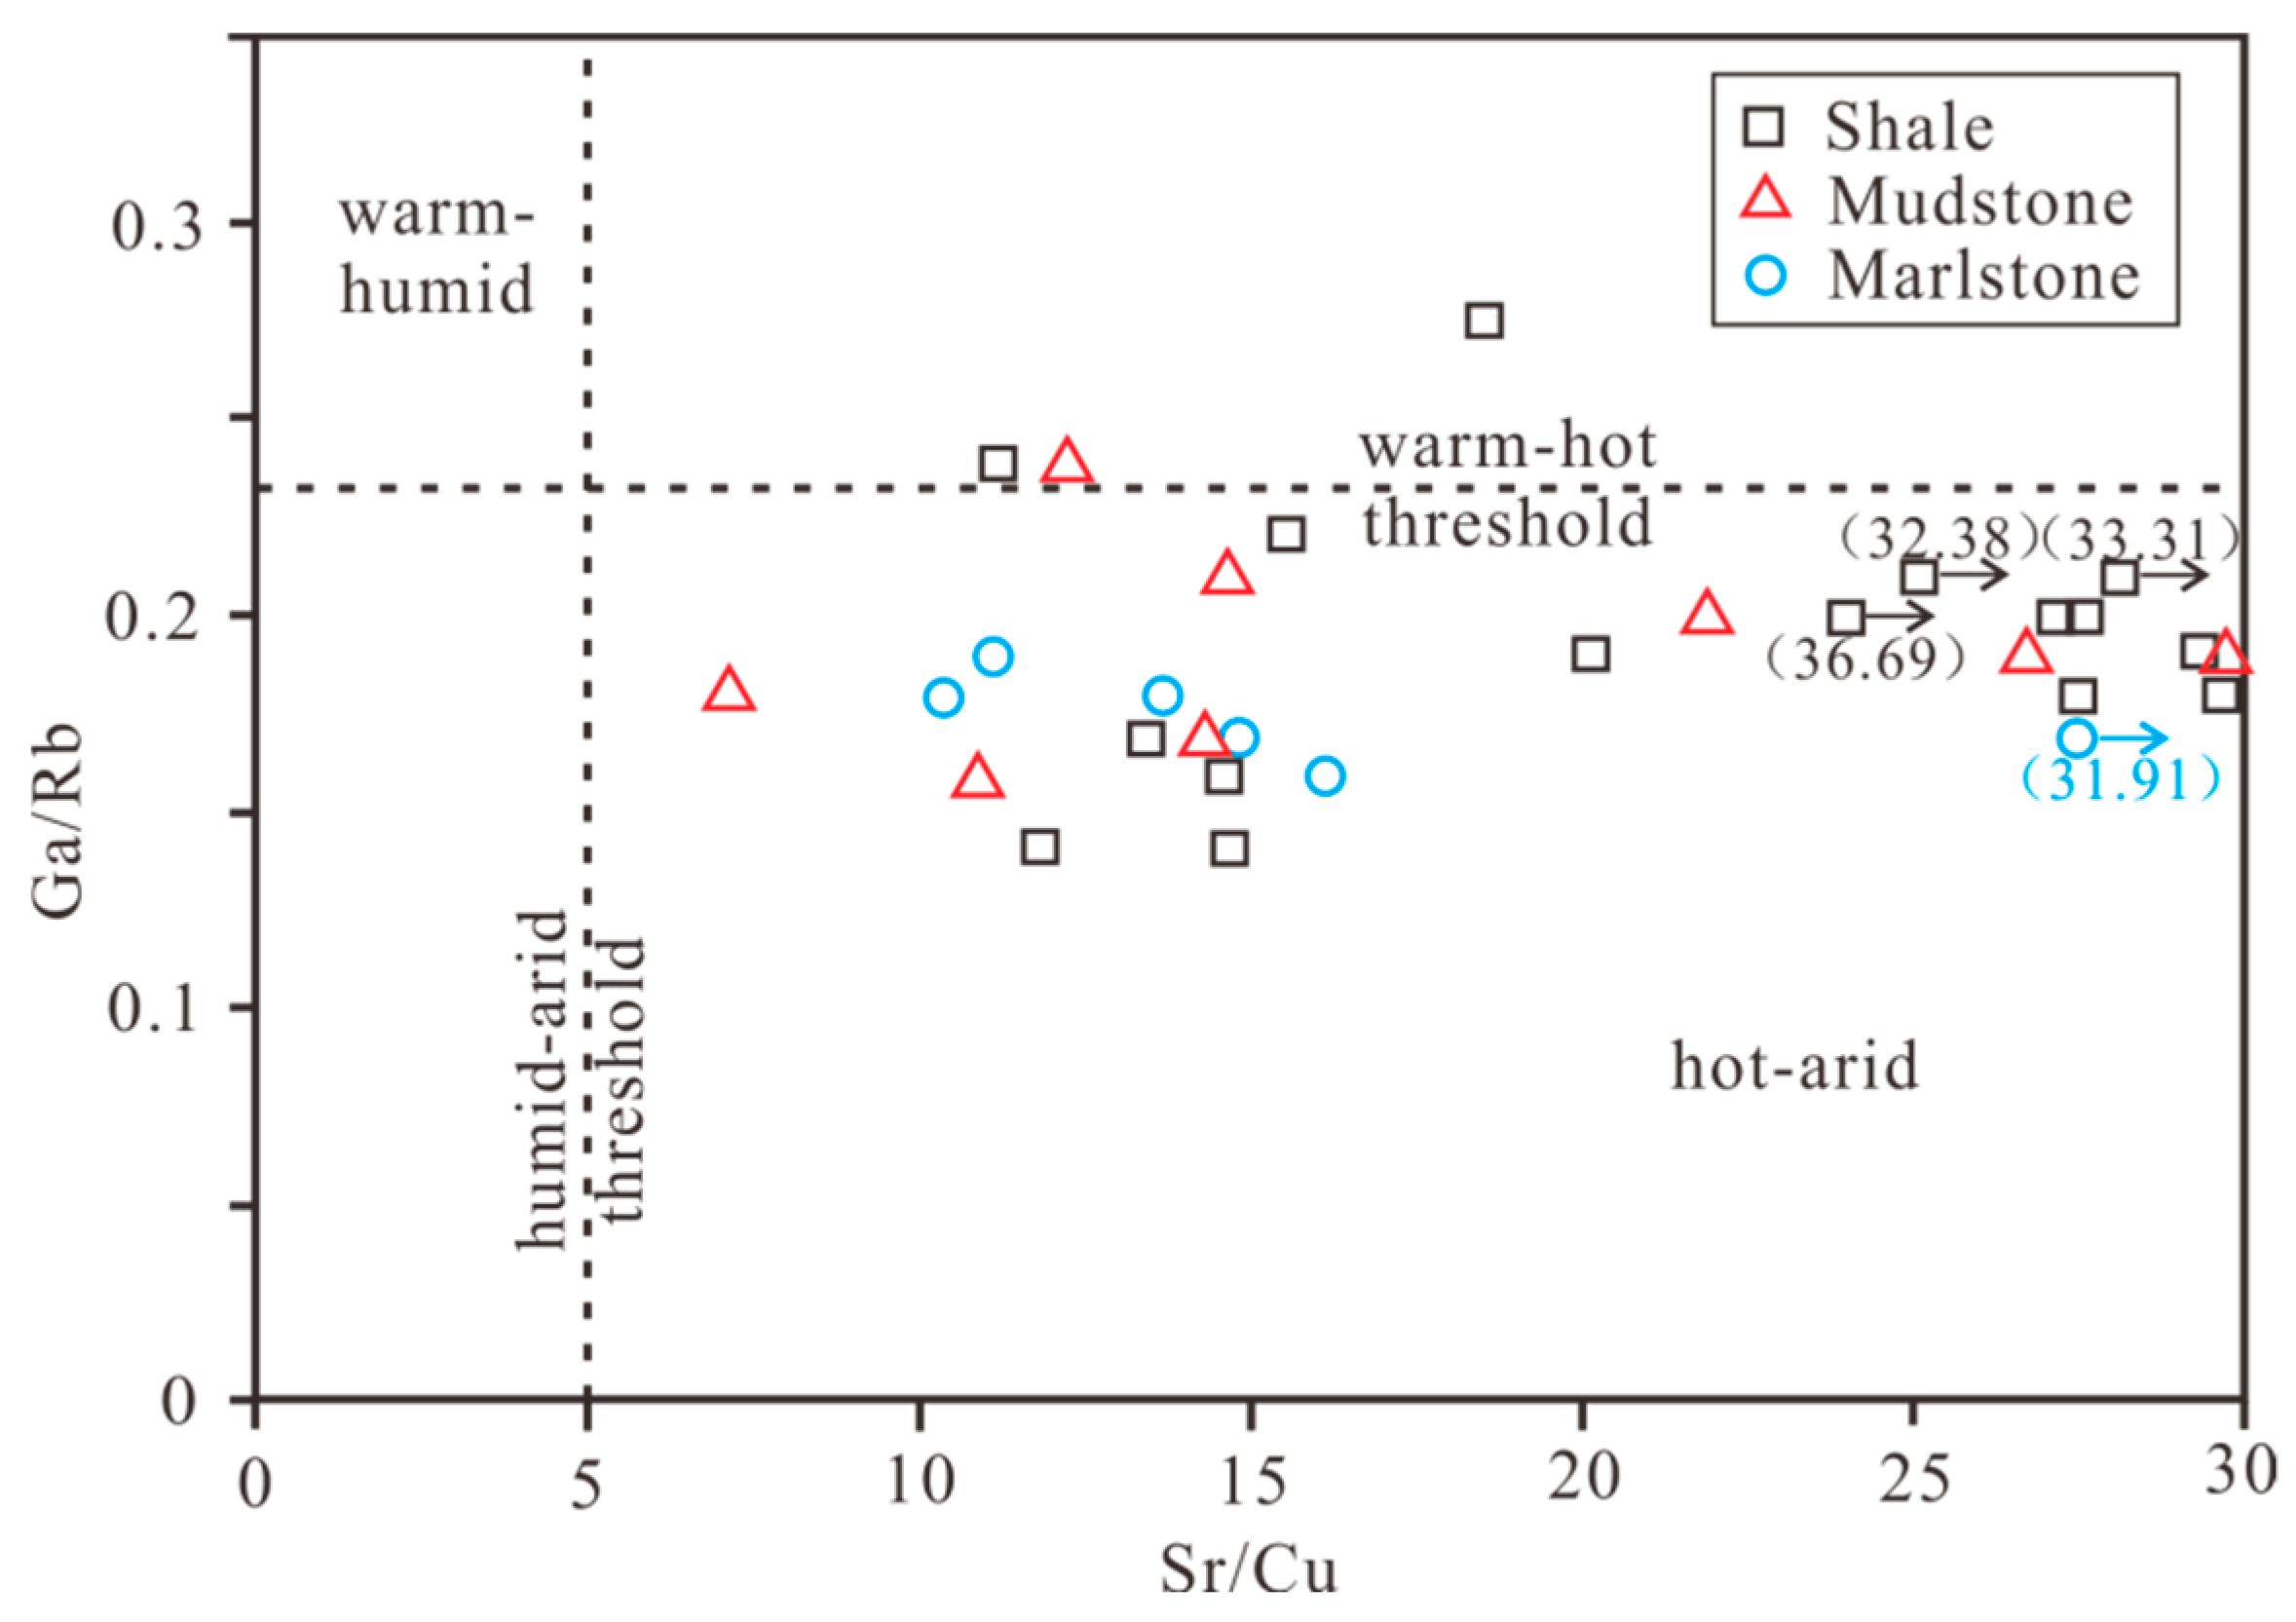
5.4. Paleoclimatic Conditions
5.5. Paleoproductivity
5.6. Organic Matter Enrichment
6. Conclusions
Author Contributions
Funding
Acknowledgments
Conflicts of Interest
References
- Bhatia, M.R. Rare earth element geochemistry of Australian Paleozoic graywackes and mudrocks: Provenance and tectonic control. Sediment. Geol. 1985, 45, 97–113. [Google Scholar] [CrossRef]
- Schatzel, S.J.; Stewart, B.W. Rare earth element sources and modification in the Lower Kittanning coal bed, Pennsylvania: Implications for the origin of coal mineral matter and rare earth element exposure in underground mines. Int. J. Coal Geol. 2003, 54, 223–251. [Google Scholar] [CrossRef]
- Ross, D.J.K.; Bustin, R.M. Investigating the use of sedimentary geochemical proxies for paleoenvironment interpretation of thermally mature organic-rich strata: Examples from the Devonian-Mississippian shales, Western Canadian Sedimentary Basin. Chem. Geol. 2009, 260, 1–19. [Google Scholar] [CrossRef]
- Algeo, T.J.; Kuwahara, K.; Sano, H.; Bates, S.; Lyons, T.; Elswick, E.; Linda Hinnov, L.; Moser, J.; Maynard, J.B. Spatial variation in sediment fluxes, redox conditions, and productivity in the Permian-Triassic Panthalassic Ocean. Palaeogeogr. Palaeoclimatol. Palaeoecol. 2011, 308, 65–83. [Google Scholar] [CrossRef]
- Blake, J.M.; Peters, S.C.; Johannesson, K.H. Application of REE geochemical signatures for Mesozoic sediment provenance to the Gettysburg Basin, Pennsylvania. Sediment. Geol. 2017, 349, 103–111. [Google Scholar] [CrossRef]
- Xie, G.L.; Shen, Y.L.; Liu, S.G.; Hao, W.D. Trace and rare earth element (REE) characteristics of mudstones from Eocene Pinghu Formation and Oligocene Huagang Formation in Xihu Sag, East China Sea Basin: Implications for provenance, depositional conditions and paleoclimate. Mar. Petrol. Geol. 2018, 92, 20–36. [Google Scholar] [CrossRef]
- Li, D.L.; Li, R.X.; Xue, T.; Liu, F.T.; Zhao, B.S.; Zhao, D. Characteristic and geological implications of major elements and rare earth elements of Triassic Chang 7 oil shale in Tongchuan city, Southern Ordos Basin (China). Minerals 2018, 8, 157. [Google Scholar] [CrossRef]
- Demaison, G.J.; Moore, G.T. Anoxic environments and oil source bed genesis. AAPG Bull. 1980, 64, 1179–1209. [Google Scholar] [CrossRef]
- Arthur, M.A.; Sageman, B.B. Marine black shales: Depositional mechanisms and environments of ancient deposits. Annu. Rev. Earth Planet. Sci. 1994, 22, 499–551. [Google Scholar] [CrossRef]
- Wignall, P.B. Black Shale; Oxford University Press: New York, NY, USA, 1994. [Google Scholar]
- Murphy, A.E.; Sageman, B.B.; Hollander, D.J.; Lyons, T.W.; Brett, C.E. Black shale deposition and faunal overturn in the Devonian Appalachian Basin: Clastic starvation, seasonal water-column mixing, and efficient biolimiting nutrient recycling. Paleoceanography 2000, 15, 280–291. [Google Scholar] [CrossRef]
- Wei, H.Y.; Chen, D.Z.; Wang, J.G.; Yu, H.; Tucker, M.E. Organic accumulation in the lower Chihsia Formation (Middle Permian) of South China: Constraints from pyrite morphology and multiple geochemical proxies. Palaeogeogr. Palaeoclimatol. Palaeoecol. 2012, 353, 73–86. [Google Scholar] [CrossRef]
- Wang, S.F.; Zou, C.N.; Dong, D.Z.; Wang, Y.M.; Li, X.J.; Huang, J.L.; Guan, Q.Z. Multiple controls on the paleoenvironment of the Early Cambrian marine black shales in the Sichuan Basin, SW China: Geochemical and organic carbon isotopic evidence. Mar. Petrol. Geol. 2015, 66, 660–672. [Google Scholar] [CrossRef]
- Xu, Q.L.; Liu, B.; Ma, Y.S.; Song, X.M.; Wang, Y.J.; Xin, X.K.; Chen, Z.X. Controlling factors and dynamical formation models of lacustrine organic matter accumulation for the Jurassic Da’anzhai Member in the central Sichuan Basin, southwestern China. Mar. Petrol. Geol. 2017, 86, 1391–1405. [Google Scholar] [CrossRef]
- Cao, J.; Wu, M.; Chen, Y.; Hu, K.; Bian, L.Z.; Wang, L.G.; Zhang, Y. Trace and rare earth element geochemistry of Jurassic mudstones in the northern Qaidam Basin, northwest China. Chem. Erde-Geochem. 2012, 72, 245–252. [Google Scholar] [CrossRef]
- Hu, T.; Pang, X.Q.; Jiang, S.; Wang, Q.F.; Xu, T.W.; Lu, K.; Huang, C.; Chen, Y.Y.; Zheng, X.W. Impact of paleo-salinity, dilution, redox, and paleo-productivity on organic matter enrichment in a saline lacustrine rift basin: A case study of paleogene organic-rich shale in Dongpu Depression, Bohai Bay Basin, Eastern China. Energy Fuels 2018, 32, 5045–5061. [Google Scholar] [CrossRef]
- Jiang, D.H. Sedimentary characteristics and evolution of a middle and late Devonian inter-platform basin in Southern Hunan. Sediment. Geol. Teth. Geol. 1990, 6, 21–28. (In Chinese) [Google Scholar]
- Mei, M.X.; Ma, Y.S.; Deng, J.; Chu, H.M.; Liu, Z.R.; Zhang, H. Carboniferous to Permian sequence stratigraphic framework of the Yunnan-Guizhou-Guangxi basin and its adjacent areas and global correlation of third-order sea-level change. Chin. Geol. 2005, 32, 13–24. (In Chinese) [Google Scholar]
- Tian, J.C.; Kang, J.W.; Lin, X.B.; Zhang, X.; Chen, H. Sequence stratigraphic characteristics and platform basin sedimentary system. J. Southwest Petrol. Univ. 2007, 29, 39–42. (In Chinese) [Google Scholar]
- Tian, S.F.; Yang, R.D. Lithofacies and paleogeography evolution and characteristics of shale gas accumulation in Lower Carboniferous, Guizhou, China. J. Chengdu Univ. Technol. 2016, 43, 291–298. (In Chinese) [Google Scholar]
- Yang, R.D.; Chen, W.; Zhou, R.X. Characteristics of organic-rich shale and exploration area of shale gas in Guizhou Province. Nat. Gas Geosci. 2012, 23, 340–347. (In Chinese) [Google Scholar]
- Zhang, J.C.; Huo, Z.P.; Tang, X.; Liu, Y.; Han, S.B. Shale Gas Geological Characteristics in China; East China University of Technology Press: Shanghai, China, 2016; pp. 26–27. (In Chinese) [Google Scholar]
- GGMRB. Guizhou Regional Geology; Geological Publishing House: Beijing, China, 1987; pp. 194–225. (In Chinese) [Google Scholar]
- Yang, R.D.; Yang, C.X.; Wang, C.Y.; Chen, W.Y. The Carboniferous trace fossils in Guizhou: Depression on distribution of Zoophycos throughout geologic history. Guihzou Geol. 1995, 12, 290–297. (In Chinese) [Google Scholar]
- Eltom, H.A.; Abdullatif, O.M.; Makkawi, M.H. Rare earth element geochemistry of shallow carbonate outcropping strata in Saudi Arabia: Application for depositional environments prediction. Sediment. Geol. 2017, 348, 51–68. [Google Scholar] [CrossRef]
- Cui, J. Sedimentary Response to Teconic Evolution of the Central Guizhou Uplift and Its Adjacent Areas. Ph.D. Dissertation, Central South University, Changsha, China, 2013; pp. 82–88. (In Chinese). [Google Scholar]
- Su, H.M.; Yang, R.D.; Cheng, W.; Zhang, Z. Shale gas accumulation characteristics and advantageous area analysis of Lower Carboniferous Dawuba Formation in Southwestern Guizhou. J. Guizhou Univ. 2017, 34, 41–46. (In Chinese) [Google Scholar]
- Goldhammer, R.K. Depositional cycles, composite sea-level changes, cycle stacking patterns, and the hierarchy of stratigraphic forcing: Examples from Alpine Triassic platform carbonates. Geol. Soc. Am. Bull. 1990, 102, 535–562. [Google Scholar] [CrossRef]
- Chen, D.; Tucker, M.E. The Frasnian-Famennian mass extinction: Insights from high-resolution sequence stratigraphy and cyclostratigraphy in South China. Palaeogeogr. Palaeoclimatol. Palaeoecol. 2003, 193, 87–111. [Google Scholar] [CrossRef]
- Goto, A.; Tatsumi, Y. Quantitative analysis of rock samples by an X-ray fluorescence spectrometer (I). Rigaku J. 1994, 11, 40–59. [Google Scholar]
- Cao, J.; Yang, R.F.; Yin, W.; Hu, G.; Bian, L.Z.; Fu, X.G. Mechanism of organic matter accumulation in residual bay environments: The Early Cretaceous Qiangtang Basin, Tibet. Energy Fuel 2018, 32, 1024–1037. [Google Scholar] [CrossRef]
- Taylor, S.R.; Mclennan, S.M. The Continental Crust: Its Composition and Evolution; Blackwell Scientific Publications: Hoboken, NJ, USA, 1985; p. 312. [Google Scholar]
- Calvert, S.E.; Pedersen, T.F. Geochemistry of Recent oxic and anoxic marine sediments: Implications for the geological record. Mar. Geol. 1993, 113, 67–88. [Google Scholar] [CrossRef]
- Rimmer, S.M. Geochemical paleoredox indicators in Devonian-Mississippian black shales, Central Appalachian Basin (USA). Chem. Geol. 2004, 206, 373–391. [Google Scholar] [CrossRef]
- Wedepohl, K.H. Environmental influences on the chemical composition of shales and clays. Phys. Chem. Earth 1971, 8, 305–333. [Google Scholar] [CrossRef]
- Tribovillard, N.; Algeo, T.J.; Lyons, T.; Riboulleau, A. Trace metals as paleoredox and paleoproductivity proxies: An update. Chem. Geol. 2006, 232, 12–32. [Google Scholar] [CrossRef]
- Spears, D.A.; Zheng, Y. Geochemistry and origin of elements in some UK coals. Int. J. Coal Geol. 1999, 38, 161–179. [Google Scholar] [CrossRef]
- Fu, X.G.; Wang, J.; Zeng, Y.H.; Tan, F.W.; He, J.L. Geochemistry and origin of rare earth elements (REEs) in the Shengli River oil shale, northern Tibet, China. Chem. Erde-Geochem. 2011, 71, 21–30. [Google Scholar] [CrossRef]
- Wang, Z.W.; Fu, X.G.; Feng, X.L.; Song, C.; Wang, D.; Chen, W.B.; Zeng, S.Q. Geochemical features of the black shales from the Wuyu Basin, southern Tibet: Implications for palaeoenvironment and palaeoclimate. Geol. J. 2017, 52, 282–297. [Google Scholar] [CrossRef]
- Haskin, L.A.; Wildeman, T.R.; Haskin, M.A. An accurate procedure for the determination of the rare earths by neutron activation. J. Radioanal. Chem. 1968, 1, 337–348. [Google Scholar] [CrossRef]
- Bau, M.; Dulski, P. Distribution of yttrium and rare-earth elements in the Penge and Kuruman iron-formations, Transvaal Supergroup, South Africa. Precambrian Res. 1996, 79, 37–55. [Google Scholar] [CrossRef]
- Zhang, M.; Liu, Z.; Xu, S.; Sun, P.; Hu, X. Element response to the ancient lake information and its evolution history of argillaceous source rocks in the Lucaogou Formation in Sangonghe area of southern margin of Junggar Basin. J. Earth Sci.-China 2013, 24, 987–996. [Google Scholar] [CrossRef]
- Zeng, S.Q.; Wang, J.; Fu, X.G.; Chen, W.B.; Feng, X.L.; Wang, D.; Song, C.Y.; Wang, Z.W. Geochemical characteristics, redox conditions, and organic matter accumulation of marine oil shale from the Changliang Mountain area, northern Tibet, China. Mar. Petrol. Geol. 2015, 64, 203–221. [Google Scholar] [CrossRef]
- Yu, B.S.; Li, J.; Zeng, Q.N.; Sun, M.D.; Shi, M. Sedimentary Environment and Diagenesis of Rich Organic Shale; East China University of Technology Press: Shanghai, China, 2016; p. 125. (In Chinese) [Google Scholar]
- Nesbitt, H.W.; Young, G.M. Prediction of some weathering trends of plutonic and volcanic rocks based on thermodynamic and kinetic considerations. Geochim. Cosmochim. Acta 1984, 48, 1523–1534. [Google Scholar] [CrossRef]
- Nesbitt, H.W.; Young, G.M. Early proterozoic climates and plate motions inferred from major element chemistry of lutites. Nature 1982, 299, 715–717. [Google Scholar] [CrossRef]
- Kasanzu, C.; Maboko, M.A.H.; Manya, S. Geochemistry of fine-grained clastic sedimentary rocks of the Neoproterozoic Ikorongo Group, NE Tanzania: Implications for provenance and source rock weathering. Precambrian Res. 2008, 164, 201–213. [Google Scholar] [CrossRef]
- Condie, K.C. Chemical composition and evolution of the upper continental crust: Contrasting results from surface samples and shales. Chem. Geol. 1993, 104, 1–37. [Google Scholar] [CrossRef]
- Harnois, L. The CIW index: A new chemical index of weathering. Sediment. Geol. 1988, 55, 319–322. [Google Scholar] [CrossRef]
- Mclennan, S.M.; Hemming, S.; Mcdaniel, D.K.; Hanson, G.N. Geochemical approaches to sedimentation, provenance, and tectonics. Geol. Soc. Am. 1993, 284, 21–40. [Google Scholar]
- Bock, B.; Mclennan, S.M.; Hanson, G.N. Geochemistry and provenance of the Middle Ordovician Austin Glen Member (Normanskill Formation) and the Taconian Orogeny in New England. Sedimentology 2010, 45, 635–655. [Google Scholar] [CrossRef]
- Yan, D.T.; Chen, D.Z.; Wang, Q.C.; Wang, J.G. Large-scale climatic fluctuations in the latest Ordovician on the Yangtze block, south China. Geology 2010, 38, 599–602. [Google Scholar] [CrossRef]
- Tang, X.; Zhang, J.C.; Liu, Y.; Yang, C.; Chen, Q.; Dang, W.; Zhao, P.W. Geochemistry of organic matter and elements of black shale during weathering in Northern Guizhou, Southwestern China: Their mobilization and inter-connection. Chem. Erde 2018, 78, 140–151. [Google Scholar] [CrossRef]
- Cullers, R.L.; Podkovyrov, V.N. Geochemistry of the Mesoproterozoic Lakhanda shales in southeastern Yakutia, Russia: Implications for mineralogical and provenance control, and recycling. Precambrian Res. 2000, 104, 77–93. [Google Scholar] [CrossRef]
- Nowrouzi, Z.; Moussavi-Harami, R.; Mahboubi, A.; Gharaie, M.H.M.; Ghaemi, F. Petrography and geochemistry of Silurian Niur sandstones, Derenjal Mountains, East Central Iran: Implications for tectonic setting, provenance and weathering. Arab. J. Geosci. 2014, 7, 2793–2813. [Google Scholar] [CrossRef]
- Mclennan, S.M.; Nance, W.B.; Taylor, S.R. Rare earth element-thorium correlations in sedimentary rocks, and the composition of the continental crust. Geochim. Cosmochim. Acta 1980, 44, 1833–1839. [Google Scholar] [CrossRef]
- Roddaz, M.; Viers, J.; Brusset, S.; Baby, P.; Boucayrand, C.; Hérail, G. Controls on weathering and provenance in the Amazonian foreland basin: Insights from major and trace element geochemistry of Neogene Amazonian sediments. Chem. Geol. 2006, 226, 31–65. [Google Scholar] [CrossRef]
- Bhatia, M.R.; Crook, K.A.W. Trace element characteristics of graywackes and tectonic setting discrimination of sedimentary basins. Contrib. Mineral. Petrol. 1986, 92, 181–193. [Google Scholar] [CrossRef]
- Yang, R.D.; Wu, X.H.; Yan, C.X.; Wang, C.Y. Geochemical character of Carboniferous sediment in Guizhou Province. J. Guizhou Inst. Technol. 1991, 20, 34–41. (In Chinese) [Google Scholar]
- Hatch, J.R.; Leventhal, J.S. Relationship between inferred redox potential of the depositional environment and geochemistry of the Upper Pennsylvanian (Missourian) Stark Shale Member of the Dennis Limestone, Wabaunsee County, Kansas, U.S.A. Chem. Geol. 1992, 99, 65–82. [Google Scholar] [CrossRef]
- Jones, B.; Manning, D.A.C. Comparison of geochemical indices used for the interpretation of palaeoredox conditions in ancient mudstones. Chem. Geol. 1994, 111, 111–129. [Google Scholar] [CrossRef]
- Shields, G.; Stille, P. Diagenetic constraints on the use of cerium anomalies as palaeoseawater redox proxies: An isotopic and REE study of Cambrian phosphorites. Chem. Geol. 2001, 175, 29–48. [Google Scholar] [CrossRef]
- Algeo, T.J.; Tribovillard, N. Environmental analysis of paleoceanographic systems based on molybdenum-uranium covariation. Chem. Geol. 2009, 268, 211–225. [Google Scholar] [CrossRef]
- Zhou, L.; Algeo, T.J.; Shen, J.; Hu, Z.; Gong, H.; Xie, S.C.; Huang, J.H.; Gao, S. Changes in marine productivity and redox conditions during the Late Ordovician Hirnantian glaciation. Palaeogeogr. Palaeoclimatol. Palaeoecol. 2015, 420, 223–234. [Google Scholar] [CrossRef]
- Roy, D.K.; Roser, B.P. Climatic control on the composition of Carboniferous–Permian Gondwana sediments, Khalaspir basin, Bangladesh. Gondwana Res. 2013, 23, 1163–1171. [Google Scholar] [CrossRef]
- Yandoka, B.M.S.; Wan, H.A.; Abubakar, M.B.; Hakimi, M.H.; Adegoke, A.K. Geochemical characterisation of Early Cretaceous lacustrine sediments of Bima Formation, Yola Sub-basin, Northern Benue Trough, NE Nigeria: Organic matter input, preservation, paleoenvironment and palaeoclimatic conditions. Mar. Petrol. Geol. 2015, 61, 82–94. [Google Scholar] [CrossRef]
- Yang, W.Q.; Jiang, Y.L.; Yong, W. Study on shale facies sedimentary environment of lower Es3-upper Es4 in Dongying sag. J. China Univ. Petrol. 2015, 39, 19–26. (In Chinese) [Google Scholar]
- Beckmann, B.; Flögel, S.; Hofmann, P.; Schulz, M.; Wagner, T. Orbital forcing of Cretaceous river discharge in tropical Africa and ocean response. Nature 2005, 437, 241–244. [Google Scholar] [CrossRef] [PubMed]
- Luo, S.W.; Fu, K. An outline map of lithofacies paleogeography in Guizhou Province. J. Guizhou Inst. Technol. 1964, 0, 24–43. (In Chinese) [Google Scholar]
- Nara, F.; Tani, Y.; Soma, Y.; Soma, M.; Naraoka, H.; Watanabe, T.; Horiuchi, K.; Kawai, T.; Oda, T.; Nakamura, T. Response of phytoplankton productivity to climate change recorded by sedimentary photosynthetic pigments in Lake Hovsgol (Mongolia) for the last 23,000 years. Quat. Int. 2005, 136, 71–81. [Google Scholar] [CrossRef]
- Francois, R.; Honjo, S.; Manganini, S.J.; Ravizza, G.E. Biogenic barium fluxes to the deep sea: Implications for paleoproductivity reconstruction. Glob. Biogeochem. Cycles 1995, 9, 289–303. [Google Scholar] [CrossRef]
- Dymond, J.; Suess, E.; Lyle, M. Barium in deep-sea sediment: A geochemical proxy for paleoproductivity. Paleoceanography 1992, 7, 163–181. [Google Scholar] [CrossRef]
- Mort, H.; Jacquat, O.; Adatte, T.; Steinmann, P.; Föllmi, K.; Matera, V.; Berner, Z.; Stüben, D. The Cenomanian/Turonian anoxic event at the Bonarelli Level in Italy and Spain: Enhanced productivity and/or better preservation? Cretac. Res. 2007, 28, 597–612. [Google Scholar] [CrossRef]
- Pedersen, T.F.; Calvert, S.E. Anoxia vs. productivity: What controls the formation of organic-carbon-rich sediments and sedimentary rocks? AAPG Bull. 1990, 74, 454–466. [Google Scholar]
- Caplan, M.L.; Bustin, R.M. Palaeoceanographic controls on geochemical characteristics of organic-rich Exshaw mudrocks: Role of enhanced primary production. Org. Geochem. 1999, 30, 161–188. [Google Scholar] [CrossRef]
- Sageman, B.B.; Murphy, A.E.; Werne, J.P.; Ver Straeten, C.A.; Hollander, D.J.; Lyons, T.W. A tale of shales: The relative roles of production, decomposition, and dilution in the accumulation of organic-rich strata, Middle-Upper Devonian, Appalachian basin. Chem. Geol. 2003, 195, 229–273. [Google Scholar] [CrossRef]
- Gallego-Torres, D.; Martínez-Ruiz, F.; Paytan, A.; Jiménez-Espejo, F.; Ortega-Huertas, M. Pliocene-Holocene evolution of depositional conditions in the eastern Mediterranean: Role of anoxia vs. productivity at time of sapropel deposition. Palaeogeogr. Palaeoclimatol. Palaeoecol. 2007, 246, 424–439. [Google Scholar] [CrossRef]
- Tyson, R.V. The “productivity versus preservation” controversy: Cause, flaws, and resolution. Soc. Sediment. Geol. 2005, 82, 17–33. [Google Scholar]
- Ibach, L.E.J. Relationship between sedimentation rate and total organic carbon content in ancient marine sediments. AAPG Bull. 1982, 66, 170–183. [Google Scholar]


| Sample No. | Lithology | Height (m) | TOC | SiO2 | Al2O3 | Fe2O3 | MgO | CaO | Na2O | K2O | MnO | TiO2 | P2O5 | LOI |
| ZN-1 | Marlstone | 1.2 | 0.97 | 40.37 | 12.24 | 6.7 | 1.83 | 24.48 | 1.55 | 3.36 | 0.047 | 0.83 | 0.051 | 8.07 |
| ZN-2 | Marlstone | 3.0 | 0.91 | 41.03 | 11.41 | 4.62 | 1.96 | 27.11 | 1.26 | 3.39 | 0.063 | 0.838 | 0.054 | 7.69 |
| ZN-3 | Marlstone | 6.0 | 0.90 | 41.73 | 10.87 | 4.61 | 1.97 | 26.33 | 1.07 | 3.39 | 0.066 | 0.843 | 0.054 | 8.99 |
| ZN-4 | Marlstone | 8.5 | 1.06 | 40.23 | 11.59 | 6.52 | 2.77 | 27.85 | 1.17 | 3.07 | 0.067 | 0.313 | 0.057 | 7.25 |
| ZN-5 | Shale | 10.2 | 1.36 | 64.3 | 16.37 | 3.12 | 1.2 | 4.53 | 0.78 | 2.18 | 0.015 | 0.881 | 0.03 | 4.45 |
| ZN-6 | Shale | 12.9 | 1.69 | 65.17 | 15.04 | 2.9 | 0.9 | 5.14 | 0.95 | 1.98 | 0.005 | 0.792 | 0.028 | 4.91 |
| ZN-7 | Shale | 14.8 | 1.51 | 60.23 | 16.02 | 3.94 | 1.32 | 6.1 | 0.74 | 2.48 | 0.009 | 0.88 | 0.024 | 3.02 |
| ZN-8 | Marlstone | 17.2 | 1.05 | 42.22 | 13.39 | 6.79 | 2.24 | 23.29 | 0.85 | 2.54 | 0.008 | 0.844 | 0.084 | 7.53 |
| ZN-9 | Mudstone | 20.0 | 1.64 | 63.28 | 15.42 | 3.17 | 1.21 | 5.11 | 0.83 | 1.8 | 0.01 | 0.682 | 0.029 | 2.85 |
| ZN-10 | Shale | 24.5 | 2.83 | 63.11 | 16.4 | 3.59 | 1.03 | 5.09 | 1.23 | 1.35 | 0.007 | 0.584 | 0.021 | 3.78 |
| ZN-11 | Shale | 27.0 | 2.29 | 60.76 | 15.69 | 4.76 | 1.78 | 4.61 | 0.84 | 2.33 | 0.012 | 0.825 | 0.041 | 3.82 |
| ZN-12 | Mudstone | 29.5 | 1.27 | 60.53 | 14.8 | 3.86 | 1.56 | 4.09 | 0.73 | 2.62 | 0.01 | 0.909 | 0.029 | 3.81 |
| ZN-13 | Mudstone | 31.5 | 1.42 | 60.87 | 14.39 | 3.48 | 1.34 | 5.1 | 0.97 | 2.52 | 0.012 | 0.934 | 0.026 | 3.21 |
| ZN-14 | Shale | 33.5 | 1.82 | 55.49 | 15.06 | 4.38 | 1.9 | 5.09 | 1.24 | 3.13 | 0.008 | 1.087 | 0.04 | 4.82 |
| ZN-15 | Shale | 35.5 | 1.72 | 56.7 | 13.91 | 4.82 | 1.98 | 4.69 | 1.38 | 2.84 | 0.007 | 1.001 | 0.046 | 5.17 |
| ZN-16 | Shale | 37.0 | 1.47 | 59.2 | 13.07 | 4.41 | 2.07 | 4.37 | 0.95 | 2.71 | 0.007 | 0.881 | 0.033 | 3.43 |
| ZN-17 | Shale | 38.7 | 1.93 | 56.24 | 13.84 | 4.64 | 1.55 | 3.95 | 0.85 | 2.66 | 0.003 | 1.044 | 0.03 | 5.33 |
| ZN-18 | Shale | 40.2 | 2.12 | 56.77 | 14.18 | 4.13 | 2.18 | 4.09 | 1.06 | 2.58 | 0.012 | 1.045 | 0.043 | 4.57 |
| ZN-19 | Mudstone | 46.5 | 1.19 | 64.52 | 15.27 | 4.22 | 1.74 | 4.81 | 1.13 | 2.66 | 0.003 | 0.976 | 0.028 | 4.71 |
| ZN-20 | Mudstone | 49.8 | 1.27 | 60.51 | 16.19 | 3.39 | 1.47 | 5.39 | 1.07 | 2.75 | 0.001 | 0.934 | 0.036 | 3.52 |
| ZN-21 | Marlstone | 52.0 | 1.08 | 41.25 | 13.21 | 4.95 | 2.2 | 27.15 | 0.6 | 2.82 | 0.002 | 0.902 | 0.035 | 7.69 |
| ZN-22 | Shale | 54.5 | 1.46 | 59.3 | 15.72 | 3.81 | 3.81 | 4.05 | 1.34 | 1.83 | 0.02 | 1.173 | 0.046 | 5.30 |
| ZN-23 | Shale | 56.0 | 1.42 | 61.83 | 15.01 | 3.54 | 3.78 | 4.48 | 0.94 | 1.74 | 0.021 | 1.073 | 0.044 | 4.95 |
| ZN-24 | Shale | 58.0 | 1.43 | 55.6 | 16.19 | 5.88 | 2.38 | 5.36 | 0.81 | 2.53 | 0.029 | 1.032 | 0.048 | 5.02 |
| ZN-25 | Mudstone | 63.2 | 1.14 | 52.25 | 18.56 | 5.7 | 2.55 | 4.61 | 1.12 | 2.3 | 0.043 | 0.803 | 0.043 | 5.21 |
| ZN-26 | Mudstone | 65.5 | 1.18 | 57.92 | 13.5 | 4.48 | 1.25 | 6.5 | 1.26 | 1.08 | 0.015 | 0.576 | 0.053 | 5.99 |
| ZN-27 | Mudstone | 68.0 | 1.38 | 65.45 | 13.83 | 2.25 | 1.4 | 5.34 | 1.21 | 1.82 | 0.003 | 0.406 | 0.015 | 5.79 |
| ZN-28 | Shale | 72.8 | 1.24 | 57.58 | 13.02 | 4.49 | 2.33 | 6.45 | 1.01 | 1.17 | 0.071 | 0.407 | 0.036 | 5.69 |
| ZN-29 | Shale | 75.6 | 1.29 | 56.92 | 14.38 | 6.22 | 4.14 | 6.25 | 1.08 | 1.2 | 0.097 | 0.449 | 0.025 | 5.99 |
| ZN-30 | Shale | 78.4 | 1.43 | 64.77 | 13.84 | 3.26 | 1.57 | 5.39 | 1.17 | 1.92 | 0.012 | 0.453 | 0.036 | 3.26 |
| Average | 1.45 | 56.20 | 14.41 | 4.42 | 1.98 | 9.23 | 1.04 | 2.36 | 0.02 | 0.81 | 0.04 | 5.19 | ||
| Sample No. | CIA | CIW | C-Value | Al/Na | ||||||||||
| ZN-1 | / | / | 0.21 | 4.80 | ||||||||||
| ZN-2 | / | / | 0.14 | 5.51 | ||||||||||
| ZN-3 | / | / | 0.14 | 6.18 | ||||||||||
| ZN-4 | / | / | 0.21 | 6.02 | ||||||||||
| ZN-5 | 76.87 | 86.45 | 0.35 | 12.76 | ||||||||||
| ZN-6 | 74.06 | 82.80 | 0.31 | 9.63 | ||||||||||
| ZN-7 | 75.79 | 86.81 | 0.36 | 13.16 | ||||||||||
| ZN-8 | / | / | 0.23 | 9.58 | ||||||||||
| ZN-9 | 76.72 | 84.96 | 0.35 | 11.30 | ||||||||||
| ZN-10 | 74.86 | 80.21 | 0.40 | 8.11 | ||||||||||
| ZN-11 | 74.80 | 85.03 | 0.49 | 11.36 | ||||||||||
| ZN-12 | 73.86 | 86.04 | 0.42 | 12.33 | ||||||||||
| ZN-13 | 70.86 | 81.85 | 0.34 | 9.02 | ||||||||||
| ZN-14 | 66.86 | 78.69 | 0.37 | 7.39 | ||||||||||
| ZN-15 | 64.63 | 75.40 | 0.43 | 6.13 | ||||||||||
| ZN-16 | 68.33 | 80.71 | 0.43 | 8.37 | ||||||||||
| ZN-17 | 70.92 | 83.19 | 0.50 | 9.90 | ||||||||||
| ZN-18 | 69.31 | 80.27 | 0.41 | 8.13 | ||||||||||
| ZN-19 | 75.63 | 88.21 | 0.40 | 8.22 | ||||||||||
| ZN-20 | 76.77 | 89.38 | 0.31 | 9.20 | ||||||||||
| ZN-21 | / | / | 0.15 | 13.39 | ||||||||||
| ZN-22 | 71.11 | 78.10 | 0.35 | 7.13 | ||||||||||
| ZN-23 | 75.11 | 82.92 | 0.33 | 9.71 | ||||||||||
| ZN-24 | 74.98 | 85.87 | 0.52 | 12.15 | ||||||||||
| ZN-25 | 75.04 | 83.44 | 0.53 | 10.08 | ||||||||||
| ZN-26 | 71.76 | 76.51 | 0.44 | 6.52 | ||||||||||
| ZN-27 | 69.92 | 77.65 | 0.23 | 6.95 | ||||||||||
| ZN-28 | 73.94 | 79.67 | 0.41 | 7.84 | ||||||||||
| ZN-29 | 74.78 | 80.19 | 0.50 | 8.10 | ||||||||||
| ZN-30 | 76.37 | 86.26 | 0.32 | 7.19 | ||||||||||
| Average | 71.20 | 81.50 | 0.35 | 8.87 |
| Sample No. | Sc | V | Cr | Co | Ni | Cu | Ga | Rb | ||||
| ZN-1 | 19.2 ± 1.5 | 193.3 ± 9.7 | 163.5 ± 6.5 | 46.3 ± 2.3 | 74.0 ± 3.7 | 17.7 ± 0.9 | 29.7 ± 1.2 | 162.3 ± 4.9 | ||||
| ZN-2 | 16.7 ± 1.3 | 176.0 ± 8.8 | 146.7 ± 5.9 | 6.5 ± 0.3 | 54.9 ± 2.7 | 18.8 ± 0.9 | 26.6 ± 1.1 | 141.4 ± 4.2 | ||||
| ZN-3 | 17.2 ± 1.4 | 194.6 ± 9.7 | 152.3 ± 6.1 | 5.2 ± 0.3 | 53.0 ± 2.6 | 21.4 ± 1.1 | 27.4 ± 1.1 | 152.8 ± 4.6 | ||||
| ZN-4 | 10.3 ± 0.8 | 88.9 ± 4.4 | 75.0 ± 3.0 | 11.4 ± 0.6 | 60.5 ± 3.0 | 14.6 ± 0.7 | 9.1 ± 0.4 | 52.3 ± 1.6 | ||||
| ZN-5 | 11.5 ± 0.9 | 190.4 ± 9.5 | 173.9 ± 7.0 | 7.1 ± 0.4 | 60.4 ± 3.0 | 27.0 ± 1.4 | 20.3 ± 0.8 | 102.2 ± 3.1 | ||||
| ZN-6 | 8.7 ± 0.7 | 150.67 ± 7.5 | 145.8 ± 5.8 | 3.8 ± 0.2 | 63.2 ± 3.2 | 15.6 ± 0.8 | 17.5 ± 0.7 | 78.6 ± 2.4 | ||||
| ZN-7 | 12.1 ± 1.0 | 167.9 ± 8.4 | 160.4 ± 6.4 | 8.3 ± 0.4 | 58.7 ± 2.9 | 33.3 ± 1.7 | 22.2 ± 0.9 | 105.7 ± 3.2 | ||||
| ZN-8 | 20.5 ± 1.6 | 191.7 ± 9.6 | 173.8 ± 7.0 | 25.9 ± 1.43 | 51.5 ± 2.6 | 12.2 ± 0.6 | 18.8 ± 0.8 | 113.7 ± 3.4 | ||||
| ZN-9 | 12.0 ± 1.0 | 125.6 ± 6.3 | 128.2 ± 5.1 | 11.7 ± 0.6 | 57.7 ± 2.9 | 26.8 ± 1.3 | 15.9 ± 0.6 | 85.7 ± 2.6 | ||||
| ZN-10 | 10.5 ± 0.3 | 111.7 ± 5.6 | 110.2 ± 4.4 | 10.4 ± 0.5 | 66.5 ± 3.3 | 32.4 ± 1.6 | 13.2 ± 0.5 | 63.2 ± 1.9 | ||||
| ZN-11 | 14.4 ± 1.1 | 158.5 ± 7.9 | 151.7 ± 6.1 | 10.6 ± 0.5 | 75.2 ± 3.8 | 27.8 ± 1.4 | 20.6 ± 0.8 | 102.3 ± 3.1 | ||||
| ZN-12 | 14.5 ± 1.2 | 155.6 ± 7.8 | 154.9 ± 6.2 | 11.0 ± 0.5 | 61.0 ± 3.1 | 22.0 ± 1.1 | 22.1 ± 0.9 | 113.3 ± 3.4 | ||||
| ZN-13 | 15.0 ± 1.2 | 199.5 ± 10.0 | 192.0 ± 7.7 | 14.2 ± 0.7 | 89.3 ± 4.5 | 29.7 ± 1.5 | 22.4 ± 0.9 | 119.7 ± 3.6 | ||||
| ZN-14 | 18.9 ± 1.5 | 244.1 ± 12.2 | 203.0 ± 8.1 | 13.9 ± 0.7 | 82.6 ± 4.1 | 27.8 ± 1.4 | 27.2 ± 1.1 | 151.2 ± 4.5 | ||||
| ZN-15 | 17.5 ± 1.4 | 215.6 ± 10.8 | 191.4 ± 7.7 | 14.6 ± 0.7 | 103.6 ± 5.2 | 30.2 ± 1.5 | 24.4 ± 1.0 | 136.2 ± 4.1 | ||||
| ZN-16 | 15.5 ± 1.2 | 181.6 ± 9.1 | 165.5 ± 6.6 | 12.5 ± 0.6 | 74.0 ± 3.7 | 36.7 ± 1.8 | 23.3 ± 0.9 | 118.2 ± 3.5 | ||||
| ZN-17 | 16.6 ± 1.3 | 211.4 ± 10.6 | 184.7 ± 7.4 | 16.9 ± 0.8 | 72.7 ± 3.6 | 29.0 ± 1.4 | 23.0 ± 0.9 | 119.4 ± 3.6 | ||||
| ZN-18 | 18.6 ± 1.5 | 229.8 ± 11.5 | 209.8 ± 8.4 | 9.9 ± 0.5 | 67.4 ± 3.3 | 20.1 ± 1.0 | 23.7 ± 0.9 | 127.2 ± 3.8 | ||||
| ZN-19 | 19.5 ± 1.6 | 202.7 ± 10.1 | 186.1 ± 7.4 | 16.5 ± 0.8 | 27.0 ± 1.4 | 14.2 ± 0.7 | 20.2 ± 0.8 | 120.5 ± 3.6 | ||||
| ZN-20 | 16.0 ± 1.3 | 223.9 ± 11.2 | 204.8 ± 8.2 | 16.2 ± 0.8 | 38.2 ± 1.9 | 10.9 ± 0.5 | 22.0 ± 0.9 | 135.3 ± 4.1 | ||||
| ZN-21 | 19.5 ± 1.6 | 235.3 ± 11.8 | 198.8 ± 8.0 | 16.7 ± 0.8 | 35.6 ± 1.8 | 10.5 ± 0.5 | 22.6 ± 0.9 | 137.2 ± 4.1 | ||||
| ZN-22 | 15.4 ± 1.2 | 200.0 ± 10.0 | 196.3 ± 7.9 | 16.1 ± 0.8 | 58.8 ± 2.9 | 11.5 ± 0.6 | 22.4 ± 0.9 | 91.5 ± 2.7 | ||||
| ZN-23 | 14.1 ± 1.1 | 169.3 ± 8.5 | 148.6 ± 5.9 | 11.3 ± 0.6 | 51.1 ± 2.6 | 18.6 ± 0.9 | 20.8 ± 0.8 | 74.0 ± 2.2 | ||||
| ZN-24 | 16.9 ± 1.3 | 203.6 ± 10.2 | 173.8 ± 7.0 | 8.7 ± 0.4 | 39.6 ± 2.0 | 13.7 ± 0.7 | 21.6 ± 0.9 | 129.2 ± 3.9 | ||||
| ZN-25 | 18.1 ± 1.4 | 171.2 ± 8.6 | 142.3 ± 6.7 | 6.5 ± 0.3 | 34.6 ± 1.7 | 14.5 ± 0.7 | 21.4 ± 0.9 | 102.0 ± 3.1 | ||||
| ZN-26 | 10.9 ± 0.9 | 131.2 ± 6.6 | 216.4 ± 8.7 | 8.3 ± 0.4 | 39.2 ± 2.0 | 12.2 ± 0.6 | 12.4 ± 0.5 | 51.7 ± 1.6 | ||||
| ZN-27 | 6.1 ± 0.9 | 103.6 ± 5.2 | 278.4 ± 11.1 | 5.0 ± 0.3 | 26.1 ± 1.3 | 7.2 ± 0.4 | 8.2 ± 0.3 | 45.5 ± 1.4 | ||||
| ZN-28 | 9.4 ± 0.7 | 100.1 ± 5.0 | 96.1 ± 3.8 | 9.5 ± 0.5 | 50.4 ± 2.5 | 14.5 ± 0.7 | 9.2 ± 0.4 | 56.6 ± 1.7 | ||||
| ZN-29 | 11.3 ± 0.9 | 118.2 ± 5.9 | 111.5 ± 4.5 | 11.0 ± 0.6 | 52.6 ± 2.6 | 14.7 ± 0.7 | 9.6 ± 0.4 | 67.0 ± 2.0 | ||||
| ZN-30 | 9.1 ± 0.7 | 107.1 ± 5.4 | 115.0 ± 4.6 | 5.5 ± 0.3 | 36.2 ± 1.8 | 12.0 ± 0.6 | 13.0 ± 0.5 | 92.1 ± 2.8 | ||||
| Average | 14.5 | 171.8 | 165 | 12.4 | 57.2 | 19.9 | 19.7 | 104.9 | ||||
| STDEV | 3.78 | 43.28 | 40.7 | 7.79 | 17.96 | 8.02 | 5.75 | 32.21 | ||||
| Sample No. | Sr | Zr | Mo | Cs | Ba | Th | U | |||||
| ZN-1 | 243.4 ± 7.3 | 117.3 ± 4.7 | 1.6 ± 0.1 | 14.2 ± 0.7 | 89.7 ± 3.6 | 21.9 ± 0.9 | 3.2 ± 0.1 | |||||
| ZN-2 | 206.3 ± 6.2 | 112.0 ± 4.5 | 1.1 ± 0.1 | 12.7 ± 0.6 | 176.4 ± 7.1 | 20.5 ± 0.8 | 3.3 ± 0.1 | |||||
| ZN-3 | 222.4 ± 6.7 | 115.7 ± 4.6 | 1.0 ± 0 | 12.5 ± 0.6 | 168.7 ± 6.7 | 19.3 ± 0.8 | 3.2 ± 0.1 | |||||
| ZN-4 | 464.1 ± 13.9 | 41.0 ± 1.6 | 2.4 ± 0.1 | 4.3 ± 0.2 | 80.9 ± 3.2 | 8.2 ± 0.3 | 3.0 ± 0.1 | |||||
| ZN-5 | 177.7 ± 5.3 | 117.7 ± 4.7 | 1.7 ± 0.1 | 7.0 ± 0.4 | 177.4 ± 7.1 | 16.0 ± 0.6 | 3.4 ± 0.1 | |||||
| ZN-6 | 155.2 ± 4.7 | 106.4 ± 4.3 | 1.9 ± 0.1 | 6.5 ± 0.3 | 169.7 ± 6.8 | 16.3 ± 0.7 | 3.3 ± 0.1 | |||||
| ZN-7 | 164.9 ± 4.9 | 123.0 ± 4.9 | 1.8 ± 0.1 | 8.0 ± 0.4 | 198.2 ± 7.9 | 17.7 ± 0.7 | 4.3 ± 0.2 | |||||
| ZN-8 | 181.1 ± 5.4 | 130.1 ± 5.2 | 1.6 ± 0.1 | 8.0 ± 0.4 | 180.8 ± 7.2 | 19.9 ± 0.8 | 3.1 ± 0.1 | |||||
| ZN-9 | 126.5 ± 3.8 | 100.2 ± 4.0 | 2.4 ± 0.1 | 5.1 ± 0.3 | 103.9 ± 4.2 | 13.4 ± 0.5 | 3.1 ± 0.1 | |||||
| ZN-10 | 109.4 ± 3.3 | 96.1 ± 3.8 | 3.9 ± 0.2 | 4.5 ± 0.2 | 322.7 ± 12.9 | 10.6 ± 0.4 | 4.1 ± 0.2 | |||||
| ZN-11 | 154.23 ± 4.6 | 116.2 ± 4.6 | 3.2 ± 0.2 | 8.0 ± 0.4 | 191.5 ± 7.7 | 17.6 ± 0.7 | 4.4 ± 0.2 | |||||
| ZN-12 | 171.1 ± 5.1 | 125.2 ± 5.0 | 2.0 ± 0.1 | 8.5 ± 0.4 | 187.2 ± 7.5 | 18.8 ± 0.8 | 4.3 ± 0.2 | |||||
| ZN-13 | 206.5 ± 6.2 | 143.4 ± 5.7 | 2.5 ± 0.1 | 9.3 ± 0.5 | 206.6 ± 8.3 | 18.9 ± 0.8 | 4.1 ± 0.2 | |||||
| ZN-14 | 213.2 ± 6.4 | 151.1 ± 6.0 | 1.8 ± 0.1 | 10.5 ± 0.5 | 240.7 ± 9.6 | 20.6 ± 0.8 | 4.9 ± 0.2 | |||||
| ZN-15 | 202.6 ± 6.1 | 153.8 ± 6.2 | 1.9 ± 0.1 | 11.1 ± 0.6 | 242.2 ± 9.7 | 19.2 ± 0.8 | 4.5 ± 0.2 | |||||
| ZN-16 | 188.1 ± 5.6 | 125.7 ± 5.0 | 1.7 ± 0.1 | 9.3 ± 0.5 | 212.3 ± 8.5 | 17.8 ± 0.7 | 4.1 ± 0.2 | |||||
| ZN-17 | 196.3 ± 5.9 | 149.8 ± 6.0 | 2.6 ± 0.1 | 9.9 ± 0.5 | 216.6 ± 8.7 | 21.4 ± 0.9 | 5.2 ± 0.2 | |||||
| ZN-18 | 219.5 ± 6.6 | 156.4 ± 6.3 | 2.3 ± 0.1 | 9.2 ± 0.5 | 198.5 ± 7.9 | 19.1 ± 0.8 | 4.5 ± 0.2 | |||||
| ZN-19 | 156.0 ± 4.7 | 143.1 ± 5.7 | 1.2 ± 0.1 | 7.9 ± 0.4 | 195.9 ± 7.8 | 20.9 ± 0.8 | 3.7 ± 0.1 | |||||
| ZN-20 | 176.4 ± 5.3 | 133.4 ± 5.3 | 1.2 ± 0.1 | 8.2 ± 0.4 | 195.0 ± 7.8 | 21.9 ± 0.9 | 3.9 ± 0.2 | |||||
| ZN-21 | 169.2 ± 5.1 | 134.2 ± 5.4 | 1.8 ± 0.1 | 8.0 ± 0.4 | 188.6 ± 7.5 | 21.5 ± 0.9 | 3.6 ± 0.1 | |||||
| ZN-22 | 199.6 ± 6.0 | 167.6 ± 6.7 | 1.7 ± 0.1 | 6.9 ± 0.3 | 227.3 ± 9.1 | 25.2 ± 1.0 | 4.4 ± 0.2 | |||||
| ZN-23 | 158.8 ± 4.8 | 131.8 ± 5.3 | 1.4 ± 0.1 | 6.2 ± 0.3 | 109.4 ± 4.4 | 24.1 ± 1.0 | 4.0 ± 0.2 | |||||
| ZN-24 | 316.4 ± 9.5 | 139.5 ± 5.6 | 1.6 ± 0.1 | 9.5 ± 0.5 | 193.7 ± 7.7 | 22.2 ± 0.9 | 4.0 ± 0.2 | |||||
| ZN-25 | 296.8 ± 8.9 | 110.2 ± 4.4 | 2.7 ± 0.1 | 7.8 ± 0.4 | 189.1 ± 7.6 | 17.9 ± 0.7 | 3.2 ± 0.1 | |||||
| ZN-26 | 573.8 ± 17.2 | 90.5 ± 3.6 | 2.3 ± 0.1 | 8.6 ± 0.5 | 171.6 ± 6.9 | 13.4 ± 0.5 | 2.6 ± 0.1 | |||||
| ZN-27 | 356.7 ± 10.7 | 68.0 ± 2.7 | 3.1 ± 0.2 | 5.9 ± 0.3 | 151.4 ± 6.1 | 8.1 ± 0.3 | 5.8 ± 0.2 | |||||
| ZN-28 | 704.9 ± 21.1 | 65.2 ± 2.6 | 1.7 ± 0.1 | 5.3 ± 0.3 | 154.7 ± 6.2 | 8.8 ± 0.4 | 3.1 ± 0.1 | |||||
| ZN-29 | 795.4 ± 23.9 | 75.3 ± 3.0 | 1.4 ± 0.1 | 5.6 ± 0.3 | 157.3 ± 6.3 | 10.6 ± 0.4 | 3.1 ± 0.1 | |||||
| ZN-30 | 149.7 ± 4.5 | 68.8 ± 2.8 | 3.4 ± 0.2 | 4.6 ± 0.2 | 161.6 ± 6.5 | 7.7 ± 0.3 | 3.5 ± 0.1 | |||||
| Average | 255.2 | 116.9 | 2 | 8.1 | 182 | 17.3 | 3.8 | |||||
| STDEV | 163.95 | 30.13 | 0.7 | 2.44 | 46.97 | 4.91 | 0.72 | |||||
| Sample No. | U/Th | V/Cr | Ni/Co | V/(V + Ni) | La/Sc | La/Co | Th/Sc | Co/Th | Cr/Th | La/Th | Sr/Cu | Ga/Rb |
| ZN-1 | 0.15 | 1.18 | 1.6 | 0.72 | 2.63 | 1.09 | 1.14 | 2.11 | 7.45 | 2.3 | 13.74 | 0.18 |
| ZN-2 | 0.16 | 1.2 | 8.49 | 0.76 | 2.84 | 7.35 | 1.22 | 0.32 | 7.17 | 2.32 | 10.97 | 0.19 |
| ZN-3 | 0.17 | 1.28 | 10.11 | 0.79 | 2.66 | 8.75 | 1.12 | 0.27 | 7.88 | 2.37 | 10.39 | 0.18 |
| ZN-4 | 0.37 | 1.18 | 5.33 | 0.6 | 3.12 | 2.85 | 0.79 | 1.38 | 9.14 | 3.93 | 31.91 | 0.17 |
| ZN-5 | 0.21 | 1.1 | 8.54 | 0.76 | 3.15 | 5.11 | 1.39 | 0.44 | 10.89 | 2.26 | 6.58 | 0.2 |
| ZN-6 | 0.2 | 1.03 | 16.45 | 0.7 | 4.38 | 9.9 | 1.88 | 0.24 | 8.93 | 2.33 | 9.96 | 0.22 |
| ZN-7 | 0.24 | 1.05 | 7.04 | 0.74 | 3.41 | 4.94 | 1.46 | 0.47 | 9.07 | 2.33 | 4.95 | 0.21 |
| ZN-8 | 0.15 | 1.1 | 1.99 | 0.79 | 1.76 | 1.39 | 0.97 | 1.3 | 8.74 | 1.81 | 14.8 | 0.17 |
| ZN-9 | 0.23 | 0.98 | 4.93 | 0.69 | 2.69 | 2.76 | 1.11 | 0.88 | 9.59 | 2.42 | 4.72 | 0.19 |
| ZN-10 | 0.38 | 1.01 | 6.4 | 0.63 | 2.59 | 2.62 | 1.01 | 0.98 | 10.4 | 2.56 | 3.38 | 0.21 |
| ZN-11 | 0.25 | 1.04 | 7.09 | 0.68 | 3.13 | 4.24 | 1.23 | 0.6 | 8.62 | 2.56 | 5.55 | 0.2 |
| ZN-12 | 0.23 | 1 | 5.56 | 0.72 | 2.82 | 3.72 | 1.3 | 0.58 | 8.25 | 2.17 | 7.77 | 0.2 |
| ZN-13 | 0.22 | 1.04 | 6.3 | 0.69 | 2.94 | 3.12 | 1.26 | 0.75 | 10.16 | 2.34 | 6.96 | 0.19 |
| ZN-14 | 0.24 | 1.2 | 5.96 | 0.75 | 2.87 | 3.9 | 1.09 | 0.67 | 9.88 | 2.63 | 7.68 | 0.18 |
| ZN-15 | 0.24 | 1.13 | 7.08 | 0.68 | 3.06 | 3.67 | 1.1 | 0.76 | 9.96 | 2.79 | 6.7 | 0.18 |
| ZN-16 | 0.23 | 1.1 | 5.9 | 0.71 | 2.96 | 3.66 | 1.15 | 0.71 | 9.31 | 2.58 | 5.13 | 0.2 |
| ZN-17 | 0.24 | 1.14 | 4.31 | 0.74 | 2.73 | 2.69 | 1.29 | 0.79 | 8.64 | 2.12 | 6.77 | 0.19 |
| ZN-18 | 0.23 | 1.1 | 6.83 | 0.77 | 2.48 | 4.65 | 1.03 | 0.52 | 10.98 | 2.4 | 10.91 | 0.19 |
| ZN-19 | 0.18 | 1.09 | 1.63 | 0.88 | 1.82 | 2.14 | 1.07 | 0.79 | 8.9 | 1.69 | 11.01 | 0.17 |
| ZN-20 | 0.18 | 1.09 | 2.36 | 0.85 | 2.43 | 2.41 | 1.37 | 0.74 | 9.34 | 1.78 | 16.16 | 0.16 |
| ZN-21 | 0.17 | 1.18 | 2.14 | 0.87 | 1.96 | 2.3 | 1.1 | 0.78 | 9.25 | 1.78 | 16.18 | 0.16 |
| ZN-22 | 0.18 | 1.02 | 3.65 | 0.77 | 2.87 | 2.74 | 1.64 | 0.64 | 7.78 | 1.75 | 17.31 | 0.24 |
| ZN-23 | 0.17 | 1.14 | 4.51 | 0.77 | 2.87 | 3.58 | 1.71 | 0.47 | 6.16 | 1.68 | 8.55 | 0.28 |
| ZN-24 | 0.18 | 1.17 | 4.55 | 0.84 | 2.51 | 4.88 | 1.31 | 0.39 | 7.83 | 1.91 | 23.13 | 0.17 |
| ZN-25 | 0.18 | 1.2 | 5.31 | 0.83 | 1.95 | 5.42 | 0.99 | 0.36 | 7.95 | 1.97 | 20.49 | 0.21 |
| ZN-26 | 0.2 | 0.61 | 4.74 | 0.77 | 3.28 | 4.32 | 1.22 | 0.62 | 16.21 | 2.68 | 47.23 | 0.24 |
| ZN-27 | 0.71 | 0.37 | 5.22 | 0.8 | 3.65 | 4.43 | 1.34 | 0.62 | 34.31 | 2.73 | 49.75 | 0.18 |
| ZN-28 | 0.35 | 1.04 | 5.28 | 0.67 | 2.59 | 2.56 | 0.93 | 1.08 | 10.91 | 2.78 | 48.71 | 0.16 |
| ZN-29 | 0.29 | 1.06 | 4.76 | 0.69 | 2.51 | 2.56 | 0.94 | 1.05 | 10.57 | 2.68 | 54.17 | 0.14 |
| ZN-30 | 0.45 | 0.93 | 6.56 | 0.75 | 2.59 | 4.3 | 0.85 | 0.71 | 14.86 | 3.06 | 12.51 | 0.14 |
| Average | 0.25 | 1.06 | 5.69 | 0.75 | 2.78 | 3.94 | 0.85 | 0.73 | 10.3 | 2.36 | 16.47 | 0.19 |
| Sample No. | Al (%) | EFSc | EFV | EFCr | EFCo | EFNi | EFCu | EFGa | EFRb | EFSr | EFMo | EFCs | EFBa | EFTh | EFU |
|---|---|---|---|---|---|---|---|---|---|---|---|---|---|---|---|
| ZN-1 | 6.48 | 2.02 | 2.03 | 2.48 | 3.32 | 1.49 | 0.54 | 2.13 | 1.58 | 1.11 | 0.85 | 3.53 | 0.21 | 2.49 | 0.10 |
| ZN-2 | 6.04 | 1.88 | 1.98 | 2.39 | 0.50 | 1.18 | 0.61 | 2.05 | 1.48 | 1.01 | 0.60 | 3.39 | 0.44 | 2.49 | 0.11 |
| ZN-3 | 5.75 | 2.04 | 2.30 | 2.60 | 0.42 | 1.20 | 0.73 | 2.21 | 1.68 | 1.14 | 0.57 | 3.51 | 0.45 | 2.47 | 0.11 |
| ZN-4 | 6.14 | 1.15 | 0.99 | 1.20 | 0.86 | 1.28 | 0.47 | 0.69 | 0.54 | 2.23 | 1.34 | 1.14 | 0.20 | 0.98 | 0.10 |
| ZN-5 | 8.67 | 0.90 | 1.49 | 1.97 | 0.38 | 0.91 | 0.61 | 1.09 | 0.74 | 0.60 | 0.68 | 1.31 | 0.31 | 1.35 | 0.08 |
| ZN-6 | 7.96 | 0.74 | 1.29 | 1.80 | 0.22 | 1.03 | 0.38 | 1.02 | 0.62 | 0.57 | 0.83 | 1.32 | 0.32 | 1.51 | 0.08 |
| ZN-7 | 8.48 | 0.97 | 1.35 | 1.86 | 0.46 | 0.90 | 0.77 | 1.22 | 0.79 | 0.57 | 0.72 | 1.52 | 0.36 | 1.53 | 0.10 |
| ZN-8 | 7.09 | 1.97 | 1.84 | 2.41 | 1.70 | 0.94 | 0.34 | 1.23 | 1.01 | 0.75 | 0.76 | 1.82 | 0.39 | 2.06 | 0.09 |
| ZN-9 | 8.16 | 1.00 | 1.05 | 1.54 | 0.67 | 0.92 | 0.65 | 0.90 | 0.66 | 0.46 | 1.02 | 1.01 | 0.19 | 1.20 | 0.07 |
| ZN-10 | 8.68 | 0.82 | 0.87 | 1.25 | 0.56 | 1.00 | 0.73 | 0.70 | 0.46 | 0.37 | 1.55 | 0.83 | 0.57 | 0.90 | 0.09 |
| ZN-11 | 8.31 | 1.18 | 1.30 | 1.79 | 0.59 | 1.18 | 0.66 | 1.15 | 0.78 | 0.55 | 1.32 | 1.55 | 0.35 | 1.56 | 0.10 |
| ZN-12 | 7.84 | 1.26 | 1.35 | 1.94 | 0.65 | 1.01 | 0.55 | 1.31 | 0.91 | 0.64 | 0.88 | 1.75 | 0.36 | 1.76 | 0.11 |
| ZN-13 | 7.62 | 1.34 | 1.78 | 2.48 | 0.87 | 1.52 | 0.76 | 1.37 | 0.99 | 0.80 | 1.13 | 1.97 | 0.41 | 1.82 | 0.11 |
| ZN-14 | 7.97 | 1.61 | 2.08 | 2.50 | 0.81 | 1.35 | 0.68 | 1.59 | 1.20 | 0.79 | 0.79 | 2.13 | 0.46 | 1.90 | 0.12 |
| ZN-15 | 7.36 | 1.62 | 1.99 | 2.55 | 0.92 | 1.83 | 0.81 | 1.54 | 1.17 | 0.81 | 0.89 | 2.44 | 0.50 | 1.92 | 0.12 |
| ZN-16 | 6.92 | 1.52 | 1.78 | 2.35 | 0.84 | 1.39 | 1.04 | 1.57 | 1.08 | 0.80 | 0.87 | 2.17 | 0.47 | 1.89 | 0.12 |
| ZN-17 | 7.33 | 1.54 | 1.96 | 2.48 | 1.07 | 1.29 | 0.78 | 1.46 | 1.03 | 0.79 | 1.20 | 2.17 | 0.45 | 2.15 | 0.14 |
| ZN-18 | 7.51 | 1.68 | 2.08 | 2.75 | 0.61 | 1.17 | 0.53 | 1.47 | 1.07 | 0.86 | 1.07 | 1.98 | 0.40 | 1.87 | 0.12 |
| ZN-19 | 8.08 | 1.64 | 1.70 | 2.26 | 0.95 | 0.43 | 0.34 | 1.16 | 0.94 | 0.57 | 0.52 | 1.57 | 0.37 | 1.90 | 0.09 |
| ZN-20 | 8.57 | 1.27 | 1.78 | 2.35 | 0.88 | 0.58 | 0.25 | 1.20 | 1.00 | 0.61 | 0.49 | 1.54 | 0.35 | 1.88 | 0.09 |
| ZN-21 | 6.99 | 1.89 | 2.29 | 2.79 | 1.11 | 0.66 | 0.29 | 1.50 | 1.24 | 0.71 | 0.90 | 1.84 | 0.41 | 2.26 | 0.10 |
| ZN-22 | 8.32 | 1.26 | 1.63 | 2.32 | 0.90 | 0.92 | 0.27 | 1.25 | 0.69 | 0.71 | 0.72 | 1.33 | 0.42 | 2.23 | 0.10 |
| ZN-23 | 7.95 | 1.21 | 1.45 | 1.84 | 0.66 | 0.84 | 0.46 | 1.22 | 0.59 | 0.59 | 0.60 | 1.26 | 0.21 | 2.23 | 0.10 |
| ZN-24 | 8.57 | 1.34 | 1.61 | 1.99 | 0.47 | 0.60 | 0.31 | 1.17 | 0.95 | 1.09 | 0.62 | 1.78 | 0.34 | 1.90 | 0.09 |
| ZN-25 | 9.83 | 1.25 | 1.18 | 1.42 | 0.31 | 0.46 | 0.29 | 1.01 | 0.66 | 0.89 | 0.94 | 1.28 | 0.29 | 1.34 | 0.06 |
| ZN-26 | 7.15 | 1.04 | 1.25 | 2.97 | 0.54 | 0.71 | 0.33 | 0.81 | 0.46 | 2.37 | 1.10 | 1.95 | 0.37 | 1.37 | 0.07 |
| ZN-27 | 7.32 | 0.56 | 0.96 | 3.74 | 0.32 | 0.46 | 0.19 | 0.52 | 0.39 | 1.44 | 1.47 | 1.30 | 0.32 | 0.81 | 0.15 |
| ZN-28 | 6.89 | 0.93 | 0.99 | 1.37 | 0.64 | 0.95 | 0.41 | 0.62 | 0.52 | 3.01 | 0.84 | 1.23 | 0.34 | 0.94 | 0.09 |
| ZN-29 | 7.61 | 1.01 | 1.06 | 1.44 | 0.67 | 0.90 | 0.38 | 0.59 | 0.56 | 3.08 | 0.64 | 1.19 | 0.32 | 1.02 | 0.08 |
| ZN-30 | 7.33 | 0.85 | 0.99 | 1.54 | 0.35 | 0.64 | 0.32 | 0.83 | 0.79 | 0.60 | 1.58 | 1.01 | 0.34 | 0.78 | 0.09 |
| Average | 7.63 | 1.32 | 1.55 | 2.15 | 0.78 | 0.99 | 0.52 | 1.22 | 0.89 | 1.09 | 0.92 | 1.76 | 0.36 | 1.68 | 0.10 |
| Sample No. | La | Ce | Pr | Nd | Sm | Eu | Gd | Tb | Dy | Ho | Er | Tm | Yb | Lu |
| ZN-1 | 50.56 | 89.87 | 9.6 | 35.43 | 5.87 | 0.95 | 4.48 | 0.57 | 3.02 | 0.67 | 2.06 | 0.37 | 2.64 | 0.42 |
| ZN-2 | 47.52 | 82.36 | 8.95 | 32.96 | 5.42 | 0.81 | 3.9 | 0.51 | 2.81 | 0.63 | 1.9 | 0.35 | 2.45 | 0.39 |
| ZN-3 | 45.86 | 80.22 | 8.83 | 33.06 | 5.38 | 0.82 | 4.17 | 0.54 | 2.87 | 0.64 | 1.97 | 0.35 | 2.51 | 0.39 |
| ZN-4 | 32.29 | 52.68 | 6.44 | 27.48 | 8.85 | 1.6 | 9.2 | 1.54 | 7.86 | 1.52 | 3.77 | 0.59 | 3.85 | 0.6 |
| ZN-5 | 36.14 | 62.72 | 7.29 | 28.02 | 5.01 | 0.78 | 3.69 | 0.52 | 2.69 | 0.59 | 1.75 | 0.31 | 2.25 | 0.36 |
| ZN-6 | 38.01 | 67.49 | 7.6 | 28.52 | 4.84 | 0.69 | 3.27 | 0.4 | 2.07 | 0.44 | 1.44 | 0.25 | 1.85 | 0.29 |
| ZN-7 | 41.15 | 68.29 | 8.09 | 30.5 | 4.83 | 0.7 | 3.5 | 0.42 | 2.36 | 0.56 | 1.78 | 0.32 | 2.36 | 0.37 |
| ZN-8 | 35.96 | 59.7 | 8.9 | 37.59 | 10.44 | 2.17 | 9.53 | 1.6 | 8.07 | 1.49 | 3.72 | 0.61 | 4.1 | 0.62 |
| ZN-9 | 32.3 | 55.76 | 7.27 | 30.56 | 6.95 | 1.49 | 7.21 | 1.07 | 5.42 | 1.1 | 2.98 | 0.51 | 3.54 | 0.56 |
| ZN-10 | 27.16 | 43.67 | 5.4 | 20.56 | 3.44 | 0.52 | 2.79 | 0.36 | 1.88 | 0.4 | 1.27 | 0.22 | 1.64 | 0.26 |
| ZN-11 | 44.98 | 74.94 | 9.29 | 36.13 | 6.32 | 1.07 | 4.74 | 0.65 | 3.43 | 0.73 | 2.22 | 0.39 | 2.82 | 0.46 |
| ZN-12 | 40.8 | 72.02 | 8.44 | 32.39 | 5.89 | 0.94 | 4.57 | 0.64 | 3.33 | 0.74 | 2.3 | 0.42 | 2.97 | 0.48 |
| ZN-13 | 44.15 | 78.32 | 9.17 | 34.49 | 5.98 | 0.84 | 3.91 | 0.45 | 2.11 | 0.46 | 1.55 | 0.29 | 2.21 | 0.36 |
| ZN-14 | 54.09 | 97.13 | 11.86 | 48.97 | 11.52 | 2.74 | 12.04 | 1.84 | 9.43 | 1.94 | 5.15 | 0.87 | 5.92 | 0.95 |
| ZN-15 | 53.65 | 98.1 | 12.07 | 50.66 | 13.1 | 3.23 | 13.79 | 2.16 | 10.95 | 2.22 | 5.79 | 0.95 | 6.38 | 1.03 |
| ZN-16 | 45.85 | 83.5 | 9.81 | 39.39 | 8.19 | 1.65 | 7.89 | 1.16 | 6.03 | 1.26 | 3.46 | 0.59 | 4.05 | 0.65 |
| ZN-17 | 45.33 | 82.73 | 9.04 | 33.6 | 5.73 | 0.85 | 4.13 | 0.53 | 2.89 | 0.64 | 1.98 | 0.36 | 2.69 | 0.43 |
| ZN-18 | 45.92 | 85.97 | 10.16 | 40.05 | 8.24 | 1.39 | 5.99 | 0.84 | 4.1 | 0.82 | 2.36 | 0.42 | 2.99 | 0.47 |
| ZN-19 | 35.41 | 79.61 | 7.3 | 27.73 | 4.94 | 0.93 | 4.31 | 0.67 | 3.6 | 0.8 | 2.36 | 0.42 | 2.92 | 0.46 |
| ZN-20 | 38.94 | 89.53 | 8.08 | 29.53 | 4.61 | 0.73 | 3.51 | 0.43 | 2.31 | 0.54 | 1.68 | 0.31 | 2.3 | 0.36 |
| ZN-21 | 38.25 | 97.92 | 8.65 | 32.86 | 6.23 | 1.15 | 5.78 | 0.85 | 4.6 | 0.99 | 2.8 | 0.49 | 3.3 | 0.53 |
| ZN-22 | 44.2 | 90.65 | 8.3 | 29.77 | 4.61 | 0.75 | 3.71 | 0.45 | 2.4 | 0.54 | 1.81 | 0.34 | 2.48 | 0.41 |
| ZN-23 | 40.55 | 82.39 | 7.59 | 27.28 | 4.22 | 0.65 | 3.35 | 0.42 | 2.26 | 0.51 | 1.64 | 0.31 | 2.31 | 0.38 |
| ZN-24 | 42.43 | 89.06 | 8.36 | 30.91 | 5.27 | 0.77 | 4.04 | 0.51 | 2.65 | 0.59 | 1.87 | 0.34 | 2.51 | 0.4 |
| ZN-25 | 35.3 | 72.38 | 7.1 | 26.8 | 4.52 | 0.76 | 3.62 | 0.47 | 2.61 | 0.56 | 1.75 | 0.31 | 2.26 | 0.36 |
| ZN-26 | 35.75 | 64.35 | 7.5 | 29.91 | 5.36 | 0.8 | 4.68 | 0.67 | 3.66 | 0.79 | 2.26 | 0.37 | 2.51 | 0.38 |
| ZN-27 | 22.16 | 33.84 | 3.87 | 14.81 | 2.52 | 0.3 | 2.21 | 0.32 | 1.91 | 0.42 | 1.25 | 0.21 | 1.44 | 0.22 |
| ZN-28 | 24.45 | 38.21 | 6.09 | 27.12 | 5.94 | 1.25 | 5.08 | 0.76 | 3.37 | 0.69 | 1.81 | 0.34 | 2.37 | 0.39 |
| ZN-29 | 28.27 | 41.39 | 6.18 | 23.73 | 5.11 | 1.09 | 4.71 | 0.71 | 3.86 | 0.76 | 2 | 0.37 | 2.48 | 0.42 |
| ZN-30 | 23.68 | 57.31 | 5.65 | 21.02 | 3.22 | 0.43 | 2.56 | 0.36 | 2.11 | 0.47 | 1.43 | 0.27 | 1.92 | 0.31 |
| NASC a | 32 | 73 | 7.9 | 33 | 5.7 | 1.24 | 5.2 | 0.85 | 5.8 | 1.04 | 3.4 | 0.5 | 3.1 | 0.48 |
| Sample No. | ΣREE | ΣLREE | ΣHREE | L/H | (La/La*)N | (Ce/Ce*)N | (Pr/Pr*)N | (Eu/Eu*)N | (La/Yb)N | (Gd/Yb)N | ||||
| ZN-1 | 206.49 | 192.27 | 14.22 | 13.52 | 1.04 | 0.87 | 1.06 | 0.84 | 1.86 | 1.01 | ||||
| ZN-2 | 190.93 | 178 | 12.92 | 13.78 | 1.06 | 0.87 | 1.06 | 0.78 | 1.87 | 0.95 | ||||
| ZN-3 | 187.61 | 174.17 | 13.44 | 12.96 | 1.05 | 0.88 | 1.07 | 0.79 | 1.77 | 0.99 | ||||
| ZN-4 | 158.26 | 129.34 | 28.93 | 4.47 | 1.31 | 0.89 | 1.05 | 0.79 | 0.81 | 1.43 | ||||
| ZN-5 | 152.12 | 139.96 | 12.16 | 11.51 | 1.07 | 0.9 | 1.08 | 0.8 | 1.55 | 0.97 | ||||
| ZN-6 | 157.17 | 147.15 | 10.02 | 14.69 | 1.03 | 0.89 | 1.08 | 0.77 | 1.98 | 1.05 | ||||
| ZN-7 | 165.24 | 153.56 | 11.68 | 13.15 | 1.06 | 0.88 | 1.1 | 0.76 | 1.7 | 0.88 | ||||
| ZN-8 | 184.49 | 154.76 | 29.74 | 5.2 | 1.01 | 1 | 1.15 | 0.95 | 0.85 | 1.39 | ||||
| ZN-9 | 156.72 | 134.33 | 22.39 | 6 | 1.12 | 0.95 | 1.09 | 0.98 | 0.89 | 1.22 | ||||
| ZN-10 | 109.57 | 100.76 | 8.81 | 11.44 | 1.06 | 0.89 | 1.11 | 0.78 | 1.6 | 1.02 | ||||
| ZN-11 | 188.18 | 172.74 | 15.44 | 11.19 | 1.04 | 0.91 | 1.11 | 0.87 | 1.55 | 1 | ||||
| ZN-12 | 175.94 | 160.49 | 15.45 | 10.39 | 1.02 | 0.91 | 1.09 | 0.81 | 1.32 | 0.92 | ||||
| ZN-13 | 184.29 | 172.95 | 11.34 | 15.25 | 1 | 0.91 | 1.09 | 0.78 | 1.94 | 1.06 | ||||
| ZN-14 | 264.47 | 226.32 | 38.15 | 5.93 | 1.1 | 0.94 | 1.07 | 1.07 | 0.88 | 1.21 | ||||
| ZN-15 | 274.09 | 230.8 | 43.28 | 5.33 | 1.11 | 0.95 | 1.06 | 1.1 | 0.82 | 1.29 | ||||
| ZN-16 | 213.49 | 188.4 | 25.09 | 7.51 | 1.07 | 0.93 | 1.06 | 0.94 | 1.09 | 1.16 | ||||
| ZN-17 | 190.92 | 177.27 | 13.65 | 12.99 | 1.03 | 0.89 | 1.06 | 0.77 | 1.63 | 0.91 | ||||
| ZN-18 | 209.74 | 191.74 | 18 | 10.65 | 0.99 | 0.95 | 1.08 | 0.86 | 1.48 | 1.19 | ||||
| ZN-19 | 171.45 | 155.91 | 15.55 | 10.03 | 1.03 | 0.91 | 0.95 | 0.89 | 1.18 | 0.88 | ||||
| ZN-20 | 182.85 | 171.42 | 11.44 | 14.98 | 0.95 | 0.91 | 0.96 | 0.83 | 1.65 | 0.91 | ||||
| ZN-21 | 204.4 | 185.07 | 19.34 | 9.57 | 0.92 | 0.96 | 0.94 | 0.88 | 1.12 | 1.04 | ||||
| ZN-22 | 190.44 | 178.29 | 12.16 | 14.66 | 1.02 | 0.86 | 0.98 | 0.85 | 1.73 | 0.89 | ||||
| ZN-23 | 173.85 | 162.69 | 11.16 | 14.58 | 1.04 | 0.86 | 0.98 | 0.79 | 1.72 | 0.86 | ||||
| ZN-24 | 189.71 | 176.8 | 12.91 | 13.69 | 1.02 | 0.89 | 0.98 | 0.76 | 1.64 | 0.96 | ||||
| ZN-25 | 158.79 | 146.87 | 11.93 | 12.31 | 1.02 | 0.9 | 1 | 0.86 | 1.51 | 0.96 | ||||
| ZN-26 | 158.98 | 143.66 | 15.31 | 9.38 | 1.09 | 0.92 | 1.06 | 0.72 | 1.38 | 1.11 | ||||
| ZN-27 | 85.5 | 77.51 | 7.99 | 9.7 | 1.21 | 0.83 | 1.08 | 0.6 | 1.47 | 0.91 | ||||
| ZN-28 | 117.87 | 103.06 | 14.81 | 6.96 | 1.13 | 1.01 | 1.15 | 1.02 | 1 | 1.29 | ||||
| ZN-29 | 121.08 | 105.77 | 15.31 | 6.91 | 0.98 | 0.94 | 1.21 | 1 | 1.1 | 1.14 | ||||
| ZN-30 | 120.74 | 111.31 | 9.43 | 11.8 | 0.84 | 0.99 | 1.01 | 0.68 | 1.19 | 0.79 | ||||
| Average | 174.85 | 158.11 | 16.74 | 10.68 | 1.05 | 0.91 | 1.06 | 0.84 | 1.41 | 1.05 |
| Sample No. | Mineral Composition | Clay Composition | ||||||||||
|---|---|---|---|---|---|---|---|---|---|---|---|---|
| Clay | Quartz | KF. | Plag. | Cal. | Dol. | Pyrite | Anhy. | Kao. | Illite | Chlo. | I/S | |
| ZN-1 | 29 | 21 | 2 | 2 | 33 | 11 | 2 | 0 | 7 | 49 | 12 | 32 |
| ZN-2 | 26 | 28 | 3 | 2 | 35 | 14 | 2 | 0 | 5 | 51 | 14 | 30 |
| ZN-3 | 23 | 24 | 2 | 0 | 37 | 12 | 2 | 0 | 9 | 53 | 13 | 25 |
| ZN-4 | 20 | 24 | 0 | 0 | 39 | 13 | 2 | 2 | 10 | 62 | 10 | 18 |
| ZN-5 | 54 | 42 | 2 | 0 | 0 | 0 | 2 | 0 | 0 | 49 | 14 | 37 |
| ZN-6 | 47 | 48 | 3 | 0 | 0 | 0 | 2 | 0 | 0 | 76 | 17 | 7 |
| ZN-7 | 55 | 40 | 2 | 0 | 0 | 0 | 3 | 0 | 0 | 72 | 12 | 16 |
| ZN-8 | 32 | 23 | 2 | 0 | 35 | 8 | 3 | 0 | 0 | 41 | 21 | 38 |
| ZN-9 | 42 | 56 | 0 | 0 | 0 | 0 | 2 | 0 | 0 | 48 | 15 | 37 |
| ZN-10 | 39 | 58 | 0 | 0 | 0 | 0 | 3 | 0 | 0 | 54 | 26 | 20 |
| ZN-11 | 59 | 38 | 0 | 0 | 0 | 0 | 3 | 0 | 0 | 46 | 24 | 30 |
| ZN-12 | 58 | 40 | 0 | 0 | 0 | 0 | 2 | 0 | 0 | 71 | 16 | 13 |
| ZN-13 | 60 | 35 | 2 | 0 | 0 | 0 | 3 | 0 | 0 | 56 | 10 | 34 |
| ZN-14 | 66 | 25 | 3 | 3 | 0 | 0 | 3 | 0 | 0 | 61 | 16 | 23 |
| ZN-15 | 60 | 33 | 3 | 2 | 0 | 0 | 2 | 0 | 0 | 56 | 17 | 27 |
| ZN-16 | 63 | 31 | 2 | 2 | 0 | 0 | 2 | 0 | 0 | 61 | 14 | 25 |
| ZN-17 | 63 | 29 | 3 | 0 | 0 | 0 | 5 | 0 | 0 | 71 | 14 | 15 |
| ZN-18 | 66 | 26 | 6 | 0 | 0 | 0 | 2 | 0 | 0 | 58 | 19 | 23 |
| ZN-19 | 53 | 44 | 2 | 0 | 0 | 0 | 1 | 0 | 0 | 53 | 21 | 26 |
| ZN-20 | 61 | 35 | 2 | 0 | 0 | 0 | 2 | 0 | 0 | 63 | 16 | 21 |
| ZN-21 | 23 | 25 | 0 | 0 | 36 | 14 | 2 | 0 | 0 | 52 | 23 | 25 |
| ZN-22 | 71 | 25 | 1 | 0 | 1 | 1 | 1 | 0 | 0 | 41 | 38 | 21 |
| ZN-23 | 76 | 19 | 0 | 0 | 2 | 2 | 1 | 0 | 0 | 47 | 35 | 18 |
| ZN-24 | 64 | 23 | 0 | 0 | 6 | 4 | 3 | 0 | 0 | 60 | 9 | 31 |
| ZN-25 | 58 | 23 | 0 | 0 | 12 | 5 | 2 | 0 | 0 | 40 | 13 | 47 |
| ZN-26 | 46 | 32 | 0 | 0 | 18 | 0 | 4 | 0 | 0 | 52 | 14 | 34 |
| ZN-27 | 49 | 27 | 5 | 0 | 13 | 3 | 3 | 0 | 0 | 57 | 15 | 28 |
| ZN-28 | 57 | 26 | 0 | 0 | 10 | 6 | 1 | 0 | 0 | 37 | 16 | 47 |
| ZN-29 | 52 | 31 | 4 | 0 | 9 | 2 | 2 | 0 | 3 | 52 | 24 | 21 |
| ZN-30 | 56 | 25 | 0 | 0 | 8 | 5 | 3 | 3 | 8 | 47 | 24 | 21 |
| Elemental Ratios | Range of the Black Rock Series in This Study | UCC a | LCC a | OC b | Range of Sediment from Mafic Sources b | Range of Sediment from Felsic Sources b |
|---|---|---|---|---|---|---|
| La/Sc | 1.76–4.38 | 2.21 | 0.31 | 0.10 | 0.43–0.76 | 2.50–16.3 |
| La/Co | 1.09–9.90 | 1.76 | 0.33 | / | 0.14–0.38 | 1.80–13.8 |
| Th/Sc | 0.79–1.88 | 0.79 | 0.06 | 0.94 | 0.05–0.22 | 0.84–20.5 |
| Th/Co | 0.47–4.25 | 0.63 | 0.06 | 0.01 | 0.04–1.140 | 0.67–19.4 |
| Cr/Th | 6.16–34.31 | 7.76 | 109.5 | / | 25–500 | 4.00–15.0 |
© 2018 by the authors. Licensee MDPI, Basel, Switzerland. This article is an open access article distributed under the terms and conditions of the Creative Commons Attribution (CC BY) license (http://creativecommons.org/licenses/by/4.0/).
Share and Cite
Ding, J.; Zhang, J.; Tang, X.; Huo, Z.; Han, S.; Lang, Y.; Zheng, Y.; Li, X.; Liu, T. Elemental Geochemical Evidence for Depositional Conditions and Organic Matter Enrichment of Black Rock Series Strata in an Inter-Platform Basin: The Lower Carboniferous Datang Formation, Southern Guizhou, Southwest China. Minerals 2018, 8, 509. https://doi.org/10.3390/min8110509
Ding J, Zhang J, Tang X, Huo Z, Han S, Lang Y, Zheng Y, Li X, Liu T. Elemental Geochemical Evidence for Depositional Conditions and Organic Matter Enrichment of Black Rock Series Strata in an Inter-Platform Basin: The Lower Carboniferous Datang Formation, Southern Guizhou, Southwest China. Minerals. 2018; 8(11):509. https://doi.org/10.3390/min8110509
Chicago/Turabian StyleDing, Jianghui, Jinchuan Zhang, Xuan Tang, Zhipeng Huo, Shuangbiao Han, Yue Lang, Yuyan Zheng, Xingqi Li, and Tong Liu. 2018. "Elemental Geochemical Evidence for Depositional Conditions and Organic Matter Enrichment of Black Rock Series Strata in an Inter-Platform Basin: The Lower Carboniferous Datang Formation, Southern Guizhou, Southwest China" Minerals 8, no. 11: 509. https://doi.org/10.3390/min8110509
APA StyleDing, J., Zhang, J., Tang, X., Huo, Z., Han, S., Lang, Y., Zheng, Y., Li, X., & Liu, T. (2018). Elemental Geochemical Evidence for Depositional Conditions and Organic Matter Enrichment of Black Rock Series Strata in an Inter-Platform Basin: The Lower Carboniferous Datang Formation, Southern Guizhou, Southwest China. Minerals, 8(11), 509. https://doi.org/10.3390/min8110509