1. Introduction
Understanding the metallurgical behavior of an ore is key in determining the viability of a project in mineral processing. Ore characterization is important not only for making a correct assessment of reserves and resources, but also for exploring novel processing strategies [
1]. Polarization microscopy (PM) is a characterization technique that differentiates minerals based on their different optical properties under polarized light. Minerals with transition metals will have characteristic reflection indexes; other minerals (such as carbonates and silicates) do not reflect light and appear opaque. Thin sections of the latter minerals, however, are transparent to transmitted light, while the first group of minerals are non-transparent. Thus, by combining experiments with reflected and transmitted polarized light, this technique allows for the identification of textures, alterations, intergrowths, among other characteristics of the mineral [
2]. This technique is often complemented by more detailed microscopies, such as scanning electron microscopy (including its variant for quantitative evaluation of minerals, QEM-SCAN), which together provide complete information regarding the mineralogical composition of ores. Applied to different stages of a metallurgical process, these techniques allow for a better understanding of the effect of such process on specific minerals within the ore [
3].
Since techniques for mineralogical characterization often analyze information over a few micrometers within the mineral, surface-related processes are rarely detected. This is a significant drawback, considering that important metallurgical processes occur at the topmost layers of minerals. For example, preg-robbing is a detrimental process through which a metal is re-adsorbed after it has been successfully leached [
4]. X-ray photoelectron spectroscopy (XPS) has a depth sensitivity on the order of 10 nm and provides information on the oxidation states and the chemical environment of different elements on a surface. There have been several investigations relying on XPS to obtain information regarding surface transformation of individual, pure minerals [
5,
6,
7,
8]. Even though this strategy provides important information regarding surface processes, many processes occur only when one mineral is in the presence of another. One of the best known examples of this is the formation of galvanic pairs, where a stable mineral (such as pyrite) can promote the dissolution of a more reactive mineral (such as sphalerite) [
9,
10]. Another example is the formation of passivating layers that can hinder the metal extraction by blocking the surface. For example, passivation may involve the formation of surface by-products (formation of sulfur during the oxidation of sulfide minerals) or the re-adsorption of dissolved metal ions (preg-robbing of AuCN
(ads) hinders the cyanidation) [
11,
12]. Since passivating layers may be as thin as a few atomic layers, identification of these species is a difficult task with traditional mineralogical techniques, and it is in these cases that XPS can provide the most valuable information [
13].
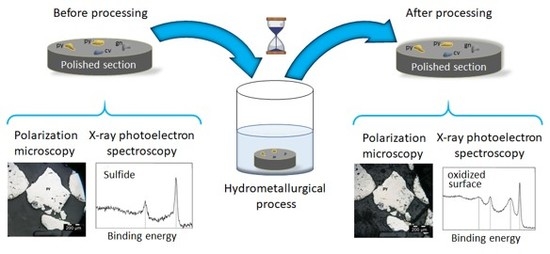
Here, a method to identify surface processes occurring on surfaces of specific minerals within a complex ore is presented. By using a polished section of minerals embedded into a resin, minerals within the section are identified with polarization microscopy and their surfaces are characterized with XPS. The same characterization tools are employed after the sample is subjected to a hydrometallurgical process (leaching with cyanide). The matrix responds well to the leaching medium and is compatible with ultra-high vacuum conditions, which allows us to use both techniques, namely XPS and PM, on the same samples [
14].
2. Materials and Methods
The ore sample analyzed was generously donated by Volcan Cia. Minera, and is a polymetallic sulfide from the Central Andes of Peru which enters a leaching circuit for extracting silver. The ore composition is mainly pyrite (FeS2), associated with galena (PbS), covellite (CuS) and sphalerite (ZnS), as well as with sulfosalts of copper and silver. The ore also contains non-metallic minerals, such as carbonates and silicates. The analysis via inductively-coupled plasma mass spectrometry (ICP-MS) shows a composition of 45.2 wt.% S, 37.1 wt.% Fe, Pb (4487 ppm), Cu (992 ppm), Zn (807 ppm) and Ag (136 ppm). The study focusing on the response of this silver-containing ore to cyanidation is a subject of a separate publication. The ore size used was mesh +35 (≈500 μm) to make identification of the minerals via PM reliable. Polished sections were prepared by embedding ore samples in an epoxy resin, which after curing was polished to ensure flatness so that it can be characterized by polarization microscopy and XPS. In the ultra-high vacuum system, the resin was stable at the base pressure in the XPS chamber.
For the leaching tests the polished sections were suspended by a nylon thread and immersed in 150 mL of cyanide solution (2 g/L) at pH ≈ 11.5 using a magnetic stirring plate at 300 RPM for 6 h. The amount of cyanide was kept constant throughout the experiments, as confirmed by measuring the cyanide consumption via titration (with silver nitrate and potassium iodide as indicator, at times 15, 30, 60, 120, 180, 240 and 360 min) and replenishing the amount consumed. CAUTION: Experiments with cyanide must be conducted by trained personnel and special care should be exercised, as this product is extremely poisonous. Solutions must be kept at all times at pH above 10 to avoid the risk of formation of gaseous hydrogen cyanide (HCN). Ore samples and all materials exposed to cyanide should be treated with strong oxidants (bleach, hydrogen peroxide) afterwards to ensure decomposition of residual cyanide.
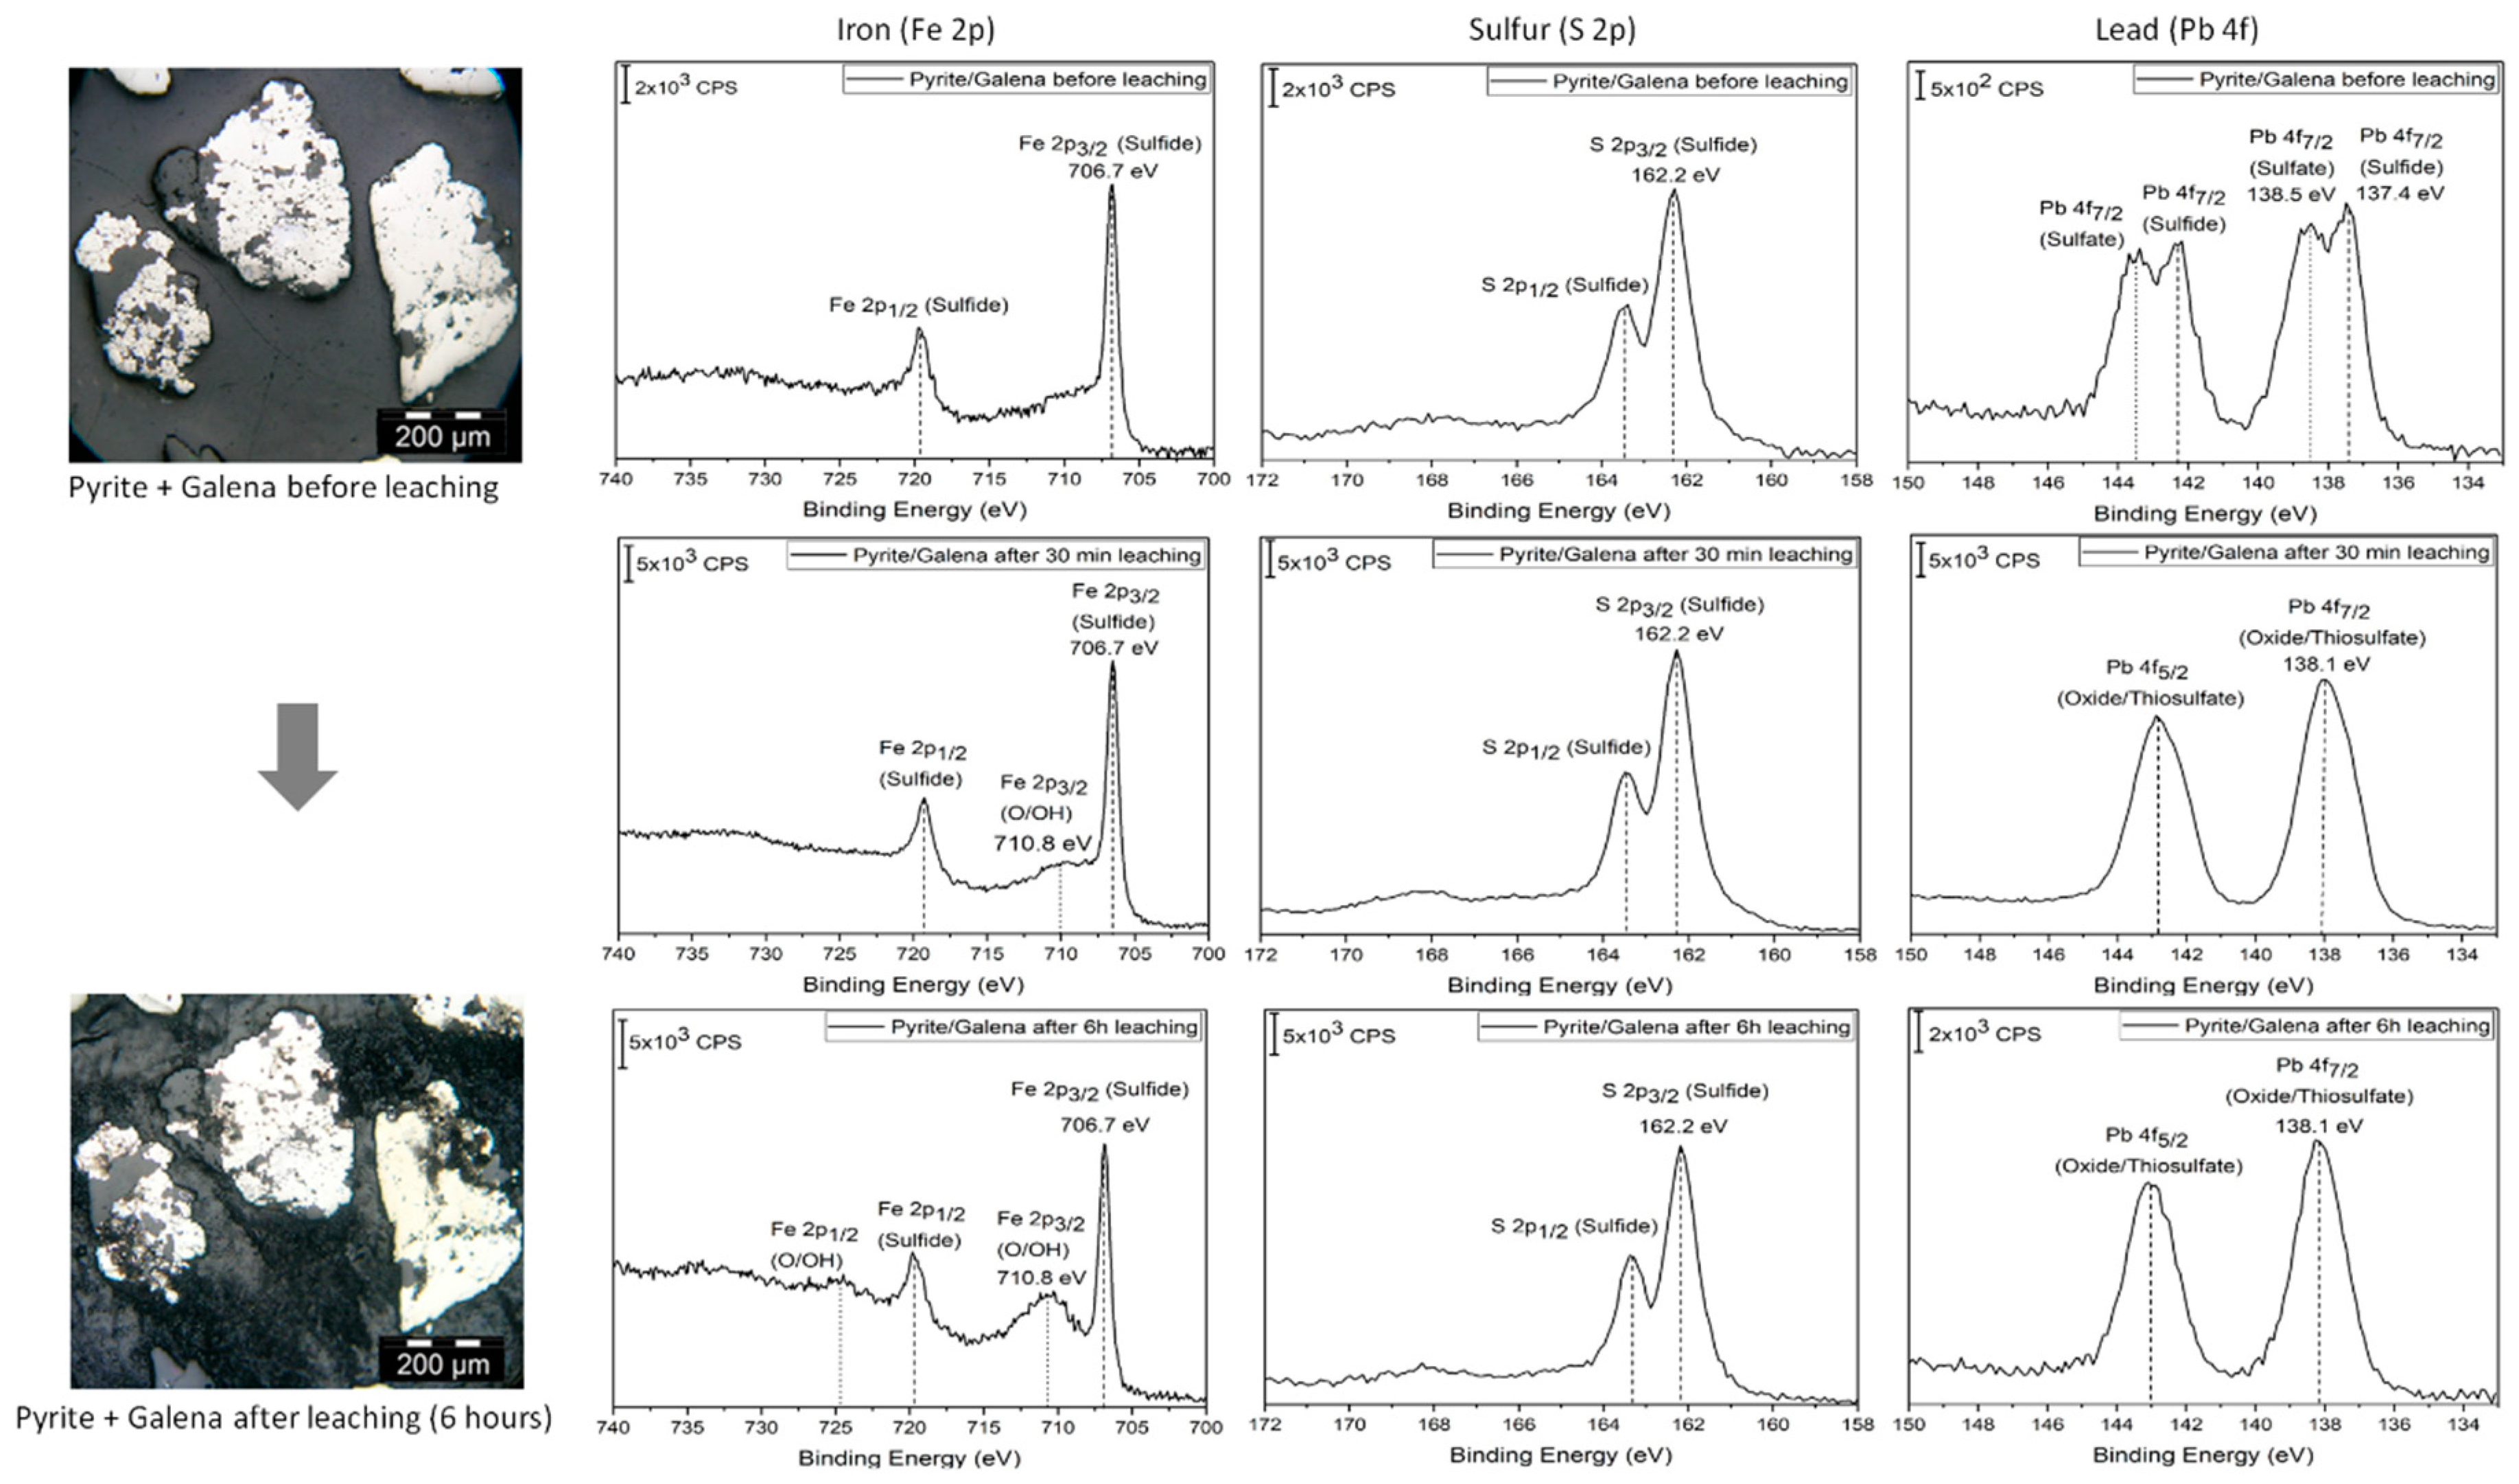
Polarization microscopy was performed with an OLYMPUS BX51 microscope (Olympus, Tokyo, Japan). The polished sections were marked on the back by two perpendicular axes to reproducibly locate the point chosen for analysis. The samples were analyzed in the magnification range from 5× to 100× and 4 different minerals were identified as pyrite (FeS2), sphalerite (ZnS), covellite (CuS) and pyrite with inclusions of galena (PbS). The micrographs were taken before and after a 6-h leaching.
XPS measurements were performed on a Thermo Scientific K-Alpha+ instrument (Thermo Fisher, Waltham, MA, USA) equipped with an Al Kα source (hν = 1486.6 eV), and a 35.3° take-off angle normal to the surface was used. The pass energy used was 58.5 eV. Measurements were performed at a base pressure of 5 × 10
−9 torr. Samples were transferred from solution to the XPS chamber as fast as possible to minimize changes due to exposure to ambient. No additional cleaning was employed following the transfer. Polished sections (with the points of interested marked) were introduced into the chamber and then the points chosen were located using the built-in microscope of the XPS instrument.
Figure S2 shows the identification of the minerals using PM and the camera operating in UHV, together with the area selected for analysis (which was set to 300 μm in diameter). The analysis was done before and after 30 and 360 min of leaching. The C 1s peak at 284.6 eV was used to calibrate all spectra. Data was collected with the software Thermo Avantage v. 5.89 (Thermo Fisher, Waltham, MA, USA) and processed with the Casa XPS software version 2.3.16 (Casa Software Ltd, Teignmouth, UK) and Origin 2017 (OriginLab, Northampton, MA, USA).
The behavior of the resin employed to prepare the polished sections in the leaching solution was followed by XPS and PM. The XPS analysis of the resin showed C, O and Si as main components, which did not change after exposure to the leaching solution (data not shown). Micrographs of the resin showed small pits in some areas, likely from a reaction with the basic medium, although they were not apparent by simple visual inspection. Even though it could be argued that species from the epoxy resin can be interfering during the mechanical preparation of samples and/or during the leaching process (which cannot be tested adequately by ex-situ XPS as C and O from ambient interfere with the measurements of epoxy resins), it will be shown here that the main surface process identified, lead re-adsorption, is also observed during the leaching of epoxy-free powdered samples.
3. Results and Discussion
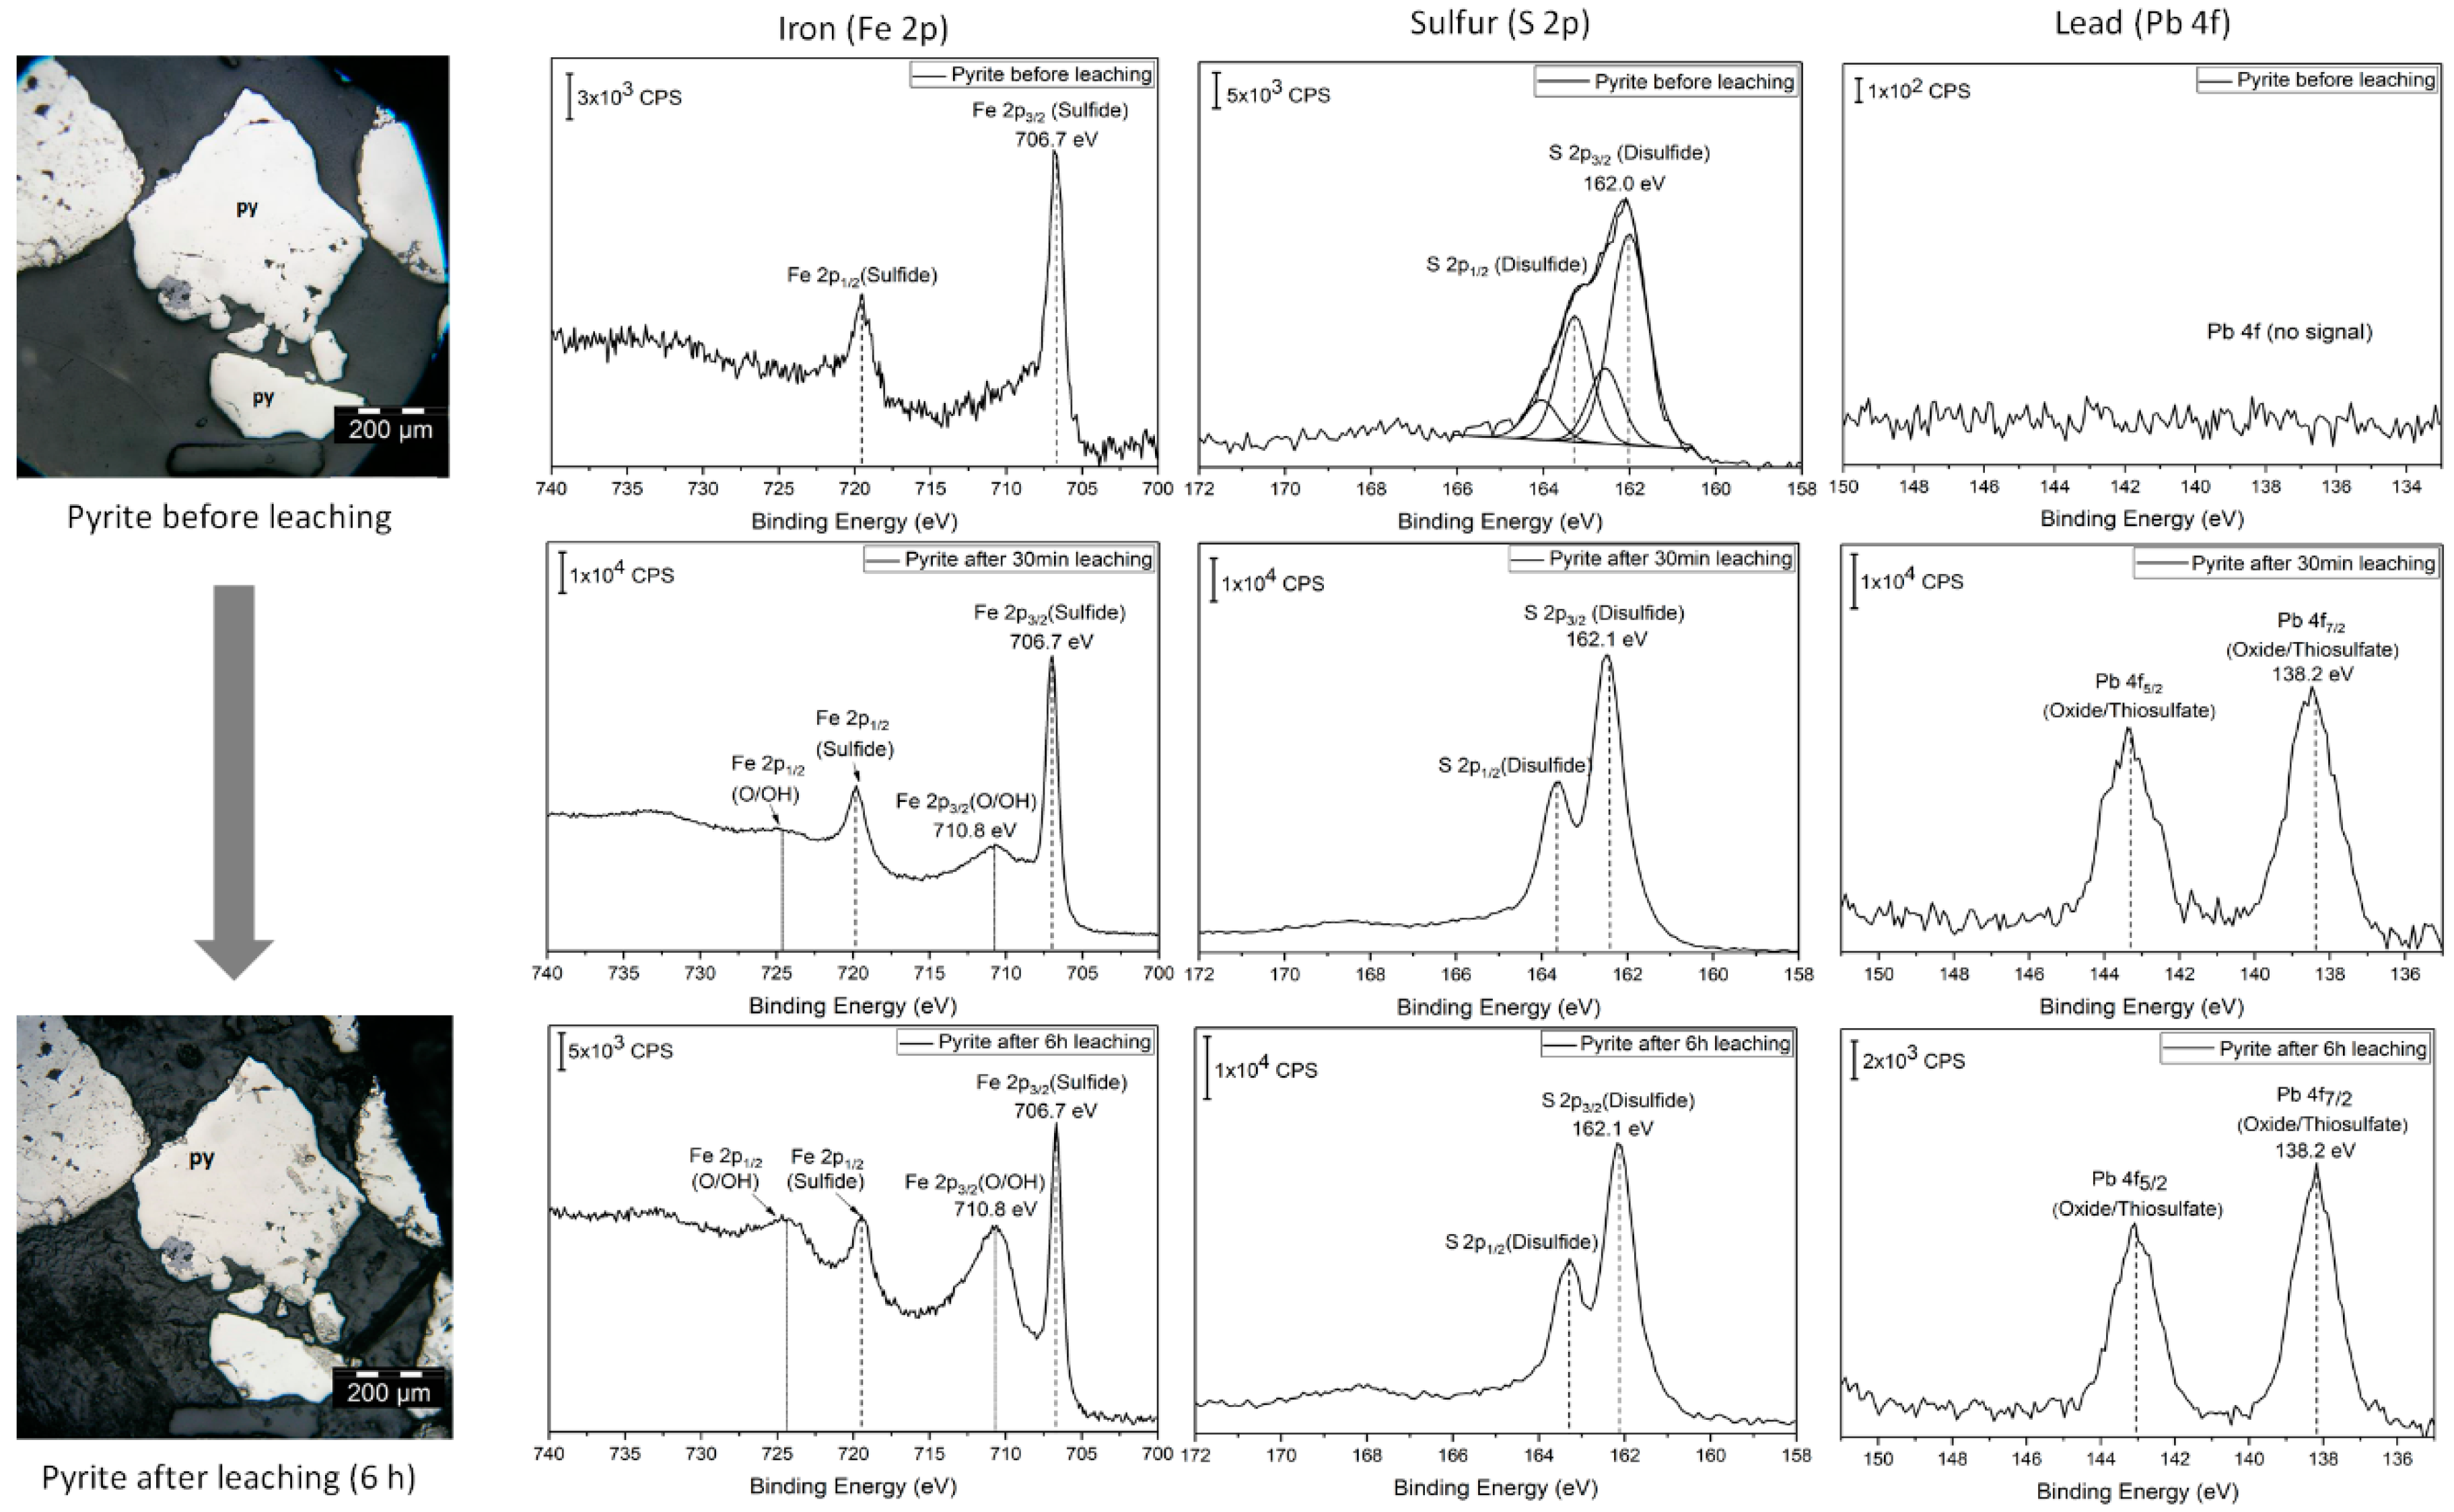
Polarization microscopy allowed for the identification of the most representative minerals in the ore.
Figure 1 shows that individual minerals, identified within a polished section with PM, can be analyzed by XPS. The presence of less-abundant minerals such as covellite and sphalerite was also confirmed by PM and XPS (
Supplementary Materials, Figure S1). For XPS measurements, the assignment of species from Fe, S and Pb is shown in
Table 1, together with selected information available from the literature [
10,
15,
16,
17,
18]. To show the reliability of the XPS signal assignments, the calibration standards are listed in the table as well for all the references cited. Despite small differences arising from different calibration standards, all the assignments of the features observed by XPS, especially the core level shifts and different oxidation states of the elements analyzed are not affected noticeably by these different calibration standards.
Since in
Figure 1 the measurements were made over a pyrite grain, the XPS spectra of this mineral show the presence of iron and sulfur, while other metals, such as lead (Pb), are not present. It is interesting to notice that iron features a Fe 2p
3/2 signal at a position corresponding to sulfides (
Table 1), which is consistent with the fact that sulfur features a S 2p
3/2 signal with its maximum intensity around values corresponding to sulfide species (162.0 eV). The sulfur peak seems to be composed of two pairs of signals, from which one has been attributed to disulfide and the other may be associated with polysulfides or other sulfur species in higher oxidation states [
15]. No sulfate is detected in this spot, which indicates that pyrite has not been oxidized after the sample was prepared for experiments (polished), as it would be expected since pyrite is relatively stable with respect to oxidation in air [
19]. After 30 min of cyanidation, however, the pyrite surface shows evidence of a reaction represented by the increase of a Fe 2p
3/2 signal at 710.8 eV, which is attributed to oxides and/or hydroxides. The sulfur signal, however, features an increased sharpness, suggesting that species different to disulfide have been removed from the surface. The most striking finding is the appearance of lead on the pyrite surface during leaching (at surface concentrations of 5.7 and 17.4 At % after 30 min and six hours, respectively), probably in the form of oxide/hydroxide or thiosulfate. Since we are focusing the study on a pyrite grain, the only explanation for the presence of lead is a two-step process, where lead is leached from particles of galena (also embedded in the polished resin sample) and it later re-adsorbs on the surface of pyrite. Senanayake [
12] has considered the following equations occurring during cyanidation in presence of galena:
Lead products from Equations (1)–(3) are only slightly soluble in water, so it is possible that forming lead-containing products are impregnated (re-adsorbed) on pyrite. Reactions (2) and (3) have also been proposed by Prestidge et al. [
20], suggesting that plumbates (PbO
2−2) can finally decompose to form lead oxide, PbO.
As the process continues for a total of six hours, the surface seems more oxidized, which is suggested by the intense Fe 2p3/2 signal at 710.8 eV. No other changes are observed, as the S 2p3/2 and Pb 4f signals remain essentially unchanged. Polarization microscopy after leaching indicates that on a mineralogical scale no change can be identified, so lead re-adsorption seems to be a surface-related process, probably taking place over a scale of a few nanometers.
To better identify the nature of the lead layer grown on the pyrite surface, a different grain was also followed during cyanidation, namely the one corresponding to pyrite with inclusions of galena. Identification of this grain was possible with PM, and micrographs are shown in
Figure 2. Before leaching, iron is mostly present as pyrite, as evidenced by the sharp peaks in the Fe 2p
3/2 region at 706.8 eV corresponding to sulfide. Lead, on the other side, shows a broad signal which suggests the presence of sulfides and sulfates (137.4 and 138.5 eV, respectively) and, indeed, the S 2p
3/2 signal shows the presence of small amounts of sulfates on the surface. After a six-hour leaching, the PM micrographs show evidence of a reaction, which promoted the loss of portions of the grain, particularly associated with galena. This suggests that leaching of galena, given by Equations (1)–(3), takes place at a fast rate, likely due to the formation of a galvanic pair pyrite–galena, which enhances the reactivity of galena while pyrite becomes more inert [
21].
As observed in
Figure 1 for a pure grain of pyrite, the XPS data in
Figure 2 shows that iron oxide is produced as a result of leaching (Fe 2p
3/2 signal at 710.8 eV). The surface concentration of lead varies from 20.90 At % in the original sample to 34.96 and 26.59 At % after 30 min and 6 h of leaching, respectively. In this case, however, the surface concentration of lead is only of relative importance, since lead is present before and after the reaction. The most important feature in XPS is the narrowness of the signal for lead (Pb 2p
7/2) at 138.1 eV, a position which was not associated with sulfides nor sulfates. According to the literature, this position can be attributed to oxides and/or thiosulfates [
18,
22] and evidences that new lead species are present on the surface while sulfides and sulfates are leached out. This fact is noticeable when inspecting the micrographs in
Figure 2. It is important to highlight that in spite of the similar surface concentration of lead throughout the leaching process, the intensity of the Pb 4f
7/2 signal shows approximately a ten-fold increase with respect to the original mineral, further supporting the fact that lead re-adsorbs on the pyrite surface. This experiment confirms that the position of the peak corresponding to adsorbed lead (138.2 eV) in
Figure 1 cannot be assigned to sulfide or sulfate.
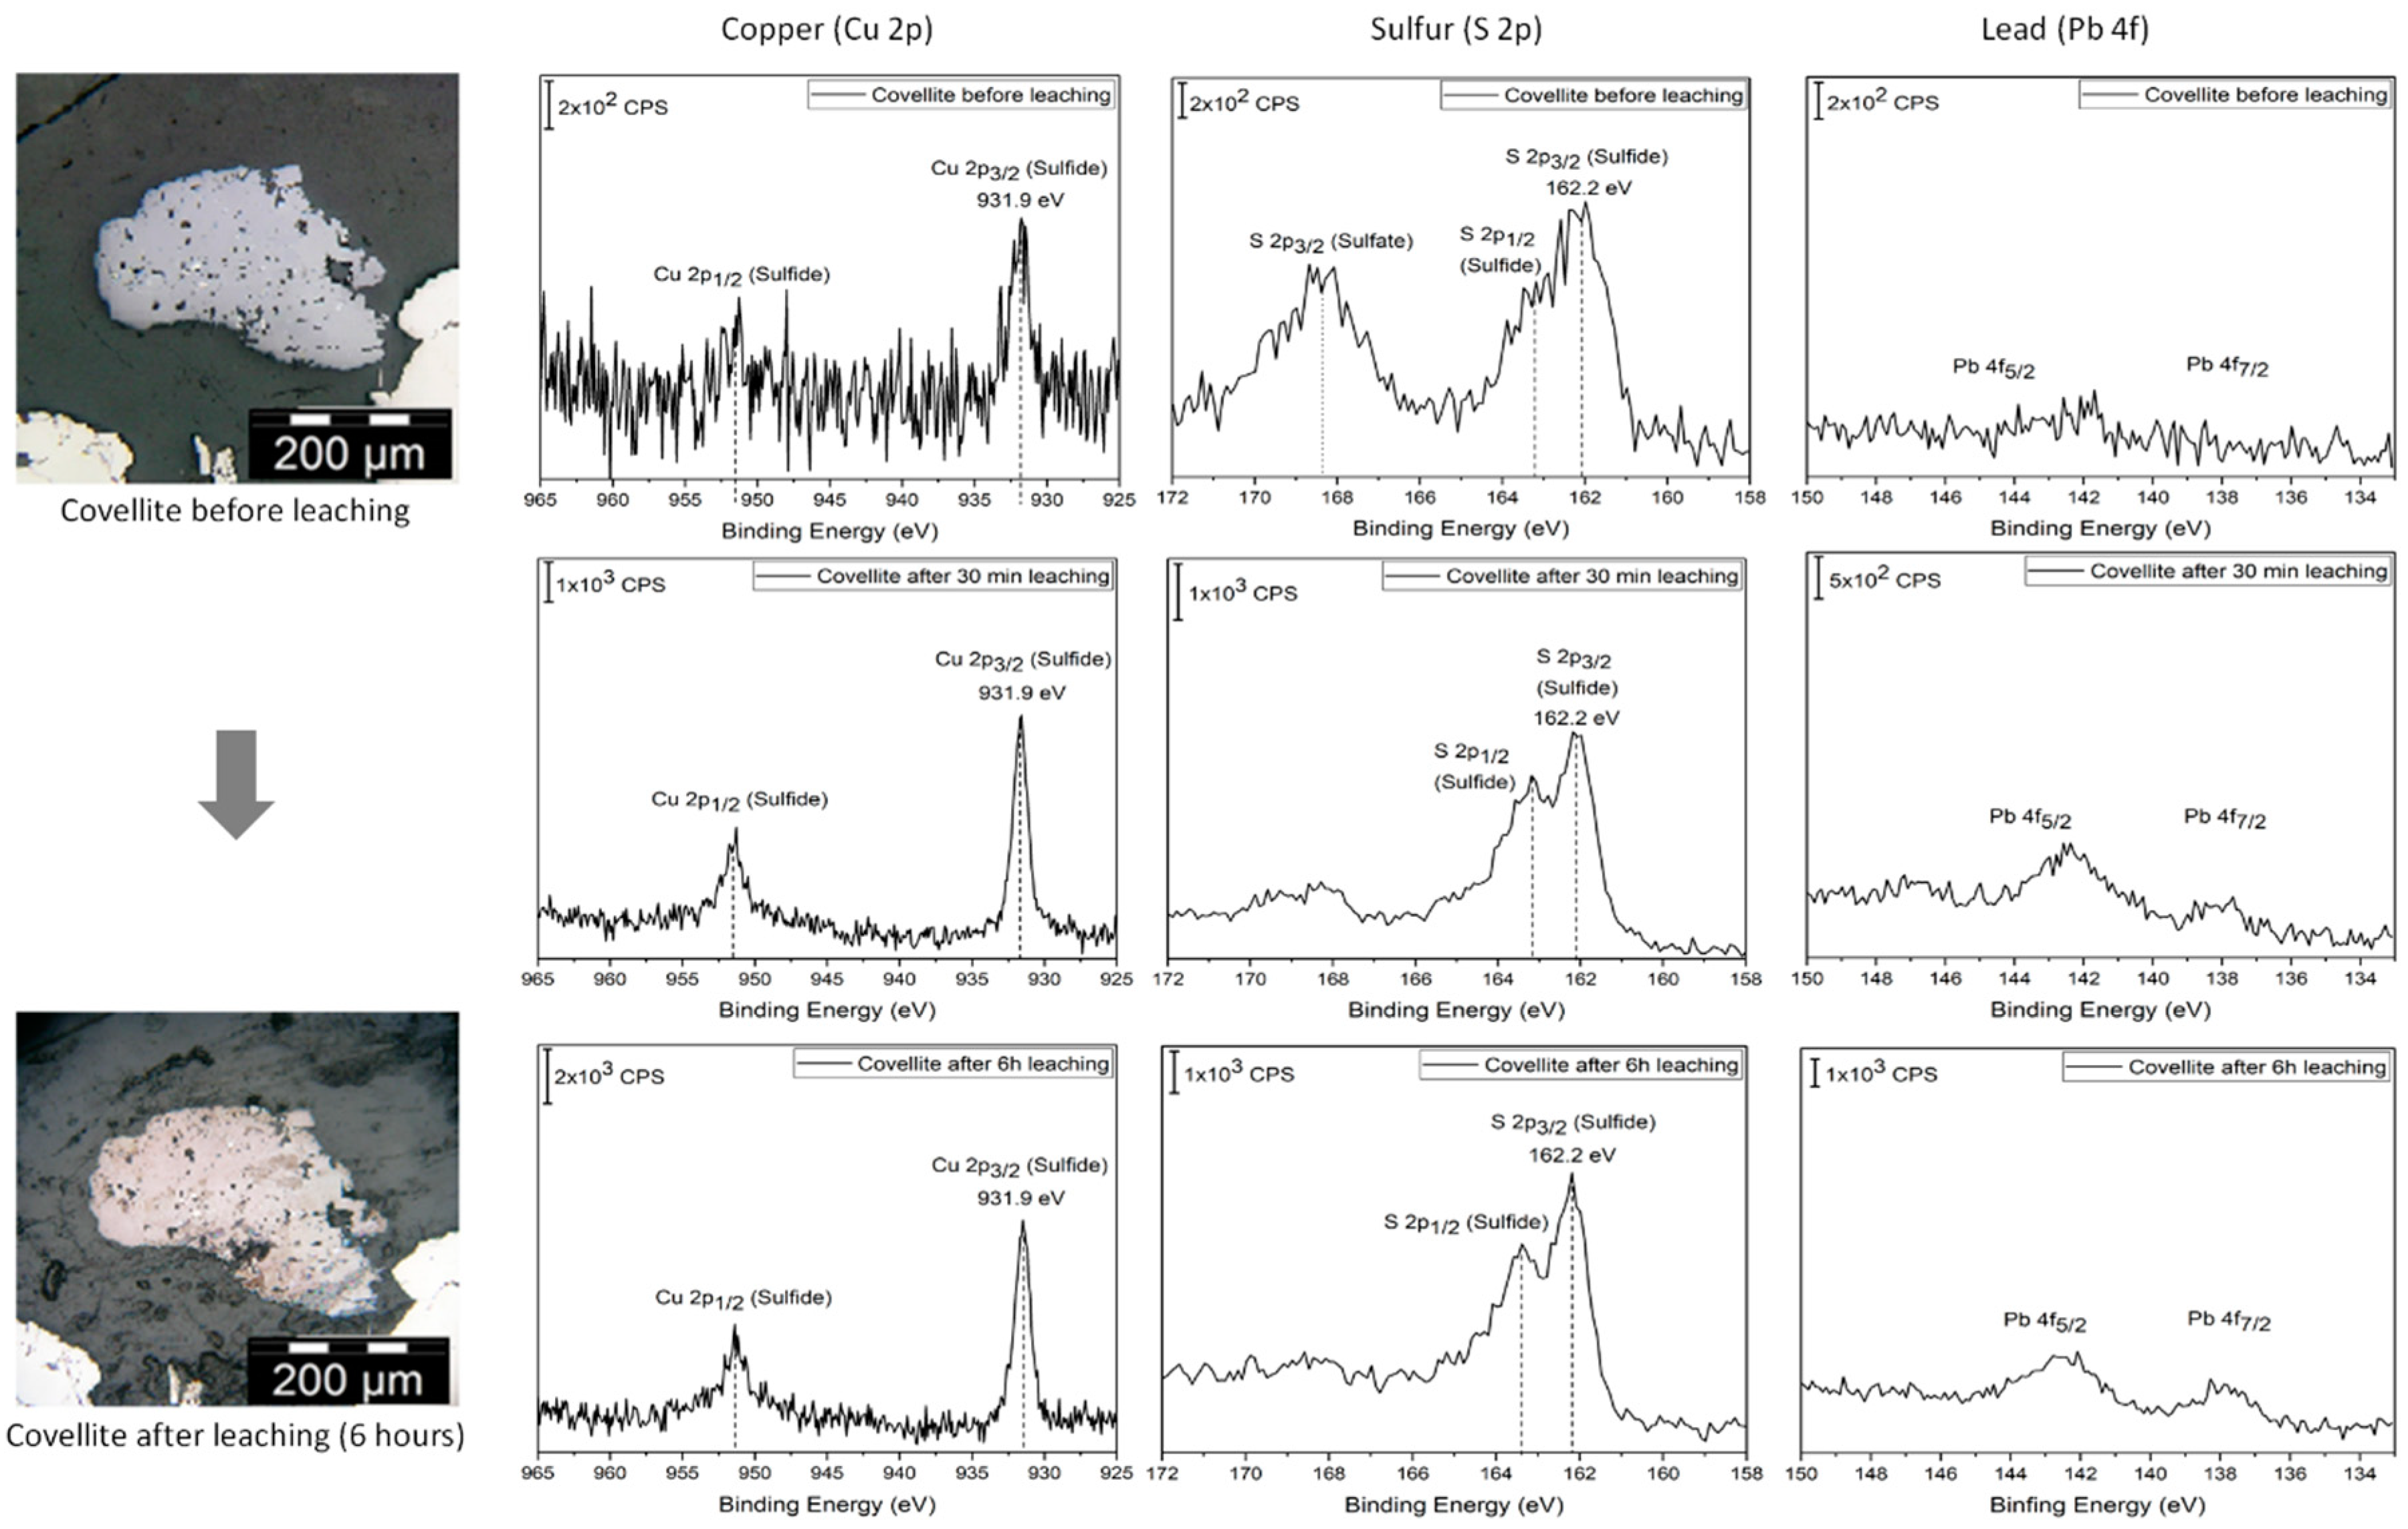
Re-adsorption is a spontaneous process which depends on the affinity of the adsorbate to interact with a surface. Therefore, it can be expected that it is not a universal process which can happen on all surfaces. Indeed,
Figure 3 shows that covellite does not feature significant evidence of lead re-adsorption. From our XPS measurements, the signals of lead after 30 min and 5 h represent only ~5 at %. The intensity of the areas of lead on covellite with respect to the case of pyrite and pyrite–galena is significantly smaller, which also supports the case that on this mineral the re-adsorption is significantly smaller. According to Breuer [
23], covellite is leached using cyanide following the reaction below:
This is a reductive dissolution mechanism, where copper passes from Cu+2 in covellite to Cu+1 in the cyanide complex. The leaching of covellite is possible but the process is slow, hence the clear change in the PM micrograph as the reaction proceeds (from an original white color to a tarnished surface) without seeing a damaged surface as in the case of galena. It may be likely that in the case of covellite, which presents an intermediate reactivity between that of pyrite (essentially inert) and galena (highly reactive in presence of pyrite), the leaching reaction is sufficiently fast to impede the adsorption of lead species.
Since lead re-adsorption was observed to be a selective process, taking place preferably over pyrite surfaces, it was expected to be also observed on the fine-milled, pyrite-based mineral entering the industrial leaching circuit. Indeed, leaching experiments done with non-embedded samples also showed evidence of lead re-adsorption (
Figure S3). In accordance with the data in
Figure 2, the two original Pb 4f
7/2 peaks, associated with lead sulfide and sulfate (137.4 and 138.5 eV, respectively), become less intense as a new component, located at 138.1 eV, which rises during leaching. This data will be further discussed in the light of silver extraction and cyanide consumption in a separate work.

 ,
, 

