Operational Decision Support for Material Management in Continuous Mining Systems: From Simulation Concept to Practical Full-Scale Implementations


Abstract
:1. Introduction
2. Theoretical Background and Definitions
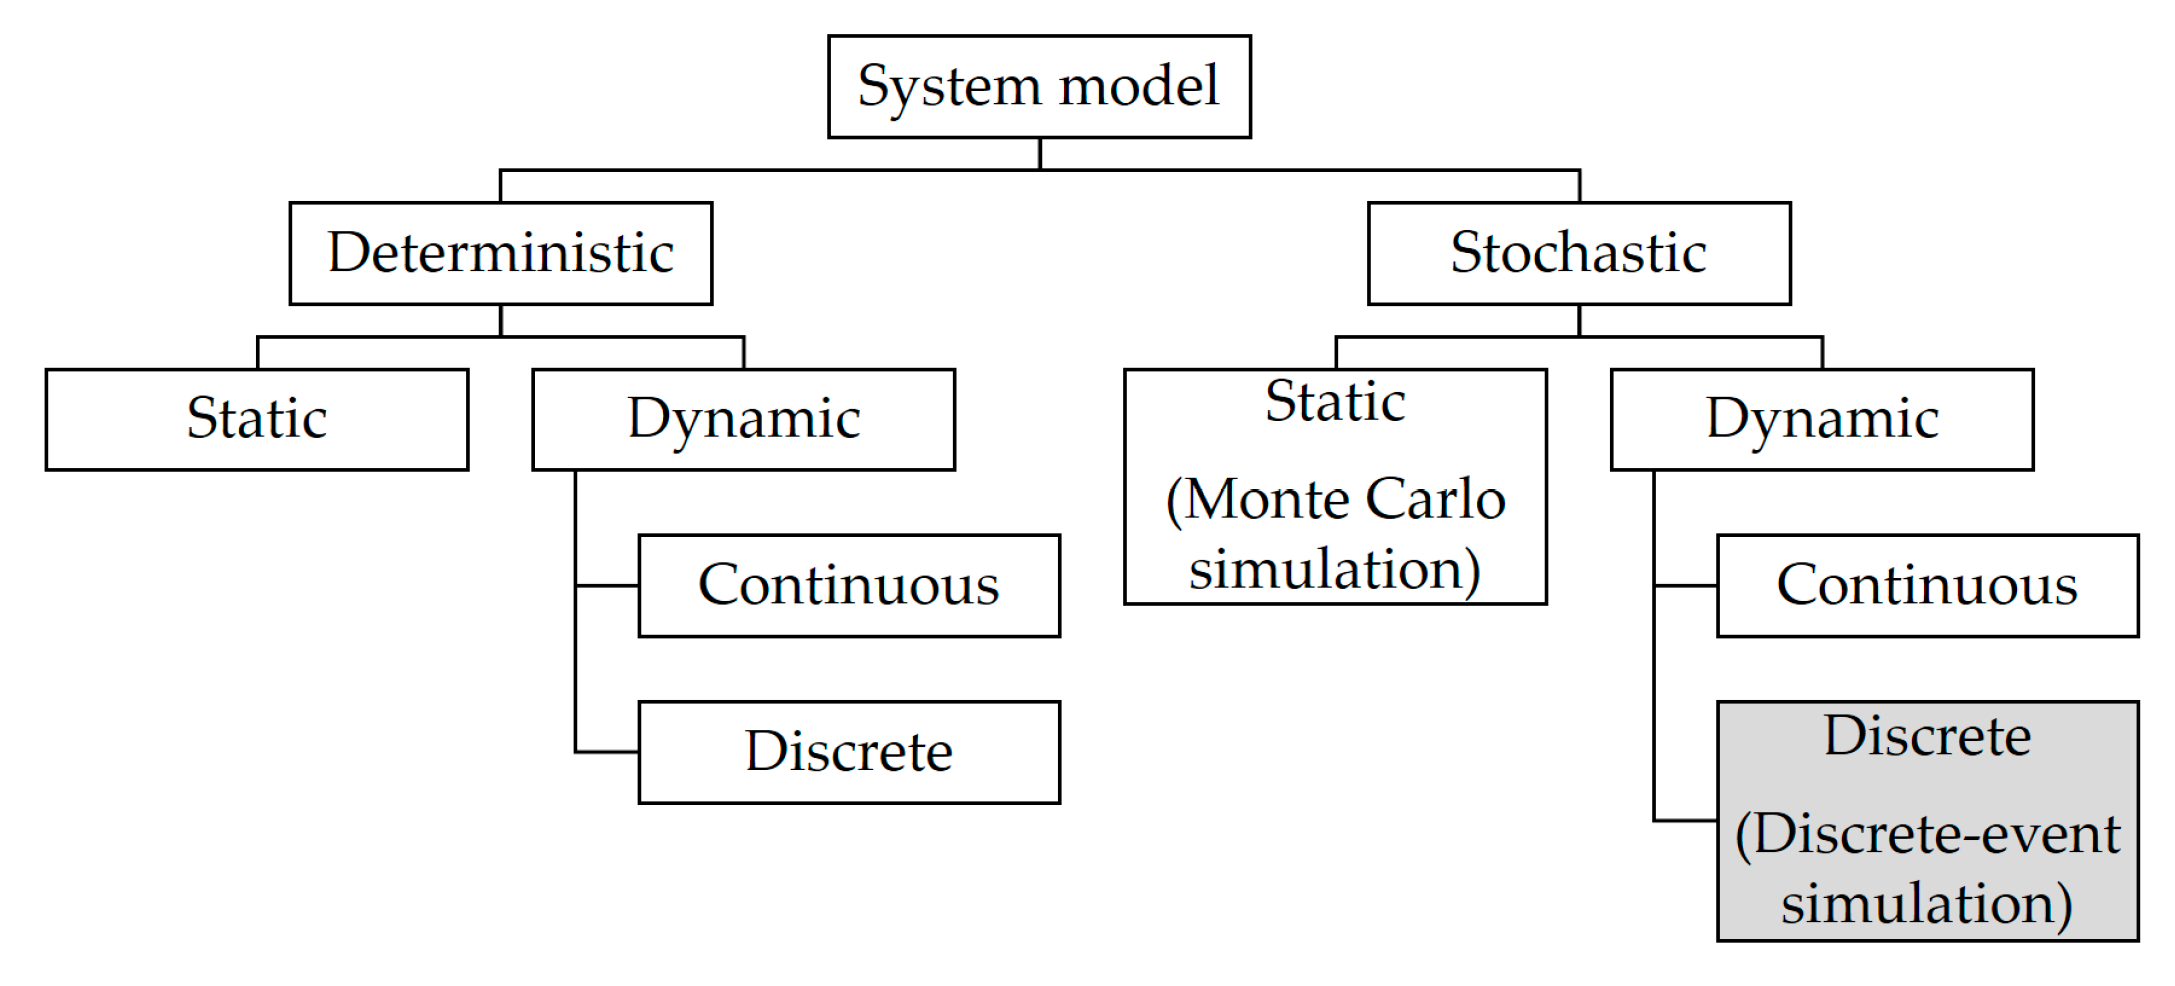
2.1. Definitions of System, Model, and Simulation
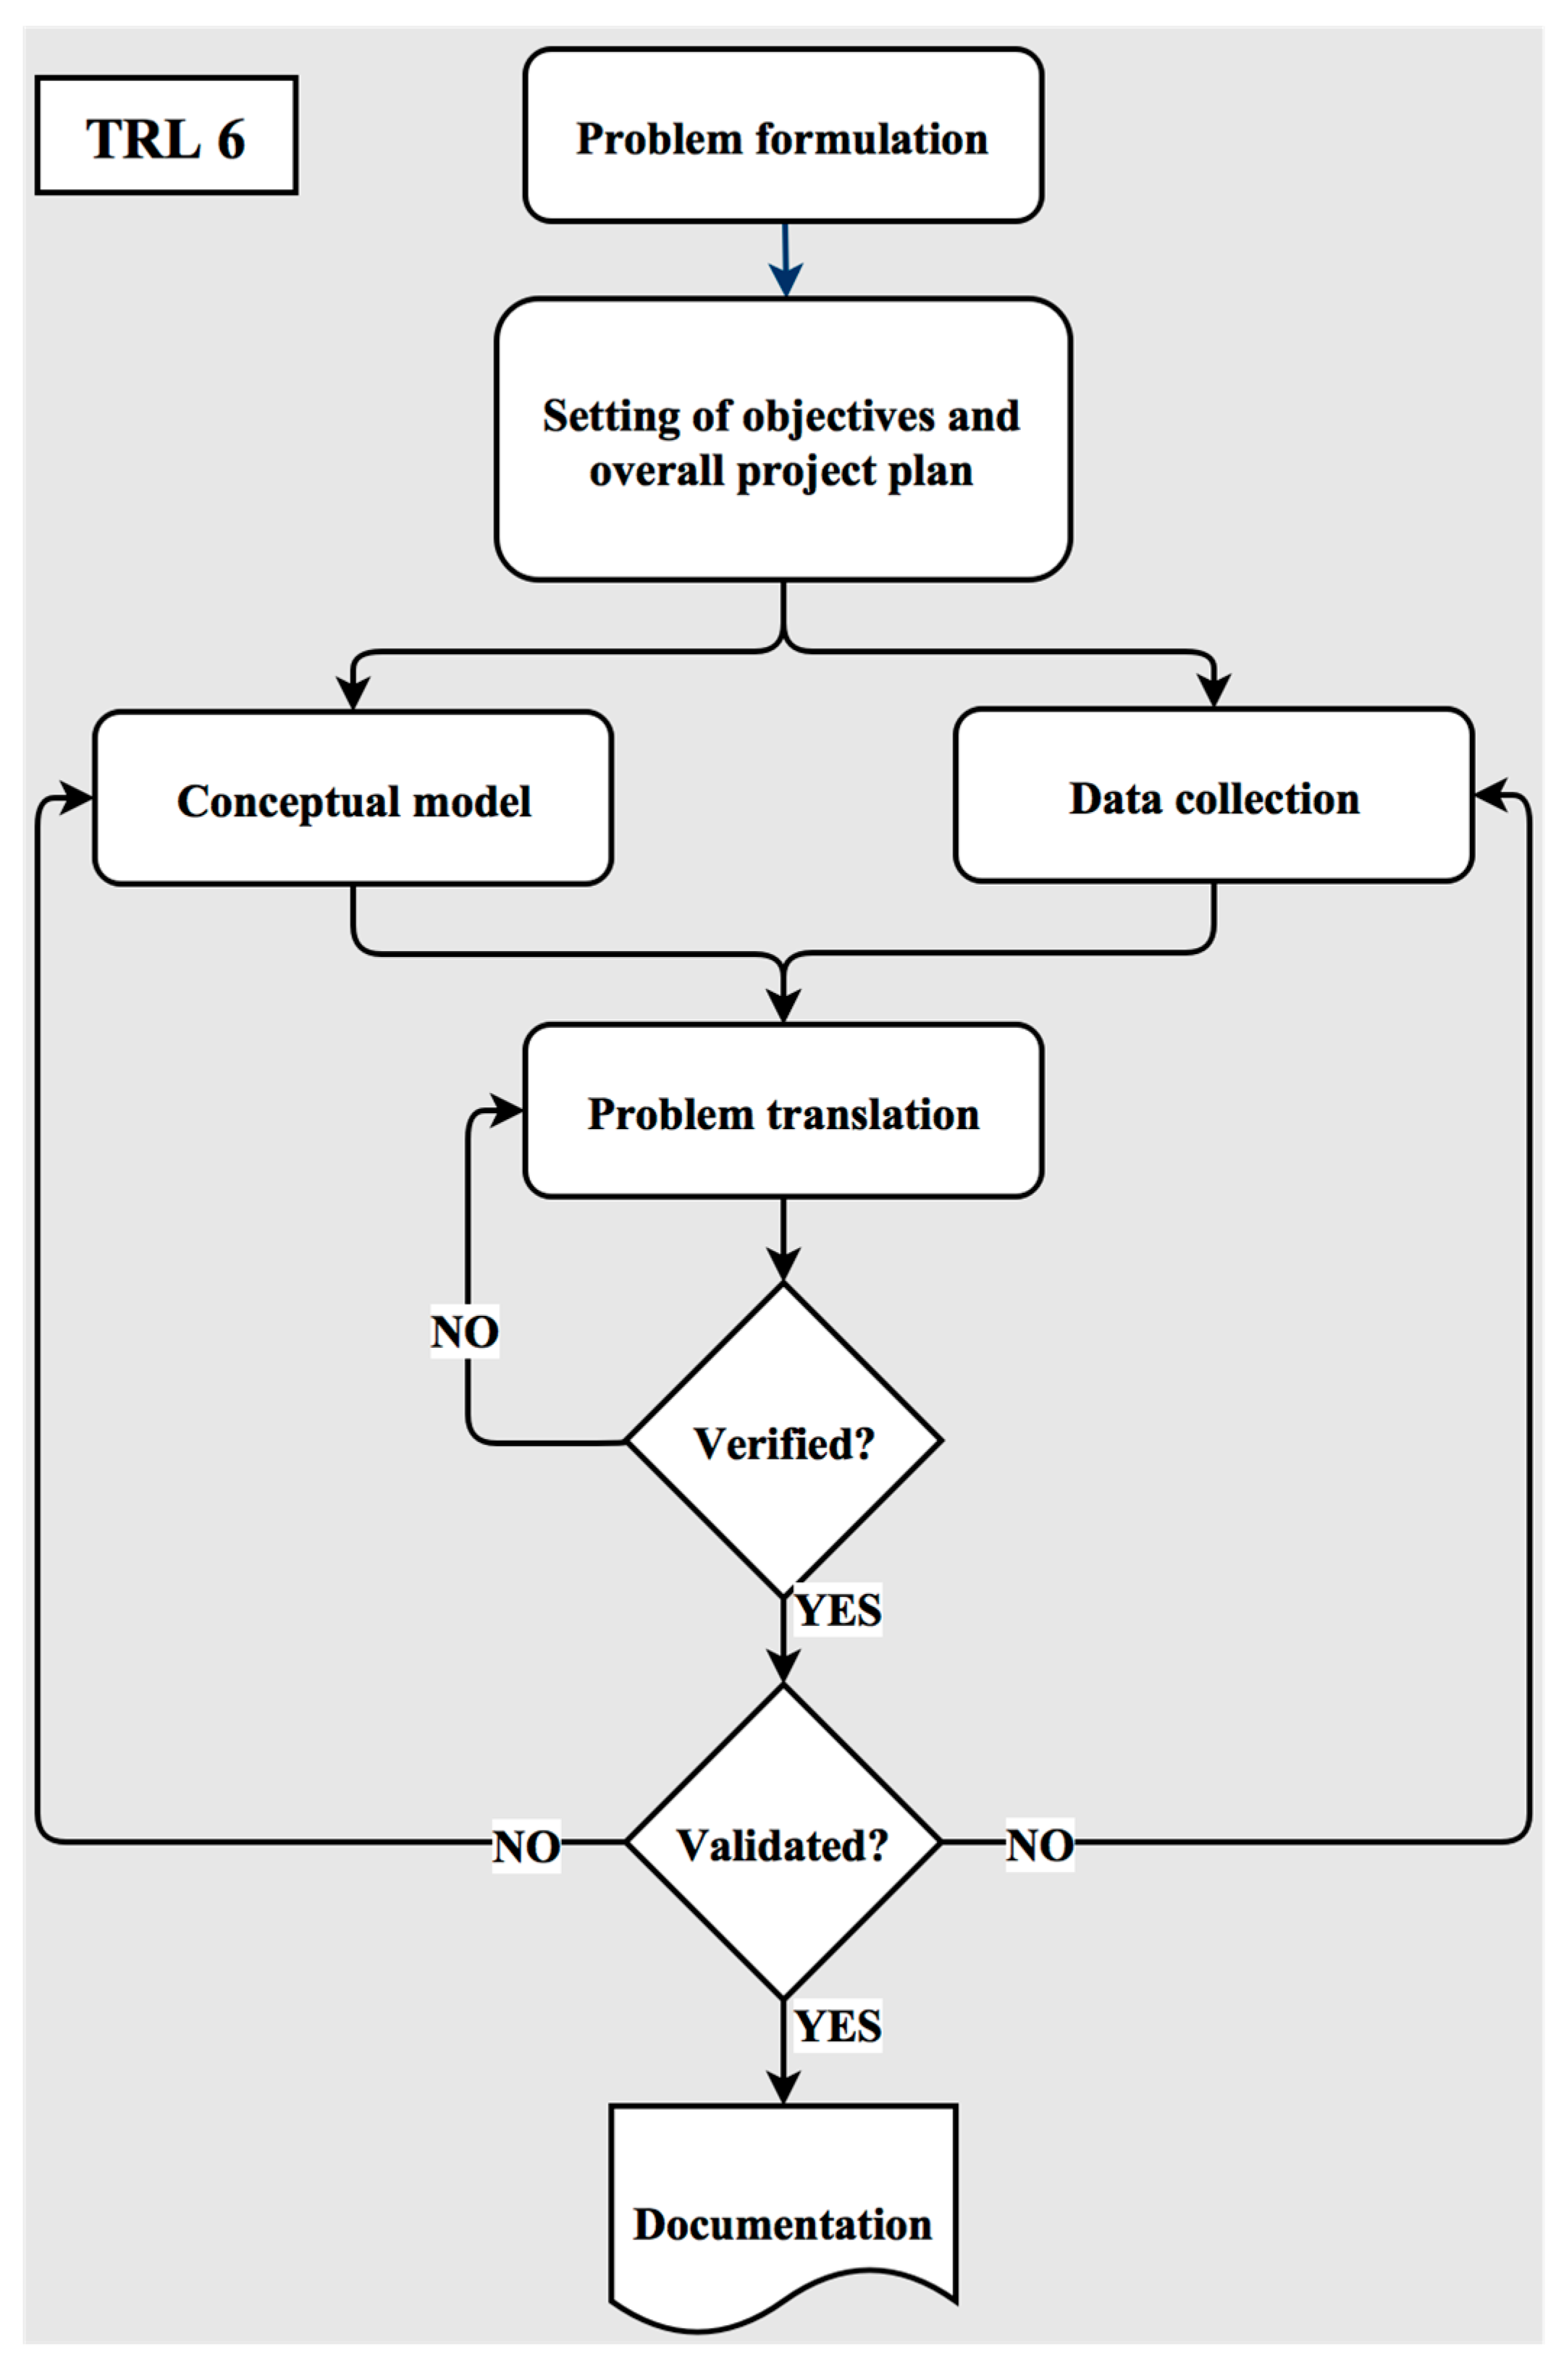
2.2. Steps in a Simulation Study
- Problem formulation: The statement of the problem must provide the description of the purpose for building the model.
- Setting of objectives and overall project plan: The defined objectives indicate the questions that are to be answered by the simulation study. Different scenarios that will be investigated should be included in the project plan.
- Conceptual model: The system under study is abstracted by a conceptual model. In this paper, the conceptual model is a series of logical relationships concerning the components (e.g., excavators, spreaders, conveyor belts, etc.) and the structure (system topology) of the case study.
- Data collection: This stage includes tasks of gathering as much data as possible about the system under study. The model parameters and input probabilities to be used in the model will be defined. Model building and data collection are shown as contemporaneous in Figure 2. The simulation modeler can construct the model while data collection is progressing.
- Model translation: The constructed conceptual model in Step 3 is converted to an operational model. This step can be carried out using simulation software like Arena® [12]. The main tasks in this phase are the coding, debugging, and testing the operational model.
- Verification of the model: This stage compares the output results of the operational model with those that would have been produced by a correct implementation of the conceptual model.
- Validation of the model: This stage compares the outputs of the verified model with the outputs of the real system. It determines that the conceptual model is an accurate representation of system under study. If the system under study is an industrially relevant environment, in this step, TRL 6 will be achieved.
- Documentation: All necessary information with the results of the analysis step should be documented.
2.3. Verification, Validation, and Evaluation Measures
- Verification: a determination of whether the conceptual model has been correctly translated into a computer program.
- Validation: a determination of whether a simulation model is an accurate representation of the system.
- Bias: refers to the tendency of a measurement process to over- or under-estimate the value of a population parameter. The bias can be defined as the sum of differences between all predicted and actual Key Performance Indicator (KPI) values over all n predicted time intervals:
- Average deviation: is one of several indices of the prediction error. Within this study, it is defined as the mean absolute deviation between all predicted and actual KPI-values over all n predicted time intervals:
- Average relative error: the relative error is the absolute error (average deviation) divided by the magnitude of the actual value. Within this study, it is defined as:
3. Goal and Objectives
- Define the problem to be studied, constraints, and the type of analysis to be performed;
- Abstract the system into a model described by the components of the system, their characteristics, and their interactions;
- Identify, specify, and gather data in support of the model;
- Extend the existing simulation model with respect to the new problem, model, and data structure;
- Embed the simulation model in a simulation platform;
- Design some experiments for the purpose of the verification and the validation of the simulation model;
- Analyze the simulation outputs to draw implications and make recommendations for problem resolutions.
4. Practical Implementation
4.1. Problem Statement
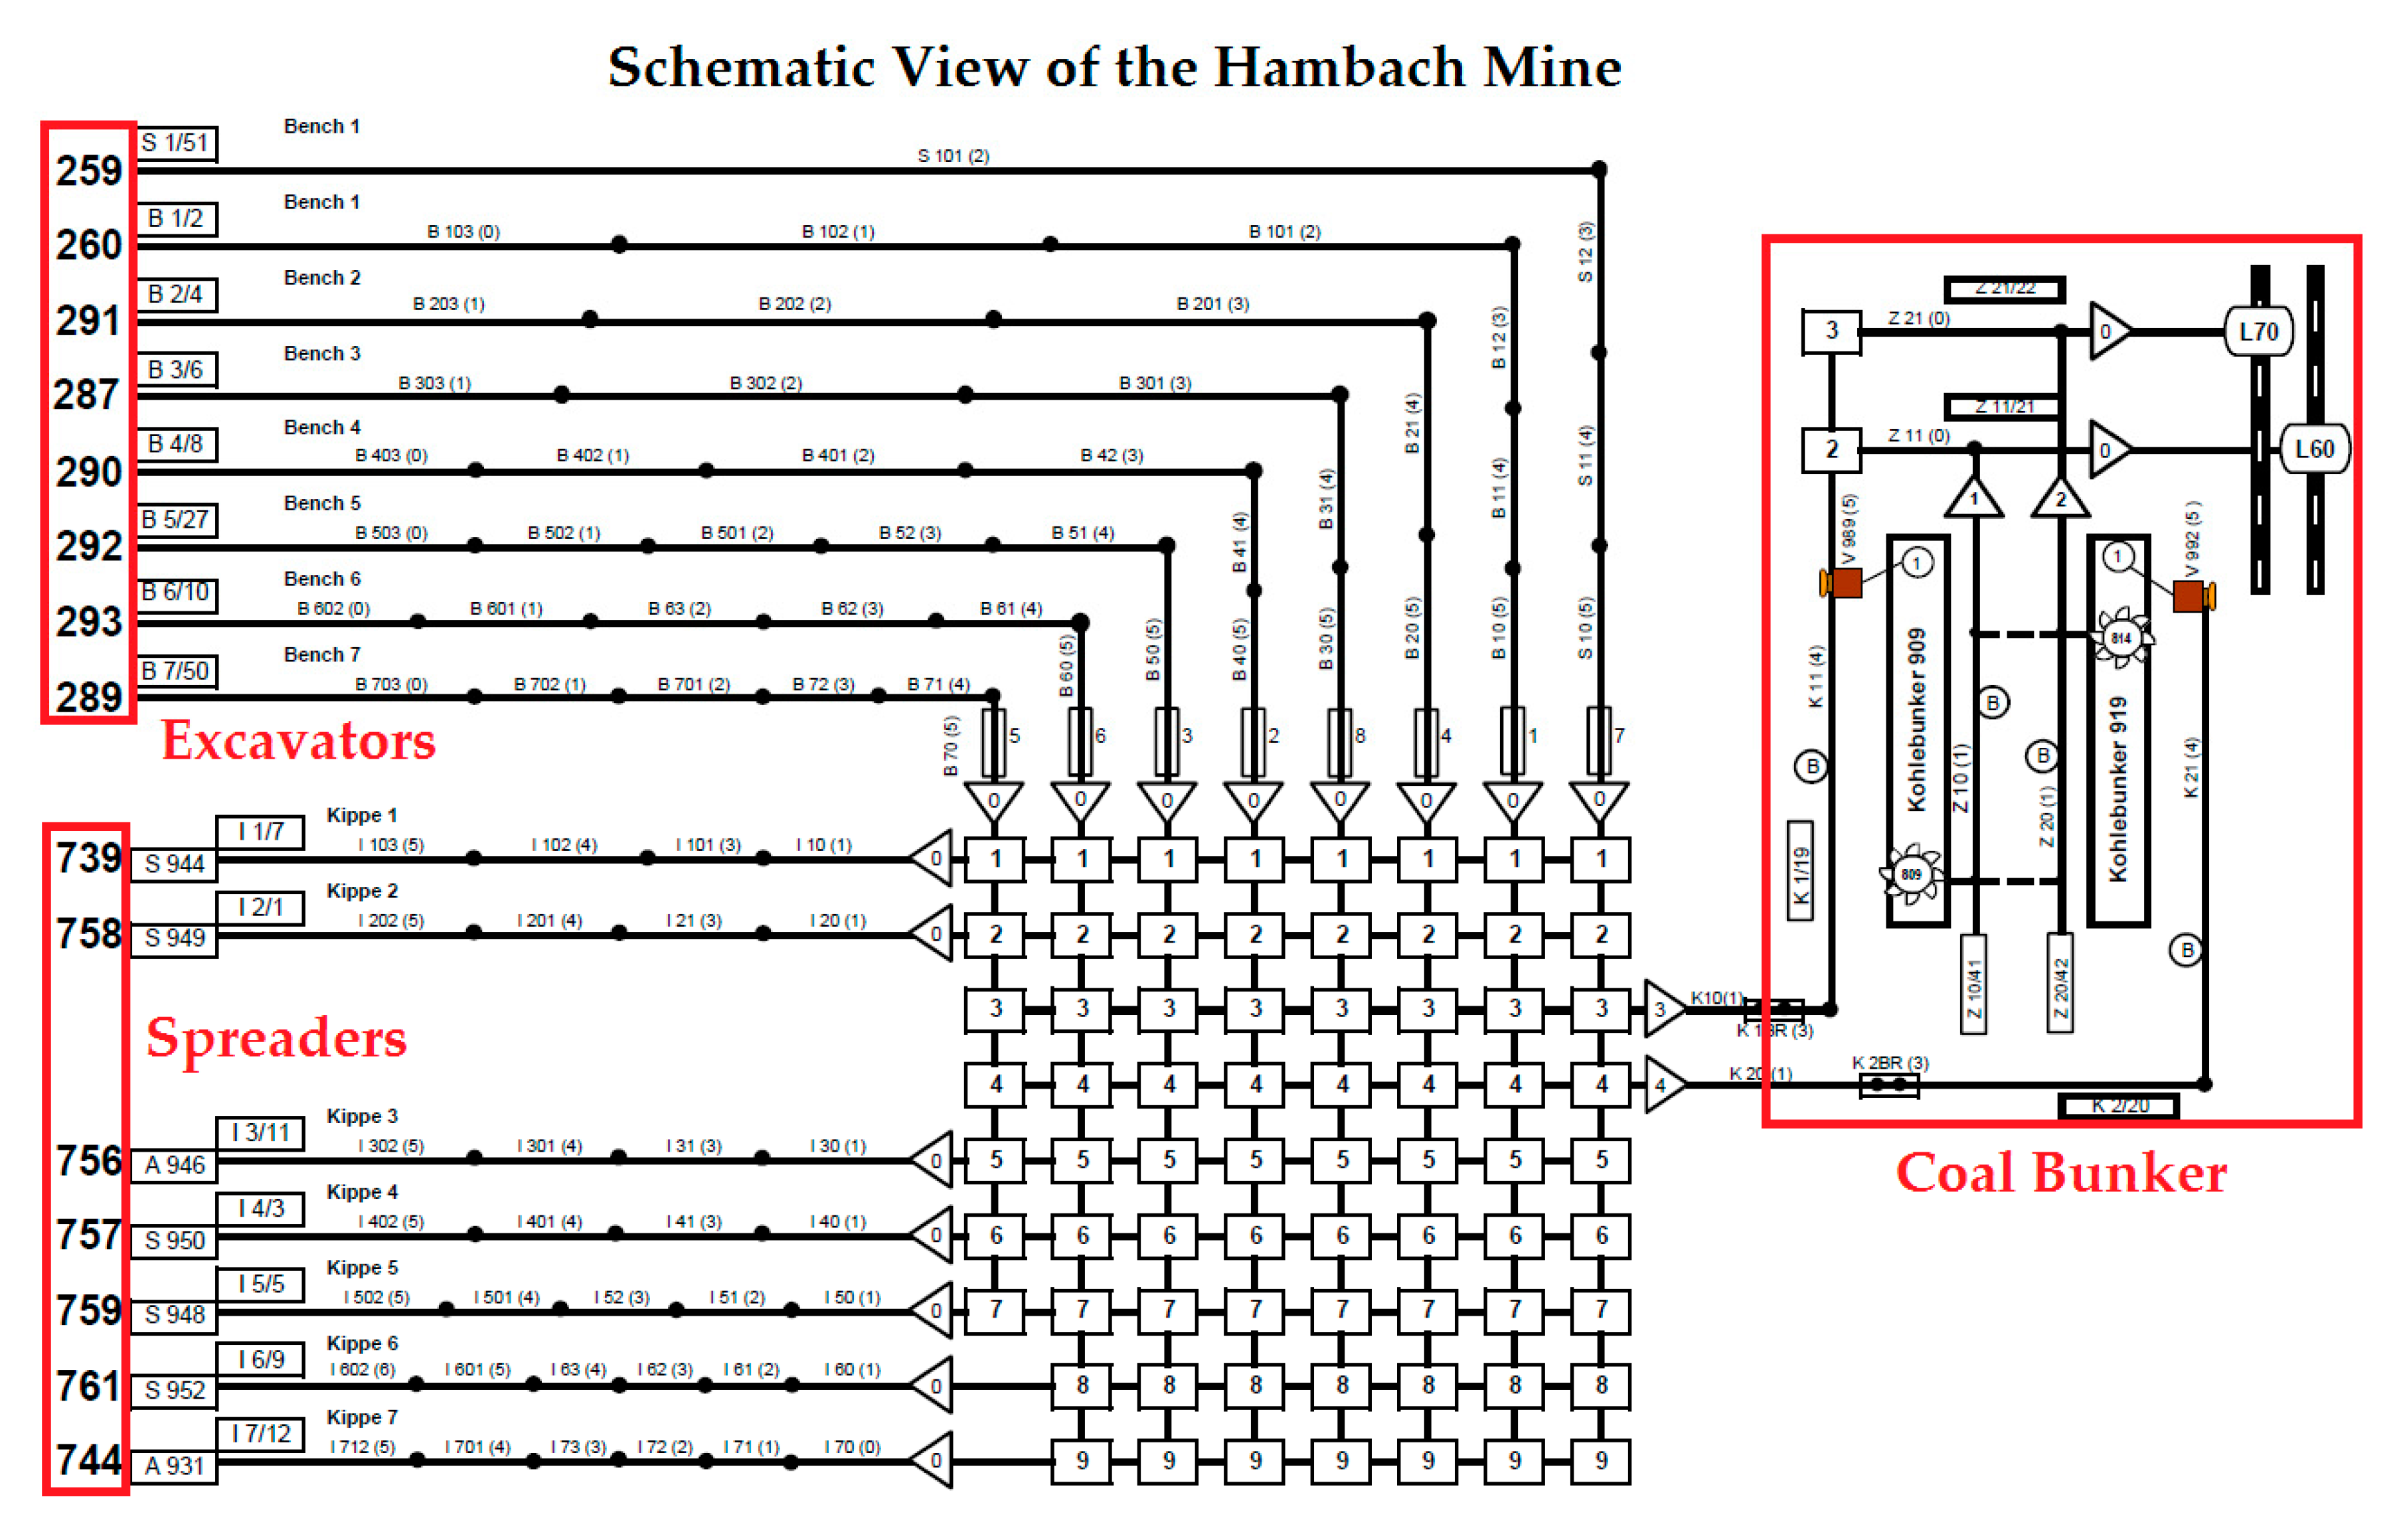
4.1.1. Case Hambach: Overburden Management
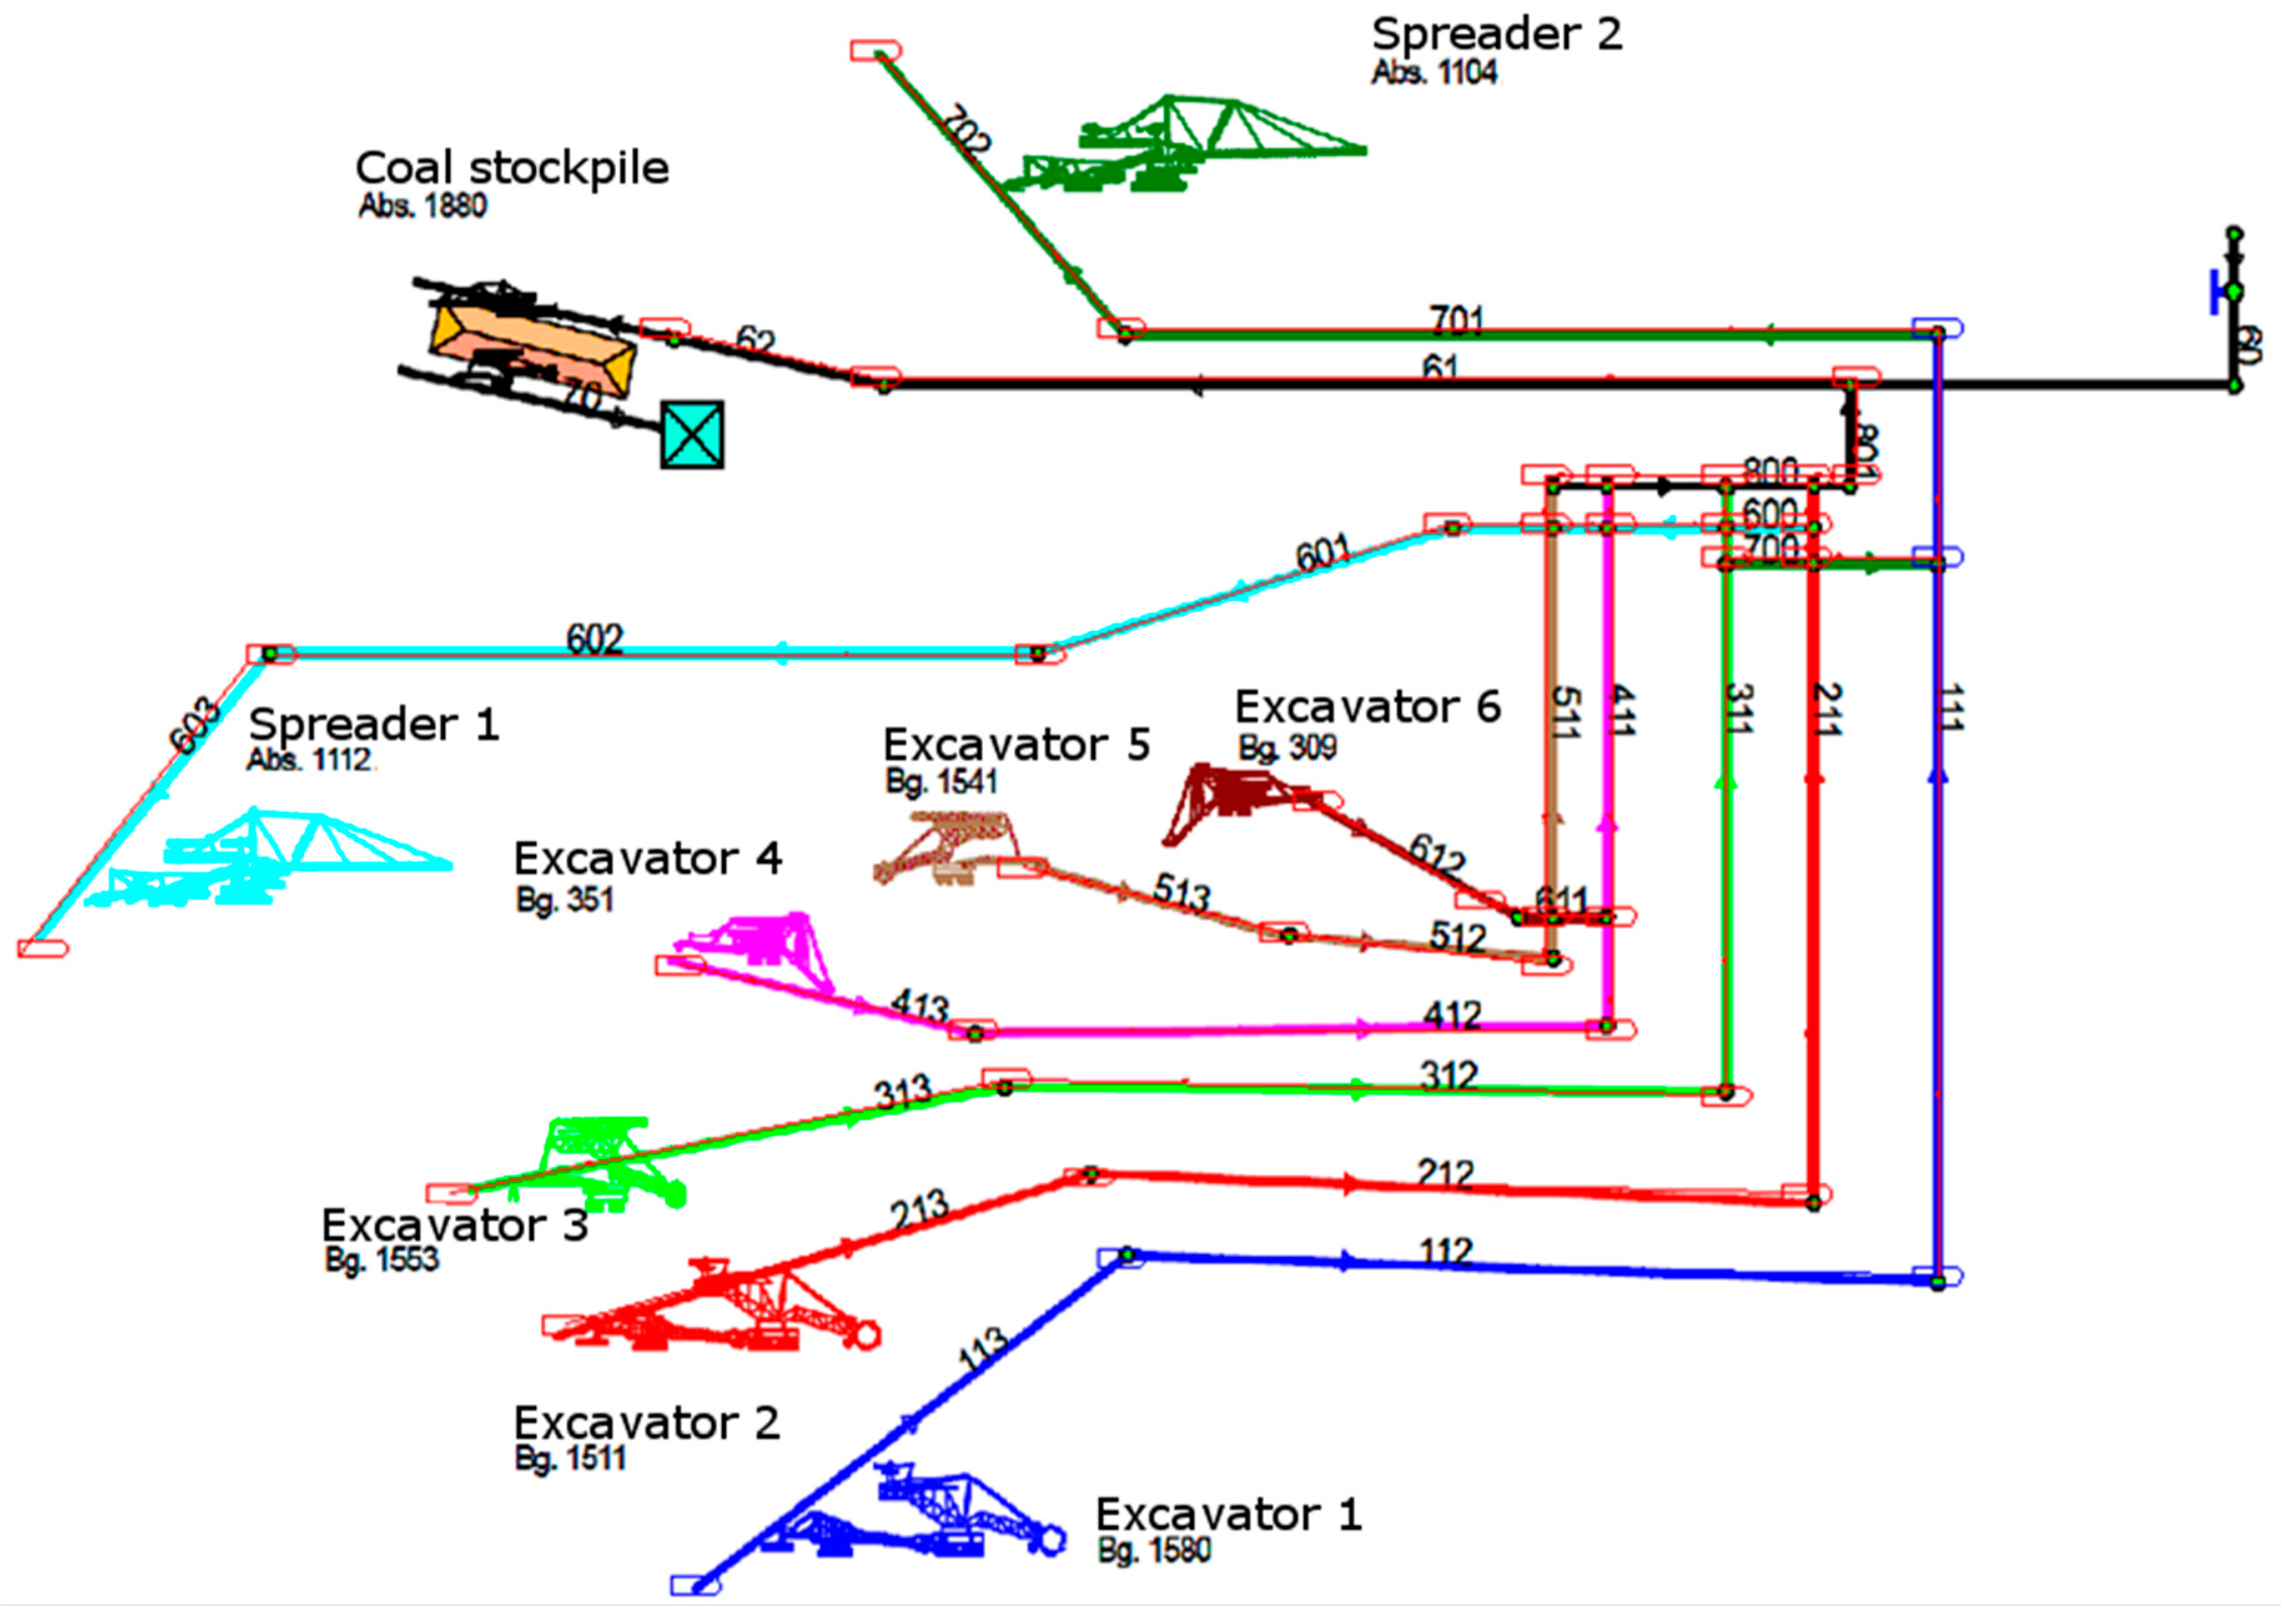
4.1.2. Case Profen: Production Efficiency and Coal Quality Management
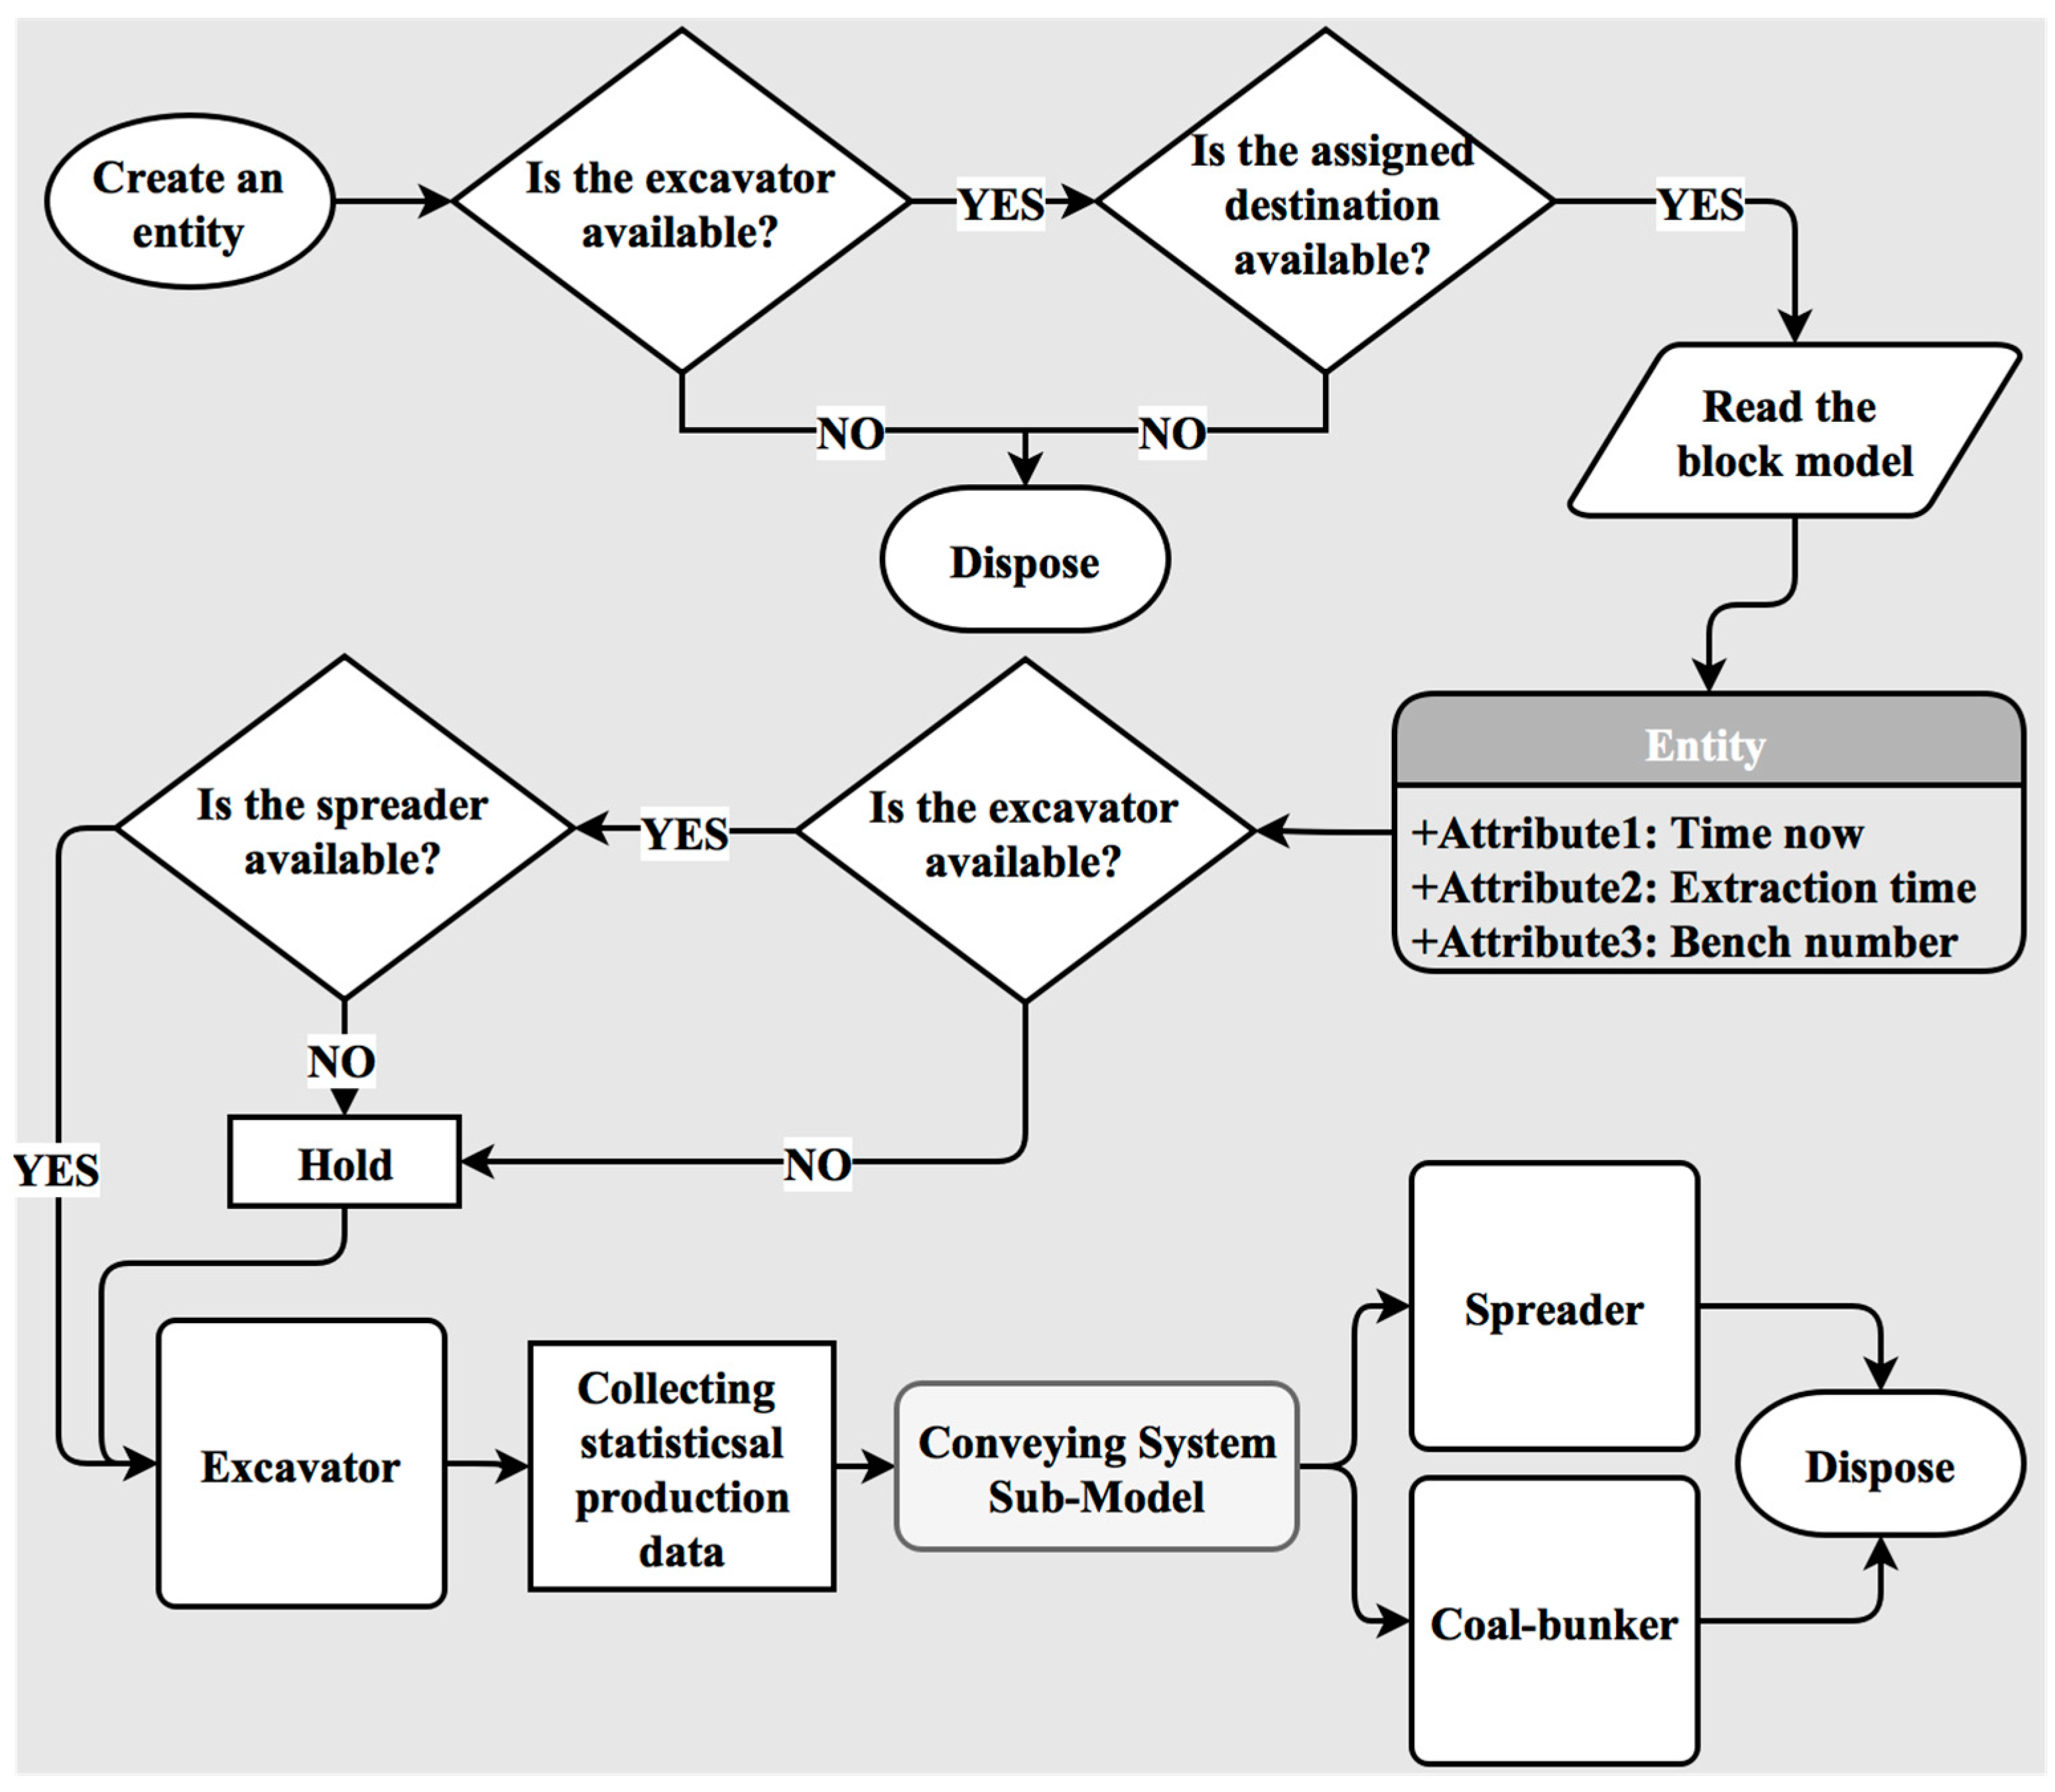
- The excavator Bg. 1580 extracts only waste (sand, gravel, and clay) and is connected to the spreader Abs. 1104.
- The excavators Bg. 1511 and Bg. 1553 can send the extracted materials to the all defined destinations, (the coal-bunker, the spreaders Abs. 1112, Abs. 1104).
- The excavators Bg. 351, Bg. 1541, and Bg. 309 extract coal and waste and have access to the spreader Abs. 1112 and the coal-bunker.
4.2. Conceptual Model of Continuous Mining Systems
- Case Hambach: The quantity and the utilization KPI will be measured.
- Case Profen: All three KPIs will be measured.
4.3. Data Collection and Modeling of Stochastic Behavior
- Any data that is related to the production process, e.g., amount of waste or coal and quality parameters of the delivered coal to different customers;
- Any data that is related to the breakdowns of equipment, e.g., at what time the failure happens, what is the root cause, and the duration of the failure (i.e., the repair time).
4.4. Model Building—Problem Translation
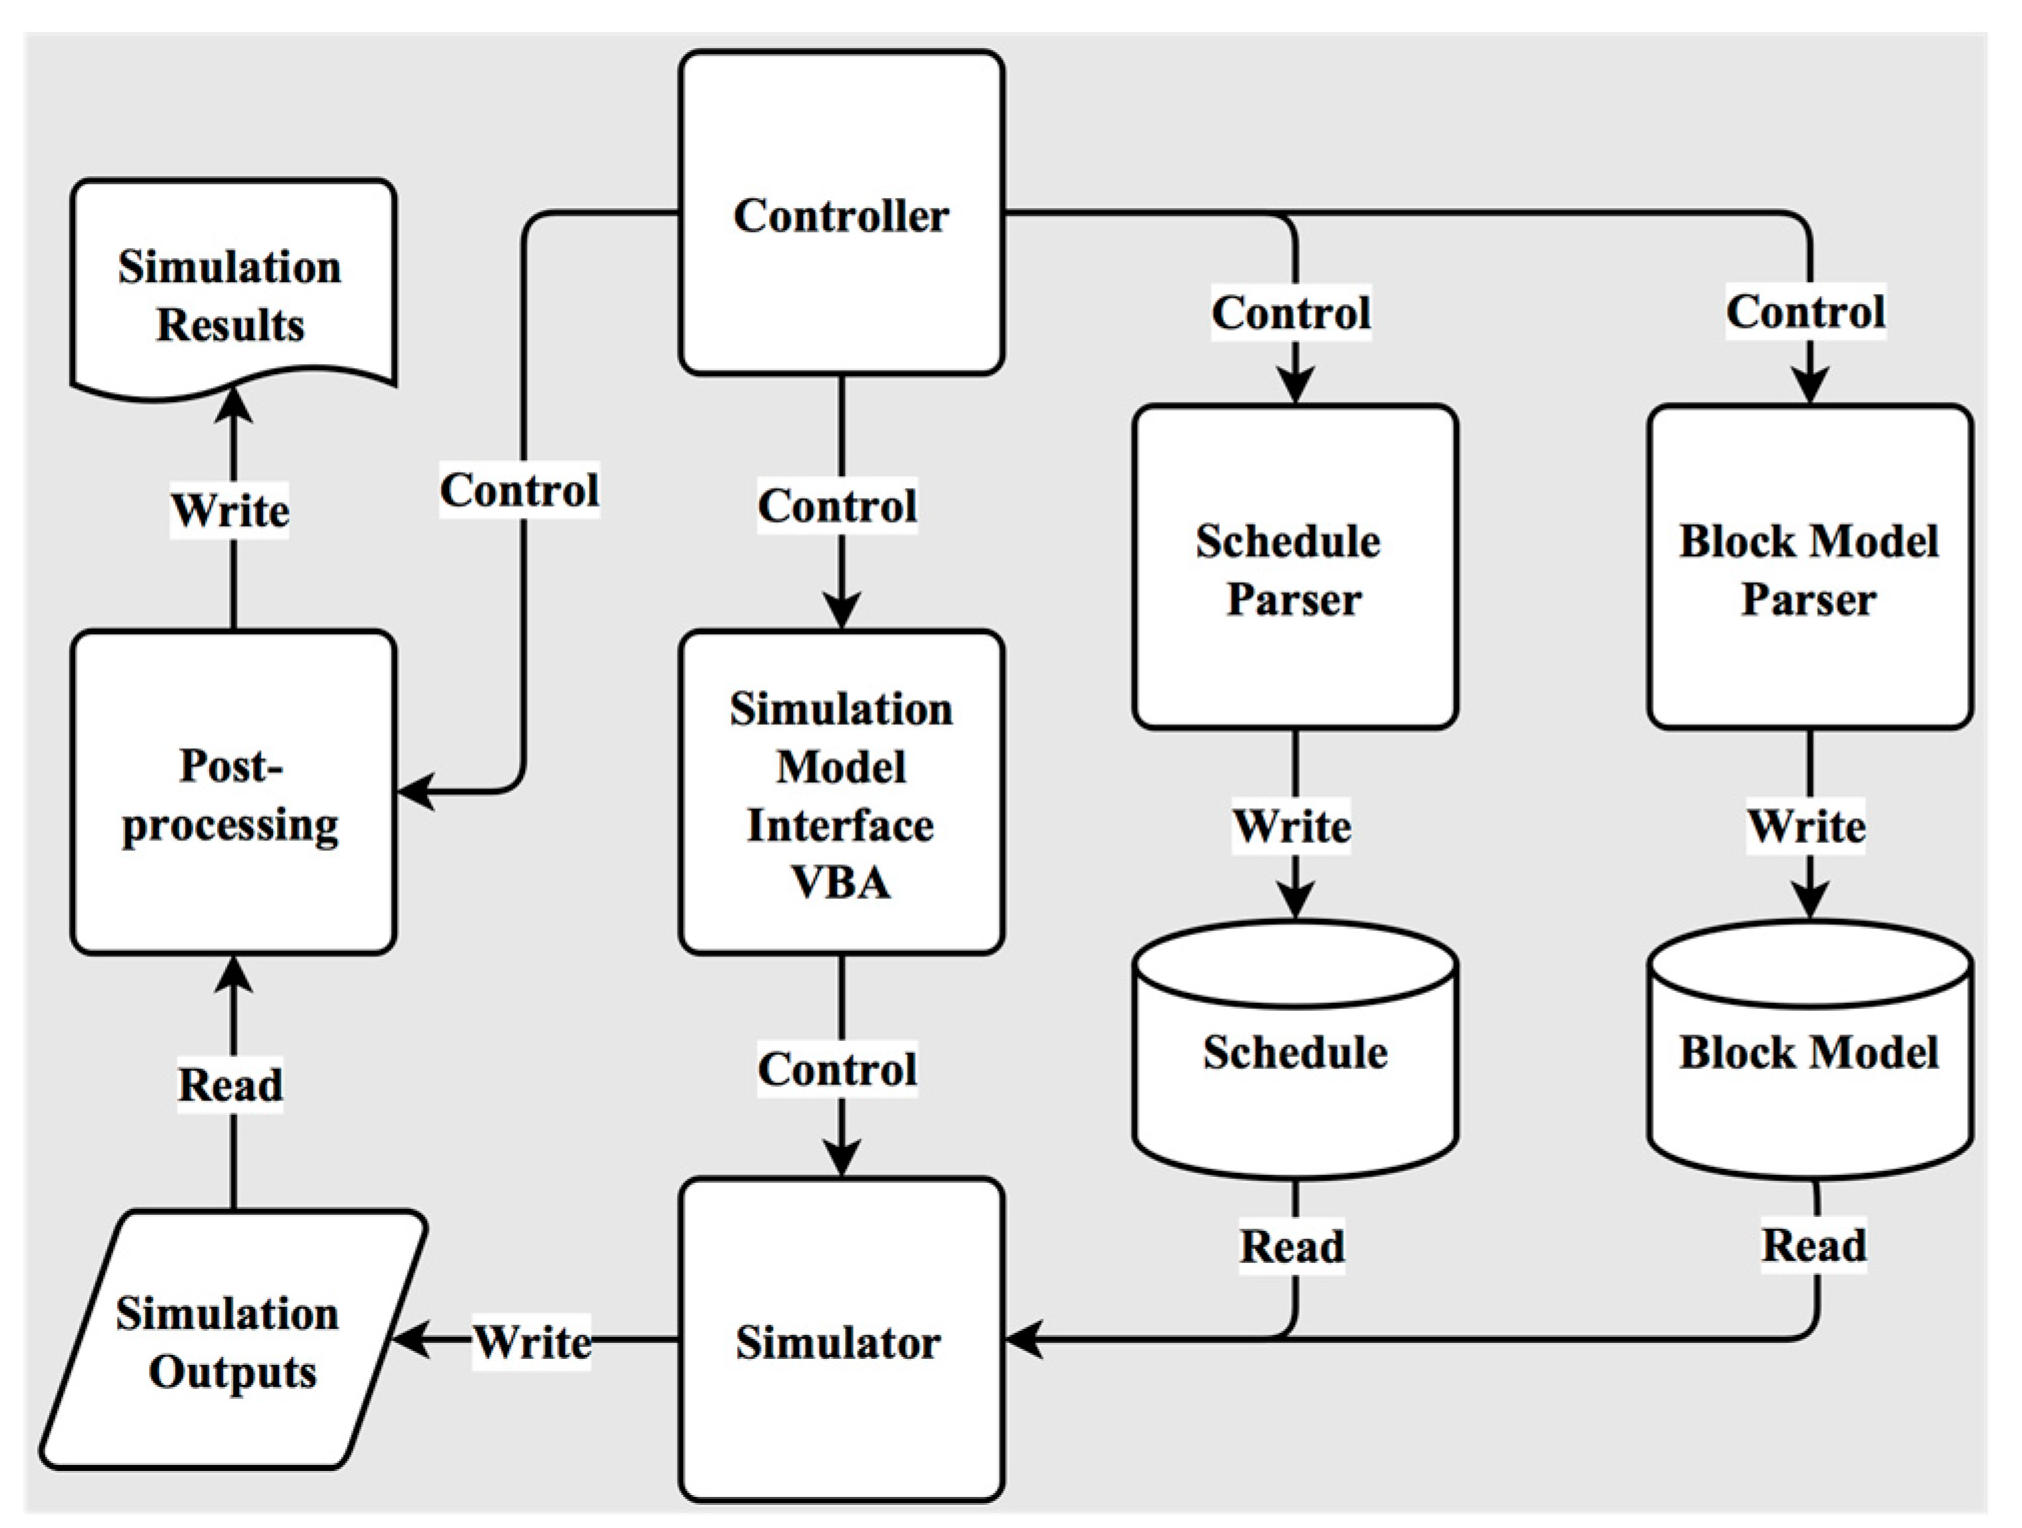
4.5. Embedding the Simulation Model in a Simulation Platform
4.5.1. Simulation Platform Overview
- Read: The process reads information from a file and uses this for its processing.
- Write: The process writes information or results to a file, which either can be read by another process or is meant as an output to the user.
- Simulation configuration
- ○
- The controller stores the date to be simulated and the output directory in a configuration file.
- Simulation preparation
- ○
- The controller creates or clears the simulation output directory.
- ○
- The block model parser selects the blocks to be used for the simulation and writes them to a database.
- ○
- The schedule parser creates a schedule based on the weekly/monthly schedule of the mine and writes the schedule to a database.
- Simulation run
- ○
- The controller calls the simulation model interface, which in turn instructs Arena to load the desired simulation model, reload the schedule data and then to run the simulation.
- ○
- Arena reads the block model and schedule data from the databases, runs the simulation and writes the output to the simulation output files.
- ○
- The controller copies the Arena output files to the output directory.
- Simulation post-processing
- ○
- The post-processing script generates the tables and figures that show the simulation results.
4.5.2. Post-Simulation Processing of Results
- Coal-bunker output for all excavators and replications, one line per entity;
- Waste dump output for all excavators and replications, one line per entity;
- Aggregated volume statistics per excavator;
- Detailed activity log of excavators.
- split the data per replication and resample the different entities,
- sum them up by day (for an example),
- determine the weighted average of quality parameters, and
- write the values in a file with the following order: replication, date, values.
4.6. Design of Experiments for Validity Test of the Case Studies
- Experiment 1: Run the simulation model without stochastic components
- ○
- The input reserve block model is derived from actual measured data and all parameters such as working schedule, failures, and excavation rates are taken as historically performed as deterministic values.
- ○
- The target of this experiment is to verify the output of the simulation model against with what exactly happened in the mine during the time horizon considered.
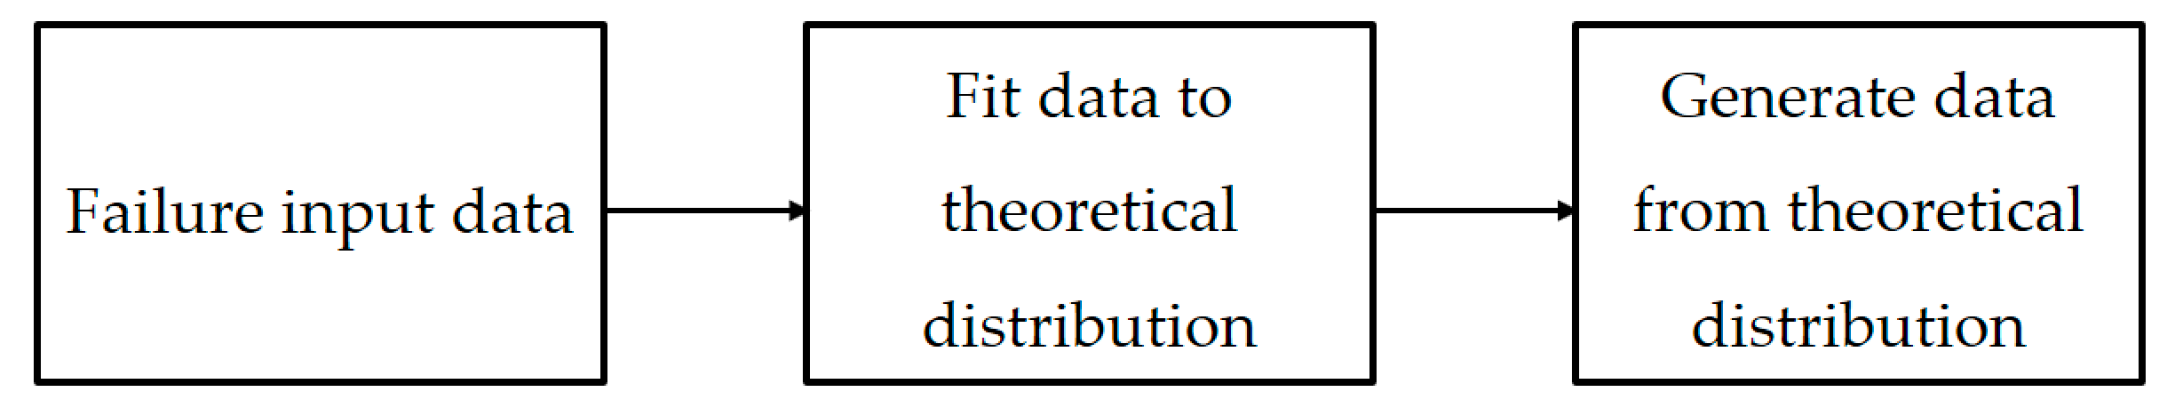
- Experiment 2: Run the simulation model with stochastic component “breakdown behavior”
- ○
- The reserve block model is kept as in Experiment 1 and it represents the reality. In this experiment, theoretical distributions for predicting unscheduled breakdowns of equipment are added to the model as stochastic components.
- ○
- The target of this experiment is to test the reliability of the model in predicting downtimes. The utilization KPI is measured.
- Experiment 3: Run the simulation model with stochastic component “breakdown behavior” and “reserve block model”
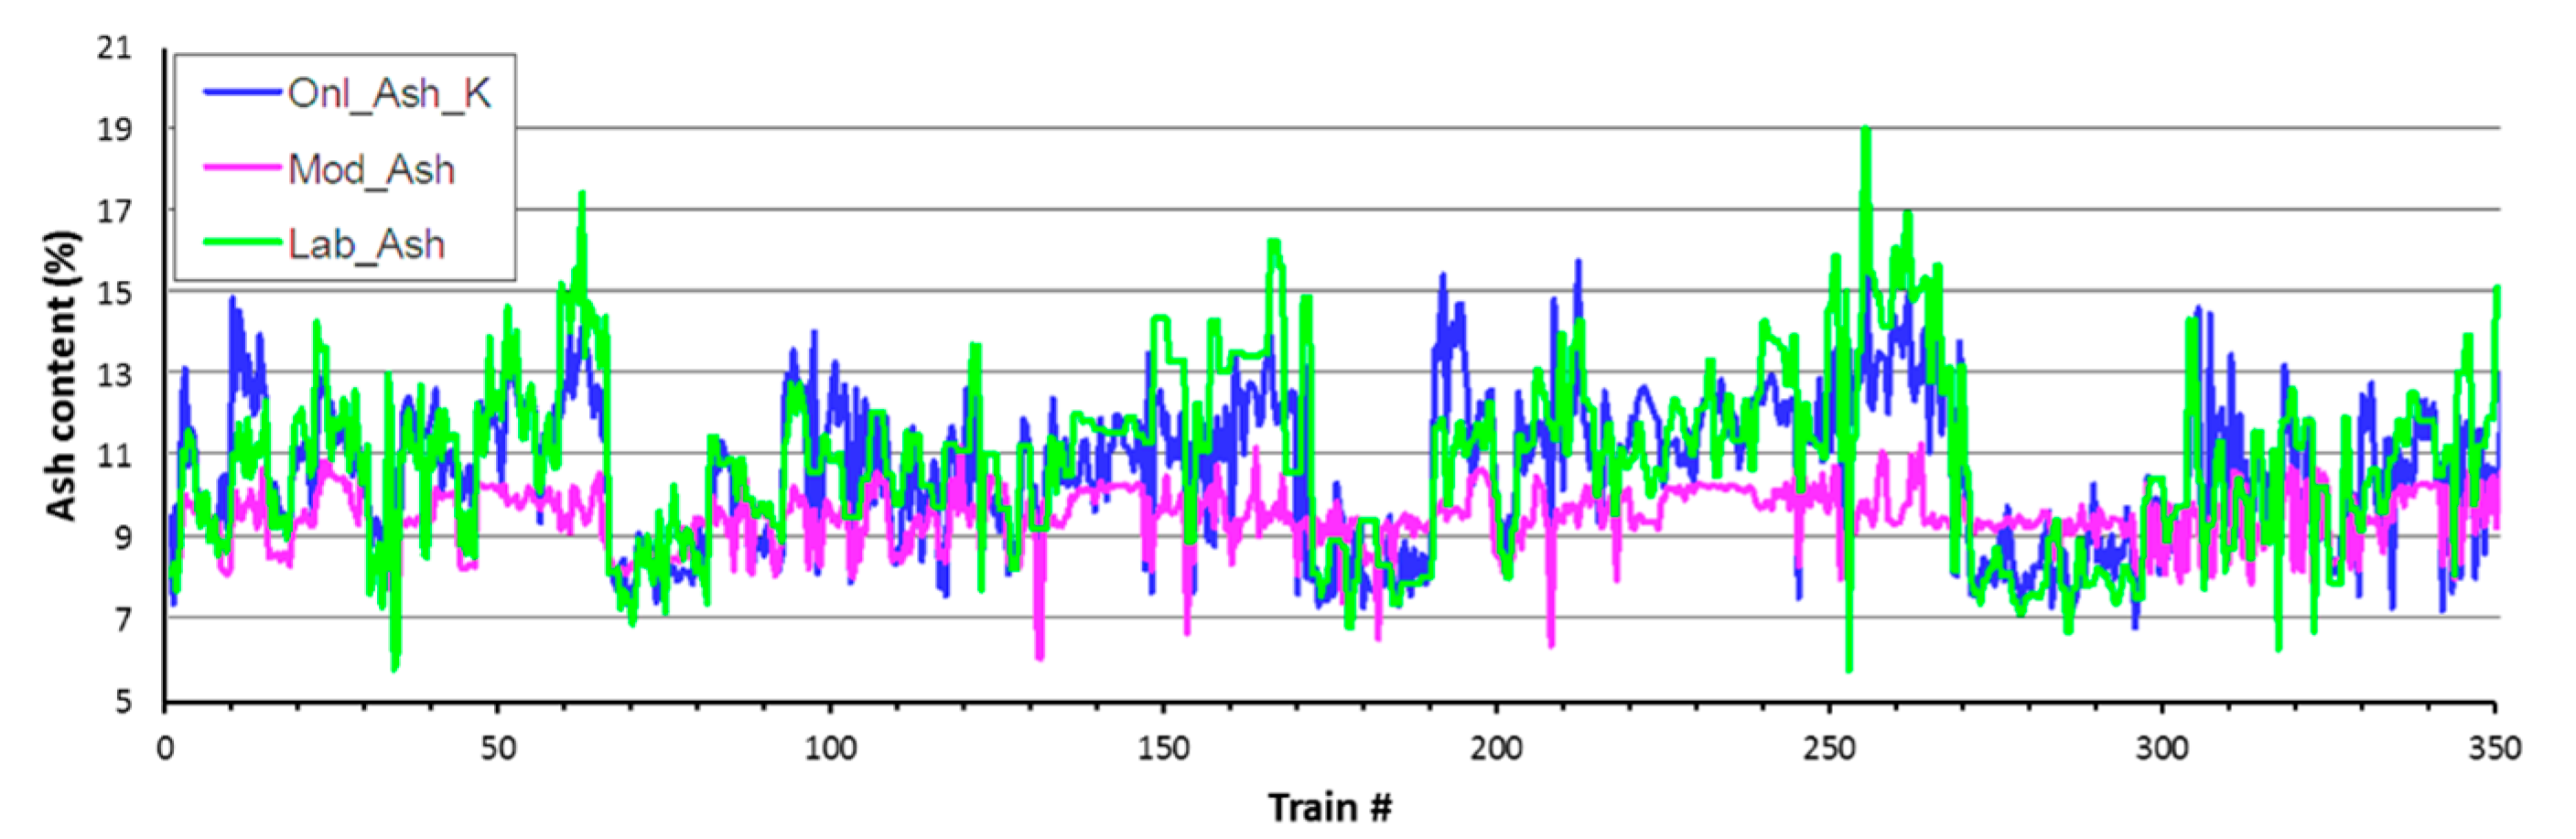
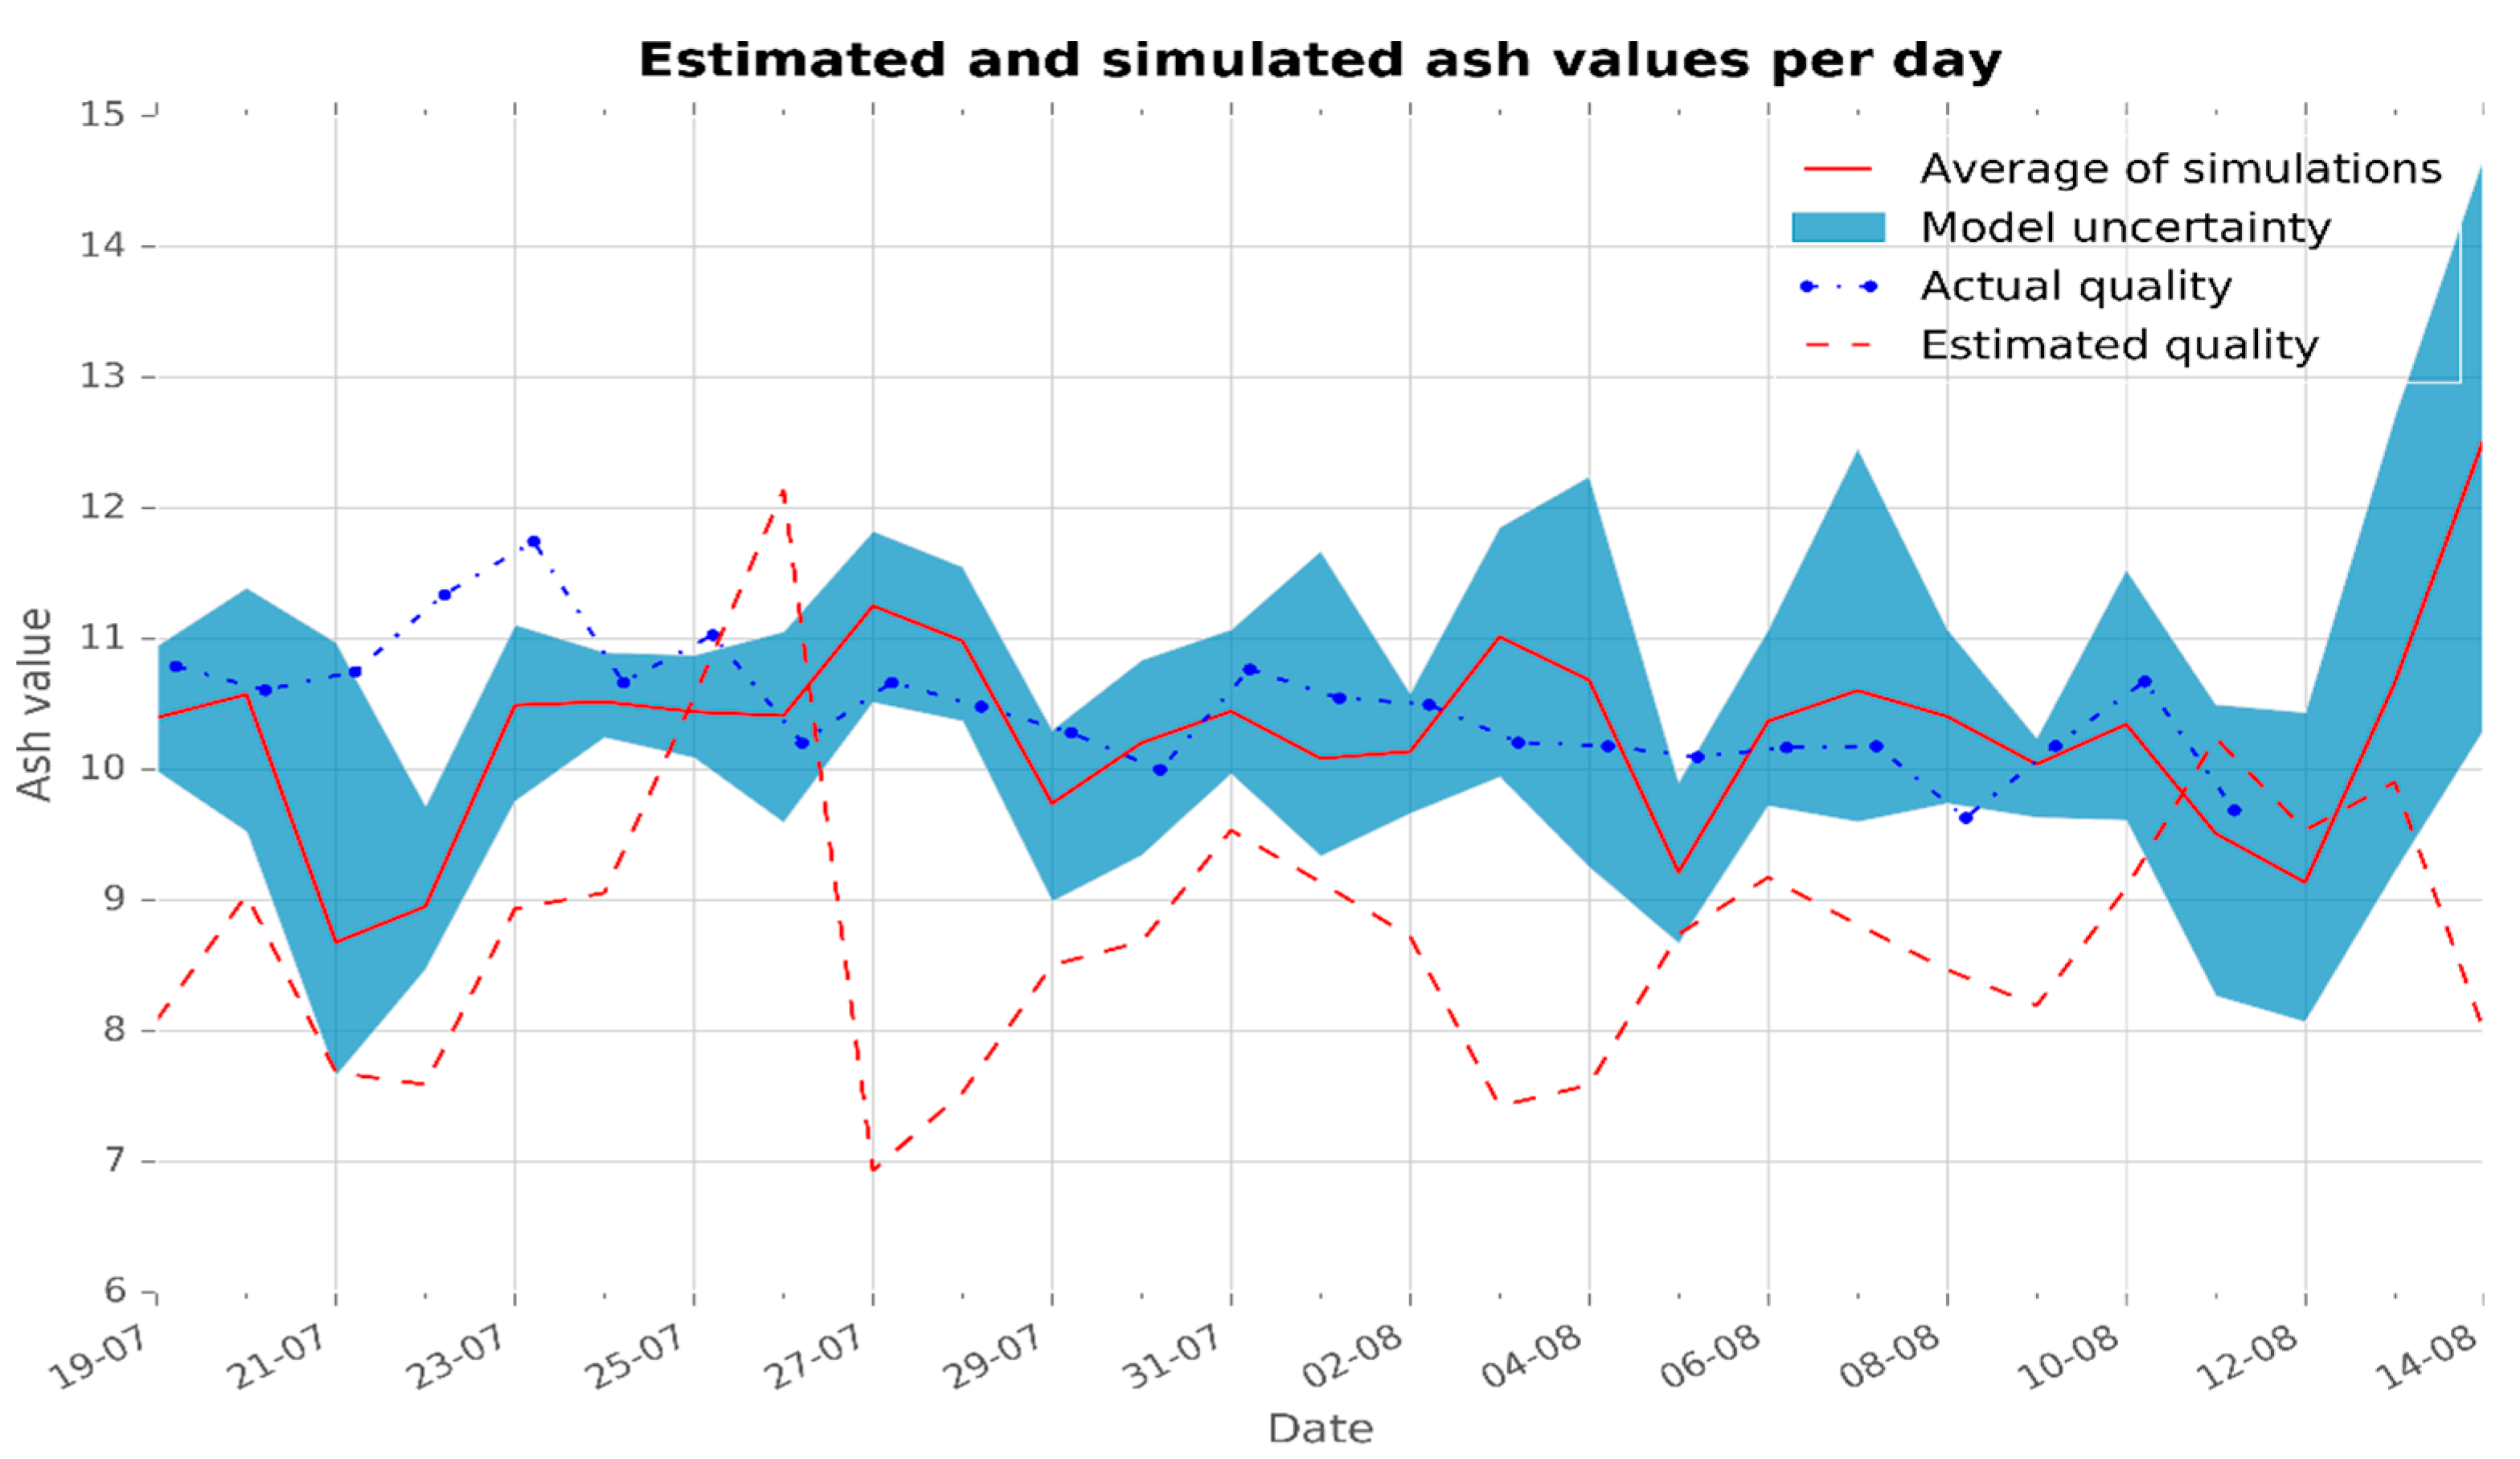
- This experiment is designed for the quantification of geological uncertainty in the Profen mine. After being certain that equipment failure models are good enough, the stochastic input “reserve block model” is added to the simulation model. In total, there are 26 different reserve block models (different possible values for ash content) as mentioned earlier.
4.7. Results
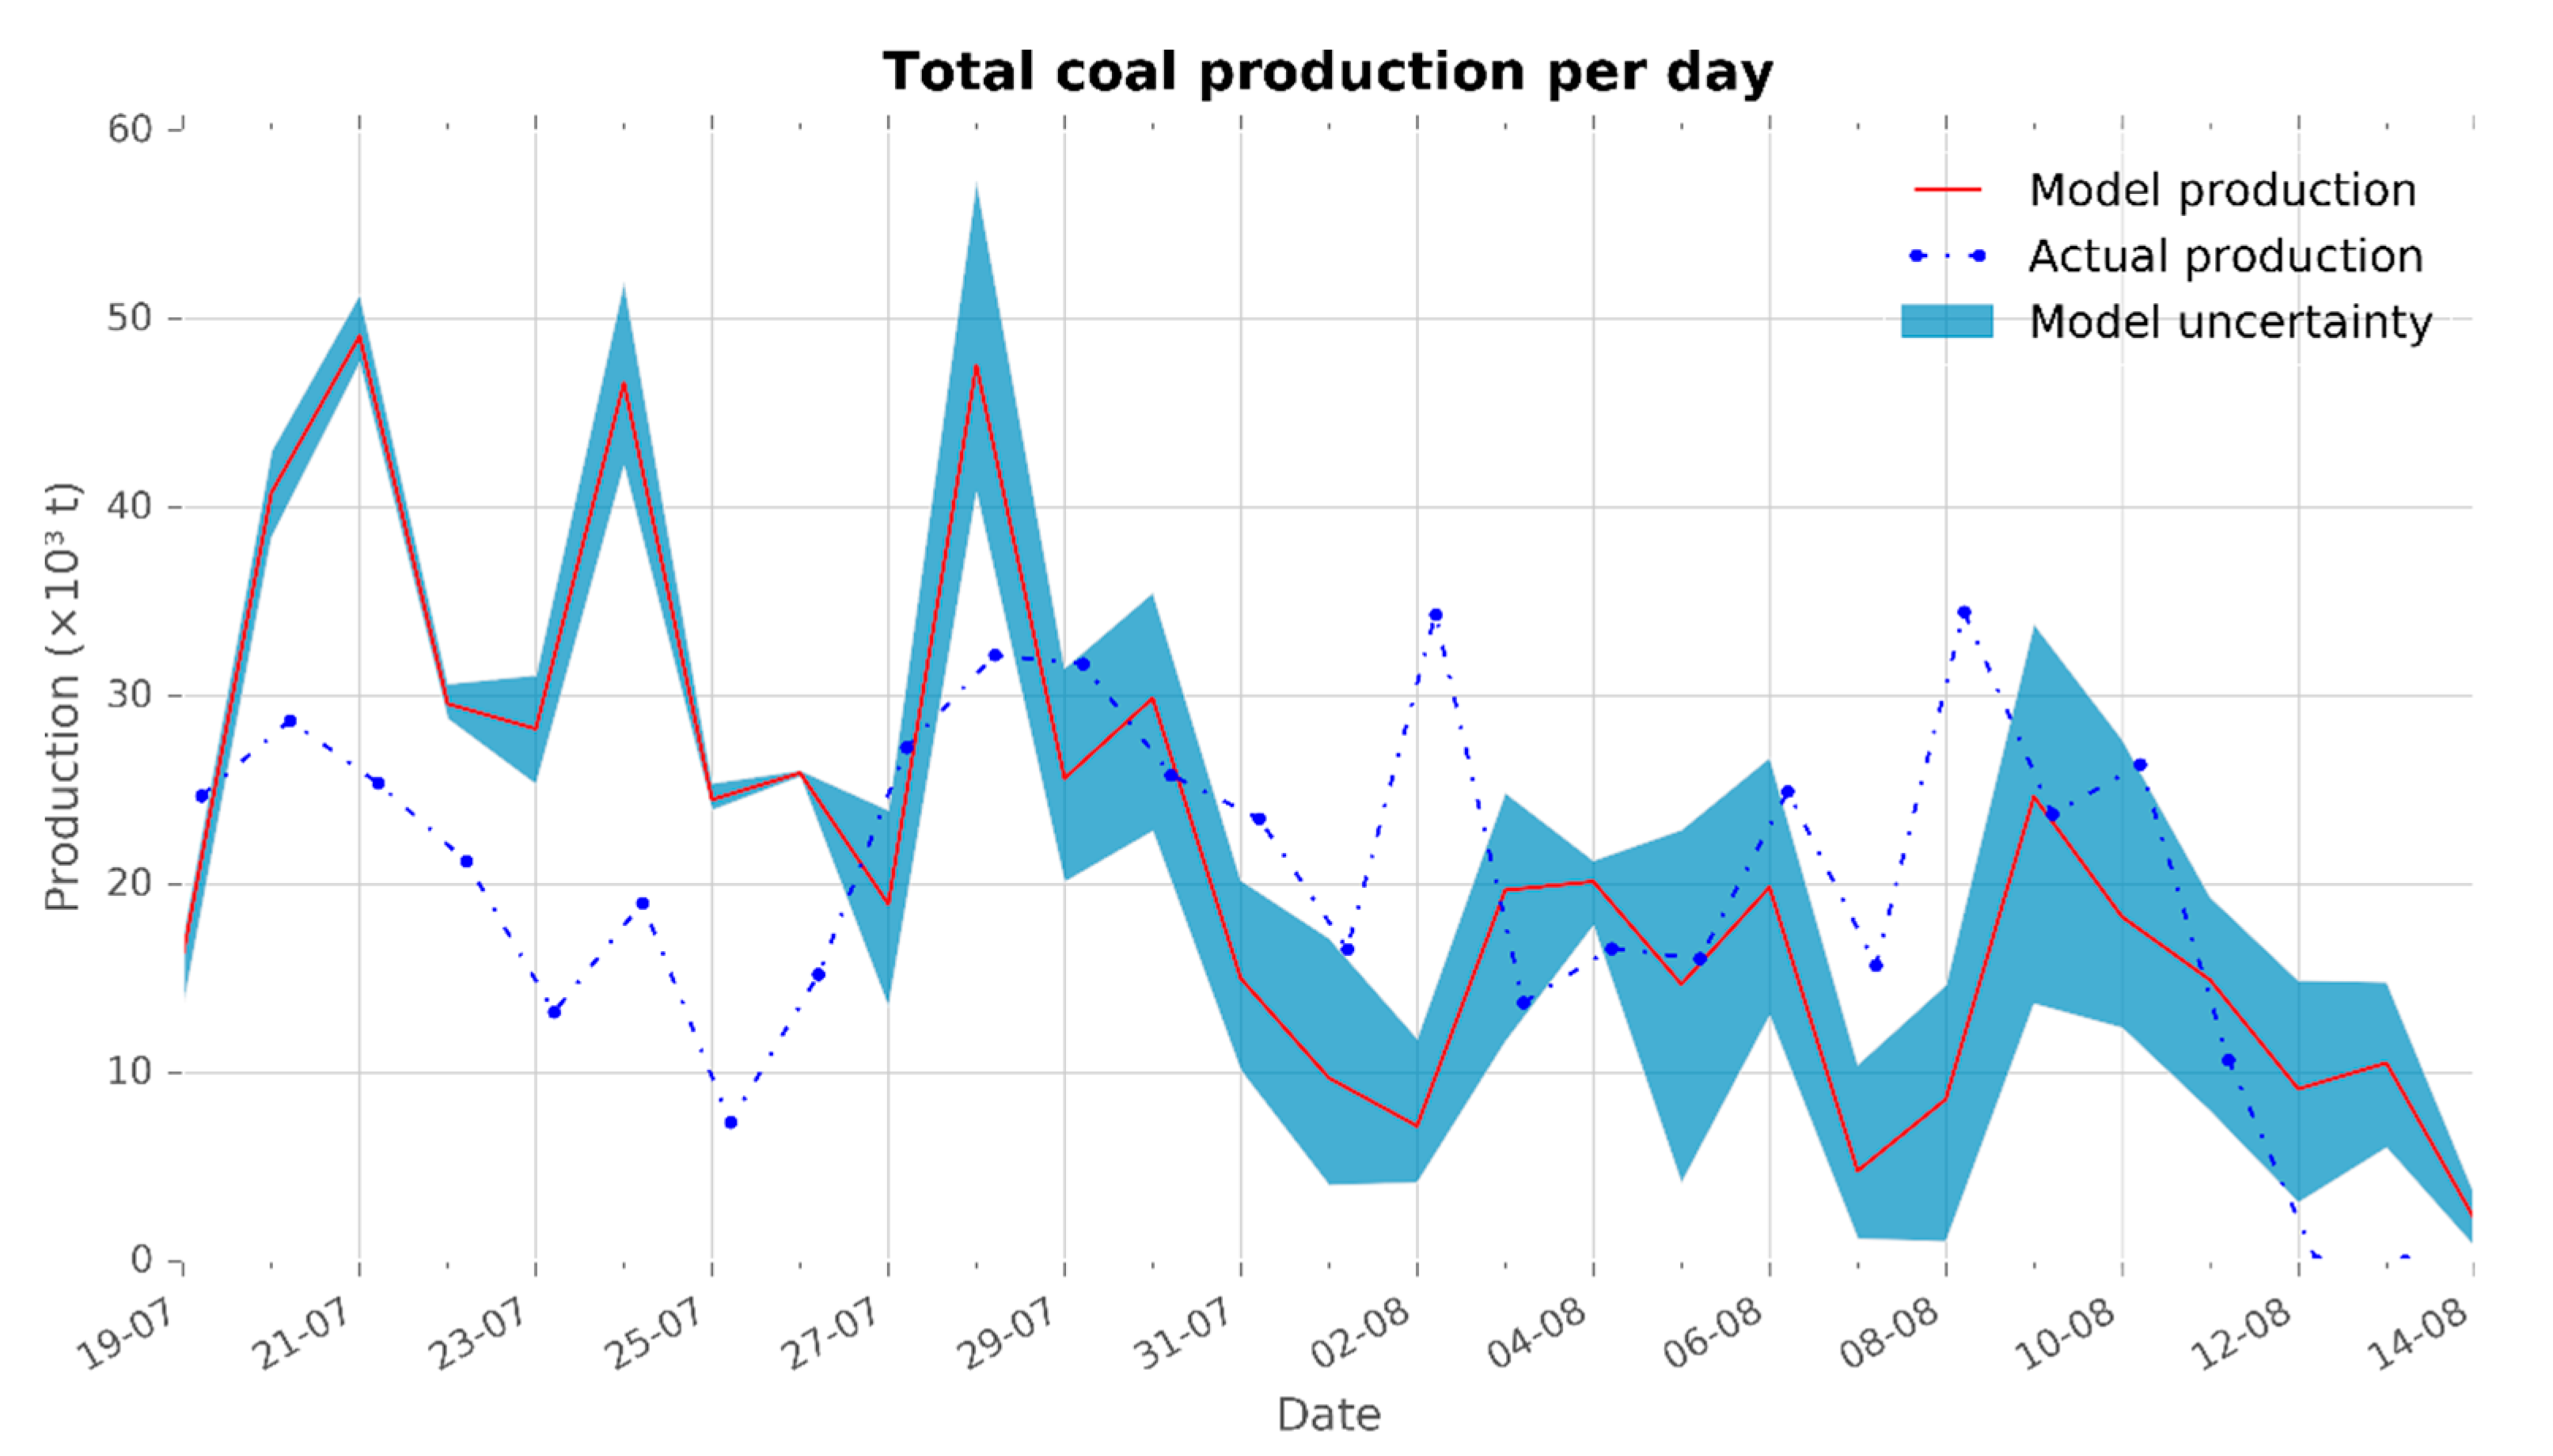
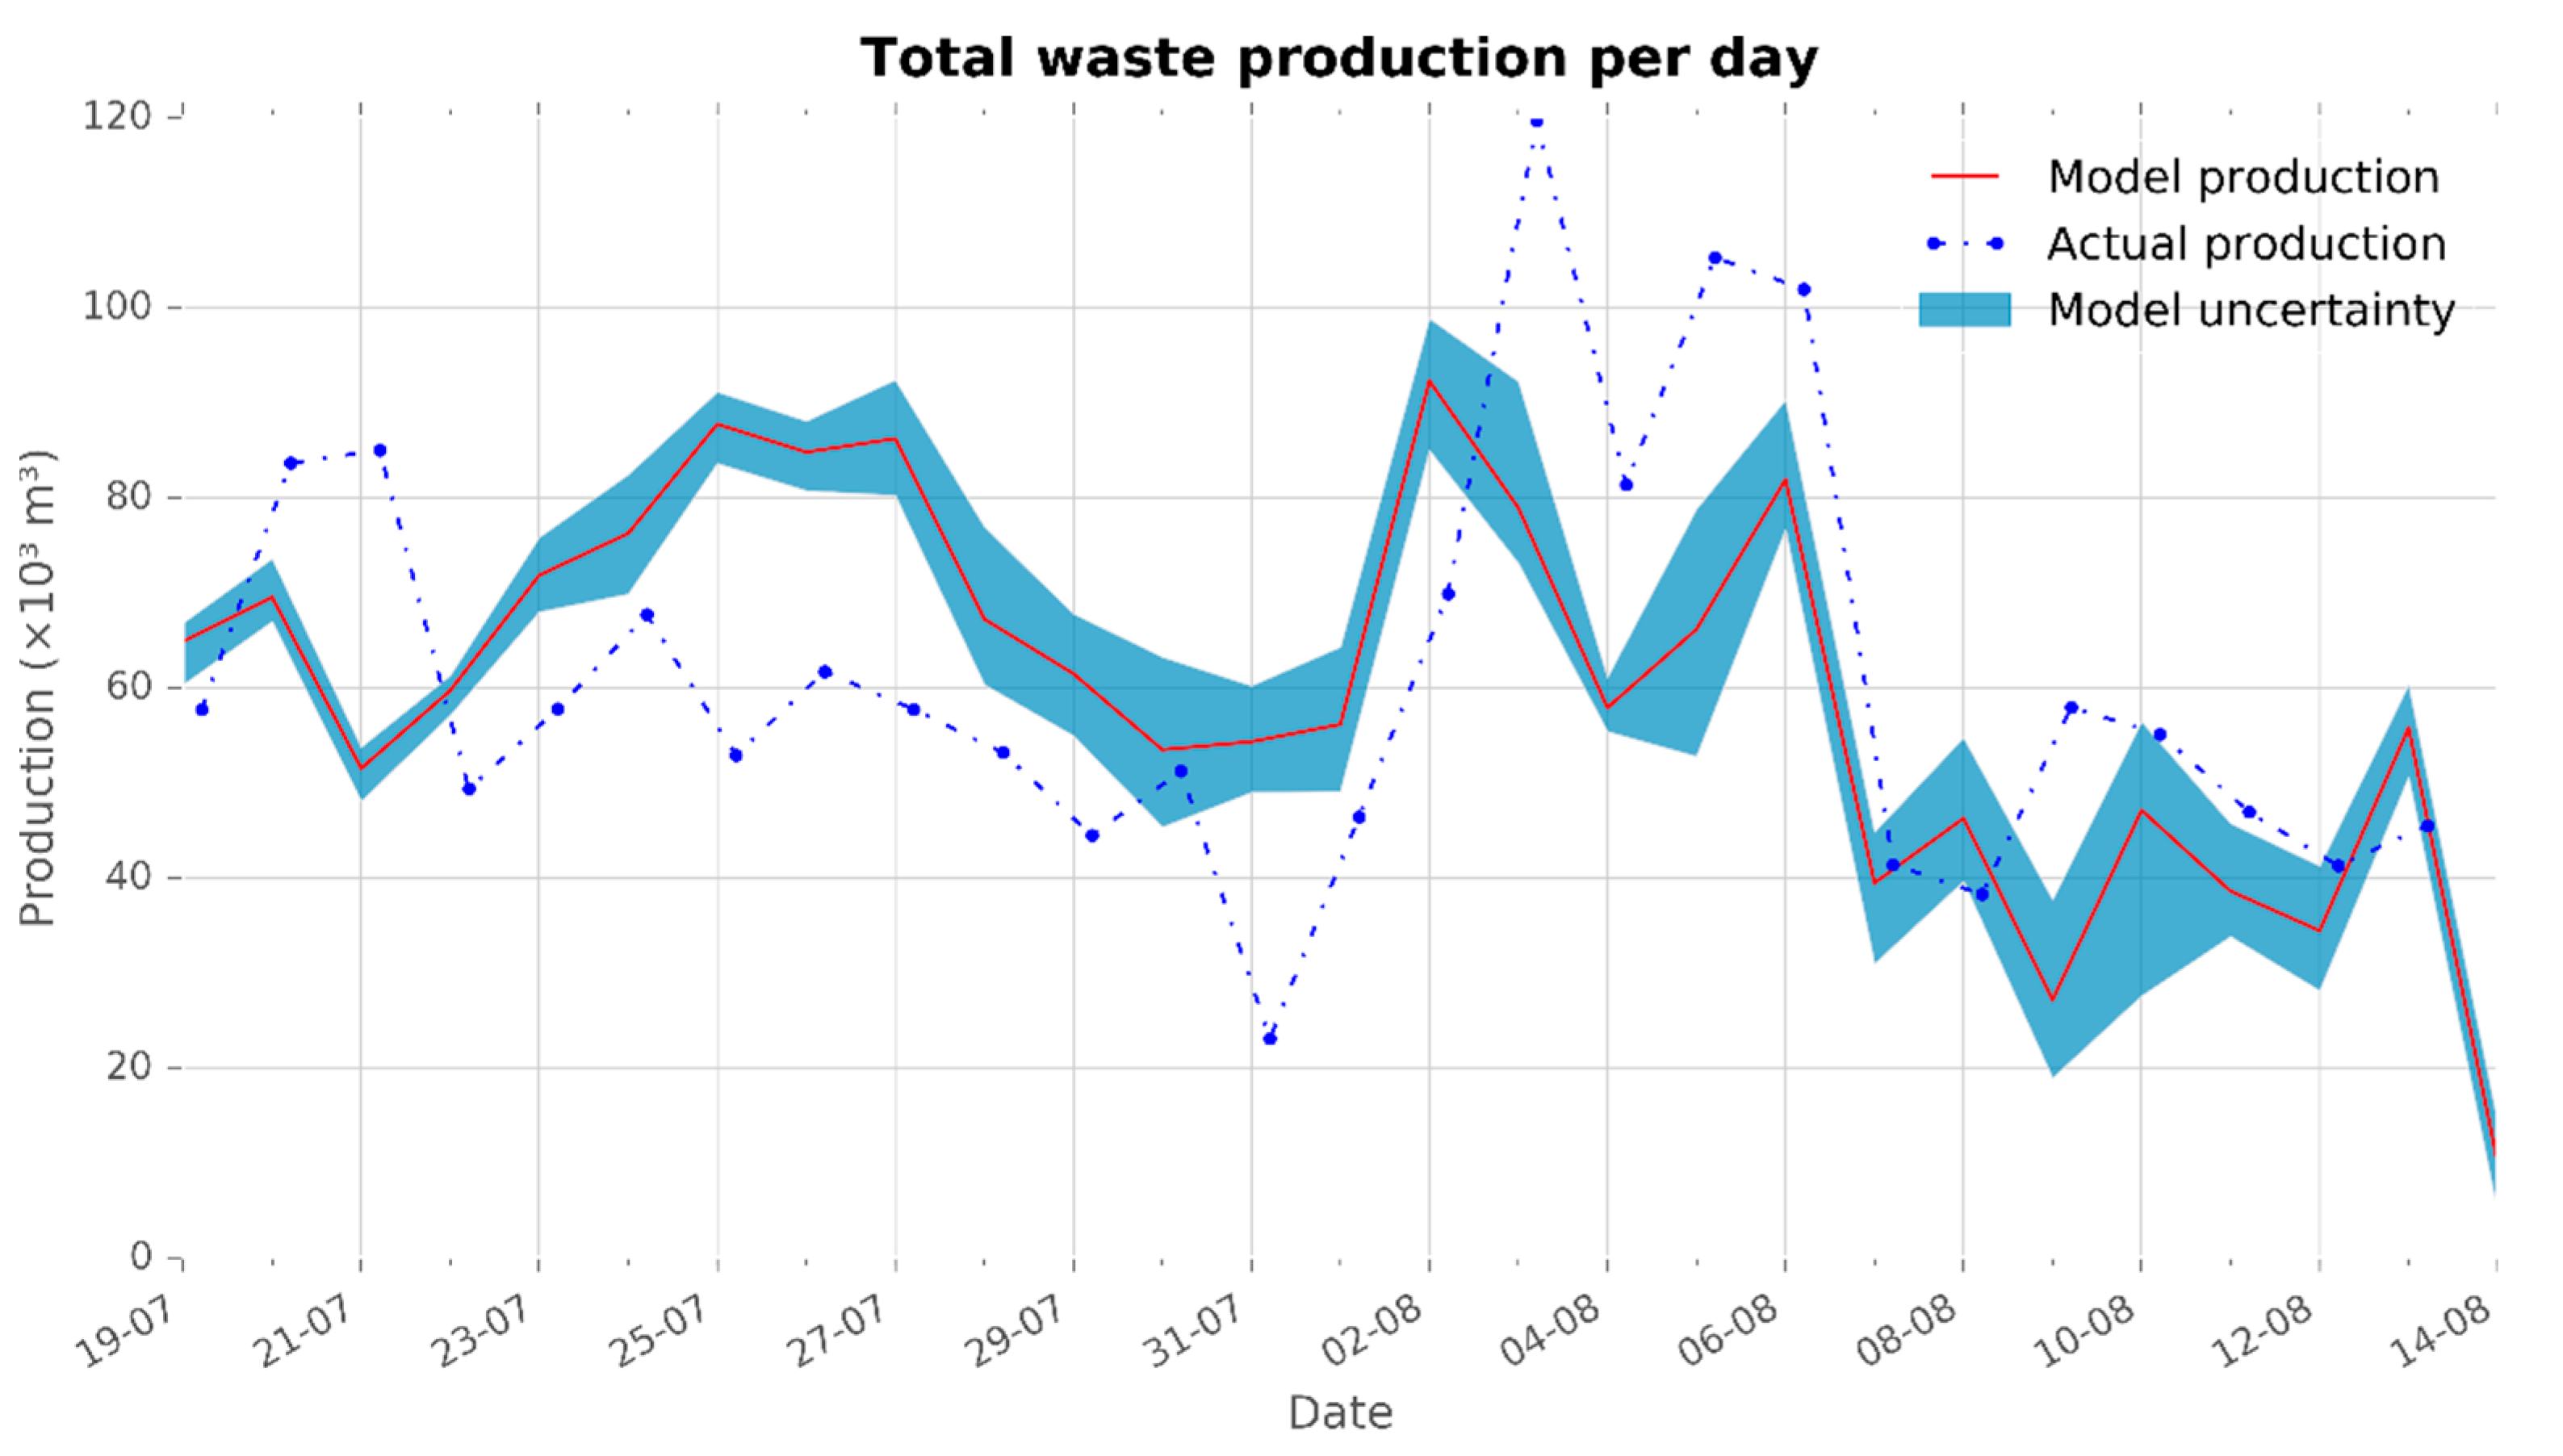
4.7.1. Case Profen
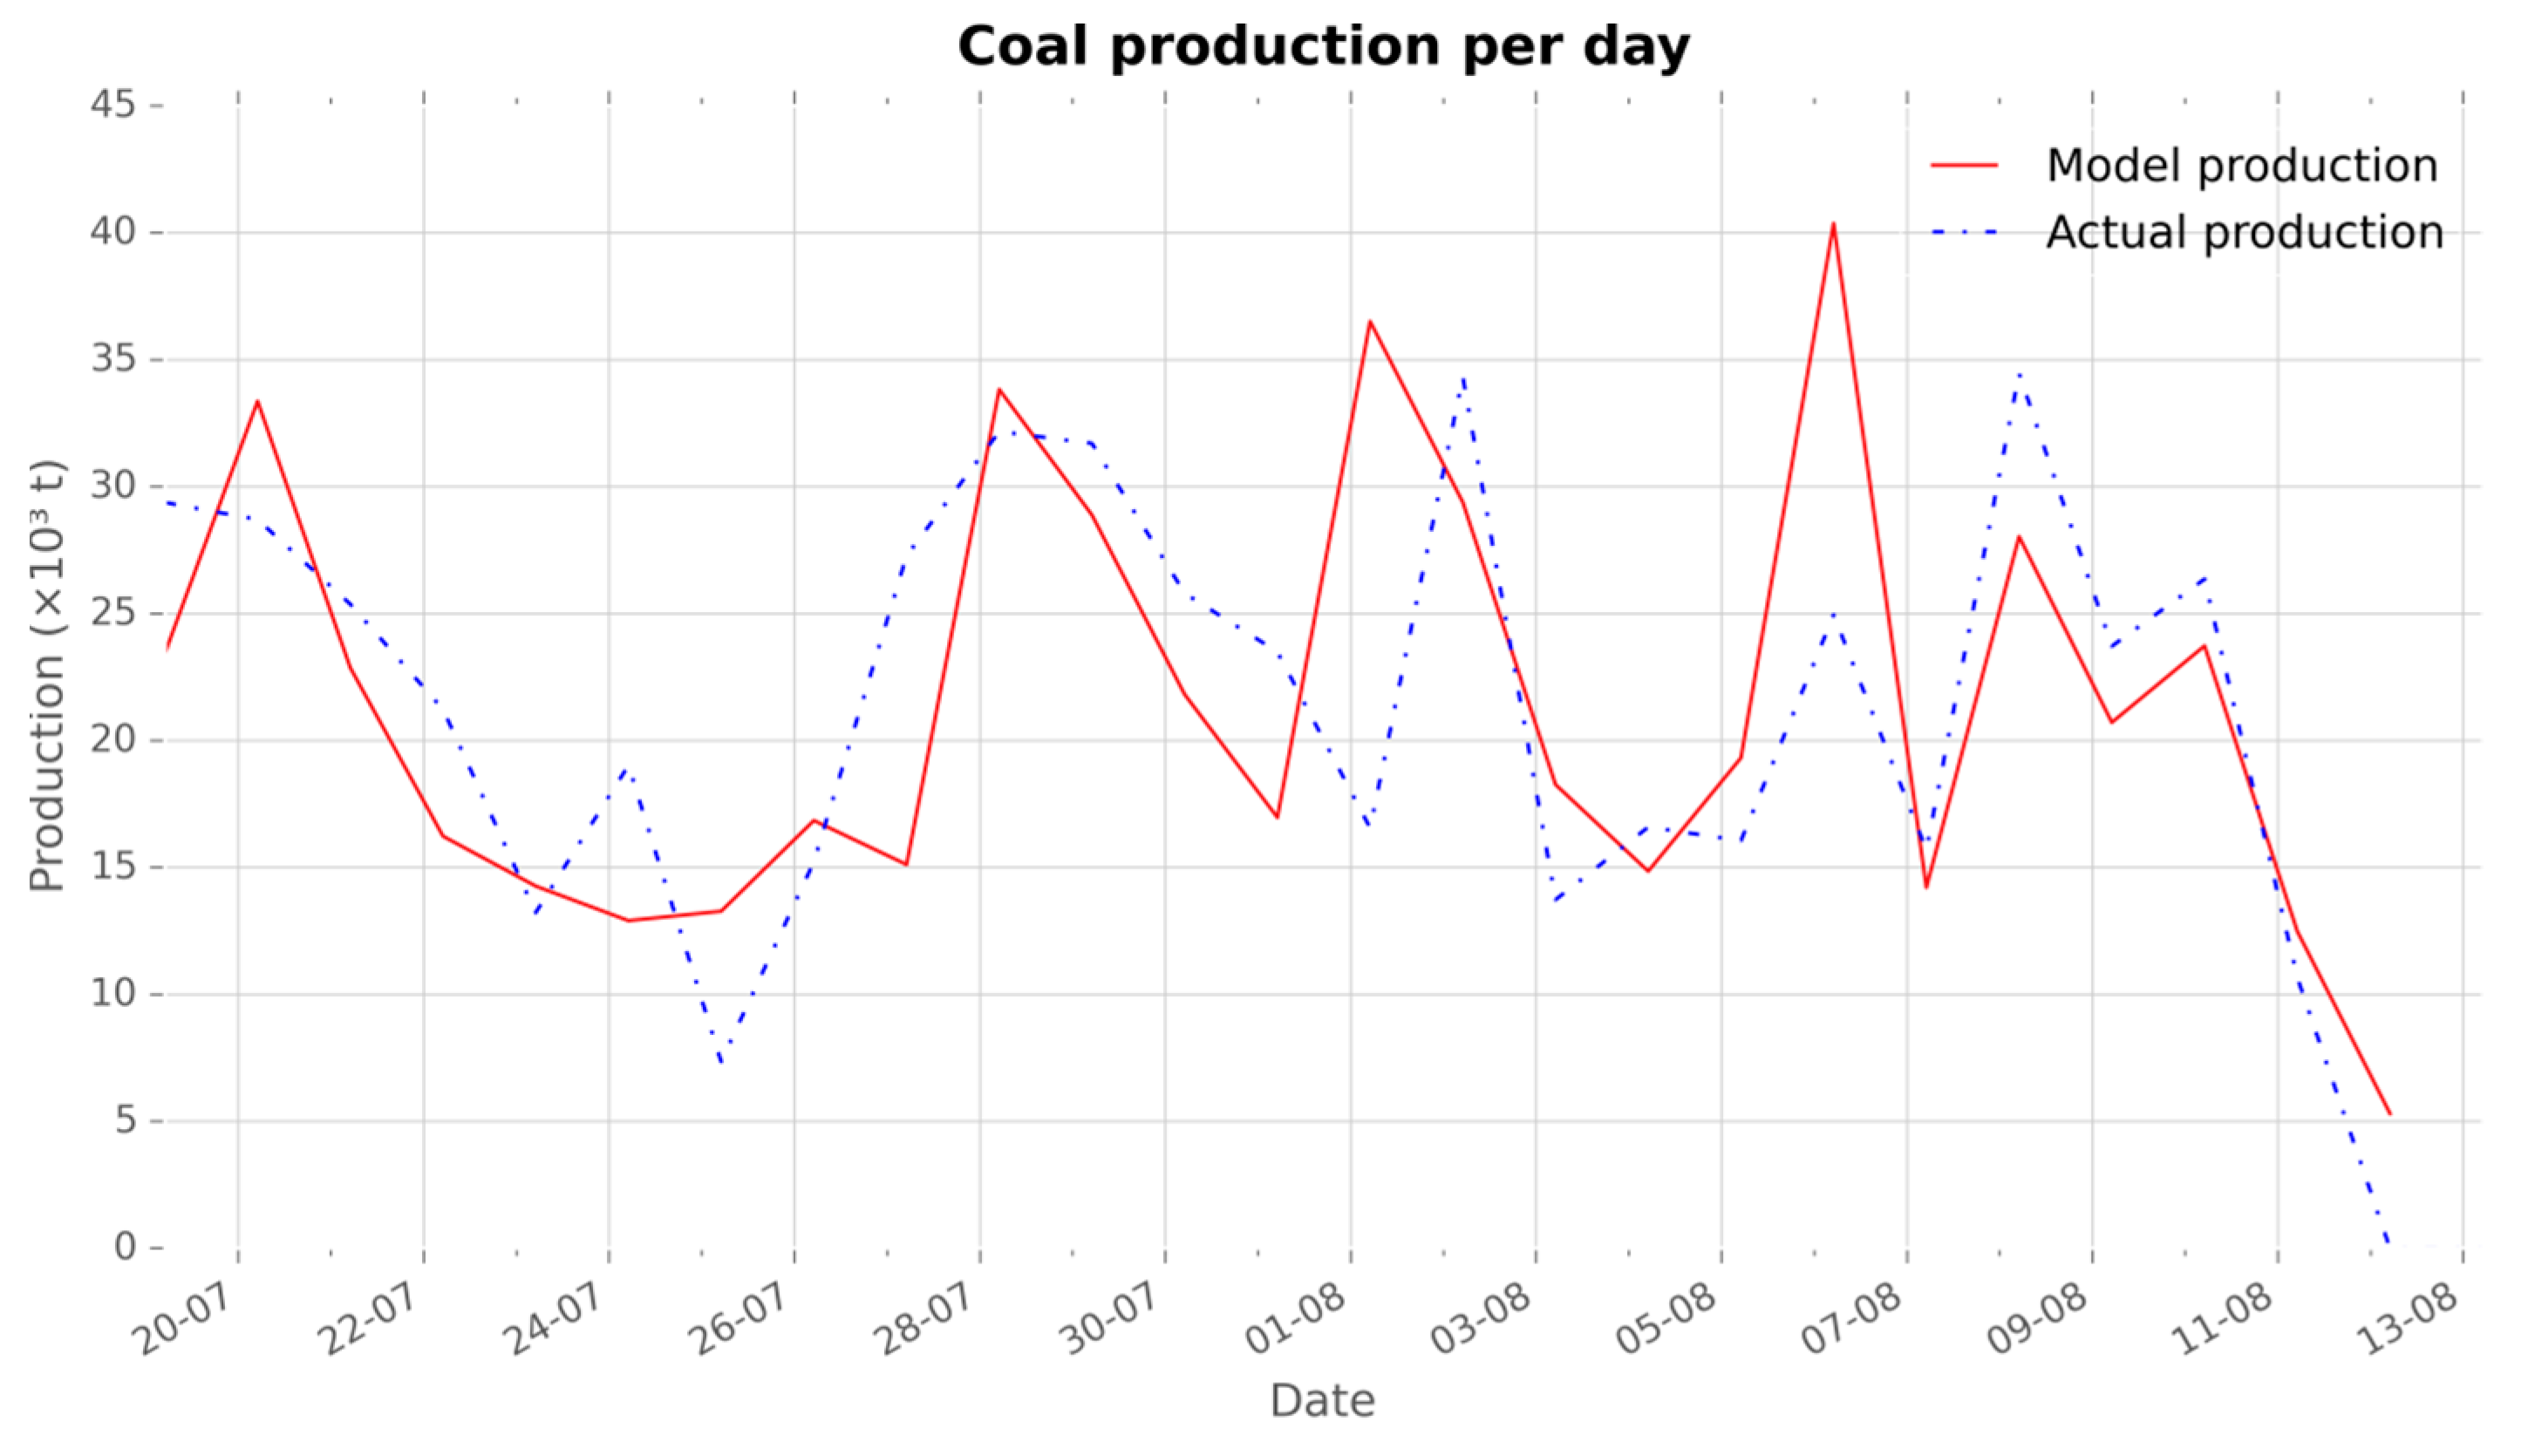
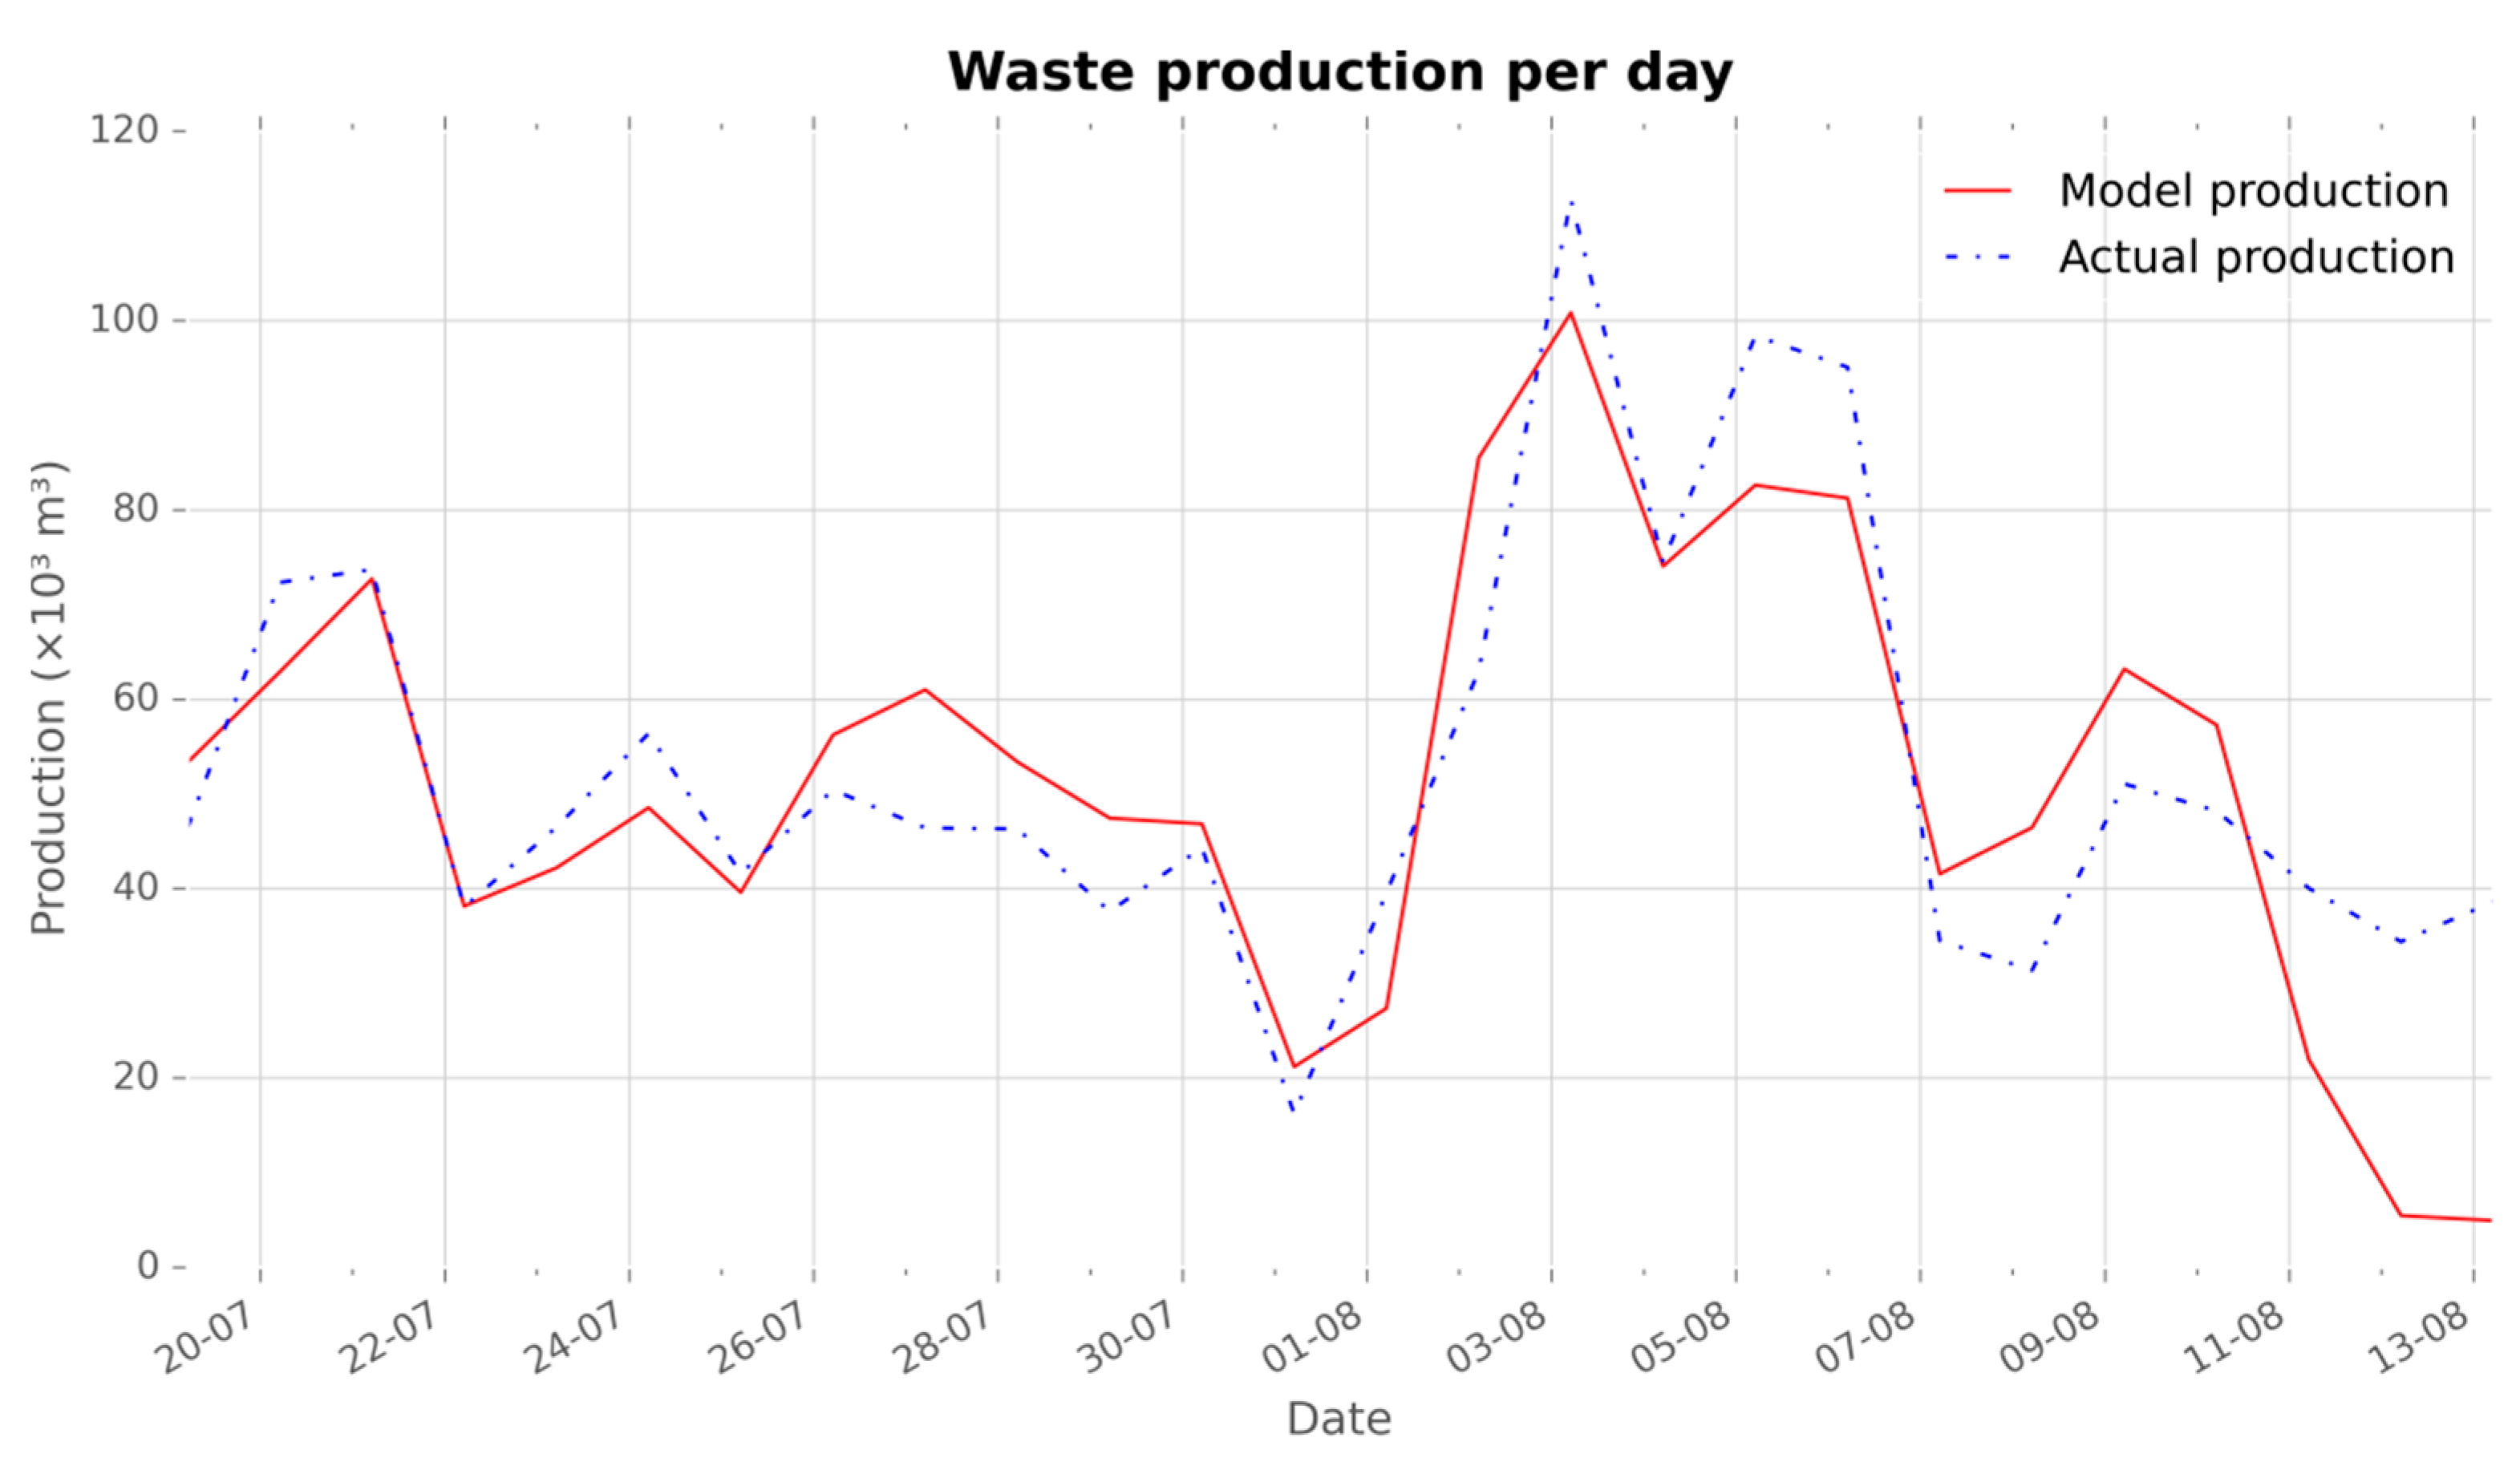
Experiment 1: Simulation Model without Stochastic Components
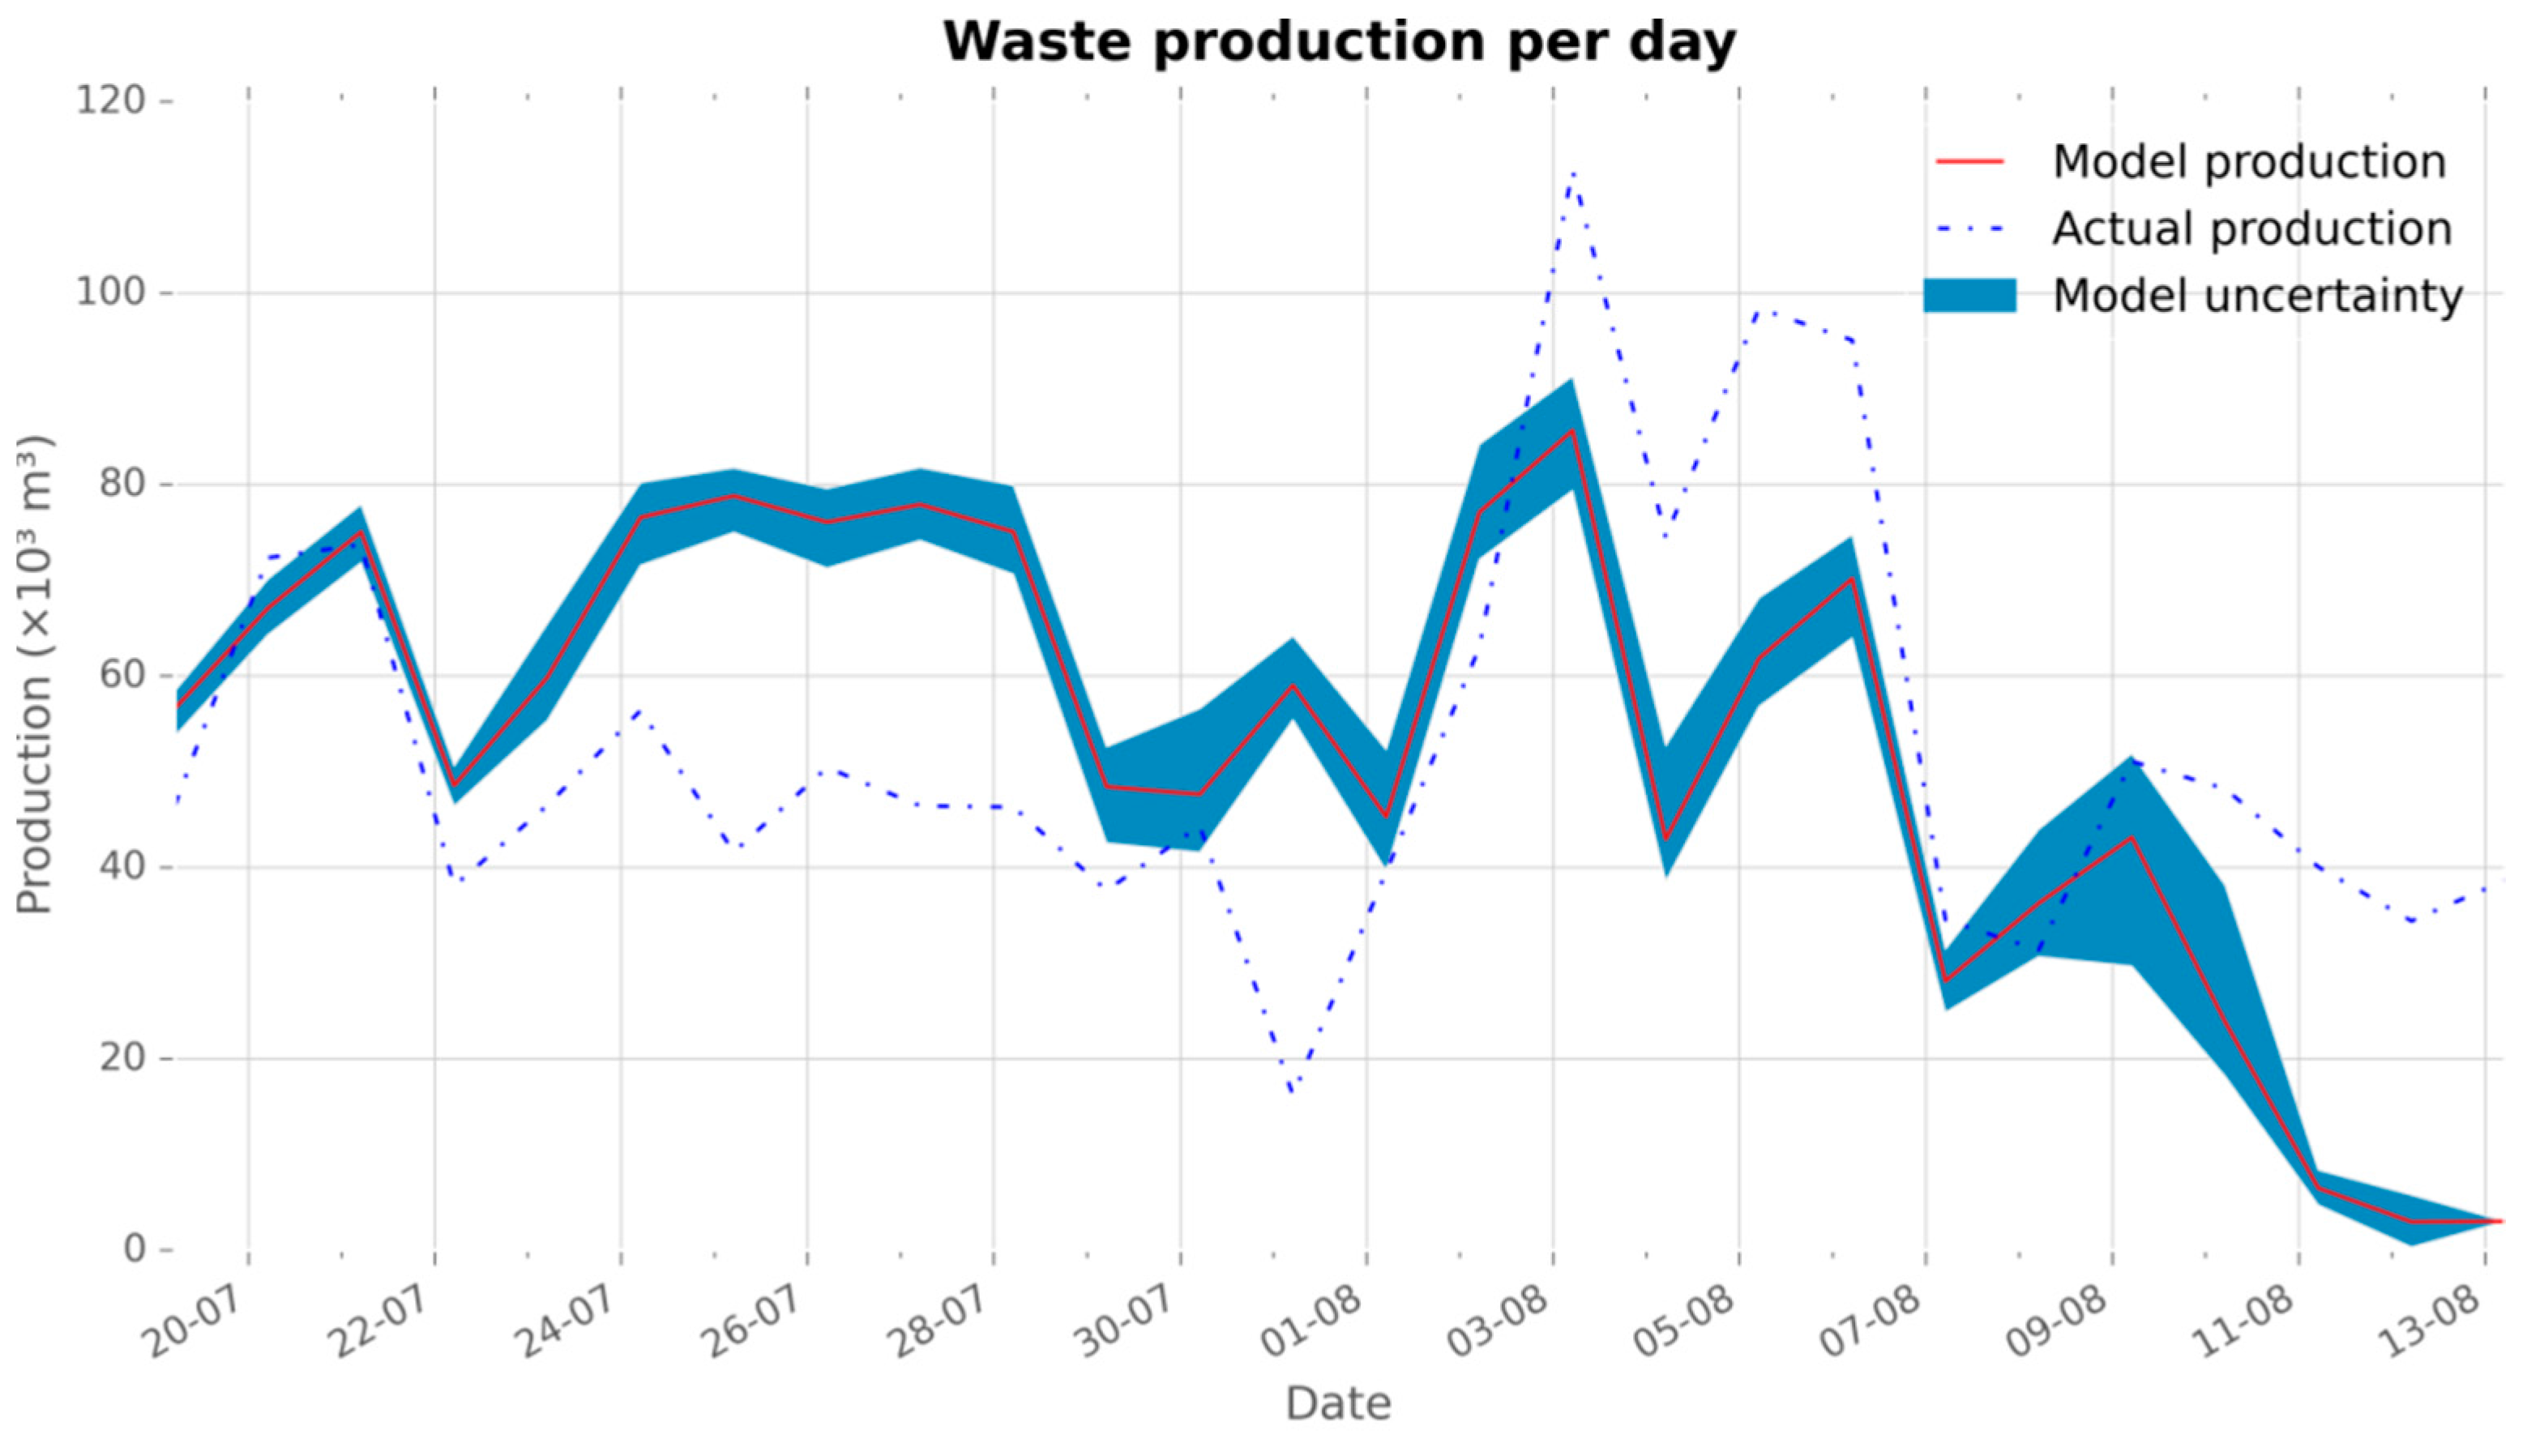
Experiment 2: Simulation Model with Stochastic Component “Breakdown Behavior”
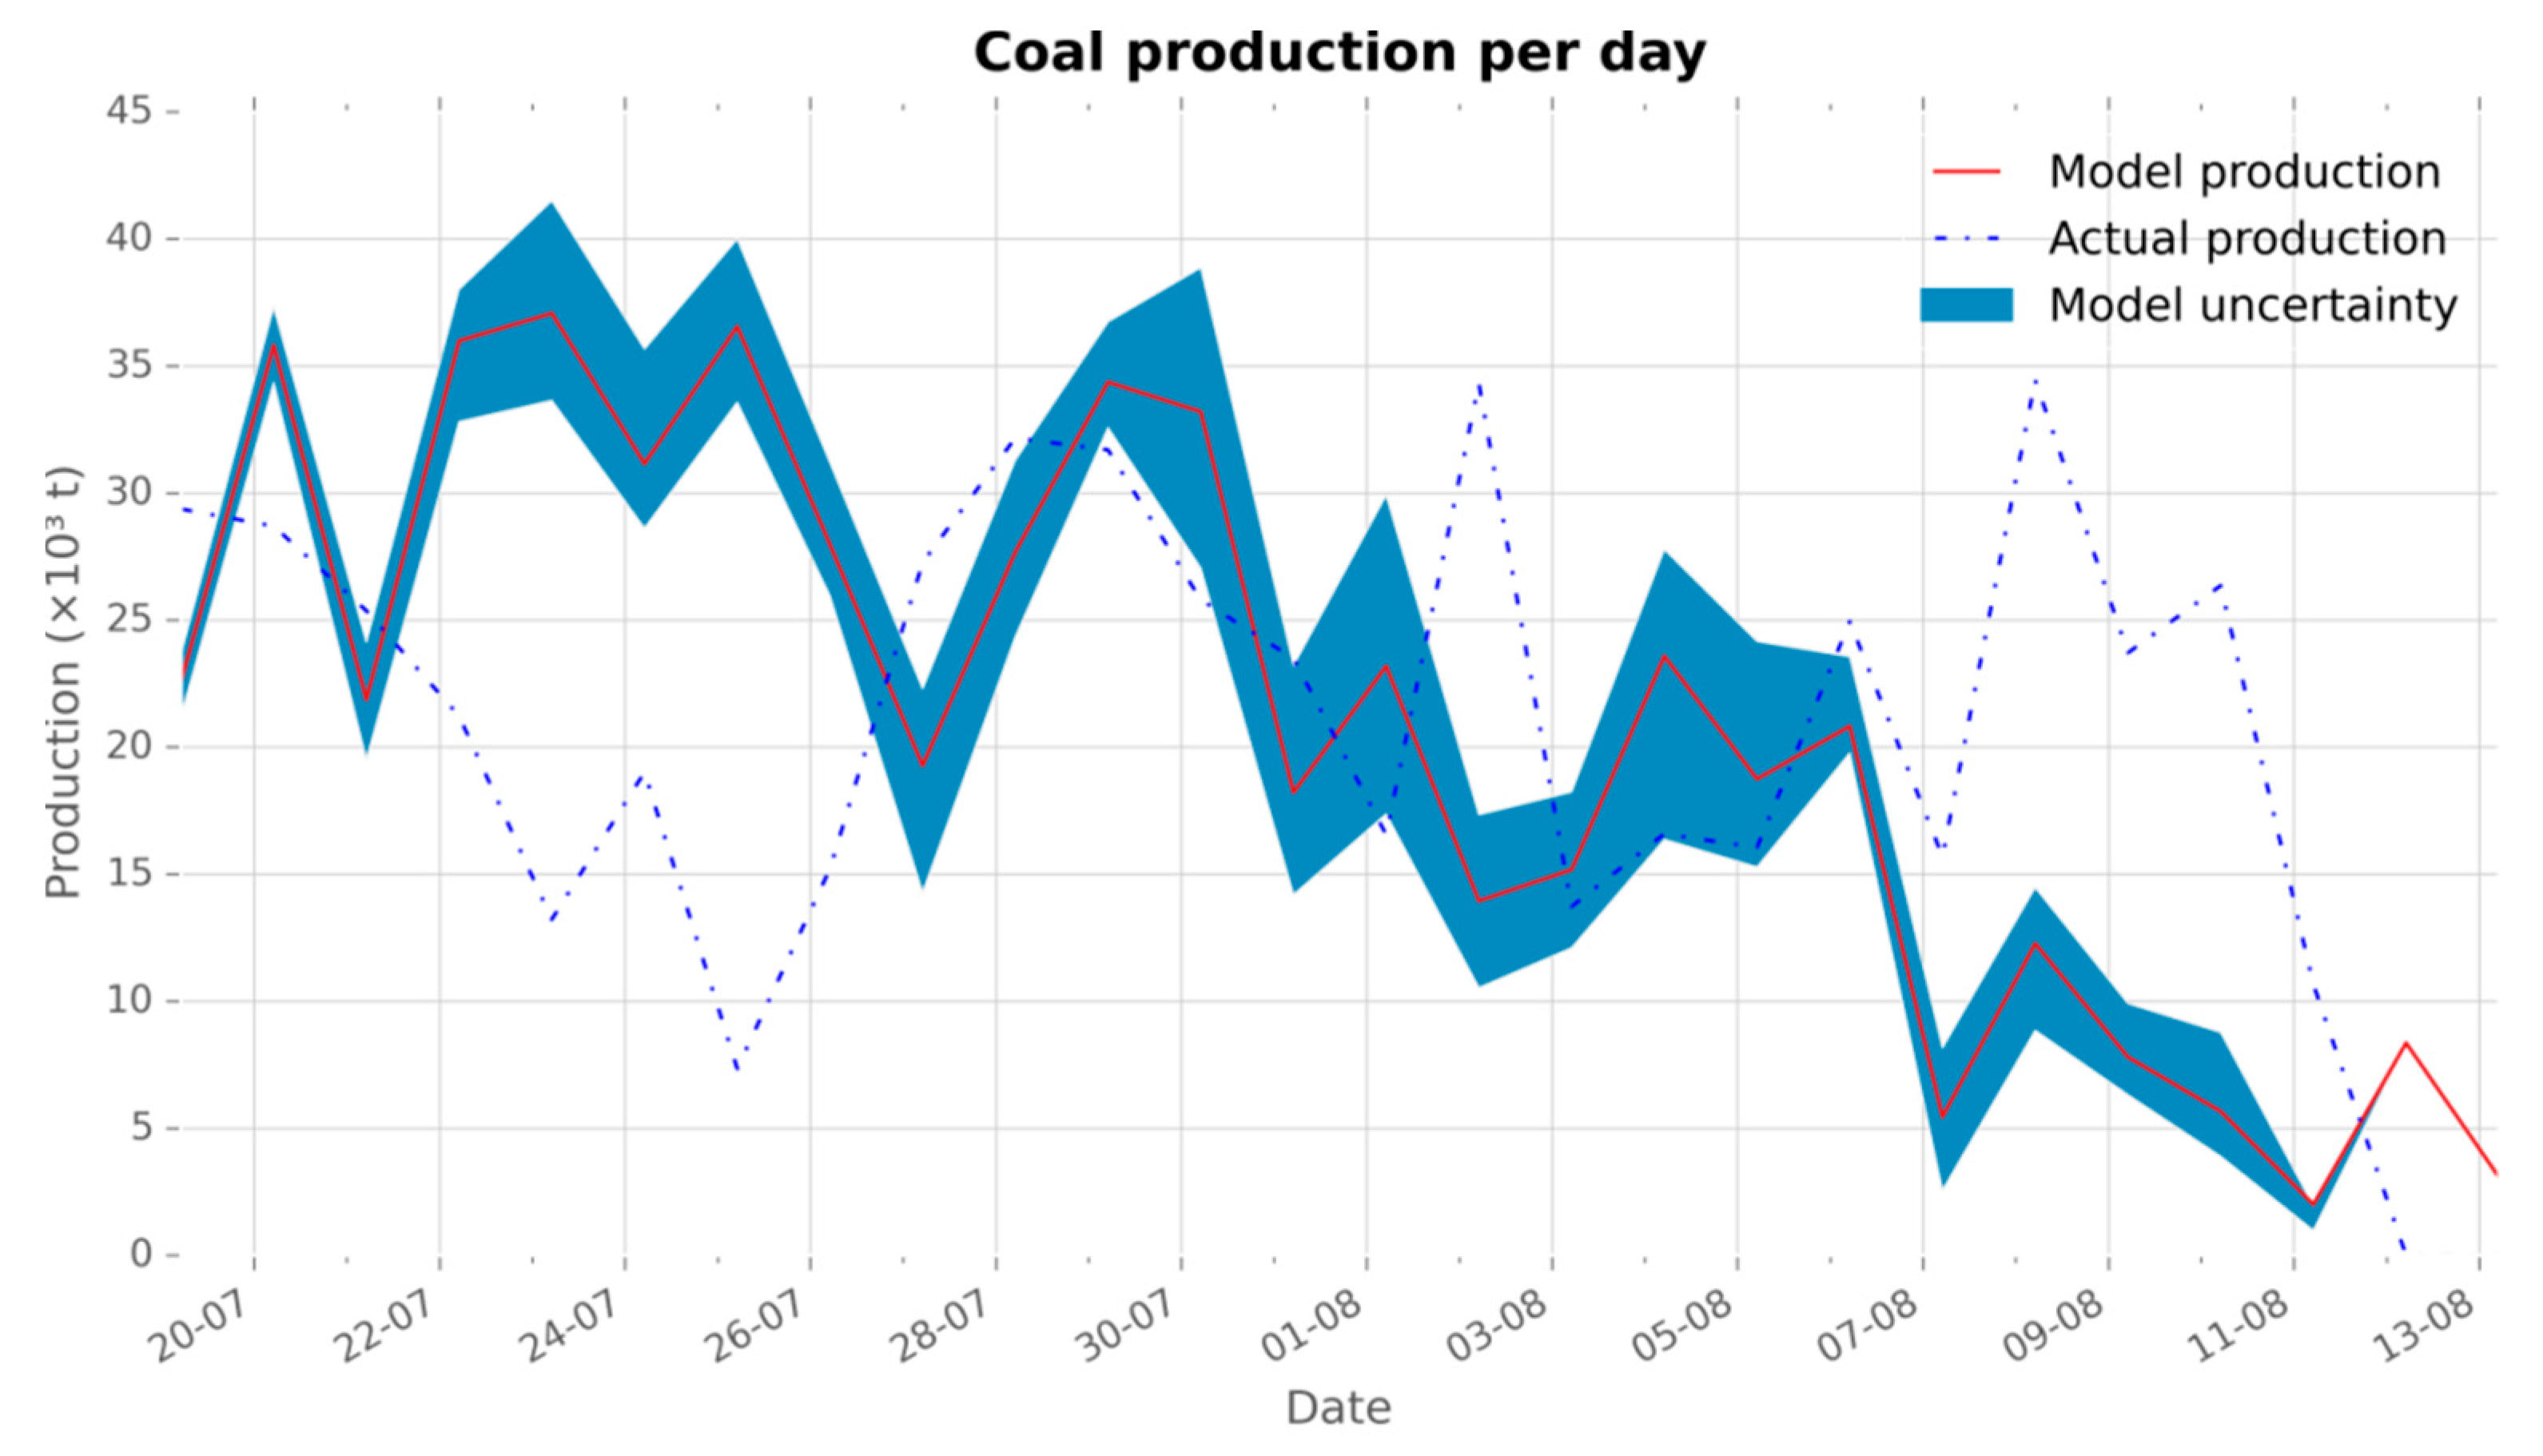
Experiment 3: Simulation Model with Stochastic Component “Breakdown Behavior” and “Reserve Block Model”
- A good prediction over long time frames.
- Deviations were seen on short scale due to geological uncertainty.
- The occurrence of seldom events may not be well captured in simulation experiments.
- In this case, for practical application, the model input would have to be adjusted according to the actual situation (e.g., equipment down for some timeframe) and iteratively re-run it.
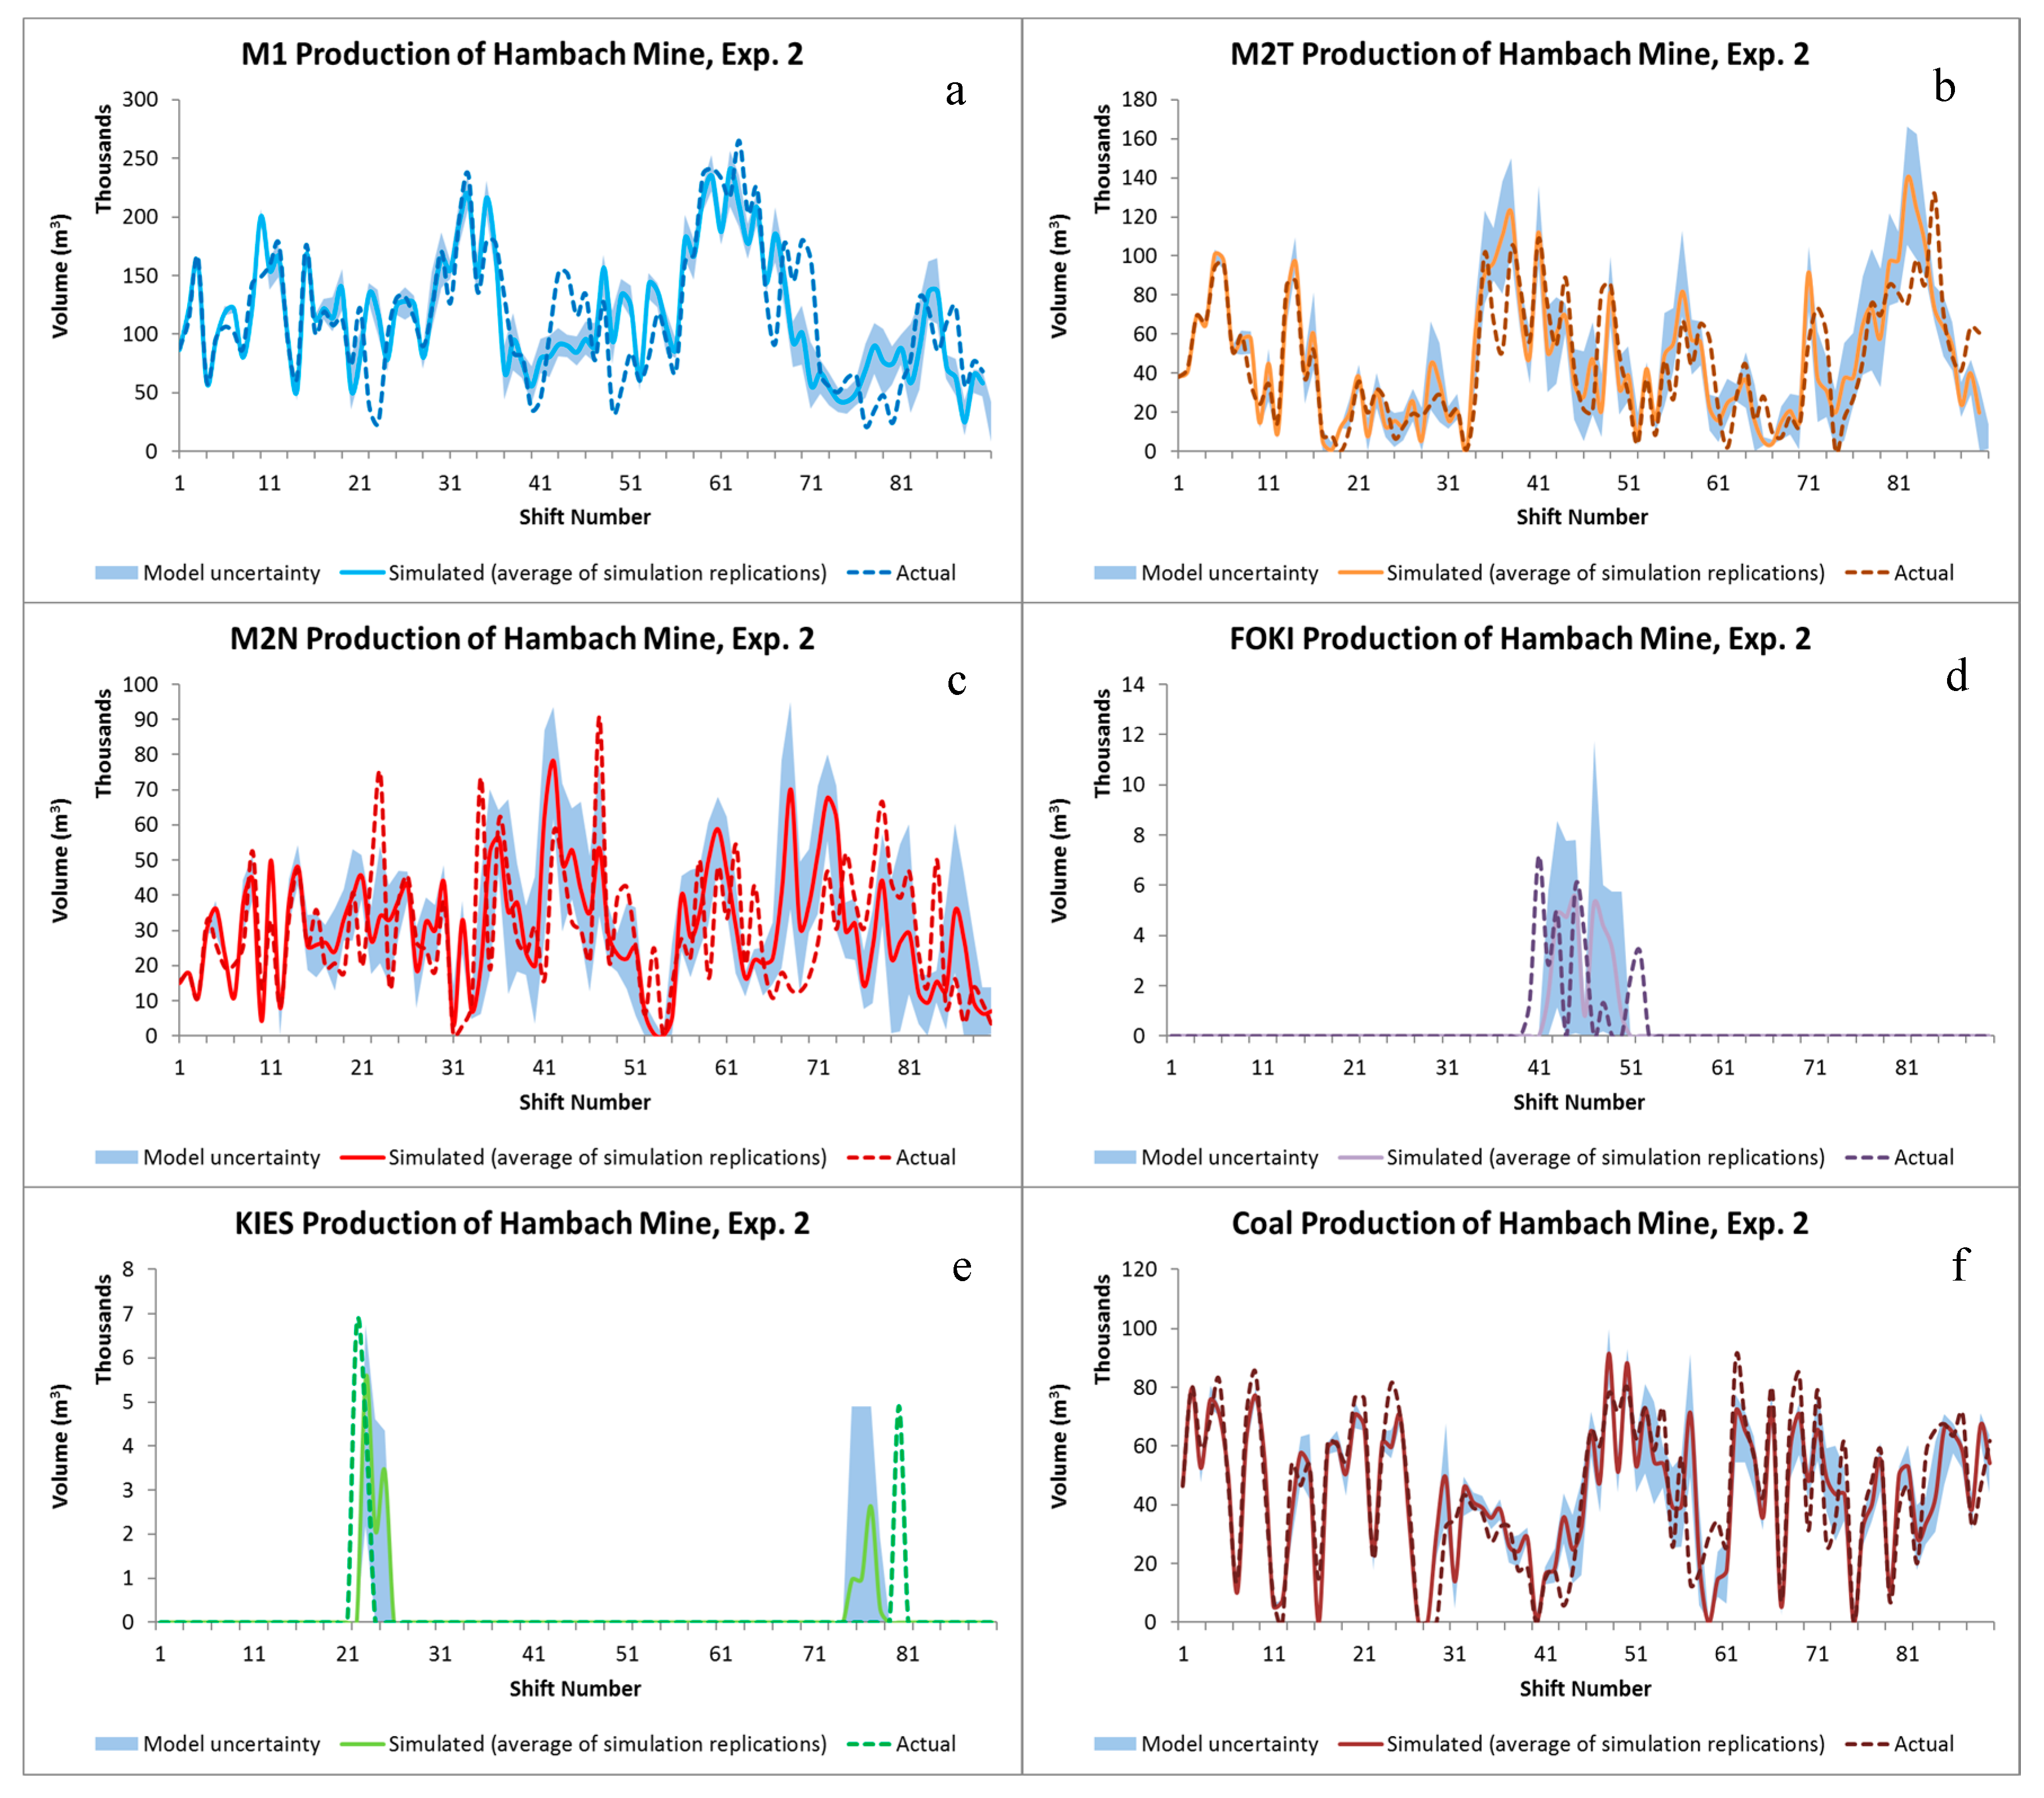
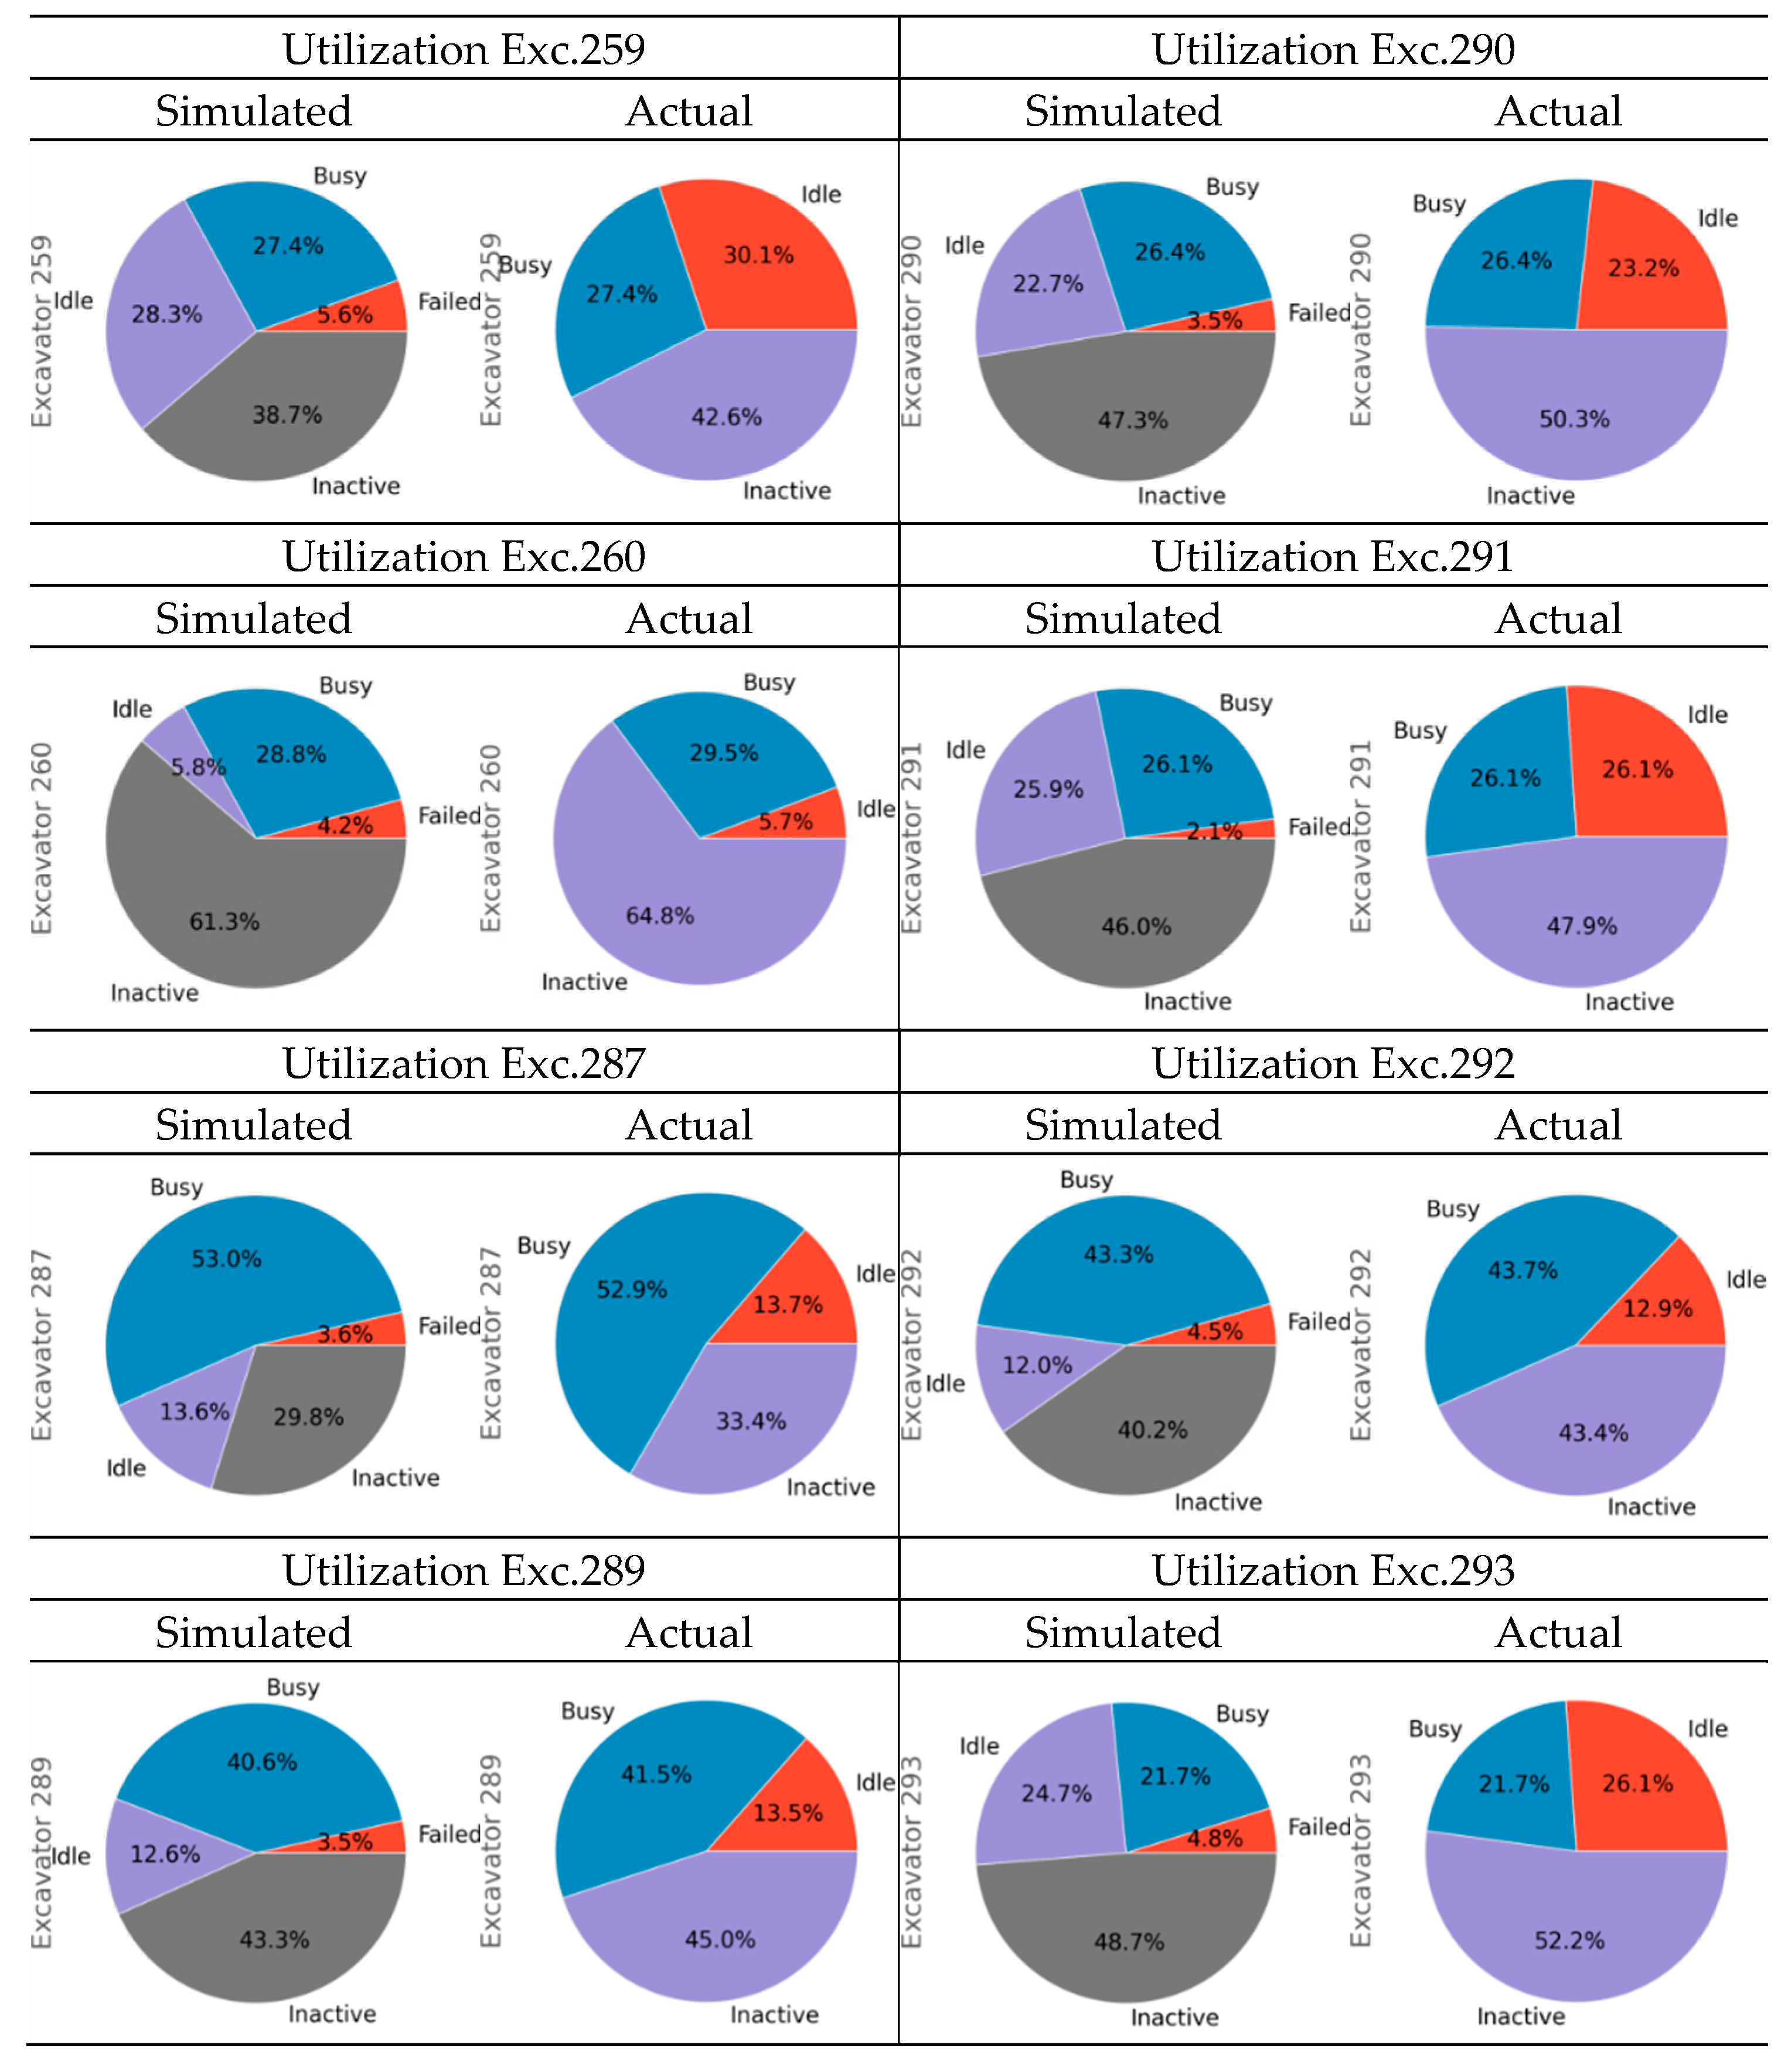
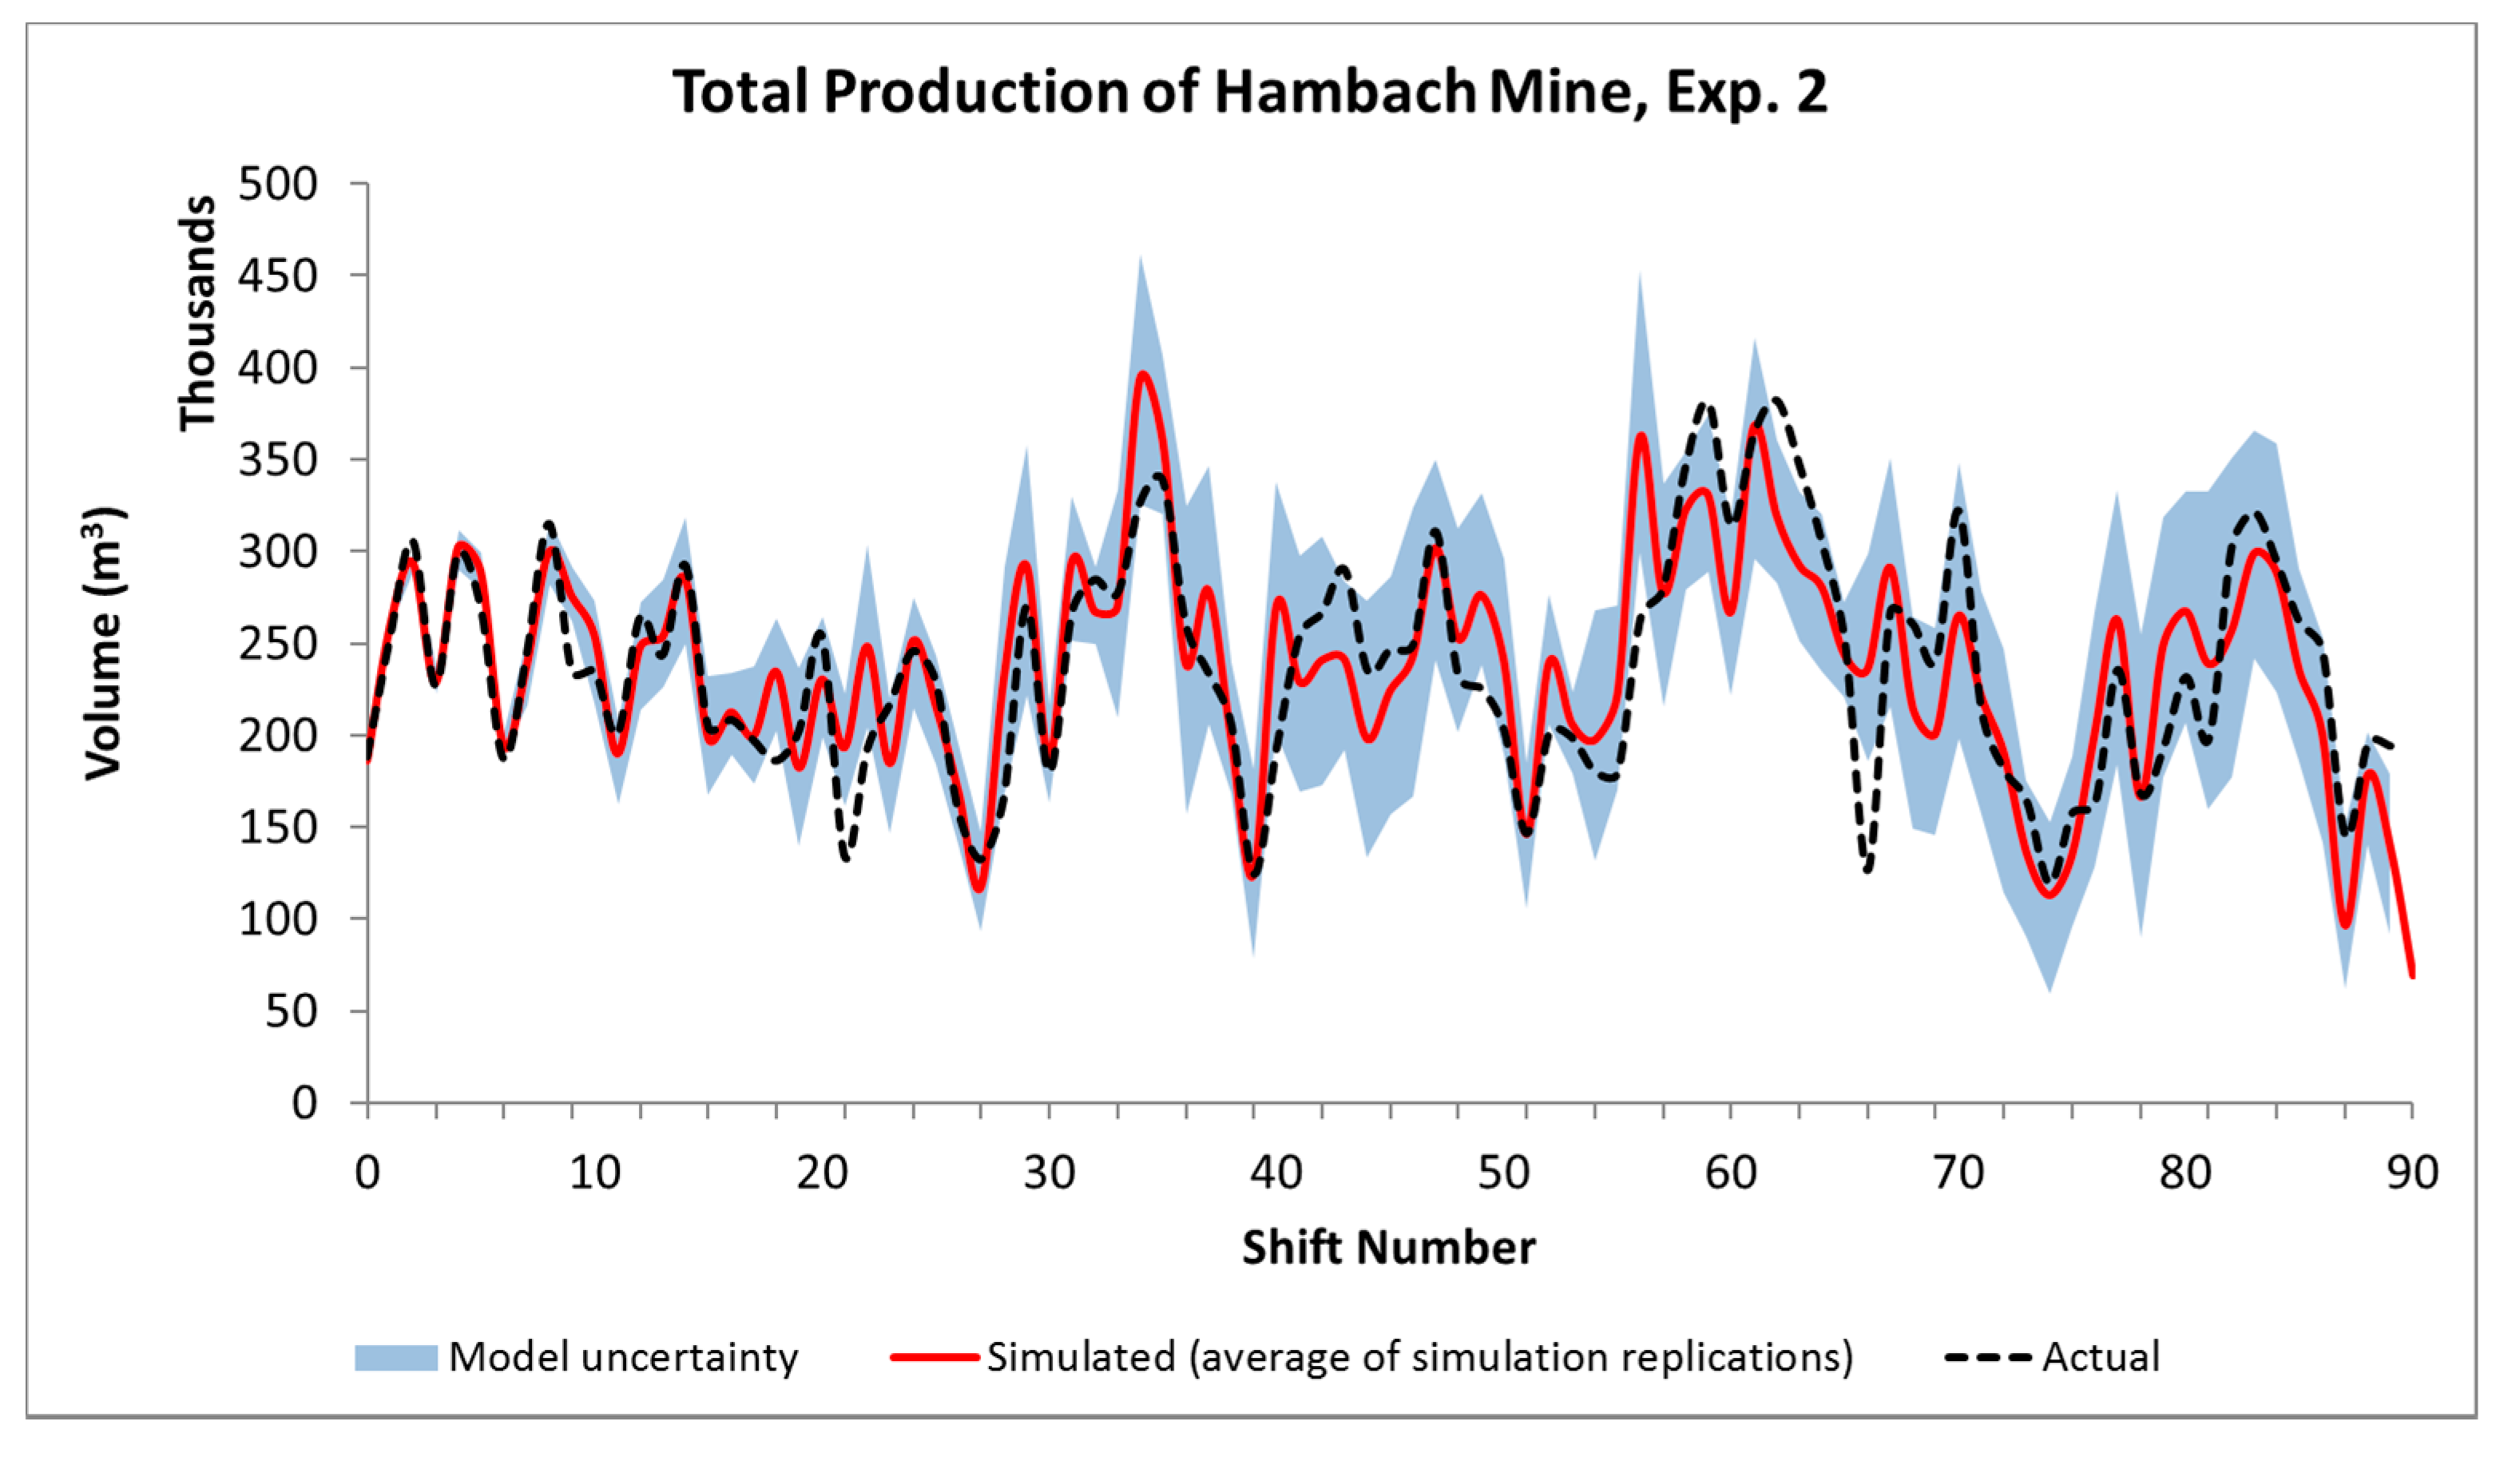
4.7.2. Case Hambach
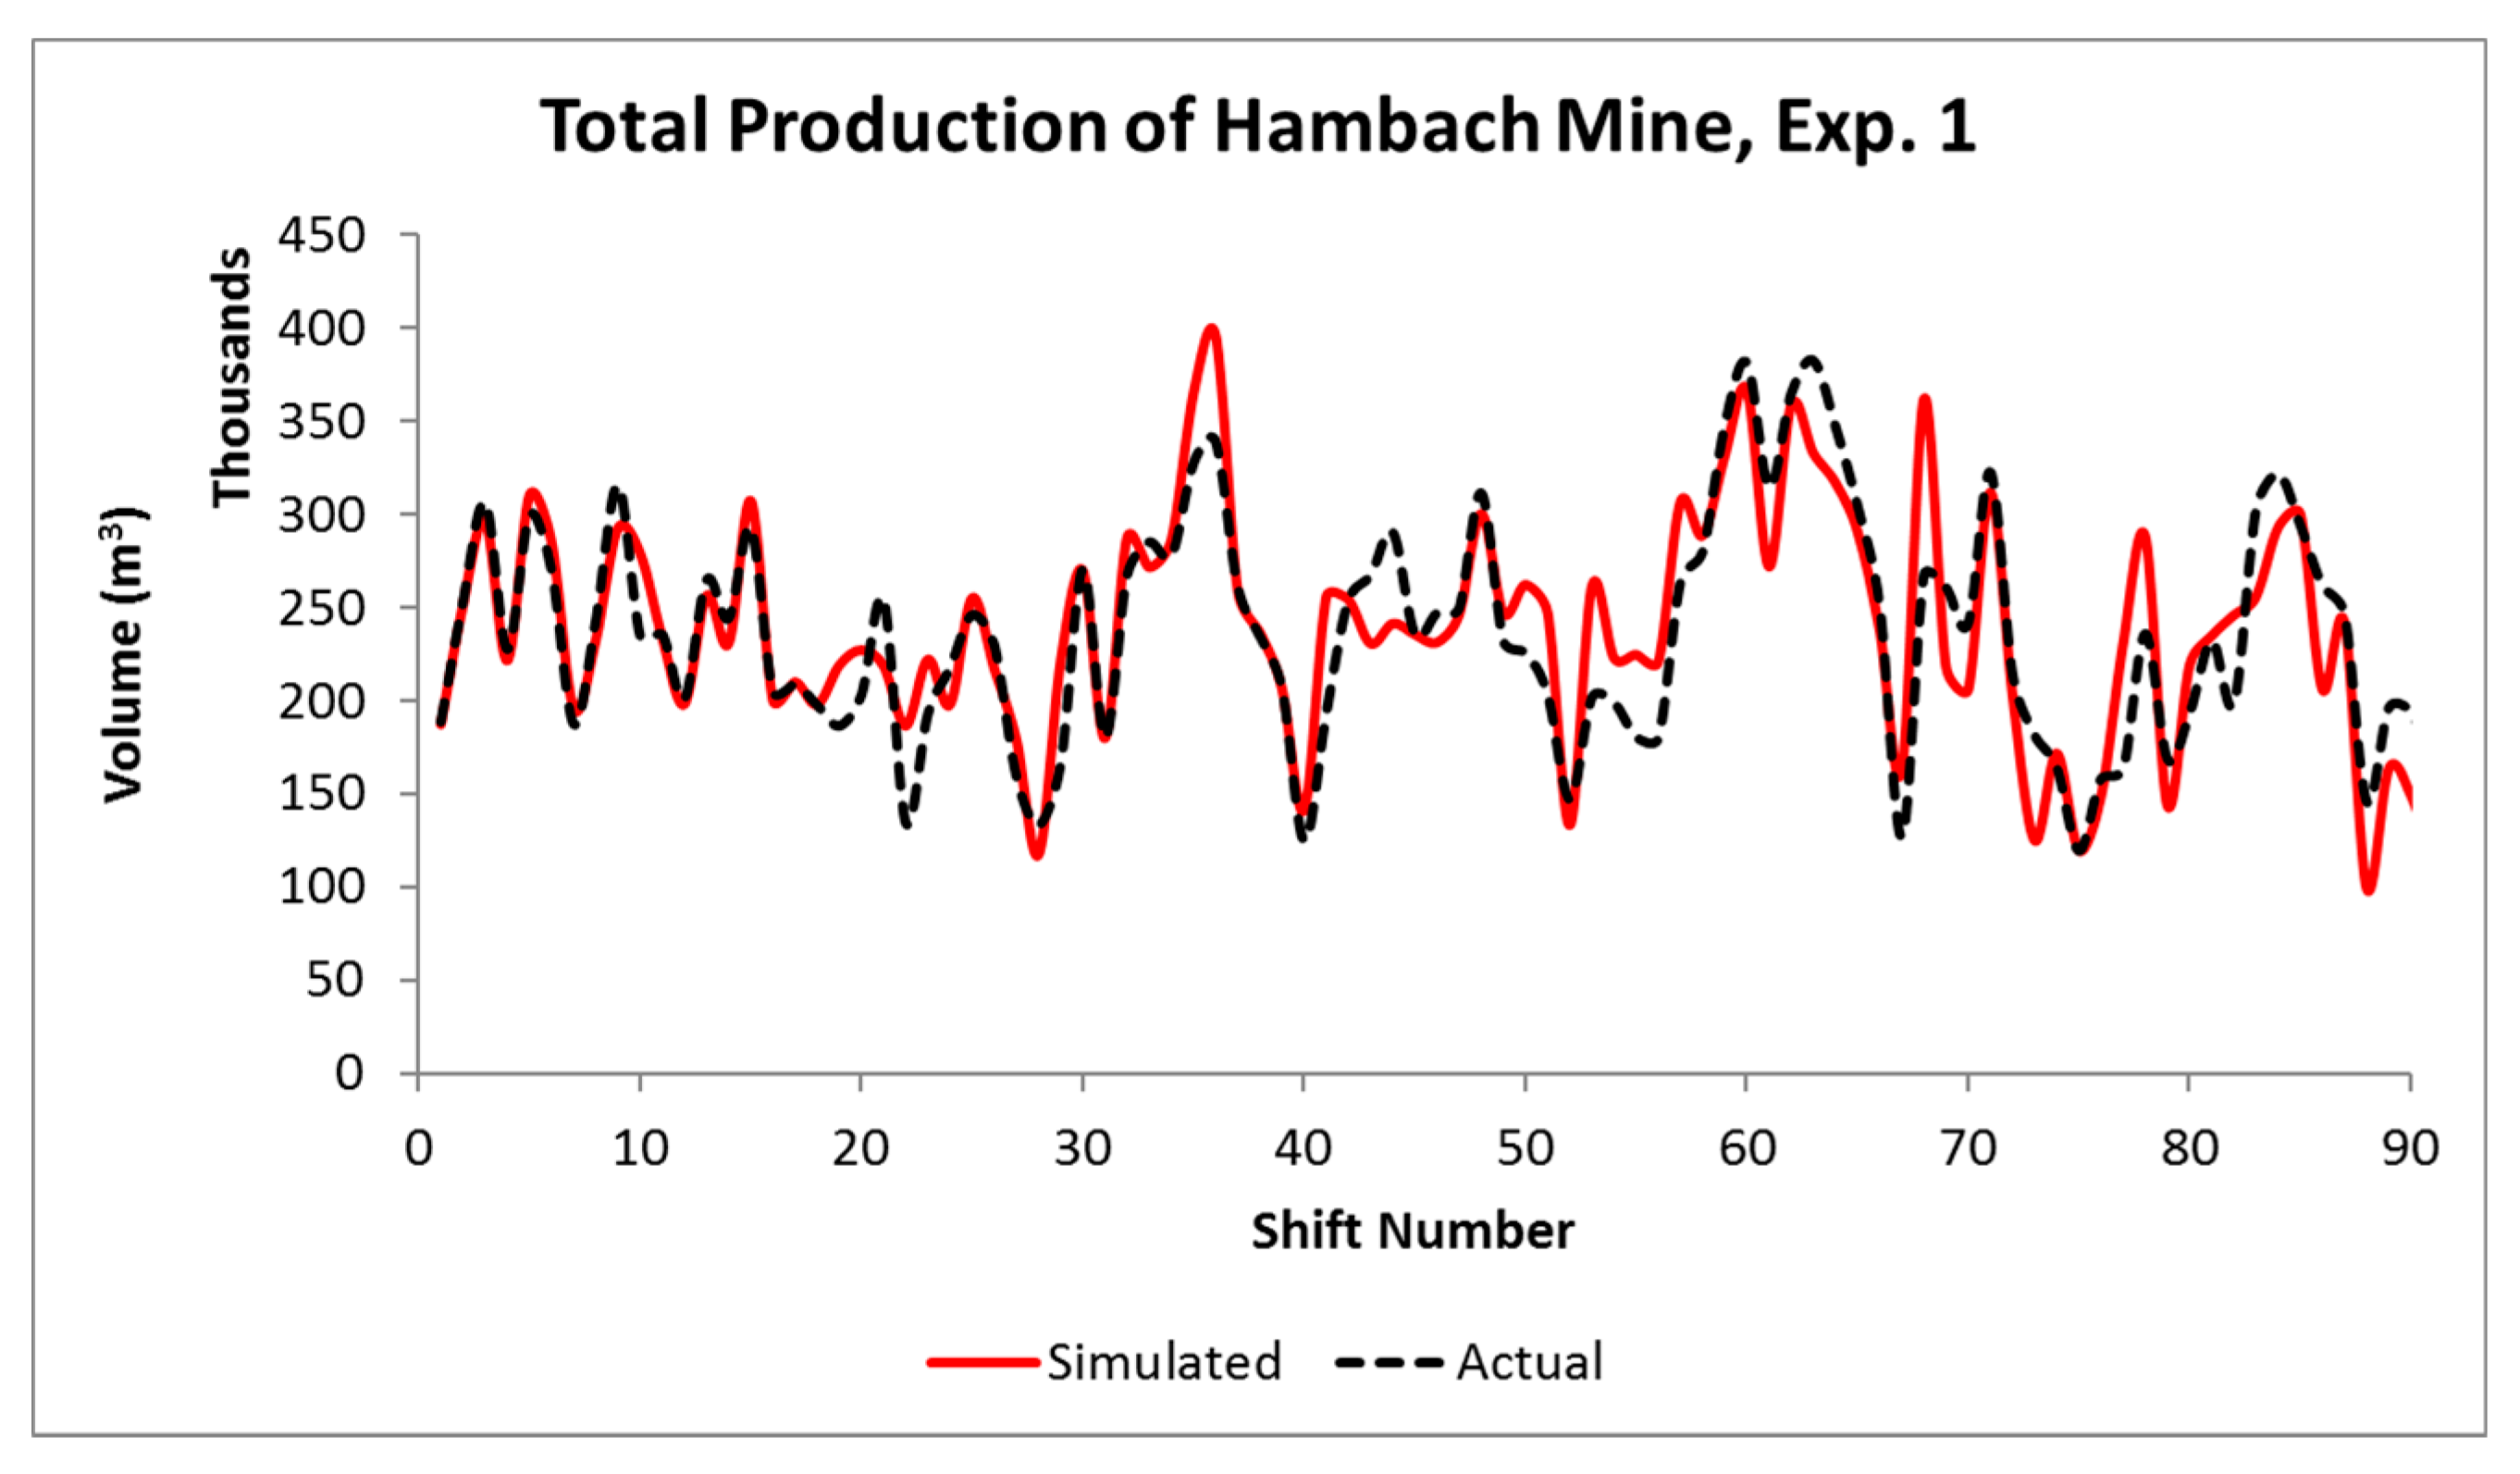
Experiment 1: Simulation Model without Stochastic Failure Models
Experiment 2: Simulation Model with Stochastic Failure Models
5. Conclusions
- The quality of the historical data that are used for the calibration of the simulation model is very important.
- Experienced problem formulators and simulation modelers are crucial for a successful simulation study.
- The occurrence of seldom events (e.g., long breakdowns of equipment) may not be well captured in simulation experiments.
Acknowledgment
Author Contributions
Conflicts of Interest
Appendix A

| Technology Readiness Level | Description |
|---|---|
| TRL 1 | basic principles observed |
| TRL 2 | technology concept formulated |
| TRL 3 | experimental proof of concept |
| TRL 4 | technology validated in lab |
| TRL 5 | technology validated in relevant environment (industrially relevant environment in the case of key enabling technologies) |
| TRL 6 | technology demonstrated in relevant environment (industrially relevant environment in the case of key enabling technologies) |
| TRL 7 | system prototype demonstration in operational environment |
| TRL 8 | system complete and qualified |
| TRL 9 | actual system proven in operational environment (competitive manufacturing in the case of key enabling technologies; or in space) |
References
- Truong, T.H.; Azadivar, F. Simulation optimization in manufacturing analysis: Simulation based optimization for supply chain configuration design. In Proceedings of the 35th Conference on Winter Simulation: Driving Innovation, New Orleans, LA, USA, 7–10 December 2003. [Google Scholar]
- Jung, J.Y.; Blau, G.; Pekny, J.F.; Reklaitis, G.V.; Eversdyk, D. A simulation based optimization approach to supply chain management under demand uncertainty. Comput. Chem. Eng. 2004, 28, 2087–2106. [Google Scholar] [CrossRef]
- Benndorf, J.; Yueksel, C.; Shishvan, M.; Rosenberg, H.; Thielemann, T.; Mittmann, R.; Lohsträter, O.; Lindig, M.; Minnecker, C.; Donner, R.; et al. RTRO–Coal: Real-Time Resource-Reconciliation and Optimization for Exploitation of Coal Deposits. Minerals 2015, 5, 546–569. [Google Scholar] [CrossRef]
- Shishvan, M.S.; Benndorf, J. The effect of geological uncertainty on achieving short-term targets: A quantitative approach using stochastic process simulation. J. South. Afr. Inst. Min. Metall. 2016, 116, 259–264. [Google Scholar]
- Shishvan, M.S.; Benndorf, J. Performance optimization of complex continuous mining system using stochastic simulation. In Proceedings of the International Conference on Engineering Optimization (ENGOPT 2014), Lisbon, Portugal, 8–11 September 2014. [Google Scholar]
- European Commission. Technology Readiness Levels (TRL), Horizon 2020–Work Programme 2014–2015 General Annexes, Extract from Part 19; European Commission: Helsinki, Finland, 2014. [Google Scholar]
- Schmidt, J.W.; Taylor, R.E. Simulation and Analysis of Industrial Systems; RD Irwin: Homewood, IL, USA, 1970. [Google Scholar]
- Maria, A. Introduction to modeling and simulation. In Proceedings of the 29th Conference on Winter Simulation, Atlanta, GA, USA, 7–10 December 1997. [Google Scholar]
- Birta, L.G.; Arbez, G. Modelling and Simulation: Exploring Dynamic System Behaviour; Springer: London, UK, 2013. [Google Scholar]
- Kelton, W.D.; Law, A.M. Simulation Modeling and Analysis; McGraw Hill: Boston, MA, USA, 2000. [Google Scholar]
- Banks, J. Handbook of Simulation: Principles, Methodology, Advances, Applications, and Practice; John Wiley & Sons: Hoboken, NJ, USA, 1998. [Google Scholar]
- Rockwell Automation Technologies; Version 14.50.00000-CPR 9 SR 2; Arena Inc.: San Diego, CA, USA, 2012.
- Yueksel, C.; Benndorf, J.; Lindig, M.; Lohstraeter, O. Updating the coal quality parameters in multiple production benches based on combined material measurement: A full case study. Int. J. Coal Sci. Technol. 2017, 1–13. [Google Scholar] [CrossRef]
- Chung, C.A. Simulation Modeling Handbook: A Practical Approach; CRC Press: Boca Raton, FL, USA, 2003. [Google Scholar]
- Petitat, M.; von Allmen, K.; Burdin, J. Automation of rock selection and aggregate quality for reuse in tunnelling and industry. Geomech. Tunn. 2015, 8, 315–320. [Google Scholar] [CrossRef]
- Entacher, M.; Resch, D.; Reichel, P.; Galler, R. Recycling of tunnel spoil–laws affecting waste from mining and tunnelling/Wiederverwertung von Tunnelausbruchmaterial–Abfallrecht im Berg-und Tunnelbau. Geomech. Tunn. 2011, 4, 692–701. [Google Scholar] [CrossRef]


| Bench | BWE Model | Discharge Per min | Bucket Capacity (m3) | Theoretical Capacity (m3/h) * |
|---|---|---|---|---|
| S1 | 259 | 44 | 2.6 | 5700 |
| B1 | 260 | 38 | 3.5 | 5700 |
| B2 | 291 | 48 | 5.0 | 12,500 |
| B3 | 287 | 43 | 5.1 | 10,400 |
| B4 | 290 | 48 | 5.0 | 12,500 |
| B5 | 292 | 48.6–72.0 | 5.0 | 12,500 |
| B6 | 293 | 48.6–72.0 | 5.0 | 12,500 |
| B7 | 289 | 48 | 5.0 | 12,500 |
| Exc. Model | Bench | Access to Abs. 1112 | Access to Abs. 1104 | Access to Coal-bunker | Theoretical Capacity (m3/h) |
|---|---|---|---|---|---|
| Bg. 1580 | 1 | No | Yes | No | 4900 |
| Bg. 1511 | 2 | Yes | Yes | Yes | 4900 |
| Bg. 1553 | 3 | Yes | Yes | Yes | 3770 |
| Bg. 351 | 4 | Yes | No | Yes | 1400 |
| Bg. 1541 | 5 | Yes | No | Yes | 3770 |
| Bg. 309 | 6 | Yes | No | Yes | 740 |
| Abs. 1112 | - | - | - | - | 10,000 |
| Abs. 1104 | - | - | - | - | 10,000 |
| Coal Type | Ash Content (%) | Calorific Value (MJ/kg) |
|---|---|---|
| KK1 | <8.5% (wet ash) | 9.5–10.5 |
| KK2 | <12% (wet ash) | 9.0–11.4 |
| SK | <15% (dry ash) | >24.5 |
| Process Related Data |
|
| Elements Related Data (for Each Piece of Equipment) |
|
| Geological Related Data |
|
| Material Type | Simulated | Actual | Difference (%) | Bias (m3 or t) | Average Deviation (m3 or t) | Average Relative Error per Day (%) |
|---|---|---|---|---|---|---|
| Coal (10³ t) * | 533.01 | 533.06 | −0.01 | −0.05 * | 5.02 * | 26.30 |
| Waste (10³ m3) | 1336.28 | 1378.03 | −3.03 | −41.75 | 10.66 | 23.62 |
| Total (10³ m3) | 1794.81 | 1841.56 | −2.54 | −46.74 | 8.49 | 15.25 |
| Material Type | Simulated | Actual | Difference (%) | Bias (m3 or t) | Average Deviation (m3 or t) | Average Relative Error per Day (%) |
|---|---|---|---|---|---|---|
| Coal (10³ t) * | 541.96 | 533.06 | 1.67 | 8.90 * | 10.36 * | 62.55 |
| Waste (10³ m3) | 1373.68 | 1378.03 | −0.32 | −4.34 | 20.19 | 47.22 |
| Total (10³ m3) | 1844.95 | 1841.56 | 0.18 | 3.39 | 24.08 | 40.76 |
| Status | Bg. 1580 | Bg. 1511 | Bg. 1553 | Bg. 351 | Bg. 1541 | Bg. 309 |
|---|---|---|---|---|---|---|
| Busy | 14.3% | 49.8% | 46.1% | 60.5% | 57.8% | 27.6% |
| Failed | 1.0% | 4.7% | 1.7% | 3.7% | 1.1% | 0.6% |
| Idle | - | 7.8% | 37.0% | 3.7% | 8.5% | 7.4% |
| Inactive | 84.7% | 37.7% | 15.3% | 32.3% | 32.5% | 64.5% |
| Status | Bg. 1580 | Bg. 1511 | Bg. 1553 | Bg. 351 | Bg. 1541 | Bg. 309 |
|---|---|---|---|---|---|---|
| Busy | 11.7% | 54.0% | 44.7% | 55.8% | 56.7% | 28.2% |
| Failed | 2.9% | 6.9% | 40.9% | 10.9% | 14.8% | 7.1% |
| Inactive | 85.4% | 39.1% | 14.4% | 33.3% | 28.5% | 64.6% |
| Status | Bg. 1580 | Bg. 1511 | Bg. 1553 | Bg. 351 | Bg. 1541 | Bg. 309 |
|---|---|---|---|---|---|---|
| Busy | 2.6% | −4.2% | 1.4% | 4.7% | 1.1% | −0.7% |
| Failed | −1.9% | −2.2% | −39.2% | −7.2% | −13.7% | −6.6% |
| Inactive | −0.7% | −1.4% | 0.8% | −1.0% | 4.1% | −0.2% |
| Material Type | Simulated | Actual | Difference (%) | Bias (m3 or t) | Average Deviation (m3 or t) | Average Relative Error per Day (%) |
|---|---|---|---|---|---|---|
| Coal (10³ t) * | 582.51 | 533.06 | 10.24 | 49.45 * | 12.31 * | 65.90 |
| Waste (10³ m3) | 1402.73 | 1378.03 | 1.54 | 24.7 | 16.33 | 29.29 |
| Total (10³ m3) | 1909.26 | 1841.56 | 3.49 | 67.7 | 18.82 | 24.65 |
| Material Type 1 | Simulated | Actual | Difference (%) | Bias (m3 or t) | Average Deviation per Shift (m3 or t) | Average Relative Error Per Shift (%) |
|---|---|---|---|---|---|---|
| M1 (m³) | 10,604,266 | 10,655,819 | −0.48 | −51,553 | 26,178 | 0.25 |
| M2T (m³) | 4,263,052 | 4,290,314 | −0.64 | −27,262 | 16,965 | 0.40 |
| M2N (m³) | 2,765,828 | 2,765,928 | 0.00 | −100 | 15,050 | 0.54 |
| FOKI (m³) | 33,329 | 33,329 | 0.00 | 0 | 593 | 1.78 |
| KIES (m³) | 16,000 | 16,000 | 0.00 | 0 | 251 | 1.57 |
| Coal (t) | 4,157,393 | 4,183,493 | −0.62 | −26,100 | 7872 | 0.19 |
| Total volume (m³) | 21,297,599 | 21,399,210 | −0.47 | −101,611 | 27,064 | 0.13 |
| Material Type | Simulated | Actual | Difference (%) | Bias (m3 or t) | Average Deviation per Shift (m3 or t) | Average Relative Error per Shift (%) |
|---|---|---|---|---|---|---|
| M1 (m³) | 10,556,753 | 10,655,819 | −0.93 | −99,066 | 27,892 | 0.26 |
| M2T (m³) | 4,257,161 | 4,290,314 | −0.77 | −33,153 | 14,912 | 0.35 |
| M2N (m³) | 4,257,161 | 4,290,314 | −0.77 | −33,153 | 14,610 | 0.34 |
| FOKI (m³) | 33,329 | 33,329 | 0.00 | 0 | 414 | 1.24 |
| KIES (m³) | 16,000 | 16,000 | 0.00 | 0 | 251 | 1.57 |
| Coal (t) | 4,060,603 | 4,183,493 | −2.94 | −122,890 | 9336 | 0.22 |
| Total volume (m³) | 23,181,006 | 23,469,269 | −1.23 | −288,263 | 30,938 | 0.13 |
© 2017 by the authors. Licensee MDPI, Basel, Switzerland. This article is an open access article distributed under the terms and conditions of the Creative Commons Attribution (CC BY) license (http://creativecommons.org/licenses/by/4.0/).
Share and Cite
Shishvan, M.S.; Benndorf, J. Operational Decision Support for Material Management in Continuous Mining Systems: From Simulation Concept to Practical Full-Scale Implementations. Minerals 2017, 7, 116. https://doi.org/10.3390/min7070116
Shishvan MS, Benndorf J. Operational Decision Support for Material Management in Continuous Mining Systems: From Simulation Concept to Practical Full-Scale Implementations. Minerals. 2017; 7(7):116. https://doi.org/10.3390/min7070116
Chicago/Turabian StyleShishvan, Masoud Soleymani, and Jörg Benndorf. 2017. "Operational Decision Support for Material Management in Continuous Mining Systems: From Simulation Concept to Practical Full-Scale Implementations" Minerals 7, no. 7: 116. https://doi.org/10.3390/min7070116
APA StyleShishvan, M. S., & Benndorf, J. (2017). Operational Decision Support for Material Management in Continuous Mining Systems: From Simulation Concept to Practical Full-Scale Implementations. Minerals, 7(7), 116. https://doi.org/10.3390/min7070116