1. Introduction
A well-established fact is that large-scale mining affects the rock mass at a considerable distance from the actual mining area, especially in the case of large-scale underground mining. A common problem, however, is that even though the effect of the underground mining might be evident from surface settlements or lowering of ground water, the explicit behaviour of the rock mass can seldom be directly studied. The underground environment, except for the immediate production area, is often inaccessible and, with the possible exception of seismic arrays, void of monitoring equipment.
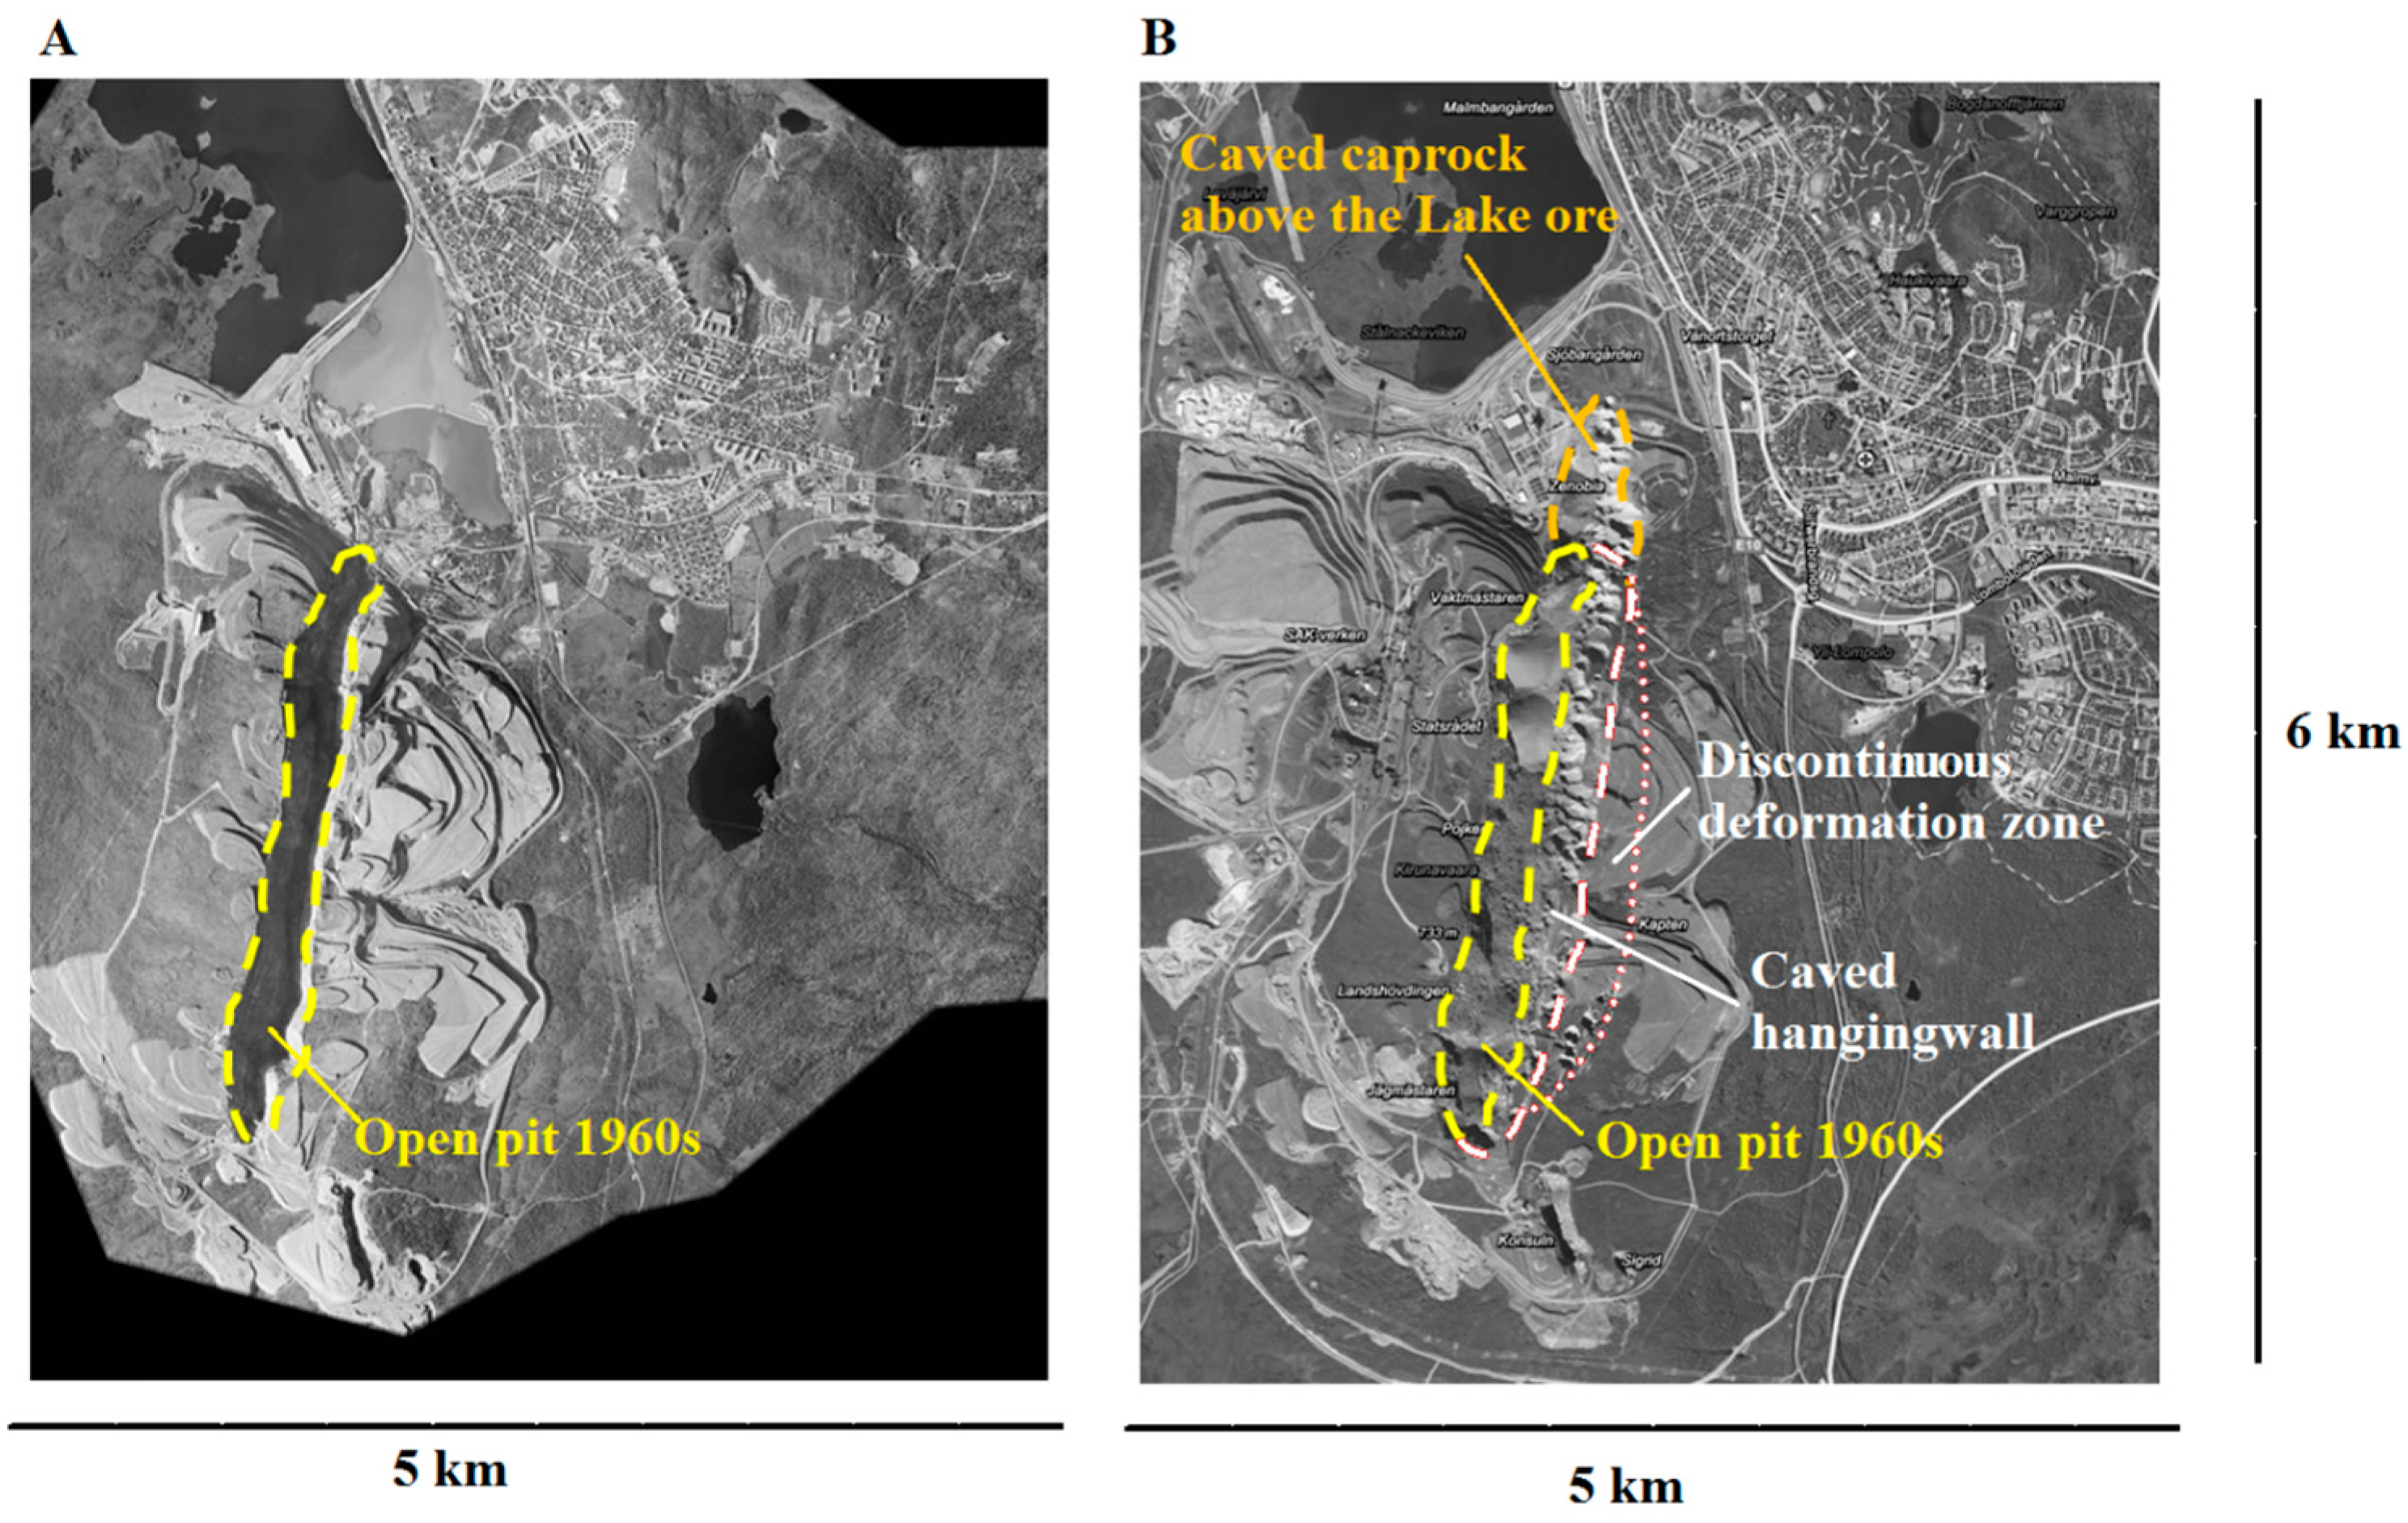
The Kiirunavaara mine offers a rare opportunity for studying the rock mass behaviour away from mining. The mineralisation is concentrated in a tabular orebody with a 60° dip that is mined by sub-level-caving (SLC). The transition from open pit into underground mining by SLC at the end of the 1950s has had a significant impact on the ground surface footprint, with caving and surface settlement on the hanging wall and caving of a cap rock above the lake ore, which was not mined during the open pit operation (see
Figure 1). Aside from the lake ore area, the surface impact on the footwall has been small, with tensile crack formation and discontinuous deformation confined to the old open pit walls [
1]. The apparent difference in behaviour between the hanging wall and footwall has resulted in the two volumes being studied almost separately. A number of previous studies focus on the ground surface impact from mining using the hanging wall rock mass as the primary entity of study, with the footwall as a passive support with a minimum of calibration related to the footwall behaviour (later works include, e.g., Villegas and Nordlund [
2,
3]). A second set of studies concentrates on the underground rock mass response and the impact on underground mining infrastructure, with the footwall rock mass in focus with hanging wall supplying buttress pressure with a minimum of calibration related to hanging wall ground surface response (later works include, e.g., Henry and Dahnér-Lindqvist [
4] and Svartsjaern et al. [
5]).
The combination of scale, geometry and mining method has resulted in a vast network of decommissioned infrastructure being left behind in the footwall as mining advanced. This allows the footwall to be inspected at a variety of depths, from the active production levels all the way up to the ground surface, meaning that the development of damage and displacements can, in some respect, be directly observed inside the rock mass. Based on underground observations and back analysis by numerical modelling, Svartsjaern et al. [
5] suggested that while the rock mass in the footwall underground is damaged, there is no explicit footwall or slope failure in progress, i.e., there is general damage without a specific large-scale failure. This theory is also supported by the results from Sjöberg [
7], where large-scale models of the footwall required significantly lowering the rock mass input values to achieve large-scale failure. That means that capturing the damage development in the footwall underground requires the study of small-scale damage mechanisms at a large scale, rather than expecting large-scale mechanisms in a coherent failure. On the hanging wall, Villegas, et al. [
8] and Villegas and Nordlund [
3] describe the surface subsidence to include a discontinuous zone with formation of tensile fractures at the ground surface, step-like settlement, and toppling of newly formed blocks near the old open pit rim. The failure mechanisms underlying such behaviour require the represented material to be allowed to fail at any point and form new fractures in previously undisturbed material.
How to include the action of the hanging wall caved rock mass on the footwall and surface profile development has also been a matter of concern. Lupo [
9] simulated the action of the cave using equivalent surface tractions derived from silo-theory. Sjöberg [
7] and Villegas and Nordlund [
3] represented the caved rock as a low-stiffness continuum material and Svartsjaern et al. [
5] used the same approach but allowed for slip and complete detachment along the footwall–cave rock interface.
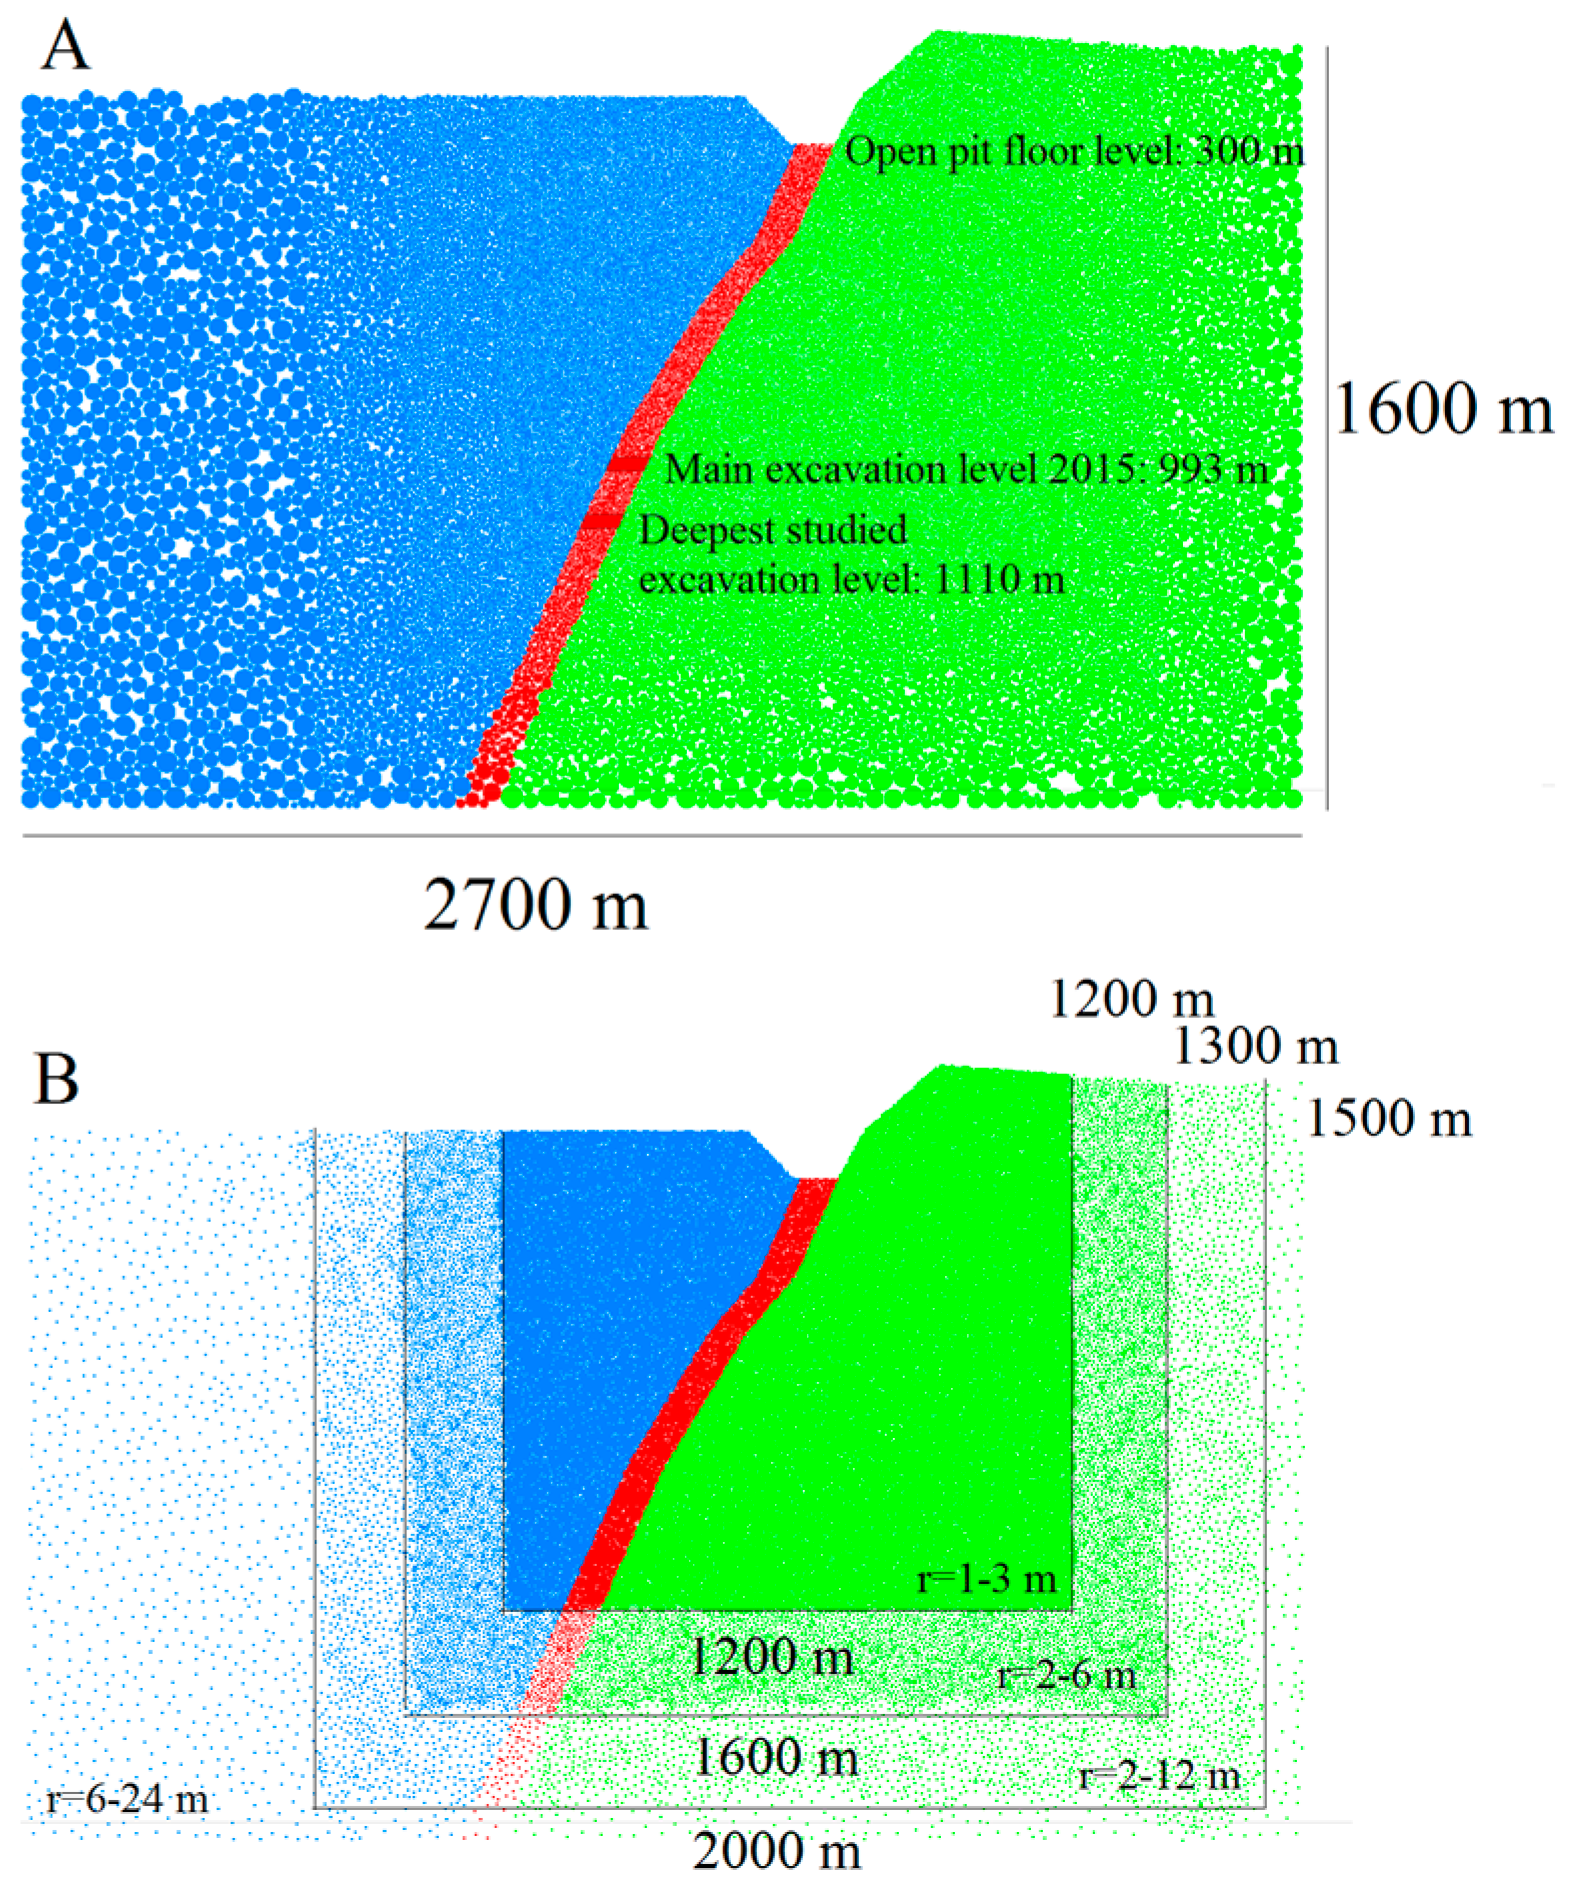
To account for the points raised above, the current study uses the Bonded-Particle Model (BPM) in PFC2D 5.0 [
10] to allow for new fracture propagation through a homogeneous rock mass matrix and direct inclusion of the cave rock. As bonds break between particles in the hanging wall due to the mining advance, the cohesive rock mass matrix constituting the hanging wall breaks down into a frictional, zero tensile strength material made up of the unbounded particles that cave into the void left by ore extraction. As the BPM allows for tracking individual bond breakages (fracture formations), damage to the footwall rock mass can be studied even if no distinct large-scale failures develop.
On the hanging wall, the close proximity of the caving operation to the city of Kiruna has resulted in ground surface subsidence being monitored and documented in great detail for decades, producing a vast bank of ground deformation data. These data have been used as a benchmark for various ground deformation analyses at the mine. This paper utilizes the data from both the footwall and hanging wall gathered over the last decades to study the mine-scale impact on the rock mass from mining and the co-dependence between the two walls for the system behaviour.
2. Site Description
The Kiirunavaara mine, or Kiruna mine, located near the city of Kiruna in the county of Norrbotten in northern Sweden, is owned and operated by the state-owned stock company Luossavaara-Kiirunavaara Aktiebolag (LKAB). Mine operations date back to the early 1900s, with a transition from open pit to underground mining in the 1950s. Current annual production is in the range of 28 million tonnes of iron ore per year. The northernmost part of the currently mined volume was never exploited by the open pit operation. This northern extension of the ore is named the lake ore and underground-only access resulted in a ground surface footprint by caving of the lake ore cap-rock (
Figure 1B).
2.1. Mine Layout
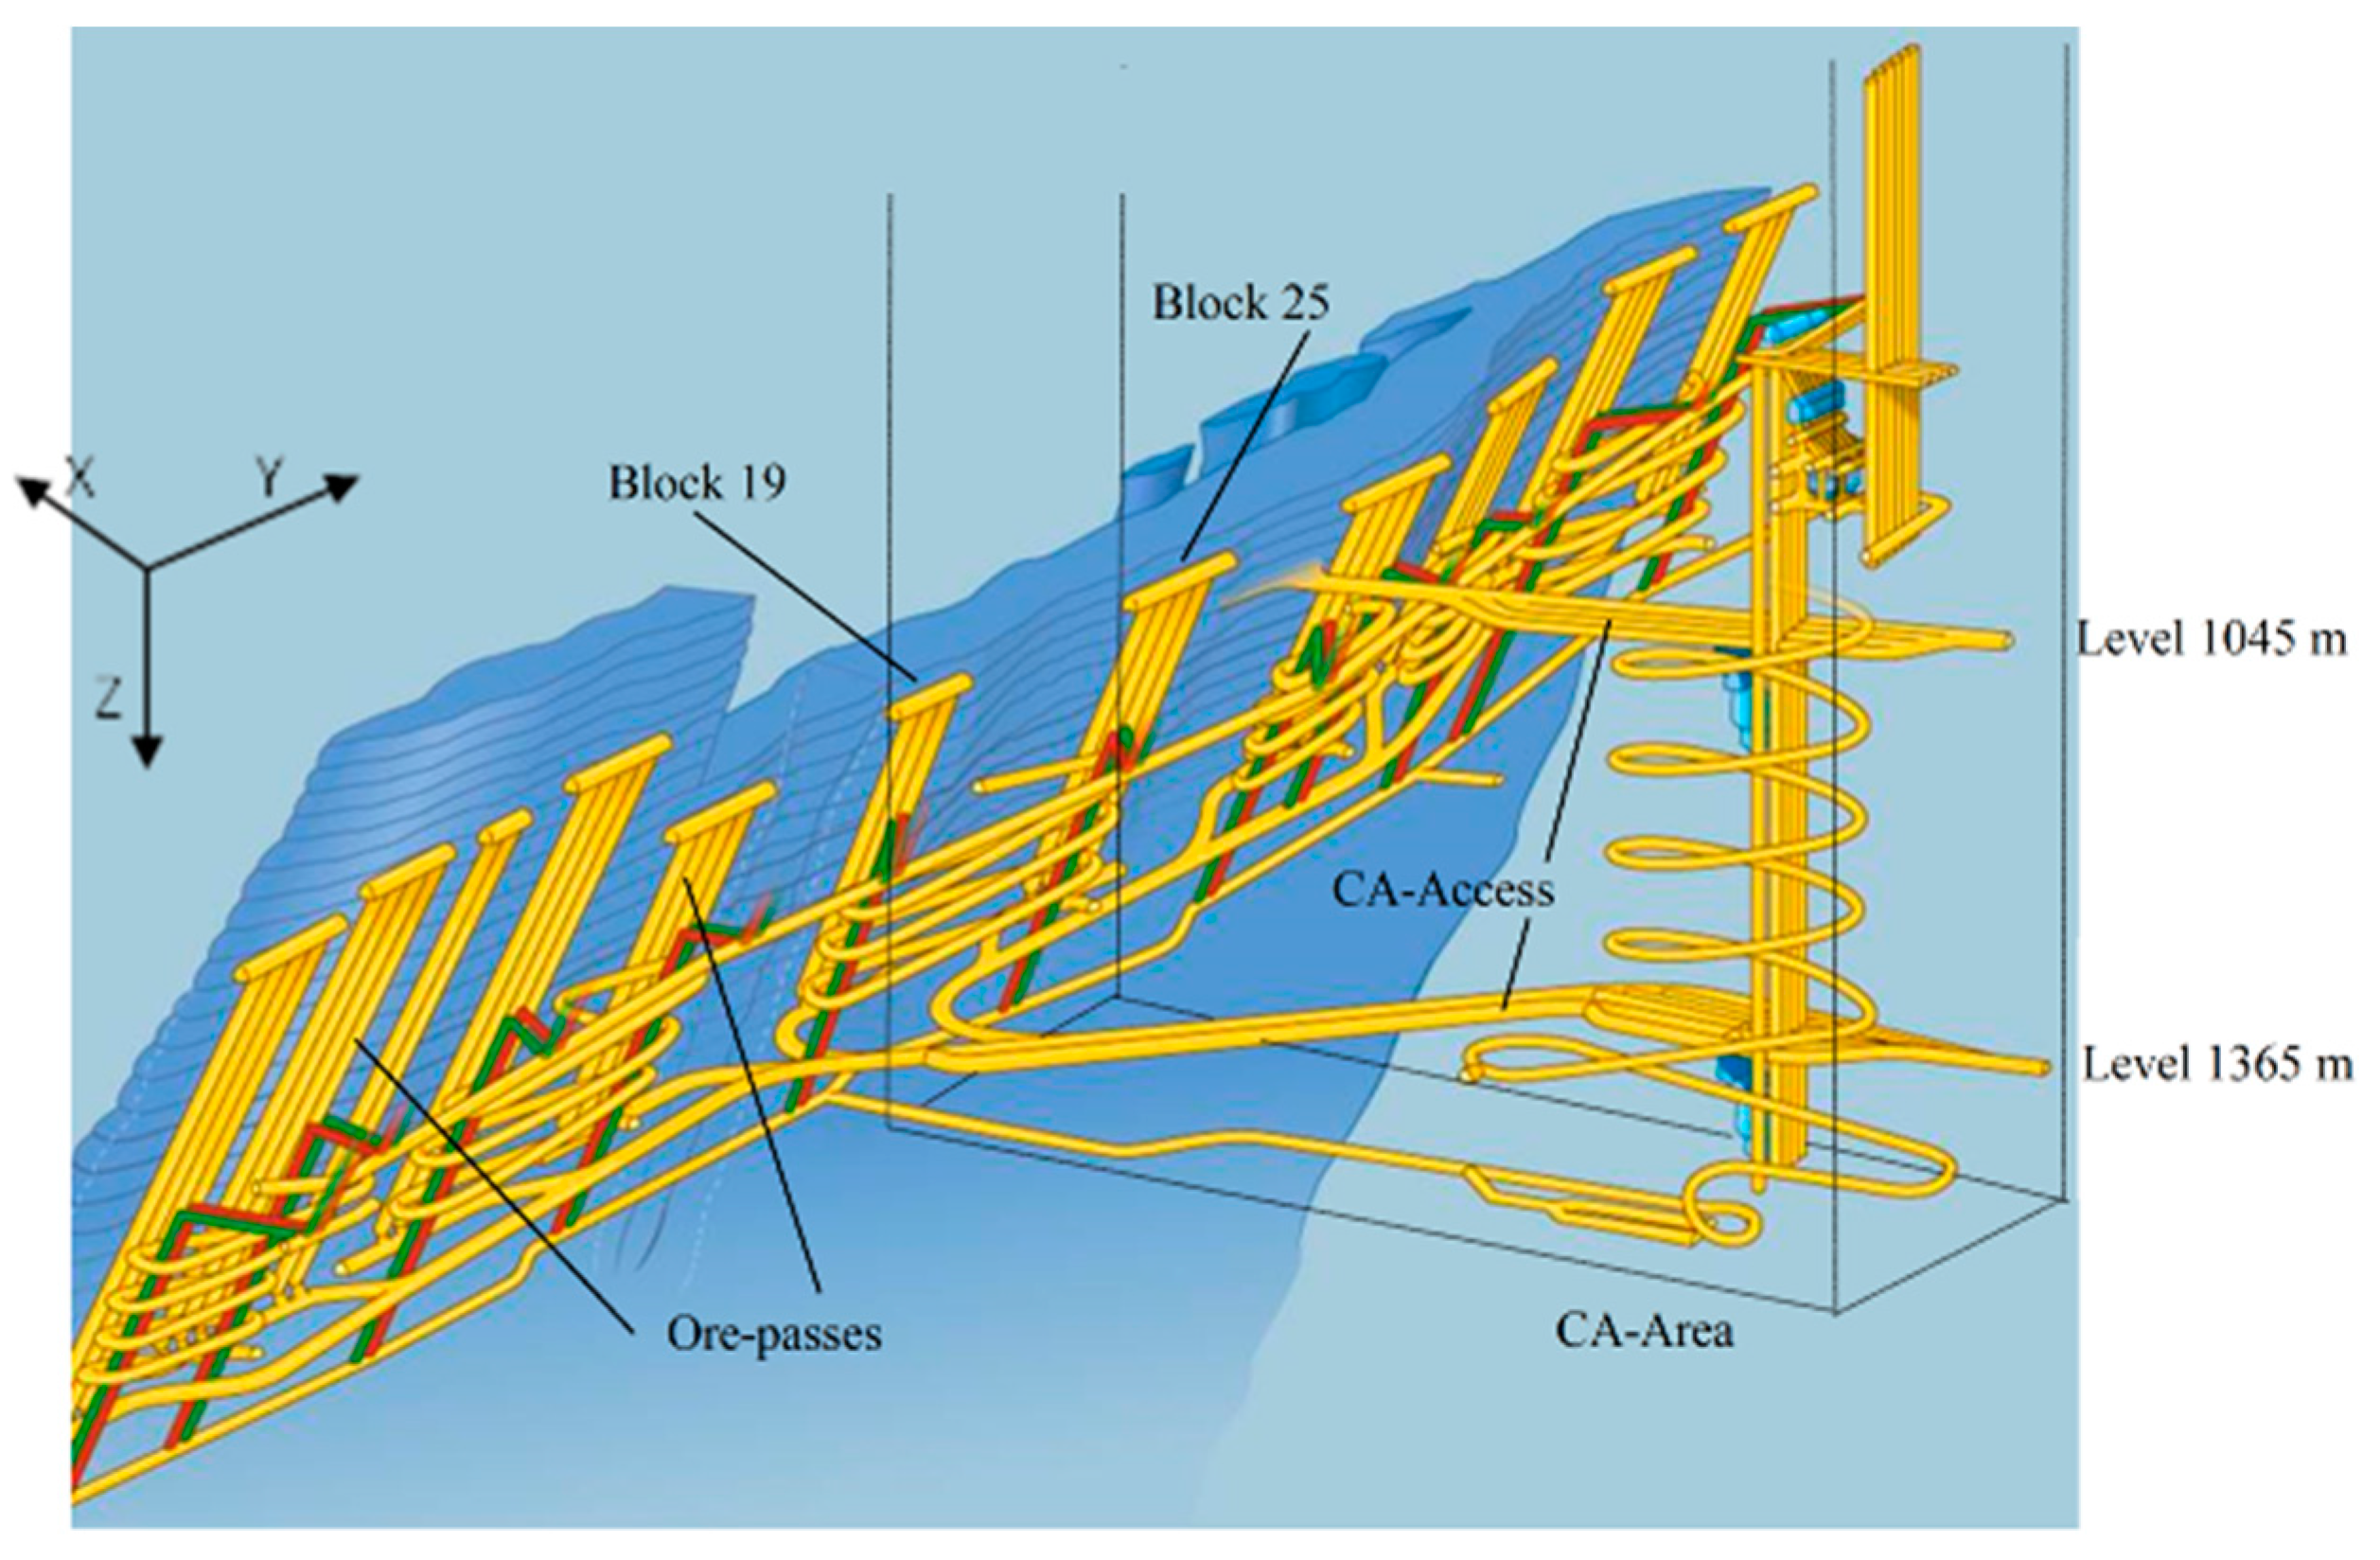
The underground mine can be described as three principal parts; (i) the northern part with Y-coordinates 9–21, including the lake ore, (ii) the central facilities area (CA-area) hosting the life of mine infrastructure at Y21–25; and (iii) the southern part comprising Y-coordinates 25–50. The production areas in the respective parts are divided into production blocks roughly 400 m wide, named by the centre Y-coordinate. The principles of the underground layout are shown in
Figure 2.
Ore extraction is achieved by blast-induced caving from silo-shaped production rings consisting of up to 50 m long holes with a diameter of 115 mm. The current sublevels are separated by a 28 m vertical distance and developed with a relative offset of 12.5 m (cross cut spacing is 25 m) to allow for the corresponding production rings. The sublevel height has been upscaled three times since underground production began, namely in 1963 (9 m), 1983 (12 m), and 1995 to the current 28 m.
The current main haulage level is 1365 m, though a few remaining blocks still use the previous main haulage level located at 1045 m. Production in the main orebody is performed between levels 993 and 1051 m depending on the production block. Level designations use an artificial ground surface as the origin based on the pre-mining peak of the Kiirunavaara mountain peak. With the current ground surface undulating and the footwall crest towering well above the hanging wall crest, the actual depth from ground surface and mining level designations may differ by as much as 200 m.
The tabular nature of the Kiirunavaara orebody makes it possible to study various sections of the mine as 2D transverse (east–west) sections. The elongated geometry creates near plane strain conditions at the mine scale for the middle two-thirds of the orebody length, as shown by numerical stress analyses by Malmgren and Sjöberg [
11]. As for the general rock mass response, section Y23, located in the middle of the CA-area, provides the most comprehensive dataset of underground observation points. The profile also represents one of the most crucial sections from a stability point of view as the CA area includes the main decline system and a number of support infrastructure installations.
The state of stress in the mining area is characteristically highly non-uniform. Due to the large and long-term mining operations, the difference between virgin and secondary stresses is significant regarding both orientation and magnitude. The major primary principal stress acts perpendicular to the orebody and thus the footwall; as a result, secondary stresses tend to concentrate at the footwall slope toe beneath the production level. The stress measurements conducted in the Kiirunavaara mine before 2003 have been summarised by Sandström [
12].
2.2. Geological Setting
The geology of the mine area is composed of igneous and metamorphic rocks, which are part of the Fennoscandian Shield. A ductile foliation that strikes north–south is commonly encountered within the area. A number of weakness zones align with this regional foliation, which shows signatures of hydrothermal alteration, including deposition of chlorites. Both the orebody itself and the principal rock type boundaries in the footwall and hanging wall sides align with the strike of the regional structures [
13].
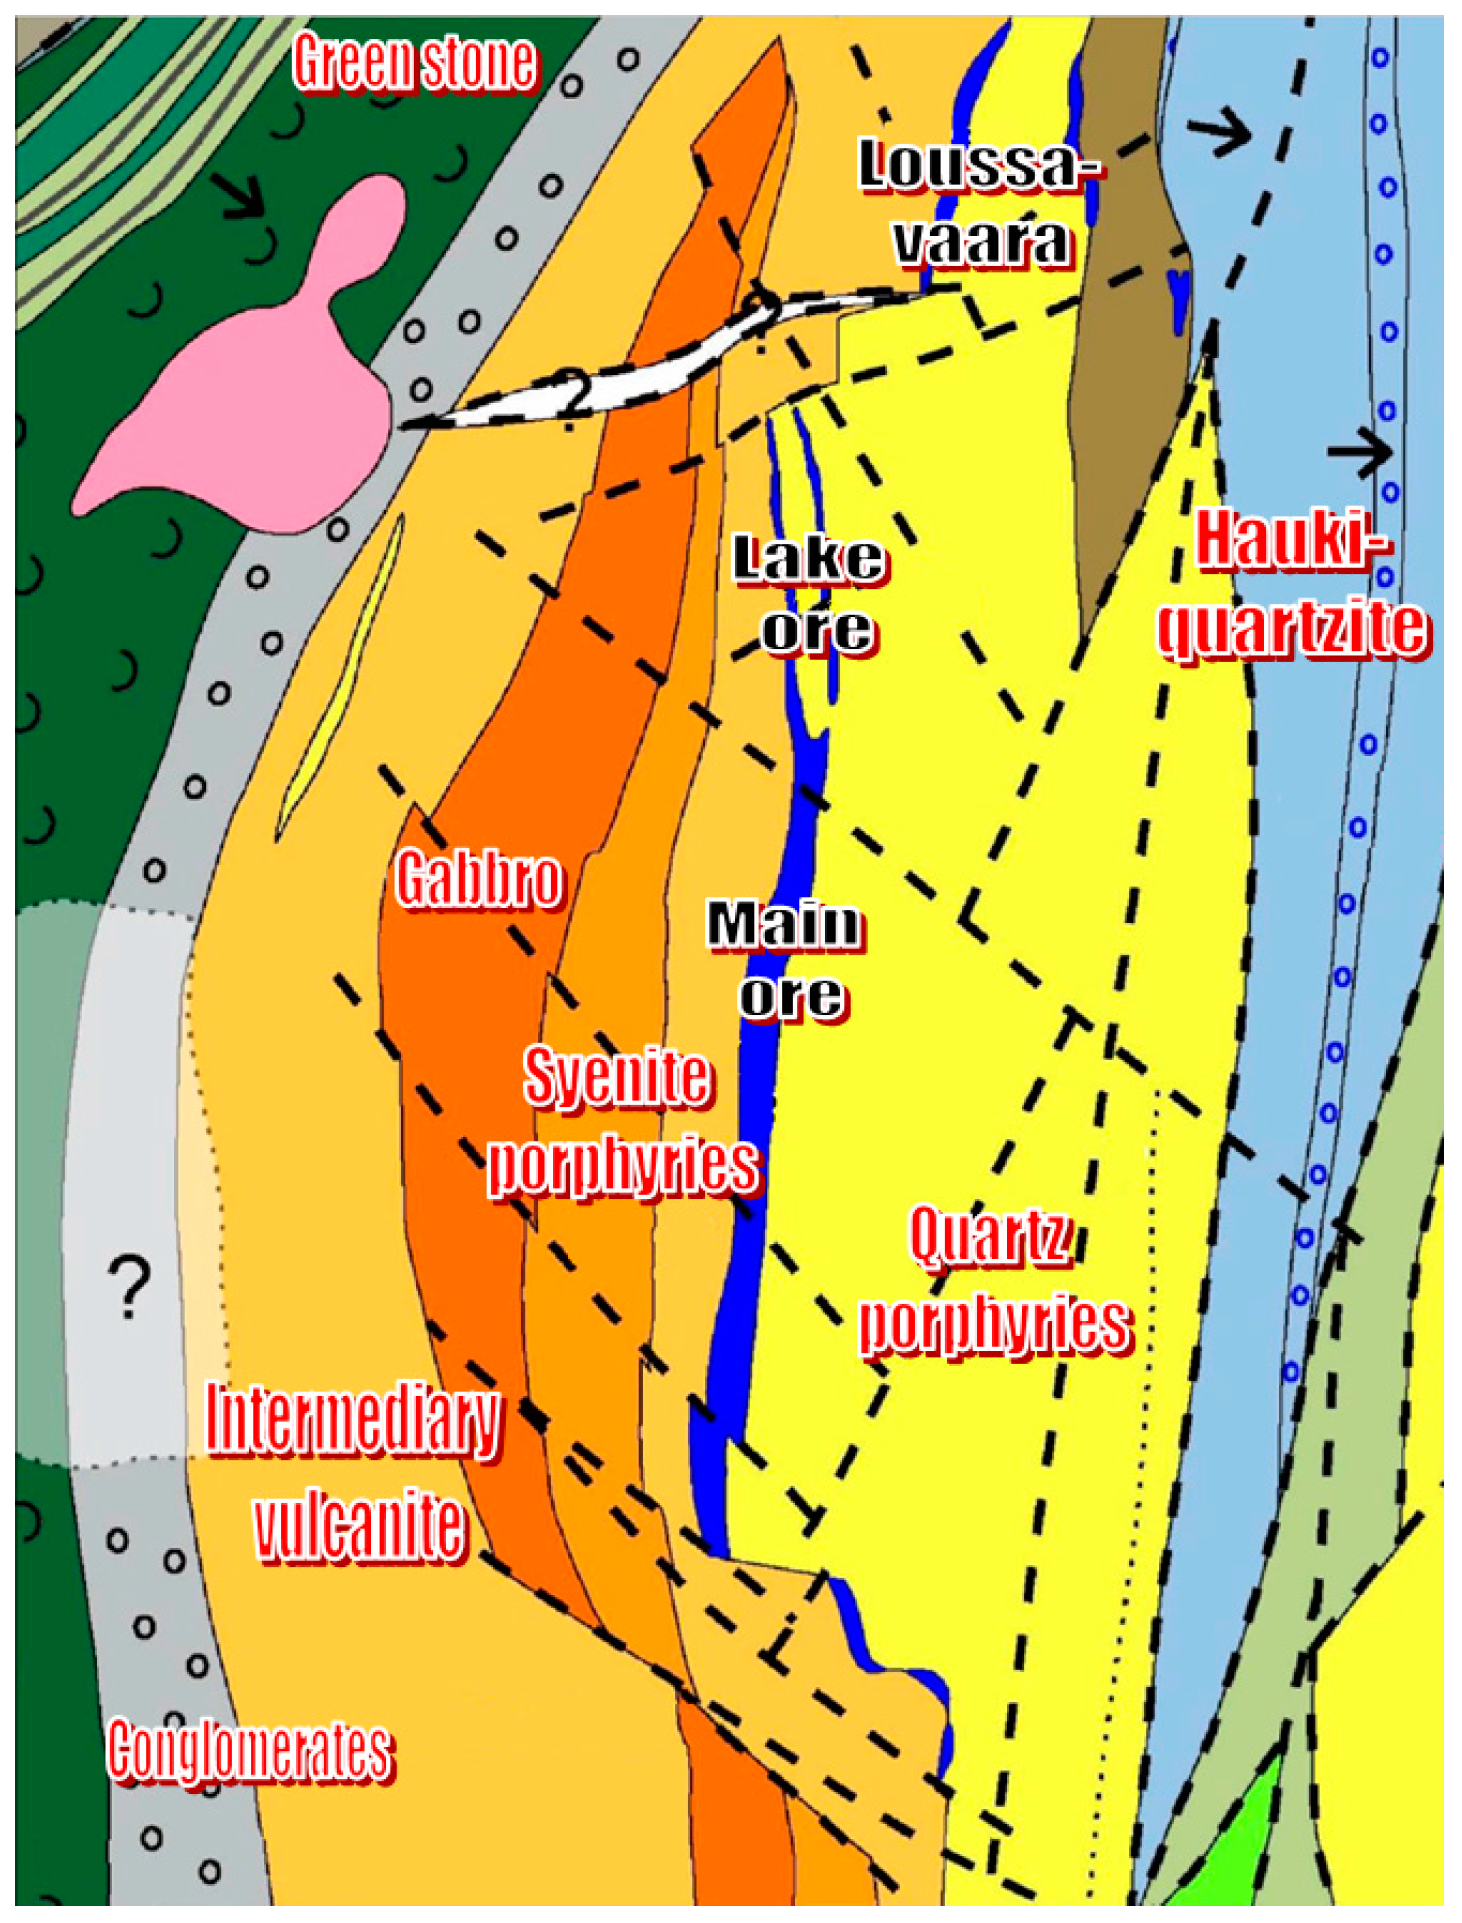
The rock mass directly to the west of the footwall contact is interpreted as Precambrian aged tracho-andesites, locally referred to as syenite porphyries,
Figure 3. These syenite porphyries have historically been separated into five subgroups denoted SP 1 –5 based on core test results. The subgroups do not cluster but are to a large degree intermixed. This intermixing, combined with the large variation in geomechanical properties between the subgroups, makes field estimations of the rock mass properties at any given location difficult.
The most commonly occurring subgroup is SP1, which forms the “baseline” syenite porphyry. SP3 has a high content of amygdules and occurs more commonly close to the footwall contact. The footwall ore contact also contains 0.2–0.4 m thick zones of amphibolite and actinolite skarns. SP4 and 5 are intermixed in volumes of SP1, where SP4 is considered to be more competent and SP5 represents heavily weathered rock. Laboratory tests of cores indicate a range of intact uniaxial compressive strengths (UCS) from 90 MPa for SP5 to 430 MPa for SP4, with SP1 falling around 300 MPa and SP3 showing considerable spread but generally falling within 110–210 MPa [
14]. Intact rock core strength data, including the results from point load tests compiled by Vatcher et al. [
15], also show that there is considerable spread in the strength properties within the remaining subgroups SP1, 2, 4, and 5.
Farther westward from the footwall, a competent granite dome is mapped on levels below 800 m. Documentation of the rock mass at a distance from the ore contact is limited to drift mapping, primarily for the central region, as most cores are related to the prospecting of mineable ore and limited attention has been given to the host rock housing the infrastructure.
The first layer of the hanging wall rock near the ore contact constitutes pyroclastic rhyodacites referred to as quartzite–porphyry [
8]. As for the footwall, the hanging wall main group (quartzite–porphyry) is locally split into five subgroups designated QP1–5. Again, as in the footwall, the internal distribution of QPs for a given volume is complex, with a high degree of intermixing. QP1–3 represent baseline quartzite–porphyry, differentiated mainly by colour and mineral content, with QP3 having a high chlorite and amphibole content. QP4 is interpreted as a meta rhyodacite and QP5 represents heavily weathered rock [
16]. From the laboratory data, there is no significant difference in strength properties between the QP groups [
15]; however, it is reasonable to assume that QP5 (similar to SP5) would represent significantly lower strength. The hanging wall is in general considered to be less competent than the footwall (e.g., [
3,
15]).
The orebody strikes north–south with an eastwards dip of about 60 degrees and is roughly parallel to the orientation of the ductile regional deformation foliation. The tabular orebody constitutes a fine-grained magnetite with intrusions of apatite with a variable width of anything from a few meters to 200 m but averaging 80–90 m. The continuation of the orebody at depth is unknown. Current and previous mining show a gentle dip-along-strike towards the north, extending the footprint of the SLC away from the old open pit. In general, the ore is considered less competent than the host rock, with the exception of SP5 and contact minerals.
Information about dominant joint orientations has been documented for most levels in moderate detail; however, joint properties have in general not been recorded. The dominant joint orientation has historically motivated the separation of the length of the footwall into domains. These domains cannot be clearly traced between levels, even though some similarities are observed between main haulage levels. The continuation of previous patterns down to level 1365 m has been deemed uncertain. Work by Vatcher et al. [
15] indicate that, at a mine scale, the domains for the rock joints might not be well represented by 2D sections related neither to the mine length coordinate (Y-axis) nor the depth designation by mining level (Z-axis). Joint orientation distribution in the southern portion of the mine (primarily in the footwall south of Y28) is reported as having a large random component and clustering of joint sets into domains is uncertain. In both the northern and southern extents of the mine, joint sets dipping parallel or sub-parallel to the orebody can be found following the general trend of the regional structures. In general the joints do not cross the ore contact zones, even though the major orientations are roughly the same on both sides of the contact [
13].
2.3. Current Deformation State of the Hanging wall and Footwall
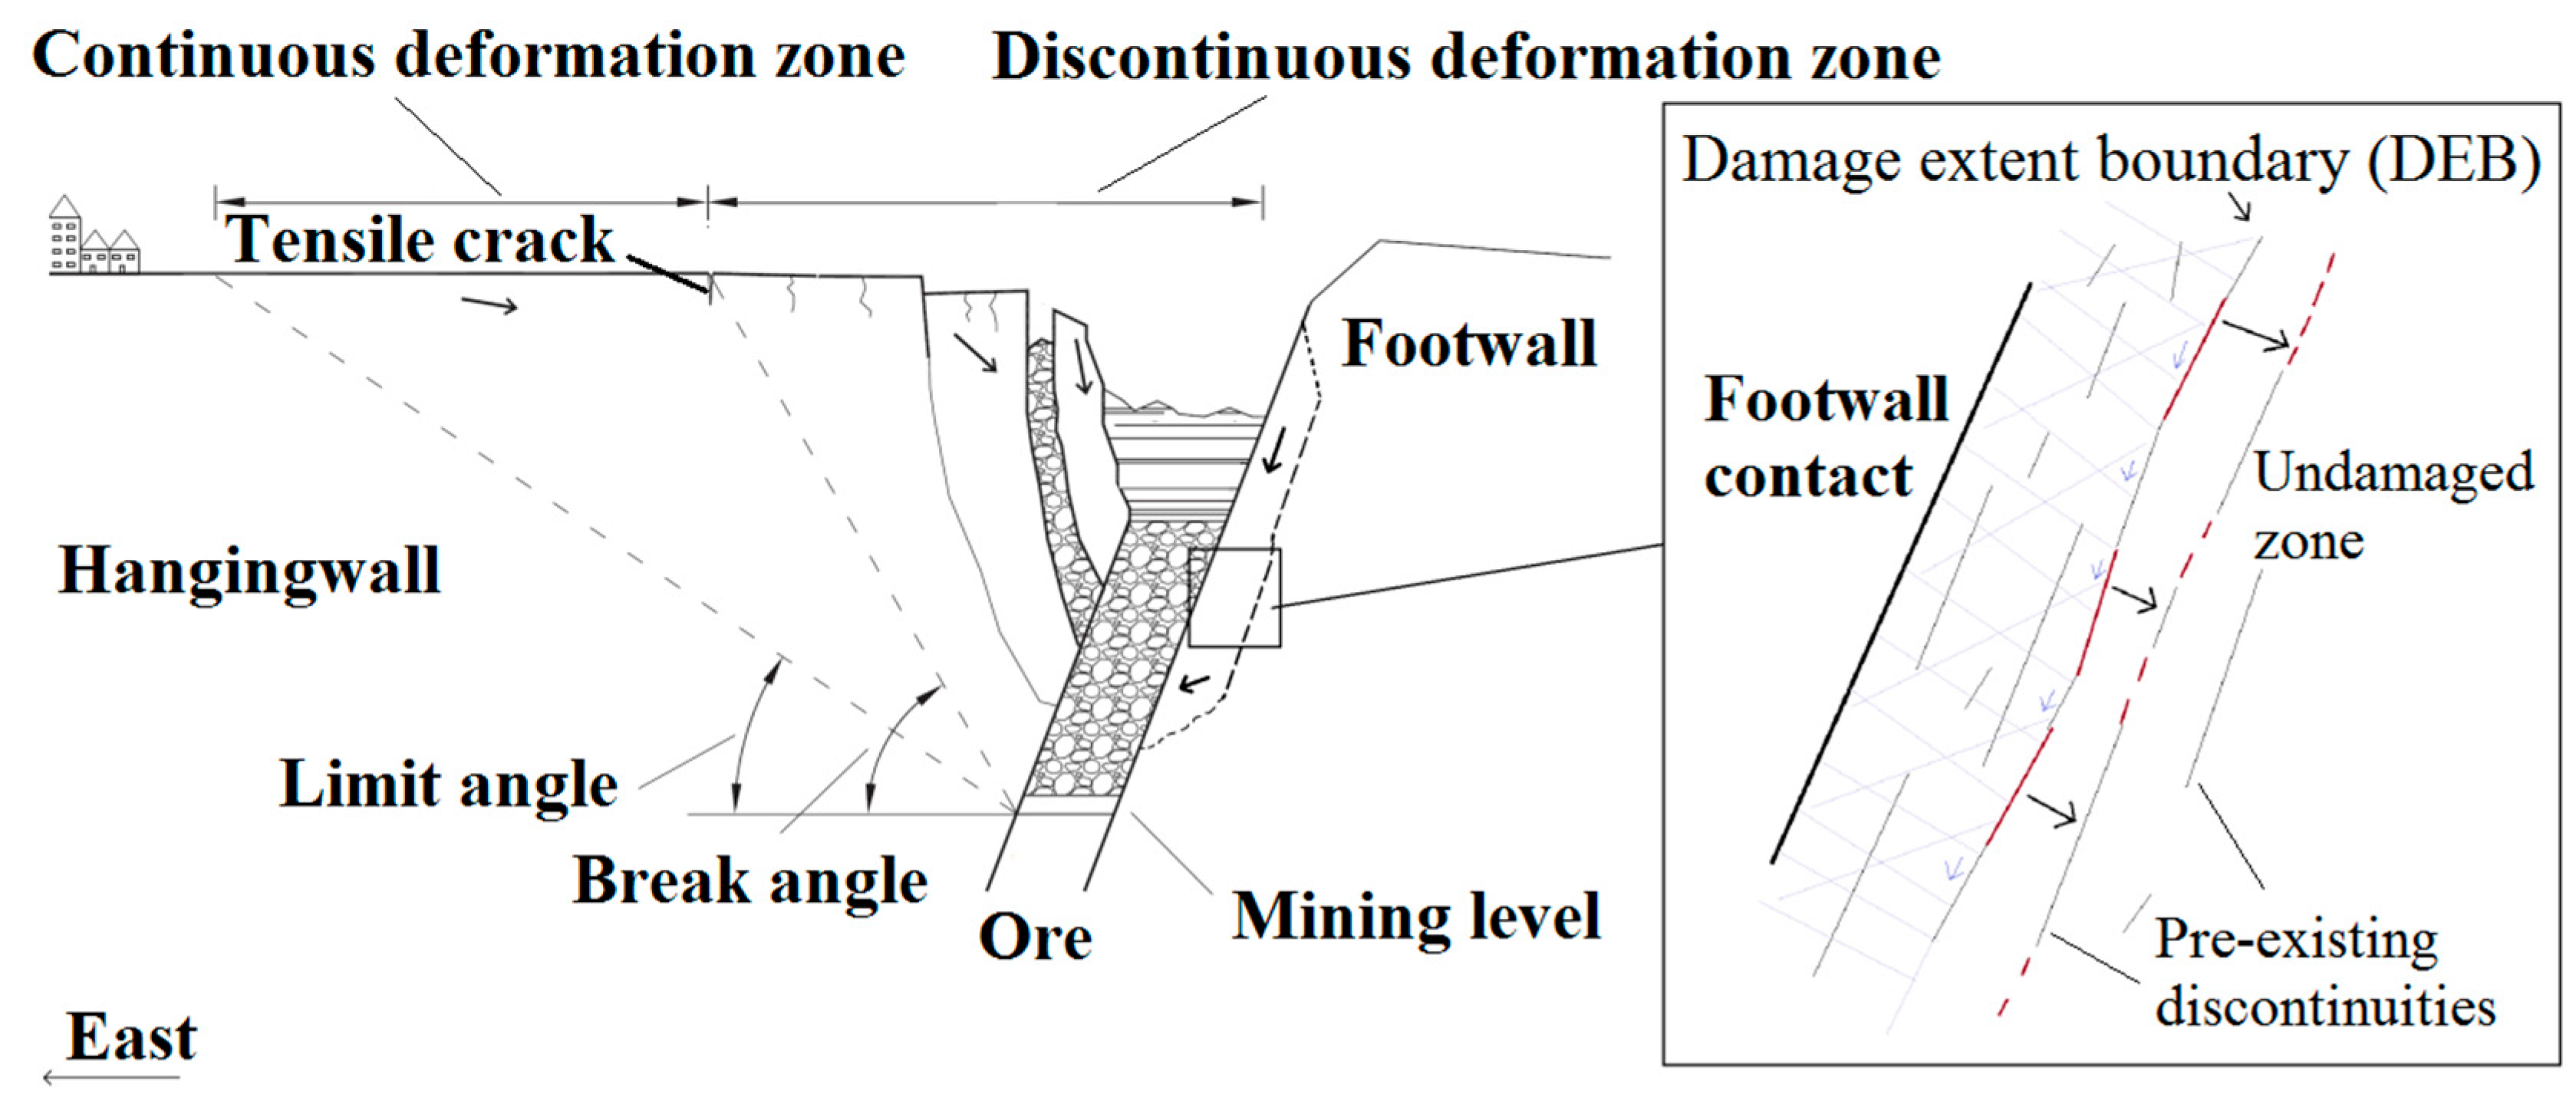
On the hanging wall the ground surface footprint develops in two main stages of ground settlement: a continuous deformation zone (free of tensile cracks and steps) and a discontinuous deformation zone. The discontinuous deformation zone is characterised by tensile fractures forming on the ground surface; these fractures develop into steps of discontinuous deformation closer to the pit rim and include complete caving of the old open pit hanging wall.
Figure 4 illustrates the definitions used for the ground surface deformation zones at the mine. The angle between the farthest point from mining (horizontal distance on ground surface) in the continuous deformation zone and the current mining level is defined as the limit angle and the transition point into the discontinuous deformation zone is given by the break angle.
The footwall rock mass response to mining is most noticeable underground in the decommissioned mining infrastructure overlying the current production areas. Svartsjaern et al. [
17] divided the rock mass closest to the ore contact in the footwall, based on results from damage mapping of the decommissioned infrastructure and numerical modelling, into two conceptual zones: (i) a damaged zone near the ore contact, where damage to the infrastructure is common and systematic; (ii) an undamaged zone with no significant damage to the infrastructure. In the undamaged zone infrastructure damage is sporadic and judged to be primarily caused by local variation in rock strength rather than stress redistribution or deformation. The damage in the damaged zone is most severe close to the ore contact and lessens farther into the footwall. The conceptual transition between damaged and undamaged is defined as a damage extent boundary (DEB). The boundary does not represent a physical plane but a transitional border. Infrastructure located between the ore contact and the boundary has a high probability of having sustained systematic damage, while infrastructure outside the boundary is unlikely to have suffered damage unrelated to local rock mass deterioration by, e.g., clay zones or water inflow. In most locations the location of the DEB, and nearby damage, can be correlated to natural pre-existing structure sets. The concepts of the described rock mass responses to mining for the hanging wall and footwall is visualised in
Figure 4. The rock mass movements interpreted for the footwall underground from the mapped infrastructure damage cannot be detected from ground surface monitoring. The current theory is that the underground movements are redirected towards the open pit slope by sub-vertical structure sets near the ground surface. Evidence of such structures includes the results from underground mapping and structures that directly daylight in the open pit footwall slope.
4. Results and Comparison to Current Damage Patterns and Deformation States
Two model setups are run based on the parameters from
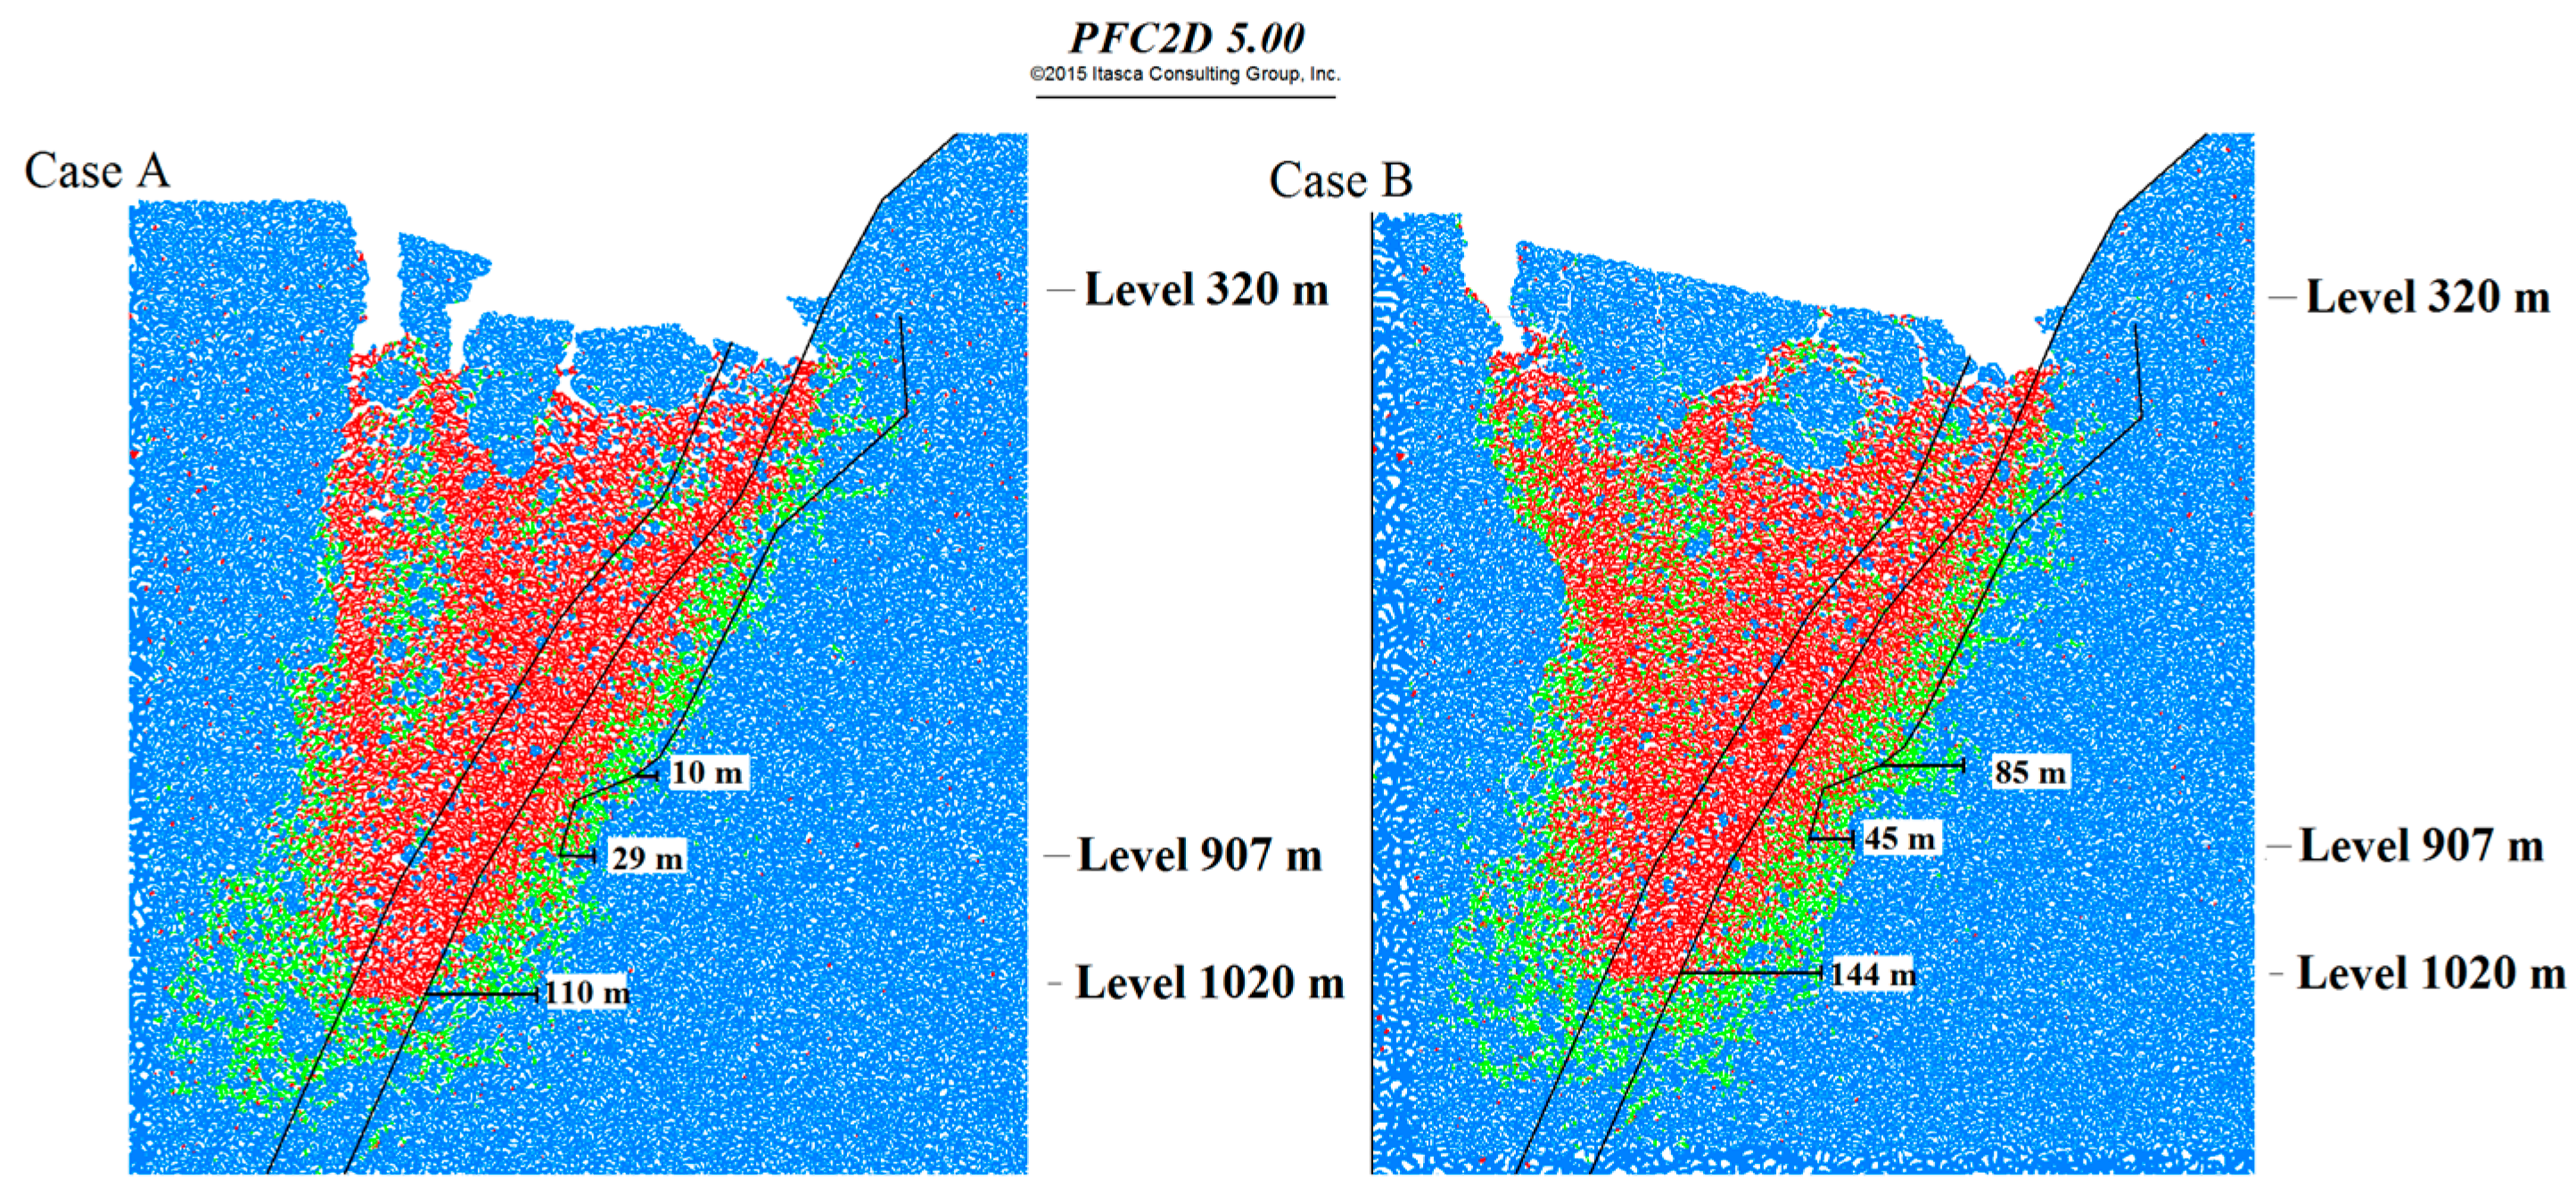
Table 2: Case A, where the same footwall rock mass properties are allocated for the hanging wall and footwall as well as the orebody, and Case B, where the footwall and orebody are allocated footwall properties and the hanging wall is allocated the lower strength properties estimated for this volume.
The footwall rock mass contains accessible underground infrastructure, which allows the response to mining be studied underground as well as on the ground surface. For the ground surface subsidence both the field data and the numerical results show negligible movement of the ground surface at the footwall crest. However, damage mapping of the underground infrastructure indicate rock mass deformation in the footwall underground [
17].
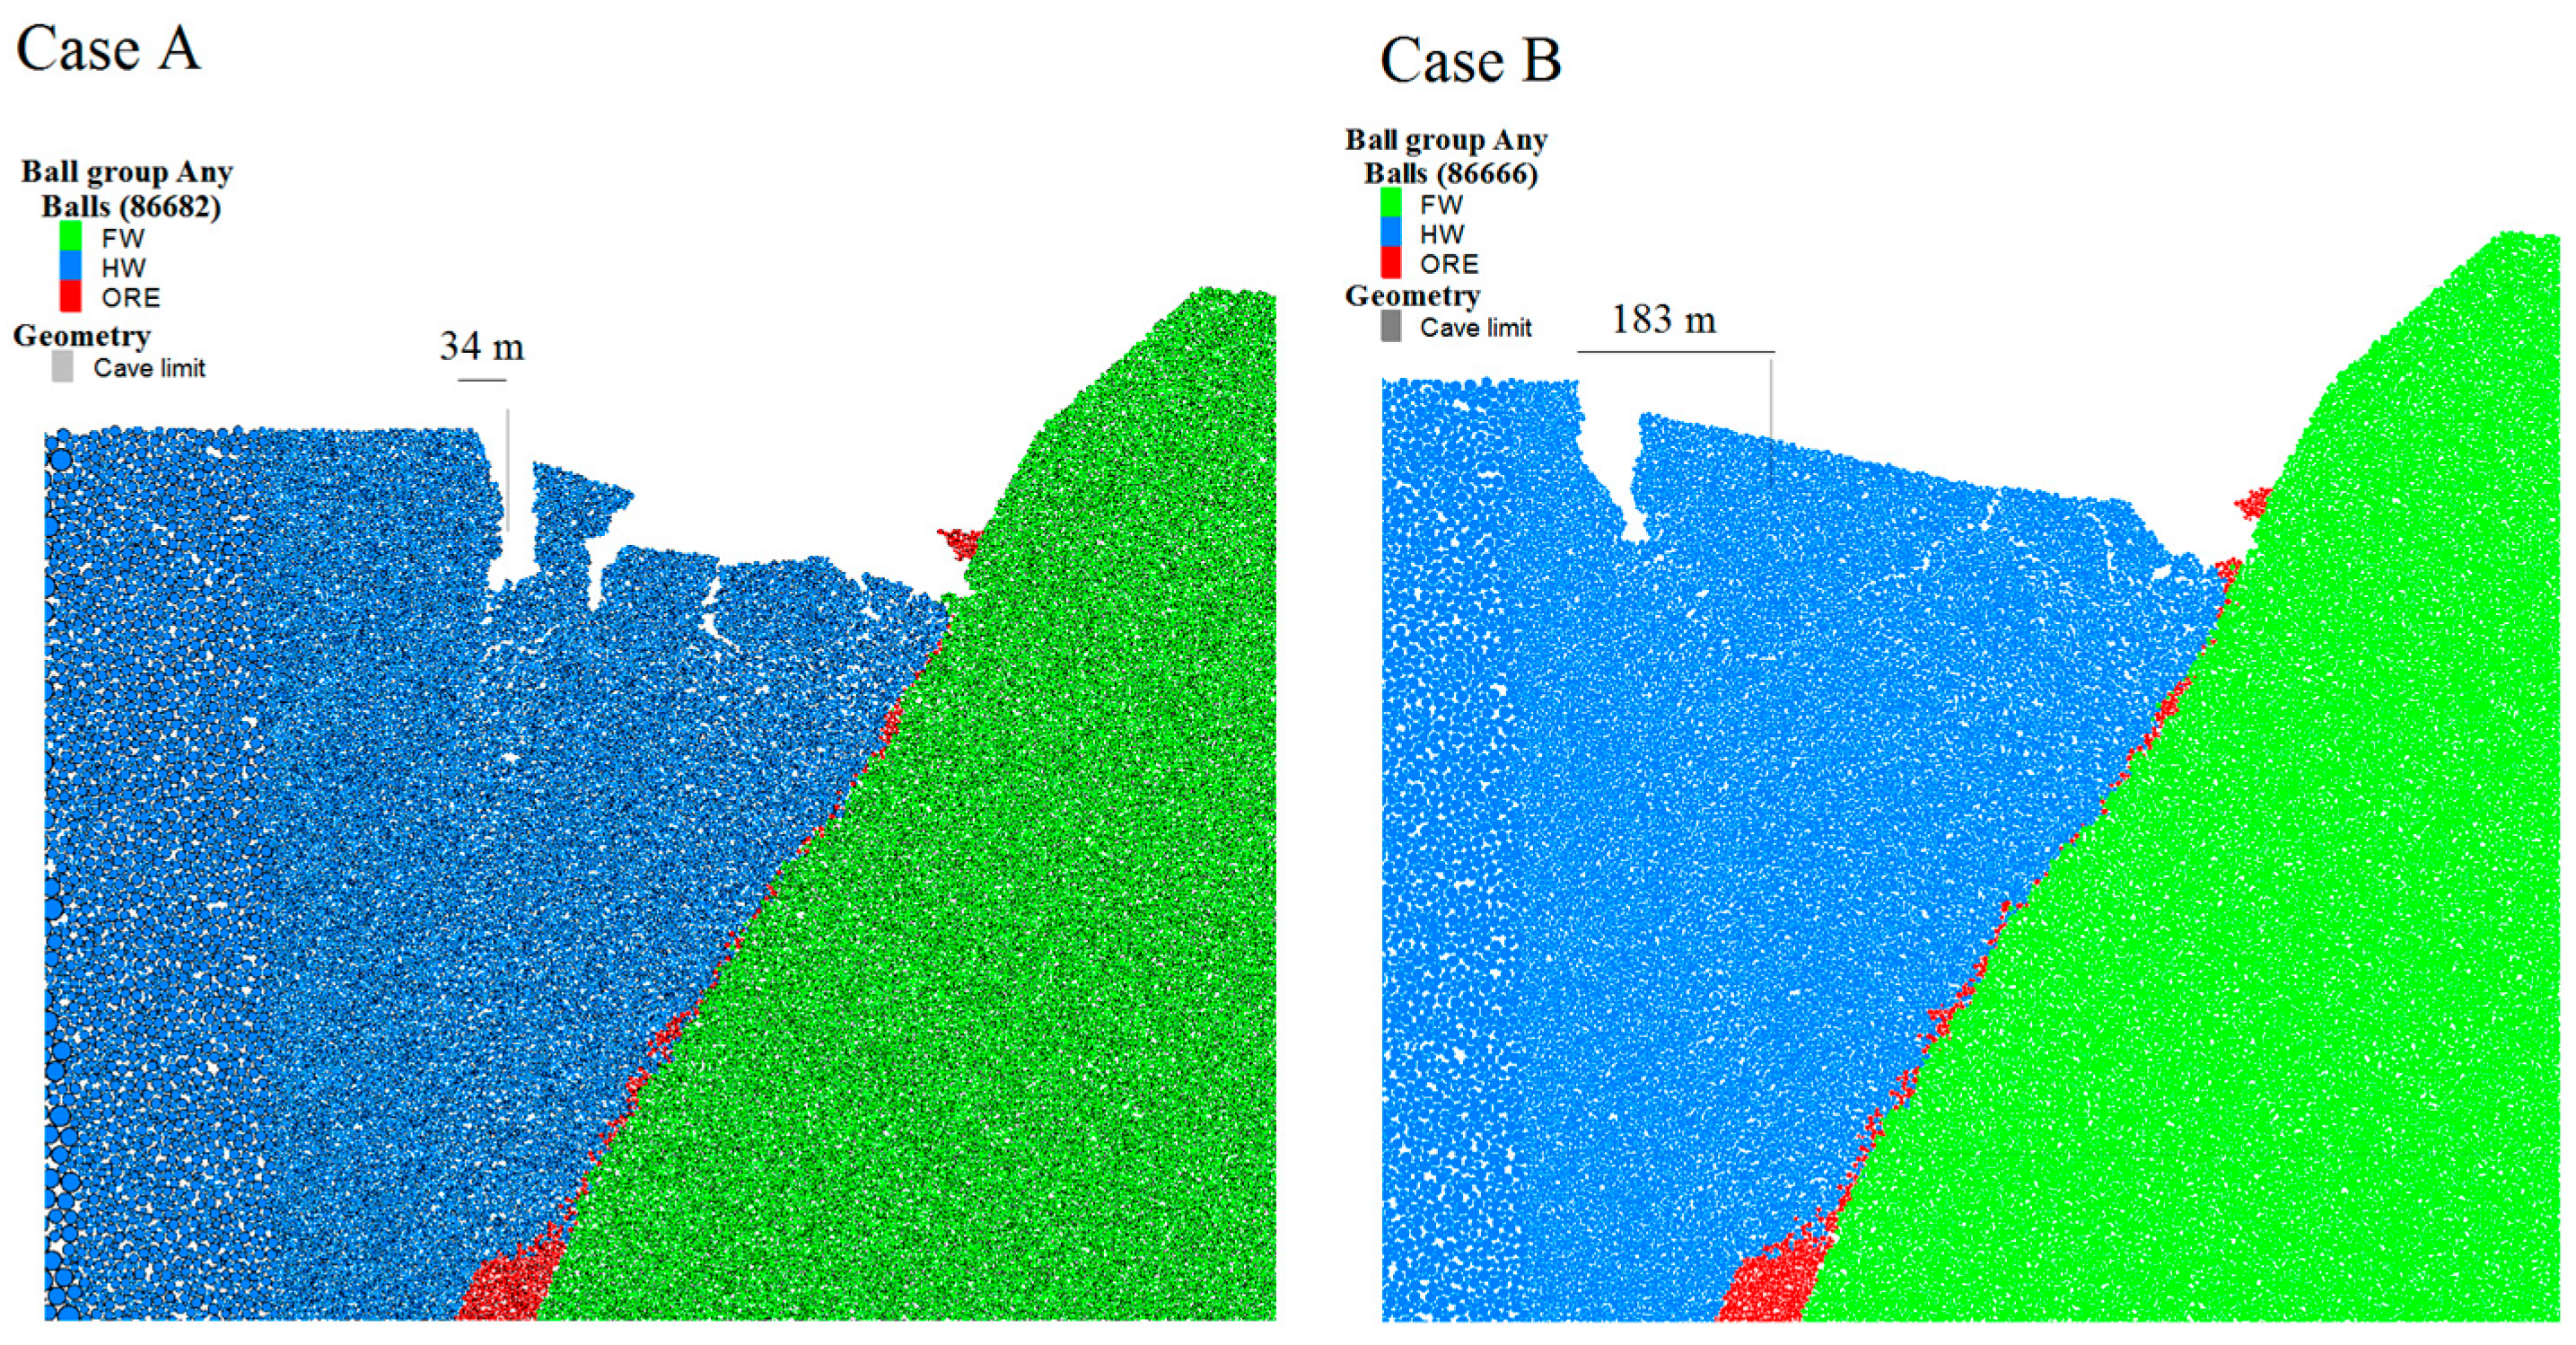
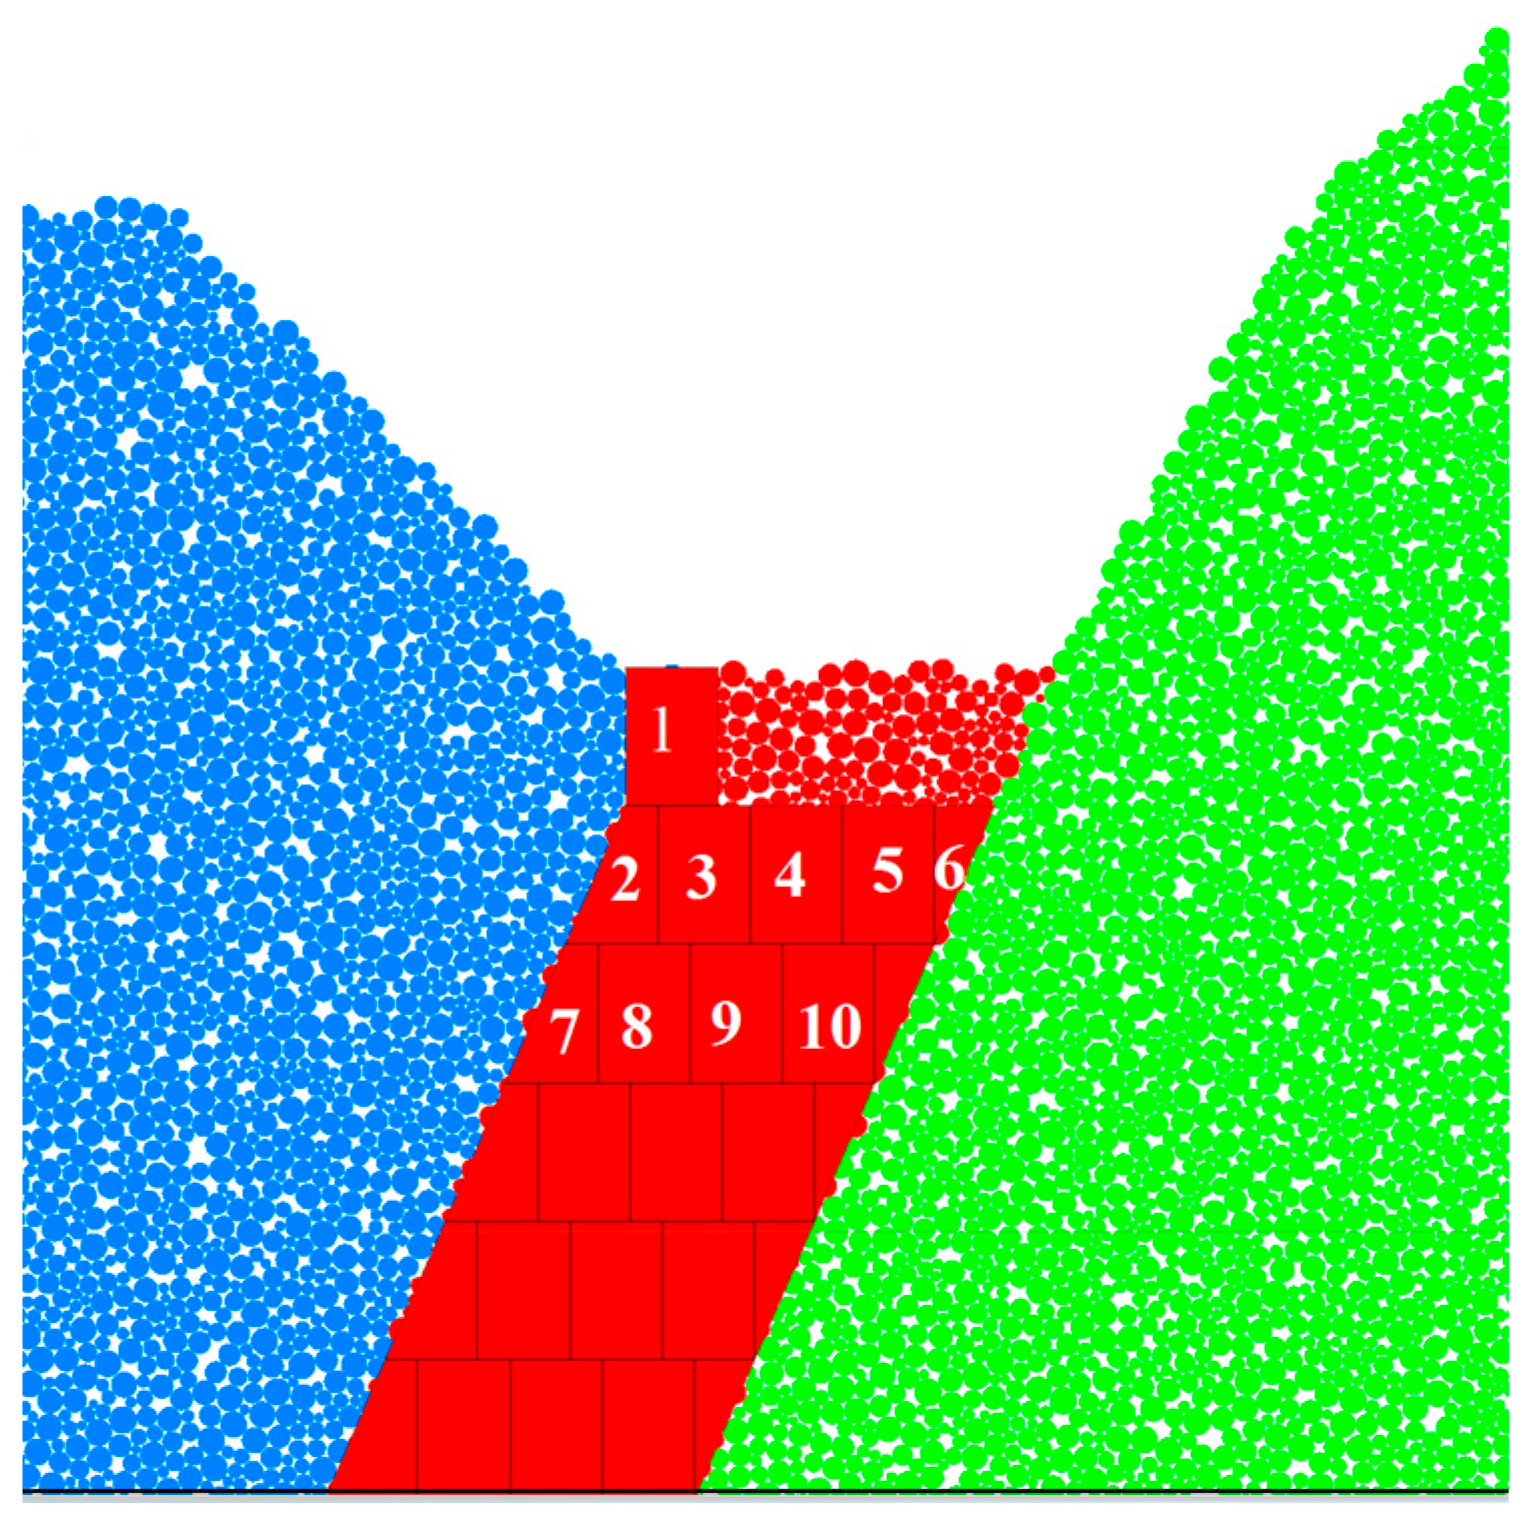
The comparison between Cases A and B shows a clear reaction in the footwall from “changing” the hanging wall strength. The weaker hanging wall in Case B caves more readily, resulting in a wider cave zone (
Figure 9). The wider cave zone entails a lower buttressing pressure on the footwall and the particle un-bonding reaches farther into the footwall, which allows for more horizontal displacements in Case B than in the more confined Case A.
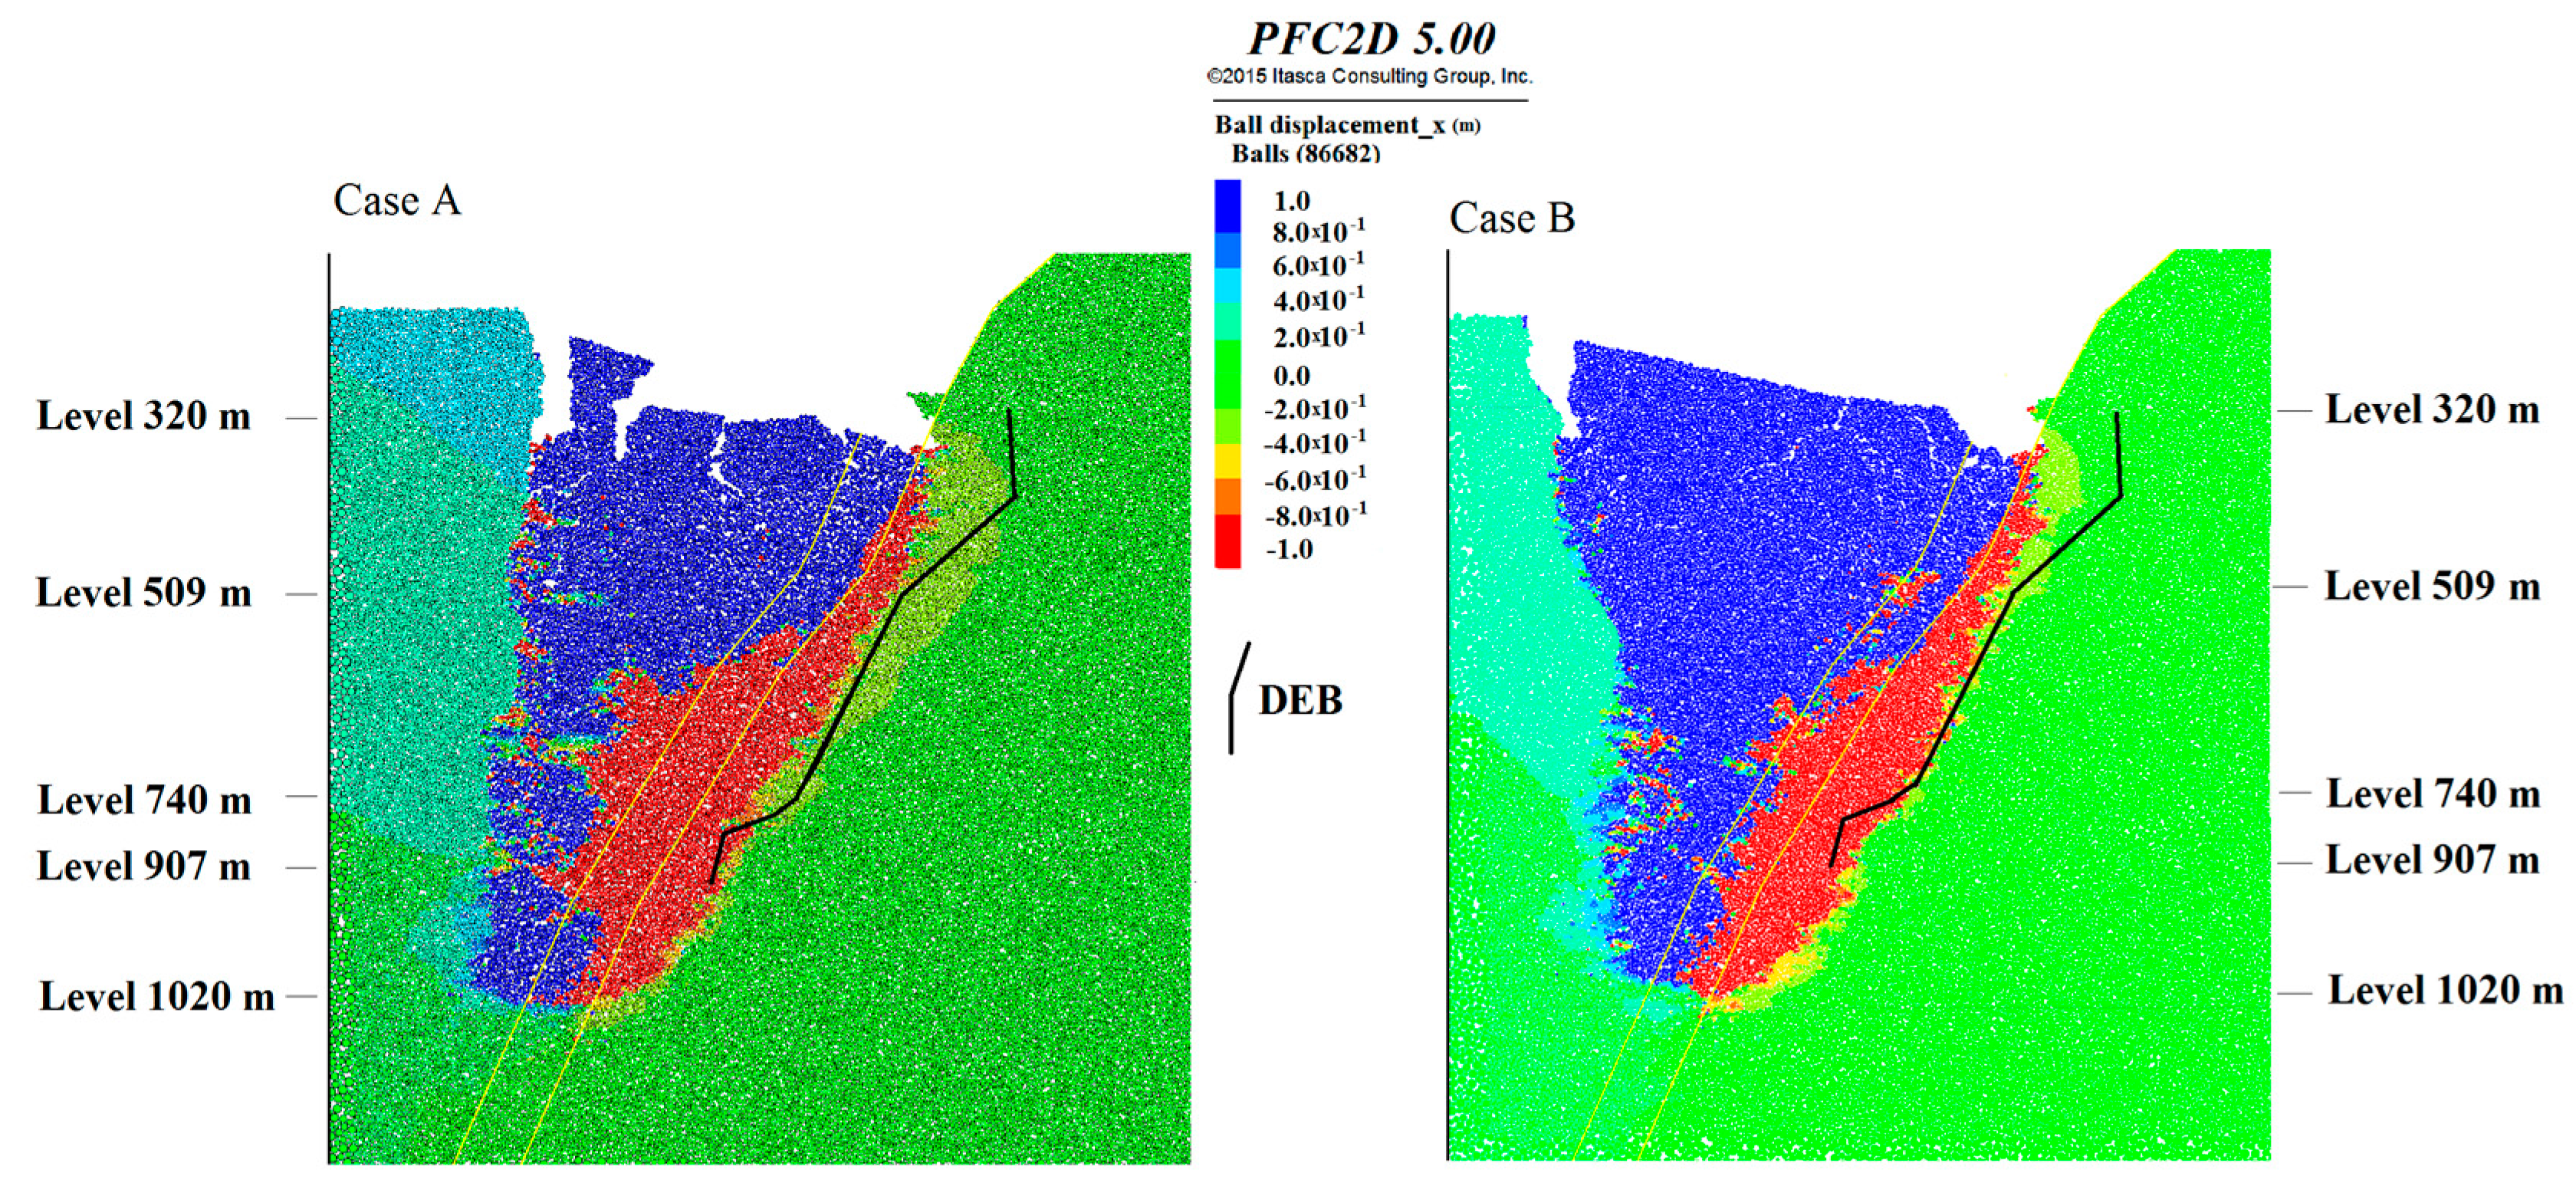
The ground surface subsidence measurements on the hanging wall indicate that the magnitudes of displacements in the numerically modelled cases might be underestimated. However, the deformation pattern indicates the existence of a mobilised zone close to the footwall contact which does not reach the footwall crest. The horizontal components in this mobilised zone are plotted together with the damage extent boundary (DEB) defined by Svartsjaern et al. [
5] in
Figure 10. There is a correlation between the extent of this mobilised zone, the DEB and the unbounded particles in the footwall (
Figure 9) most notably between levels 509 and 740 m. Unfortunately, section Y23 is not accessible between 907 m and the current excavation levels of 993 and 1020 m; the DEB is thus not defined below 907 m. Damage mapping on other sections of the mine indicate that the DEB intersects with the SLC 100–150 m above the production level. The extent of fracturing at depth in the model cases is thus not interpreted as indicative of the current position of the DEB.
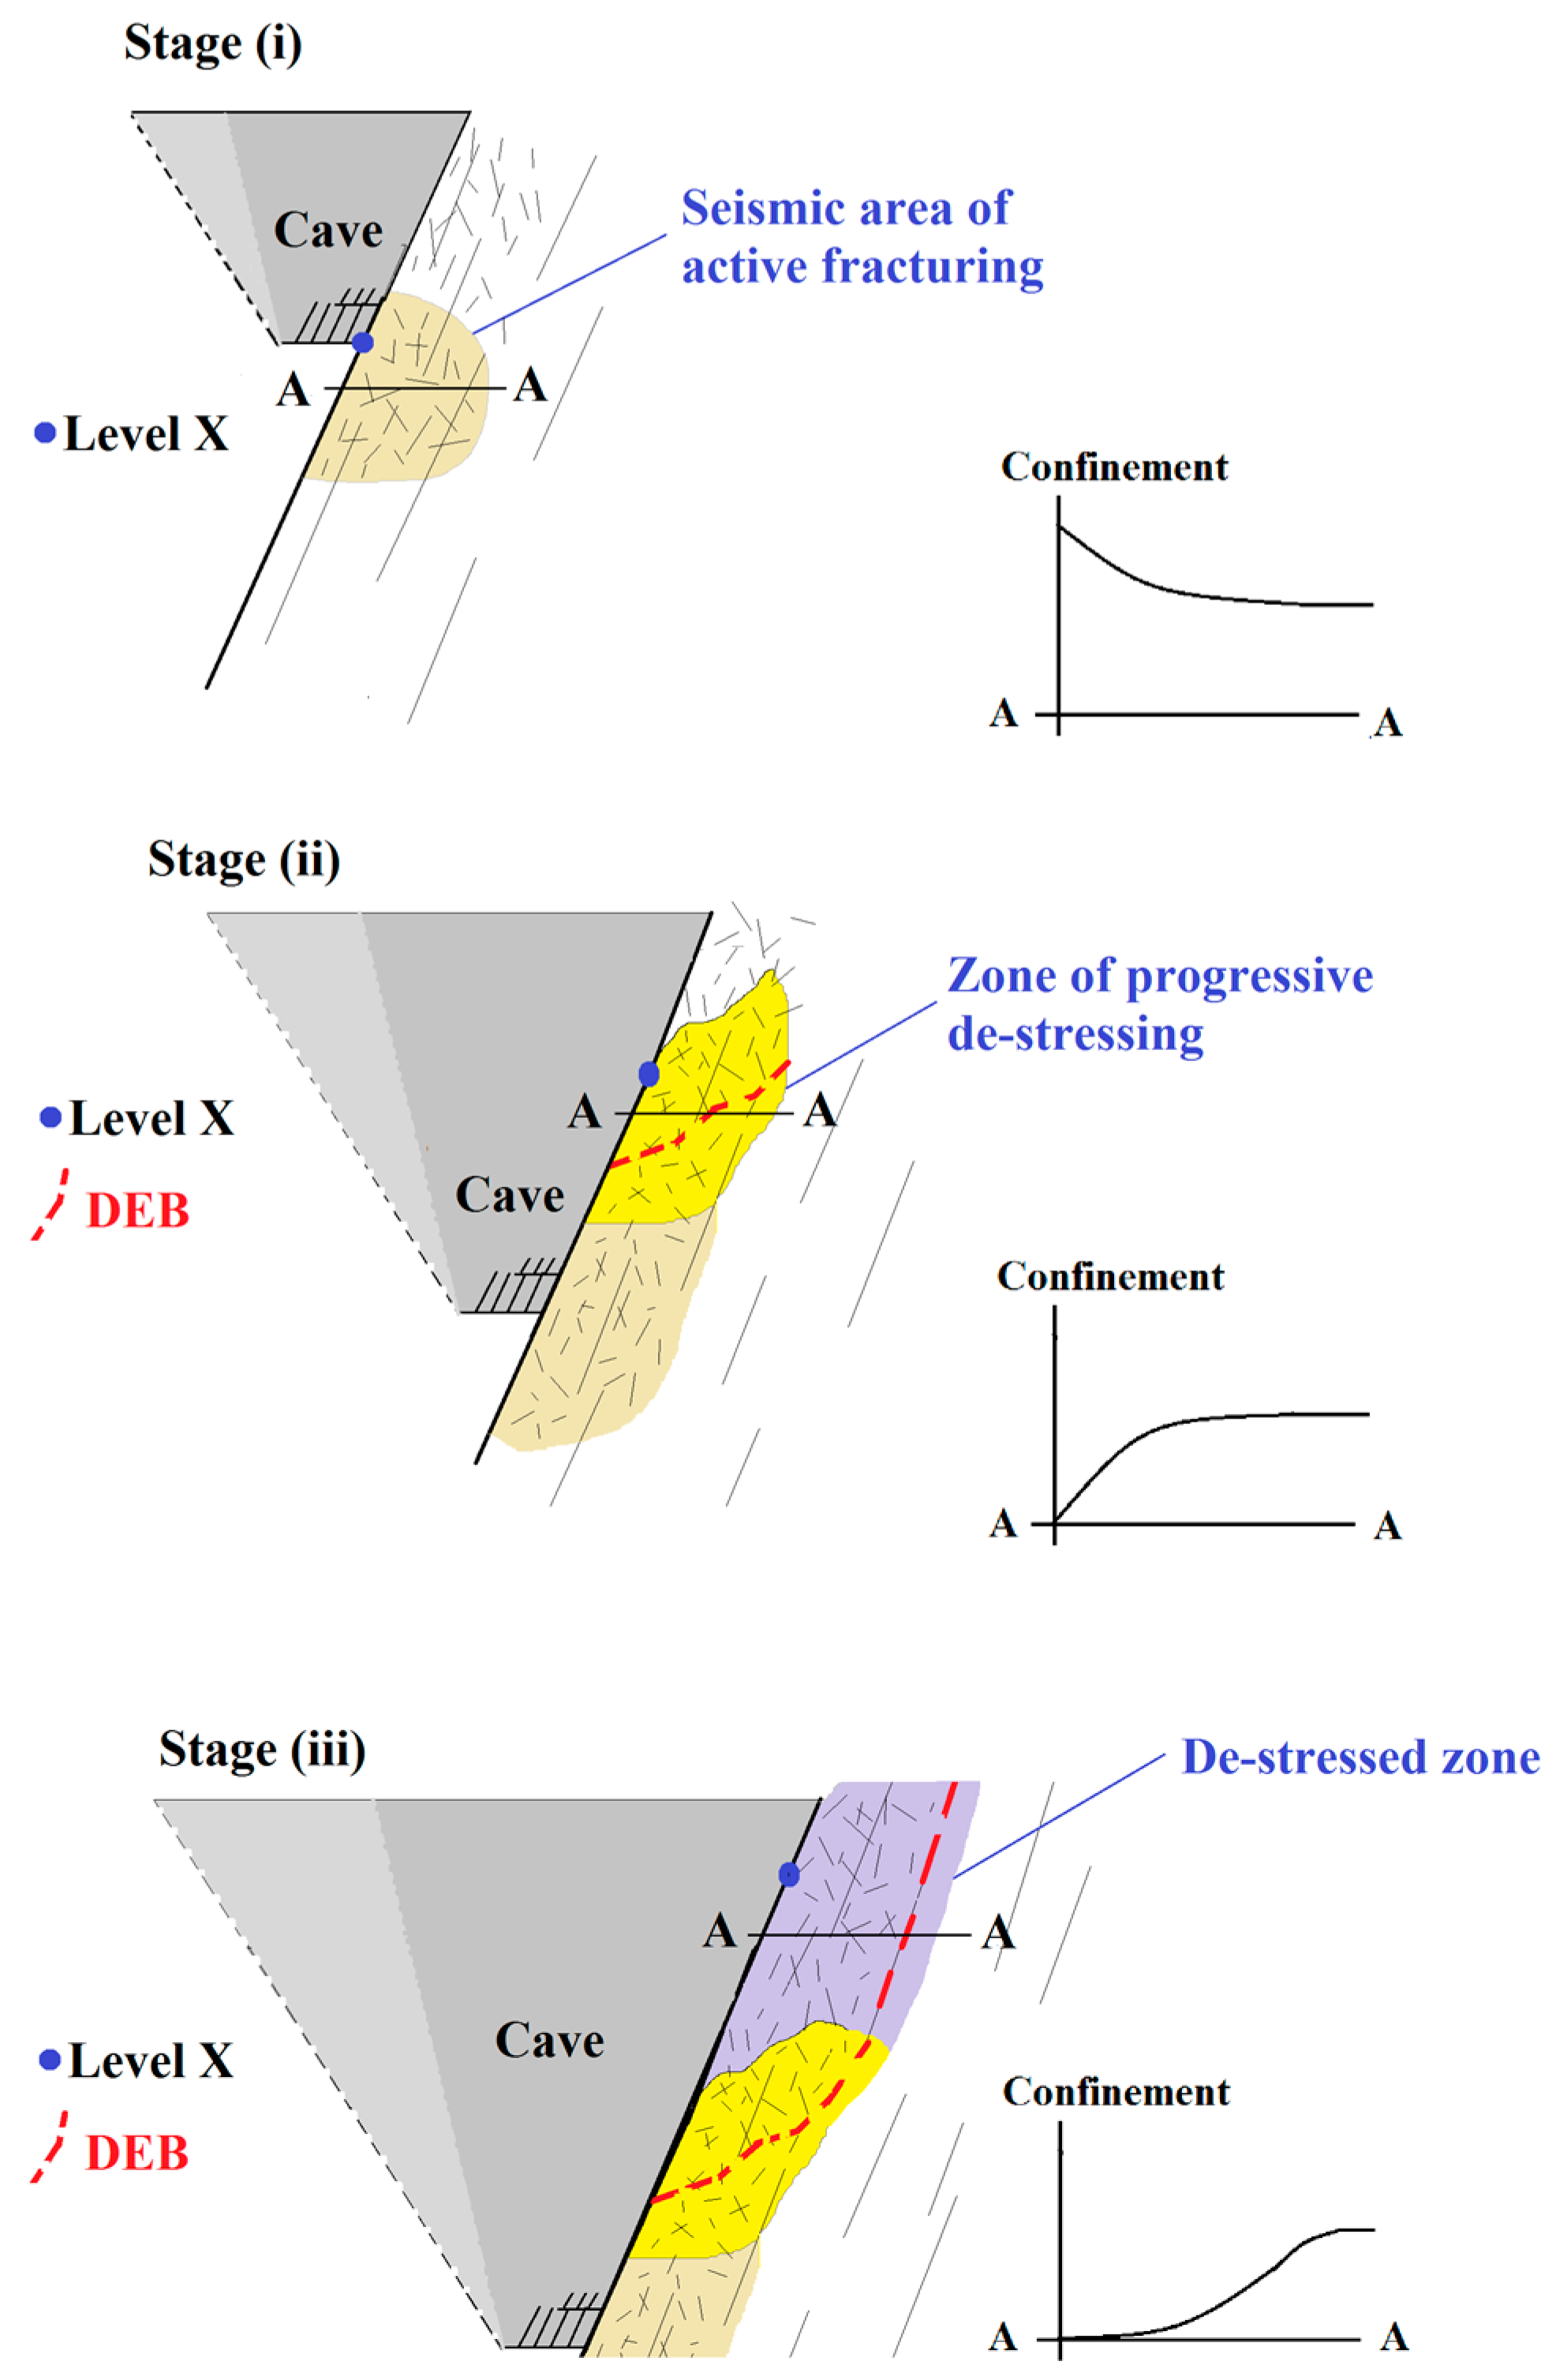
The relation between the active fracturing zone below the production level indicated by seismic records as described by Svartsjaern and Eitzenberger [
27], the extent of bond breakage in the modelled cases, and the development of the DEB are conceptually described in
Figure 11. Rock mass damage primarily accumulates at, and beneath, the production level, but high confining pressures immobilises the blocks. As the production goes deeper, the widening SLC gradually de-stresses the footwall, causing rock falls and other damages in the infrastructure defined by the earlier rock mass deterioration. This evolution path of the DEB clearly advocates the importance of the cave rock backpressure on the footwall stability as the width of the SLC relates to the in-wall depth of the DEB. There is thus a strong argument for including the hanging wall caving behaviour when attempting to forecast damage development in the footwall.
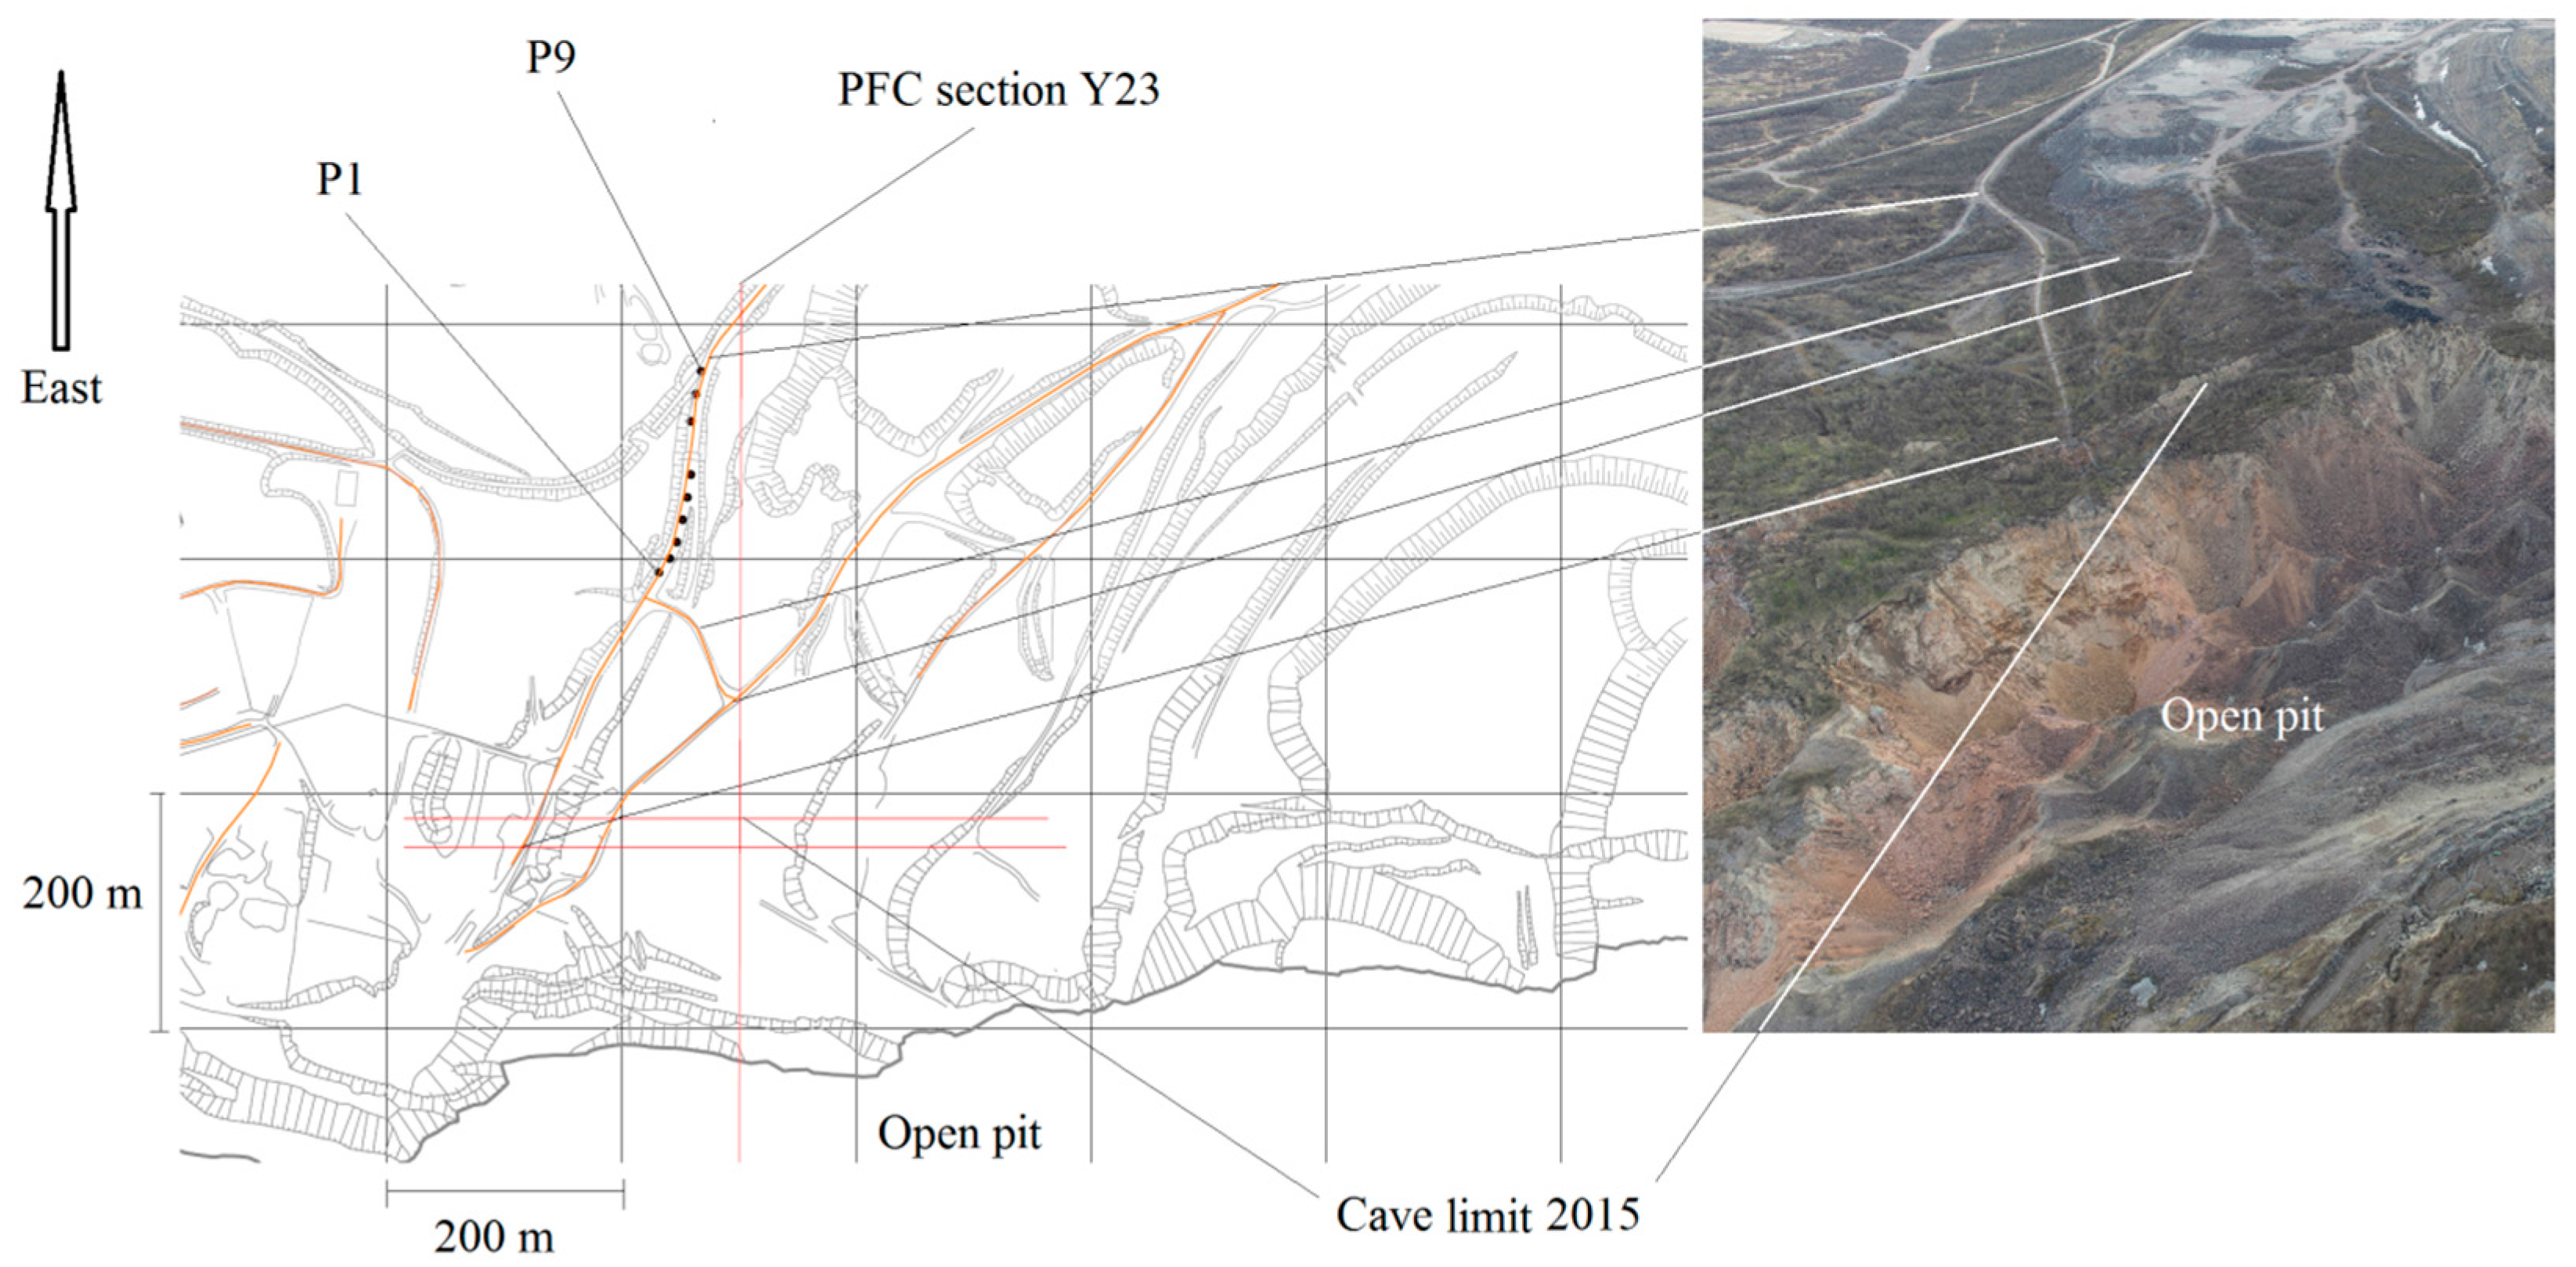
On the hanging wall there is no relevant accessible infrastructure underground; trends in the modelling results are therefore compared to the ground surface response to mining for the two model cases, A and B. The model comprises a 2D section along the east–west X-axis set at Y23; the relative position of this section to the closest GPS subsidence measurement line, the position of the current cave limit, and the nearby surface features are shown in
Figure 12. The closest GPS line constitutes nine individual points designated P1 to P9, where P1 lies closest to the cave limit and P9 farthest away, with the cave limit defined as the western-most point on the hanging wall crest considered stable enough to walk to in the field.
Comparison between the field ground surface observations and the modelling results shows that the full range of the hanging wall behaviour is not well represented in either of the two modelled cases. However, some of the principal trends and mechanisms are replicated by Case A for the current deformation state.
After caving is initiated, Case A shows a tendency towards toppling near the cave limit as slabs of the rock mass matrix cave from the hanging wall in vertical rectangles that rotate into the cave zone, which corresponds the field descriptions by Villegas and Nordlund [
3]. However, due to the use of a non-jointed equivalent continuous in situ material in the models, caving of the hanging wall does not correspond to the start of underground mining. Caving of the hanging wall begins after mining at 630 m (corresponding to roughly 1992) and the location of the cave limit is overestimated by about 100 m compared to the location reported by Lupo [
9]. The Case A cave limit remains stationary until mining at 840 m (year 2004), during which it moves 90 m. Interpolation between the 2015 field cave limit and that reported for 1994 by Lupo [
9] indicates that the Case A cave limit again overestimates the cave limit position by about 100 m. The actual cave limit in the field continues to progress while the Case A limit remains stationary, resulting in the model case and field observation lining up for the 2015 excavation of level 990 m and opening of level 1020 m. Also for Case B, caving beings after mining of several sublevels; again the cave limit location remains stationary for several excavation steps followed by a significant move. The Case B cave limit position is determined by the caving of one single massive block, which overestimates the position for excavation stages. At the current deformation state, Case B overestimates the cave limit position by almost 200 m (see
Figure 13).
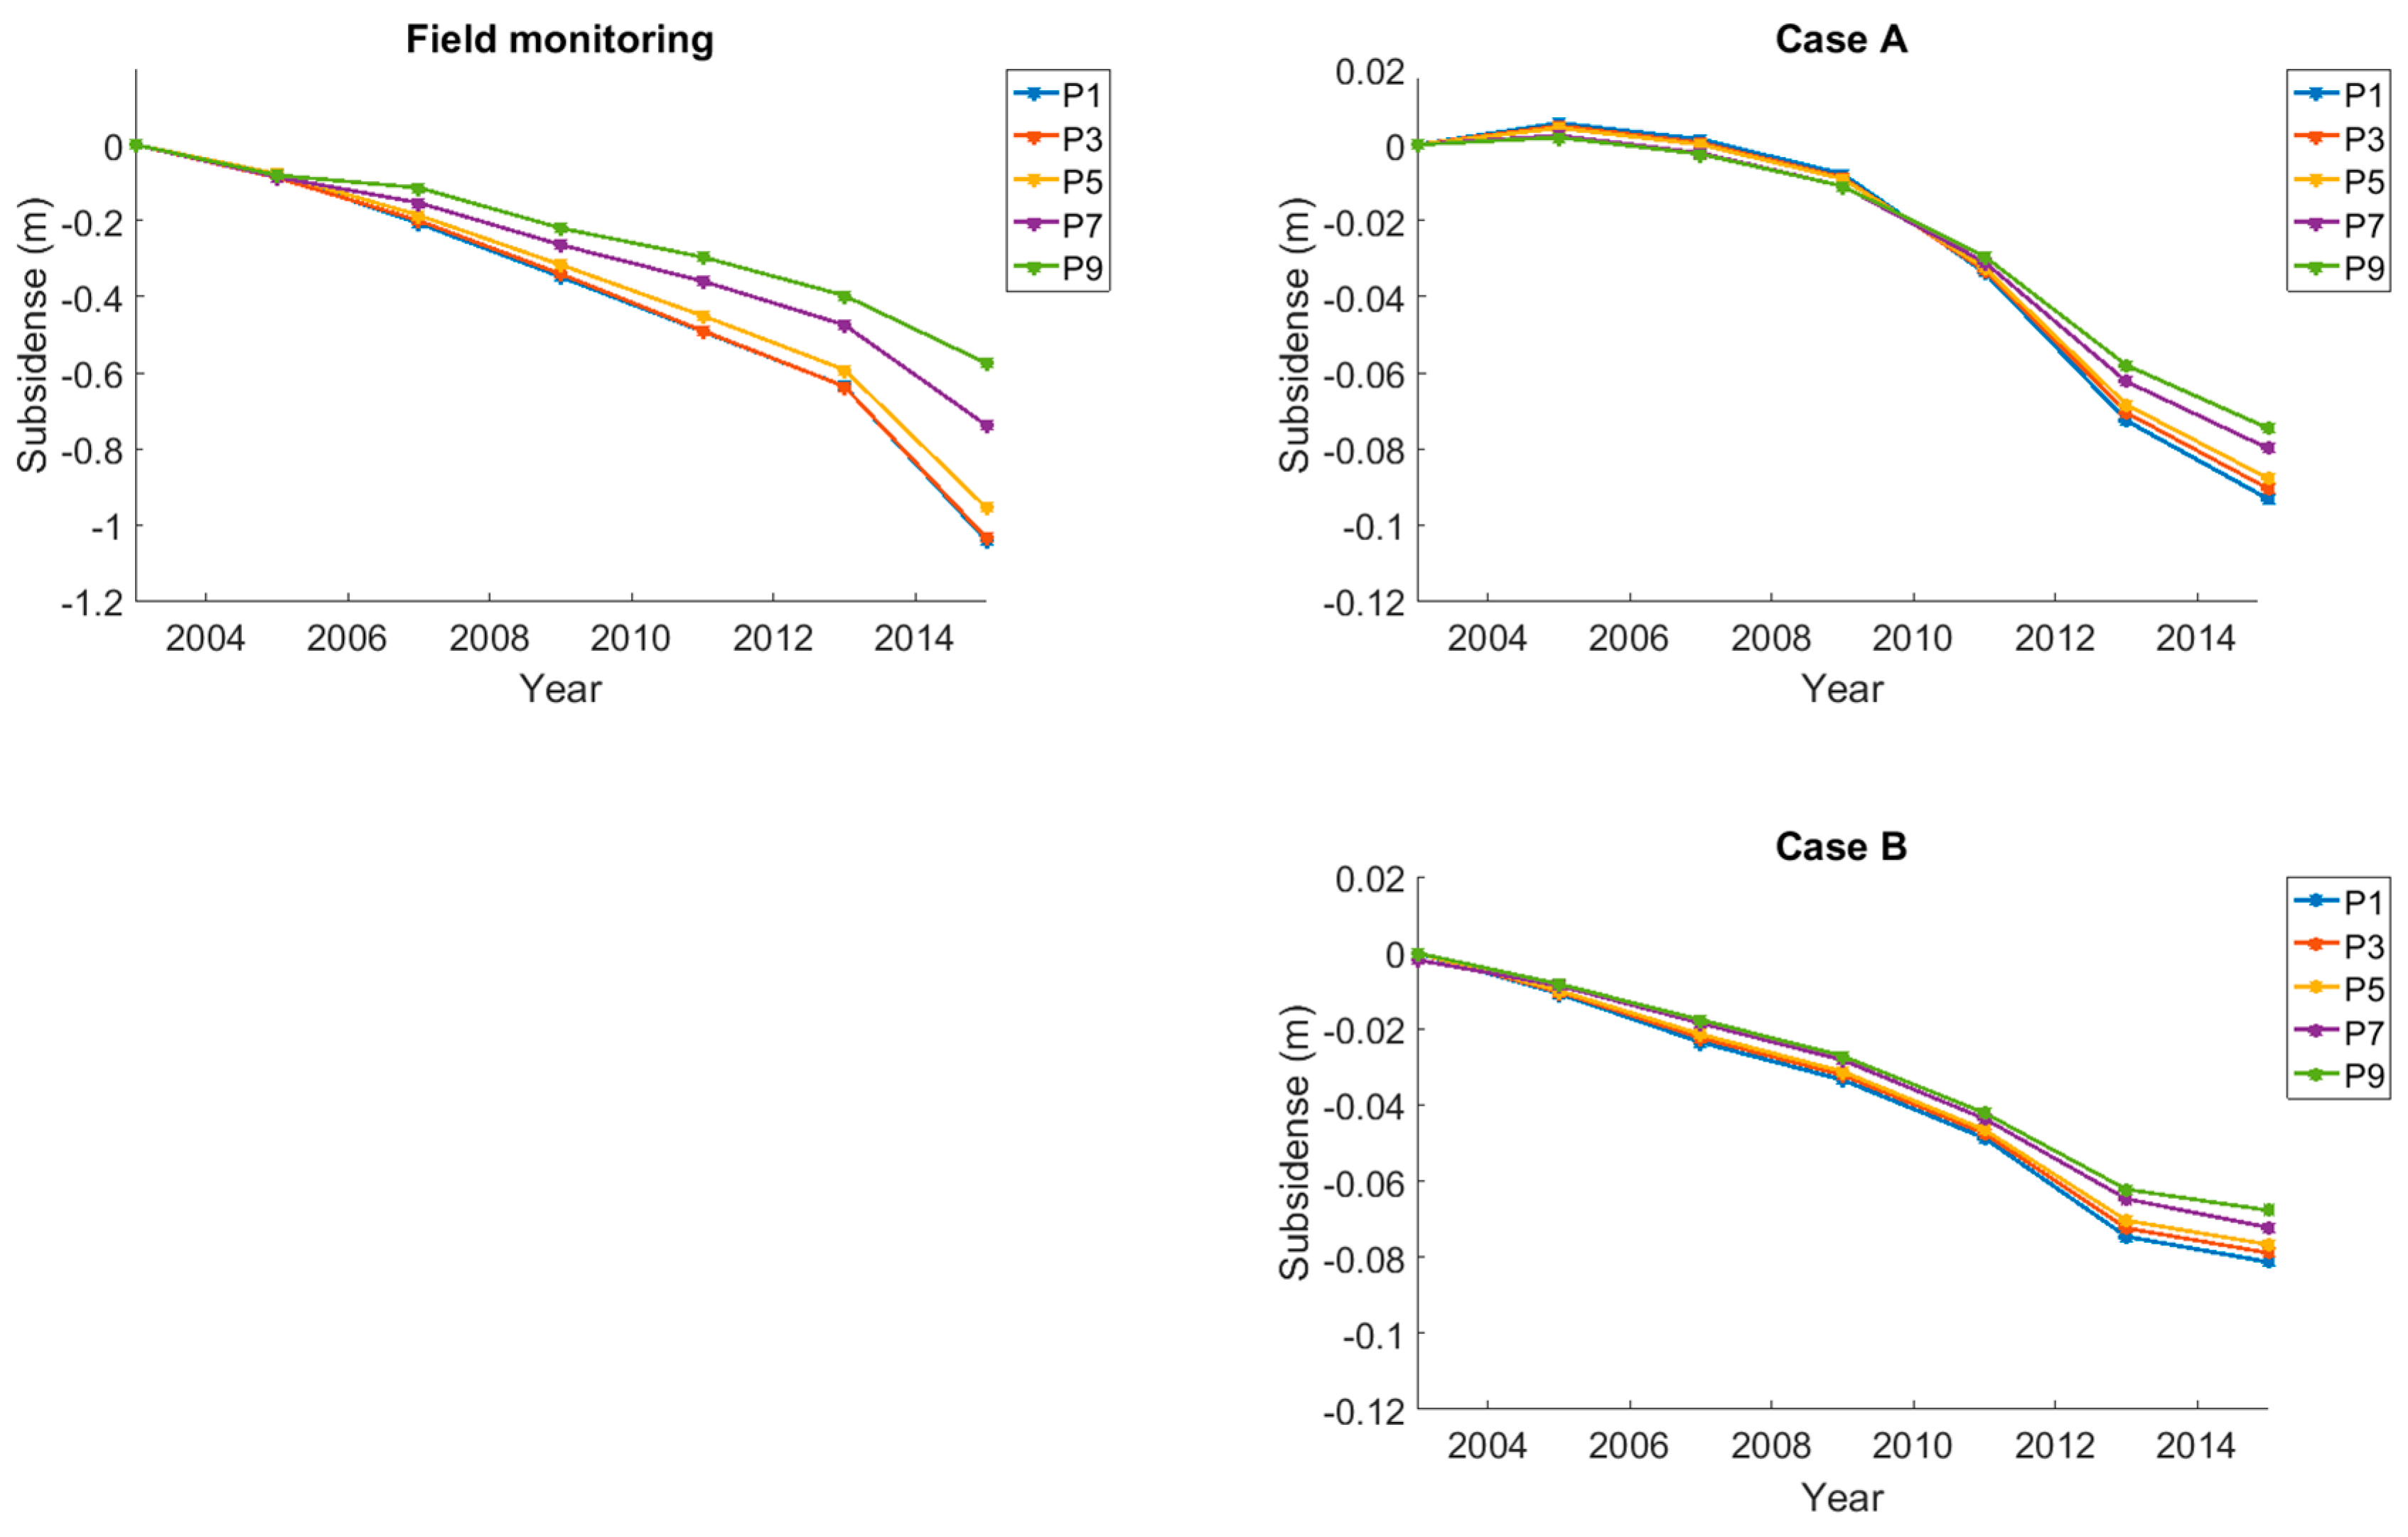
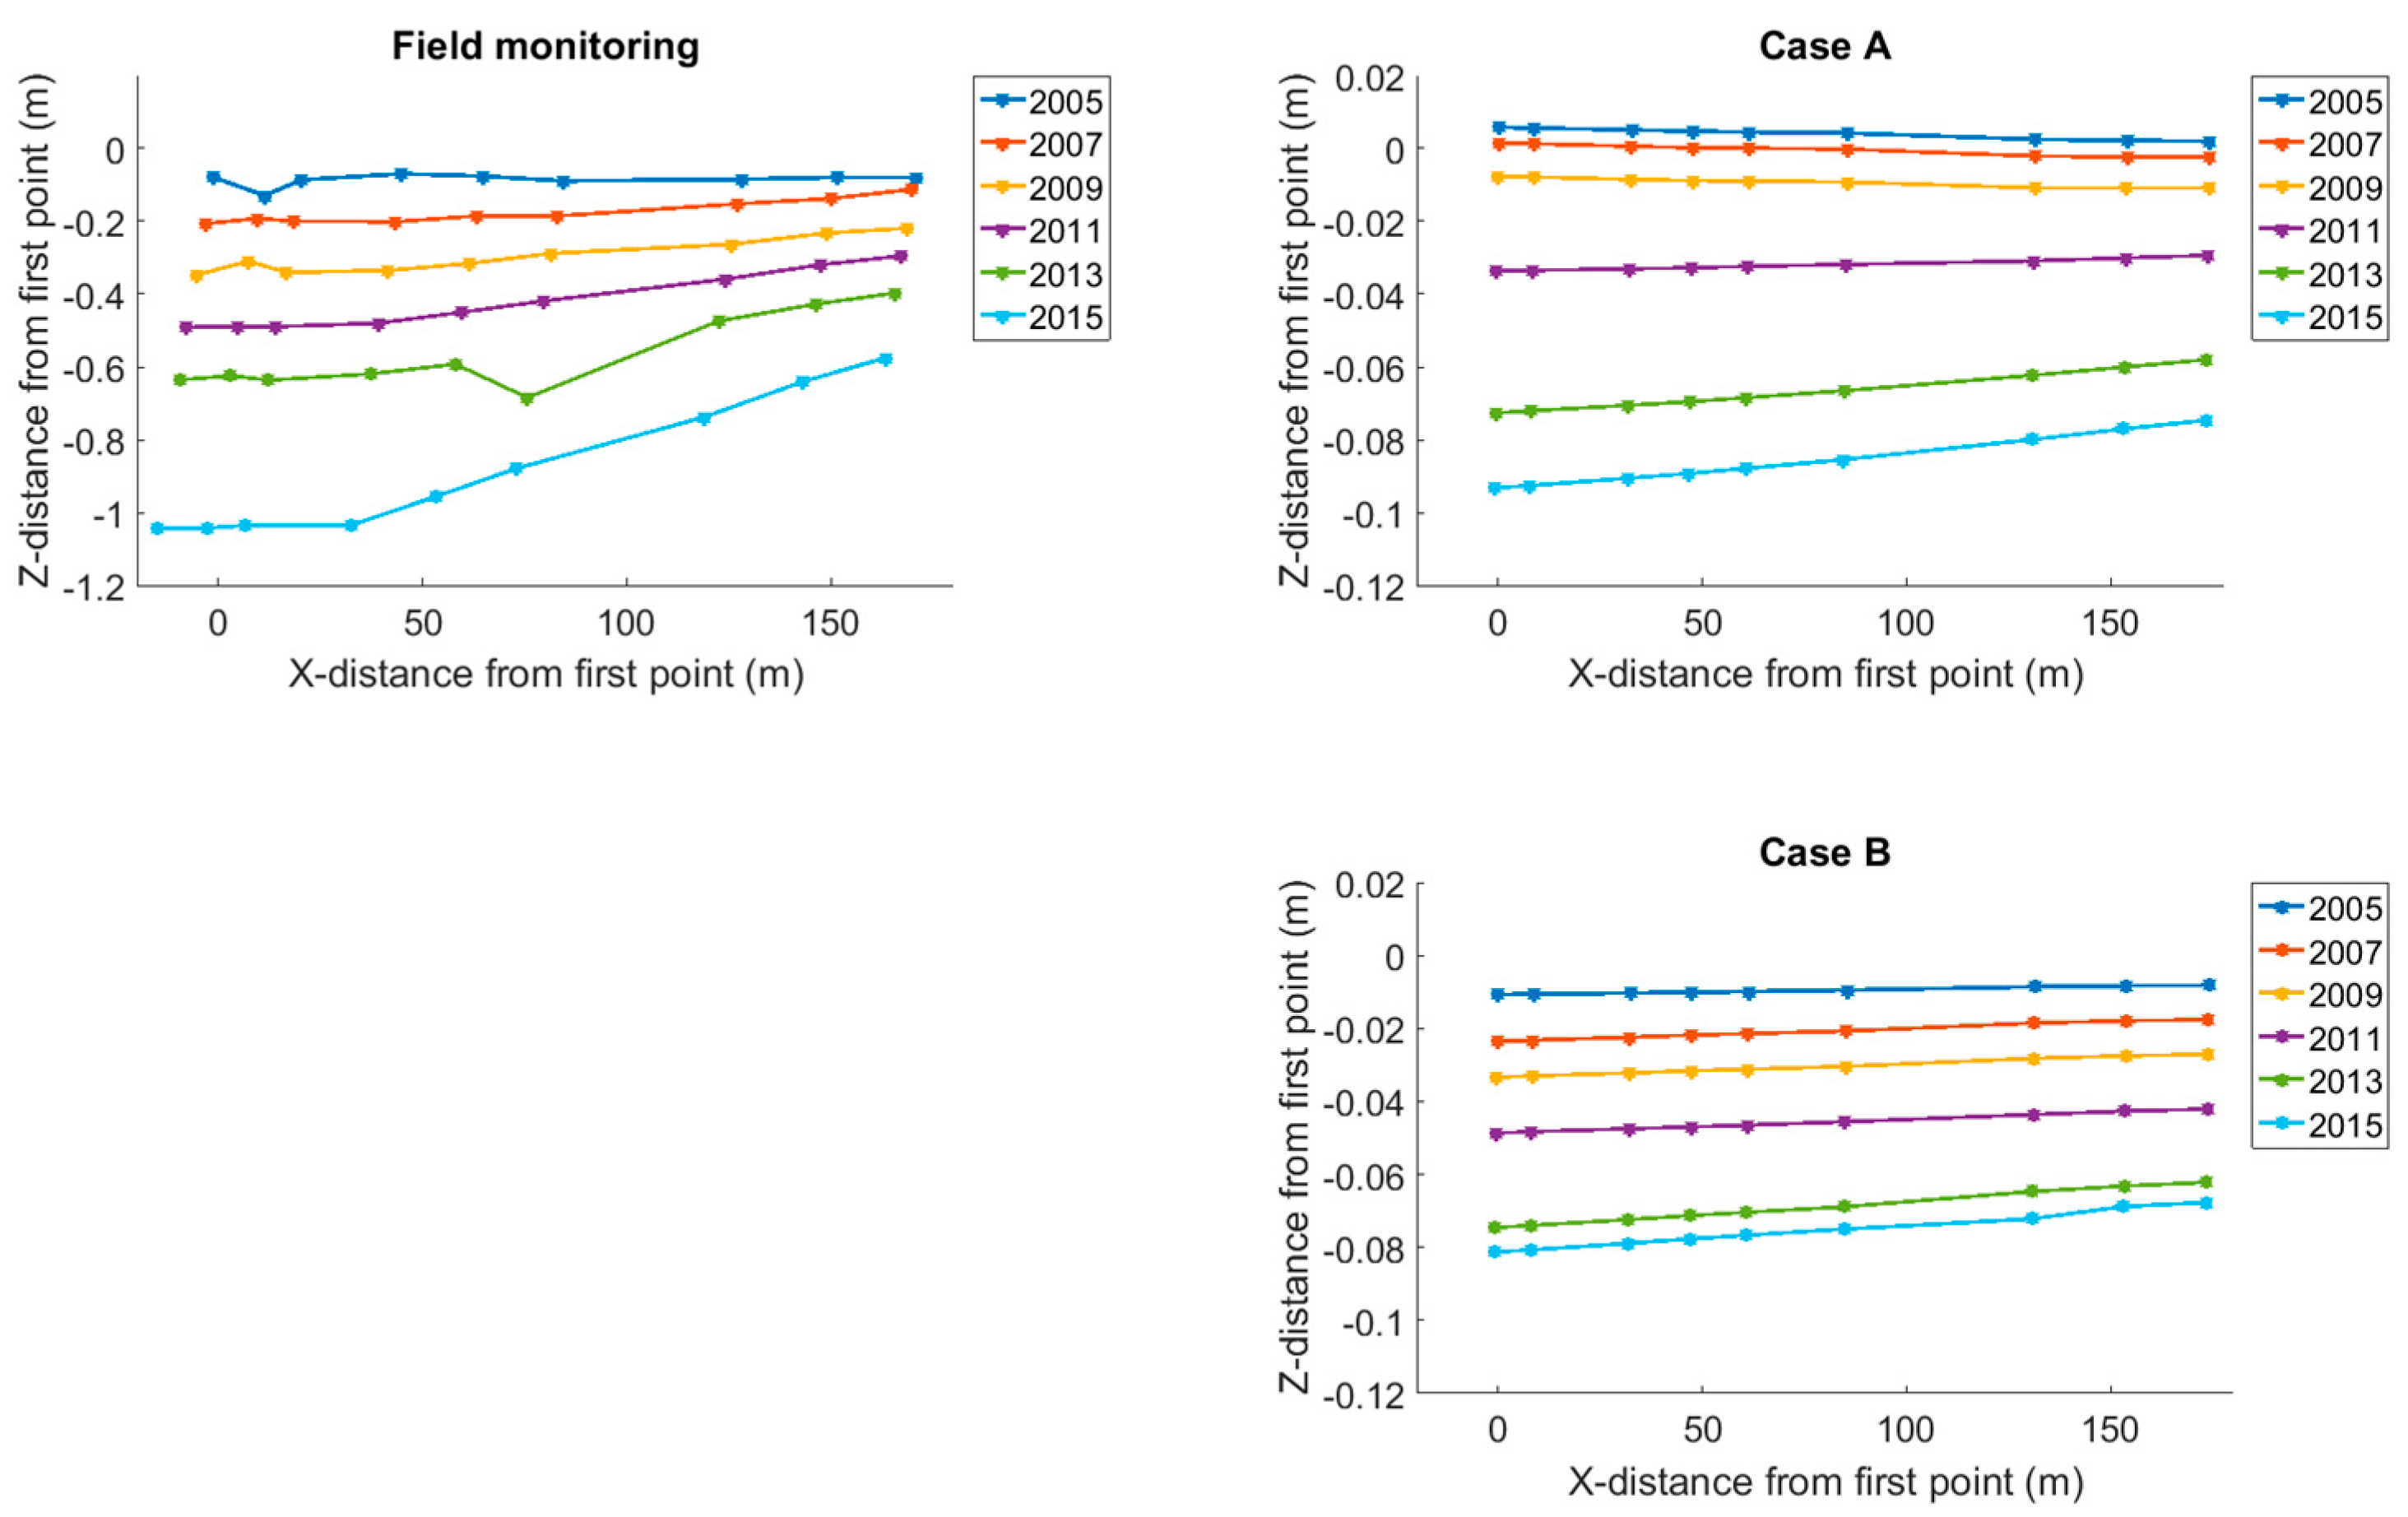
The deformation state in the elastic region ahead of the cave limit at the location of the P1–P9 GPS line for both modelled cases and the corresponding field measurements are shown in
Figure 14 for the GPS line and
Figure 15 for the individual measuring point locations. It is clear that there are similarities in the trends for the three cases (field case and numerical cases A and B), but the magnitude of deformations indicated by the numerical results are approximately 10 times lower. Cases A and B produce similar results but Case A indicates an acceleration of surface subsidence as the mining continues (the curved line in
Figure 15) while Case B indicates steady state subsidence for the same period (the almost-straight line in
Figure 15). The field data for the same period show steady state subsidence between 2005 and 2013, followed by accelerated deformation between 2013 and 2015. All cases (numerical and field) show increasing subsidence when moving along the GPS line from P9 to P1 for the period 2011–2015 (the left-inclined trends in
Figure 14).
5. Discussion
The rock mass parameters used for this study were based on two types of data sources; (i) measurement data, e.g., UCS combined with rock mass classifications from field data; and (ii) back analysis of damage observations reported in previous studies of the mine. It goes without saying that the preferable case would have been to directly input measured quantities into the model and replicate field results. However, due to the scale difference between what is commonly measured in laboratories and in the field (mm to m scale) and the mine scale (hundreds to thousands of m), some features must be scaled, some neglected in the simplification process, and others are simply unknown. To address the scaling issue, the geological properties known for the intact rock and the rock mass classification results were used to suggest plausible ranges for the geomechanical properties from the back-analysed cases.
The rock mass in the modelled cases was represented as a cemented granular matrix (BPM in PFC), initially set up as a homogeneous material that was later allowed to fracture in response to mining stresses. The in situ rock joints were accounted for indirectly by scaling of the target rock mass strength using GSI and RMR values from the field. With this approach the strength reduction of the rock mass relative to the expected strength of an intact rock core sample was achieved but the directional dependence or anisotropy related to the major joint sets was lost. From the results of this study, it is reasonable to assume that this anisotropy might be an important factor in the caving behaviour of the hanging wall as the failure mode of the hanging wall involves the propagation and opening of large-scale discontinuities outlining toppling blocks. However, while not covering the full range of the caving behaviour, the applied PFC model does allow the cave material to form explicitly from the hanging wall caving, which directly models the pressures and internal material flow within the cave zone. The footwall failure mode, which was the primary focus of this study, involves the creation of many short and multi-directionally oriented fractures during stress rotation below and at the production level, making it much less dependent on the coalescence of anisotropic planes. The step-by-step mining sequence applied, in combination with the large number of bonded-particles, was associated with significant computational time. In all, using a high-performance office desktop, the complete mining cycle runs for about three weeks. In a case when the expected failure pattern would be affected more by semi-persistent discontinuity planes with an expected coherent failure surface reaching the ground surface by, e.g., the development of a step-path failure, computation time could likely be decreased by application of a hybrid method such as FEM/DEM rather than a pure DEM approach (e.g., [
28,
29]). This approach is, however, dependent on the quality of the applied DFN [
30].
Two model cases were run to study the impact of the caving behaviour of the hanging wall on the footwall failure. In Case A the hanging wall UCS
rm was set to be equal to the scaled strength of the footwall and in Case B the UCS
rm of the hanging wall was lowered by 30%. While the second, lower, value used in Case B was not derived directly from field data, it is considered to be reasonable from a comparison standpoint as previous studies indicate that the hanging wall is less competent than the footwall (e.g., [
3,
15]). Thus, by retaining the strength values for the footwall and at the same time lowering the values for the hanging wall, the significance of the backpressure from the hanging wall cave rock on damage development in the footwall could be studied by comparing Cases A and B. The possible importance of this relationship for the footwall stability as well as the large number of unknowns related to the cave rock has been highlighted by previous research [
6,
23].
Case A came close to the current in situ hanging wall cave limit, which suggests that the width and flow of the cave rock zone was adequately simulated at the current mining stage. The cave rock zone in Case B was much wider than that suggested by Case A and the field estimate. The comparison of the two modelled cases showed that the extent and pattern of damage in the footwall rock mass are dependent not only on the footwall strength but also on the hanging wall strength. Future studies of rock mass damage in the footwall rock mass thus need to focus on both the hanging wall strength and the footwall strength in any effort using damage patterns as the basis for calibration.
The elastic deformation ahead of caving on the hanging wall was not well captured by either modelled case. Case A arguably replicates the development of steps and chimneys at the inner edge of the discontinuous deformation zone, but does not capture the small-scale tensile fractures forming ahead of the cave limit, as the fractures that do form coalesce rapidly to facilitate the cave limit toppling. The expected transition between the discontinuous and continuous deformation zones, and thus the break angle of the operation, cannot be readily determined for the modelled case. As described earlier, it is plausible that this model limitation is related to the equivalent homogeneous material approach. The anisotropic behaviour related to natural joint planes likely has a significant impact on the near ground surface behaviour of the hanging wall as the material strives to shift towards the cave zone. The lack of such distinct weakness planes means that the model caves less readily and breaks into blocks larger than expected from field observations. This also means that the deformations ahead of caving in the model cases are purely elastic, the plastic component from joint opening in the field is neglected and the resulting deformations are much smaller than the actual response on site.


