1. Introduction
In underground metal mining, goafs form incessantly, and the surrounding rock stress is in uninterrupted disturbance and balance. The tunnel has the risk of wall caving, rock burst, and collapse. Due to the complexity of underground rock, the damage of partial rock may cause a series of chain damage, and thus cause large-scale deformation and collapse of the ground surface.
In the stability of surrounding rock, finite element method (FEM) [
1,
2] has great advantages in the stress–strain analysis of underground engineering rock mass. Considering the heterogeneity and discontinuity of the underground rock mass, FEM can provide the distribution of stress and deformation, and further it can analyze the deformation and failure mechanism of the underground structure approximately according to the stress and strain rule. Cai et al. [
3] simulated the influence of intermediate principal stress in the failure process and strength in boundary rock excavation. Fu et al. [
4] studied the surrounding rock stress–strain evolution rule in the goaf formation process based on similar material model testing and numerical simulation. Therefore, it can be realized that the FEM is appropriate to discuss the stress and strain rule and the stability of surrounding rock during rock mass excavation. COMSOL Multiphysics is a general-purpose software platform based on advanced numerical methods for modeling and simulating physical field problems, which plays an important role in the analysis of geotechnical engineering applications such as tunnels, excavations, surrounding rock stability, and support structures. Zhao [
5] simulated the influence of mining disturbances and crustal stress on rock stress and deformation characteristics by COMSOL Multiphysics software. Zhang et al. [
6] analyzed the stress of the surrounding rock mass around three chambers and the displacement change of several key monitoring points after excavation, and evaluated the stability of surrounding rock mass taking advantage of COMSOL Multiphysics software. Therefore, the COMSOL Multiphysics numerical simulation software and the finite element theory can be used to interpret the stress field and mechanism of surface collapse.
Microseismic monitoring technology [
7,
8,
9] is one of the main means of obtaining rock mass fracture signals. It is widely used in the continuous real-time monitoring of the occurrence, development, and evolution of micro fractures in the rock mass [
10,
11,
12,
13]. Xu et al. [
14,
15] proposed a rock mass damage evolutional model based on microseismic data and conducted a feedback analysis of the left bank slope stability combined with a 3D finite element method (FEM) model. However, mine rock mass engineering is a dynamic stability problem, with the stope space and rock damage constantly changing. The moment tensor theory has already been used to study the types of rock fracture and fracture surfaces in the field of rock mechanics. Feignier et al. [
16] developed an algorithm to invert the moment tensor components to objectively assess the source mechanism of mining-induced seismic events, and obtained the ratio of isotropic/deviatoric components in the source. Ohtsu et al. [
17,
18,
19,
20] used the moment tensor inversion based on P wave amplitude to determine six independent tensor components in addition to studying the application of a moment tensor analysis for acoustic emission (AE) to elucidate crack types and orientations of AE sources. Chang et al. [
21] investigated the mechanisms of fracture and damage to rock, which was induced by the accumulation of micro cracks using moment tensor analysis. Yu et al. [
22] carried out moment tensor analysis to investigate the mechanism of acoustic emission in a rock fracture experiment, with the results indicating that moment tensor analysis may be used as a measurement to reflect the damage evolution of a rock specimen. Hazzard et al. [
23] presented a numerical model as an approach that simulates the cracking and failure in rock and the associated seismicity, in addition to describing a technique for quantifying the seismic source mechanisms of the modeled events. Gasperini et al. [
24] prepared a structured package of FORTRAN 77 subroutines to simplify the management of earthquake focal mechanism data. Vavryčuk [
25,
26] proposed the inversion of the parameters of tensile sources based on the evaluation of the isotropic (ISO), compensated linear vector dipole (CLVD), and double-couple (DC) components in seismic moment tensors. The above studies show that moment tensor analysis has great advantages in researching the focal mechanism. Using the moment tensor theory, we can obtain the type of crack generation and slip direction, allowing for a deeper understanding of the interaction between cracks and the mechanism of the expansion of these cracks. Therefore, using a combination of microseismic monitoring technology, moment tensor theory, and numerical simulation, it is possible to realize the overall understanding of the complex goaf group in the process of mining from the macroscopic rock mass fracture model to the failure mechanism of surrounding rock and the microscopic crack evolution rule. This connects mining and rock damage in time and space, thus providing safety guidance for mining.
In this paper, the occurrence and development of micro fractures within rock mass are firstly obtained by microseismic monitoring technology. Then, the moment tensor theory is used to invert the rock fracture type and fracture surface, and the crack type and slip direction are analyzed, and further, the crack evolution mechanisms are acquired in a roadway chain failure process. Numerical simulation is used to analyze the failure mechanism of surrounding rock. Thus, with a combination of a microseismic monitoring technique, moment tensor theory, and numerical simulation, the overall understanding of the process from rock mass macroscopic fracture to the surrounding rock failure mechanism and the micro-crack evolution rule are obtained.
2. Engineering Background
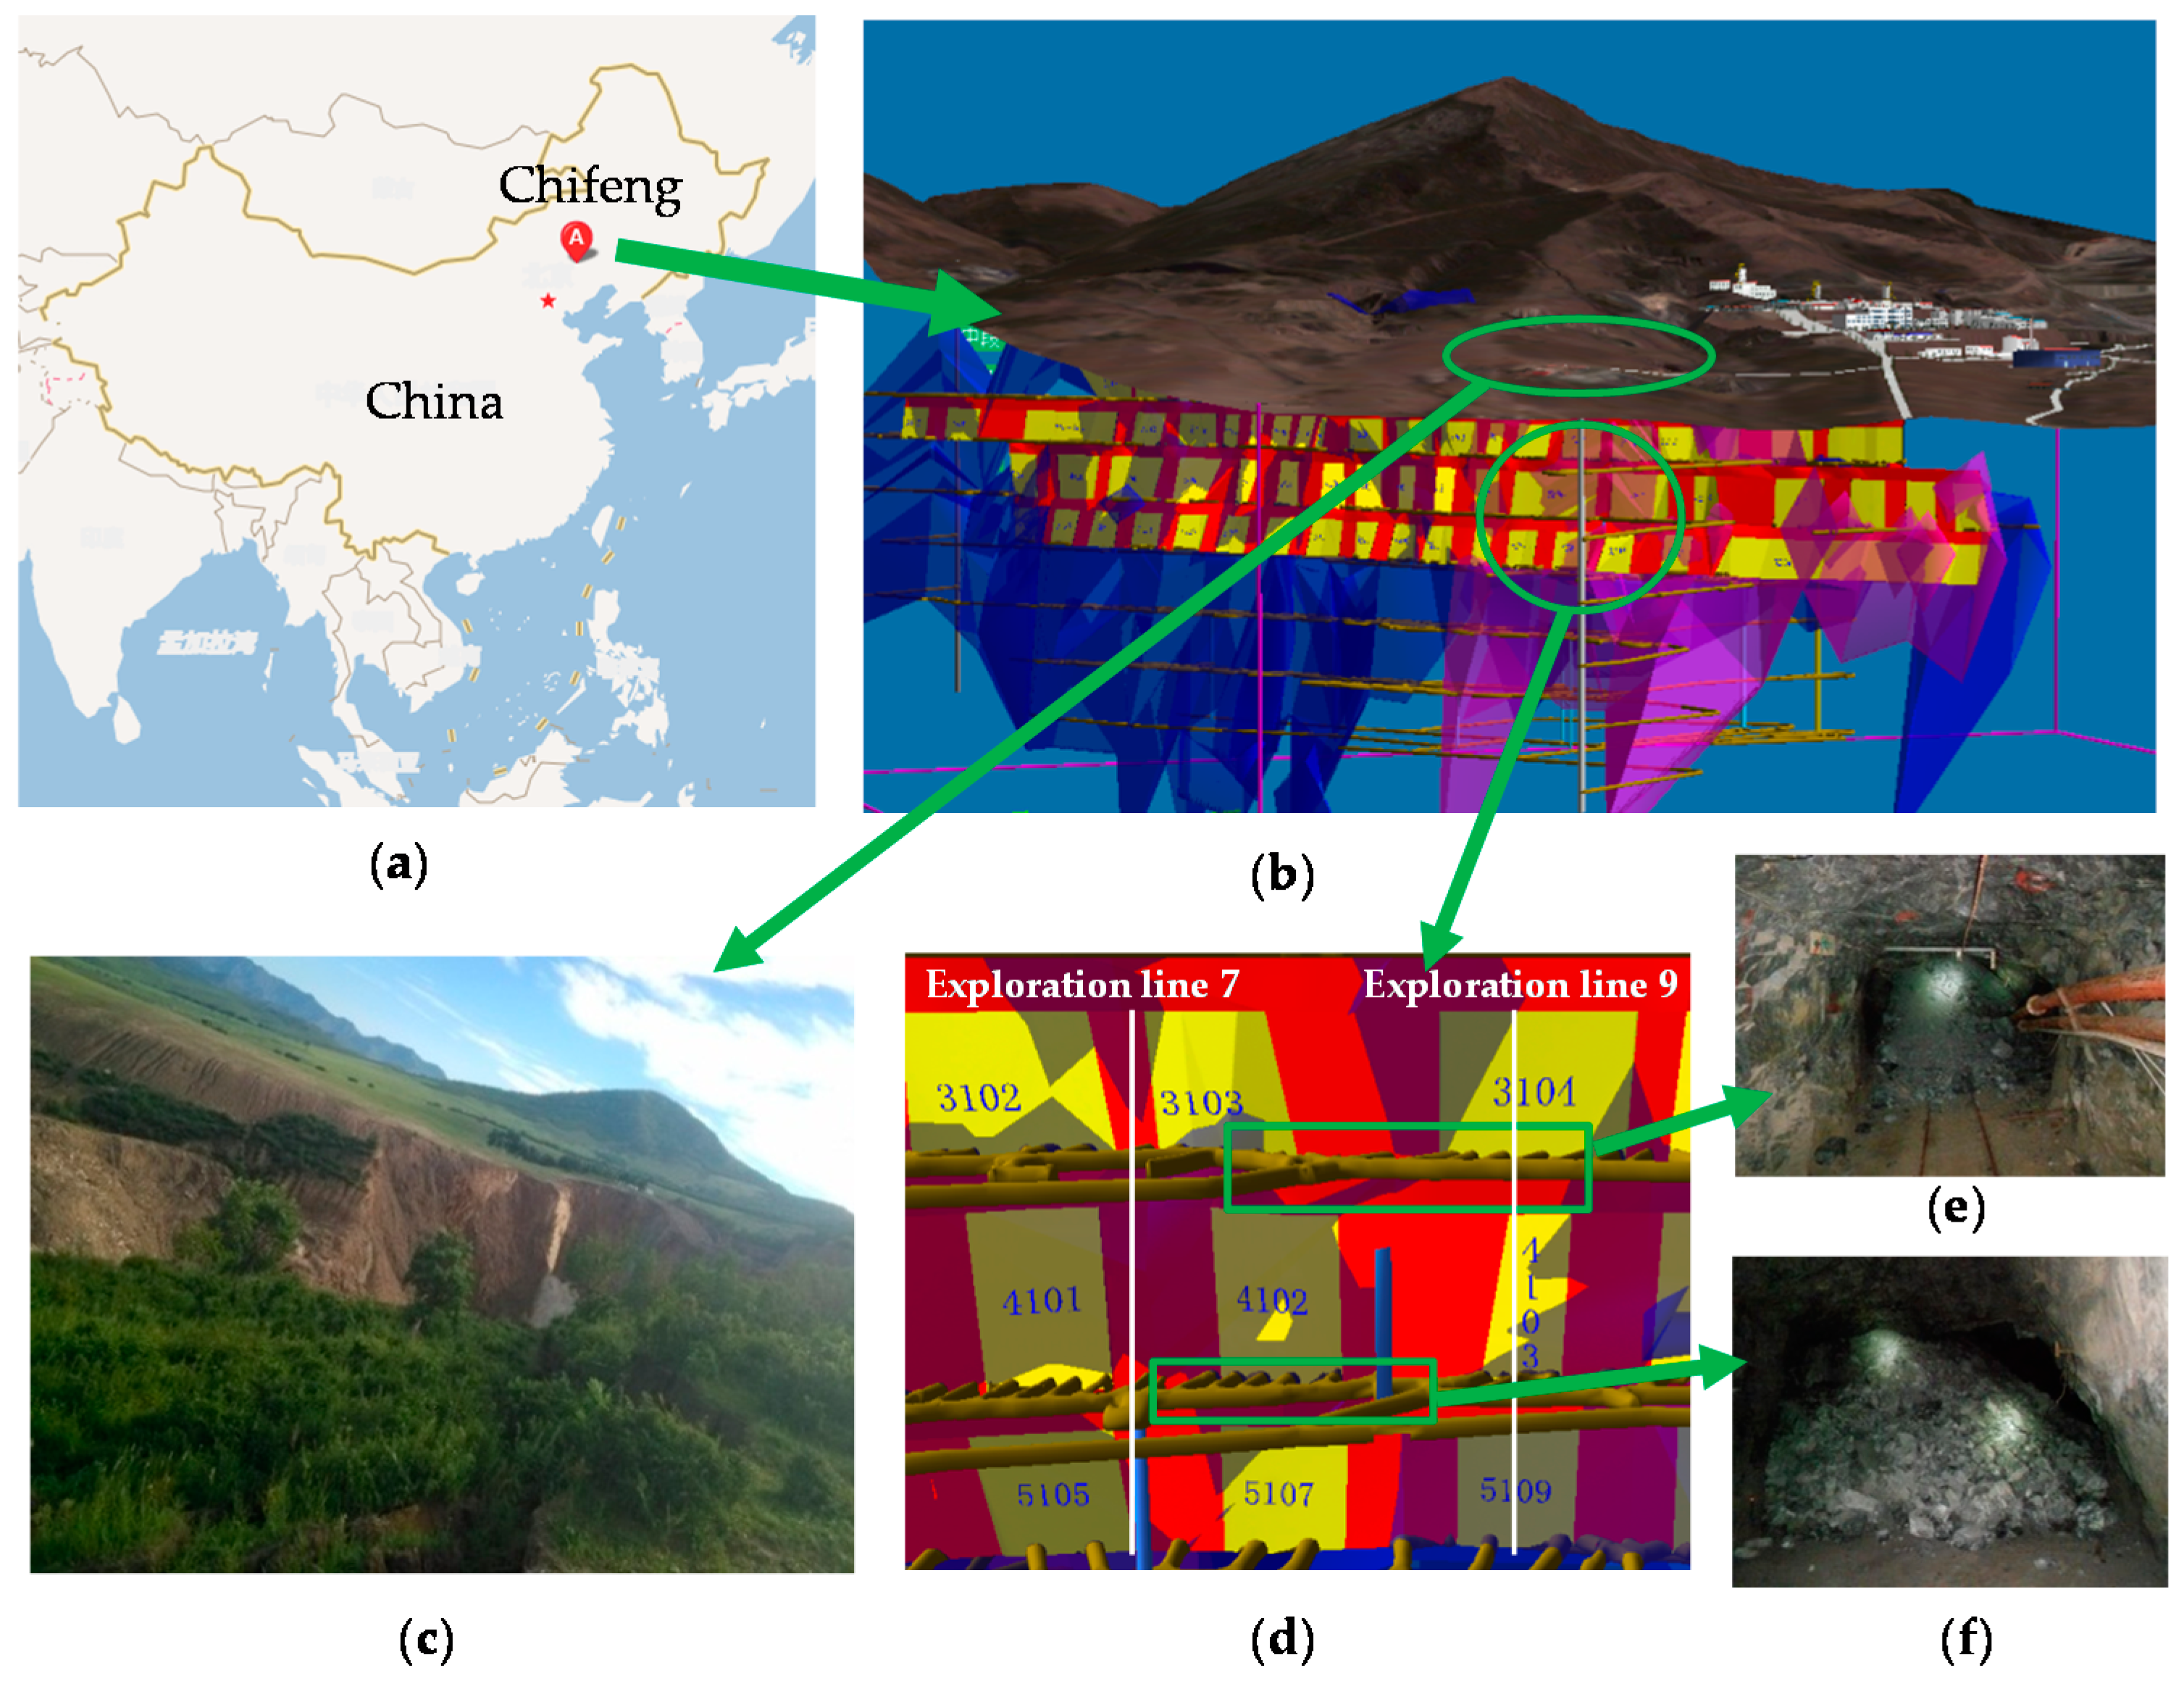
Hongling lead zinc ore is located in Chifeng, China, as shown in
Figure 1a, which is a polymetallic mineral deposit, as shown in
Figure 1b. The length of the mining area is 5.7 km, and the altitude of the mine ranges from 890 m to 1362 m. The vegetation is developmental. The mineral deposit has a length of 1350 m, and it is divided into two ore bodies, named #1 and #2. The mineral deposit strike is north by east 60°, with the dip direction of north-west and the dip angle ranging from 70° to 80°, and the surrounding rock is slate and skarn. The ground surface allows collapse.
The ore bodies are divided into eight sublevels of 50 m each. The upper four sublevels have already been mined and are recovering pillars; the fifth and sixth sublevels are mining rooms. There are large areas of collapse in the ground surface between the #1 and #2 ore bodies during pillars recovery, as shown in
Figure 1c. The collapse areas are close to the industrial factory buildings with straight-line distance less than 200 m, so there is a very high potential risk of collapse. With the mining activity, the deformation of surrounding rock and the area of surface collapse will increase, which will threaten the safety of the surface industrial factory building and will have unimaginable consequences once collapsed. The footwall haul road in the +905 m level and footwall haulage way the in +955 m level had already collapsed when the 5107-pillar recovered, as shown in
Figure 1d–f. The collapse not only influenced the mining scheduling, but also caused a high potential safety hazard.
Thus, the main problems for mine managers that must be solved are: how to analyze the failure mechanism of the collapse area effectively, how to deeply study the influence of mining activity, and how to acquire the fracture precursor signal beforehand.
2.1. Moment Tensor Theory
A seismic moment tensor is a quantity that depends on source strength and fault orientation [
27,
28]. It characterizes all the information about the source that can be learned from observing waves whose wavelengths are much longer than the dimensions of the source. When the focal dimension is considerably less than the observation distance and seismic wavelength, the focus can be seen as the point source. The focal inelasticity deformation behavior can be described by a moment tensor, with the waveform displacement amplitude
uk received by monitoring terminal
k expressed as Equation (1):
where * is the convolution operation and
Gki (
x,
t;
ξ,
t’) is the Green’s function in the elastokinetics, which is a displacement field caused by unit impulse concentrated force. Green’s function is an effective tool to help solve complex linear differential functions [
27,
28].
x is the monitoring point,
t and
t’ are the instant time, and
ξ is the location of the focus.
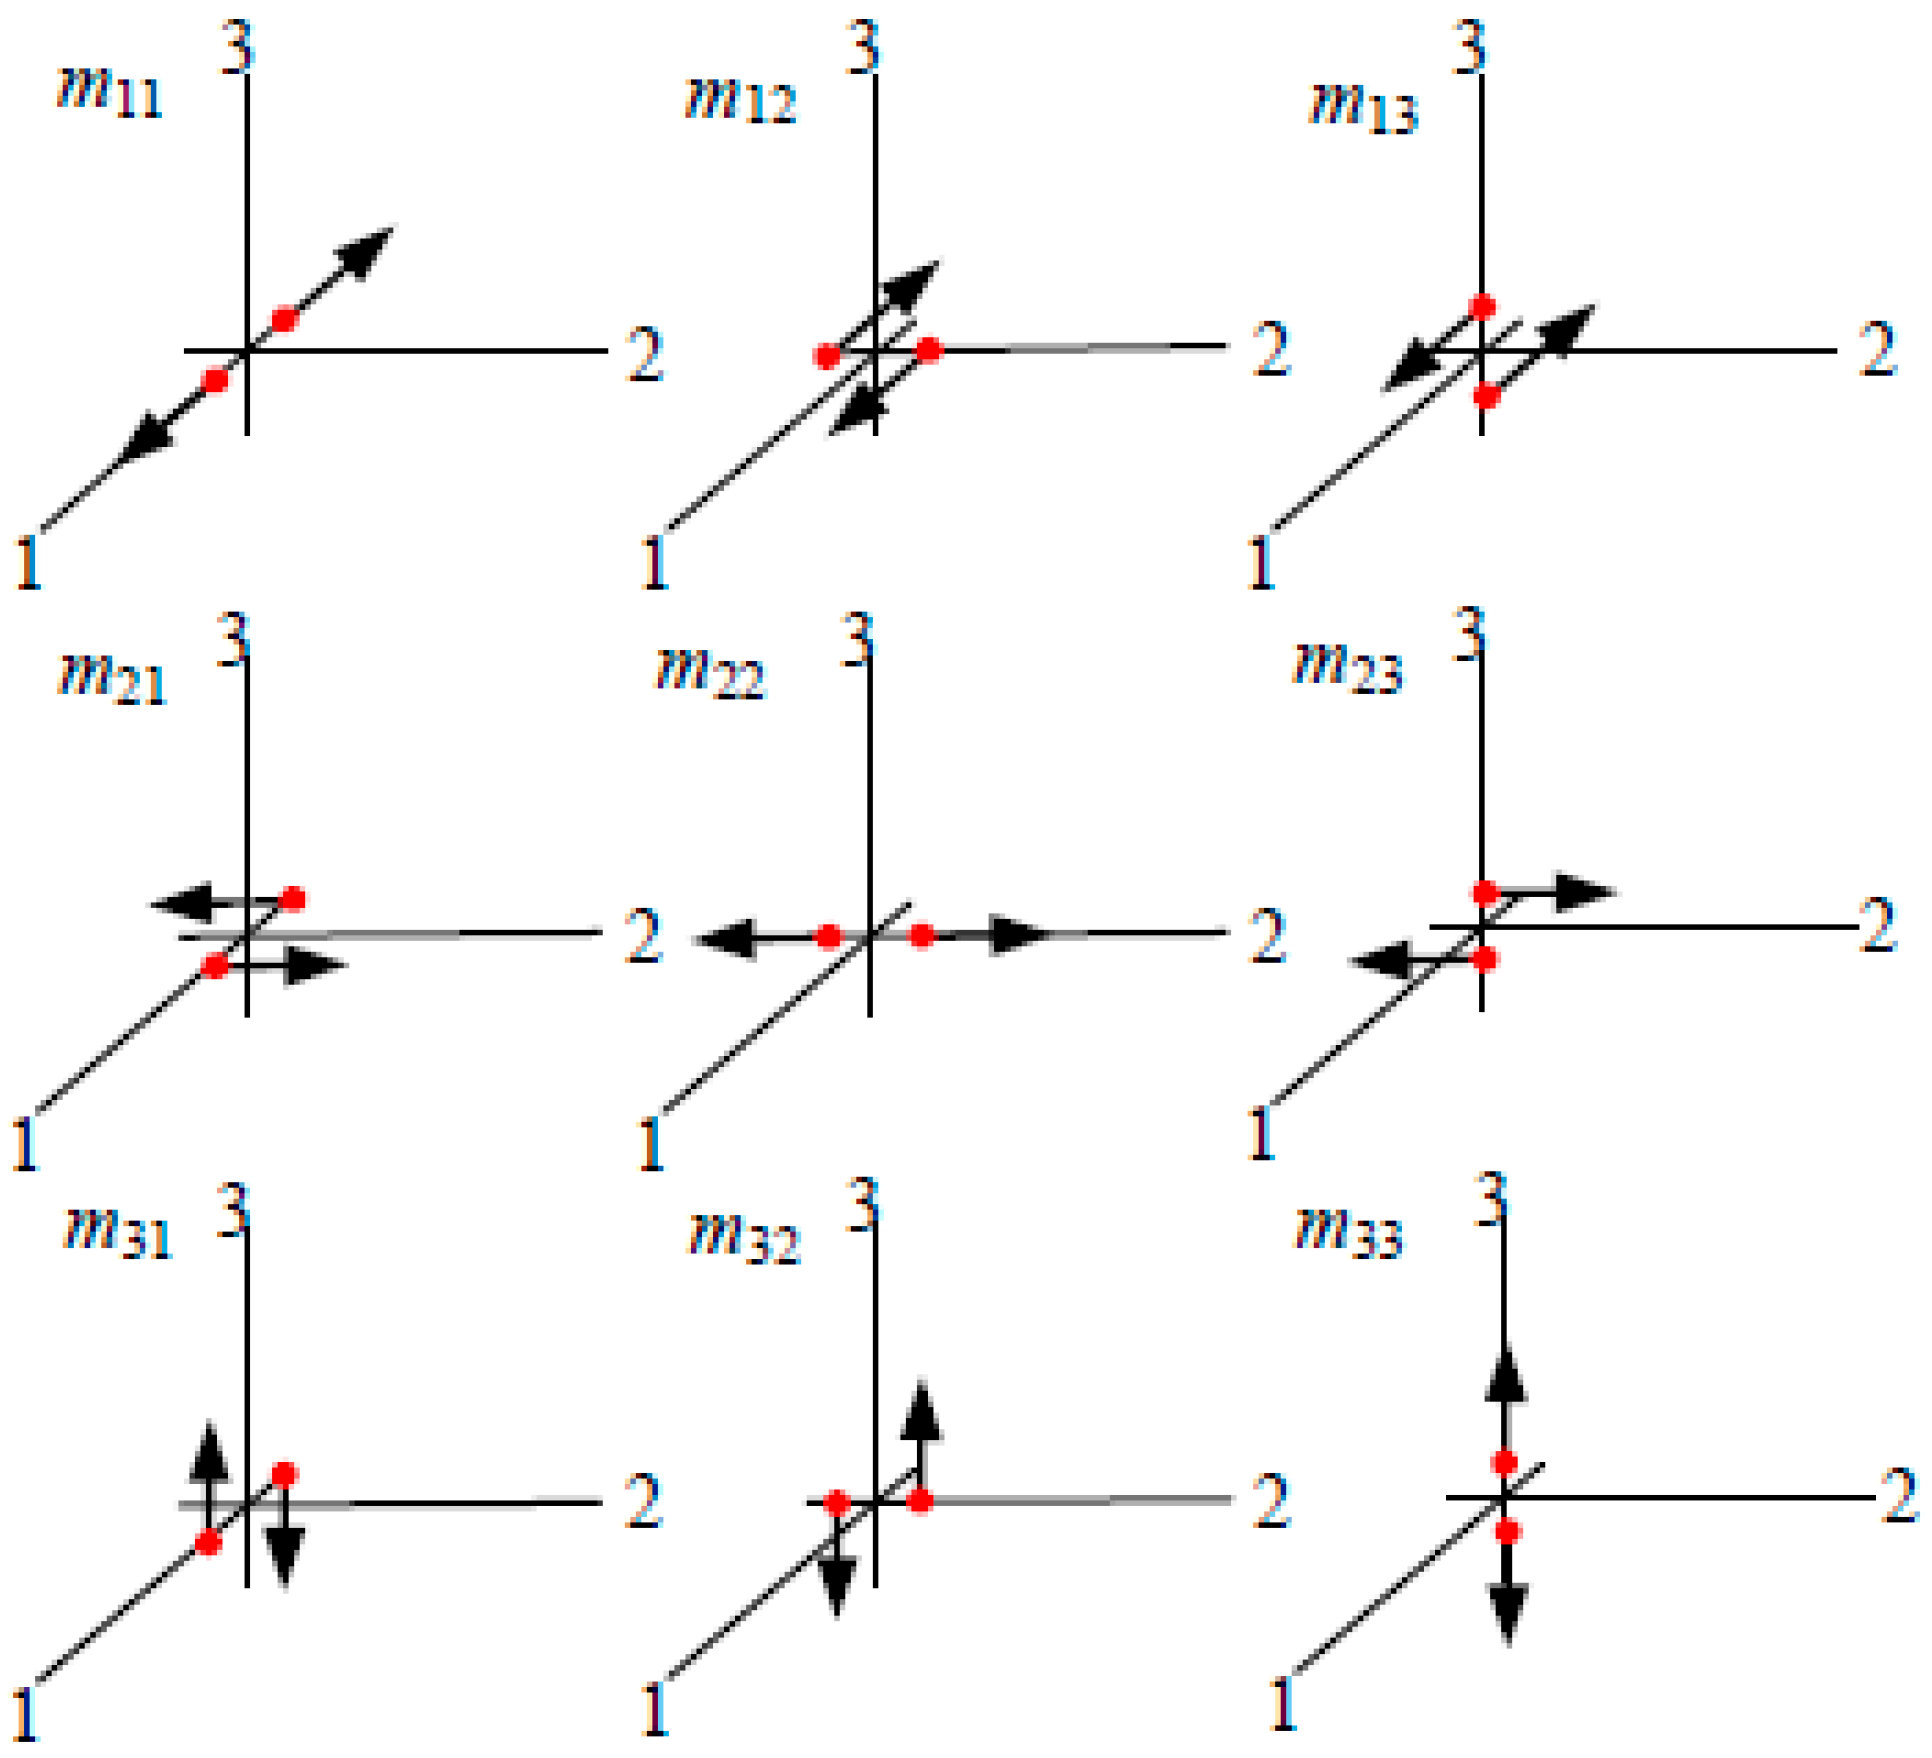
Mij is the focal moment tensor, and can be expressed as Equation (2):
where
mij is the constant, and represents the component in the secondary moment tensor. If
i = j, the force and the arm of force are in the same direction, which represents a no-moment single couple. If
i ≠ j, the force acts in the
i direction, and the arm of force acts in the
j direction, which represents a single couple with the moment of force
mij.
Figure 2 shows the secondary moment tensor components sketch map [
27]. Because of point source angular momentum conservation, the moment tensor turns into the secondary symmetry tensor and has only six isolated components of nine components. Assuming that the focus is the synchronous source, which means all moment tensor components have the same time function
s(t’
), then Equation (1) can be expressed as Equation (3):
where
s(t’
) is the source time function, which represents the information of source time and intensity. Assuming that the action time of the equivalent force is transitory as a pure impulse function, then
Gki,j(
x,
t;
ξ,
t’)
δ(
t’) =
Gki,j, and Equation (3) can be expressed as the linear Equation (4):
Crack types are obtained by the moment tensor. The method is proposed by Ohtsu [
20]. Through Ohtsu, the eigenvalue can be decomposed into a shear component
X, a hydrostatic component
Z, and a deviatoric component
Y. According to the normalization with the use of the first (maximum) eigenvalue, the different eigenvalues are represented as follows:
where
λmax,
λint, and
λmin are maximum, intermediate, and minimum eigenvalues, respectively. The cracks are classified into three types of micro seismic sources:
X > 60% as shear cracks;
X < 40% and
Y +
Z > 60% as tensile cracks, and 40% <
X < 60% as mixed-mode cracks.
2.2. Parameters of Microseismic Monitoring System and Numerical Simulation
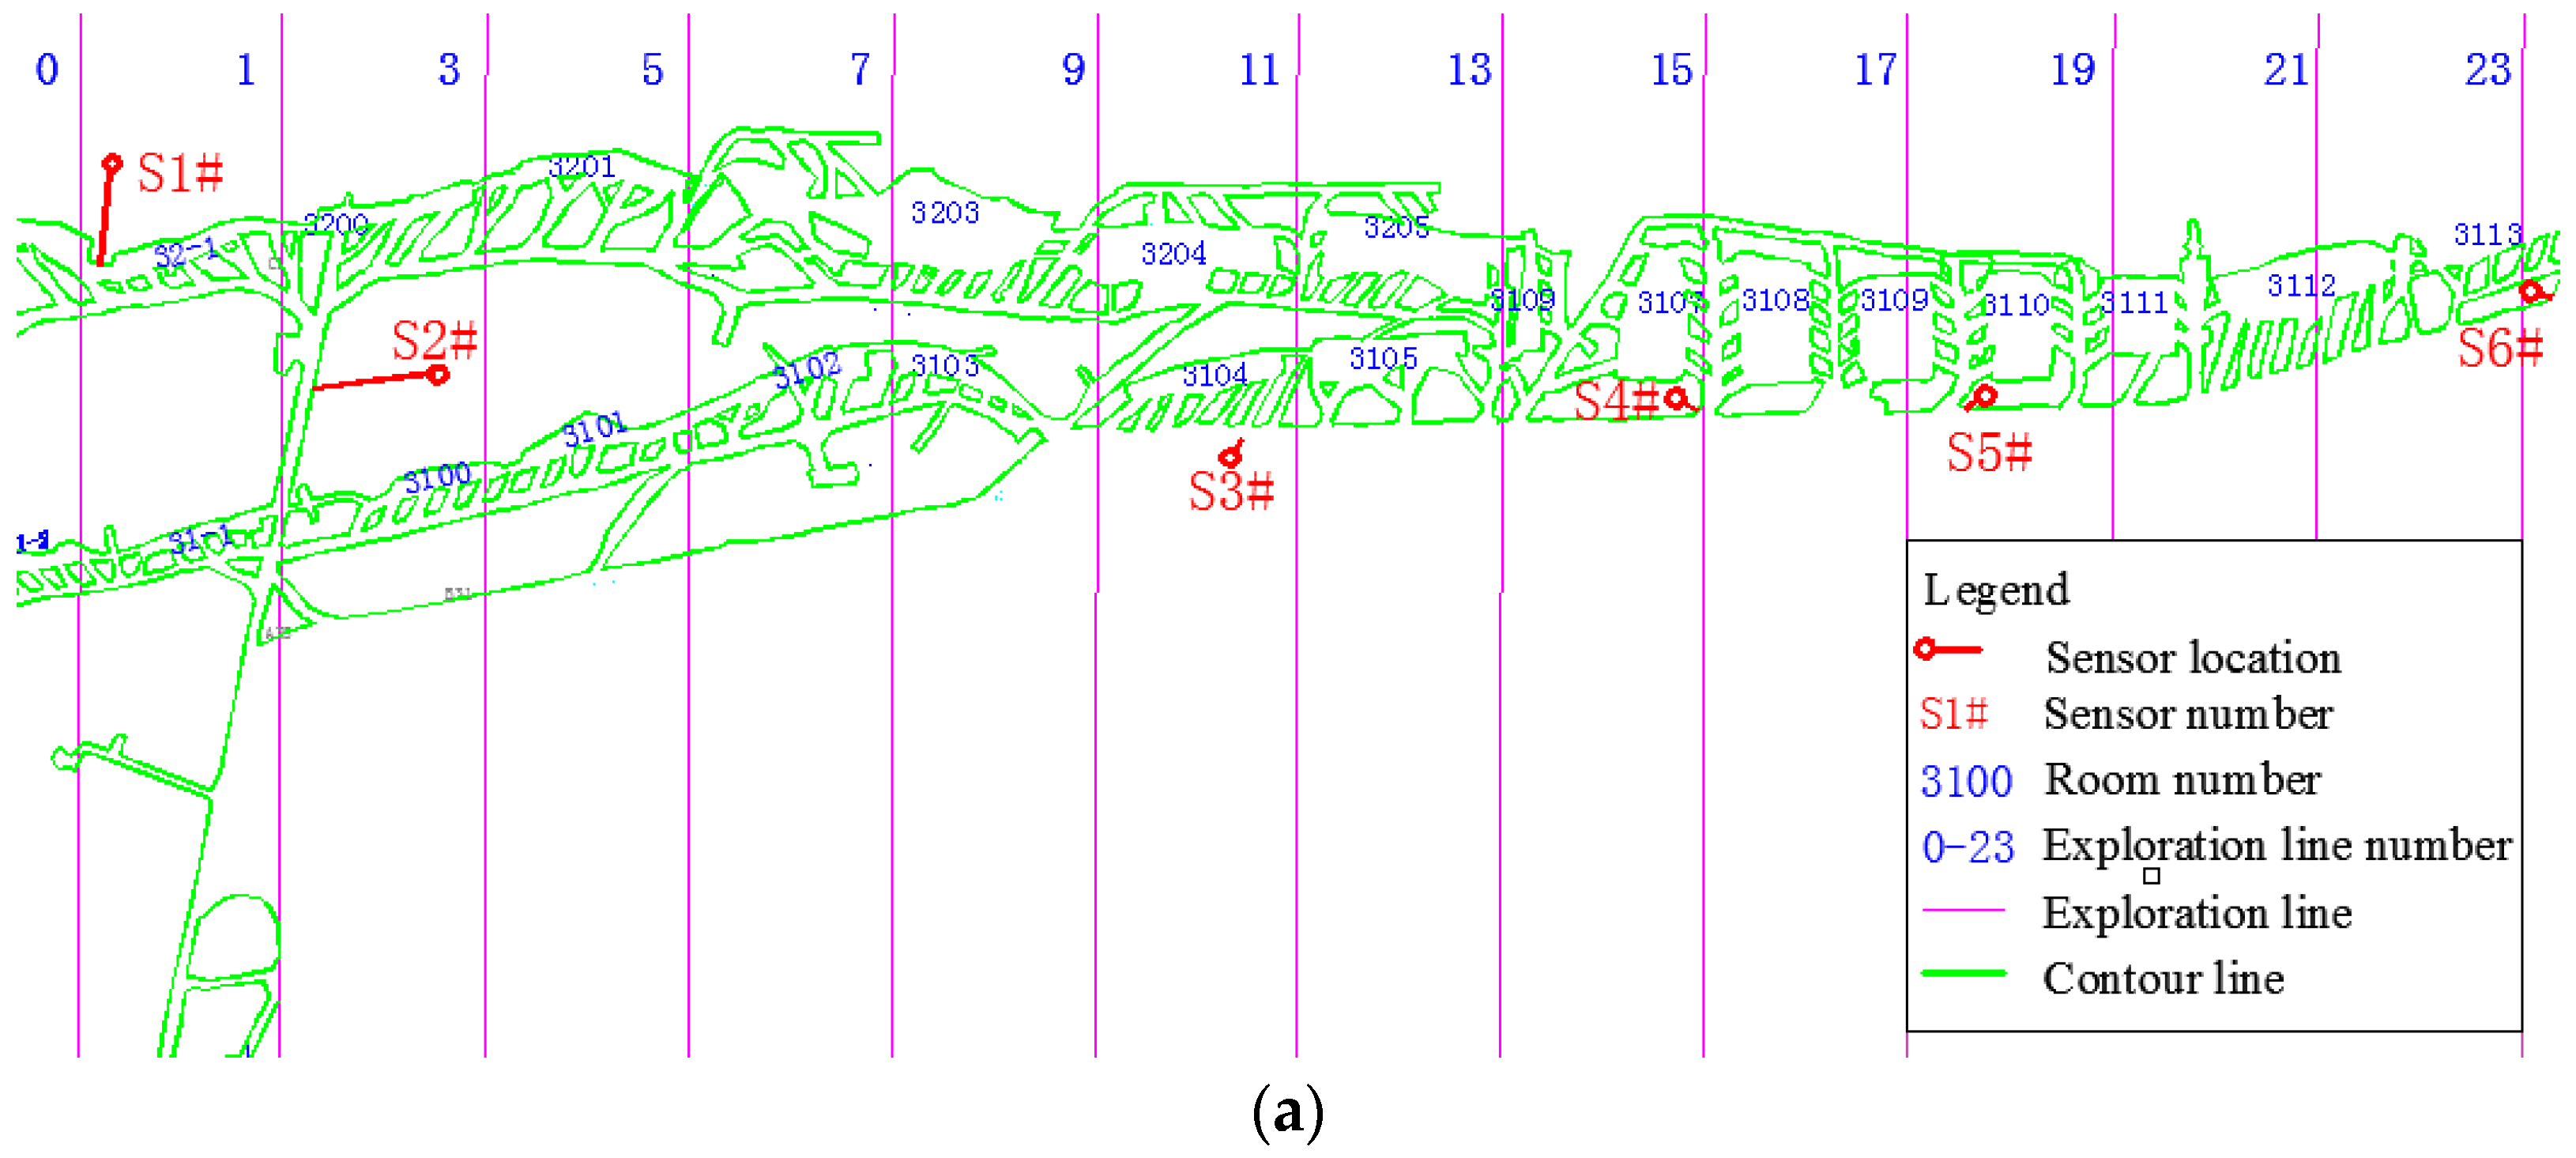
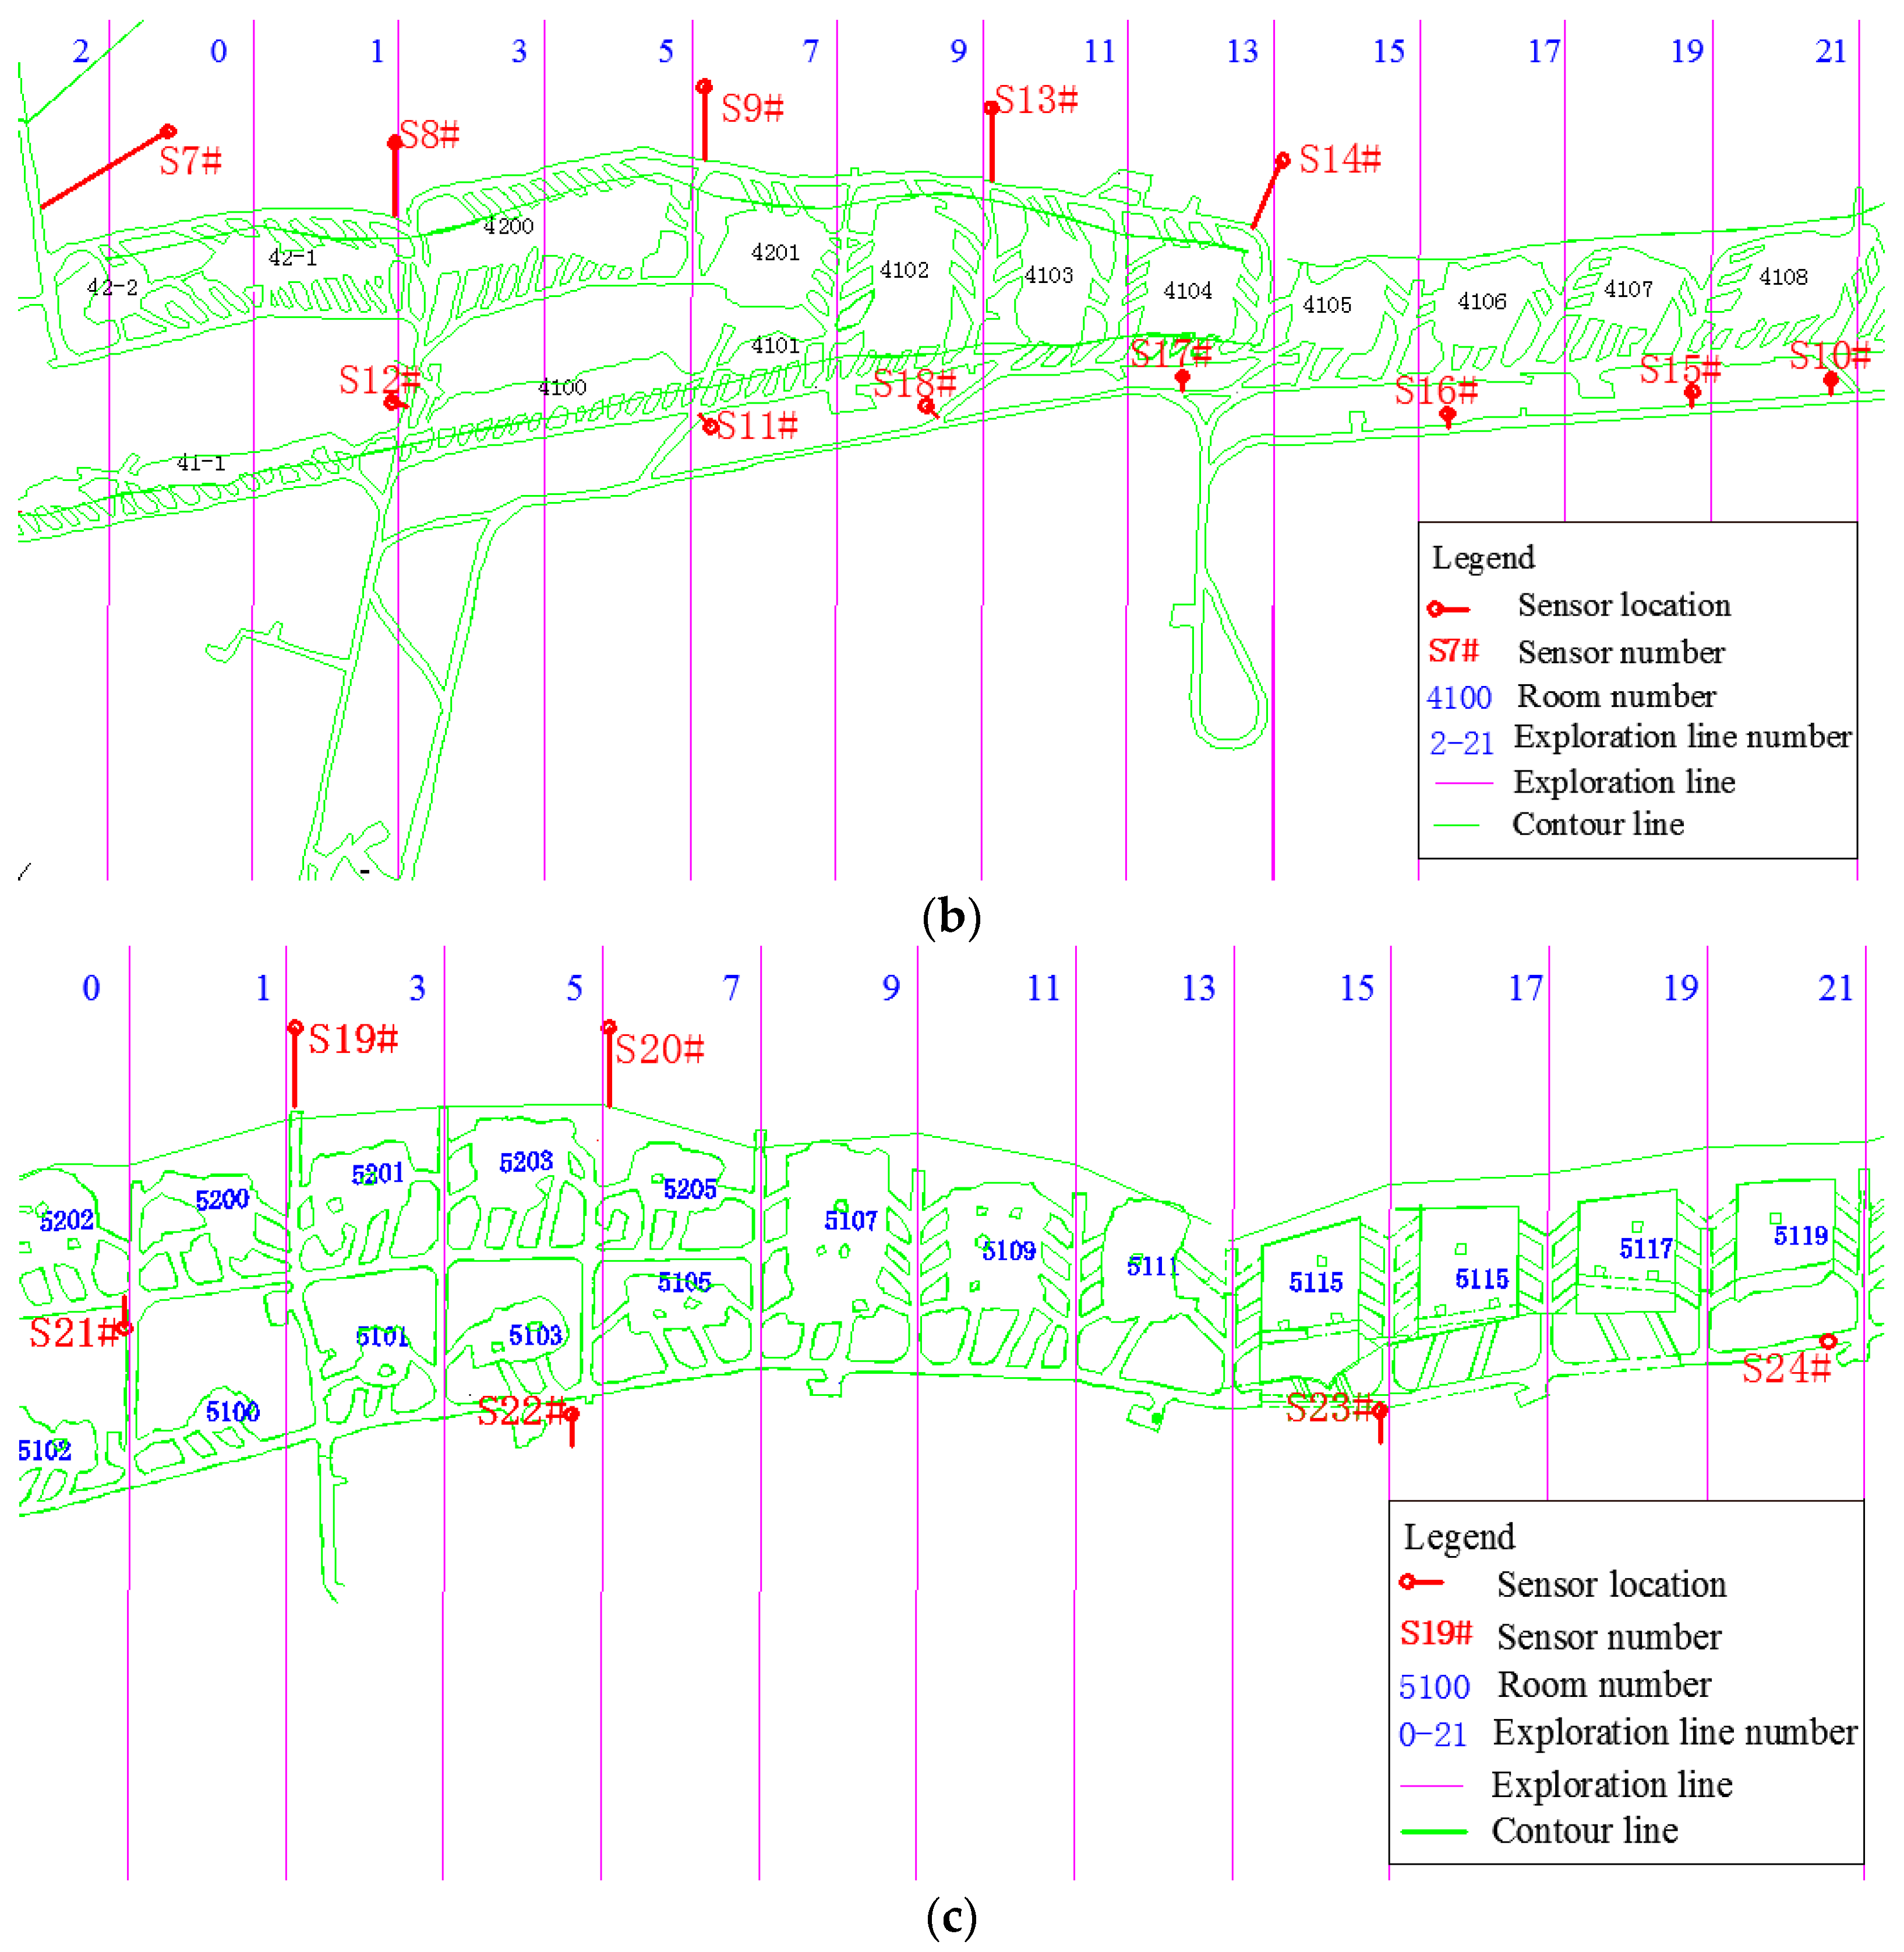
Microseismic monitoring was used mainly to receive the rock mass waveform signal through the sensor, from which we were able to extract a wealth of information to analyze the fracture extension within the rock mass. There were two sets of acoustic emission systems with twenty-four simple component acoustic emission sensors in the Hongling lead zinc ore. The first set of acoustic emission systems with sensors S1–S12 were installed in the pillars of the +955 and +905 m level, with a second set of acoustic emission systems with sensors S13–S24 being installed in the pillars of the +905 and +855 m level. The specific sensor placements are shown in
Figure 3 below.
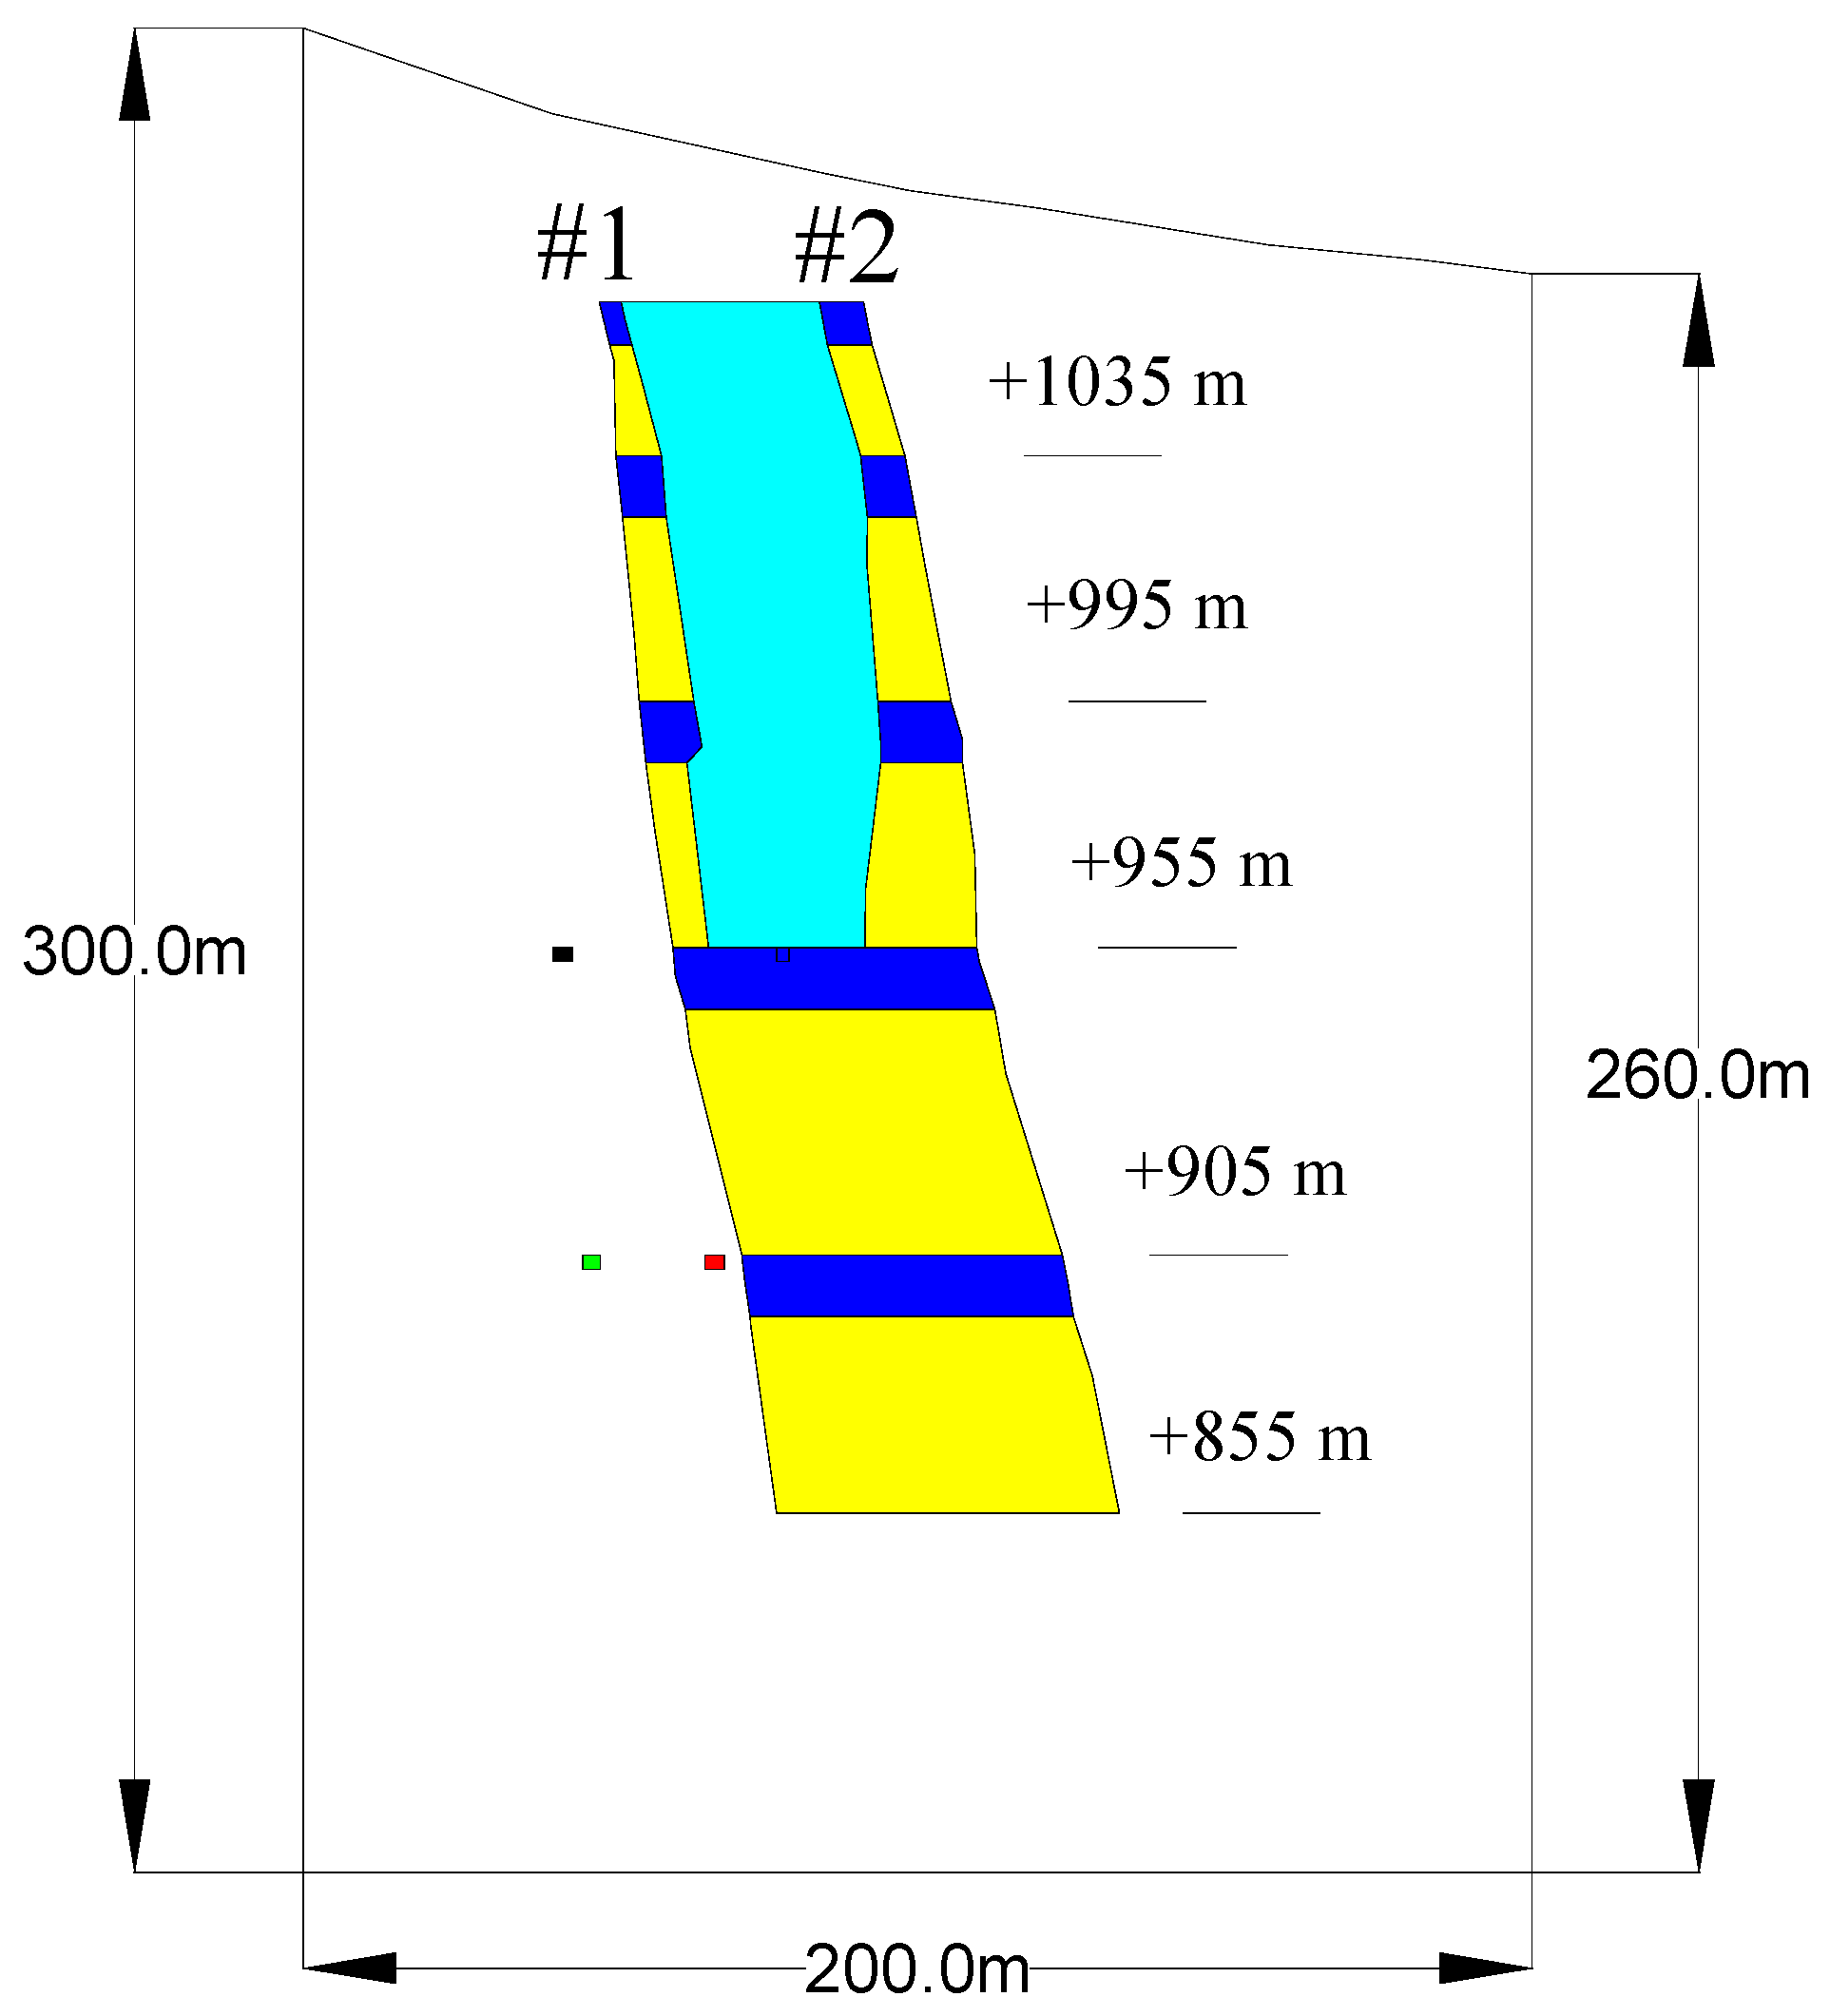
The rock and soil mechanics module of the COMSOL Multiphysics numerical simulation software was used in the calculation and solution of the mechanics. The numerical model was mainly established based on a typical profile from the location of the exploration line seven to the exploration line nine perpendiculars to the 5107 room, as shown in
Figure 4 below. The model was 200 m wide and 300 m high, with the top being an irregular free surface. The inner ore body contour was established according to the realized geological profile. When calculating, the bottom side had fixed constraints, while both sides of the model were the roller support constraints, and these constraints were only by their own weight. The multi-step mining simulation was carried out by the method of top-down sublevel mining, with the stress field iterative method being used in the simulation calculation. The Mohr–Coulomb strength criterion was chosen as the rock mass shear failure standard. The rock mass tensile failure was judged by the relationship between the tensile stress and the tensile strength.
The rock mass strength parameters were calculated by combining the indoor experiment, the field structure plane photogrammetry [
29], and the generalized Hoek–Brown intensity criterion [
30,
31]. The process involved first carrying out the laboratory experiment and obtaining the basic rock mechanics parameters of different lithologic rock specimens, such as uniaxial compressive strength. Following this, the parameters of the structural plane were obtained by using rock mass surface photogrammetry technology, and the surface structural plane of the rock with different lithologies was measured. We obtained parameters such as the inclination, dip angle, and density of the structural. Finally, the strength parameters of different lithologic rock masses were calculated according to the general Hoek–Brown strength criterion. The final calculated rock mass parameters are shown in
Table 1 below.
2.3. Research Framework Map
The research framework map is expressed in
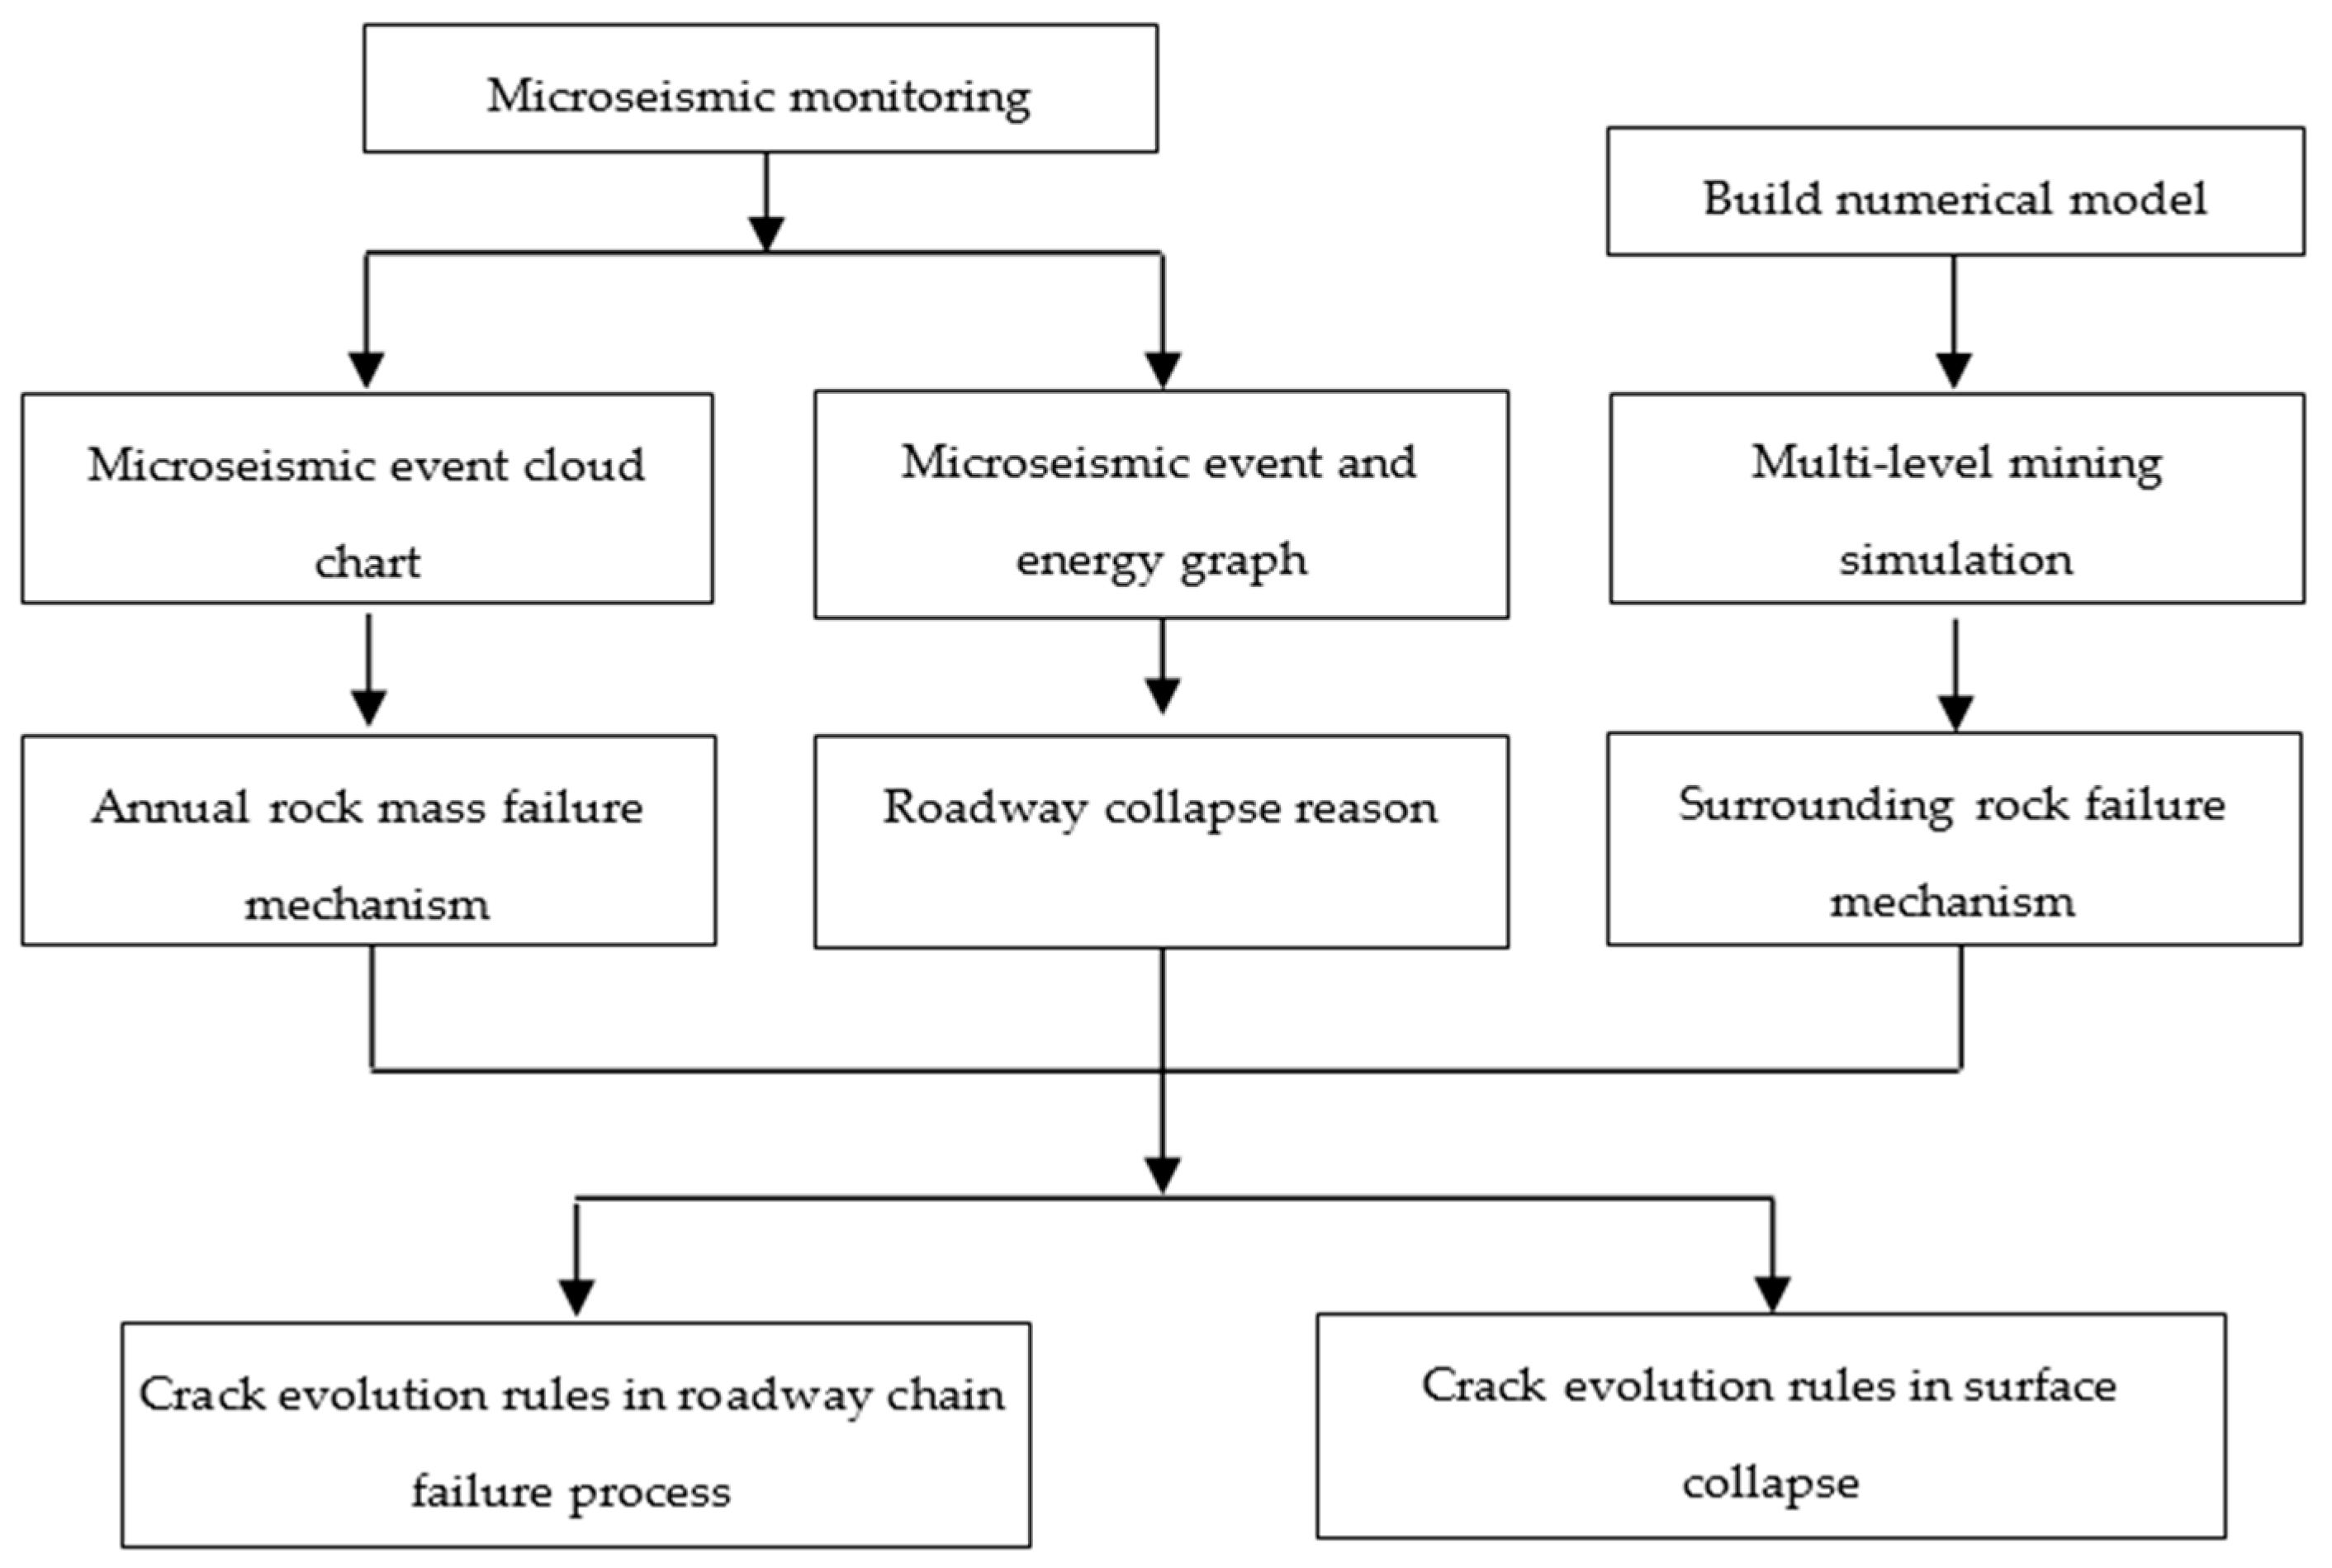
Figure 5. First, the microseismic monitoring technique is used to obtain the number of microseismic events and the density cloud. This then combines with the moment tensor theory to solve the micro-fracture pattern in the rock mass, with the rock mass fracture mode being obtained. The microseismic events and energy cloud map are drawn, with the obtained roadway collapse reason being combined with the mining plan. Following this, the numerical simulation model is established and the numerical simulation of the multi-stage mining is carried out to obtain the failure mechanism of the surrounding rock. Finally, the fracture mode inverted by the moment tensor and the plastic zone cloud drawn by numerical simulation are combined to obtain the crack evolution rule and the surface collapse mechanism.
3. Rock Mass Failure Mechanism Analysis
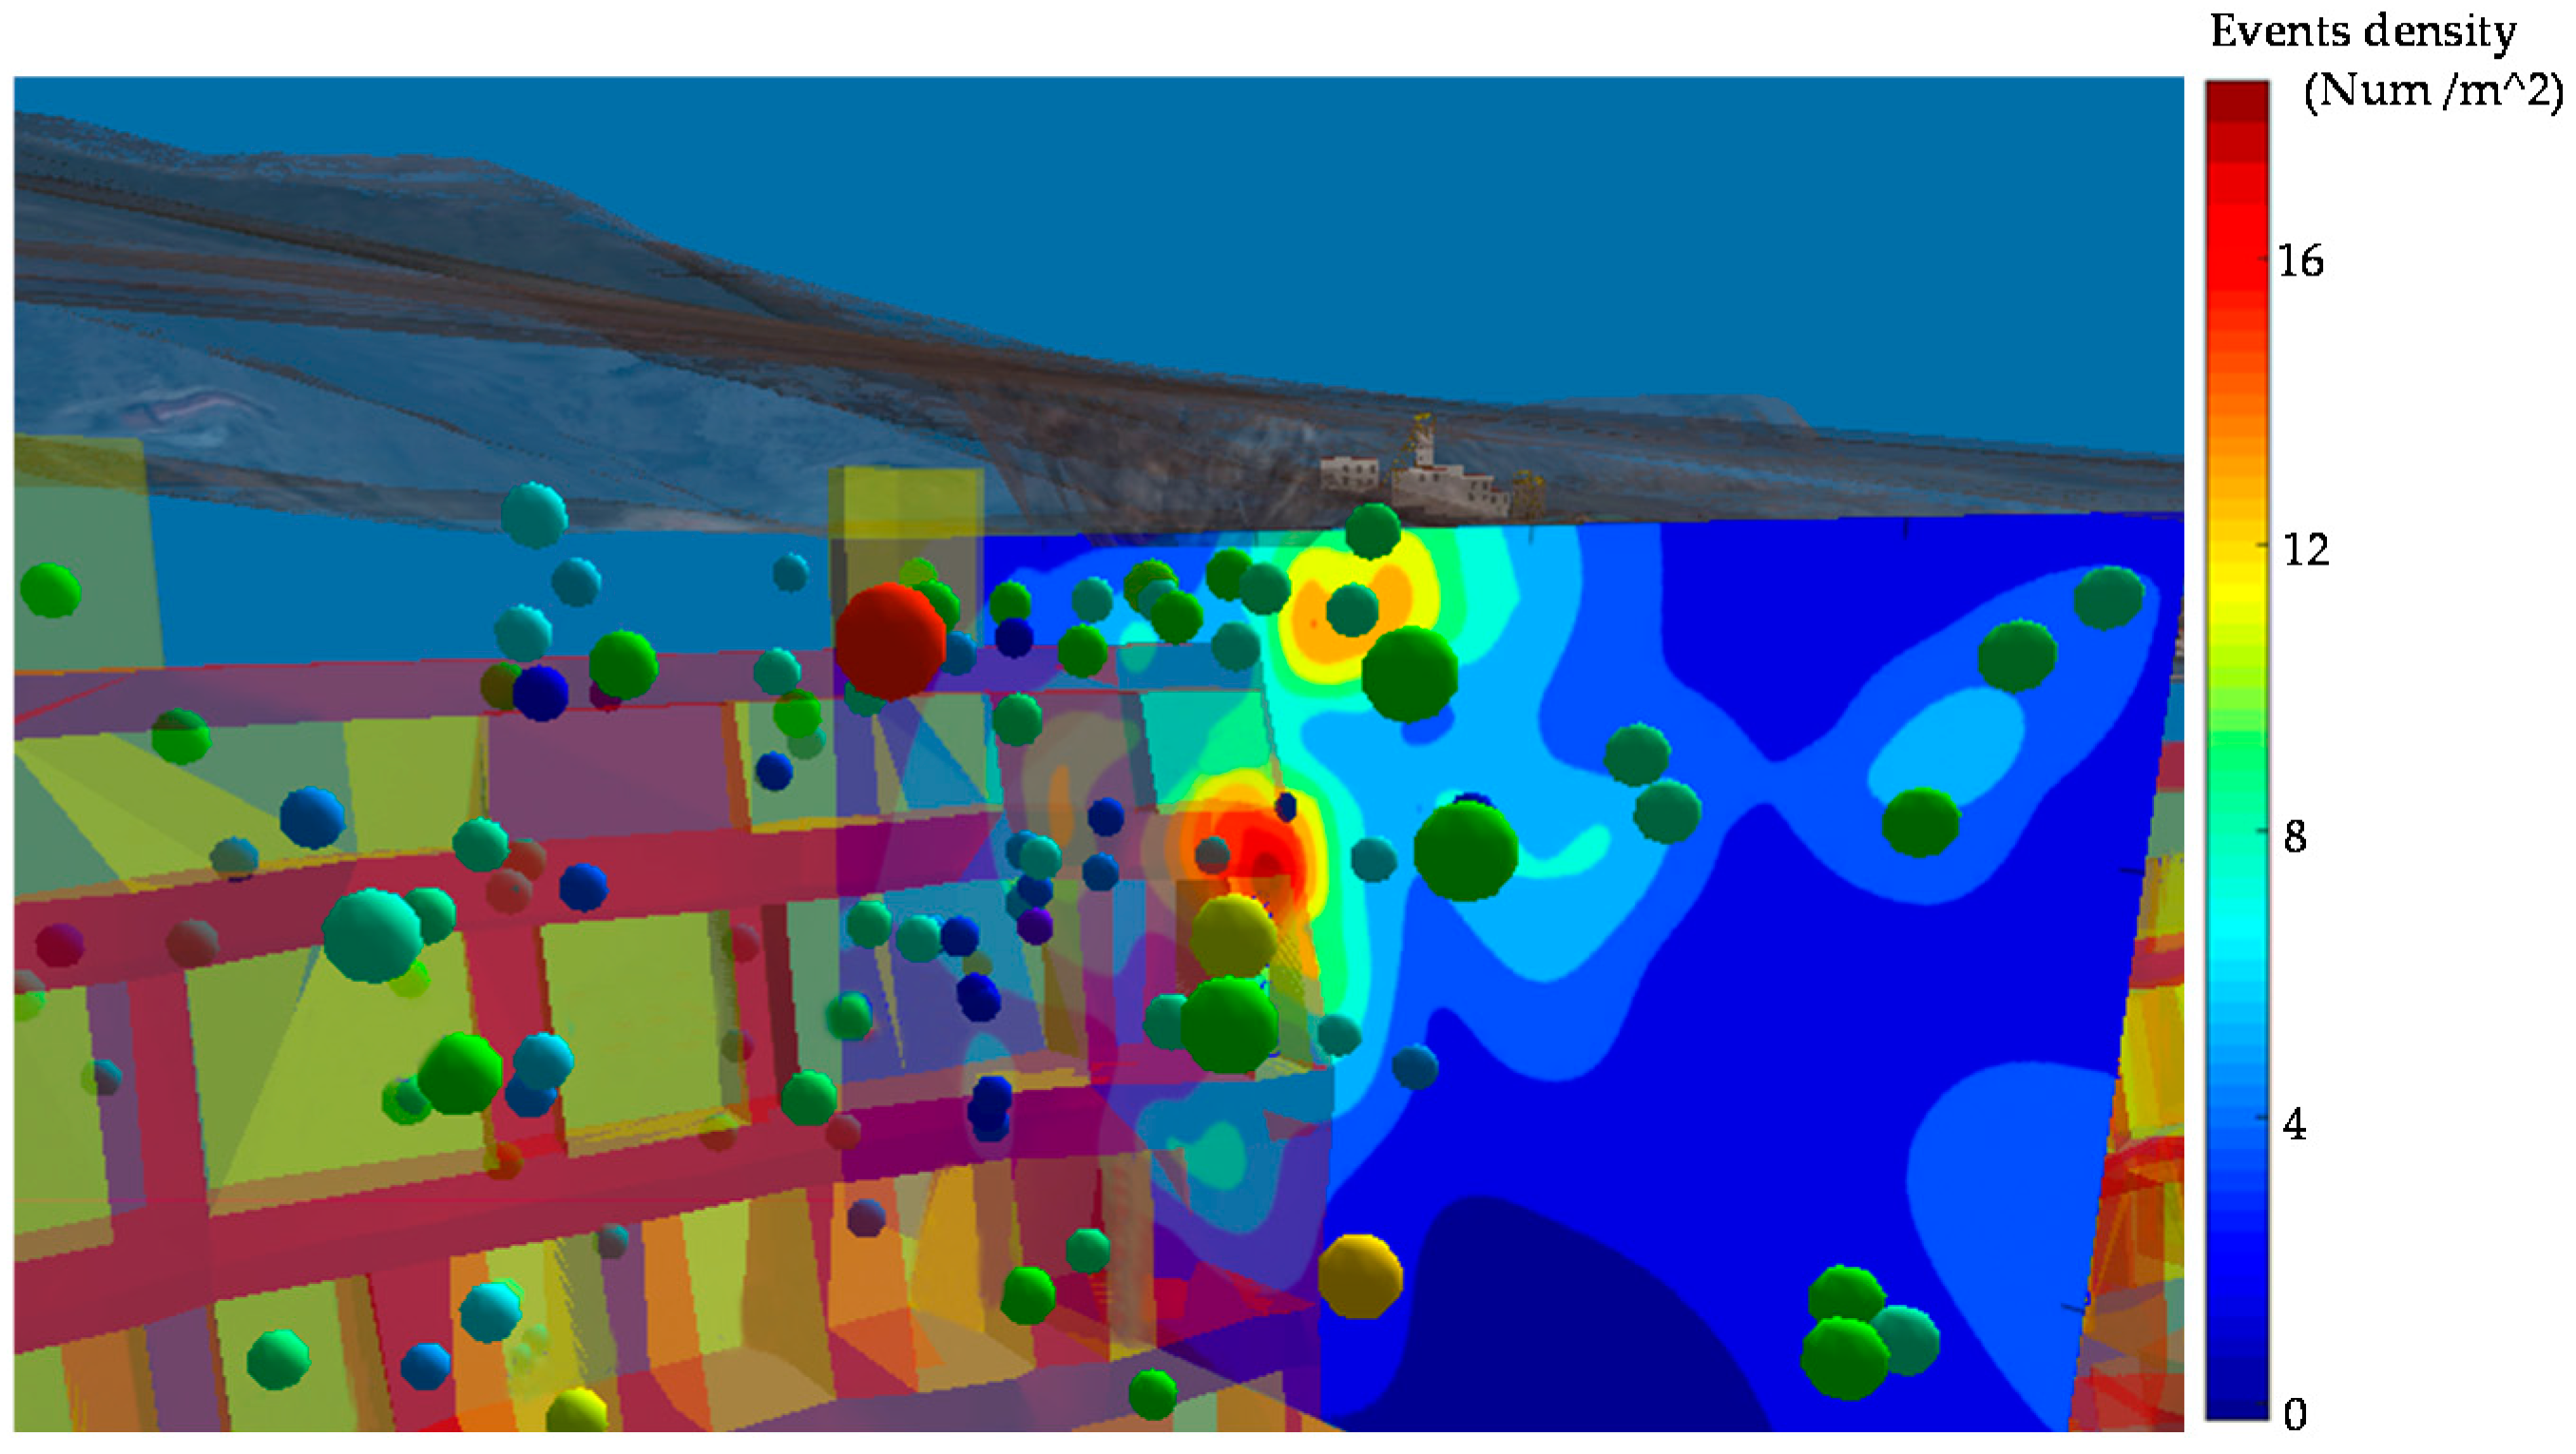
The microseismic events and density contours from July 2014 to July 2015 are shown in
Figure 6 in exploration line seven of Hongling lead zinc ore. The density contours describe the “concentration degree” of seismic events. Each value on the figure is denoted by the number of events within a given radius. The spheres represent microseismic sources (micro-cracks). These are scaled and colored by seismic moment. The red and yellow areas in the density contours indicate the degree of event concentration. The density contours show that during mining activity, there are large red areas appearing in the +955 m level, which indicates that the microseismic events mainly concentrate in the +955 m level and were potentially already causing damage. The yellow areas near the ground surface in the hanging wall indicate that there are also many microseismic events concentrating near the ground surface. A large red microseismic event ball appears near the ground surface, which contained 6800 J of energy with a 0.67 earthquake magnitude. The red microseismic event ball indicates that a large fracture signal has already occurred near the ground surface, with the ground surface potentially already having collapsed or been partially destroyed.
The micro-fracture analysis results are shown in
Figure 7, which represents the step-by-step accumulation of fracture signals in different months.
Figure 7a is the profile map of exploration line seven, showing the ore body contour of the study area. It contains the contour of the surface, room, pillar, and the marble interlayer.
Figure 7b–f shows the gradual accumulation process of the rock fracture in different months. The red signals
![Minerals 07 00096 i007]()
represent tension failure, the blue signals
![Minerals 07 00096 i008]()
represent shear failure, the green signals
![Minerals 07 00096 i009]()
represent mixed failure, the circles represent the fracture surface, and the arrows represent the fracture direction.
Figure 7b shows that six large fracture sources appear in the rock mass in January after pillar recovery. The fracture that first occurs in the +955 m level is a shear failure. Under the footwall, two shear failures also appear.
Figure 7c shows that the fracture sources are extending in April, with the tensile-shear failures multiplying from the +955 m level to the +995 m level and the hanging wall. In the working site, the roof of the +955 m level is damaged during mining activity. In the footwall of the +905 m level, many tensile failures appear.
Figure 7d shows that the +955 m level fracture sources extend further to the +1035 m level and the +905 m level in July. There appear two tension failures in the +905 m level, two mixed failures in the +1035 m level, and two shear failures in the footwall. Many tension failures occur in the hanging wall near the ground surface, resulting in damage to the ground surface.
Figure 7e shows that there are vast tension failures and shear failures aggregating in the +955 m level in September, which causes damage to the marble interlayer. In the footwall, five shear fractures appear close to the ore body, forming the footwall destruction outline. On the ground surface, the tension failures gradually move from the hanging wall to the footwall and join into the large scope, which forms the preliminary outline of the surface collapse.
Figure 7f shows that the hanging wall surface fractures have already connected in the large area and join with the footwall destruction outline in December. In the inner ore body, tension failures shift from the +955 m level to the +905 m level, while shear failures largely aggregate in the hanging wall of the +955 m level and cause a large destruction. In the hanging wall destruction outline, a shear failure occurs in the +905 m level, before extending upward and connecting with two tension failures in the +955 m level. Continuing its upswept extension, the surface shear failures all join and form the outline for the destruction of the whole hanging wall.
Above all, failures are first produced within the +955 m level, extending through the hanging wall to the ground surface, before moving to the footwall and forming the outline of the collapse of the ground surface. Meanwhile, many shear failures occur in the footwall surface, extending downward in an arc-shaped path to the +905 m level and forming the outline of the footwall destruction. In this process, many shear failures are produced in the ore body and hanging wall rock, gradually extending to the surface. These form the hanging wall destruction outline, and ultimately collectively cause the large-scale failures.
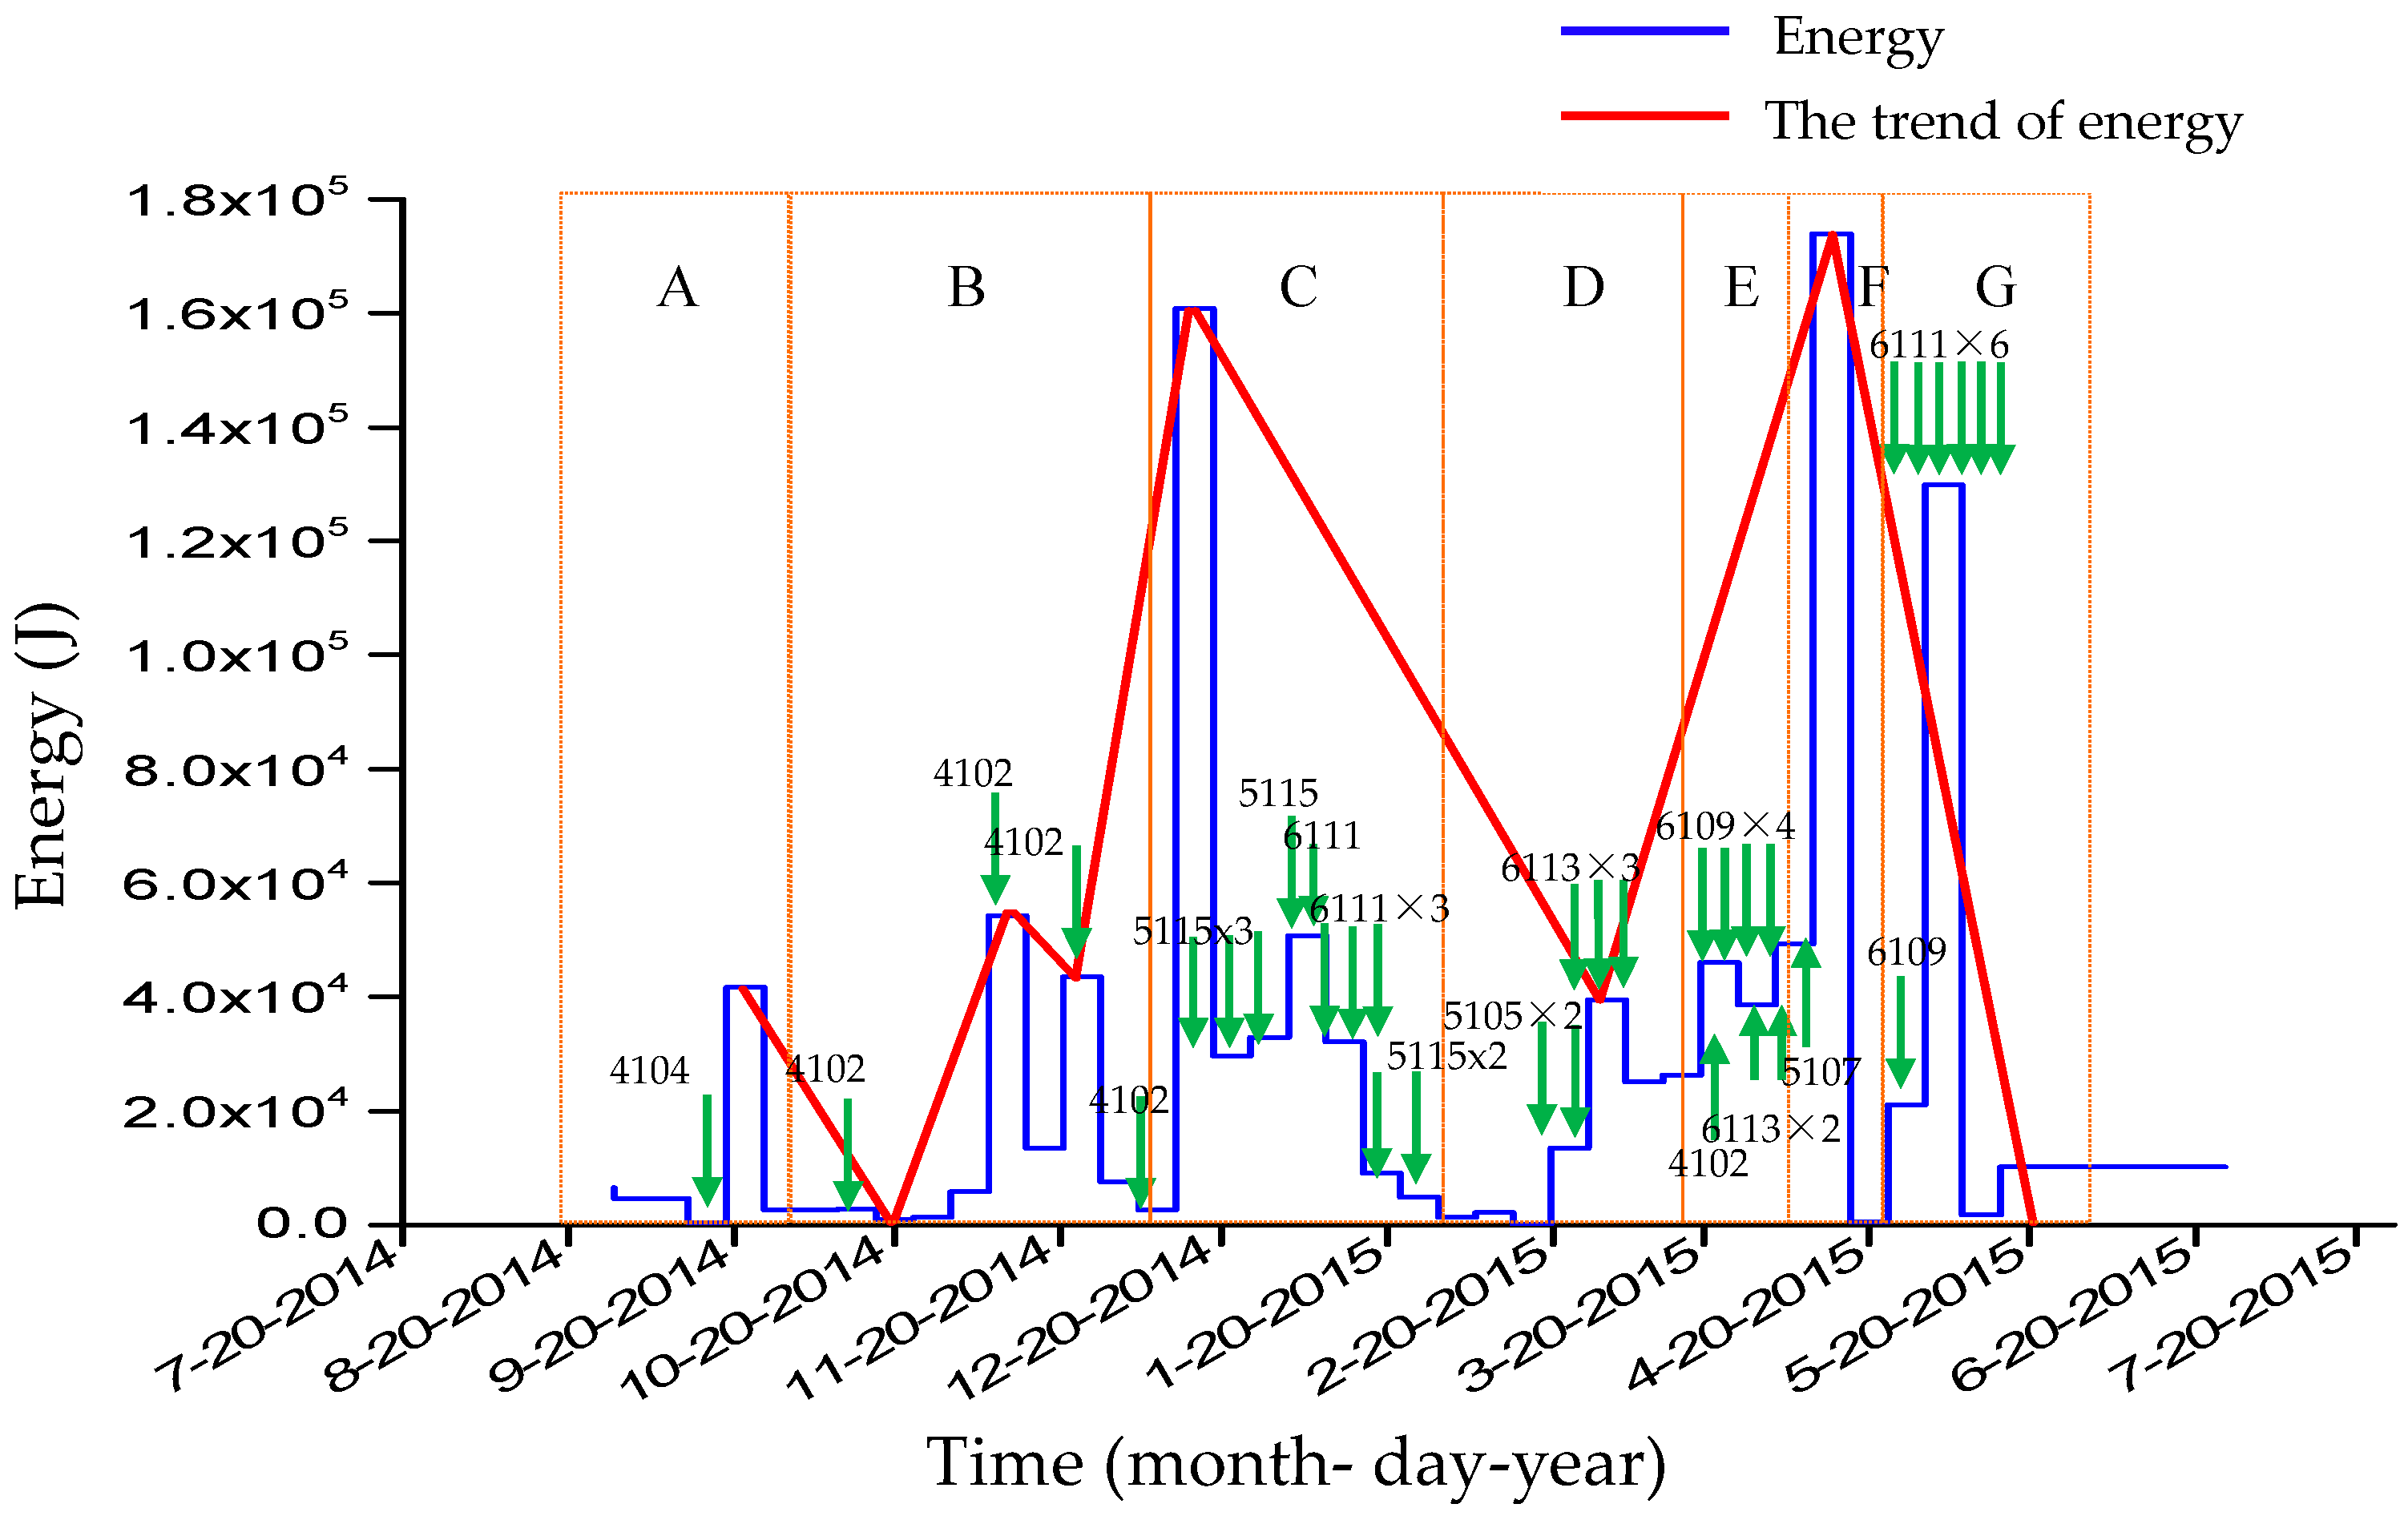
4. Microseismic Event and Energy Analysis
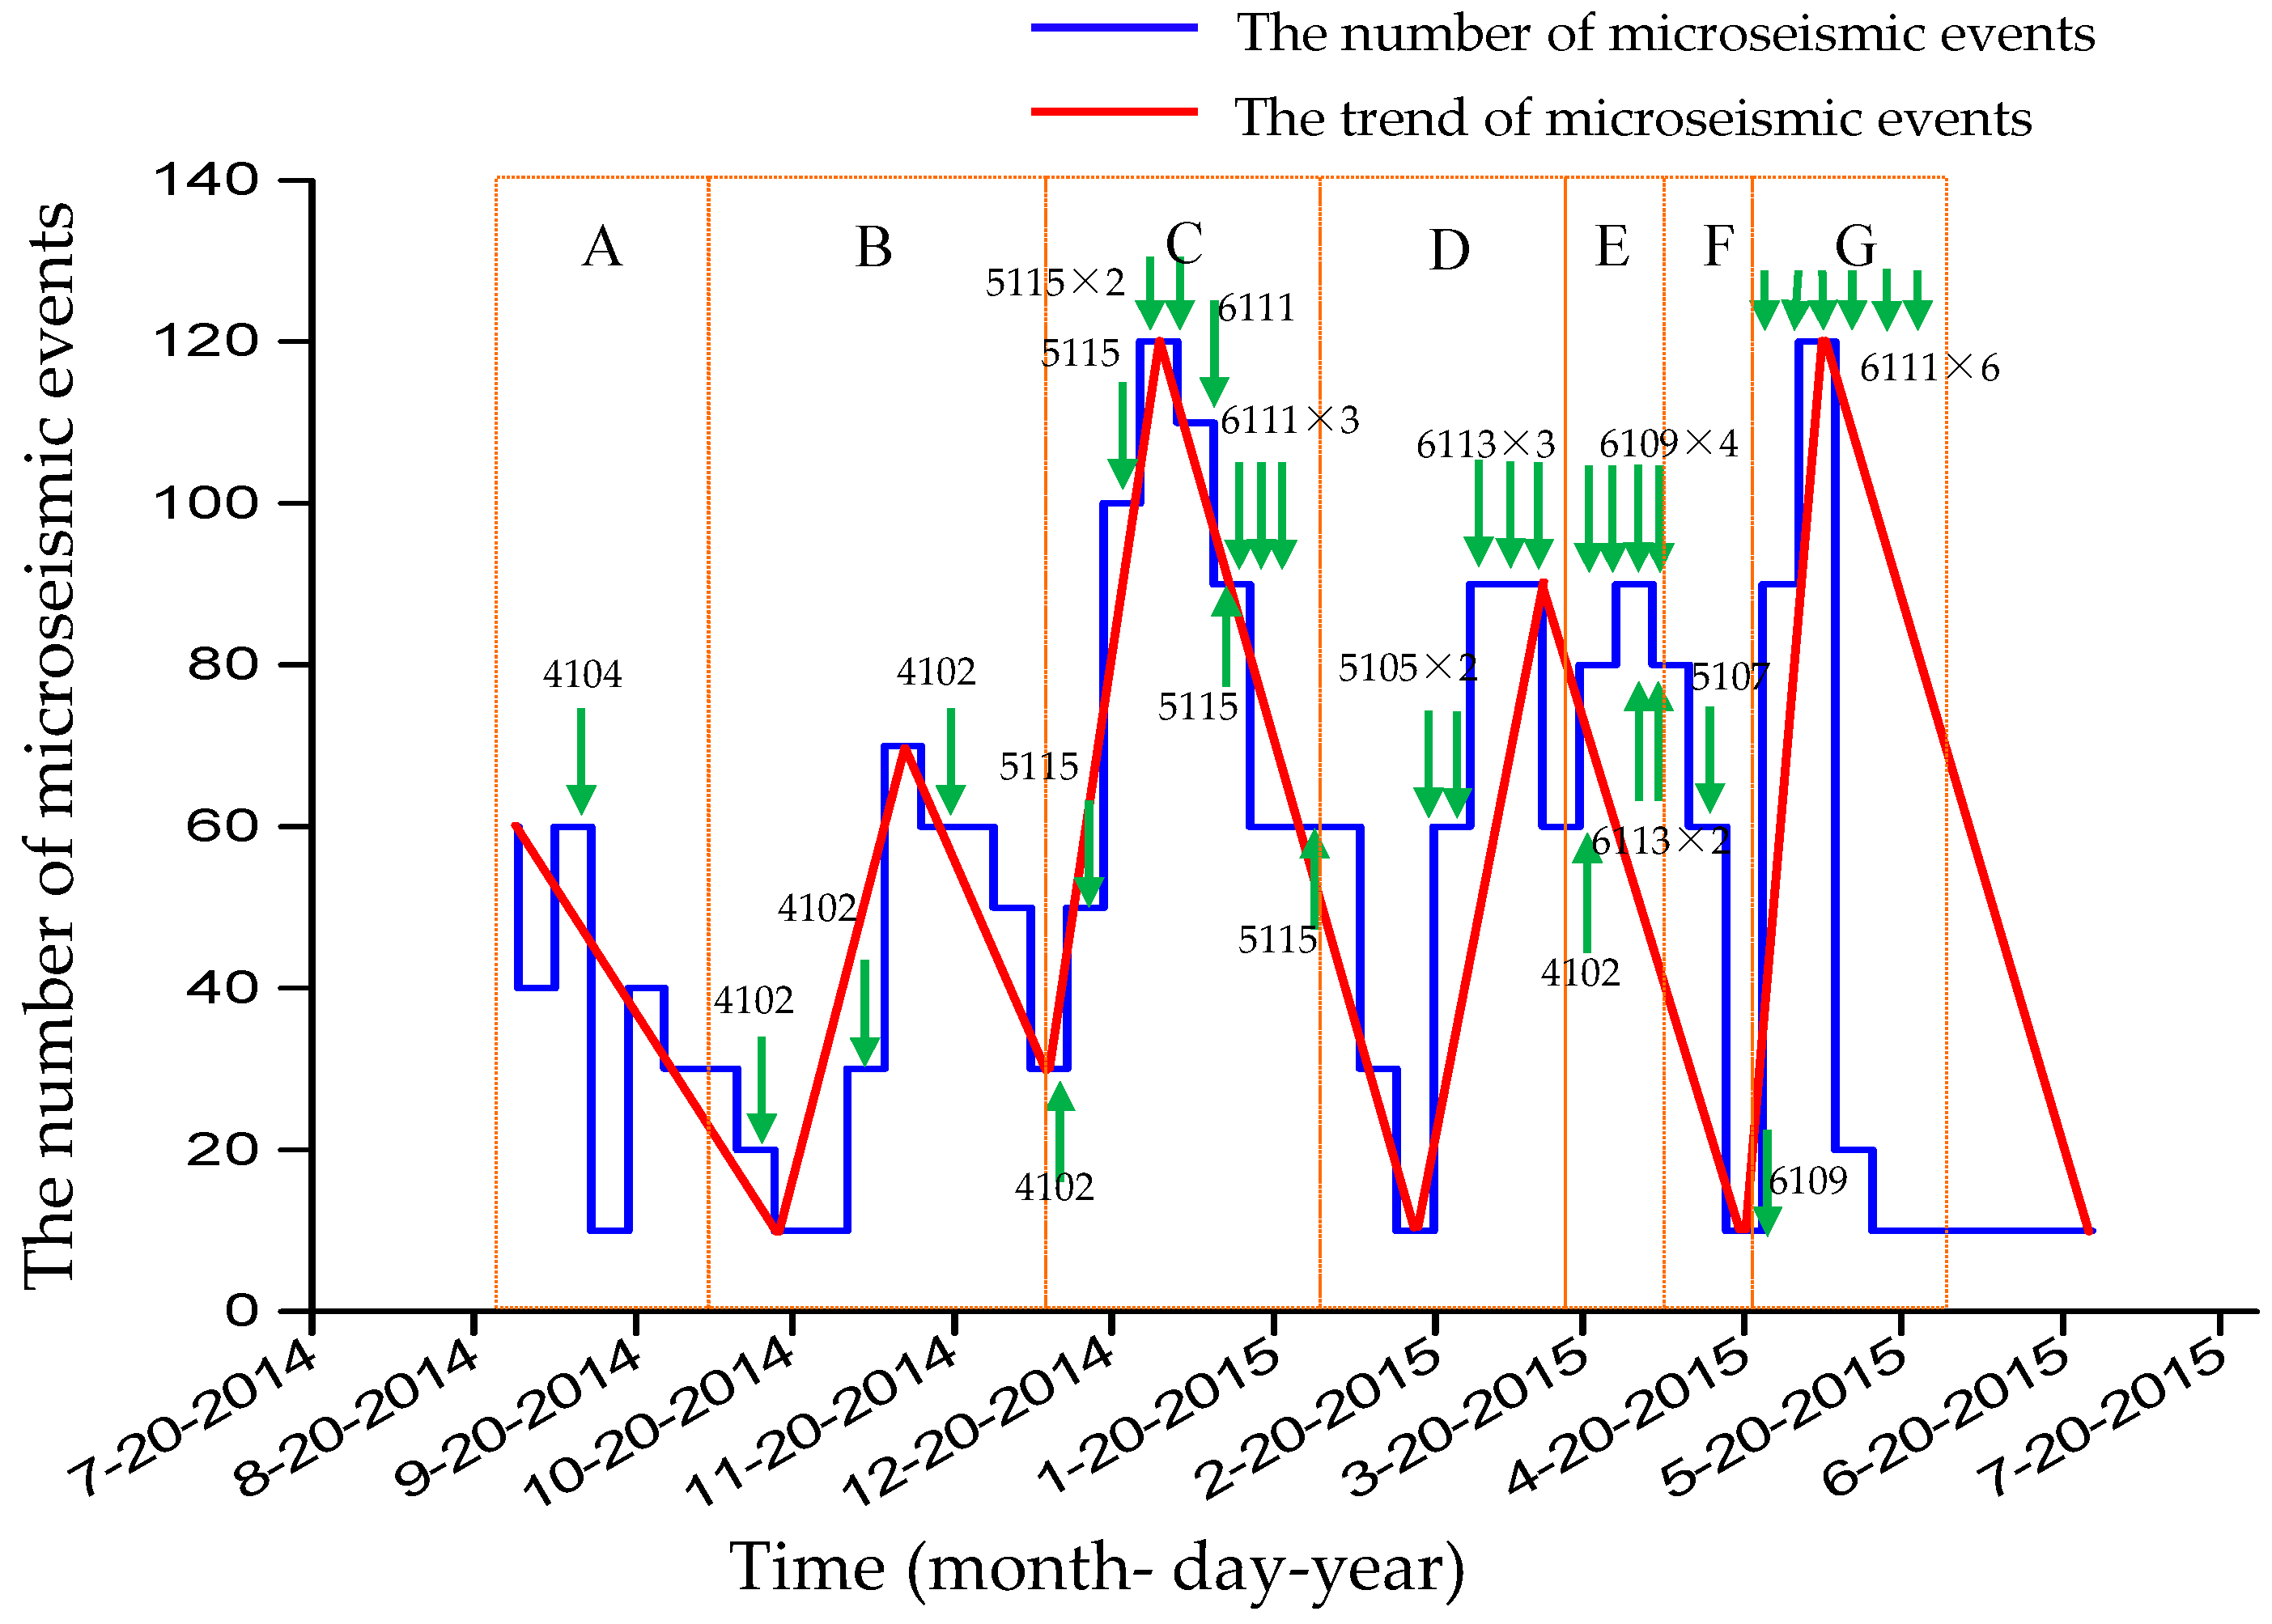
From July 2014 to July 2015, the recovery areas were mainly concentrated in the +905, +855, and +805 m level. The microseismic event graph is shown in
Figure 8, and the microseismic energy graph is shown in
Figure 9. In this figure, the letters A–E represent the different time intervals. The recovery area between exploration line three to exploration line fifteen can be seen in
Figure 10. In this figure, the red area represents the mining area, the cyan area represents the pillar, the green area represents the roof, the yellow area represents the recovering ore body, and the numbers are the different room numbers. The mining time and mining area are shown in
Table 2 below.
Figure 8A and
Figure 9A show that sixty microseismic events appear after the recovery of the 4104 roof on 13 September 2014. The 4104-right pillar collapsed during the mining activity on September 20, releasing 40 KJ of energy.
Figure 8B and
Figure 9B show that twenty microseismic events appear after the recovery of the 4102-top pillar on 14 October 2014, with no energy released. During the second-time recovery of 4102 pillar on October 31, the increment of microseismic events was just ten and the increment of energy was 60 KJ, forming a small energy peak. On November 15 during the third-time recovery of 4102 pillar, the number of microseismic events reached seventy and 51 KJ of energy was released, forming another small energy peak. In the following twenty days, the number of microseismic events remained at more than fifty and the rock mass was broken continually. On December 11 at the fourth-time recovery of 4102 pillar, the number of microseismic events increased from thirty to fifty and the energy increased from 2 KJ to 160 KJ with the increment of 158 KJ. This formed the first large energy peak in the recovery of pillars. It is speculated that a large collapse of the rock mass occurred when the 4102 pillar was recovered, but works did not notice the collapse on-site. The reason may be that the collapse occurs near the closed mined-out area, but it did not occur in the roadway, so it was not observed.
Figure 8C and
Figure 9C show that from 17 December 2014 to 27 January 2015, there were six days needed for the recovery of 5115 room and four days for the recovery of 6111 room. The recovery interval is transitory and the surrounding rock stress is caused by balance disturbance. More than one hundred microseismic events appeared on 20 December 2014, and 40 KJ of energy was released.
Figure 8D and
Figure 9D show that the number of microseismic events increased from sixty to ninety, and the released energy increased from 14 KJ to 38 KJ in the recovery of 5105 room on 25 February 2015. From February 23 to March 23, the main recovery area included 5105 room and 6113 room. The number of microseismic events remained at more than sixty every day, and the release energy remained at more than 30 KJ every day. This period is the process of the preliminary energy accumulation.
Figure 8E and
Figure 9E show that sixty microseismic events appeared in the recovery of 4102 pillar and 6113 room on 18 March 2015, and 30 KJ of energy was released. On March 23, during the second time in the recovery of 6113 room, and in March 28 during the first time in recovery of 6109 room, the number of microseismic events increased from sixty to ninety, and the released energy increased from 23 KJ to 45 KJ. In this month, the 6109 room and 6113 room were in continuous recovery. The number of microseismic events remained at more than sixty, and the release energy remained at more than 40 KJ. This period is the process of the continuous energy accumulation.
Figure 8F and
Figure 9F show that sixty microseismic events appeared during the recovery of 5107 pillar on 9 April 2015, and the energy released increased to 170 KJ, reaching the maximum value. On April 15, the energy accumulating in the surrounding rock reached its maximum, causing the roadway between exploration line seven and exploration line nine to collapse. The footwall haul road in the +905 m level first collapsed, followed by the haulage way in the +955 m level collapsing soon after.
Figure 8G and
Figure 9G show that the number of microseismic events increased from eight to ninety, releasing 25 KJ of energy in the recovery of 6109 room on 22 April 2015. From May 5 to May 22 during the sixth-time recovery of 6111 room, the number of microseismic events increased from ninety to one hundred and ten, with the release energy increasing from 25 KJ to 130 KJ and reaching another peak. The footwall haul road and the haulage way were destroyed once again.
According to the analysis of microseismic events and energy, the reason for roadway collapse is as follows: after the recovery of 4102 pillar, the support of surrounding rock in the branched area was removed, causing damage to the surrounding rock with the release of large amounts of energy. During the recovery of 5115 room and 6111 room, many microseismic events gathered, and the surrounding rock was continuously destroyed. During the recovery of 5105 room, 6109 room, and 6113 room, energy was gradually accumulated. After the recovery of 5107 pillar, the accumulated energy reached the limitation of the surrounding rock support and released, which caused the roadway to collapse. During the recovery of 6109 room, the accumulated energy released again, and the roadway was destroyed once again.
Through the analysis above, three large-scale collapses mainly occurred in the rock mass, as shown in
Table 3 below. It can be found that before the rock mass collapse, there were causes directly inducing the collapse, such as mining roofs and mining pillars. When the rock mass collapsed, the final number of microseismic events was 60, so 60 microseismic events can be defined as the threshold of the number of events that causes rock collapse. When the rock is in a mining area, there will be a risk of a collapse if the number of microseismic events generated is more than 60. In these three collapses, the time period from the rock failure being induced to final rock collapse was seven, six, and seven days This shows that when the rock is subject to the incentive effect, even if the occurrence of microseismic events is more than 60, the rock will not immediately destroy and collapse, as there will be a gradual process of energy accumulation. This accumulation process was initially predicted to be six-to-seven days, so six days can be used as the time threshold for the rock mass to progress from an induced failure to an actual collapse. This point is important for guiding the safety of mine production—especially for field workers, as they should try not to go into the mined-out area when pillars are recovered after six days, so as to avoid danger. With regards to the released energy, the first collapse is the pillar collapse and releases 40 KJ of energy. The second and third collapses are the surrounding rock collapses, releasing 170 KJ and 130 KJ of energy. These energy values are much higher than the energy of pillar collapse.
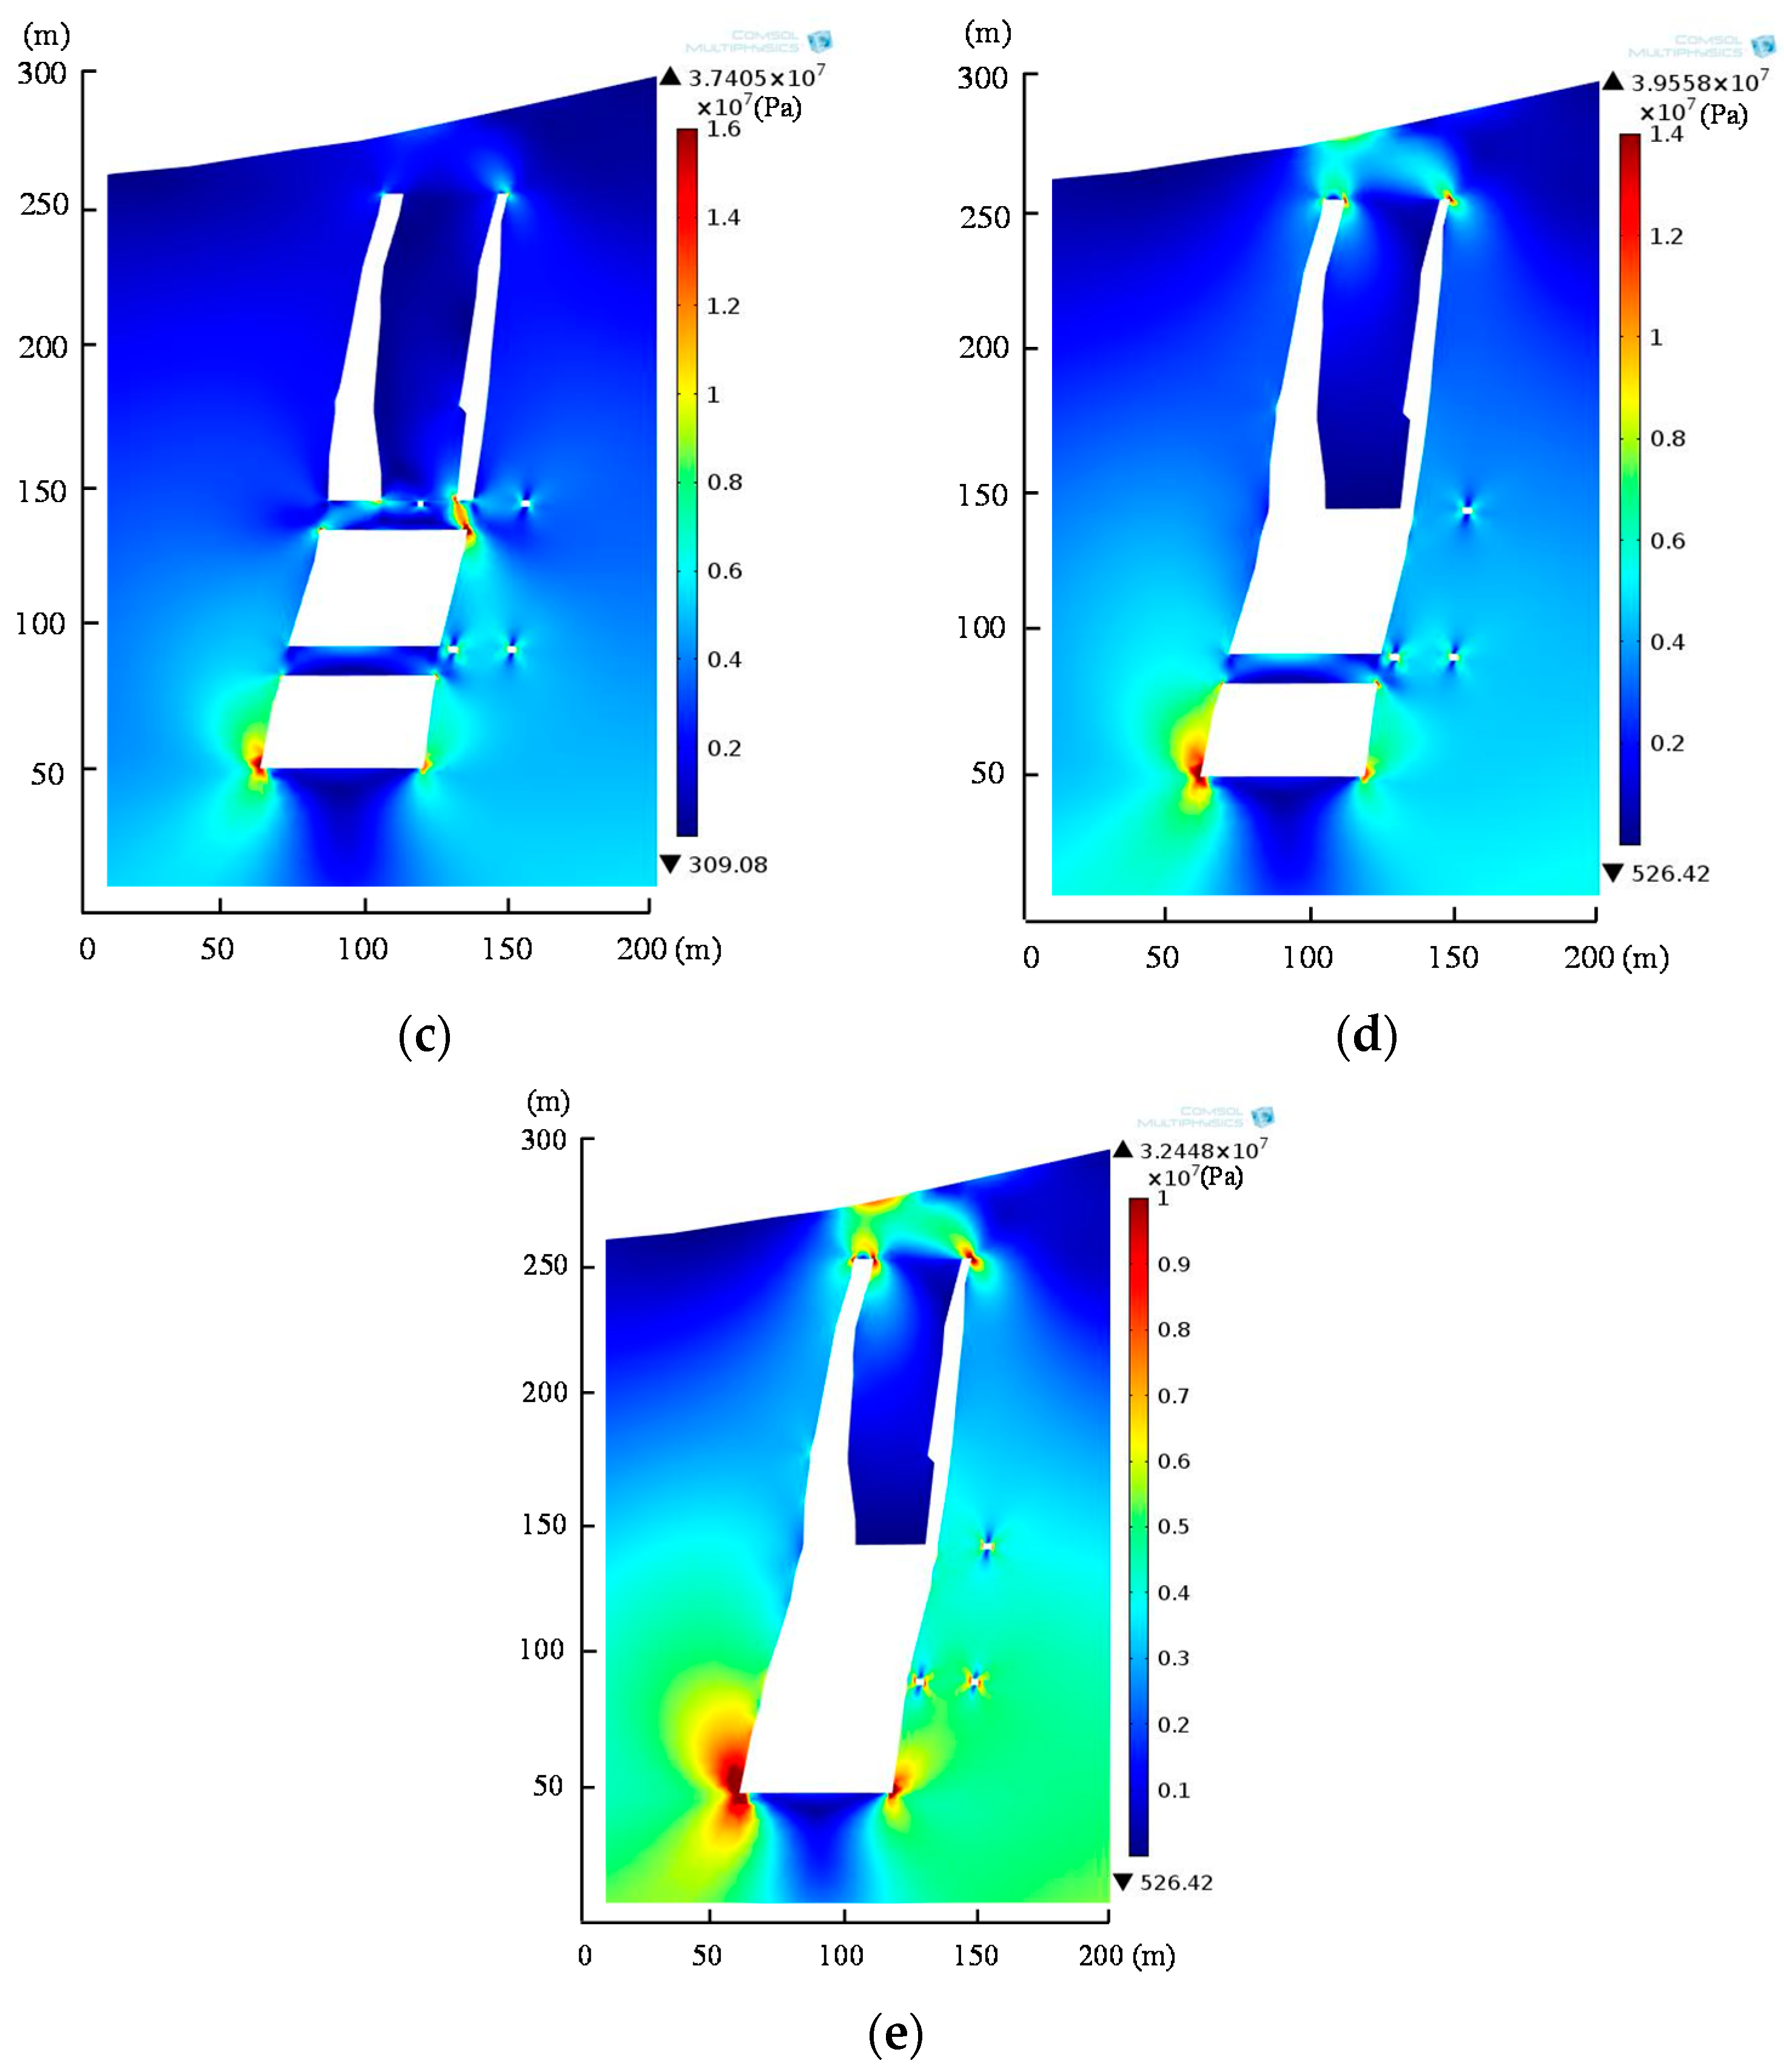
5. Surrounding Rock Failure Mechanism Analysis
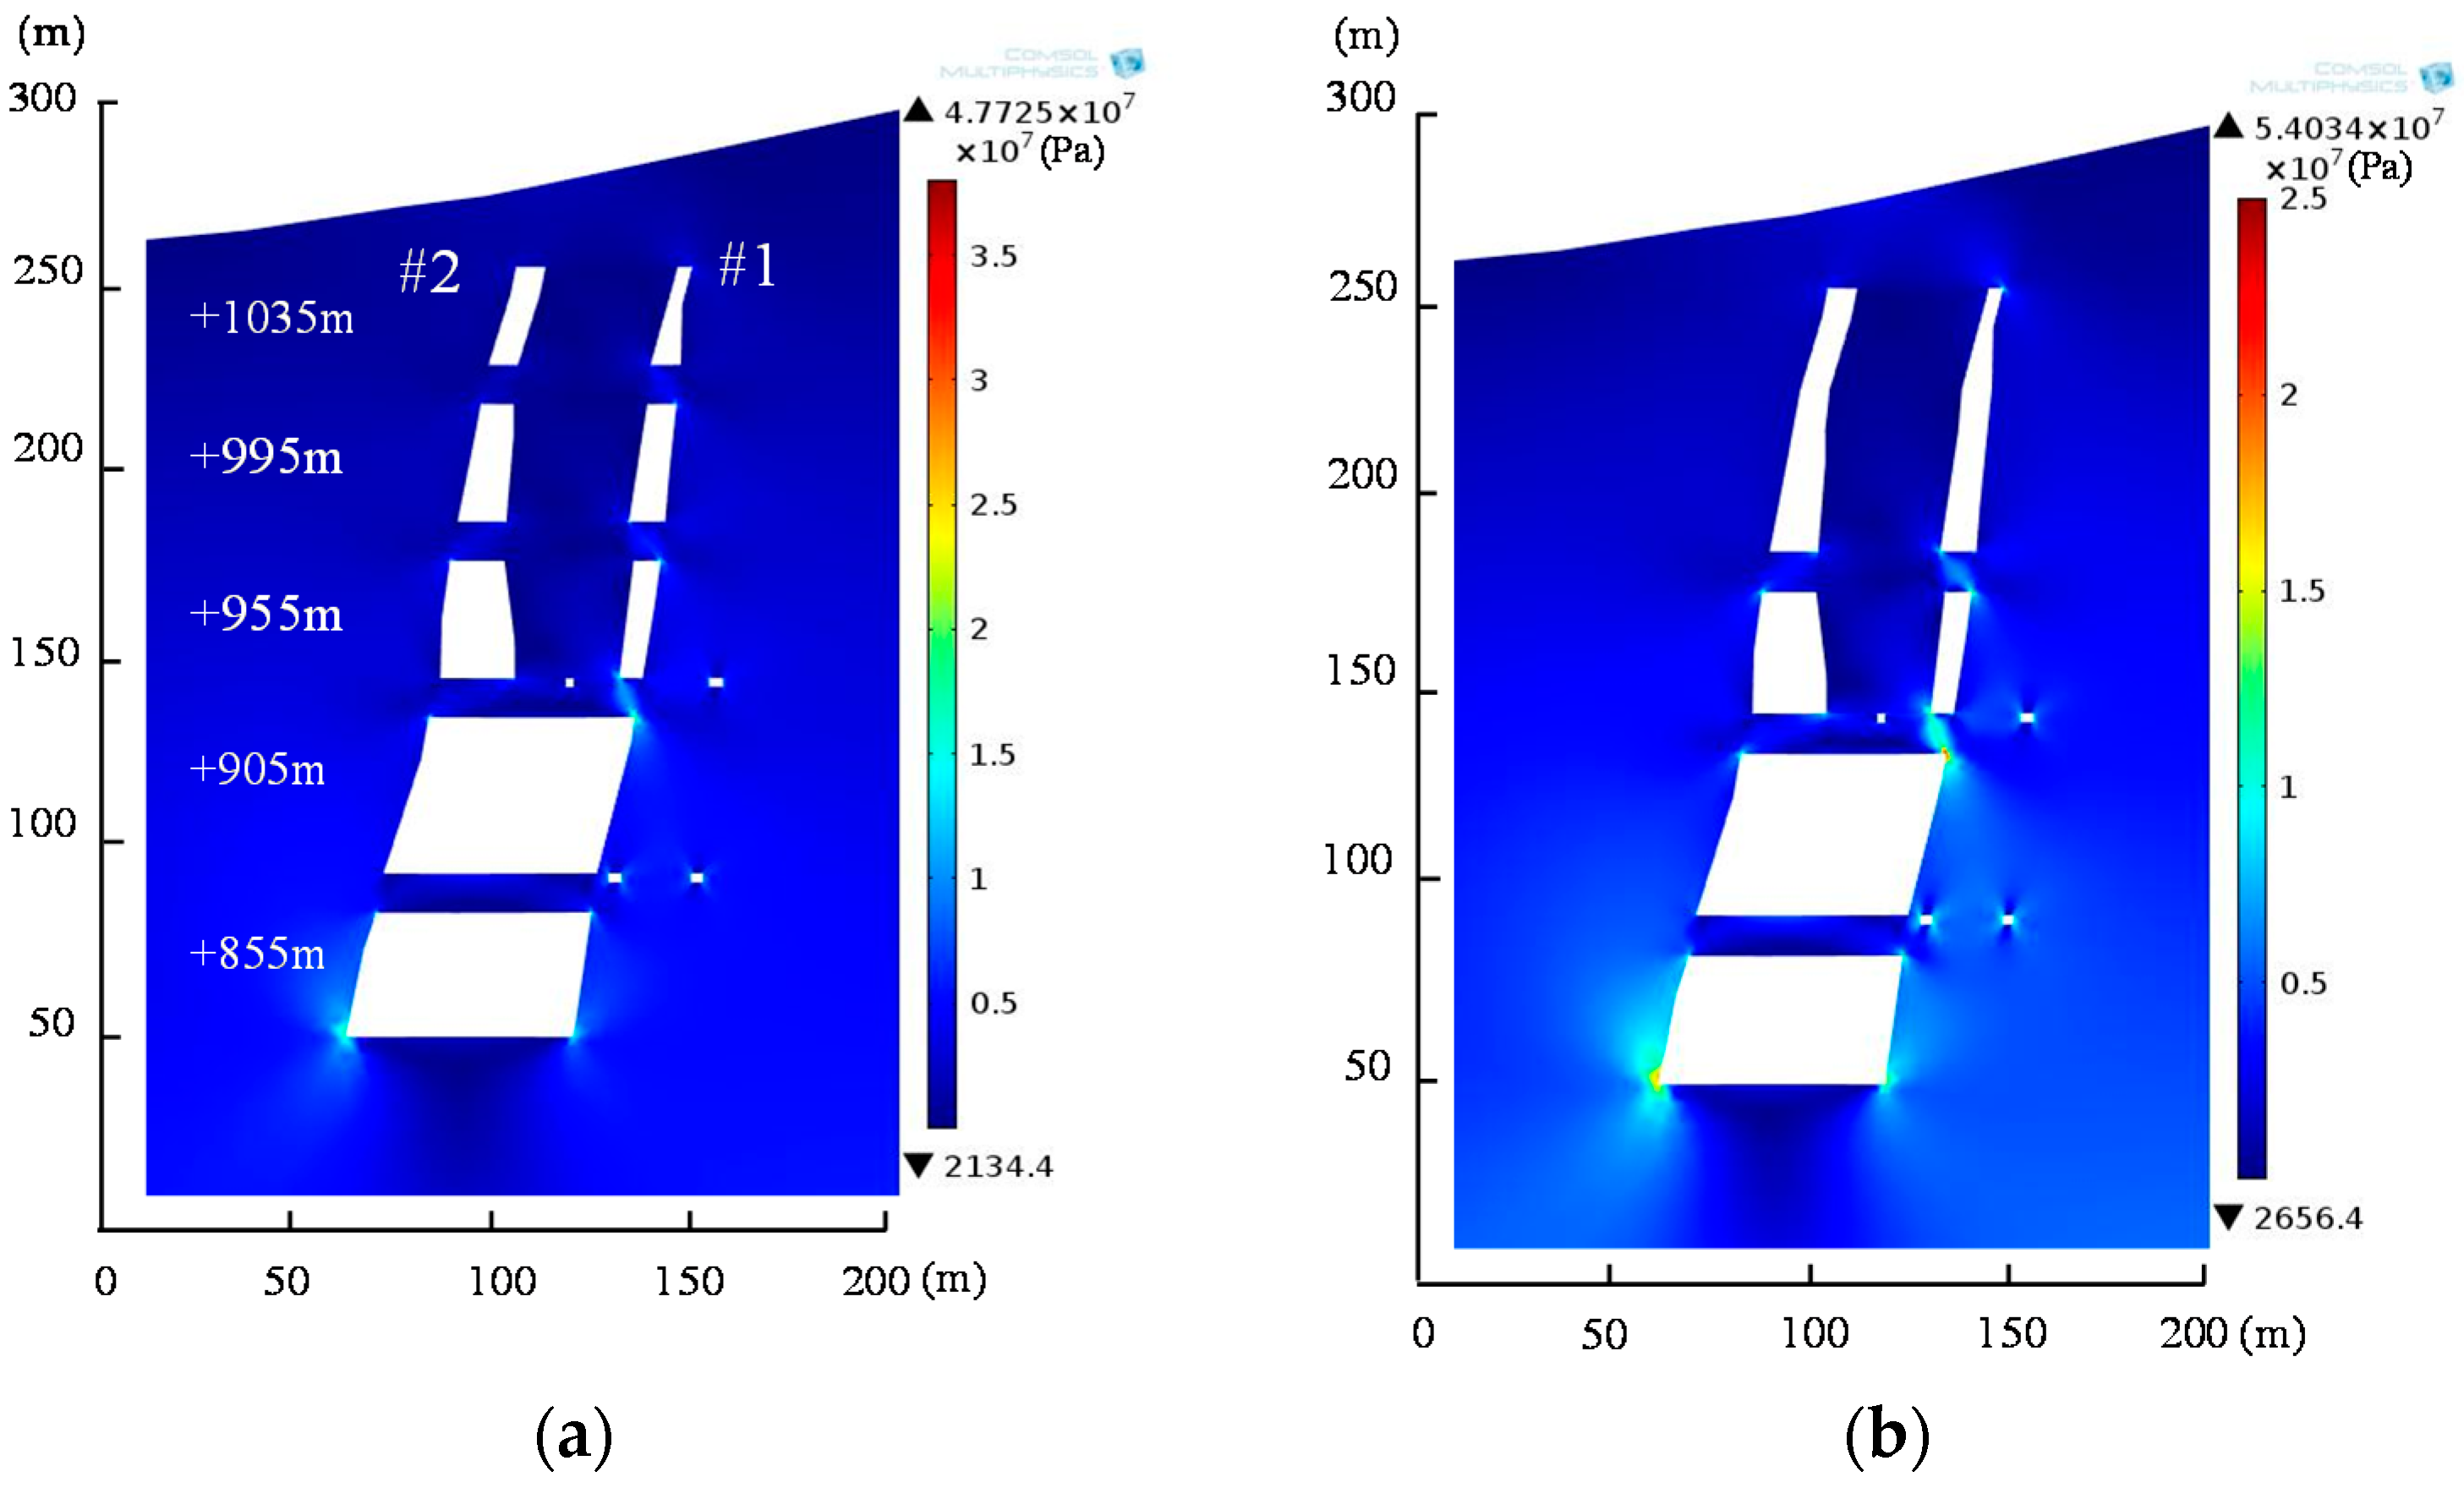
Figure 11 shows the surrounding rock dynamic failure mechanism in pillar recovery, while
Figure 11a–e represent the stress nephograms of pillar recovery from the +1035 to +855 m level. Before pillar recovery, the goafs are relatively stable and no obvious stress concentration appears.
Figure 11a shows that little stress influences appear in the surrounding rock during the pillar recovery of the +1035 m level, except for a tiny stress concentration that appears at the +955 m level.
Figure 11b shows that no stress influences appear in the orebody #2 surrounding rock during the recovery of pillars in the +995 m level, but one stress concentration appears in the floor.
Figure 11c shows that the marble interlayer loses the surrounding rock support and presses its whole weight on the floor of the +955 m level when the pillars are recovered, which causes the floor stress to be highly concentrated and forms a single bevel shear failure in it. Meanwhile, plastic damage appears in the hanging wall bottom in the +855 m level.
Figure 11d shows that the marble interlayer hangs in the air after the roofs and pillars of the +905 m level are recovered, which causes damage to the ground surface and results in a large amount of tension-shear stresses appearing in it. Meanwhile, partial damage appears in the top goafs of orebodies #1and #2 and the plastic damage areas in the +855 m level are extending.
Figure 11e shows that the ground surface stress concentration degrees are aggravated and the surrounding rock damage areas are extended on a large scale, which cause the degree of marble interlayer sinking to increase. Large areas of damage are produced in the top goaf of orebody #2 and extend upwards to the top of orebody #1. This damage intersects in the ground surface and causes the surface to collapse, further causing the marble interlayer collapse. Meanwhile, the footwall damage areas extend in a prolonged manner and upwards, which finally causes the footwall haul road in the +905 m level to collapse.
Above all,the marble interlayer first ceases to bind, causing a single bevel shear failure to appear in the floor after the recovery of pillars in the +955 m level. The marble interlayer then hangs in the air and causes many tensile-shear failures to concentrate in the ground surface after the recovery of pillars in the +905 m level. Finally, the marble interlayer is destroyed and sinks after the recovery of pillars in the +855 m level, with a large-scale collapse occurring at the surface.
6. Crack Evolution Rule Analysis
A considerable amount of macroscopic analysis has been given above for analyzing the failure mode of rock mass. Hence, some microcosmic analyses are shown for analyzing the crack evolution mechanism in the recovery of the 5107 pillars, combined with the moment tensor inversion and the stress field nephogram.
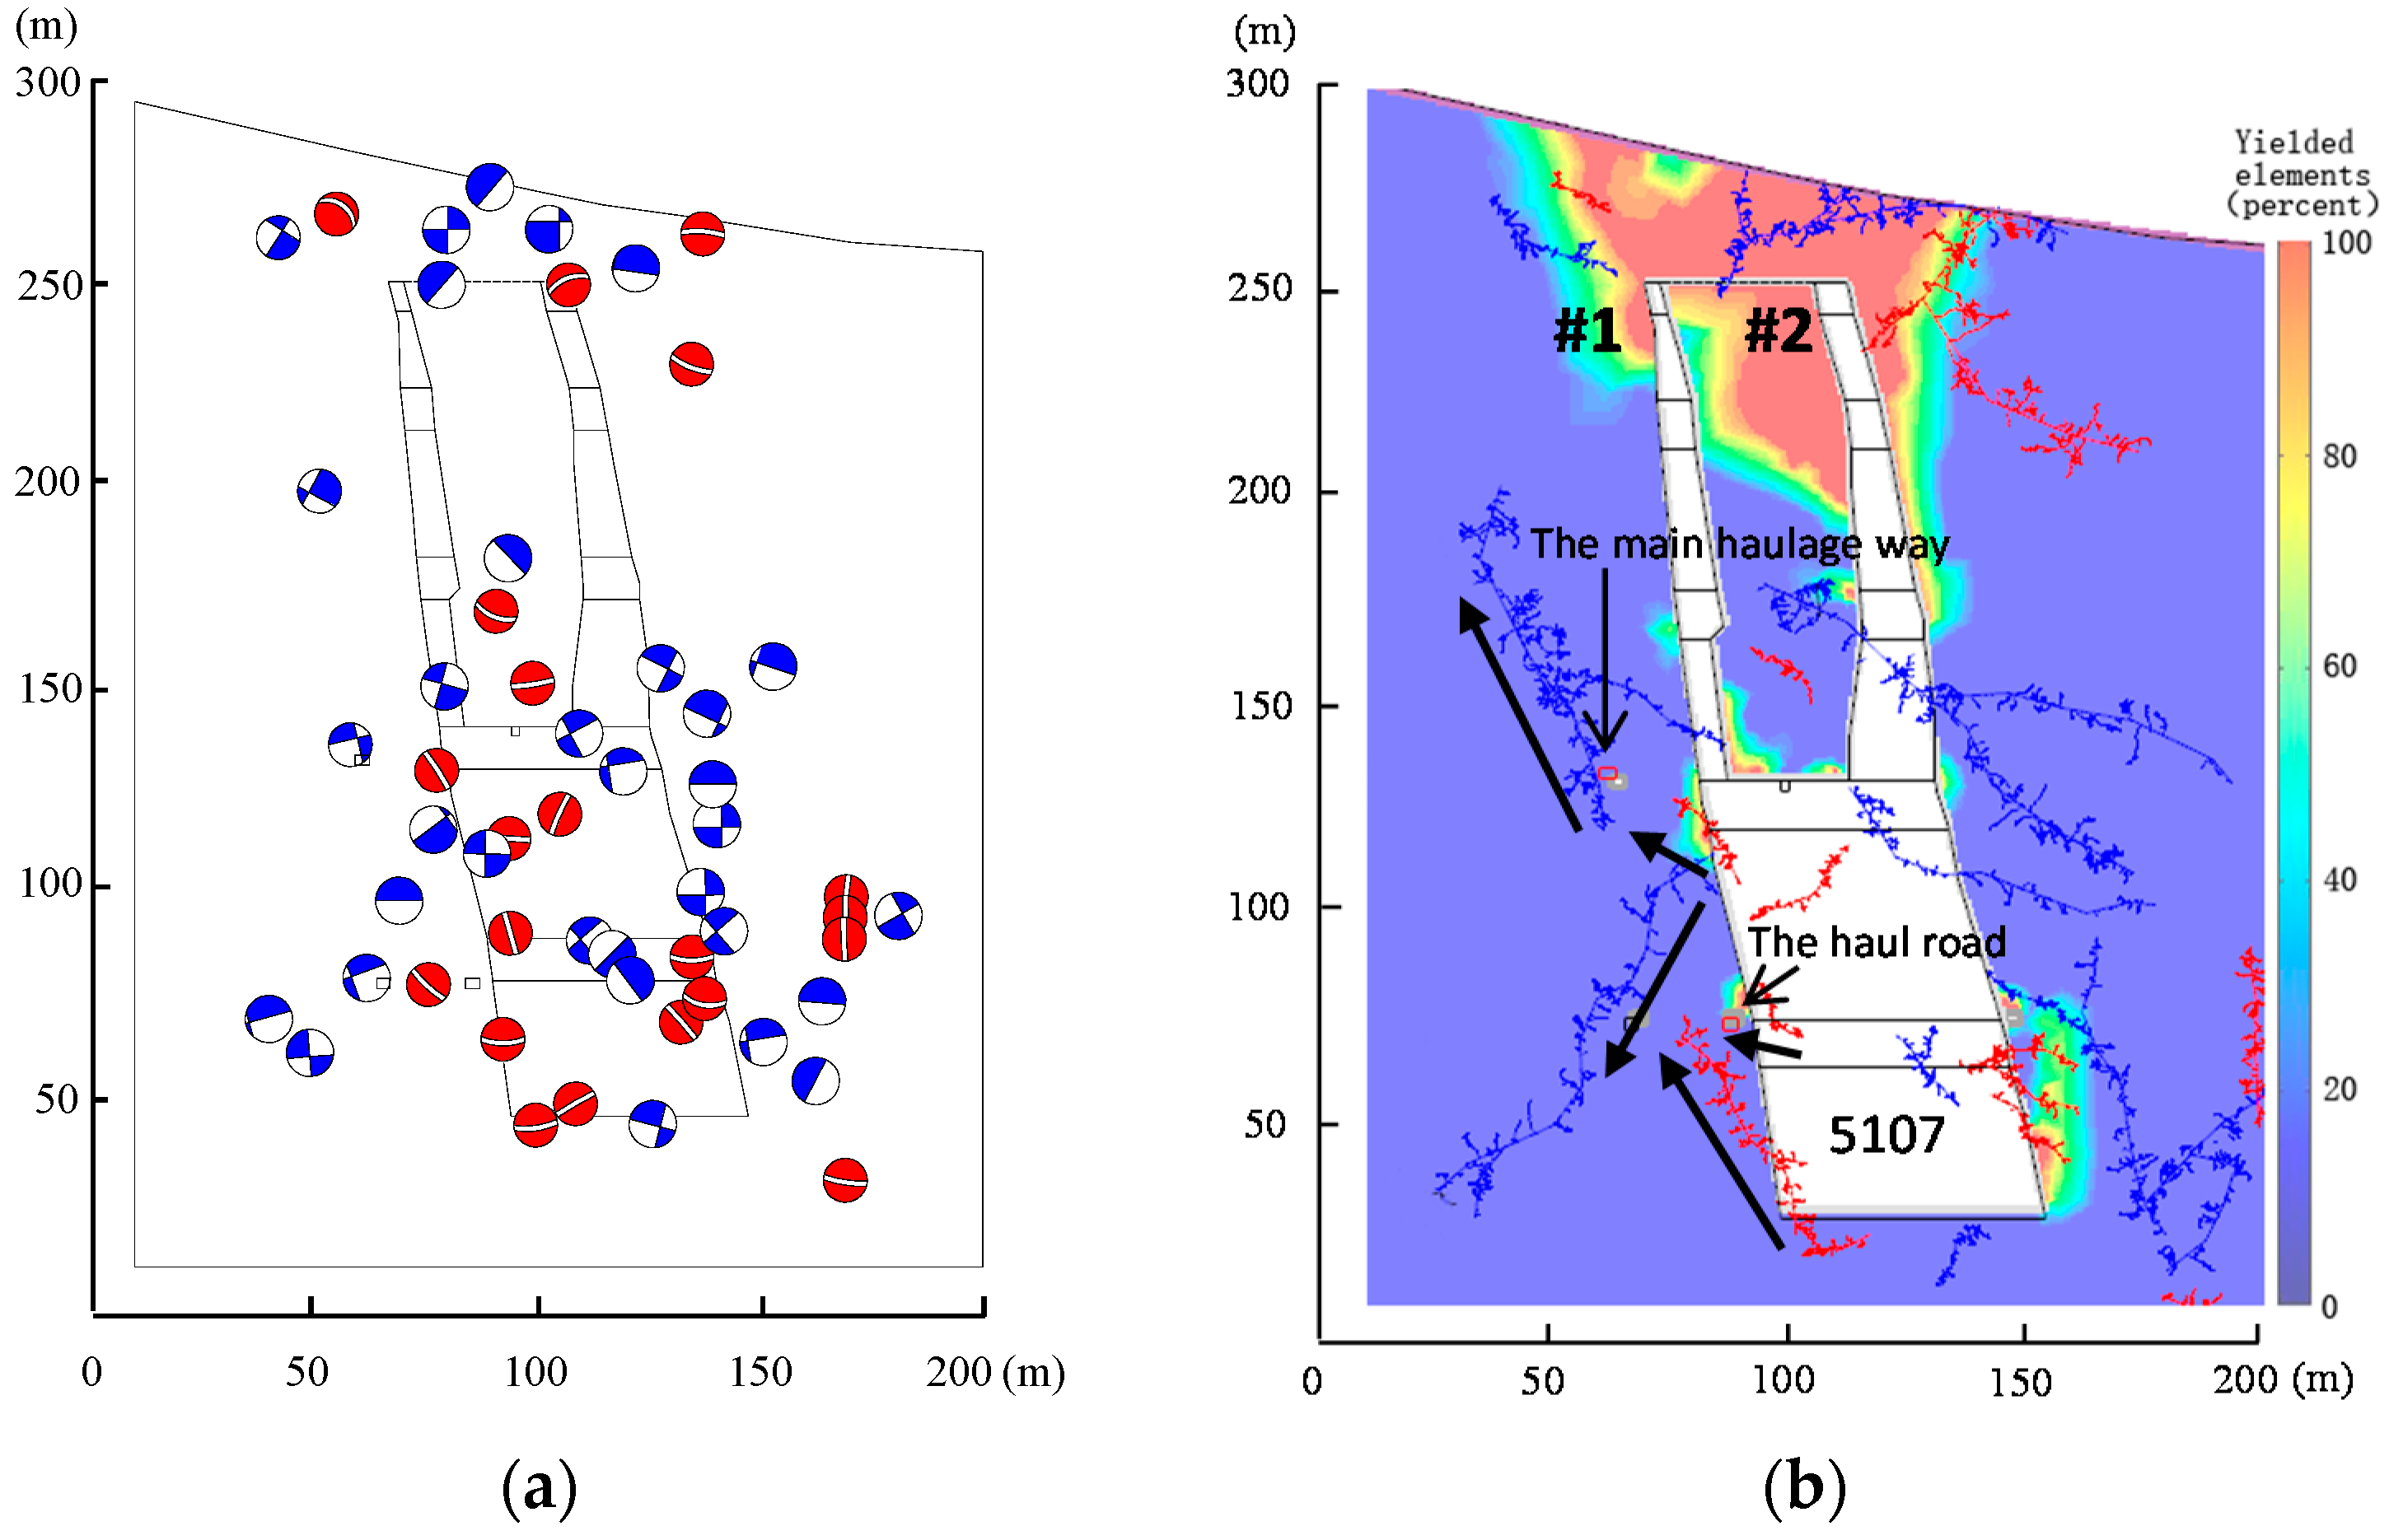
Figure 12 shows the mechanism of crack evolution in the surrounding rock during the recovery of 5107 pillars.
Figure 12a represents the rock mass failure mode in moment tensor inversion, the red moment tensor balls represent tension failures, and the blue moment tensor balls represent shear failures. The crack evolution mechanism can be acquired by connecting the rupture directivity of the moment tensor balls.
Figure 12b represents the crack evolution mechanism with the plastic zone nephogram.
Figure 12a shows the failure mode of rock mass in the moment tensor inversion. The rock mass failures are mainly concentrated in the hanging wall, footwall, and ground surface. Many blue moment tensor balls are concentrated in the hanging wall, and the rock mass is destroyed in shear stresses. Many red moment tensor balls are concentrated in the footwall, and the rock mass is destroyed by tensile stresses. Several blue moment tensor balls are concentrated in the roofs of the +955 and +905 m levels, and the roofs are destroyed by shear stresses. Many red moment tensor balls are concentrated in each footing, and the footings are destroyed in tensile stresses. In the ground surface, blue moment tensor balls are mainly concentrated and the ground surface is destroyed by shear stresses. Red and blue moment tensor balls are concentrated in the footwall haul road and the footwall haulage way, and the roadways are destroyed by both tensile stresses and shear stresses.
Figure 12b shows the crack evolution mechanism in the roadway chain failure in the recovery of 5107 pillars. Before the recovery, tensile cracks existed in the footwall footing of the +855 m level and extended upwards to the +905 m level, which did not cause the surrounding rock damage. However, after the recovery of 5107 pillars, the footwall haul road was damaged and collapsed due to the cut-through cracks, which are composed of the upward cracks and the newly generated tensile cracks in the mined-out roof region. Those cracks then continued extending upwards and converged with the slanting shear cracks, which collectively formed a triangular failure in the footwall rock. Finally, the failure caused the tensile cracks and shear cracks in the haulageway to extend and connect, which formed the haulageway chain failure.
In the ground surface crack evolution failure mechanism, the saffron areas represent the plastic zone. Tensile cracks are generated in the top of orebody #2, extending upwards and obliquely, which causes the tensile failure profile in the hanging wall rock. Analogously, shear cracks generated in the top of orebody #1 extend upwards and obliquely, forming the shear failure profile in the footwall rock. Above the marble interlayer, many tensile cracks and shear cracks exist and incise in the ground surface, which cause the ground surface to collapse outwards stepwise.
7. Discussion
(1) The internal fracture expansion mode of the rock mass in the pillar recovery was obtained, in addition to the development and evolution of the rock mass fracture during the large-scale ore body recovery being obtained. The damage process and the cause of the destruction of the hanging wall, the footwall, and the ground surface were determined. The analysis of these fracture modes and the determination of the damage contours can be used to recognize the damage development process of the mine at each recovery stage, allowing for the intuitive understanding of the overall failure process to be obtained. The research results can be used to analogically analyze the destruction of surrounding rock in other unrecovered areas, providing an important reference and guidance for the subsequent recovery in other areas.
(2) Combined with the site excavation plan, this paper analyzes the number of microseismic events and the energy released when mining different ore bodies, which determines the direct impact of each mining on the surrounding rock. The causes of the rock mass collapses, the threshold of the microseismic event, and the induced time were analyzed. The determination of these thresholds clearly defines the critical values that may cause collapse and plays a very important role in guiding safe mining. In the process of mining, when a factor reaches the threshold, the site staff should immediately start the corresponding emergency safety measures and prepare security well, reducing the risk to a minimum.
(3) The surrounding rock failure mechanism in multi-stage mining, the mechanical state of marble interlayer, and the mechanical mechanism of surface collapse are obtained. Combined with the moment tensor theory, the crack evolution rule of roadway chain collapse was obtained. This determines that the recovery of 5107 roof caused the collapse of the footwall haul road and induced the collapse of the footwall haulage way. The roadway chain collapse mechanism provides a possible impact to the surrounding rock in roof recovery, which provides theoretical guidance for similar mines in deep mining.
(4) The combination of the microseismic monitoring technique, moment tensor theory, and numerical simulation can realize the process of the macroscopic fracture of rock mass to the surrounding rock failure mechanism and the micro-crack evolution rule, which is important for engineering applications and safety guidance. The research methods and results can be applied and used in other similar mines, guiding safe mining and reducing unnecessary damage and collapse during the mining process. These are important contributions to the mine safety.
8. Conclusions
(1) In the rock mass failure mechanism, failures were first produced within the +955 m level, extending through the hanging wall to the ground surface, then moving to the footwall and forming the ground surface collapse outline. Meanwhile, many shear failures occured in the footwall surface, extending downward in an arc-shaped path to the +905 m level and forming the footwall destruction outline. In this process, many shear failures are produced in the ore body and hanging wall rock, gradually extending to the surface and forming the hanging wall destruction outline. Ultimately, these collectively caused the large-scale failures.
(2) In the surrounding rock dynamic failure mechanism, the marble interlayer first ceased to bind, causing a single bevel shear failure to appear in the floor of the +955 m level after the recovery of pillars in the +955 m level. The marble interlayer then hung in the air and caused many tensile-shear failures to concentrate in the ground surface after the recovery of pillars in the +955 m level. Finally, the marble interlayer was destroyed and sank after the recovery of pillars in the +855 m level, with a large-scale collapse occurring at the surface.
(3) In the surface collapse mechanism, tensile cracks generated in the top of orebody #2 extended upwards and obliquely, which caused the tensile failure profile in the hanging wall rock. Analogously, shear cracks were generated in the top of orebody #1, extending upwards and obliquely, forming the shear failure profile in the footwall rock. Above the marble interlayer, many tensile cracks and shear cracks exist and incise in the ground surface, which cause the ground surface to collapse outwards stepwise.
(4) In the crack evolution mechanism in the roadway chain failure process, tensile cracks existed in the footwall footing of the +855 m level and extended upwards to the +905 m level before the recovery of 5107 pillar. After the recovery, the footwall haul road was damaged and collapsed due to cut-through cracks composed of upward cracks and tensile cracks. Those cracks then continued extending upwards and converged with the slanting shear cracks, which formed a triangular failure in the footwall rock. Finally, the failure caused the tensile cracks and shear cracks in the haulageway in the +955 m level to extend and connect, which formed the haulageway chain failure.
(5) Combined with microseismic monitoring, numerical simulation, and the rock mass failure mechanism, the surrounding rock dynamic failure mechanism, the surface collapse mechanism, and the roadway chain failure process mechanism are examined. Each research study can be important for safety guidance in mining, allowing mine staff to understand the direct causes and the damage processes of each collapse. This can allow them to prevent the occurrence of dangerous accidents in advance. The research methods and research results can be applied and used in other similar mines, guiding safe mining and reducing the unnecessary damage and collapse during the mining process. These are important contributions to the mine safety.


 ,
,  represent tension failure, the blue signals
  represent shear failure, the green signals
  represent mixed failure, the circles represent the fracture surface, and the arrows represent the fracture direction.

 : room;
  : roof;
  : marble;
  : the haul road;
  : the haulage way in the +955 m level;
  : the haulage way in the +905 m level.


 : the ground surface;
  : the marble interlayer;
  : room;
  : the ore body profile; +855 m, +905 m, +955 m, +995 m and +1035 m means the different sublevels;
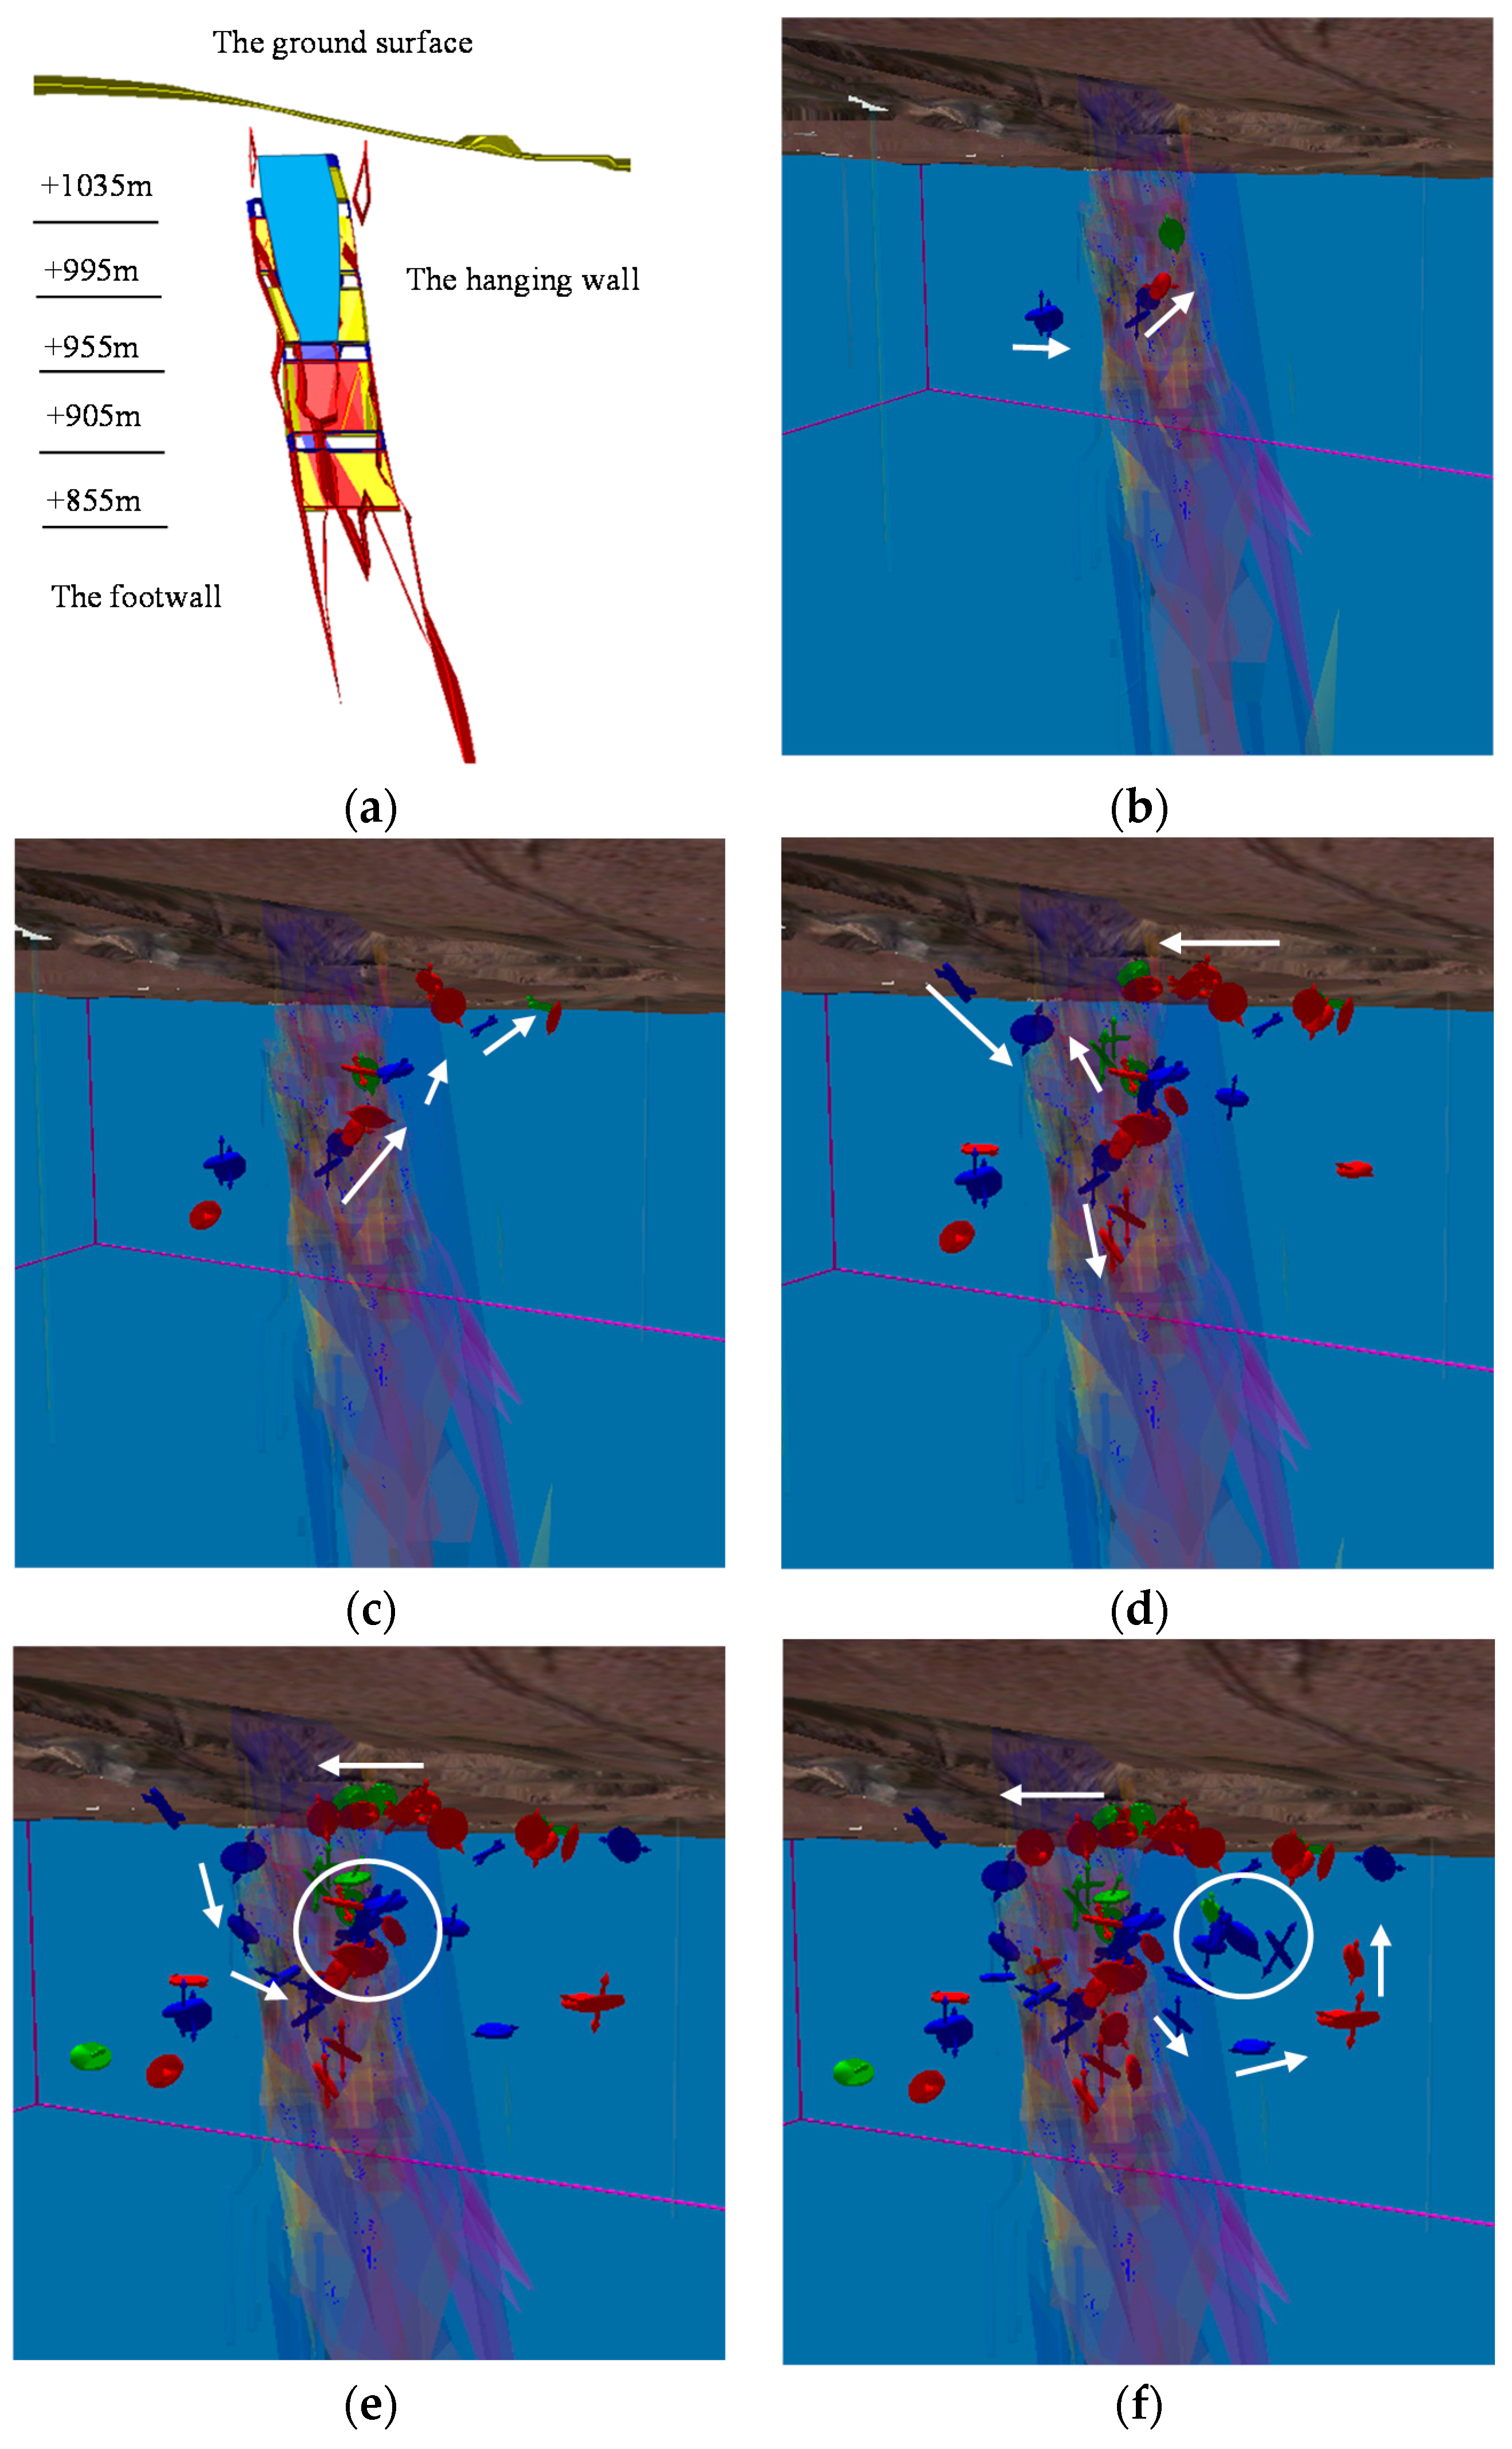

 : roof;
  : pillar;
  : room;
  : the mined-out area;
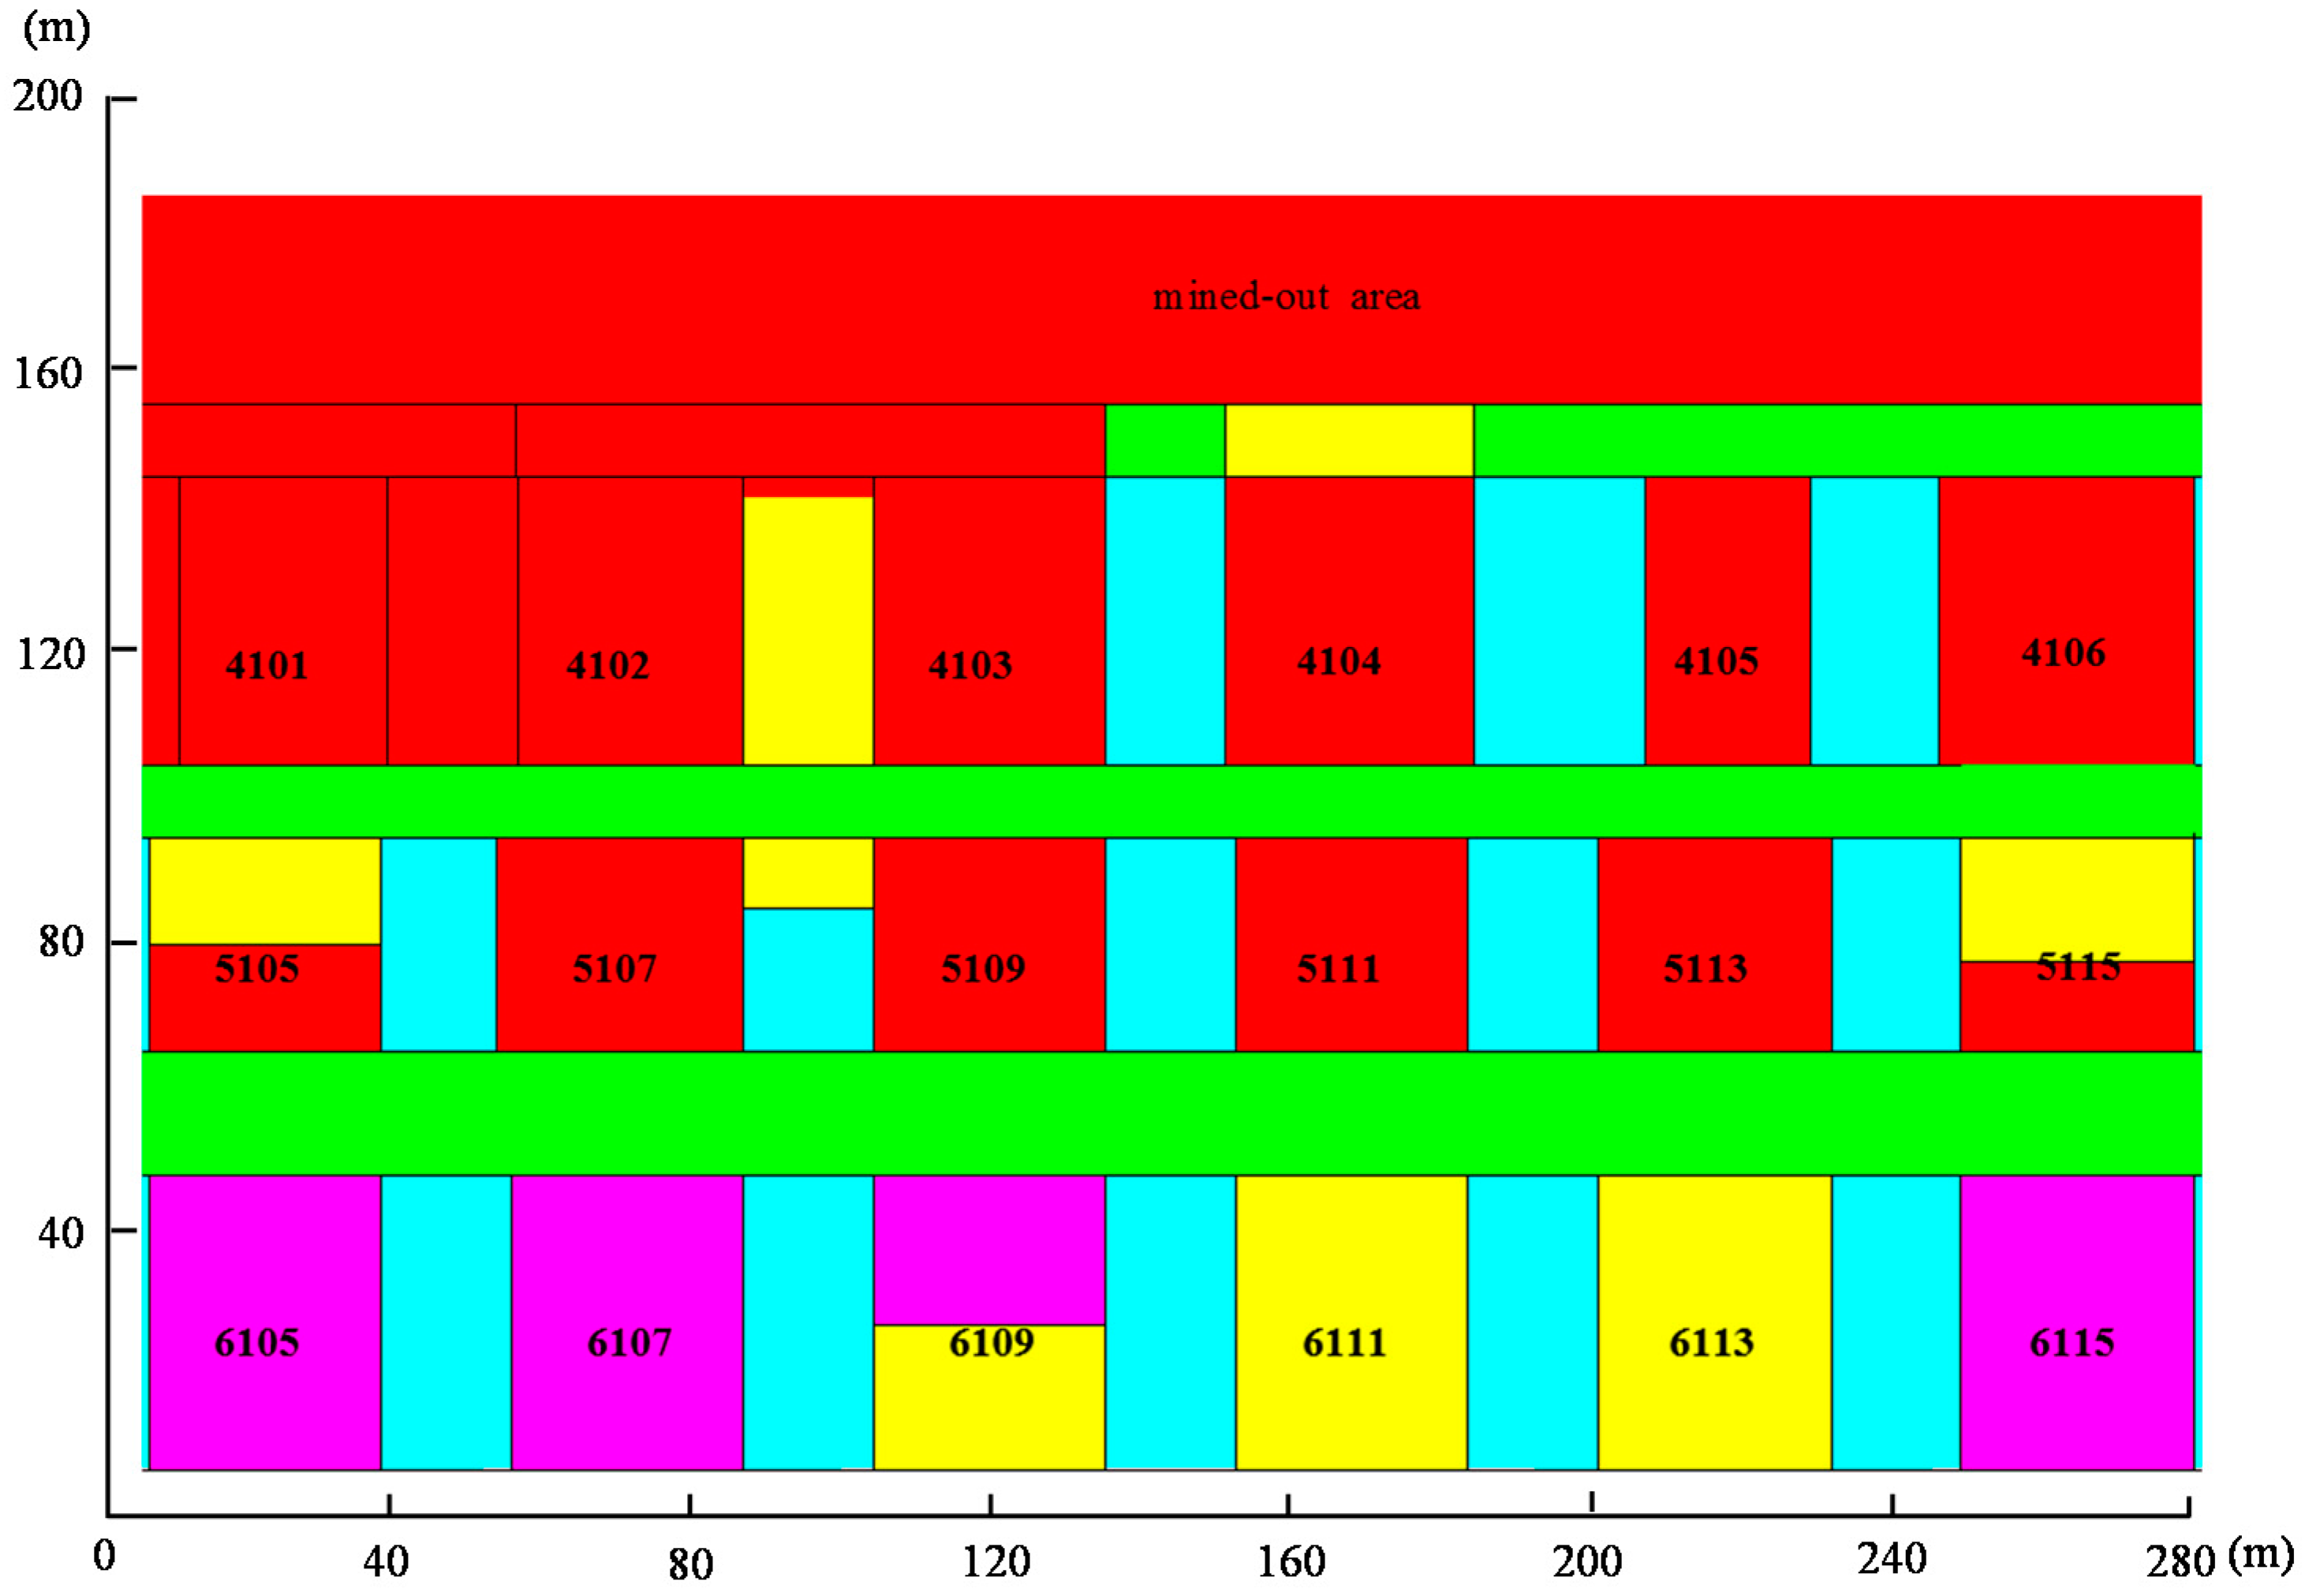

