
Insights into Ferric Leaching of Low Grade Metal Sulfide-Containing ores in an Unsaturated Ore Bed Using X-ray Computed Tomography

 ,
,  , , , and
Abstract
:1. Introduction
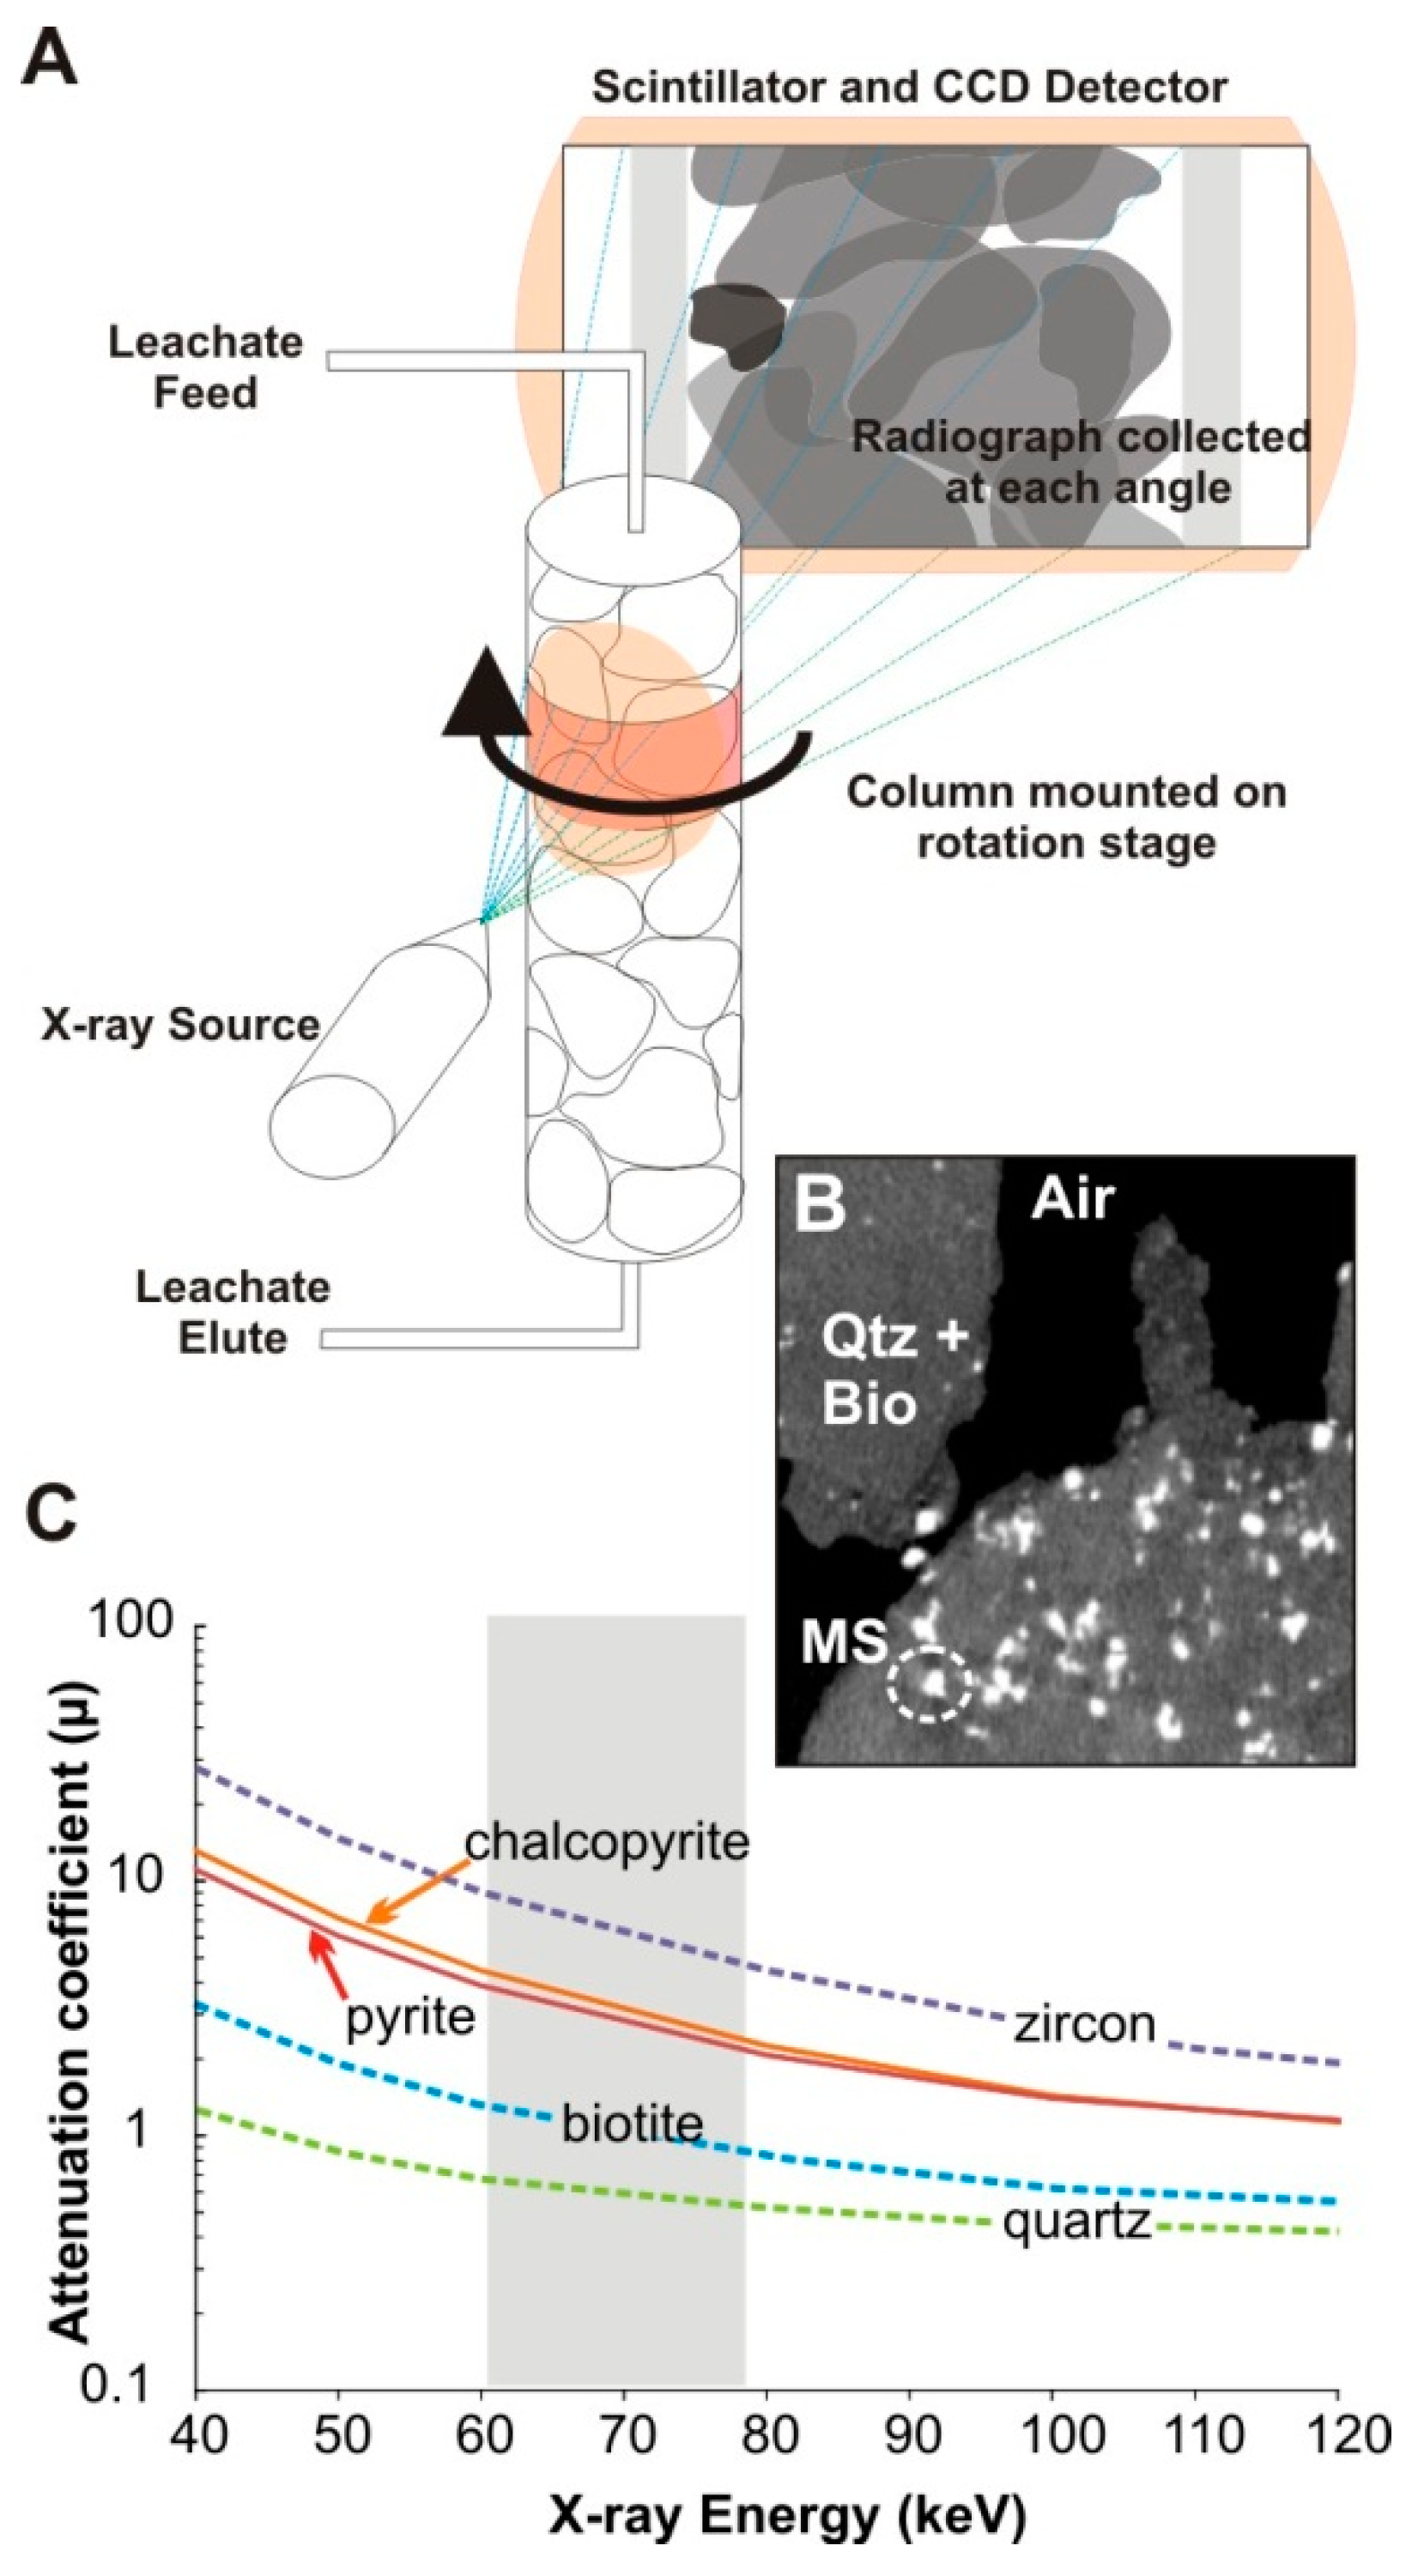
2. µCT of Laboratory Scale Columns
3. µCT as a Tool for Assessing Compositional and Behavioural Heterogeneity
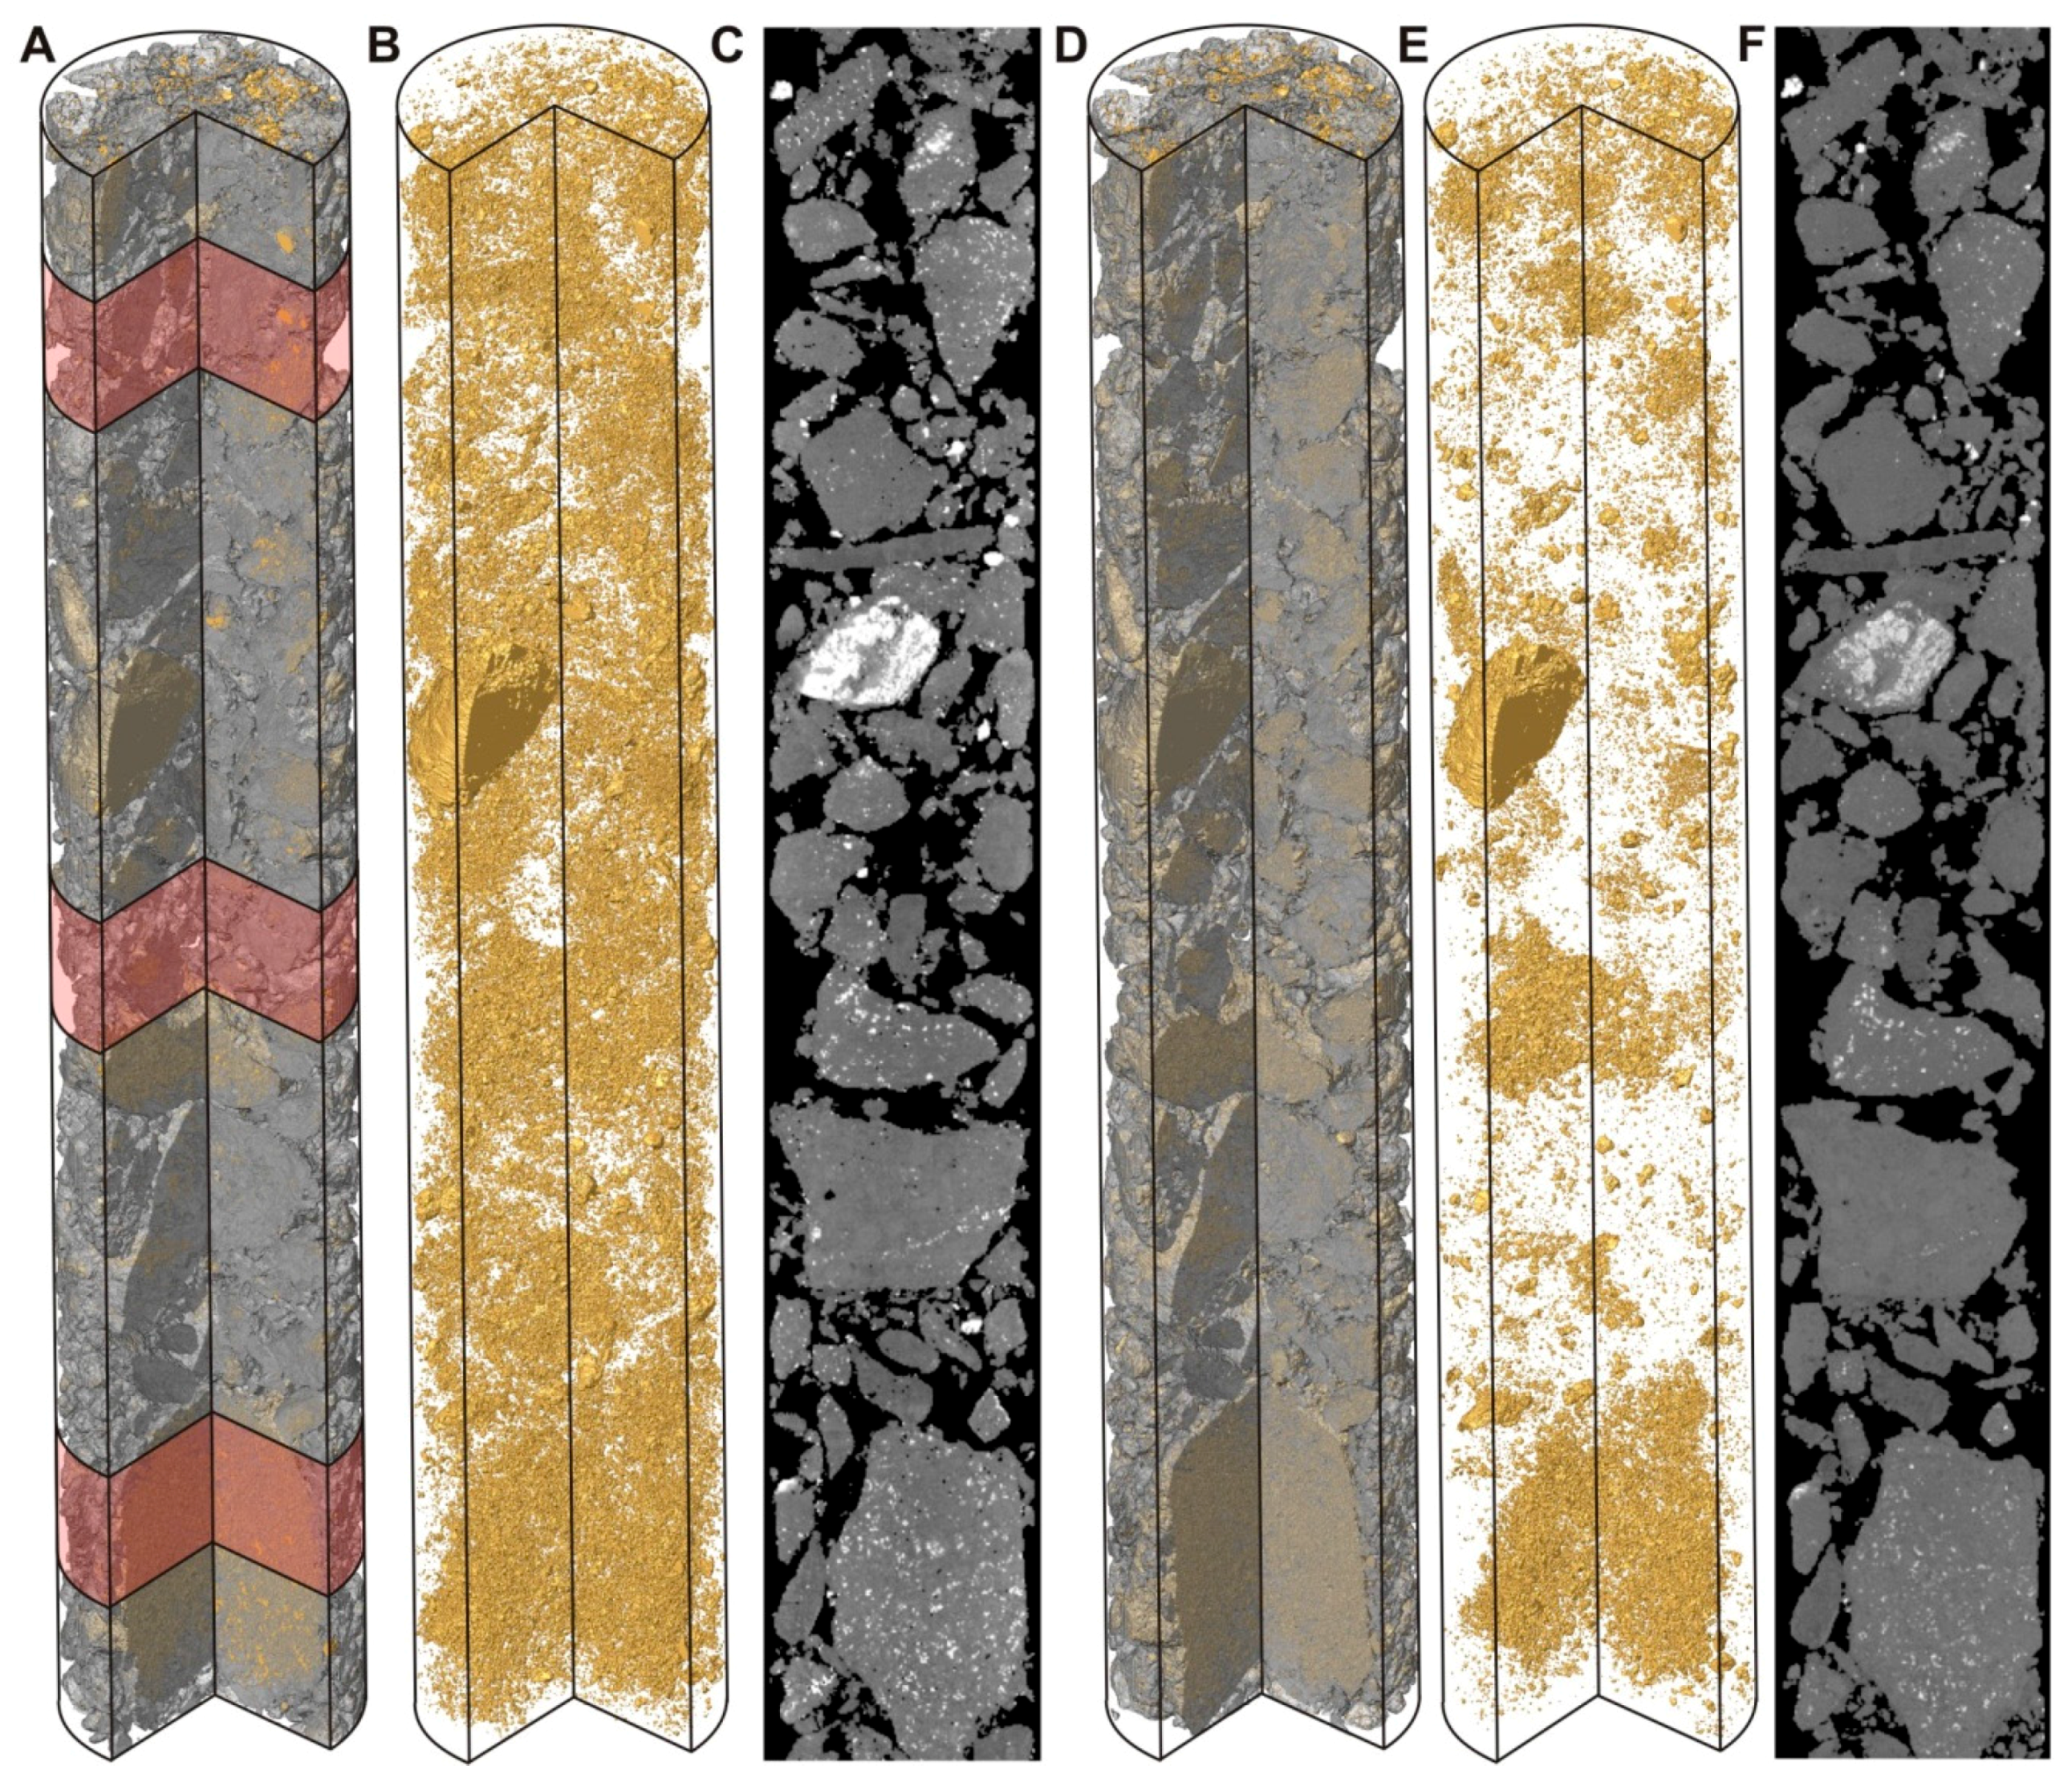
3.1. Qualitative Observation of an Ore during Leaching
4. Quantitative Assessment
4.1. Column Scale Parameters and Bulk Leaching Behaviour
4.2. Volume & Fragment Scale Behaviour
5. Quantification of Ore Exposure
5.1. Volume Scale Behaviours
5.2. Fragment Scale Behaviours
6. Spatial Heterogeneity in MS Leaching Behaviour
7. Conclusions
Acknowledgments
Author Contributions
Conflicts of Interest
References
- Kotsiopouios, A.; Harrrison, S.T.L. Application of fine desulfurised coal tailings as a neutralising barrier in the prevention of acid rock drainage. Hydrometallurgy 2017, 168, 159–166. [Google Scholar] [CrossRef]
- Bartlett, R.W. Metal extraction from ores by heap leaching. Metall. Mater. Trans. B Process Metall. Mater. Process. Sci. 1997, 28, 529–545. [Google Scholar] [CrossRef]
- Brierley, J.A. A perspective on developments in biohydrometallurgy. Hydrometallurgy 2008, 94, 2–7. [Google Scholar] [CrossRef]
- Petersen, J.; Dixon, D.G. Modelling zinc heap bioleaching. Hydrometallurgy 2007, 85, 127143. [Google Scholar] [CrossRef]
- Watling, H.R. The bioleaching of nickel-copper sulfides. Hydrometallurgy 2008, 91, 70–88. [Google Scholar] [CrossRef]
- Watling, H.R. The bioleaching of sulphide minerals with emphasis on copper sulphides—A review. Hydrometallurgy 2006, 84, 81–108. [Google Scholar] [CrossRef]
- Leahy, M.J.; Schwarz, M.P. Modelling jarosite precipitation in isothermal chalcopyrite bioleaching columns. Hydrometallurgy 2009, 98, 181–191. [Google Scholar] [CrossRef]
- Breed, A.W.; Hansford, G.S. Modelling continuous bioleach reactors. Biotechnol. Bioeng. 1999, 64, 671–677. [Google Scholar] [CrossRef]
- Breed, A.W.; Hansford, G.S. Studies on the mechanism and kinetics of bioleaching. Miner. Eng. 1999, 12, 383–392. [Google Scholar] [CrossRef]
- Cordoba, E.M.; Muñozb, J.A.; Blázquezb, M.L.; Gonzálezb, F.; Ballesterb, A. Leaching of chalcopyrite with ferric ion. Part I: General aspects. Hydrometallurgy 2008, 93, 81–87. [Google Scholar] [CrossRef]
- Ketcham, R.A.; Carlson, W.D. Acquisition, optimization and interpretation of X-ray computed tomographic imagery: applications to the geosciences. Comput. Geosci. 2001, 27, 381–400. [Google Scholar] [CrossRef]
- Stock, S.R. Recent advances in X-ray microtomography applied to materials. Int. Mater. Rev. 2008, 53, 129–181. [Google Scholar] [CrossRef]
- Lin, C.L.; Miller, J.D. 3D characterization and analysis of particle shape using X-ray microtomography (XMT). Powder Technol. 2005, 154, 61–69. [Google Scholar] [CrossRef]
- Ghorbani, Y.; Becker, M.; Mainza, A.; Franzidis, J.P.; Petersen, J. Large particle effects in chemical/biochemical heap leach processes—A review. Miner. Eng. 2011, 24, 1172–1184. [Google Scholar] [CrossRef]
- Ghorbani, Y.; Becker, M.; Petersen, J.; Morar, S.H.; Mainza, A.; Franzidis, J.-P. Use of X-ray computed tomography to investigate crack distribution and mineral dissemination in sphalerite ore particles. Miner. Eng. 2011, 24, 1249–1257. [Google Scholar] [CrossRef]
- Kodali, P.; Dhawan, N.; Depci, T.; Lin, C.L.; Miller, J.D. Particle damage and exposure analysis in HPGR crushing of selected copper ores for column leaching. Miner. Eng. 2011, 24, 1478–1487. [Google Scholar] [CrossRef]
- Miller, J.D.; Lin, C.L.; Garcia, C.; Arias, H. Ultimate recovery in heap leaching operations as established from mineral exposure analysis by X-ray microtomography. Int. J. Miner. Process. 2003, 72, 331–340. [Google Scholar] [CrossRef]
- Ghorbani, Y.; Mainza, A.N.; Petersen, J.; Becker, M.; Franzidis, J.P.; Kalala, J.T. Investigation of particles with high crack density produced by HPGR and its effect on the redistribution of the particle size fraction in heaps. Miner. Eng. 2013, 43–44, 44–51. [Google Scholar] [CrossRef]
- Lin, Q.; Barker, D.J.; Dobson, K.J.; Lee, P.D.; Neethling, S.J. Modelling particle scale leach kinetics based on X-ray computed micro-tomography images. Hydrometallurgy 2016, 162, 25–36. [Google Scholar] [CrossRef]
- Lin, Q.; Neethling, S.; Courtois, L.; Dobson, K.; Lee, P. Multi-scale quantification of leaching performance using X-ray tomography. Hydrometallurgy 2016, 164, 265–277. [Google Scholar] [CrossRef]
- Fagan-Endres, M.A.; Cilliers, J.J.; Sederman, A.J.; Harrison, S.T.L. Spatial variations in leaching of a low-grade, low-porosity chalcopyrite ore identified using X-ray μCT. Miner. Eng. 2017, 105, 63–68. [Google Scholar] [CrossRef]
- Schindelin, J.; Arganda-Carreras, I.; Frise, E.; Kaynig, V.; Longair, M.; Pietzsch, T.; Preibisch, S.; Rueden, C.; Saalfeld, S.; Schmid, B.; et al. Fiji: An open-source platform for biological-image analysis. Nat. Methods 2012, 9, 676–682. [Google Scholar] [CrossRef] [PubMed]
- Africa, C.-J.; van Hille, R.P.; Sand, W.; Harrison, S.T.L. Investigation and in situ visualisation of interfacial interactions of thermophilic microorganisms with metal-sulphides in a simulated heap environment. Miner. Eng. 2013, 48, 100–107. [Google Scholar] [CrossRef]
- Van Hille, R.P.; van Zyl, A.W.; Spurr, N.R.L.; Harrison, S.T.L. Investigating heap bioleaching: Effect of feed iron concentration on bioleaching performance. Miner. Eng. 2010, 23, 518–525. [Google Scholar] [CrossRef]
- Fagan, M.A.; Sederman, A.J.; Johns, M.L. MR imaging of ore for heap bioleaching studies using pure phase encode acquisition methods. J. Magn. Reson. 2012, 216, 121–127. [Google Scholar] [CrossRef] [PubMed]
- Petersen, J. Heap leaching as a key technology for recovery of values from low-grade ores—A brief overview. Hydrometallurgy 2016, 165, 206–212. [Google Scholar] [CrossRef]
- Harrison, S.T.L.; Stevenson, R.; Cilliers, J.J. Assessing solids concentration homogeneity in Rushton-agitated slurry reactors using electrical resistance tomography (ERT). Chem. Eng. Sci. 2012, 71, 392–399. [Google Scholar] [CrossRef]
- Lin, Q.; Neethling, S.J.; Dobson, K.J.; Courtois, L.; Lee, P.D. Quantifying and minimising systematic and random errors in X-ray micro tomography based volume measurements. Comput. Geosci. 2015, 77, 1–7. [Google Scholar] [CrossRef]
- Fagan, M.A.; Sederman, A.J.; Harrison, S.T.L.; Johns, M.L. Phase distribution identification in the column leaching of low grade ores using MRI. Miner. Eng. 2013, 48, 94–99. [Google Scholar] [CrossRef]
- Fagan, M.A.; Ngoma, I.E.; Chiume, R.A.; Minnaar, S.; Sederman, A.J.; Johns, M.L.; Harrison, S.T.L. MRI and gravimetric studies of hydrology in drip irrigated heaps and its effect on the propoagation of bioleaching micro-organisms. Hydrometallurgy 2014, 150, 210–221. [Google Scholar] [CrossRef]
- Ilankoon, I.M.S.K.; Neethling, S.J. Transient liquid holdup and drainage variations in gravity dominated non-porous and porous packed beds. Chem. Eng. Sci. 2014, 116, 398–405. [Google Scholar] [CrossRef]


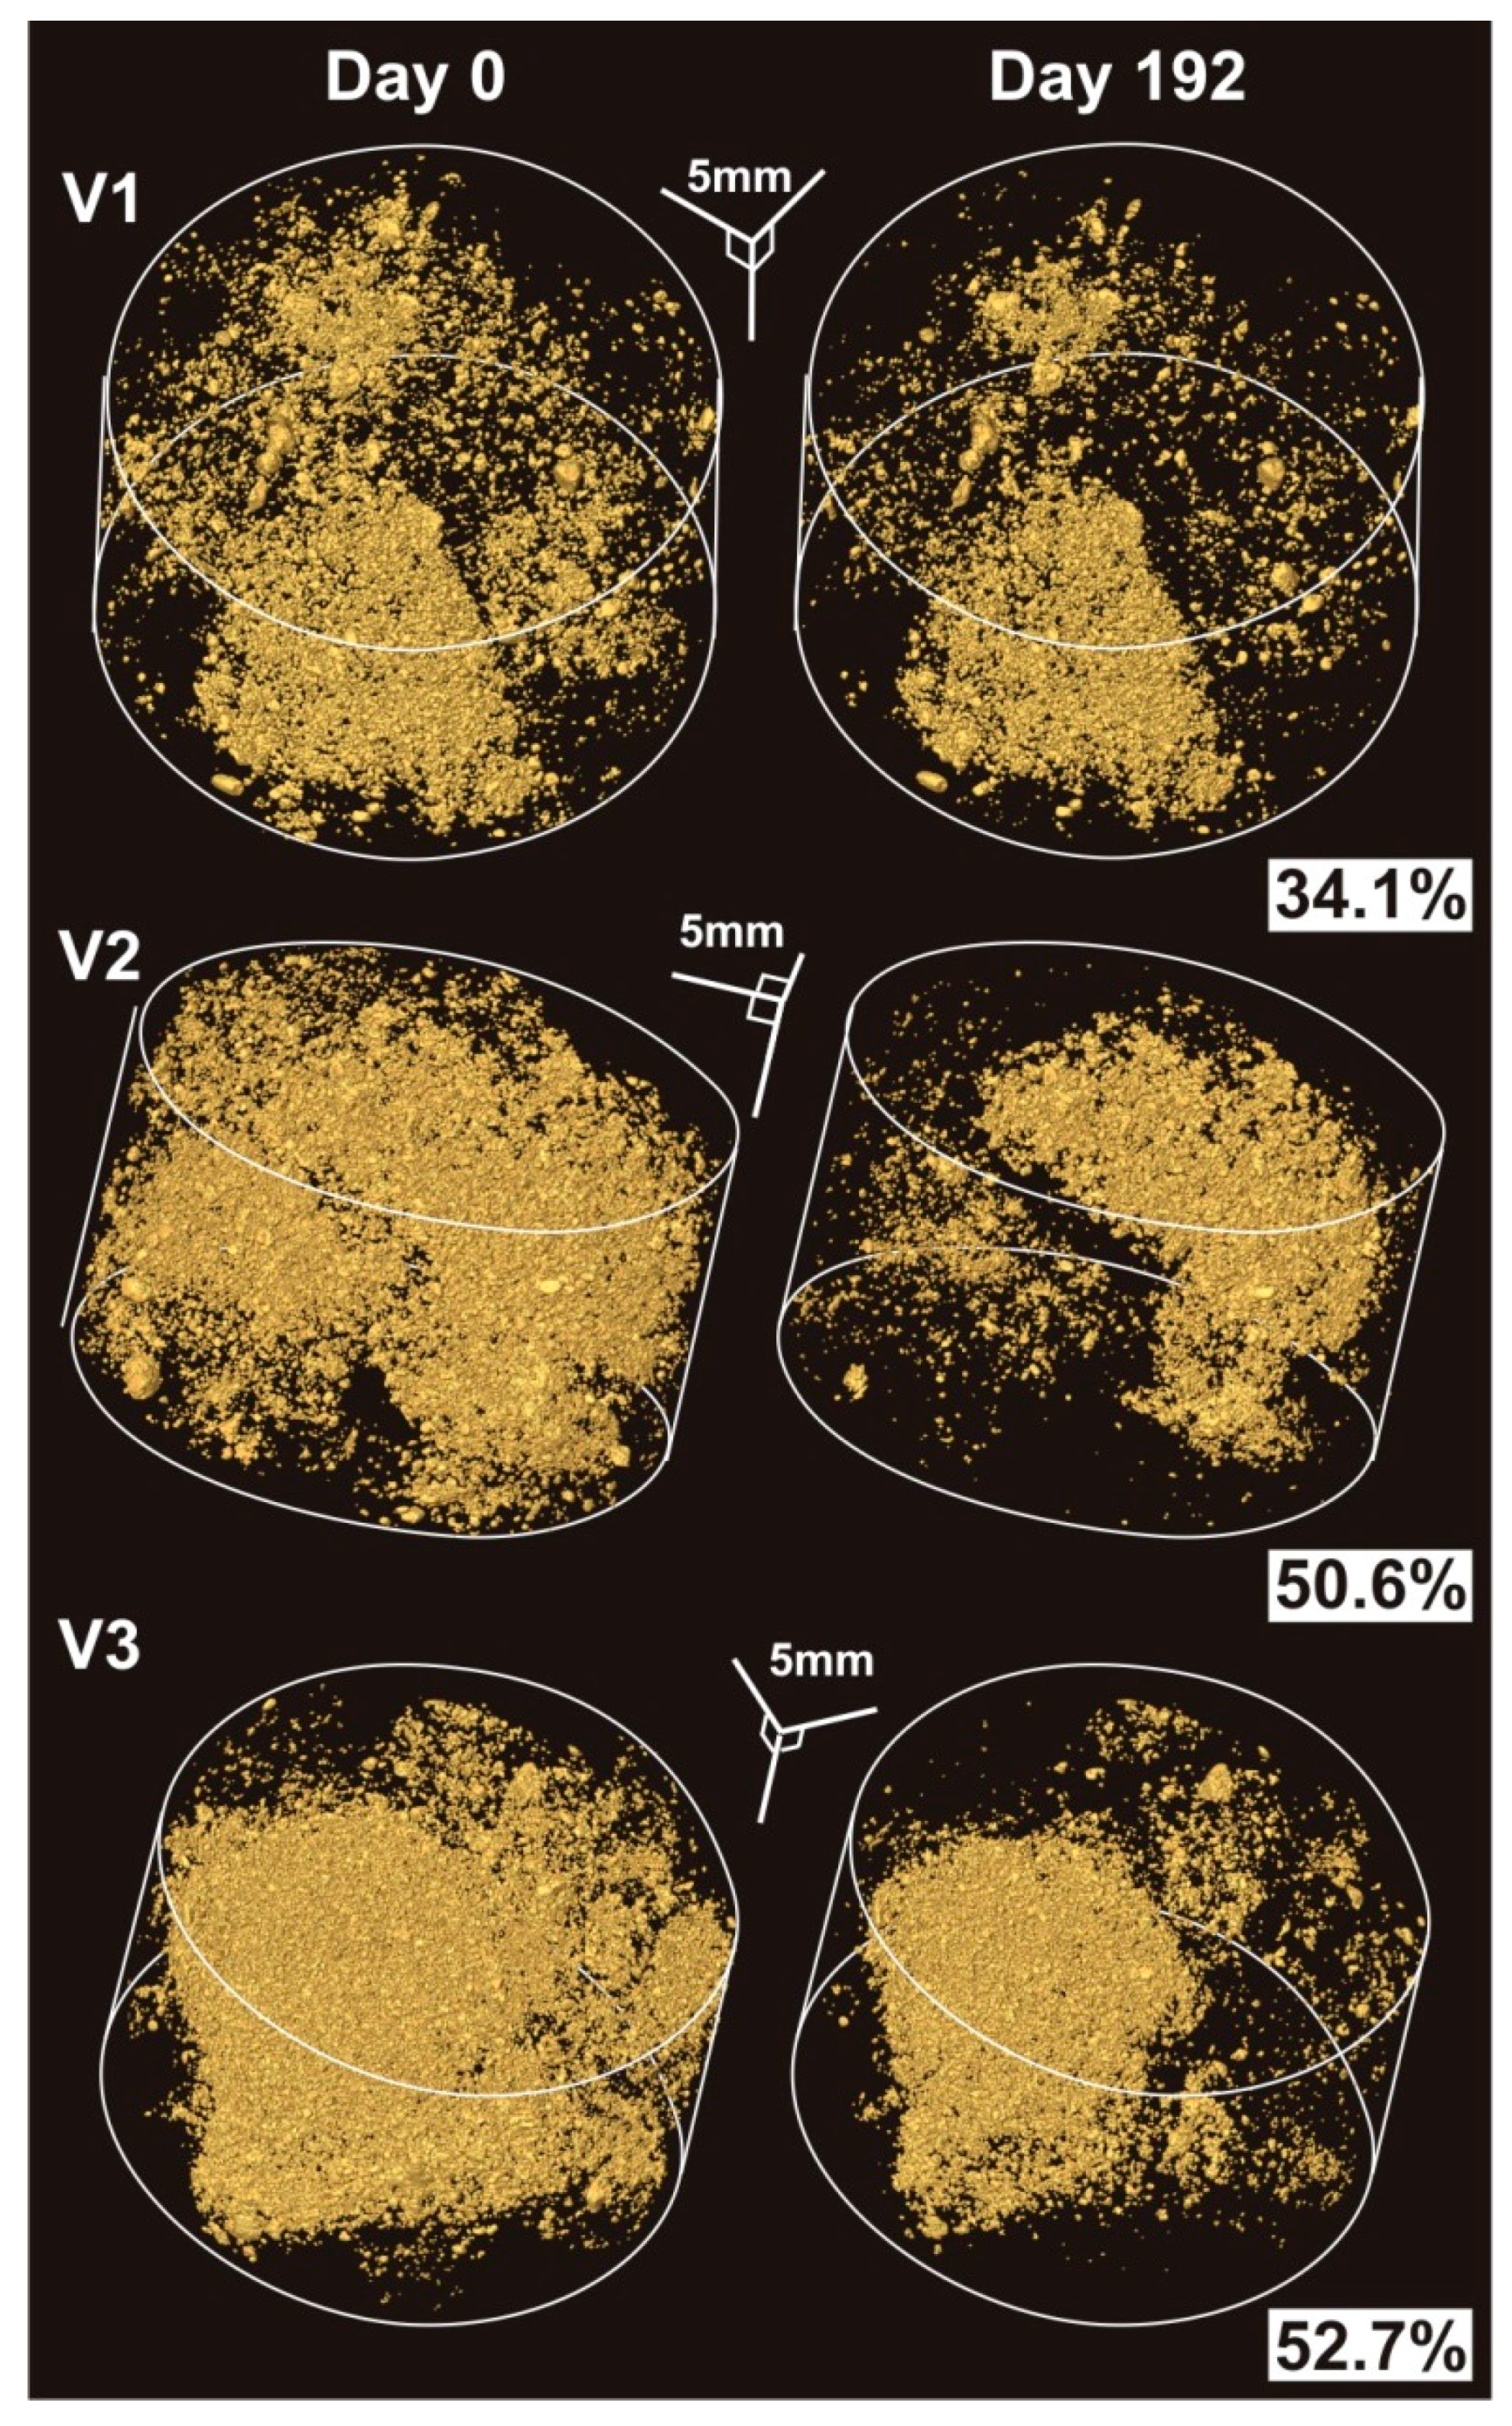
| V1 | V2 | V3 | ||||
| Day 0 | Day 192 | Day 0 | Day 192 | Day 0 | Day 192 | |
| Volume of ore (voxels) | 97,733,700 | 95,388,930 | 98,112,370 | 99,623,260 | 104,996,300 | 103,069,400 |
| Volume of ore (mm3) | 3512 | 3428 | 3529 | 3580 | 3773 | 3704 |
| Number of MS grains * | 12,112 | 8474 | 20,929 | 7859 | 29,844 | 14,093 |
| Volume of MS (voxels) * | 1,608,660 | 1,034,291 | 2,997,445 | 1,505,130 | 3,878,633 | 1,800,546 |
| Volume of MS (mm3) | 57.81 | 37.17 | 10772 | 52.09 | 139.39 | 64.71 |
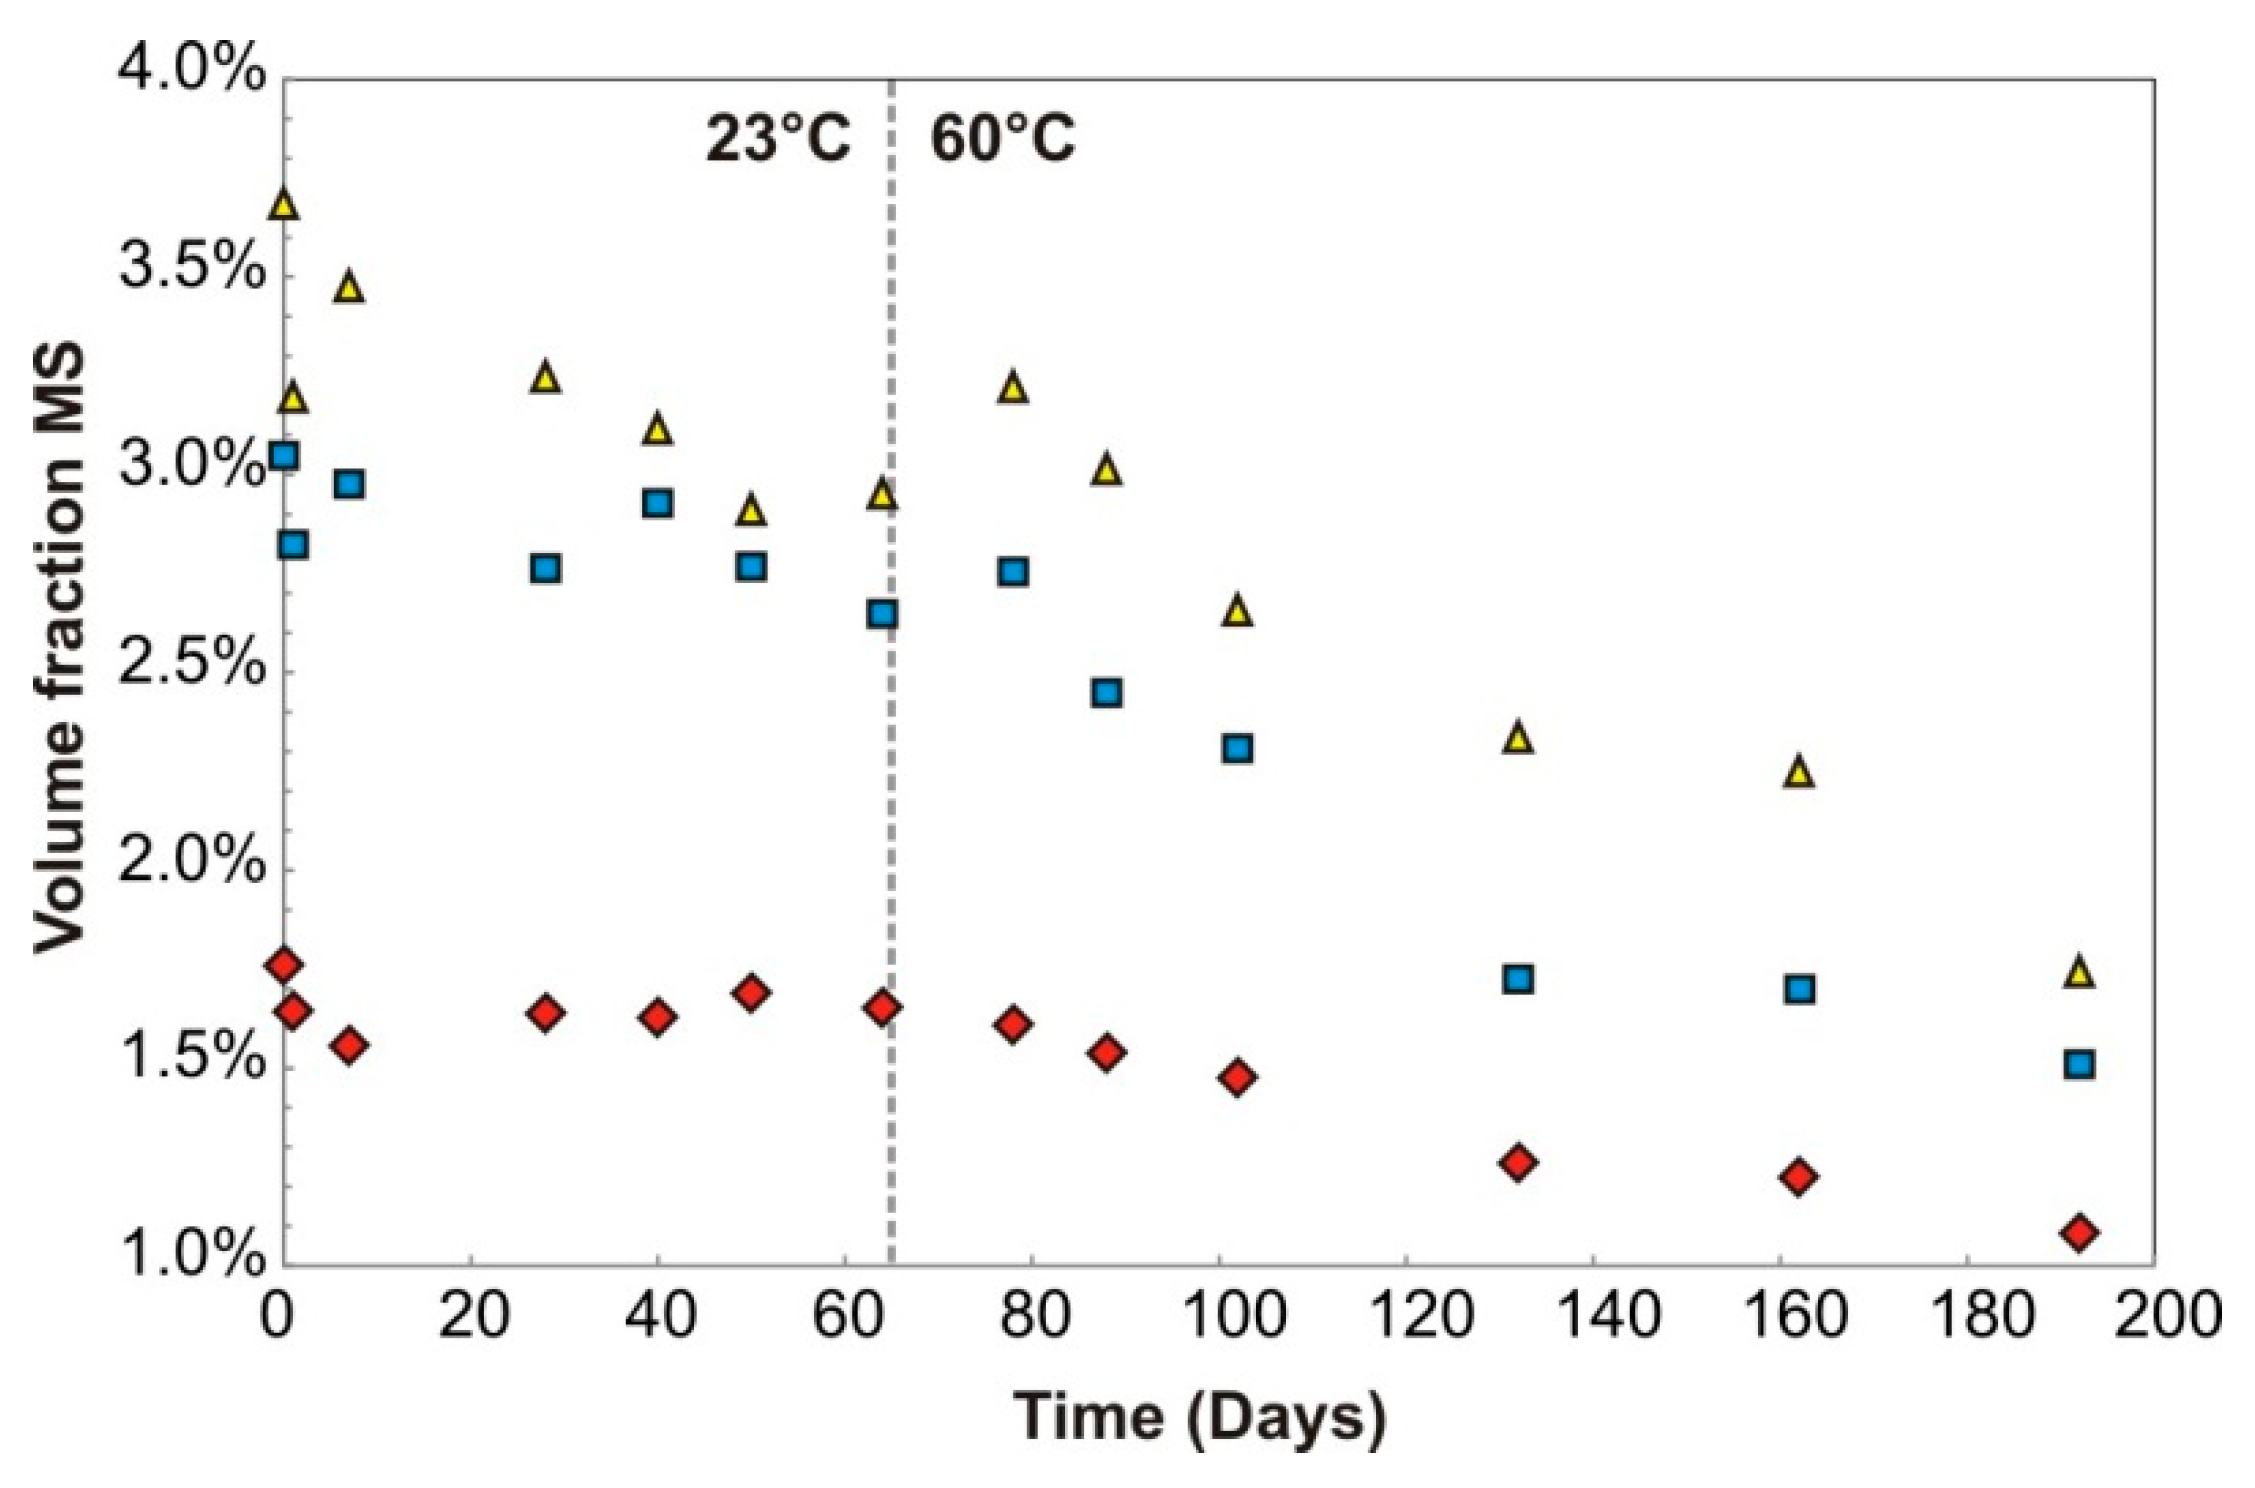
| Volume % MS | 1.65% | 1.08% | 3.06% | 1.51% | 3.69% | 1.75% |
| % Reduction in MS in Scan Volume | 34.12% | 50.55% | 52.71% | |||
| Pore volume (voxels) | 54226640 | 56359170 | 52380510 | 52121250 | 46337550 | 49092750 |
| Pore volume (voxels) | 1949 | 2025 | 1882 | 1873 | 1665 | 1764 |
| Connected Pore vol. (mm3) | 1946 | 2024 | 1879 | 1872 | 1661 | 1762 |
| Volume % connected pore | 35.6% | 37.1% | 34.8% | 34.3% | 30.5% | 32.2% |
| % Change in Pore Volume | −4.23% | 1.2% | −5.5% | |||
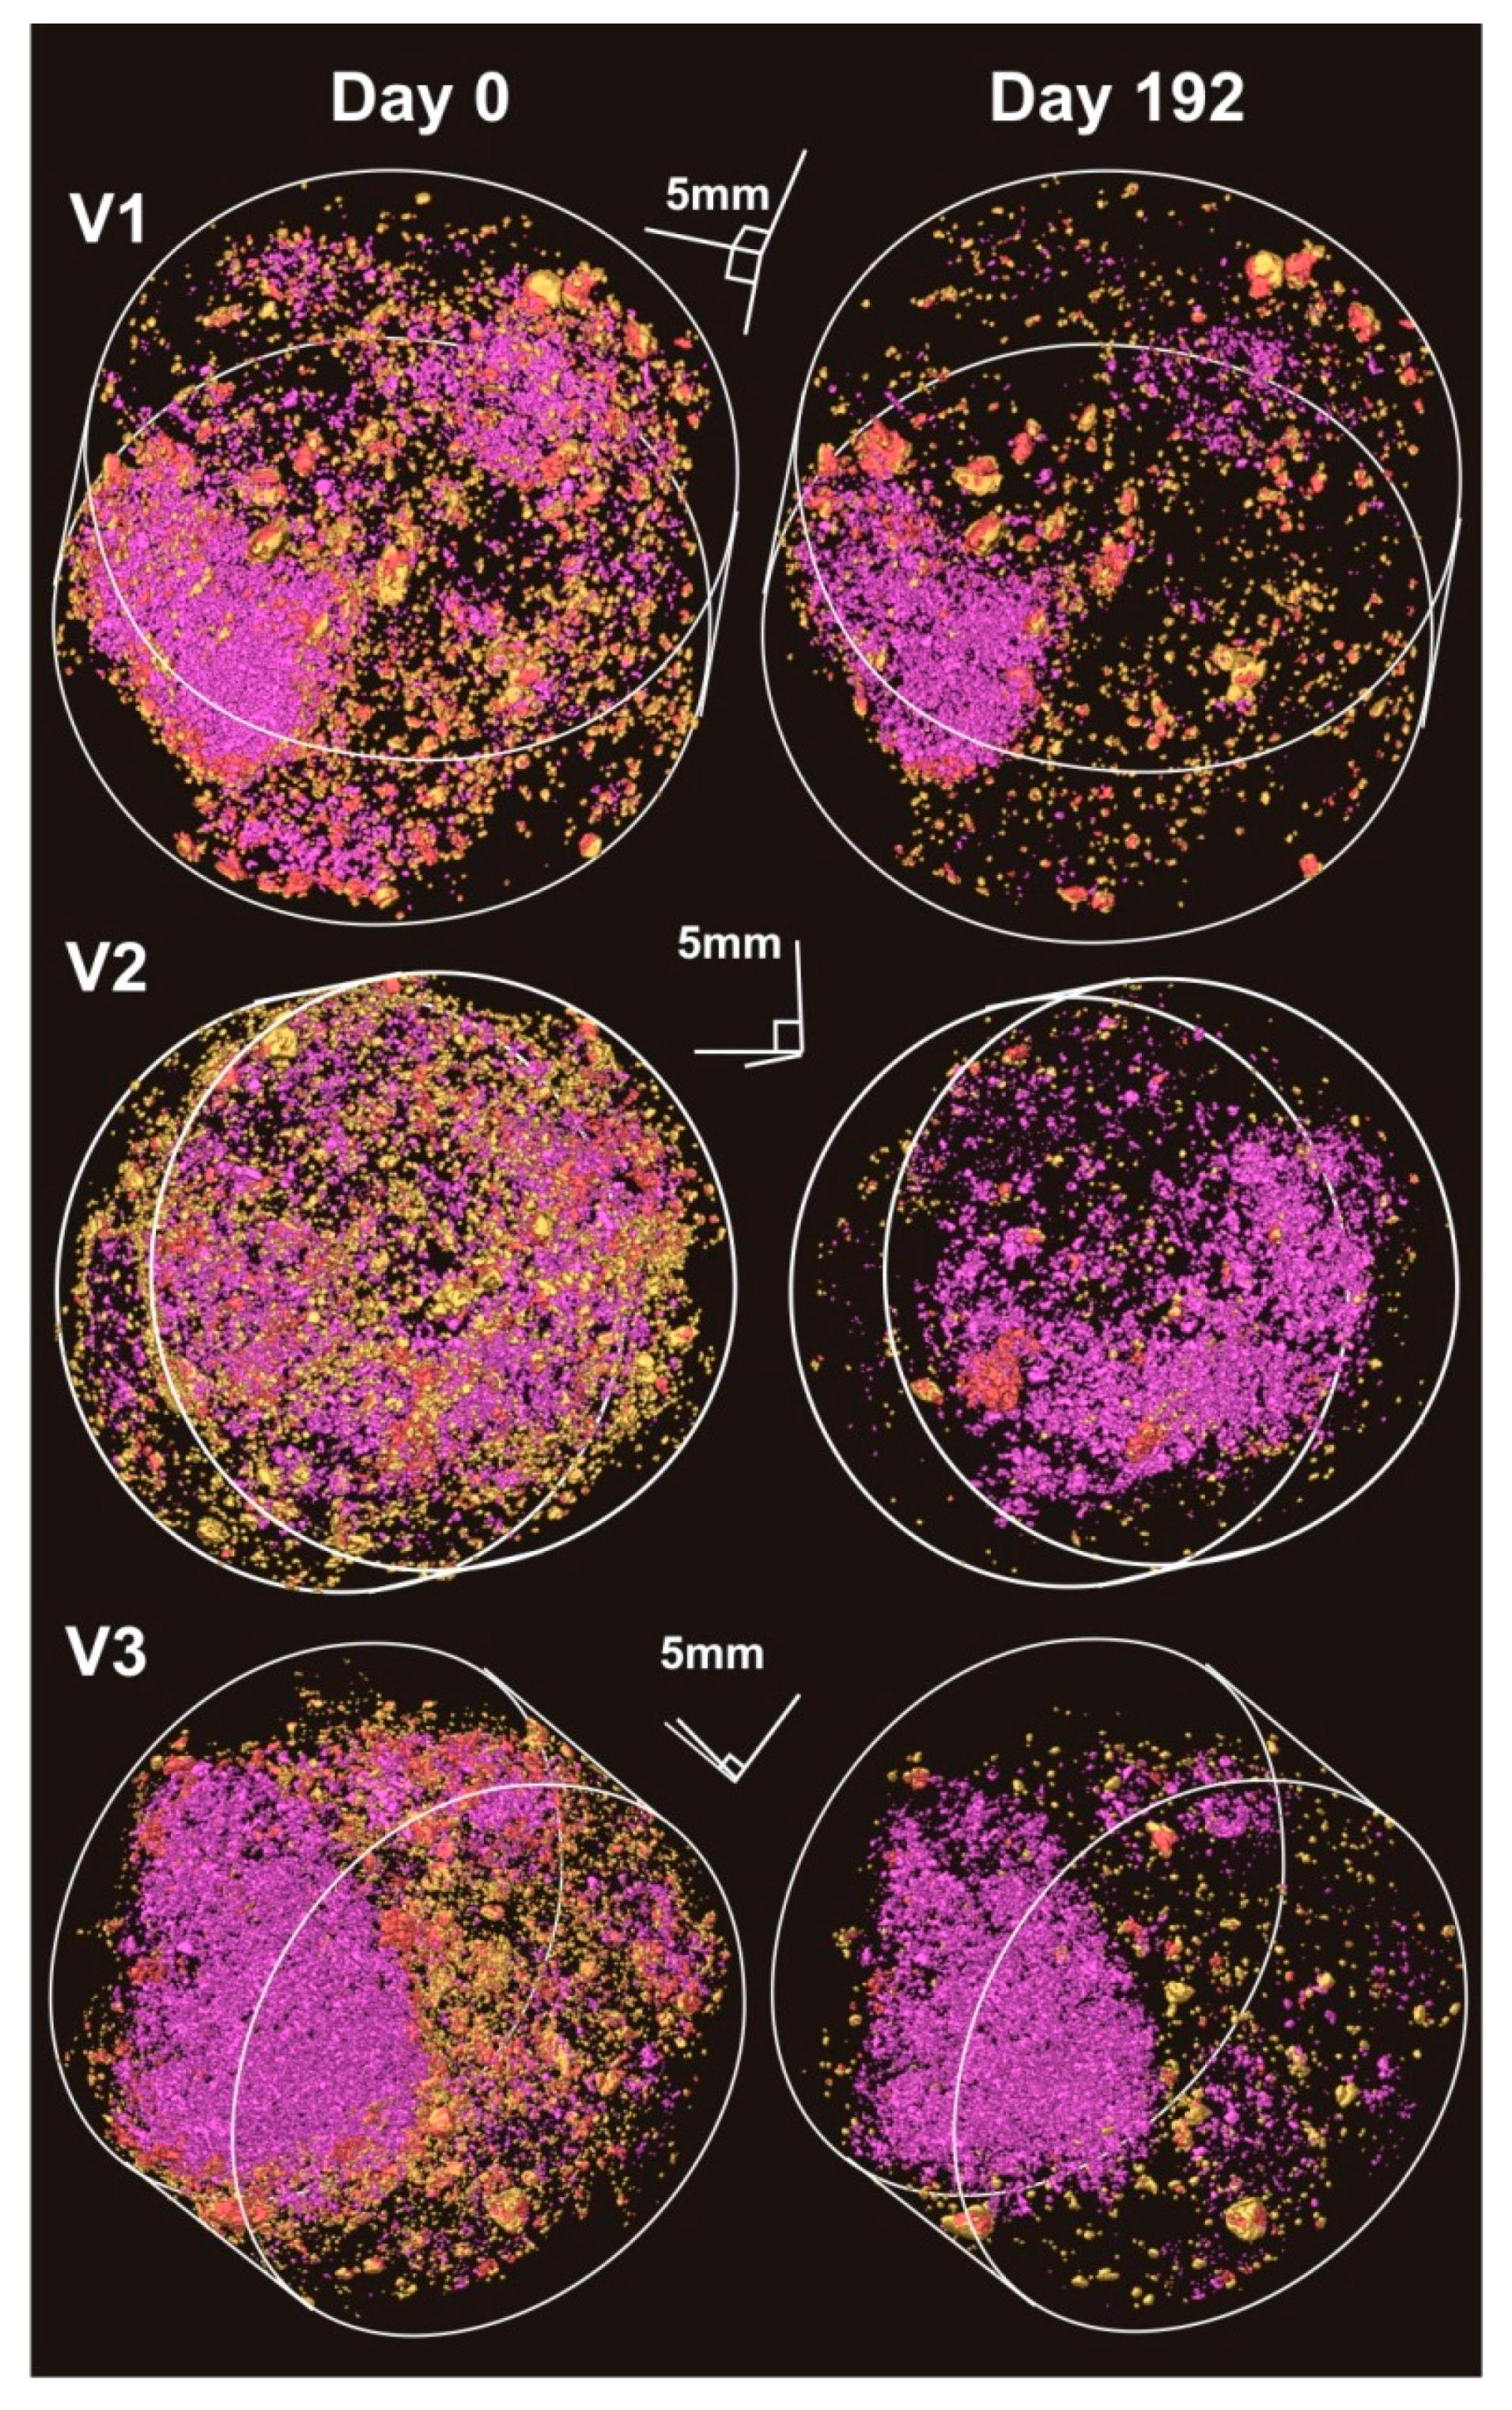
| Accessible | ||||||
| Volume MS (mm3) | 30.58 | 16.89 | 48.49 | 7.83 | 48.55 | 7.22 |
| Volume % MS | 0.87% | 0.49% | 1.38% | 0.22% | 1.29% | 0.19% |
| % MS | 52.90% | 45.43% | 45.02% | 14.48% | 34.83% | 11.15% |
| Volume % removed | 0.38% | 1.16% | 1.09% | |||
| Reduction in MS | 43.42% | 84.10% | 84.86% | |||
| % leaching | 67.31% | 74.89% | 56.08% | |||
| Directly Accessible | ||||||
| Volume MS (mm3) | 7.18 | 4.57 | 10.95 | 0.61 | 1500 | 2.40 |
| Volume % MS | 0.20% | 0.13% | 0.31% | 0.02% | 0.40% | 0.06% |
| Fraction MS | 12.42% | 12.30% | 10.16% | 1.13% | 10.76% | 3.72% |
| Volume % removed | 0.07% | 0.29% | 0.33% | |||
| Reduction in MS | 34.79% | 94.52% | 83.67% | |||
| % leaching | 12.66% | 19.01% | 17.09% | |||
| Indirectly Accessible | ||||||
| Volume MS (mm3) | 23.40 | 12.32 | 37.54 | 7.22 | 33.55 | 4.81 |
| Volume % MS | 0.67% | 0.36% | 1.06% | 0.20% | 0.89% | 0.13% |
| % MS | 40.48% | 33.13% | 34.85% | 13.35% | 24.07% | 7.43% |
| Volume % removed | 0.31% | 0.86% | 0.46% | |||
| Reduction in MS | 46.07% | 81.06% | 85.39% | |||
| % leaching | 54.65% | 55.89% | 39.00% | |||
| Inaccessible | ||||||
| Volume MS (mm3) | 27.23 | 20.28 | 59.23 | 46.26 | 90.83 | 57.49 |
| Volume % MS | 0.78% | 0.59% | 1.68% | 1.29% | 2.41% | 1.55% |
| % MS | 47.10% | 54.57% | 54.98% | 85.52% | 65.17% | 88.85% |
| Volume % removed | 0.18% | 0.39% | 0.86% | |||
| Reduction in MS | 23.68% | 23.08% | 35.52% | |||
| % leaching | 32.69% | 25.11% | 43.92% | |||
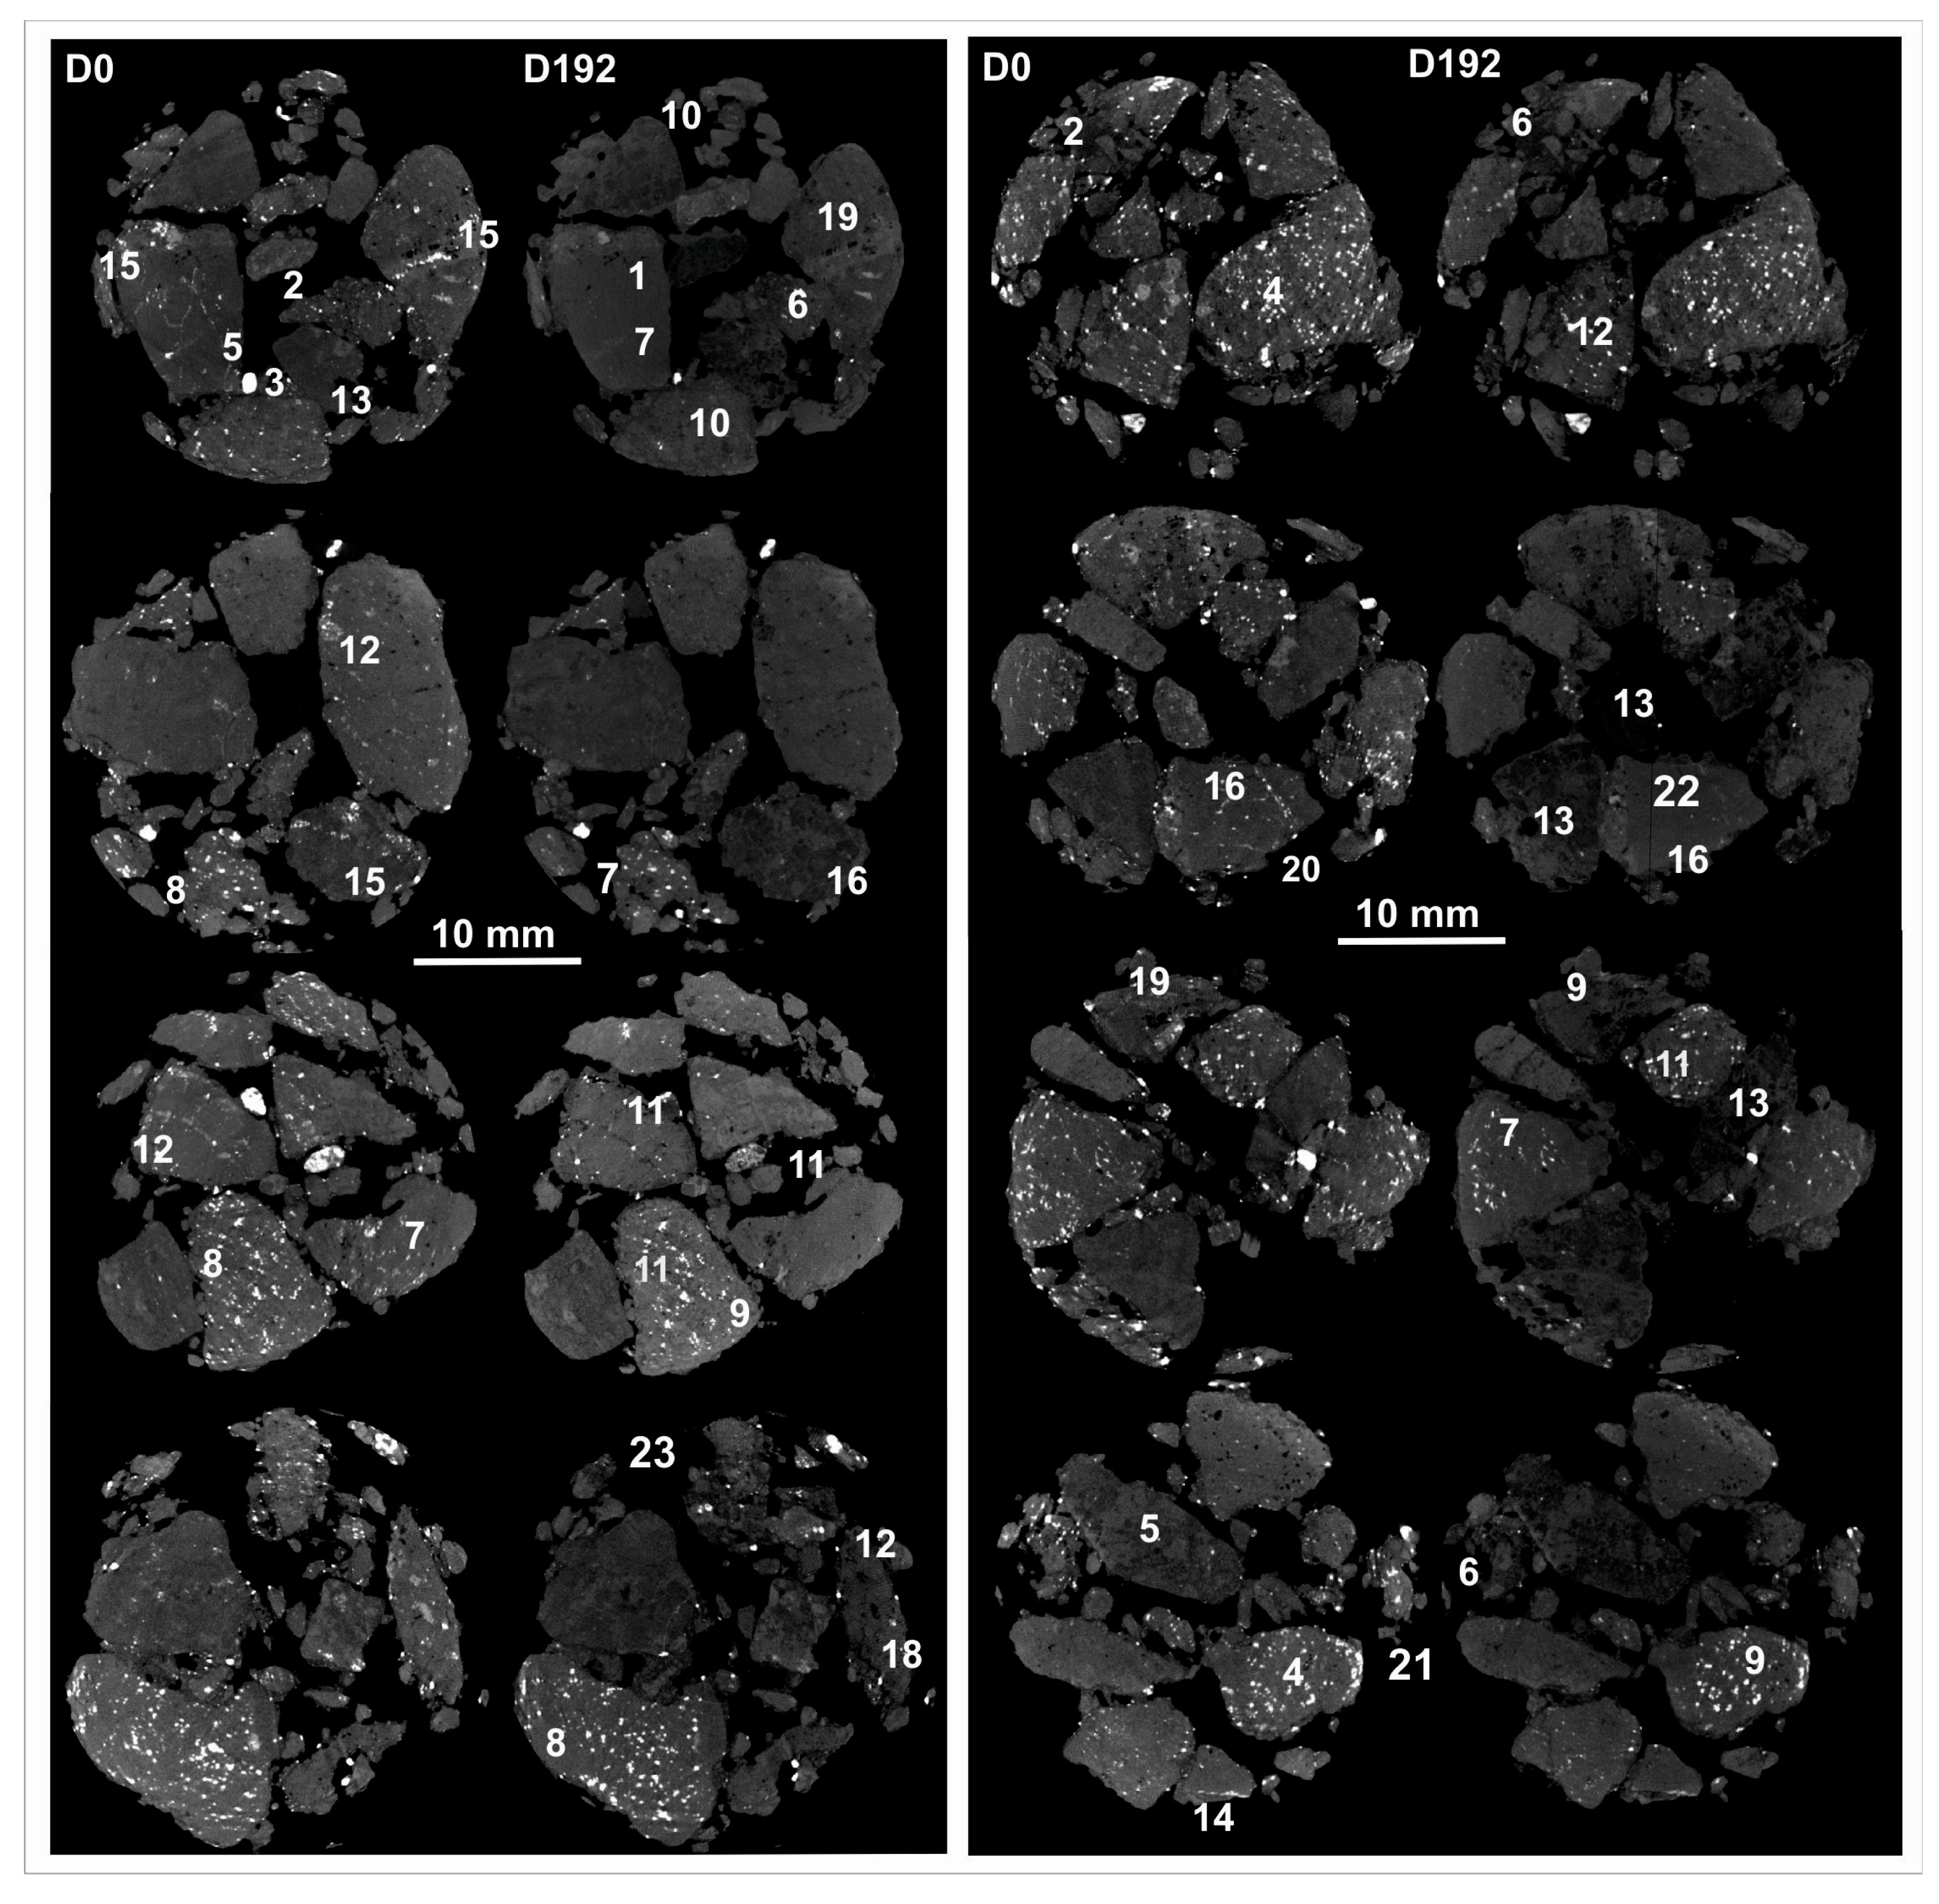
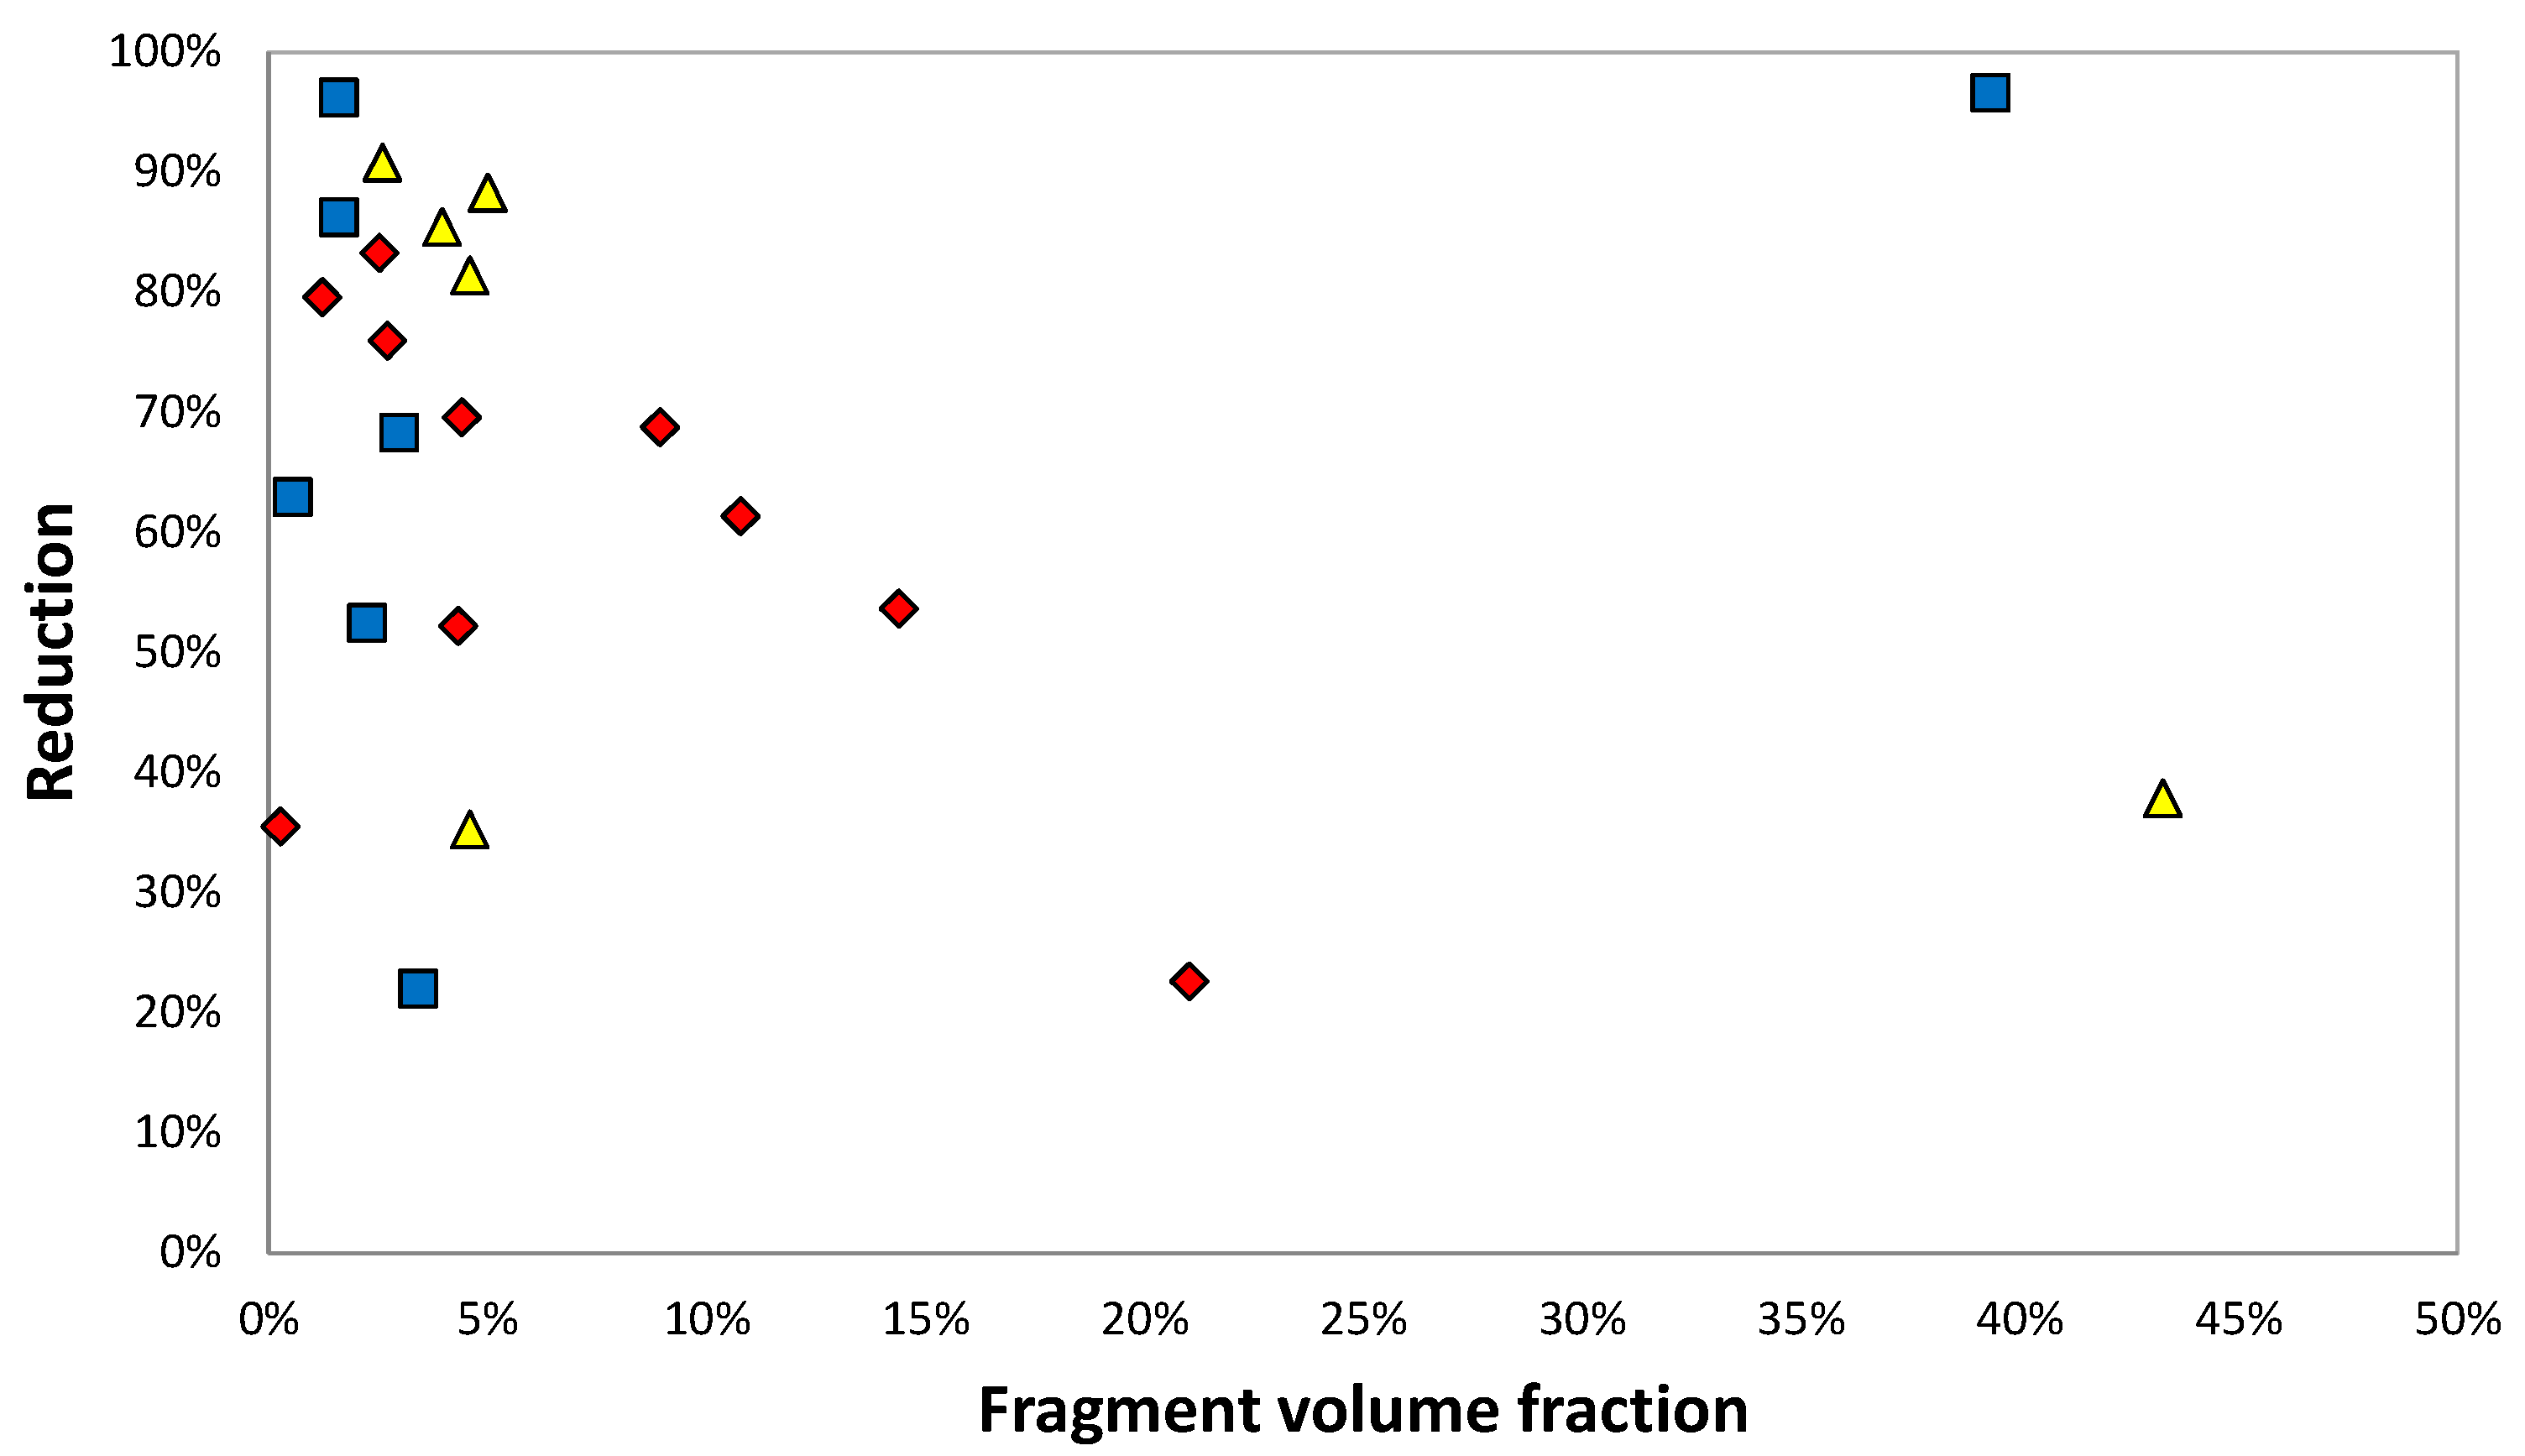
| # | Type | Frag vol * (%) | Radii µm | MS vol % (D0) | MS vol % (D192) | MS Reduct.(%) | A (D0) % | dA (D0) % | idA (D0) % | nA (D0) % | A (D192)% | dA (D192)% | idA (D192) % | nA (D192)% | Δ dA vol % | % Reduct. | Δ idA vol % | % Reduct. | Δ nA vol % | % Reduct. | Total Recovery (%) | ||
|---|---|---|---|---|---|---|---|---|---|---|---|---|---|---|---|---|---|---|---|---|---|---|---|
| dA | idA | nA | |||||||||||||||||||||
| Fragments in V1 (top) | |||||||||||||||||||||||
| 1 | 1bc | 4.42 | 1551 | 0.25 | 0.08 | 69.5 | 0.15 | 0.06 | 0.09 | 0.05 | 0.06 | 0.01 | 0.05 | 0.01 | 0.05 | 77.7 | 0.04 | 44.7 | 0.03 | 74.7 | 40.4 | 31.9 | 27.8 |
| 2 | 1ef,2 | 1.22 | 1551 | 1.10 | 0.22 | 79.6 | 0.52 | 0.26 | 0.25 | 0.40 | 0.17 | 0.04 | 0.12 | 0.00 | 0.22 | 84.3 | 0.13 | 51.2 | 0.40 | 100 | 29.3 | 17.2 | 53.5 |
| 3 | 2c | 0.27 | 1056 | 6.12 | 3.95 | 35.4 | 4.88 | 0.50 | 4.38 | 1.19 | 3.14 | 0.13 | 3.01 | 0.81 | 0.37 | 74.0 | 1.37 | 31.2 | 0.38 | 31.8 | 17.6 | 64.6 | 17.9 |
| 4 | 1bcec | 2.54 | 2244 | 0.66 | 0.11 | 83.2 | 0.14 | 0.07 | 0.07 | 0.37 | 0.08 | 0.03 | 0.06 | 0.03 | 0.05 | 62.9 | 0.01 | 19.1 | 0.35 | 93.0 | 11.2 | 3.4 | 85.5 |
| 5 | 1bcd | 4.34 | 2244 | 0.59 | 0.28 | 52.2 | 0.33 | 0.16 | 0.17 | 0.17 | 0.18 | 0.05 | 0.13 | 0.10 | 0.11 | 69.4 | 0.04 | 21.4 | 0.08 | 43.5 | 50.0 | 16.2 | 33.8 |
| 6 | 1b | 10.79 | 3168 | 0.30 | 0.12 | 61.3 | 0.16 | 0.07 | 0.09 | 0.10 | 0.10 | 0.02 | 0.08 | 0.02 | 0.05 | 69.7 | 0.01 | 15.6 | 0.08 | 81.6 | 32.5 | 9.9 | 57.6 |
| 7 | 2bc | 8.95 | 2772 | 0.49 | 0.15 | 68.7 | 0.18 | 0.08 | 0.10 | 0.20 | 0.10 | 0.02 | 0.08 | 0.05 | 0.06 | 73.5 | 0.02 | 21.4 | 0.16 | 75.8 | 24.9 | 9.4 | 65.7 |
| 8 | 1a | 2.72 | 1419 | 2.79 | 0.67 | 75.9 | 1.73 | 0.46 | 1.27 | 0.83 | 0.56 | 0.09 | 0.47 | 0.11 | 0.37 | 80.3 | 0.80 | 63.3 | 0.72 | 86.4 | 19.6 | 42.4 | 38.0 |
| 9 | 1bd | 14.40 | 2574 | 1.69 | 0.78 | 53.6 | 0.61 | 0.17 | 0.45 | 0.83 | 0.36 | 0.04 | 0.31 | 0.43 | 0.12 | 74.3 | 0.13 | 29.8 | 0.40 | 48.4 | 18.9 | 20.1 | 61.0 |
| 10 | 2bc | 21.04 | 3498 | 3.52 | 2.72 | 22.6 | 0.70 | 0.12 | 0.58 | 2.46 | 0.42 | 0.03 | 0.39 | 2.30 | 0.09 | 75.3 | 0.19 | 33.0 | 0.16 | 6.4 | 21.0 | 43.2 | 35.8 |
| Fragments in V2 (middle) | |||||||||||||||||||||||
| 11 | 1bc | 0.98 | 1419 | 1.27 | 0.07 | 94.7 | 0.61 | 0.27 | 0.33 | 0.66 | 0.05 | 0.02 | 0.03 | 0.02 | 0.25 | 92.4 | 0.30 | 90.8 | 0.64 | 97.6 | 21.1 | 25.3 | 53.6 |
| 12 | 1bc | 2.95 | 1947 | 0.49 | 0.01 | 98.6 | 0.39 | 0.16 | 0.23 | 0.10 | 0.00 | 0.00 | 0.00 | 0.00 | 0.16 | 98.5 | 0.23 | 99.9 | 0.09 | 95.8 | 32.8 | 47.8 | 19.4 |
| 13 | 1bef | 1.60 | 1848 | 1.14 | 0.01 | 98.9 | 0.28 | 0.14 | 0.14 | 0.86 | 0.00 | 0.00 | 0.00 | 0.01 | 0.14 | 100 | 0.14 | 99.7 | 0.84 | 98.6 | 12.8 | 12.1 | 75.1 |
| 14 | 1a | 2.99 | 2541 | 1.19 | 0.05 | 96.1 | 0.55 | 0.23 | 0.32 | 0.65 | 0.03 | 0.01 | 0.01 | 0.02 | 0.22 | 94.5 | 0.30 | 95.4 | 0.63 | 97.1 | 19.0 | 26.2 | 54.9 |
| 15 | 1cec | 3.43 | 1947 | 4.43 | 1.40 | 68.3 | 2.41 | 0.23 | 2.17 | 2.02 | 0.02 | 0.00 | 0.01 | 1.39 | 0.23 | 98.3 | 2.16 | 99.4 | 0.63 | 31.3 | 7.6 | 71.5 | 21.0 |
| 16 | 1ac | 39.3 | 5214 | 4.19 | 3.27 | 22.0 | 1.42 | 0.14 | 1.28 | 2.77 | 0.42 | 0.01 | 0.41 | 2.85 | 0.14 | 93.6 | 0.87 | 67.8 | −0.08 | −2.9 | 14.7 | 94.0 | −8.7 |
| Fragments in V3 (bottom) | |||||||||||||||||||||||
| 17 | 1a | 2.25 | 2244 | 0.33 | 0.01 | 96.6 | 0.12 | 0.09 | 0.02 | 0.21 | 0.00 | 0.00 | 0.00 | 0.01 | 0.09 | 99.2 | 0.02 | 95.1 | 0.20 | 95.5 | 29.74 | 7.03 | 63.23 |
| 18 | 1a | 0.55 | 1617 | 2.83 | 1.35 | 52.4 | 1.51 | 0.52 | 0.99 | 1.32 | 0.50 | 0.09 | 0.41 | 0.84 | 0.42 | 81.8 | 0.59 | 58.9 | 0.48 | 36.1 | 28.43 | 39.44 | 32.13 |
| 19 | 1c | 1.61 | 1914 | 1.59 | 0.59 | 62.9 | 0.56 | 0.27 | 0.29 | 1.03 | 0.02 | 0.02 | 0.00 | 0.57 | 0.25 | 92.9 | 0.29 | 98.9 | 0.46 | 44.9 | 24.88 | 28.85 | 46.27 |
| 20 | 1b | 2.99 | 1782 | 1.25 | 0.17 | 86.2 | 0.50 | 0.14 | 0.36 | 0.75 | 0.03 | 0.01 | 0.02 | 0.14 | 0.14 | 93.6 | 0.34 | 94.0 | 0.60 | 81.0 | 12.57 | 31.39 | 56.04 |
| 21 | 1b,d | 3.98 | 1947 | 1.24 | 0.18 | 85.4 | 0.43 | 0.20 | 0.24 | 0.81 | 0.06 | 0.03 | 0.03 | 0.12 | 0.16 | 83.8 | 0.21 | 87.9 | 0.69 | 85.0 | 15.51 | 19.61 | 64.88 |
| 22 | 1a | 4.60 | 2079 | 1.38 | 0.89 | 35.2 | 0.45 | 0.21 | 0.25 | 0.93 | 0.18 | 0.07 | 0.12 | 0.71 | 0.14 | 67.6 | 0.13 | 52.7 | 0.22 | 23.3 | 28.96 | 26.57 | 44.47 |
| 23 | 1b | 5.01 | 2607 | 1.41 | 0.17 | 88.2 | 0.63 | 0.13 | 0.50 | 0.78 | 0.03 | 0.01 | 0.02 | 0.14 | 0.12 | 93.5 | 0.48 | 96.1 | 0.64 | 82.3 | 9.75 | 38.89 | 51.35 |
| 24 | 1a | 2.61 | 1650 | 3.75 | 0.35 | 90.8 | 1.77 | 0.37 | 1.40 | 1.98 | 0.12 | 0.04 | 0.08 | 0.23 | 0.33 | 90.4 | 1.32 | 94.0 | 1.75 | 88.5 | 9.75 | 38.68 | 51.57 |
| 25 | 1c, 2c | 4.60 | 2046 | 6.23 | 1.16 | 81.4 | 2.47 | 0.51 | 1.96 | 3.75 | 0.07 | 0.04 | 0.04 | 1.09 | 0.48 | 92.8 | 1.92 | 98.2 | 2.67 | 71.0 | 9.40 | 37.98 | 52.62 |
| 26 | 1a | 43.28 | 5907 | 5.32 | 3.31 | 37.8 | 0.84 | 0.14 | 0.70 | 4.47 | 0.08 | 0.02 | 0.07 | 3.22 | 0.12 | 86.6 | 0.64 | 90.7 | 1.25 | 28.0 | 6.02 | 31.73 | 62.25 |
| Liberated MS grains (across all three volumes) | |||||||||||||||||||||||
| 1 | 3 | 0.06 | 693 | 13.04 | 9.41 | 27.9 | 12.98 | 2.71 | 10.27 | 0.13 | 9.40 | 0.67 | 8.74 | 0.00 | 2.04 | 75.4 | 1.54 | 15.0 | 0.13 | 100 | 55.05 | 41.45 | 3.50 |
| 2 | 3 | 0.08 | 792 | 42.21 | 38.01 | 9.9 | 42.67 | 8.87 | 33.80 | 0.00 | 38.01 | 3.10 | 34.90 | 0.00 | 5.77 | 65.0 | −1.11 | −3.3 | 0.00 | n/a | 123.73 | 23.73 | n/a |
| 3 | 3 | 0.11 | 726 | 61.55 | 11.28 | 81.7 | 61.55 | 12.08 | 49.47 | 0.00 | 11.28 | 1.39 | 9.88 | 0.00 | 10.69 | 88.5 | 39.58 | 80.0 | 0.00 | n/a | 21.26 | 78.74 | n/a |
| 4 | 3 | 0.06 | 396 | 38.58 | 1.97 | 94.9 | 38.33 | 11.50 | 26.83 | 0.25 | 1.73 | 0.52 | 1.21 | 0.24 | 10.98 | 95.5 | 25.62 | 95.5 | 0.01 | 2.84 | 29.99 | 69.99 | 0.02 |
| 5 | 3 | 0.07 | 330 | 57.40 | 4.33 | 92.5 | 57.39 | 17.79 | 39.60 | 0.00 | 3.99 | 2.27 | 1.72 | 0.00 | 15.52 | 87.2 | 37.88 | 95.7 | 0.00 | n/a | 29.07 | 70.93 | n/a |
| 6 | 3 | 0.07 | 528 | 45.03 | 44.33 | 1.6 | 45.02 | 9.87 | 35.15 | 0.00 | 44.33 | 9.34 | 34.99 | 0.00 | 0.54 | 5.4 | 0.16 | 0.6 | 0.00 | n/a | 77.05 | 22.95 | n/a |
© 2017 by the authors. Licensee MDPI, Basel, Switzerland. This article is an open access article distributed under the terms and conditions of the Creative Commons Attribution (CC BY) license (http://creativecommons.org/licenses/by/4.0/).
Share and Cite
Dobson, K.J.; Harrison, S.T.L.; Lin, Q.; Ní Bhreasail, A.; Fagan-Endres, M.A.; Neethling, S.J.; Lee, P.D.; Cilliers, J.J. Insights into Ferric Leaching of Low Grade Metal Sulfide-Containing ores in an Unsaturated Ore Bed Using X-ray Computed Tomography. Minerals 2017, 7, 85. https://doi.org/10.3390/min7050085
Dobson KJ, Harrison STL, Lin Q, Ní Bhreasail A, Fagan-Endres MA, Neethling SJ, Lee PD, Cilliers JJ. Insights into Ferric Leaching of Low Grade Metal Sulfide-Containing ores in an Unsaturated Ore Bed Using X-ray Computed Tomography. Minerals. 2017; 7(5):85. https://doi.org/10.3390/min7050085
Chicago/Turabian StyleDobson, Katherine J., Sue T. L. Harrison, Qingyang Lin, Aine Ní Bhreasail, Marijke A. Fagan-Endres, Stephen J. Neethling, Peter D. Lee, and Jan J. Cilliers. 2017. "Insights into Ferric Leaching of Low Grade Metal Sulfide-Containing ores in an Unsaturated Ore Bed Using X-ray Computed Tomography" Minerals 7, no. 5: 85. https://doi.org/10.3390/min7050085
APA StyleDobson, K. J., Harrison, S. T. L., Lin, Q., Ní Bhreasail, A., Fagan-Endres, M. A., Neethling, S. J., Lee, P. D., & Cilliers, J. J. (2017). Insights into Ferric Leaching of Low Grade Metal Sulfide-Containing ores in an Unsaturated Ore Bed Using X-ray Computed Tomography. Minerals, 7(5), 85. https://doi.org/10.3390/min7050085