Abstract
This study, based on fluid inclusion petrography, microthermometry and ultraviolet microspectroscopy of inclusion oil, investigates the petroleum charge history at Parsons Pond, western Newfoundland. To address this matter, drill core and cuttings samples of allochthonous and autochthonous strata in the Parson’s Pond area were collected from three exploration wells. Fluid inclusions were examined from fragments of calcite and quartz veins, diagenetic cements in sandstone, and in large hydrothermal dolomite and calcite crystals. Primary aqueous inclusions in authigenic sandstone cements indicate that cementation occurred at relatively shallow depths and low temperatures (<50 °C). Hydrocarbon-bearing fluid inclusions (petroleum, wet gas and gas) are generally restricted to calcite and quartz veins, indicating that petroleum and gas migration at Parson’s Pond is fracture-controlled. No hydrocarbons were observed in the diagenetic cements of the essentially tight sandstones. Fluid inclusion microthermometry and ultraviolet microspectroscopy indicate the presence of multiple generations of hydrocarbon fluid, ranging in composition from ~33 API gravity petroleum to pure CH4. Petrographic evidence suggests that hydrocarbons were generated multiple times during progressive burial and heating. In addition, the distribution of hydrocarbon bearing inclusions with depth suggests that deeper levels are gas-prone, with petroleum confined to relatively shallow depths. Although only gas flow was encountered during the drilling of exploration wells at Parson’s Pond, the presence of petroleum-bearing fluid inclusions in calcite and quartz veins indicates that the historical production from shallow wells in the Parsons Pond area likely tapped small reservoirs of fractured petroliferous strata.
1. Introduction
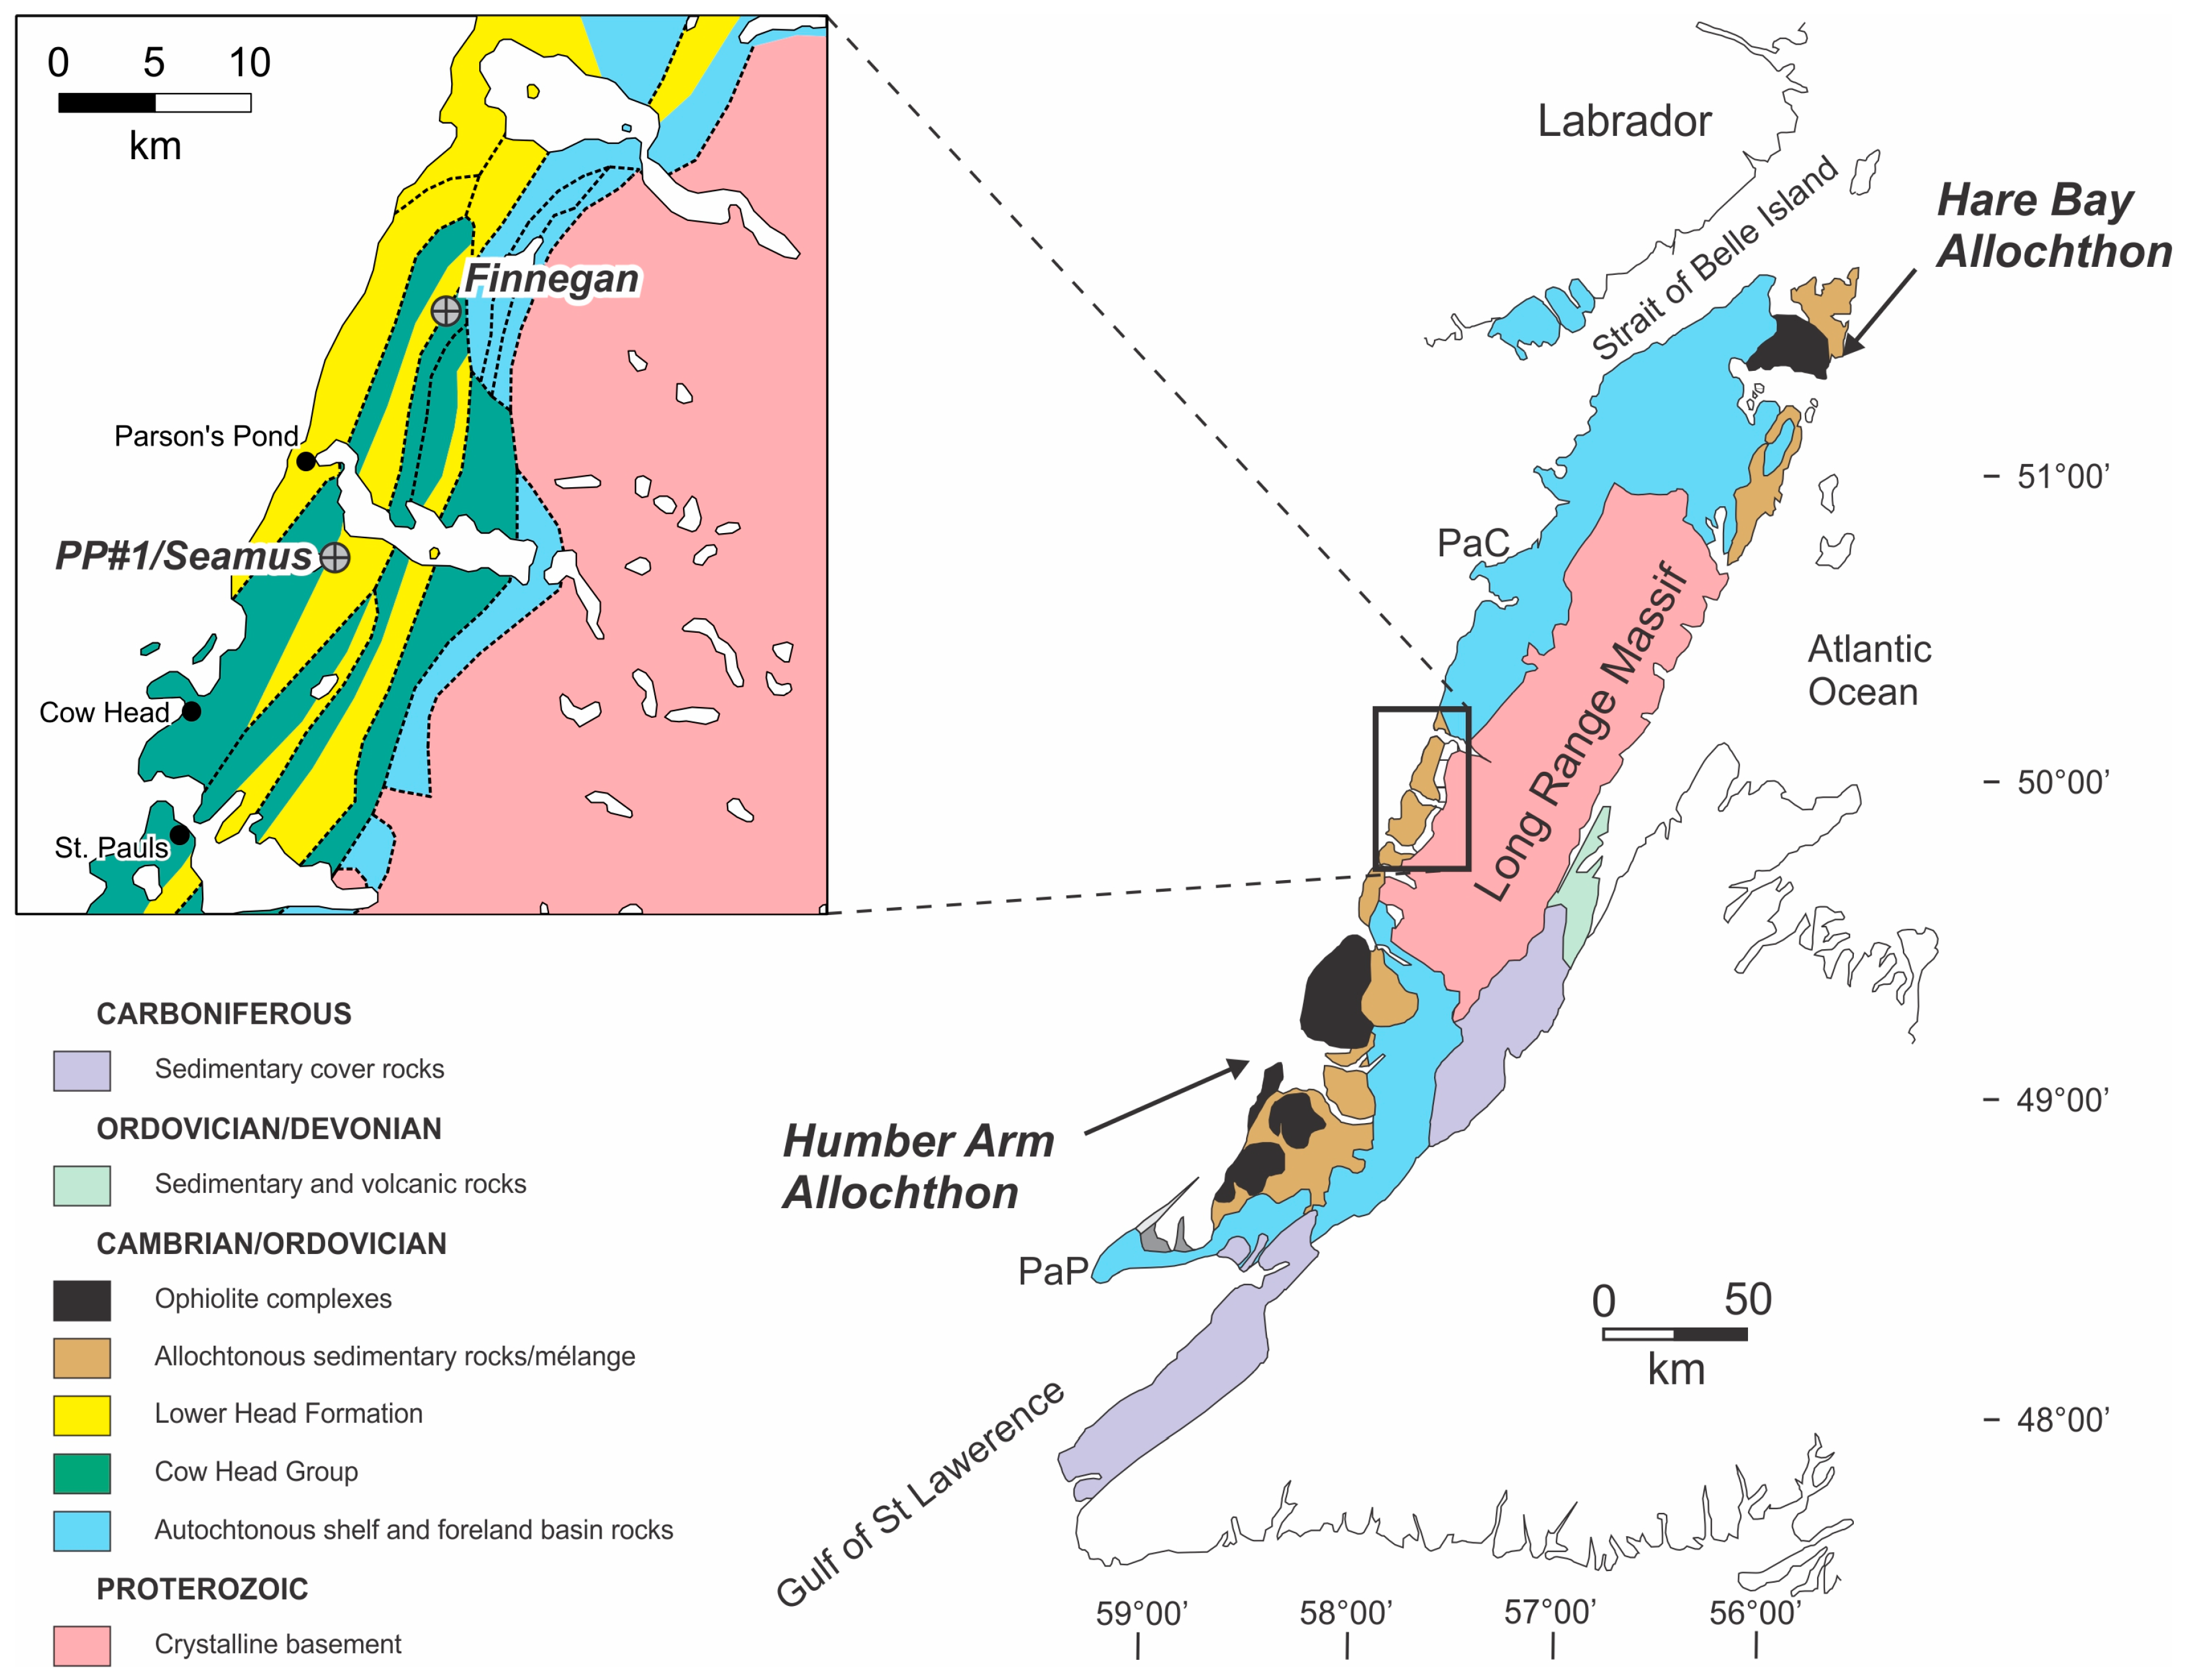
In western Newfoundland (Figure 1) the search for hydrocarbons has been ongoing for nearly 200 years, with small quantities of oil produced in the 19th and 20th centuries from the Port au Port Peninsula and Parsons Pond areas [1]. Recent exploration indicates the presence of active petroleum systems in Cambro-Ordovician strata, with source rocks located in the allochthon (e.g., organic-rich mudstones in the Green Point Formation) and carbonate reservoirs in the Lower Ordovician St. George Group of the autochthon [2]. However, there have been no previous studies investigating the relative timing of petroleum migration and potential migration pathways. In addition, it is unclear whether oil and gas represent a single phase petroleum migration event or multiple migration events from multiple sources. An understanding of syn- and post-diagenetic petroleum and aqueous fluid flow has important implications for new exploration strategies.
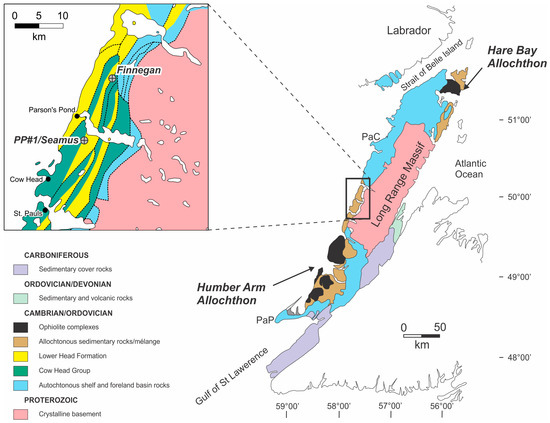
Figure 1.
Simplified map of the geology of western Newfoundland, showing the location of Parsons Pond, adapted from [3]. Inset map showing detailed geology of Parsons Pond area, with locations of exploration wells, adapted from [4].
Fluid inclusions represent micro-scale samples of fluids, trapped during the evolution of sedimentary basins, and can be used to identify the composition of fluids associated with diagenetic and post-diagenetic fluid processes [5]. In petroleum systems, fluid inclusion data have been widely used to define hydrocarbon migration and charge histories, especially where there is a complex petroleum charge history (e.g., [6,7,8,9,10,11,12]).
In this study, we present data from fluid inclusion petrography and microthermometry of petroleum, gas-bearing, and aqueous inclusions in drillcore and cuttings samples from the Parsons Pond area. In addition, ultraviolet fluorescence microspectroscopy of inclusion oils is conducted to determine whether there are variations in the composition of inclusion oils. The combined results are used to determine the nature and relative timing of oil and gas migration events at Parsons Pond.
2. Geological Setting
Late Precambrian rifting and younger Early Paleozoic spreading of what was then the southern margin of Laurentia (and now eastern North America) created accommodation space for several thousand metres of shallow and deep marine clastic and carbonate strata. These largely flat-lying beds, collectively identified as the St. Lawrence Platform, are now separated and divided according to their position along the Appalachian tectonic front. Deformed and broken strata laying east and south of this structural boundary are now referenced as forming part of the outer domain of the Humber Zone (Figure 1), and the westernmost part of the five tectonostratigraphic terranes that form the Appalachians [13].
The Humber Zone is a broad terrane along the western edge of the Appalachian orogenic belt, where mostly Cambro-Ordovician sedimentary rocks record the evolution and destruction of the Laurentian continental margin from about 610 to 390 Ma [2,14,15,16,17]. Progressively deformed autochthonous and mostly sedimentary strata (Figure 2) generally represent relatively shallow, nearshore depositional environments. In contrast, now significantly deformed allochthonous strata, deposited in deep distal shelf, slope and rise settings, originated some distance to the east. During the Taconic Orogeny from ca. 495–450 Ma [18], the allochthonous strata and associated Lower Ordovician ophiolite complexes (e.g., Bay of Islands complex), were thrust up to 100 km west and over the autochthonous rocks [19].
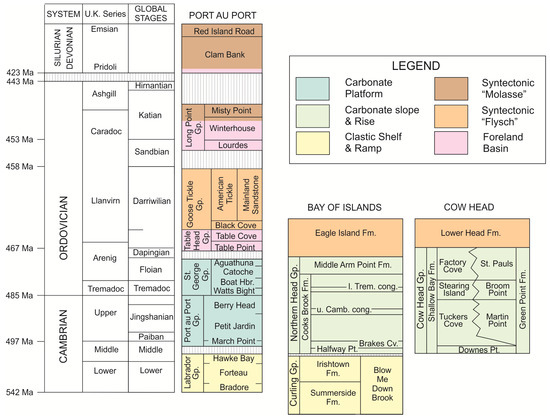
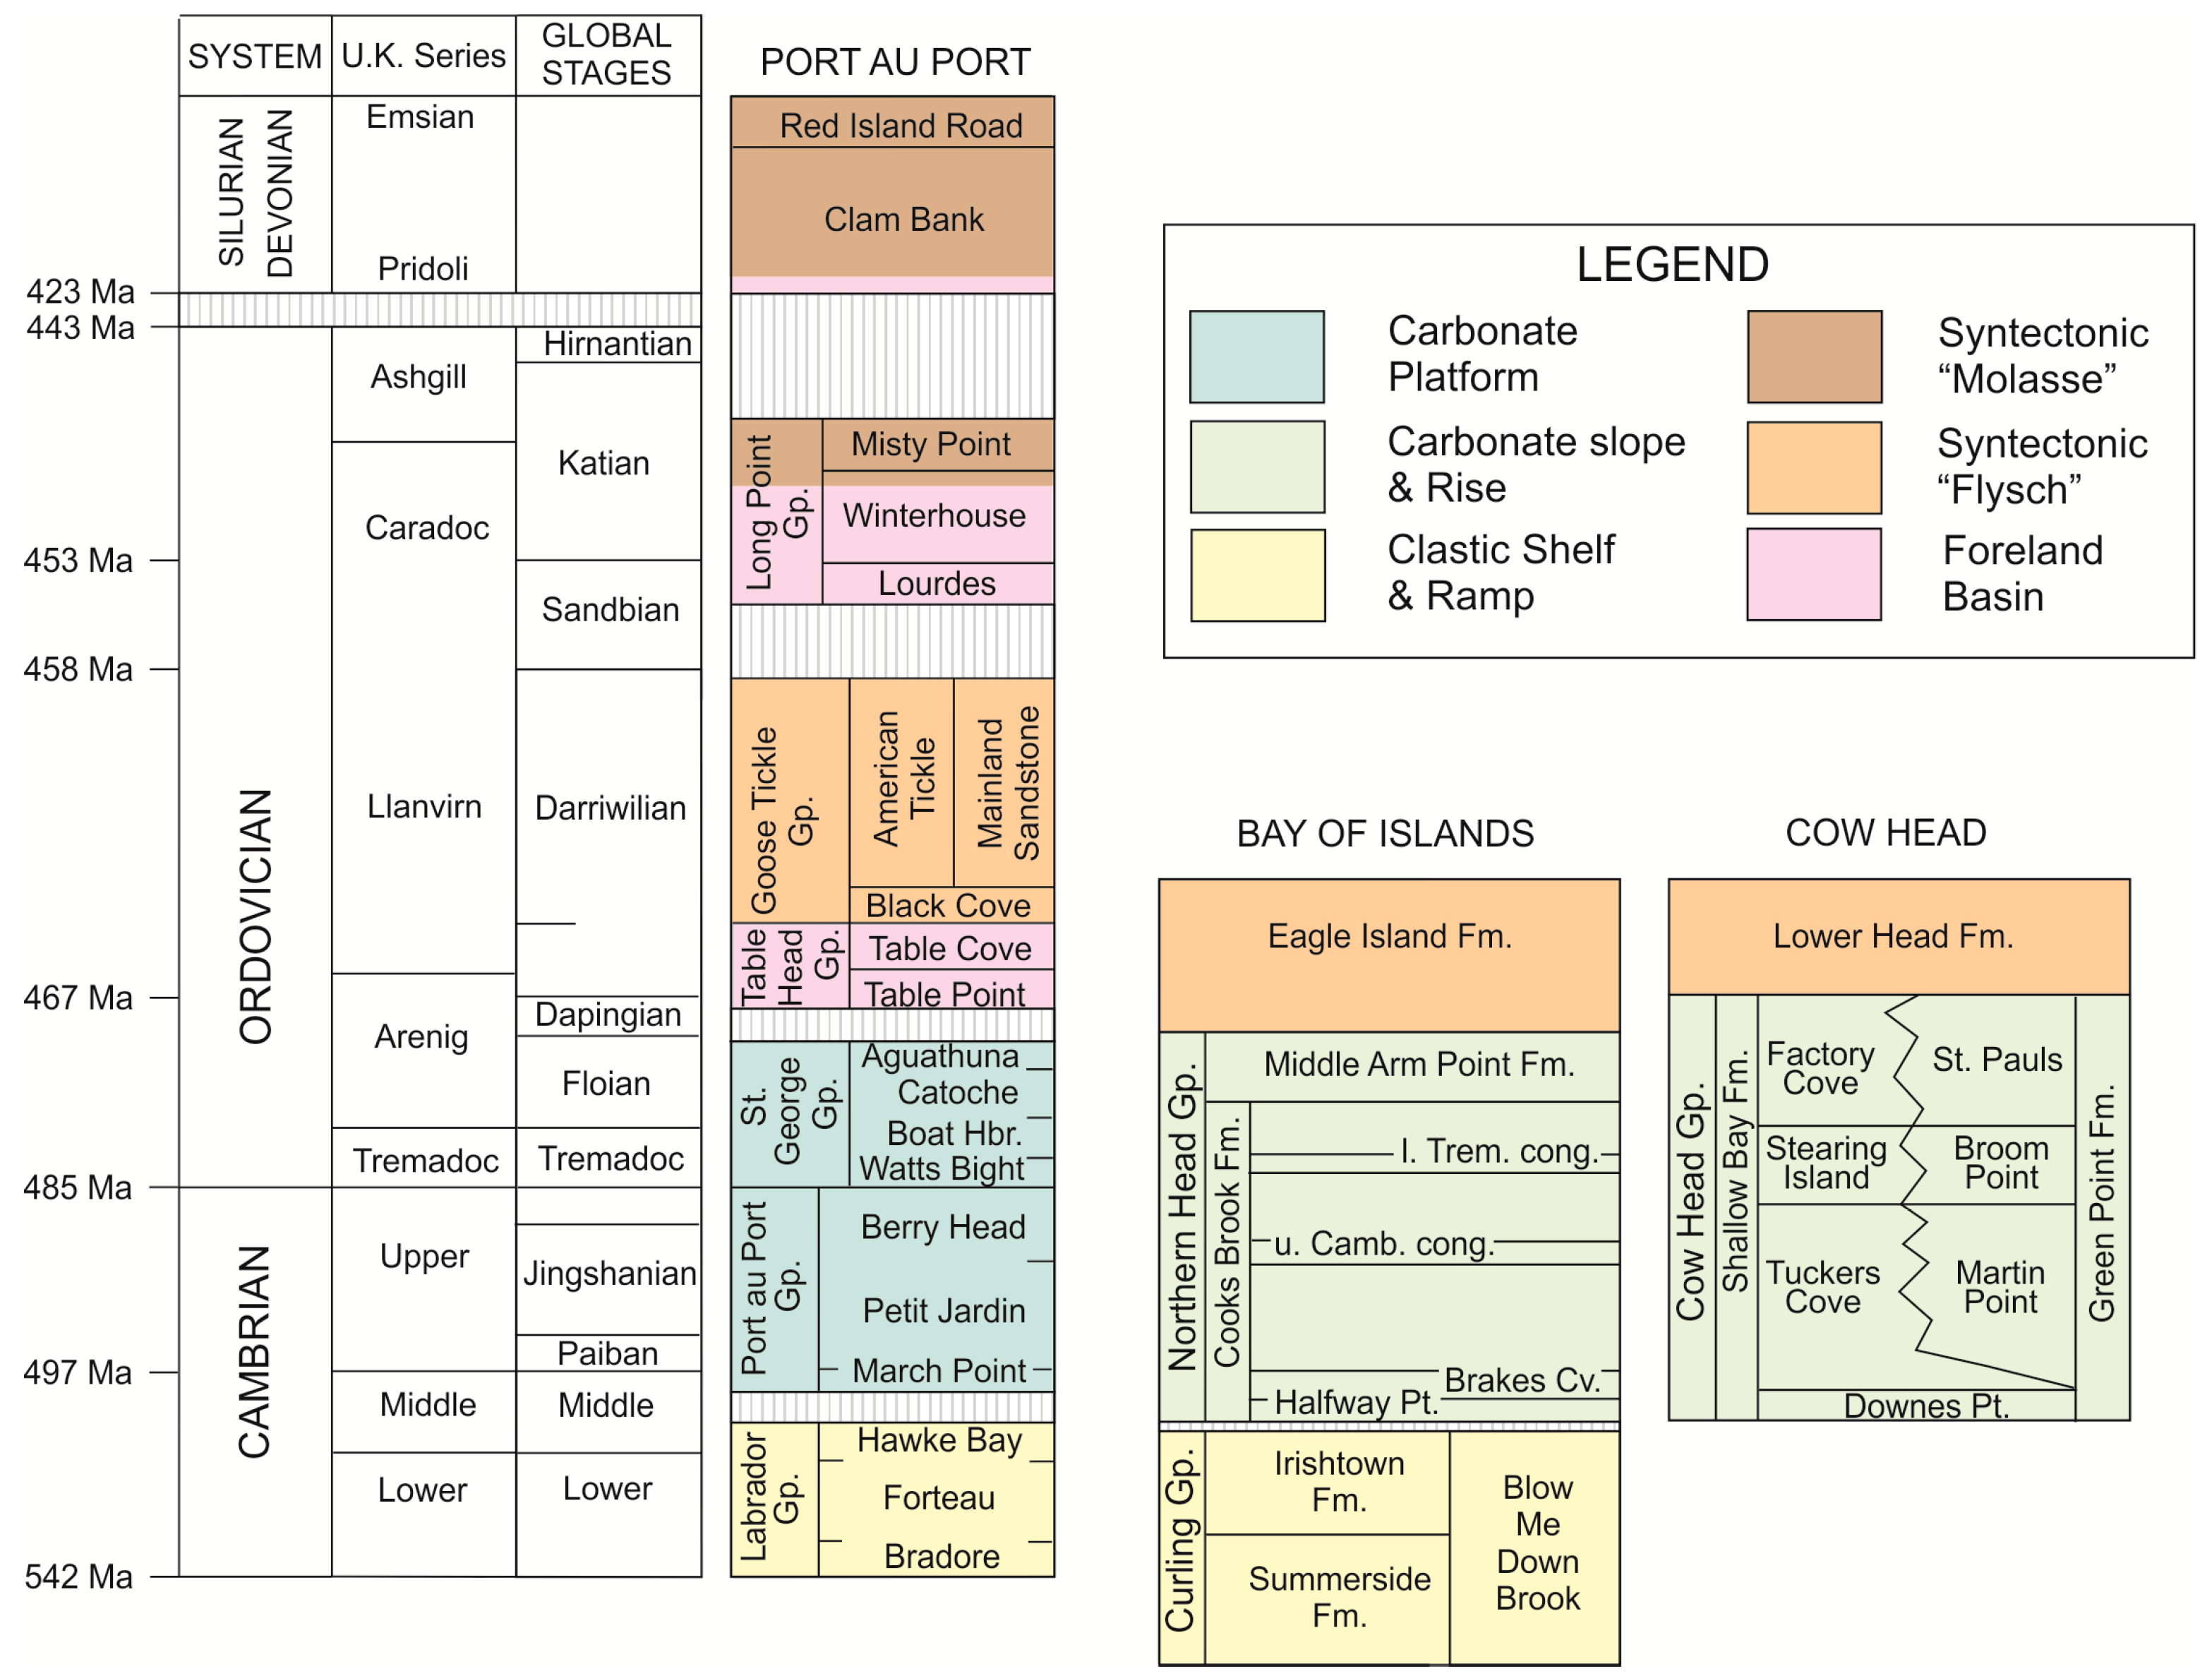
Figure 2.
Modified and simplified regional tectonostratigraphy and correlations for Lower Paleozoic sedimentary rocks in the western Newfoundland (adapted from [20]).
2.1. Lower Cambrian to Middle Ordovician Autochthonous Sequence
In western Newfoundland, significant late Proterozoic and early Cambrian [16] rifting, associated with the opening of the Iapetus Ocean, is first recorded as late Proterozoic, fault-bounded, terrestrial clastic and volcanic rocks of the lower Labrador Group. Later, in the early and middle Cambrian, these beds were unconformably overlain by <1 km of coarse and fine clastic rocks of the upper Labrador Group and a thick (~1.5 km) middle Cambrian to lower Ordovician carbonate platform succession (Port au Port and St George groups), deposited on what was by then a passive continental margin along the southern coast of Laurentia [14]. The middle to late Cambrian Port au Port Group is a narrow, high-energy carbonate platform that slowly developed into the wide, low-energy carbonate platform of the early to middle Ordovician St. George Group [14].
The St. George Group forms a sequence of subtidal and peritidal limestones and dolostones deposited, in ascending order, as the Watts Bight, Boat Harbour, Catoche and Aguathuna formations. This group has been mapped throughout western Newfoundland [21] and is extensively dolomitized in many areas [22]. A regional unconformity, the St. George Unconformity, marks the top of the St. George Group and defines a shift from a passive margin to a foreland basin at the beginning of the Taconic orogeny [23]. Shallow to deep subtidal carbonates and mudstones of the Table Head Group were deposited in this foreland basin [15], and were subsequently buried beneath muddy flysch of the Goose Tickle Group [14].
2.2. Lower Cambrian to Middle Ordovician Allochthonous Sequence
In western Newfoundland, the Lower Cambrian to Middle Ordovician allochthons represents a sequence of slope and basin sediments and ophiolites transported and thrust over the autochthonous succession. There are two main allochthons in western Newfoundland, the smaller Hare Bay Allochthon in the north and the larger Humber Arm Allochthon (HAA) in our study area to the south (Figure 1).
The base of the HAA can be observed south of our study area where it crops out as a deep water sedimentary succession of Early Cambrian clastics and turbidites. Locally known as the Curling Group, these beds are considered to be the distal equivalent of the shallow marine autochthonous rocks of the Labrador Group [24,25]. Curling Group strata are overlain by Middle Cambrian to Middle Ordovician sedimentary rocks of the Northern Head Group in the south [26], and the correlative Cow Head Group in the north [24]. The Cow Head Group is subdivided into two distinct end members, the Shallow Bay and Green Point formations [24]. In reference to the carbonate platform of the autochthon, the more proximal Shallow Bay Formation consists of transported coarse limestone conglomerates, calcarenites and thinly bedded limestones. The more distal Green Point Formation dominantly consists of undifferentiated mudstones with less common organically enriched mudstone, and minor, thin conglomerate, calcarenite, and lithic arenite beds. Due to the complex shifting of facies through time and the subsequent tectonic deformation, most measured sections comprise mixed successions of the two end members, carbonate and mudstone [24,27].
The Middle Ordovician Lower Head Formation unconformably overlies the Cow Head Group and was deposited during the early stages of foreland basin development and Taconic deformation [28]. The Lower Head Formation is highly variable in character, but mainly consists of medium- to coarse-grained sandstones with lesser conglomerate and mudstone units [28]. In the south, where it overlies the Northern Head Group, the Lower Head Formation is called the Eagle Island Formation [26]. In this locality, this Taconic flysch carries the same graptolite assemblage as that found in the uppermost Middle Arm Point [26].
2.3. Parsons Pond Geology
The surface geology in the Parsons Pond area is dominated by thrust-bounded imbricate sheets of Lower Head Formation and Cow Head Group strata. These allochthonous rocks were first carried west over autochthonous platform during the Taconic orogeny. Later in their history, suites of east verging post-Taconic thrusts (e.g., the Parsons Pond thrust), are thought to have been reactivated and inverted [29].
Organic geochemical studies of oils and strata, mineralogy, fission tracks, and fossils [30,31,32] offer substantial evidence to show that some organic Green Point Formation mudstones can be rich Type 1 and 2 source rocks with as much as 10% TOC and with oils enriched with cyanobacterial biomarkers that correspond with some of the abundant the fossil acritarchs in these beds. The Green Point strata are the most likely source of petroleum in the Parsons Pond area. Furthermore, the maturation indicators from fossils in outcrops show the mudstones are marginally mature to mature [33], and additional mature and overmature strata may occur at depth. A number of potential oil and gas bearing reservoir rocks have been suggested to exist in the Parsons Pond area [1], including porous sandstones of the Lower Head Formation. However, Knuckle [34] suggested that these sandstones commonly have such poor porosity and permeability that natural fracture-enhanced porosity would be required to account for any historical production. Other potential reservoir rocks include dolomitized carbonate sands of the Cow Head Formation and porous dolomite and clastic formations in underlying autochthonous rocks, similar to the potential reservoir rocks identified on the Port au Port Peninsula [2].
In 2004, Contact Exploration Inc. drilled the Parsons Pond #1 well about 5 km southeast of the town of Parsons Pond (Figure 1). The well was drilled into the allochthonous cover rocks (Lower Head Formation and Cow Head Group) with core recovered from 111 to 1062 m (Figure 3); full drill logs and drilling details are available in [35]. The Lower Head Formation, as logged from 111 to 635 m, predominantly consists of fine- to coarse-grained sandstone with well-developed calcite cement. The sandstone is generally tight but with minor sections containing up to 12% intergranular porosity and gas shows (up to 3.94% total gas; [35]) associated with more fractured zones. The Lower Head Formation unconformably overlies the Cow Head Group, the base of which is not intercepted in this well. The Cow Head strata from 635 to 755 m are mudstones and dolomitic mudstones with minor limestone horizons (possible Green Point Formation). This is followed by 307 m of rhythmically bedded limestone, with local conglomeritic limestone horizons (possible Shallow Bay Formation). The limestone horizons (rhythmically bedded and conglomeritic) are commonly crosscut by thin (generally 1–2 mm) calcite veinlets, with oil and gas shows recorded in the most intensely faulted and fractured sections [35].

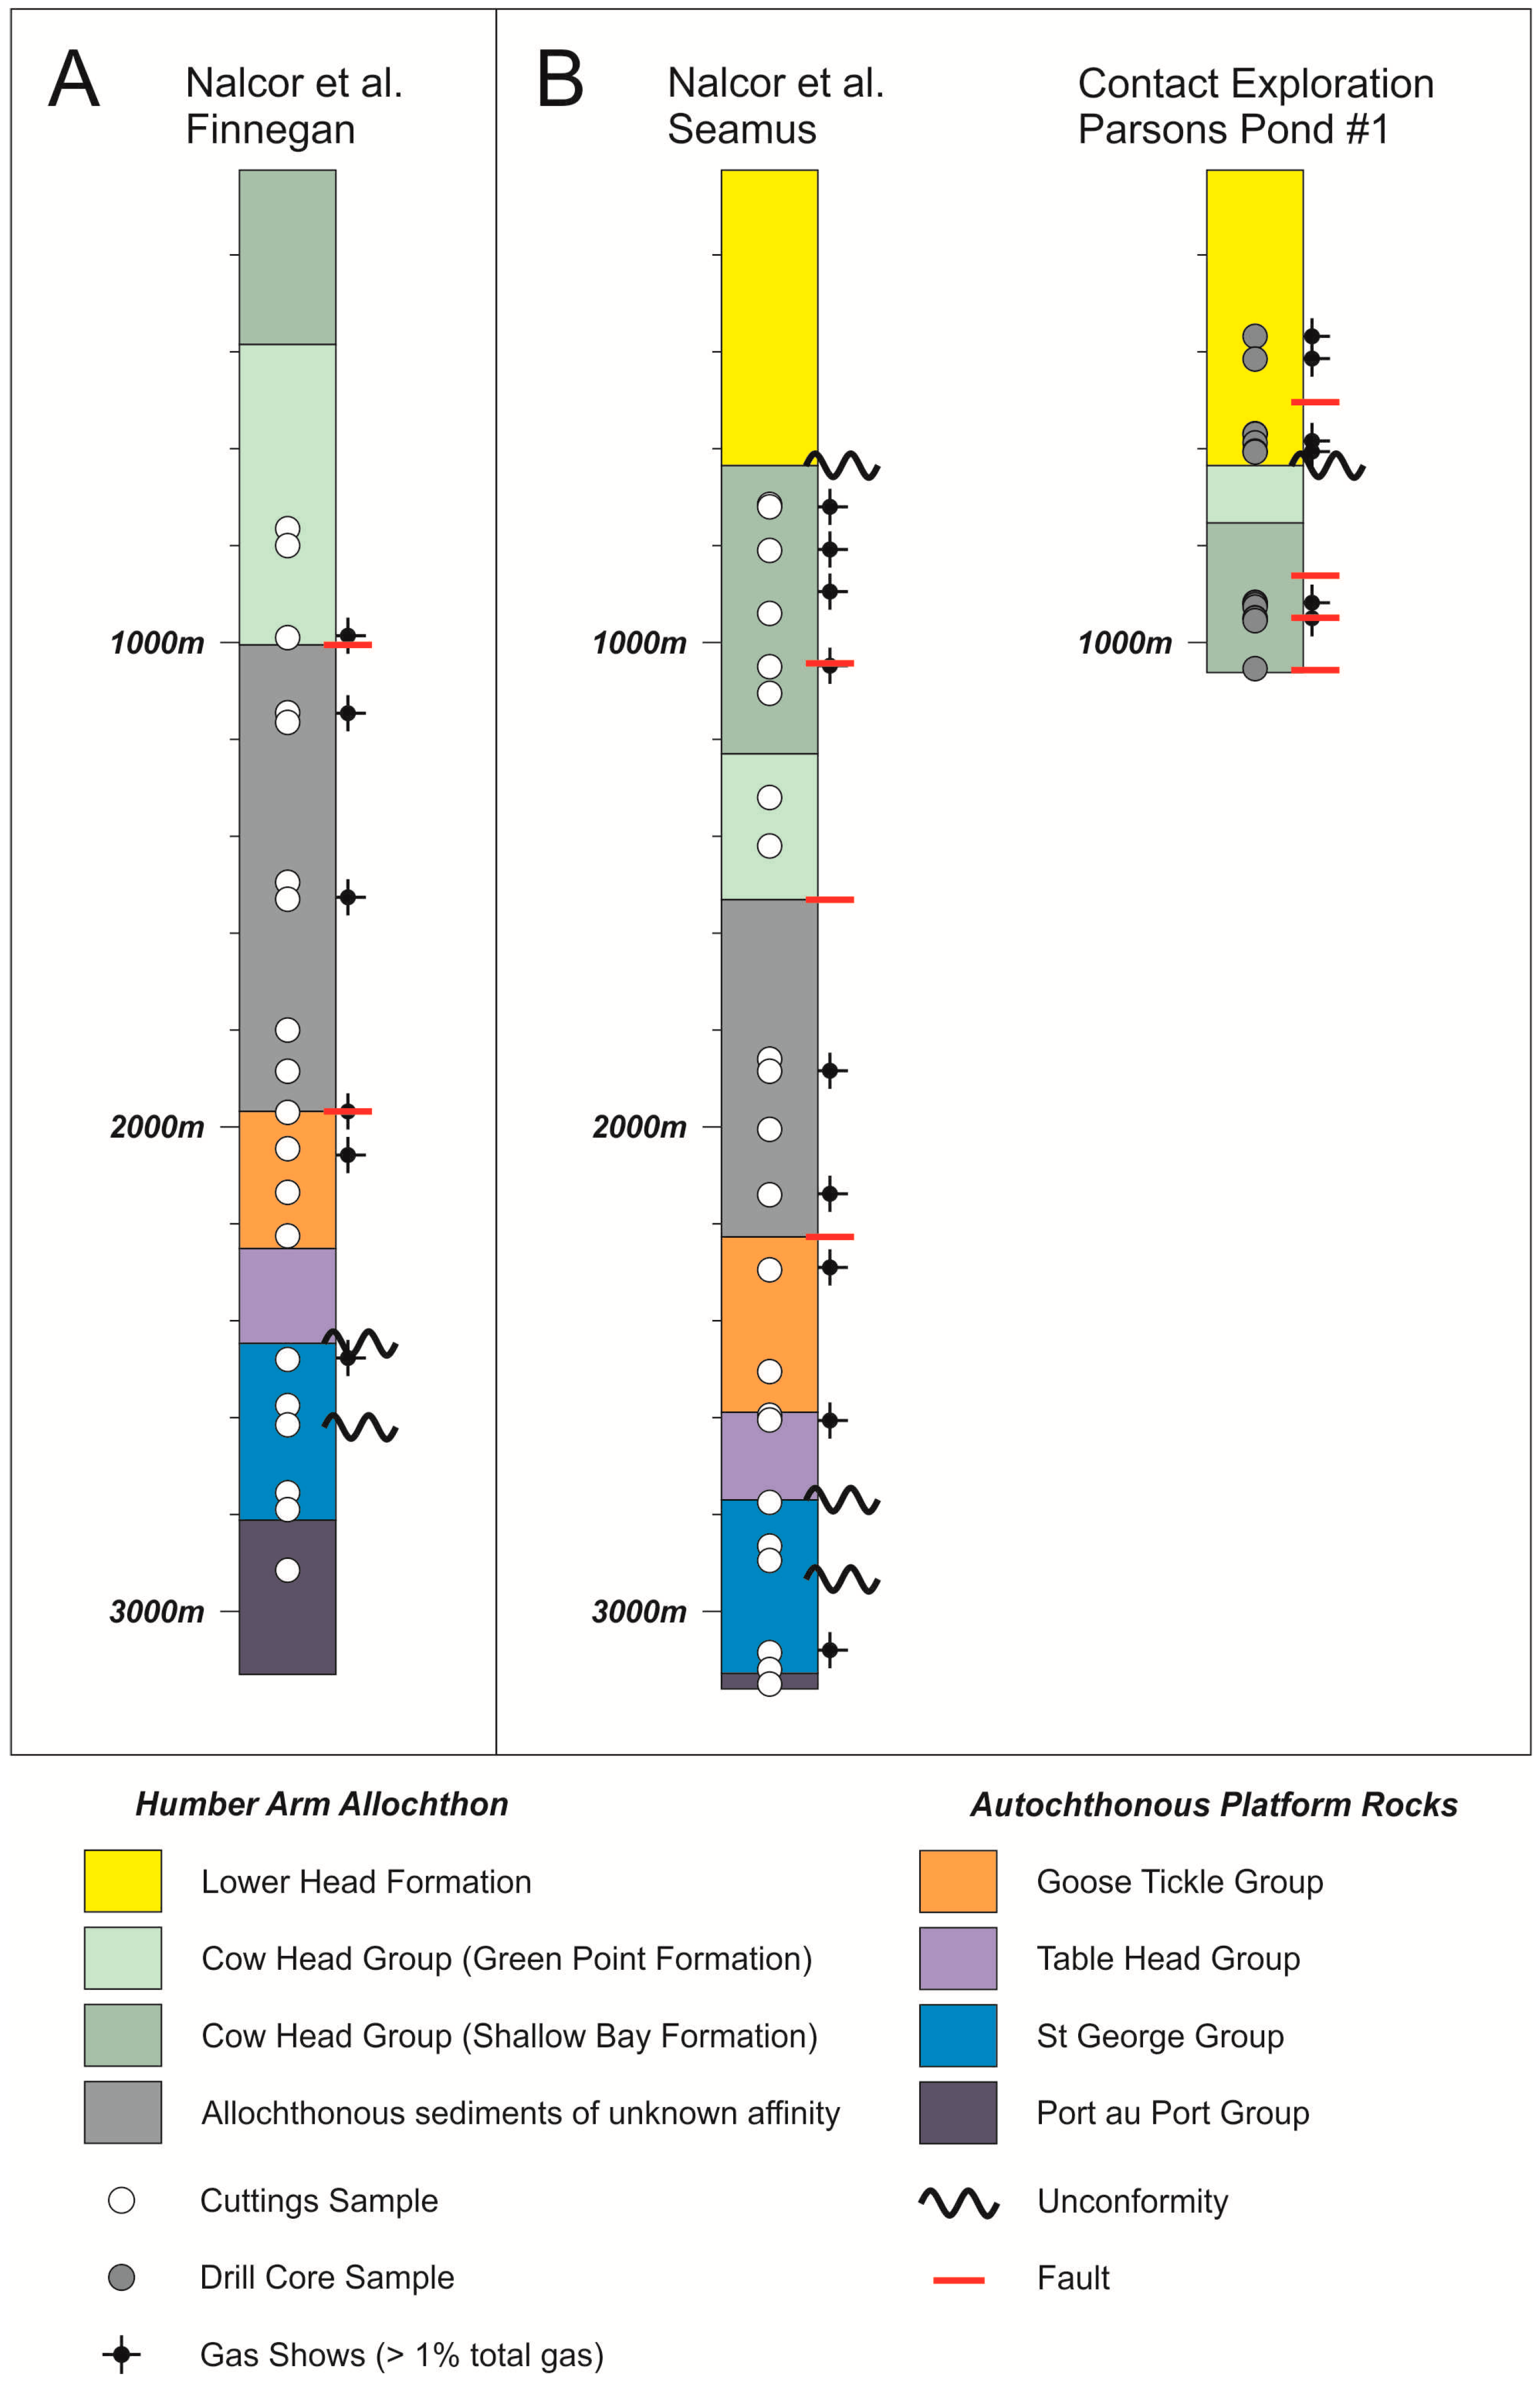
Figure 3.
Simplified stratigraphic logs for exploration wells in the Parsons Pond area, showing the location of drillcore and cuttings samples used in this study (location of wells shown in Figure 1). (A) Stratigraphic log for Nalcor et al. Finnegan (northern well); (B) Stratigraphic logs for Nalcor et al. Seamus and Parsons Pond #1 (southern wells). Stratigraphy adapted from [35,36,37].
In 2010 Nalcor Energy drilled two exploration wells in the Parsons Pond area. Nalcor et al. Seamus is located close to the Parsons Pond #1 well and Nalcor et al. Finnegan is located ~10 km northeast of Parson’s Pond (Figure 1). These wells reached depths of 3130 and 3160 m, respectively, and were the first wells at Parsons Pond to penetrate the allochthonous cover rocks and reach potential reservoir rocks in the autochthonous sequence below (Figure 3). They were drilled into spate thrush sheets making correlations between the allochthonous strata in each well impossible. Full drill logs and drilling details are available for Nalcor et al. Seamus at [36] and for Nalcor et al. Finnegan at [37].
Nalcor et al. Seamus encountered Lower Head sandstones to 635 m, and Cow Head Group mudstones and limestones from 635 to 1529 m. From 1529 to 2227 m, a sequence of limestones, mudstones and sandstones of unknown affinity were encountered. Nalcor et al. Finnegan encountered Cow Head Group limestones and mudstones to 1005 m, followed by limestones, mudstones and sandstones of unknown affinity from 1005 to 1837 m. These unknown sedimentary sequences are interpreted to represent Eagle Island and Yellow Point formation rocks [36] or undifferentiated allochthonous sediments [37], and further work is required to determine their relationships with other allochthonous strata in western Newfoundland. A faulted contact with the underlying autochthonous sediments is assumed based on seismic sections [36,37], and the autochthonous shelf rocks in both wells record a full sequence from the Goose Tickle to the Port au Port groups (Figure 3).
Numerous gas shows with up to 64.89% total gas were recorded in both allochthonous and autochthonous strata [36,37]. Higher total gas values are generally associated with fractured host rocks and/or major faults and stratigraphic contacts (Figure 3). Minor gas shows are also reported from St. George Group carbonates.
3. Sampling and Methodology
A total of 15 drill core samples from the Parsons Pond #1 well and 43 cutting samples from Nalcor et al. Seamus and Nalcor et al. Finnegan were collected for fluid inclusion analysis (Table 1, Figure 3). These samples represent all major allochthonous and autochthonous units in the Parson’s Pond area, with special emphasis on samples from horizons containing elevated gas shows. Doubly polished wafers for fluid inclusion analysis were prepared from core samples. Suitable grains (generally 1–5 mm in size) for fluid inclusion analysis (e.g., calcite and quartz vein material, well cemented sandstone, late-stage hydrothermal dolomite and calcite rhombs) were hand-picked from cuttings, mounted on glass slides and polished for analysis.

Table 1.
Sample locations and brief lithological descriptions from Parsons Pond #1 well (prefix CE), Nalcor et al. Seamus (prefix S) and Nalcor et al. Finnegan (prefix F).
All analytical work was carried out at the Core Research Equipment and Instrument Training Network (CREAIT) Fluid Inclusions Facility, Memorial University of Newfoundland. Petrographic studies established a fluid inclusion classification scheme for aqueous, petroleum-bearing and gas-bearing fluid inclusions (>2 µm in size). The fluid inclusion petrographic study adopted the concept of fluid inclusion assemblages (FIA) described by Goldstein [38]—An approach that places fluid inclusions into assemblages interpreted to have been trapped at approximately the same time. Textural relationships between inclusions and the host mineral are therein used to constrain the relative timing of fluid migration.
Fluid inclusion microthermometry was conducted using a Linkam THMSG600 heating freezing stage (Surrey, UK). Calibration was carried out using synthetic H2O and CO2 standards; precision of ±0.2 °C at –56.6 °C and ±0.5 °C at 300 °C. Homogenization temperatures (Th) were recorded from aqueous, petroleum and gas fluid inclusions. All Th values of inclusions in a single FIA vary by <10 °C, which indicates that these inclusions have not re-equilibrated post-entrapment (e.g., stretching, leaking) Eutectic temperatures (temperature of first ice melting) were recorded in some Type 2 and 3 inclusions (described below), and later used to estimate the composition of aqueous inclusions. In addition, fluid salinities (equivalent weight % NaCl; eq. wt % NaCl) in aqueous inclusions were calculated using temperatures of last ice melting (Tmice), according to the equation of [39].
The presence of petroleum bearing fluid inclusions was determined using an Olympus BX51 microscope (Tokyo, Japan) attached to the Linkam THMSG600 heating freezing stage illuminated with both visible and ultraviolet (UV) light sources. The UV excitation was approximately 365 nm with a 420 nm epi-fluorescence barrier. The fluorescence colour of petroleum fluids under UV light can be related to API gravity [40,41], although variations in fluorescence colours may also related to other processes such as water washing and fractionation during migration [42] or source rocks [43].
UV microfluorescence spectroscopy can be used to better determine the composition and API gravity of the fluids, and to discriminate between separate populations of petroleum fluid inclusions, as it provides a more detailed evaluation of the fluorescence characteristics of petroleum fluids at a range of wavelengths [11,12,44,45,46]. The fluorescence spectra for inclusion oils were measured with a CRAIC QDI 202Tm Microspectrophotometer (San Dimas, CA, USA), according to the methodology outlined by [46]. In order to discriminate between different oil types, the maximum intensity of peaks (λmax) and the relative intensity at 650 and 500 nm (QR/G; [44]) and at 500 and 430 nm (QG/B; [45]) were calculated for petroleum-bearing fluid inclusions.
4. Results
4.1. Fluid Inclusion Petrography and Microthermometry
Fluid inclusions were recorded in authigenic quartz cements in sandstones (allochthonous and autochthonous strata), veins which crosscut all lithologies allochthonous and autochthonous strata) and in hydrothermal dolomite cements (autochthonous strata only). The veins are predominantly composed of calcite and quartz, and the dominant mineralogy is controlled by the host rock (calcite veins in limestone and shale unites, quartz and quartz–calcite veins in sandstone units). Detailed analysis of drillcore have only recognised crosscutting veins in a single sample (CE922.7), where an early calcite veinlet is crosscut by a later calcite vein.
FIA are recorded in a variety of settings, including clusters of inclusions and inclusions in trails parallel to and not crosscutting grain boundaries (primary, pseudosecondary) and trails of inclusions along annealed fractures crosscutting grain boundaries (secondary). Where possible, microthermometric measurements were made on FIA of demonstrably primary and pseudosecondary origin. However, grain boundaries were not observed in some vein fragments in cutting samples and therefore it was not possible to determine the precise paragenesis of these inclusions. Numerous FIA were also recorded in detrital quartz grains in sandstone horizons. These FIA likely represent inherited fluid signatures (from the source of the quartz sand grains), and were not included in this study.
Six main fluid inclusion types were identified from their optical characteristics at room temperature and their phase behaviour on cooling (Table 2). In the case of Type 3 (petroleum bearing) inclusions, their identity was determined using UV microscopy. Fluid inclusions in all samples display a range of morphologies from ellipsoidal to irregular shapes, and rare negative crystal shapes. Microthermometric analysis shows that there is no systematic variations based on host mineral (calcite, quartz or dolomite), indicating that these inclusions did not re-equilibrate by post-entrapment processes such as stretching.
Table 2.
Characteristics of fluid inclusion types.
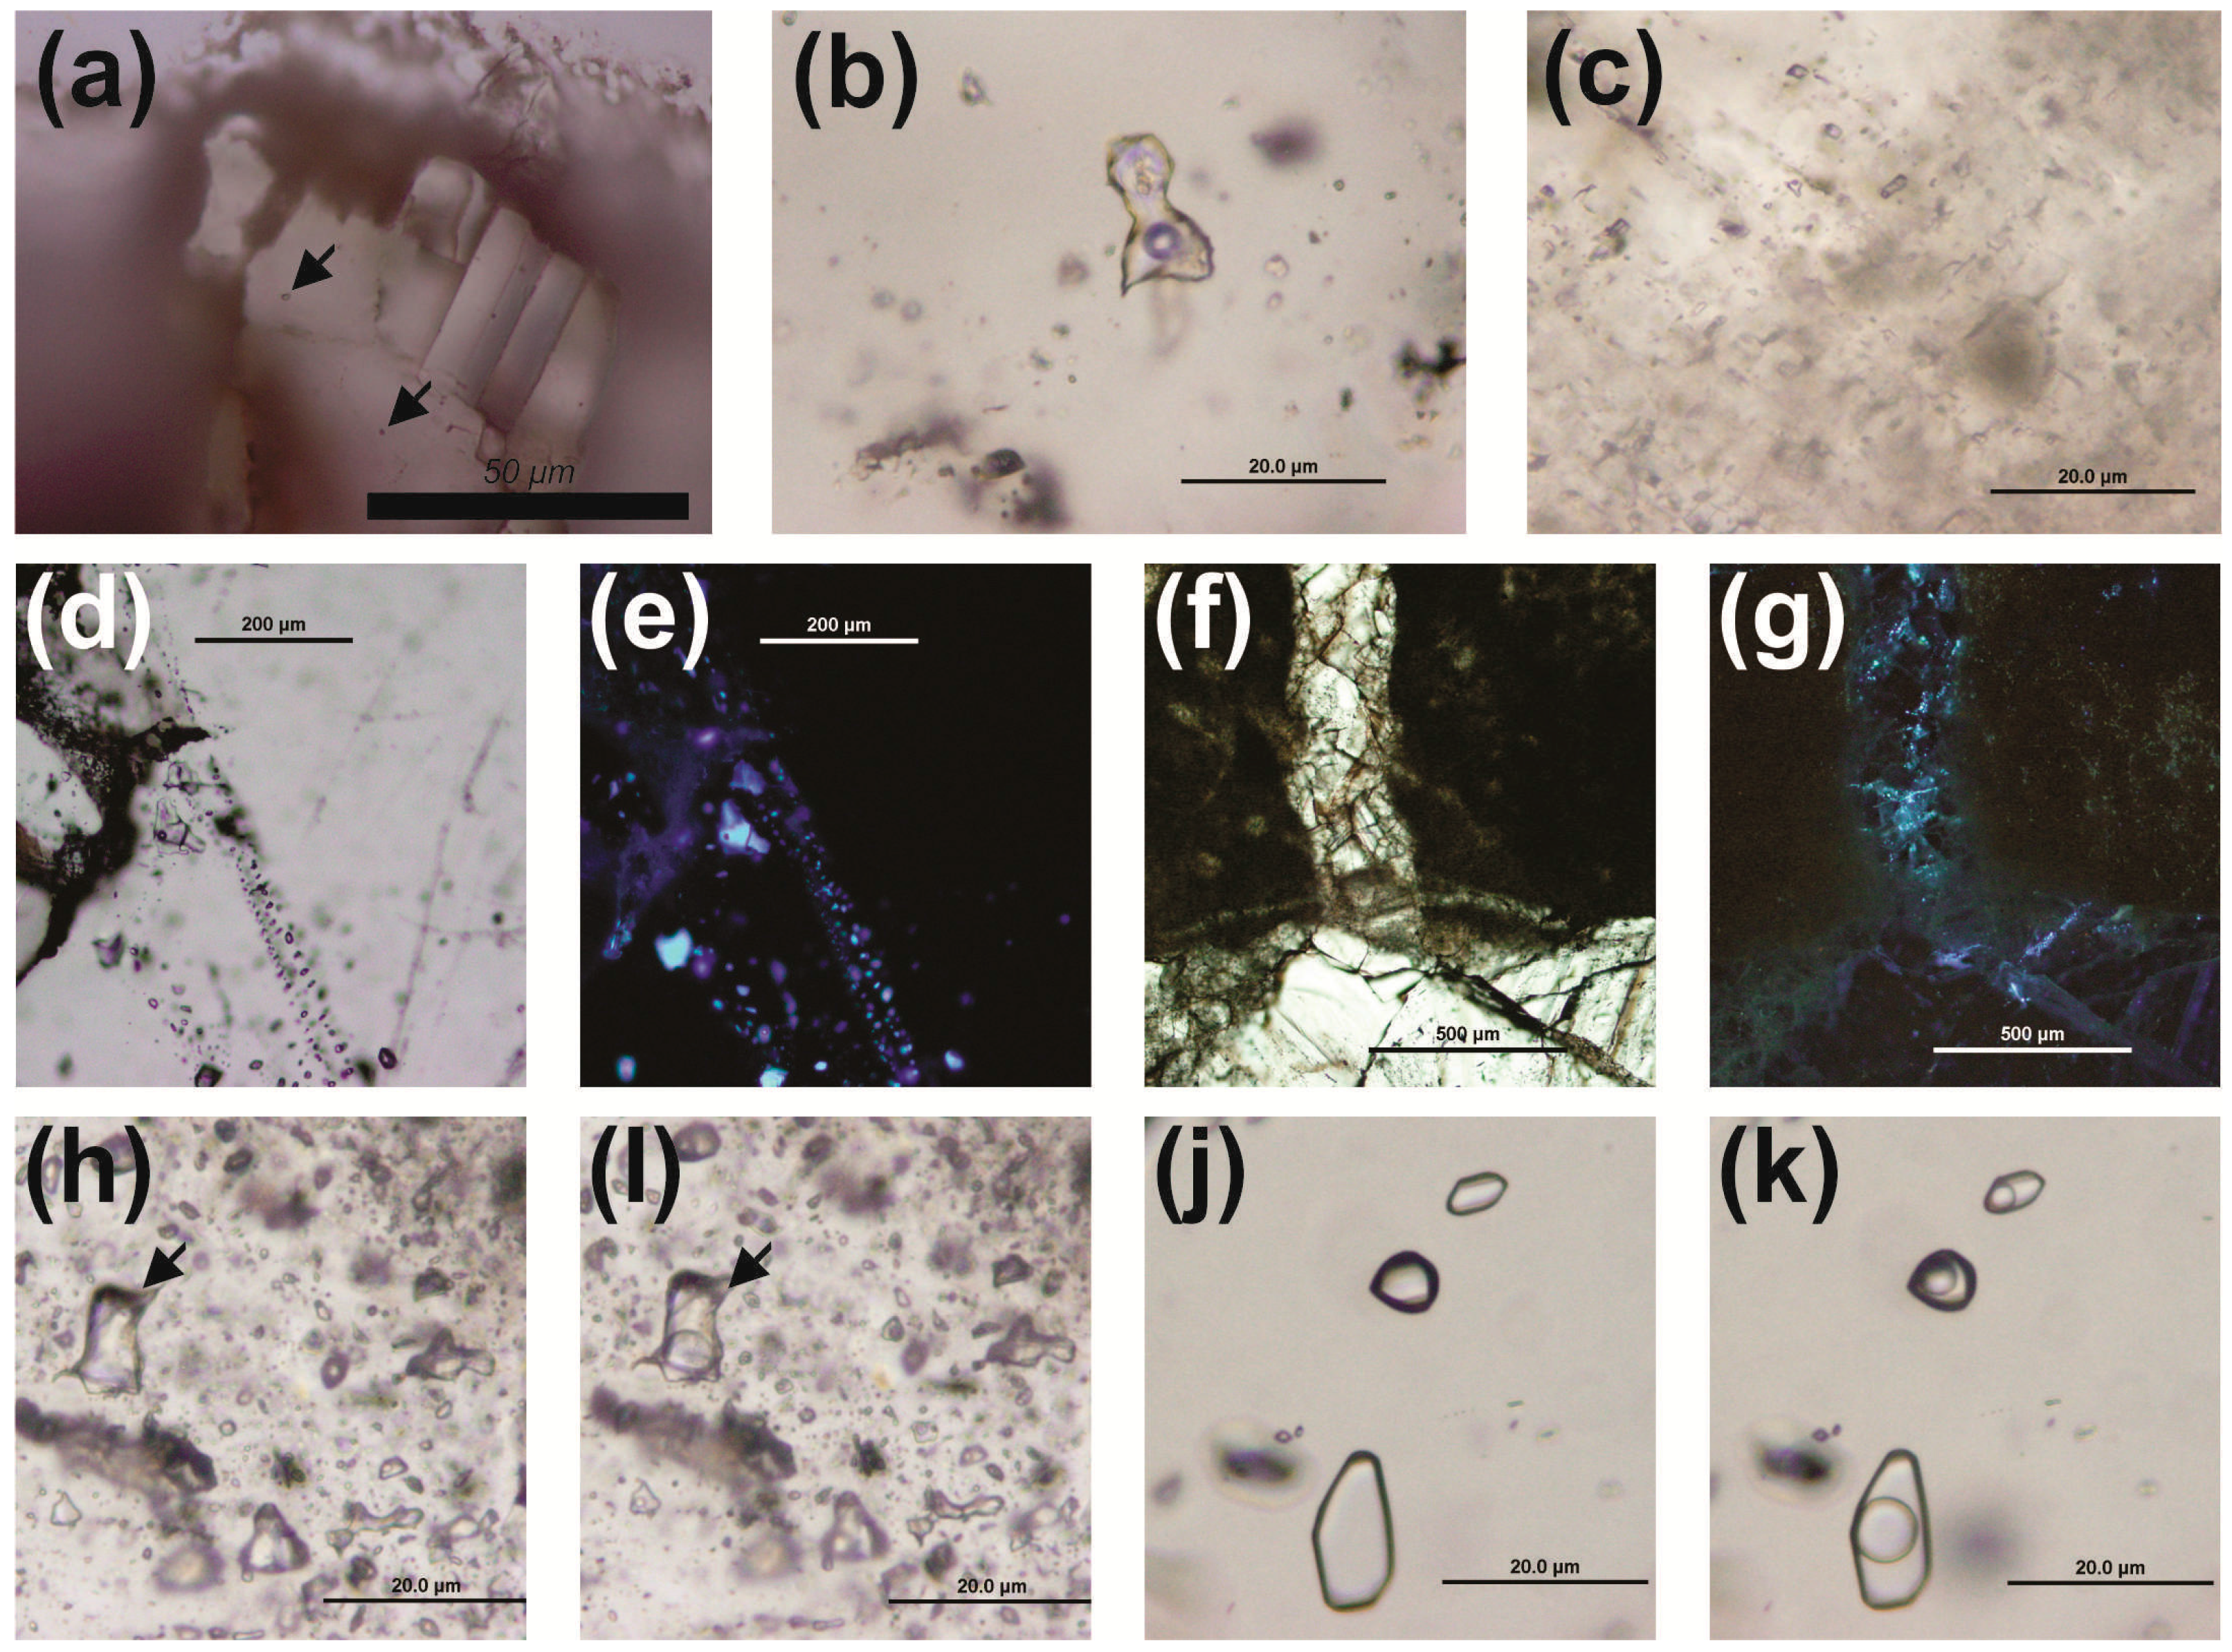
4.1.1. Type 1 Inclusions
Type 1 inclusions are monophase (liquid only), non-fluorescent aqueous inclusions (Figure 4a) observed in authigenic calcite and quartz cements in nine samples from the Lower Head Formation, the allochthonous sandstones of unknown affinity, and the Goose Tickle Formation (Table 3). No microthermometric measurements were carried out on Type 1 inclusions, but their presence indicates that cements probably formed at low temperatures (<50 °C) [5].

Figure 4.
Photomicrographs of fluid inclusion types. (a) Small, monophase liquid Type 1 inclusions in C1 calcite cement (sample CE570.3); (b) two-phase aqueous Type 2 inclusions in C2 calcite vein material (sample F1530); (c) cluster of two-phase Type 3 inclusion in dolomite crystal (sample F2755); (d) two-phase petroleum bearing Type 4 inclusions in C2 calcite vein material (sample CE949.2); (e) same view as (d); but in ultraviolet light showing blue fluorescence of Type 4 inclusions; (f) Two generations of calcite veining in sample CE927.2; (g) same view as (f); but in ultraviolet light showing blue-green fluorescence of Type 4b inclusions in early veinlet and blue fluorescence of Type 4c inclusions in later calcite vein; (h) calcite-hosted Type 5 inclusions at room temperature in sample F1800; (i) same view as (h) but at −120 °C, showing a large vapour bubble; (j) large, quartz-hosted Type 5 inclusions at room temperature in sample S2005; (k) same view as (j) at −120 °C, showing a large vapour bubble.
Table 3.
Distribution, relative abundance and microthermometric data from fluid inclusions in samples from Parsons Pond. xxx = abundant. xx = common. x = rare.
4.1.2. Type 2 Inclusions
Type 2 inclusions are two-phase (liquid + vapour) aqueous inclusions hosted in both quartz and calcite veinlets (Figure 4b). They have degrees of fill ((volume of liquid)/(volume of liquid + vapour)) between ~0.90 and 0.99. Type 2 inclusions were recorded in 29 samples (Table 3), and accurate microthermometric analyses were only possible on 20 samples due to poor sample clarity and small size (<3 μm) of some inclusions.
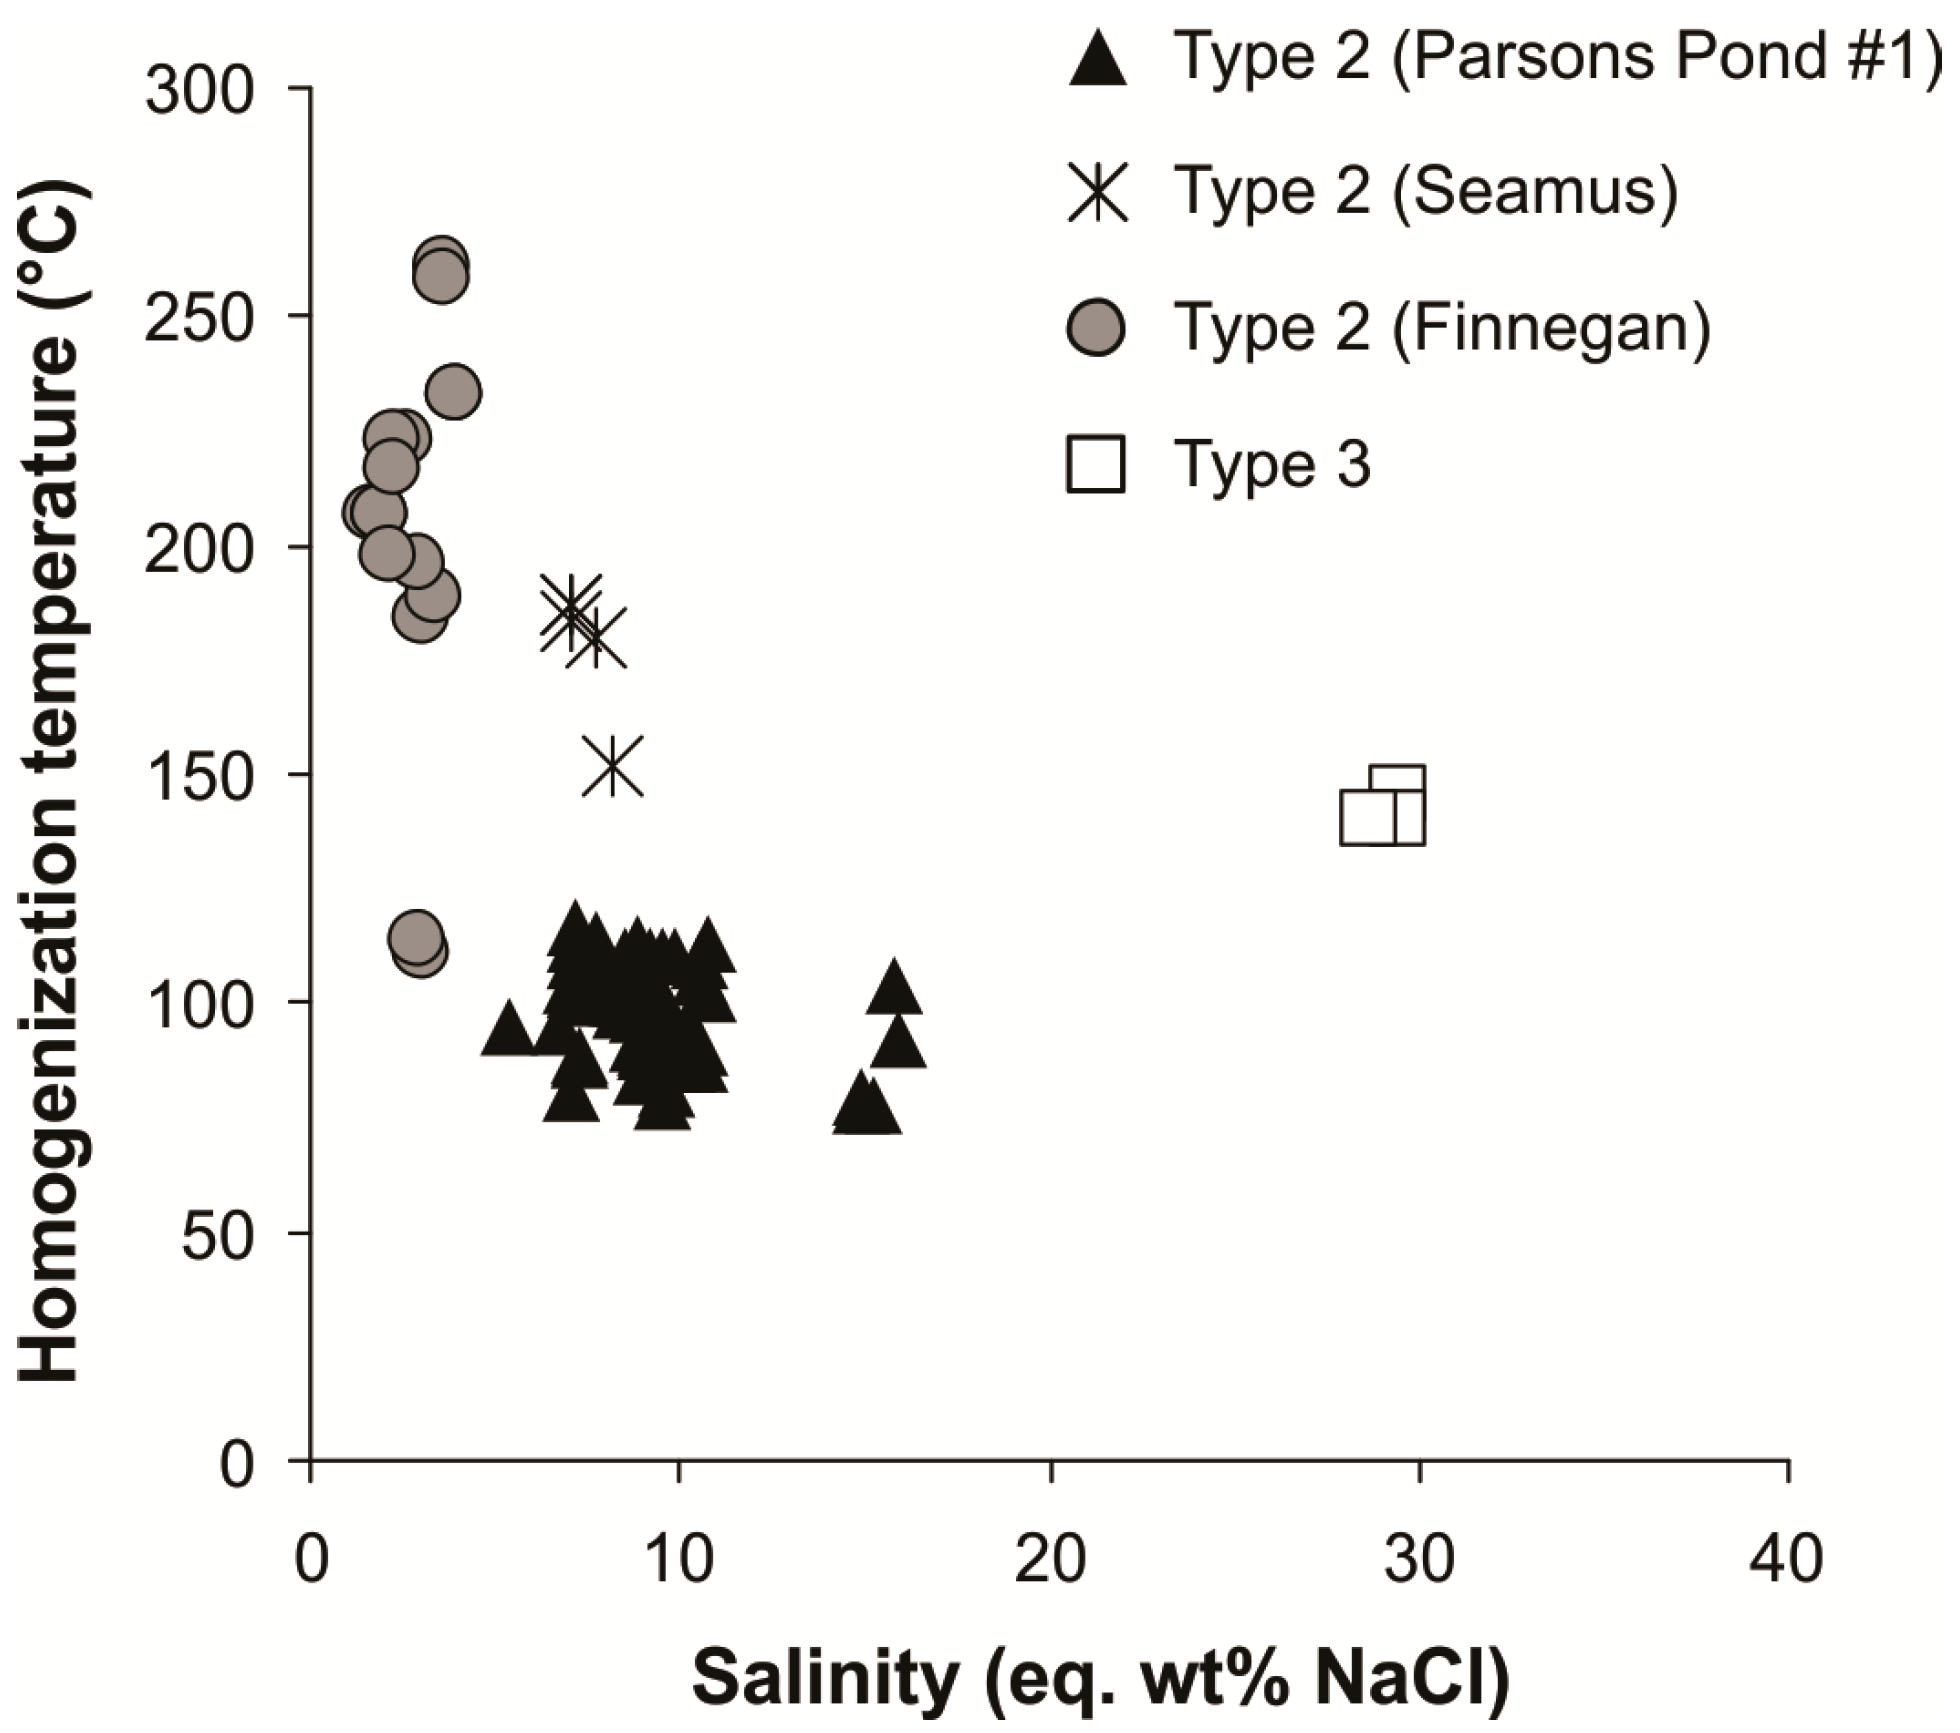
Upon cooling, Type 2 inclusions freeze below −50 °C. First ice melting temperatures were observed at −22.9 ± 1.0 °C, indicating a H2O + NaCl ± KCl composition. Type 2 inclusions from the southern wells (Parsons Pond #1 and Nalcor et al. Seamus) generally have higher salinities (8.9 ± 1.9 eq. wt % NaCl) and lower homogenization temperatures (105 ± 21.5 °C) than inclusions in calcite and quartz veinlets from Nalcor et al. Finnegan (1.65 ± 0.42 eq. wt % NaCl; 204.3 ± 39.1 °C) (Figure 5). In addition, some Type 2 inclusions from Nalcor et al. Finnegan display clathrate melting at temperatures >0 °C, consistent with the presence of dissolved CH4 ± CO2 in the aqueous fluids.
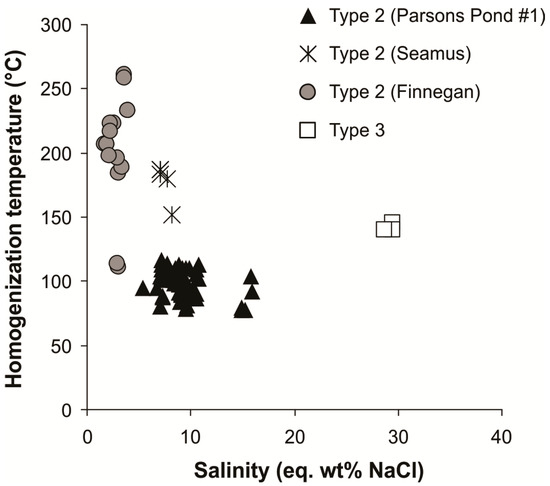
Figure 5.
Bivariate plot of salinity vs. homogenization temperatures for Type 2 and Type 3 inclusions.
4.1.3. Type 3 Inclusions
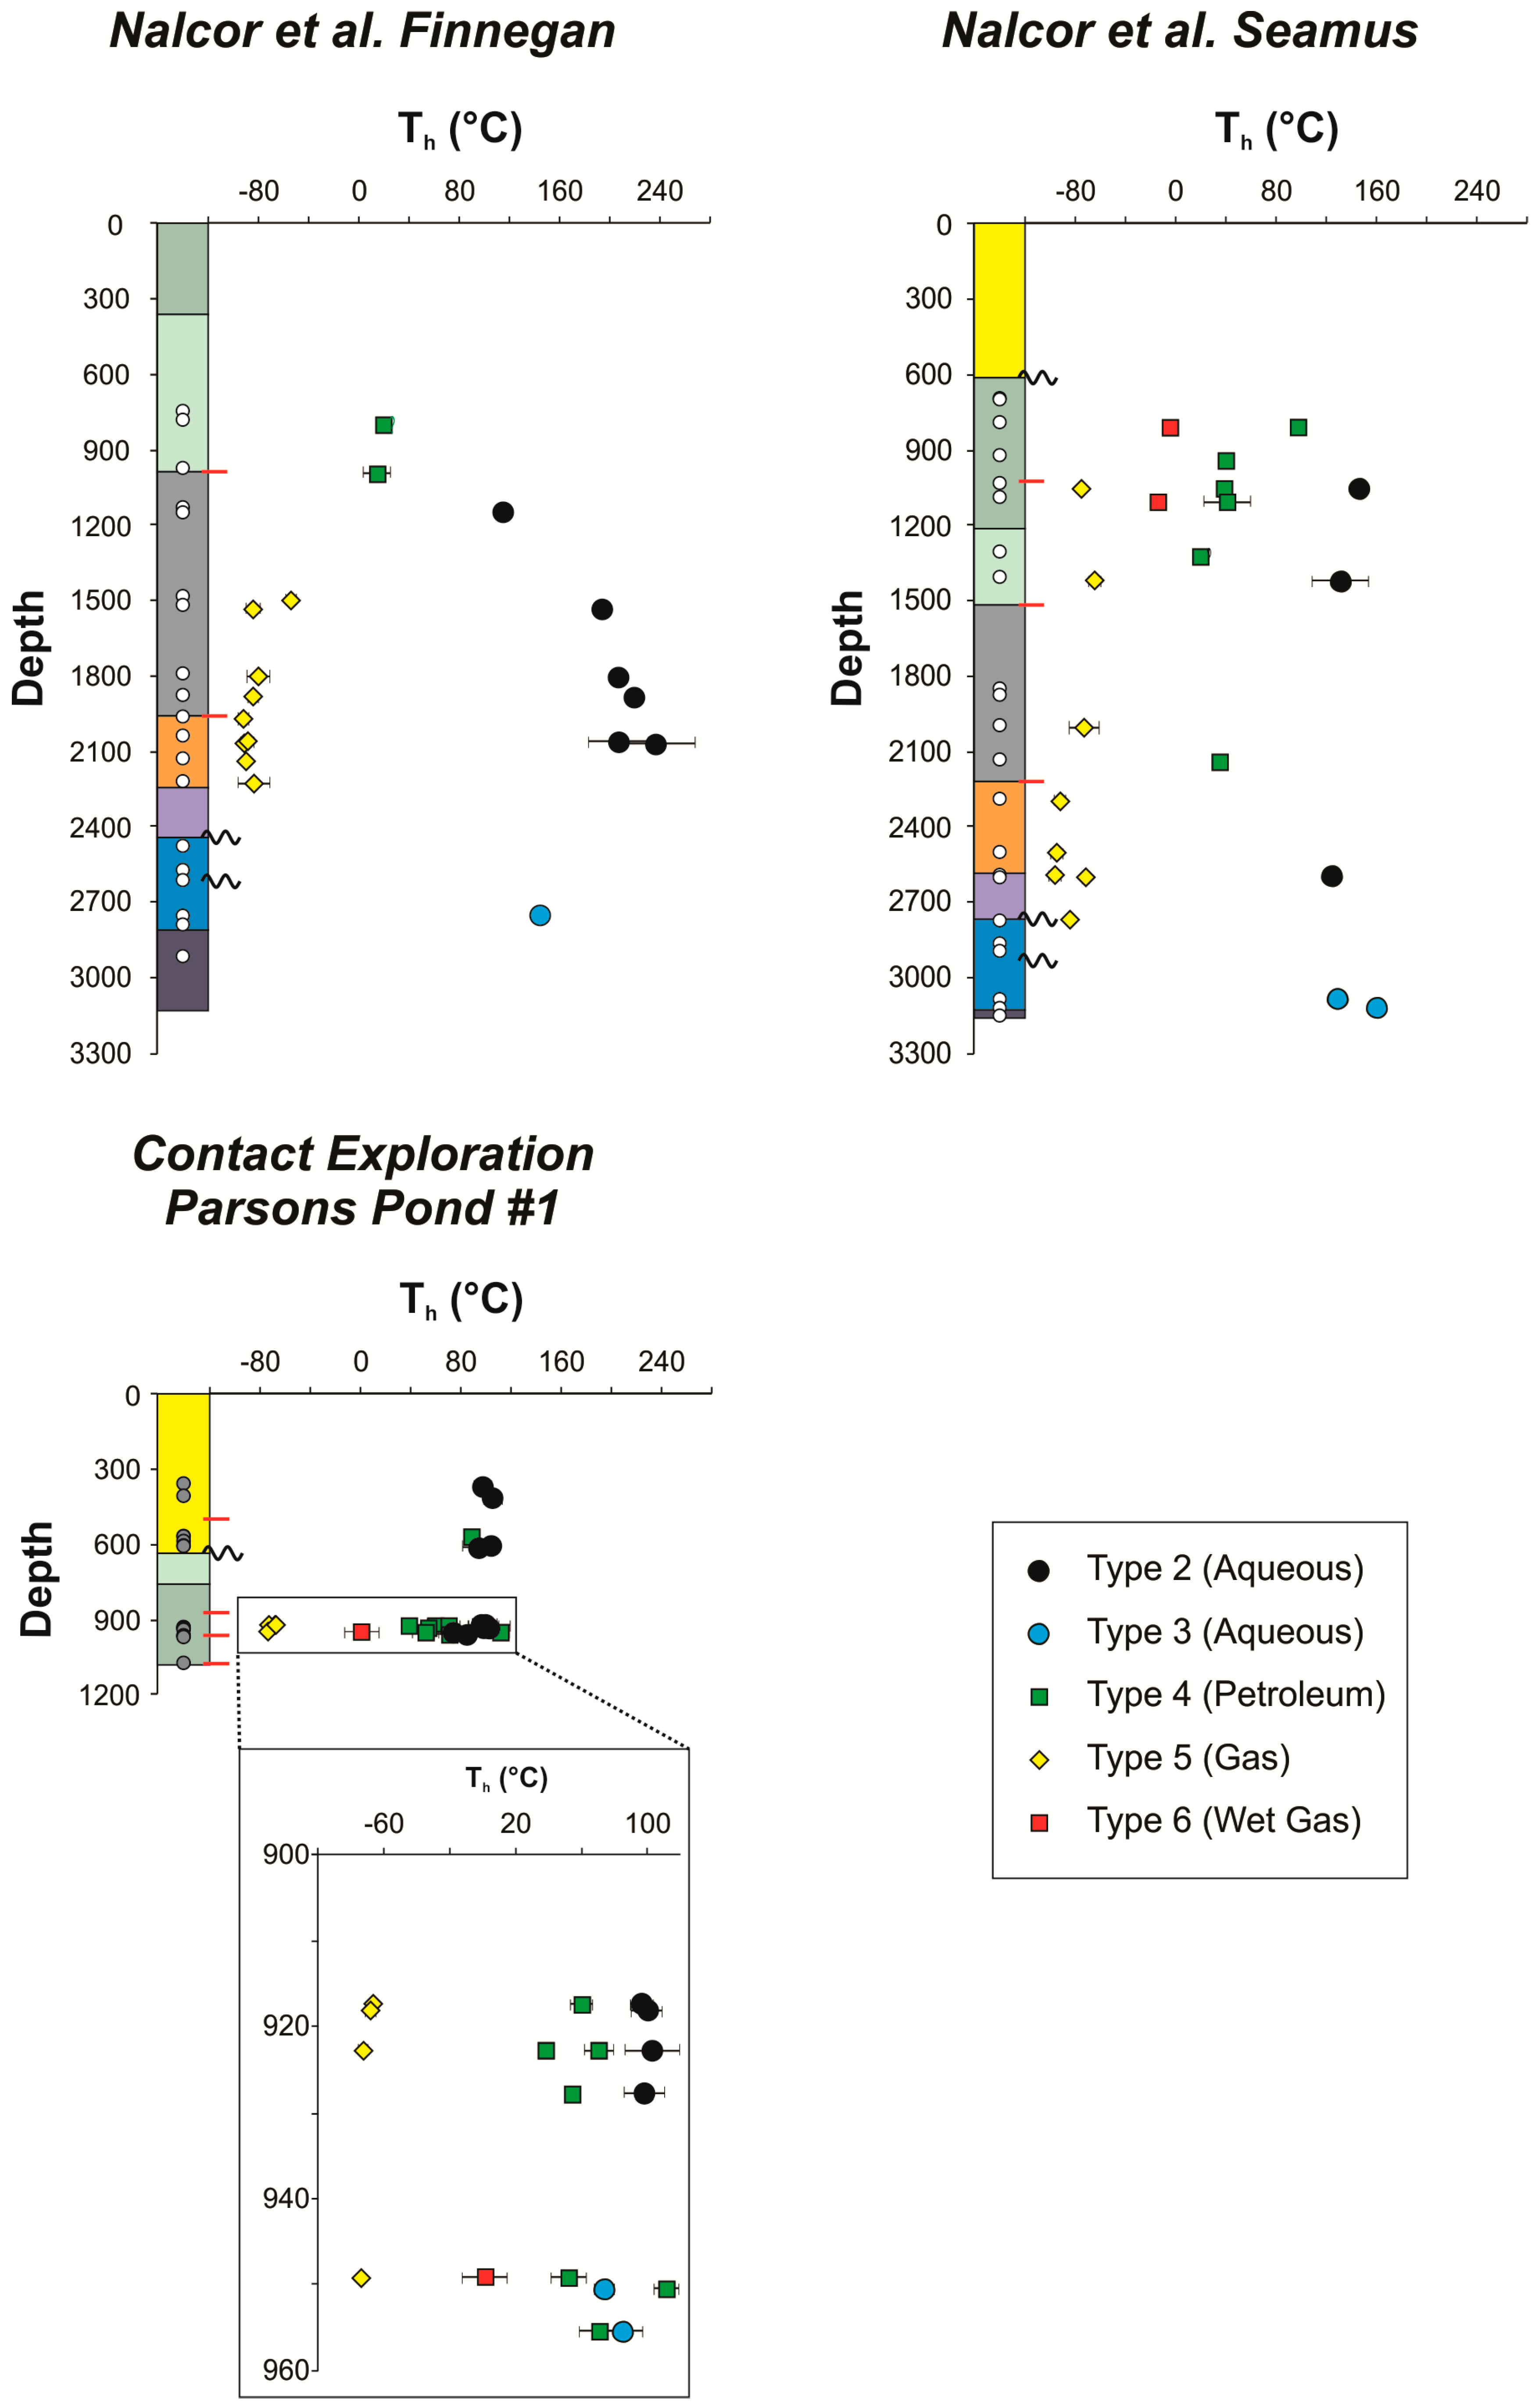
Type 3 inclusions in eight samples from the St. George and Port au Port group carbonates are two-phase aqueous inclusions hosted by dolomite and calcite (Table 3; Figure 4c). These inclusions are small (<5 μm), and microthermometric measurements were only possible in three samples. Type 3 inclusions freeze at temperatures of <−70 °C and form a characteristic brown ice. First ice melting occurs at ~−50 °C, indicating that these fluids are CaCl2-rich brines. Tmice values were recorded in one sample (F2755) and were used to calculate fluid salinities of 29.2 ± 0.5 eq. wt % NaCl (Figure 5). Homogenization temperatures of Type 3 inclusions range from 124.6 to 164.9 °C (Figure 5 and Figure 6).
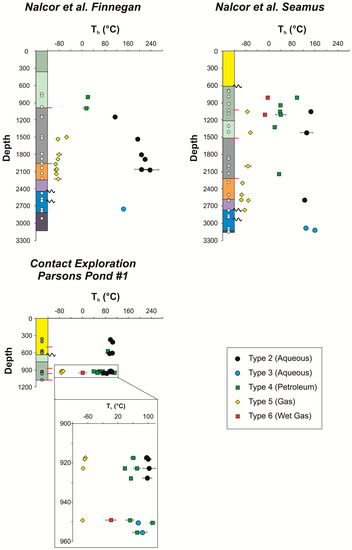
Figure 6.
Homogenization temperatures of all inclusion types in Nalcor et al. Finnegan, Nalcor et al. Seamus and Parsons Pond #1 exploration wells plotted against depth. Symbols represent mean Th values; error bars represent standard deviation.
4.1.4. Type 4 Inclusions
Type 4 inclusions are petroleum-bearing fluid inclusions found in calcite and quartz vein material from 15 samples (Table 3). They range in size from <2 to >50 μm, and include both two-phase (L + V petroleum) and monophase liquid inclusions with a vapour bubble nucleating in some Type 4 inclusions upon slight cooling. The liquid phase in Type 4 inclusions is typically clear or light brown in transmitted ordinary light and, with light blue to green fluorescence colours under UV light (Figure 4d,e), indicating a range of petroleum compositions [41]. Fluid inclusion homogenization temperatures range from between 2.9 and 111.3 °C (Figure 6). However, homogenization temperatures within individual FIA vary by <10 °C, and the wide range of homogenization temperatures likely reflects compositional variations rather than variations in true trapping temperatures).
In sample CE922.7 two generations of calcite veining were observed, with Type 4 inclusions in both vein generations (Figure 4f,g). Type 4 inclusions in early and late calcite have different homogenization temperatures (Table 1) and fluorescent colours consistent with multiple petroleum charge events.
4.1.5. Type 6 Inclusions
Type 6 inclusions, only observed in three samples from the southern wells (CE949.2, S810 and S1105; Table 3), are classified as “wet gas”. These inclusions have petrographic and microthermometric characteristics that are intermediate between Type 4 and Type 5 inclusions. They are monophase at room temperature, with a very weak blue fluorescence. Upon freezing they separate into a liquid and vapour phase, and show a wide range of homogenization temperatures (−19.8 to 11.4 °C).
4.2. Ultraviolet Fluorescence Microspectroscopy
Based on detailed petrography and fluid inclusion microthermometry, samples with Type 4 inclusions were selected for additional ultraviolet fluorescence microspectroscopy to ascertain additional hydrocarbon properties. A total of 119 Type 4 inclusions and 4 Type 6 inclusions from 16 samples were analysed; nine from the Contact Exploration Inc. Parsons Pond #1 well, five from the Nalcor et al. Seamus well, , and two from the Nalcor et al. Finnegan well. In some samples, the Type 4 inclusions contained in the same FIA have a wide range of microspectrographic values, namely, variations in λmax, QR/G and QG/B. This may reflect pore-scale water washing or in situ biodegradation of the oils after trapping. Care was taken to avoid Type 4 inclusions containing solid bitumen phases or with a range of fluorescence colours in the same FIA. In these samples the petroleum composition may have been modified by other post entrapment processes e.g., gas deasphalting [10]. Based on λmax, QR/G, QG/B and their spectral shape, the Type 4 inclusions have been separated into three main populations (Figure 7 and Figure 8 and Table 4).
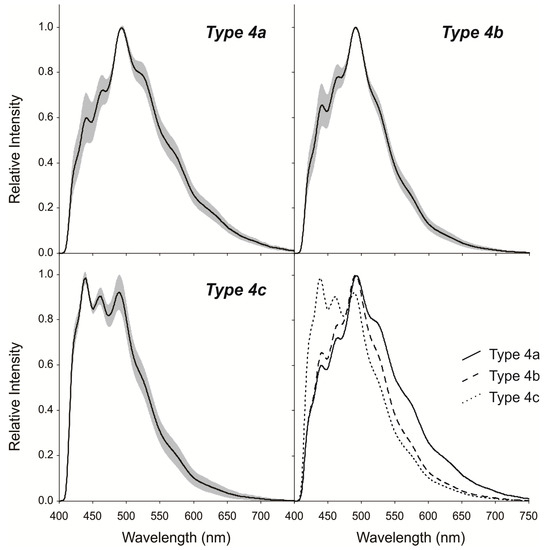
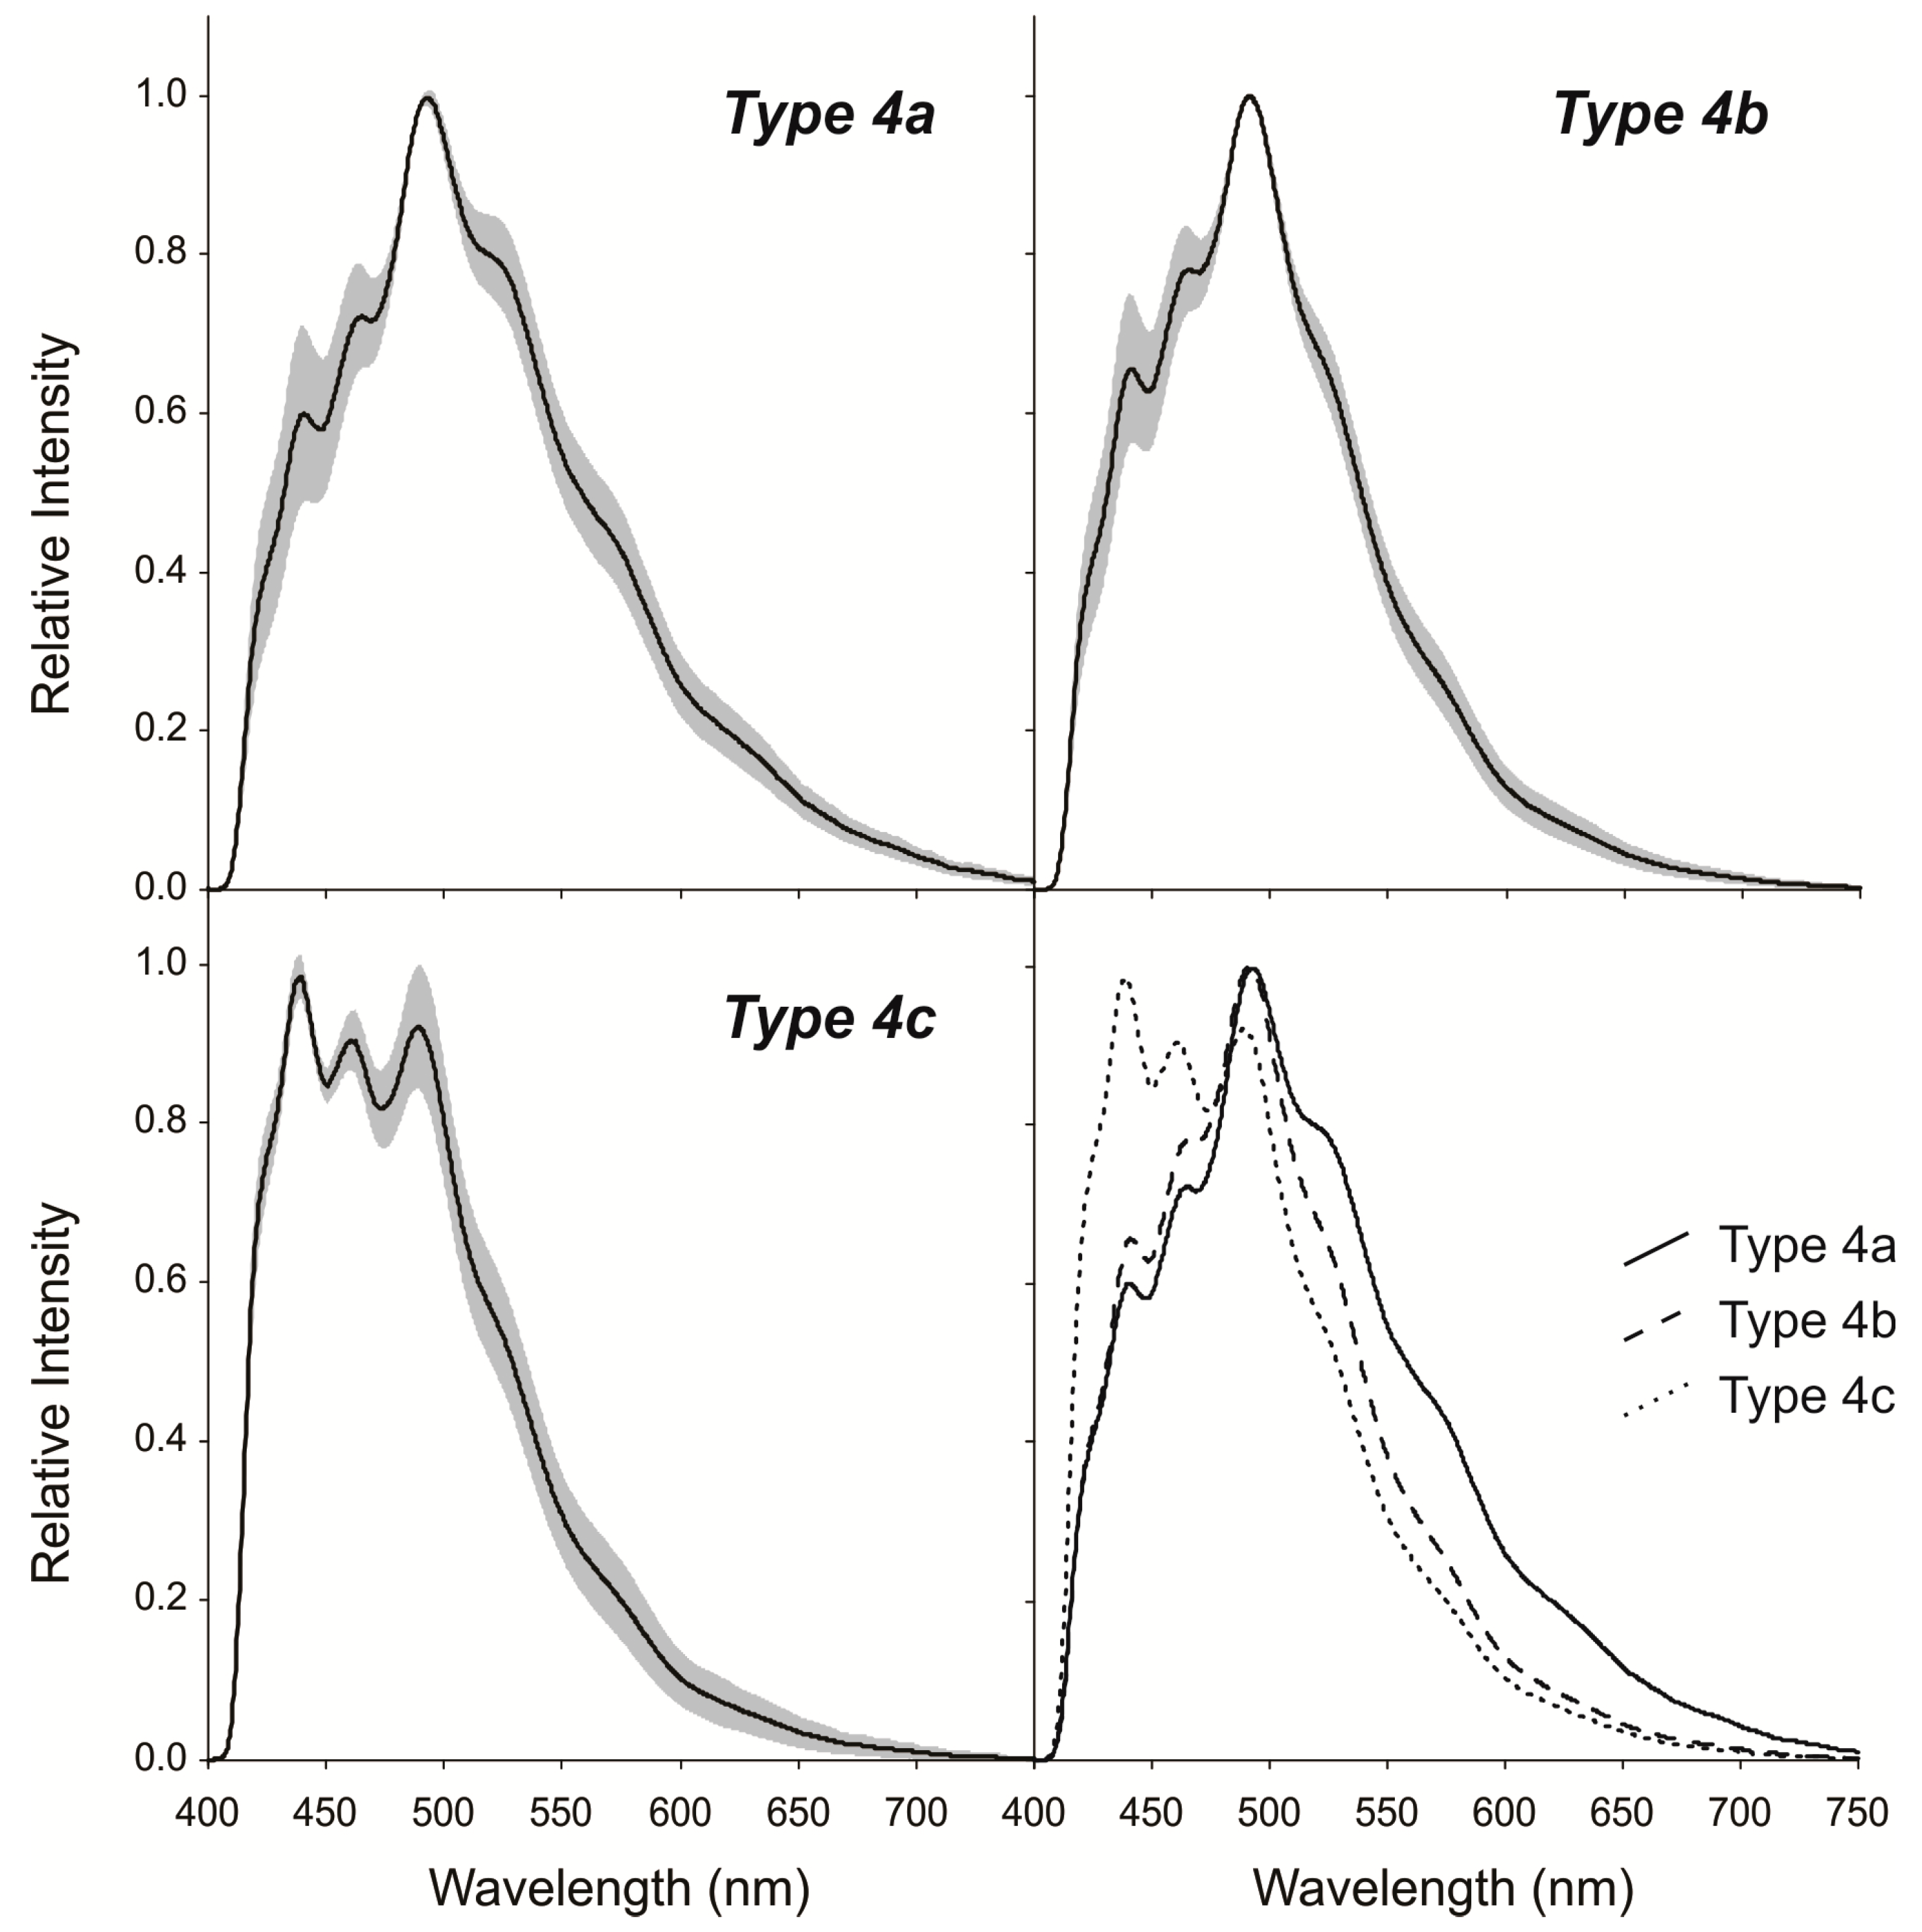
Figure 7.
Ultraviolet fluorescence spectra for Type 4a, 4b and 4c inclusions. Solid black line represents an average spectrum, grey shaded area represents standard deviation. Bottom right diagram displays averages for all three inclusions types, showing progressive shift of intensity to lower wavelengths from Type 4a to Type 4c inclusions.
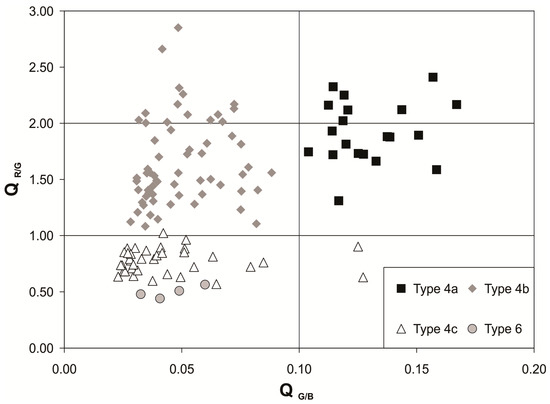
Figure 8.
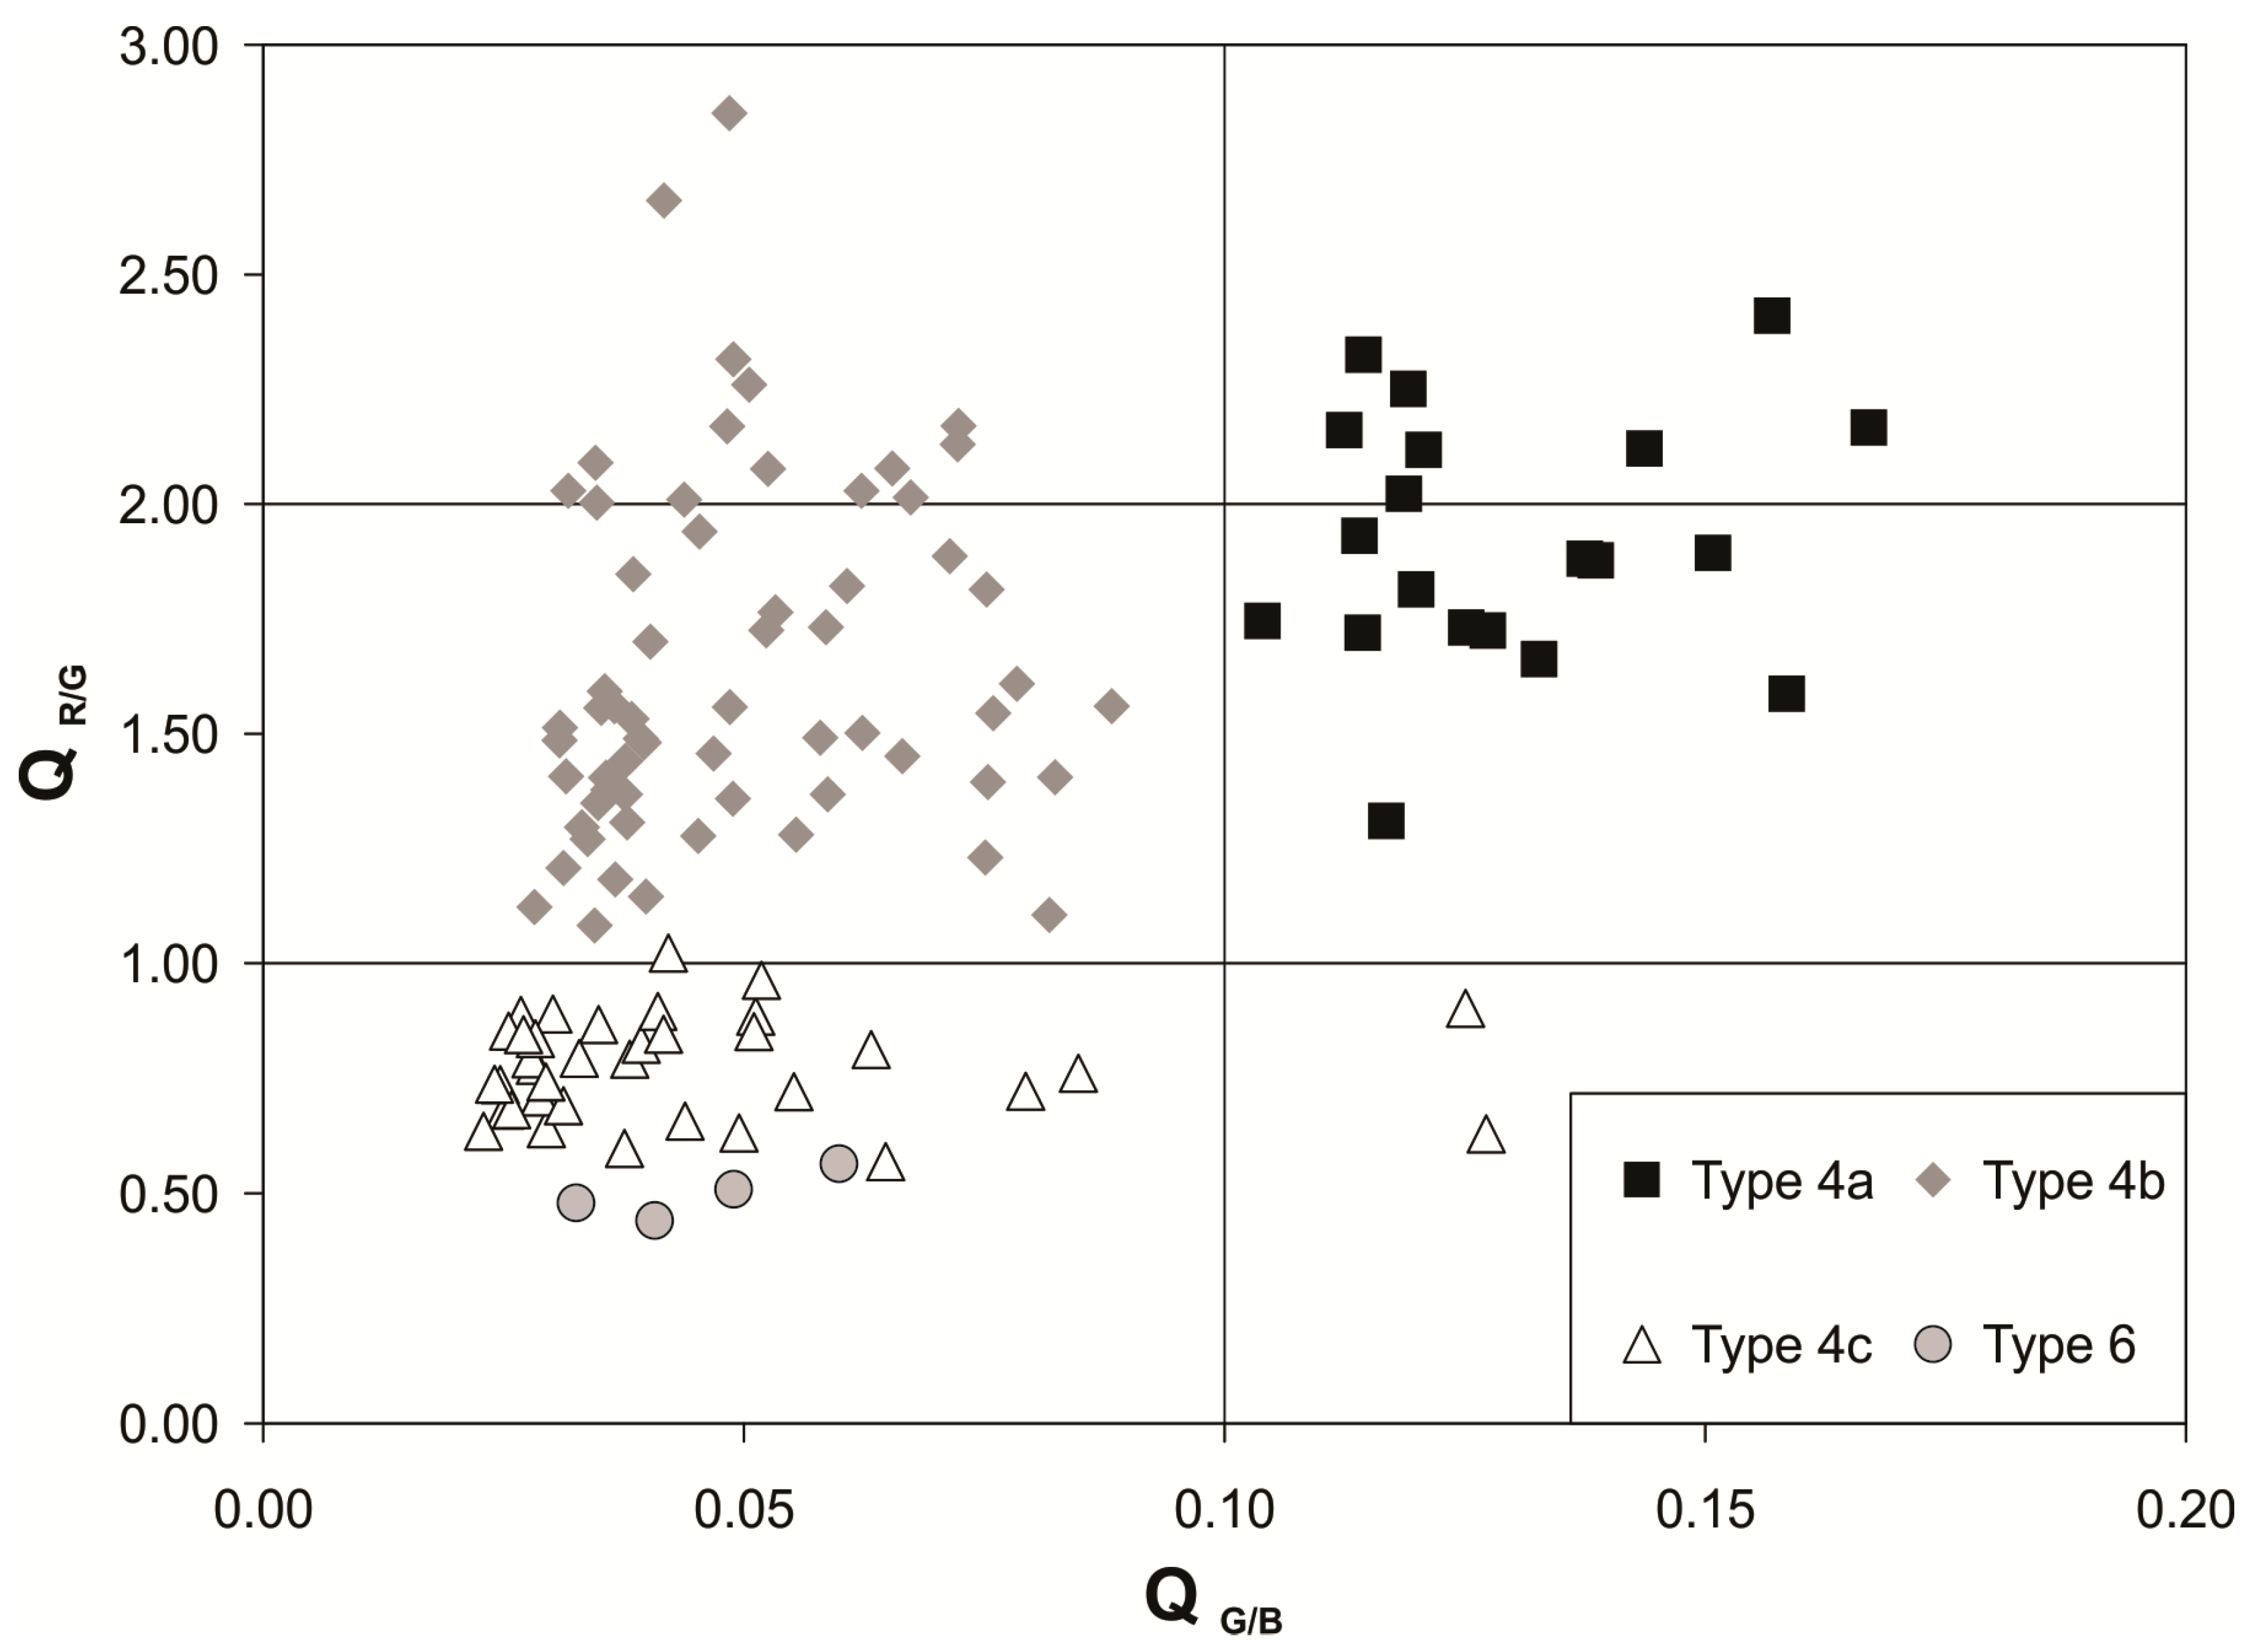
Bivariate plot of QG/B vs. QR/G for Type 4a, 4b and 4c inclusions.
Table 4.
Fluorescence data (λmax, Q650/500 and Q510/430) and calculated API gravity from Type 4 and Type 6 inclusions. Refer to Table 1 for sample depths and formations.
Type 4a: These inclusions have a green-blue fluorescence under UV light, and were recorded in five samples (Table 4). They are characterized by a pronounced peak (λmax) at 490–495 nm (Figure 7) and when plotted on a bivariate plot of QR/G vs. QG/B (Figure 8) these inclusions have relatively high QR/G (>0.10) and QG/B (>1.5).
Type 4b: Type 4b inclusions were recorded in nine samples (CE922.7, CE949.2, CE950.4, CE955.5, CE1054.2, F990, S1105, S1320 and S2140). They have a blue fluorescence under UV light and λmax of 490 to 495 nm and relatively high QG/B values (>1). However, Type 4b inclusions have a sharp drop in intensity above 500nm (Figure 7) which corresponds to QR/G values of <0.10 (Figure 8).
Type 4c: Type 4c inclusions have a light blue fluorescence and were recorded in samples CE917.4, CE922.7, CE927.7, CE949.2, and S940. Their spectra is characterised by maximum intensity from 430–435 nm or relatively equal intensity peaks at approx. 435 nm and 490 nm (Figure 7). On a bivariate plot of QR/G vs. QG/B Type 4c inclusions have QG/B values of <1 (Figure 8).
In addition, a cluster of Type 6 inclusions were analysed in sample CE949.2. These inclusions have a λmax at ~437 nm, with QG/B of 0.50 ± 0.05 (Table 4).
Previous studies have shown that the API gravity of petroleum fluids can be related to their fluorescence spectra [12,44,45,46]. Reports by Stasiuk and Snowden [44] and Gillespie et al. [46] correlated the intensity of fluorescence at 650 and 500 nm (QR/G) to known API values, and the equation of Gillespie et al. [46] was used here to calculate the API of petroleum fluids in Type 4a and Type 4b inclusions. However, Bourdet et al. [12] showed that these equations were not suitable for very light oils or condensates, as the intensity of fluorescence at 650 nm is weak. Therefore the API of petroleum fluids in Type 4c and Type 6 inclusions was calculated using the equation of Bourdet et al. [12], based on correlations between the intensity of fluorescence at 510 and 430 nm (QG/B) to API. The results of these calculations are shown in Table 4, and record a progressive increase in API from Type 4a inclusion (~35 to 39), Type 4b inclusions (~39 to 42), Type 4c inclusions (~44 to 52) to Type 6 inclusions (~52 to 55). Although these calculations may underestimate the API gravity of the live oils contained in inclusions, they can give an approximation of API gravity and relative maturity of multiple petroleum generations.
5. Discussion
5.1. Aqueous Fluid Flow and Diagenetic History
Aqueous fluid inclusions provide an insight into the diagenetic and post-diagenetic fluid history in both allochthonous and autochthonous strata at Parsons Pond. Type 1 fluid inclusions in authigenic cements in both Lower Head Formation (allochthonous) and Goose Tickle Formation (autochthonous) sandstones are monophase at room temperature, indicating that cementation occurred at low temperatures [5], early in their diagenetic history. This is consistent with petrographic and stable isotope analysis of calcite cements in the Lower Head sandstones [47] and has important implications for the potential for hydrocarbon migration through these sandstones.
Type 2 inclusions, hosted by calcite and quartz vein material, provide a record of the temperature and nature of the fluids present during vein formation and any coeval hydrocarbon migration. These inclusions indicate low to moderate temperature fluids, with NaCl (±KCl) as the dominant salt. In addition, Type 2 inclusions in samples from the southern wells (Parsons Pond #1 and Nalcor et al. Seamus) have higher salinities than Type 2 inclusions in samples from Nalcor et al. Finnegan (Figure 5). Type 2 fluid inclusions likely represent the migration of meteoric or modified meteoric fluids that migrated through the sediments during deformation and faulting. In general, the homogenization temperatures recorded for Type 2 inclusions increases with depth (Figure 6), which is consistent with the migration of deep seated fluids that cooled during their assent, after the emplacement of the allochthonous thrust stacks.
Type 3 inclusions in dolomite and calcite from the St George and Port au Port group carbonates represent the trapping of high salinity CaCl2 bearing brines during hydrothermal dolomitization. Similar basinal brines have also been recorded from hydrothermal dolomites on the Port au Port and Port au Choix peninsulas [48,49].
5.2. Hydrocarbon Migration at Parsons Pond
Fluid inclusion analysis of core and cuttings samples from Parsons Pond provides strong evidence for hydrocarbon (petroleum and gas) migration in all three wells. All petroleum bearing fluid inclusions (Type 4), wet gas inclusions (Type 6), and the majority of gas inclusions (Type 5) are hosted in quartz and calcite vein material, and with the exception of sample S2775, no petroleum or gas inclusions have been recorded in any diagenetic sandstone cements. In addition, gas-bearing inclusions were only observed in one dolomite sample (F2470) from any of the targeted autochthonous carbonate reservoir rocks in Nalcor et al. Finnegan and Seamus wells. This suggests that any hydrocarbon migration at Parsons Pond was dominantly through fracture controlled allochthon rocks and no hydrocarbons were present during lithification of the sandstones of the Lower Head Formation. The fracture controlled migration of multiple hydrocarbon fluids is particularly evident in sample CE922.7, where two generations of calcite veining have been recognised (Figure 4f,g), with low temperature migration of relatively immature hydrocarbon in early calcite veinlets followed by the migration of more mature hydrocarbons at higher temperatures in later calcite veins.
Hydrocarbon-bearing fluid inclusions (Types 4–6) also show consistent distributions with depth (Figure 6). Type 4 inclusions are generally confined to intermediate depths; from 569.7 to 1054 m in Contact Exploration Inc. Parsons Pond #1, 800 to 990 m in Nalcor et al. Finnegan, and 810 to 1320 m (plus a single sample at 2140 m) in Nalcor et al. Seamus. Although only gas flow was encountered during drilling, the presence of abundant petroleum-bearing fluid inclusions in calcite veins and the historical production of oil from shallow wells in the Parson’s Pond area indicate that these shallow fractured reservoirs were charged with petroleum during their post-diagenetic history. Calcite and quartz vein material from deeper depths show abundant evidence for gas migration, but only rare evidence for petroleum migration. This may be related to increased temperatures with depth, and suggests that deeper levels are gas-prone with the transition from the oil to the gas window occurring at approximately 1000–1500 m. The timing of this hydrocarbon migration is unknown, but the petrographic evidence and wide range of hydrocarbon compositions, from ~33 API petroleum fluids (Type 4a inclusions) to pure CH4 gas (Type 5 inclusions, [50]), are consistent with a complicated charge history.
Previous studies have shown that the mudstones of the Green Point Formation (Cow Head Group) are the most likely source for the petroleum present in the Parsons Pond area [32], while other potential source rocks include mudstones of the Table Head and Goose Tickle groups in the underlying autochthonous strata. These mudstones are distributed throughout the allochthonous sequence and it is likely that hydrocarbons were generated at multiple times during progressive burial and heating. In addition, evidence of increasing temperature with depth (as recorded by aqueous fluid inclusions) and the presence of hydrocarbon-bearing fluid inclusions in both the allochthonous and autochthonous strata indicate that hydrocarbon generation and migration at least in part postdates thrusting of the allochthonous sediments over the autochthonous platform during the Taconic orogeny.
Fluid inclusion evidence indicates that hydrocarbons were not present in any significant quantity during dolomitization of the St. George Group carbonates, which are thought to have significant reservoir potential [2]. This does not, however, mean that these carbonate reservoirs were never charged with hydrocarbons. Analysis of sucrosic and hydrothermal dolomite from the major exposed reservoir at Port aux Choix, ~70 km to the north of Nalcor et al. Finnegan, found no evidence of hydrocarbon charge during dolomitization, and filling of the reservoir postdates porosity enhancement during dolomitization [48,49]. Current data indicate hydrocarbons were generated from overlying mudstones, but without evidence of the juxtaposition of these mudstones with potential carbonate reservoirs it remains unresolved if these reservoirs were ever filled.
6. Conclusions
This study has documented a complex hydrocarbon charge history at Parsons Pond, with hydrocarbons generated during progressive burial and heating. Early cementation of sandstones at low temperatures (<50 °C) is indicated by the presence of monophase aqueous fluid inclusions in diagenetic cements. Hydrocarbon-bearing fluid inclusions are common in calcite and quartz vein material, which suggests that petroleum and gas migration is fracture controlled, and no hydrocarbons were observed to have been present during the cementation of the essentially tight sandstones of the Lower Head Formation and Cow Head Group. This supports previous analysis by Contact Exploration, who conducted an assessment of five fracture zones in Contact Exploration Inc. Parsons Pond #1 which suggests that the Lower Head Formation sandstones formed a fractured reservoir [35]. The distribution of petroleum and petroleum and gas-bearing inclusions with depth suggests that deeper levels, and namely the autochthonous strata, are gas-prone, with liquid petroleum confined to thrust sheets of the relatively shallow, allochthonous strata. Although only gas flow was encountered during the drilling of exploration wells at Parson’s Pond, the presence of abundant petroleum bearing fluid inclusions in calcite veins indicates that the fractured reservoirs may have been charged with hydrocarbons. Therefore, the limited production from shallow wells in the Parsons Pond area likely represents the tapping of shallow fractured reservoirs, which would account for the lack of sustained production over time and small widespread oil seeps.
Acknowledgments
This project was funded the Petroleum Exploration Enhancement Program (PEEP). Helen Gillespie is acknowledged for assistance in ultraviolet fluorescence microspectroscopy analysis. Thanks also go to Nalcor Energy for discussions on background geology and providing cuttings samples from the Nalcor et al. Finnegan and Nalcor et al. Seamus exploration wells.
Author Contributions
James Conliffe performed all analytical work. James Conliffe, Elliot Burden and Derek Wilton oversaw the entire project, and wrote the manuscript.
Conflicts of Interest
The authors declare no conflict of interest.
References
- Newfoundland Department of Energy Report: Hydrocarbon Potential of the Western Newfoundland Onshore Area; Government of Newfoundland and Labrador: St. John’s, NL, Canada, 1989.
- Cooper, M.; Weissenberger, J.; Knight, I.; Hostad, D.; Gillespie, D.; Williams, H.; Burden, E.; Porter-Chaudhry, J.; Rae, D.; Clark, E. Basin Evolution in Western Newfoundland: New Insights from Hydrocarbon Exploration. AAPG Bull. 2001, 85, 393–418. [Google Scholar]
- Zhang, S.; Barnes, C.R. Arenigian (Early Ordovician) sea level history and the response of shelf and slope conodont communities, western Newfoundland. Can. J. Earth Sci. 2004, 41, 843–865. [Google Scholar] [CrossRef]
- Cawood, P.A.; Williams, H.; Grenier, R. Geology of Portland Creek area (12I/4), Western Newfoundland. Scale: 1:50 000; Open File Report 1435; Geological Survey of Canada: Ottawa, ON, Canada, 1987.
- Goldstein, R.H.; Reynolds, T.J. Systematics of Fluid Inclusions in Diagenetic Minerals; Society of Economic Paleontologists and Mineralogists Short Course: Tulsa, OK, USA, 1994. [Google Scholar]
- Parnell, J.; Middleton, D.; Honghan, C.; Hall, D. The use of integrated fluid inclusion studies in constraining oil charge history and reservoir compartmentation: Examples from the Jeanne d’Arc Basin, offshore Newfoundland. Mar. Petrol. Geol. 2001, 18, 535–549. [Google Scholar] [CrossRef]
- Blanchet, A.; Pagel, M.; Walgenwitz, F.; Lopez, A. Microspectrofluorimetric and microthermometric evidence for variability in hydrocarbon fluid inclusions in quartz overgrowths: Implications for inclusion trapping in the Alwyn North Field, North Sea. Org. Geochem. 2003, 34, 1477–1490. [Google Scholar] [CrossRef]
- George, S.C.; Lisk, M.; Eadington, P.J. Fluid inclusion evidence for an early, marine-sourced oil charge prior to gas-condensate migration, Bayue1, Timor Sea, Australia. Mar. Petrol. Geol. 2004, 21, 1107–1128. [Google Scholar] [CrossRef]
- Baron, M.; Parnell, J.; Mark, D.; Carr, A.; Przyjalgowski, M.; Feely, M. Evolution of hydrocarbon migration style in a fractured reservoir deduced from fluid inclusion data, Clair Field, west of Shetland, UK. Mar. Petrol. Geol. 2008, 25, 153–172. [Google Scholar] [CrossRef]
- Conliffe, J.; Blamey, N.F.; Feely, M.; Parnell, J.; Ryder, A.G. Hydrocarbon migration in the Porcupine Basin, offshore Ireland: evidence from fluid inclusion studies. Petrol. Geosci. 2010, 16, 67–76. [Google Scholar] [CrossRef]
- Bourdet, J.; Eadington, P.J.; Volk, H.; George, S.C.; Pironon, J.; Kempton, R.H. Chemical changes of fluid inclusion oil trapped during the evolution of an oil reservoir: Jabiru-1A case study (Timor Sea, Australia). Mar. Petrol. Geol. 2012, 36, 118–139. [Google Scholar] [CrossRef]
- Bourdet, J.; Burruss, R.C.; Chou, I.-M.; Kempton, R.; Liu, K.; Hung, N.V. Evidence for a palaeo-oil column and alteration of residual oil in a gas-condensate field: Integrated oil inclusion and experimental results. Geochim. Cosmochim. Acta 2014, 142, 362–385. [Google Scholar] [CrossRef]
- Williams, H. Appalachian Orogen in Canada. Can. J. Earth Sci. 1979, 16, 792–807. [Google Scholar] [CrossRef]
- James, N.P.; Barnes, C.R.; Stevens, R.K.; Knight, I.A. Lower Paleozoic continental margin carbonate platform, northern Canadian Appalachians. In Controls on Carbonate Platforms and Basin Development; Crevello, T., Sarg, R., Read, I.F., Wilson, J.L., Eds.; Society of Economic Paleontologists and Mineralogists Special Publication: Tulsa, OK, USA, 1987; Volume 44, pp. 123–146. [Google Scholar]
- Stenzel, S.R.; Knight, I.; James, N.P. Carbonate platform to foreland basin: Revised stratigraphy of the Table Head Group (Middle Ordovician), western Newfoundland. Can. J. Earth Sci. 1990, 27, 14–26. [Google Scholar] [CrossRef]
- Waldron, J.W.F.; van Staal, C.R. Taconian orogeny and the accretion of the Dashwoods block: a peri-Laurentian microcontinent in the Iapetus Ocean. Geology 2001, 29, 811–814. [Google Scholar] [CrossRef]
- Van Staal, C.R. North America: Northern Appalachians. In Encyclopaedia of Geology; Selley, A.C., Cocks, L.R.M., Plimer, I.R., Eds.; Elsevier: Oxford, UK, 2005; pp. 81–92. [Google Scholar]
- Van Staal, C.R.; Whalen, J.B.; McNicoll, J.; Pehrsson, S.; Lissenberg, C.J.; Zagorevski, A.; van Breemen, O.; Jenner, G.A. The Notre Dame arc and the Taconic orogeny in Newfoundland. In 4-D Framework of Continental Crust: Geological Society of America Memoir 200; Hatcher, R.D., Carlson, M.P., McBride, J.H., Martínez Catalán, J.R., Eds.; The Geological Society of America: Boulder, CO, USA, 2007; pp. 511–552. [Google Scholar]
- Stockmal, G.S.; Waldron, J.W.F.; Quinlan, G.M. Flexural modeling of Paleozoic foreland basin subsidence, offshore western Newfoundland: evidence for substantial post-Taconian thrust transport. J. Geol. 1995, 103, 653–671. [Google Scholar] [CrossRef]
- Knight, I.; James, N.P. Stratigraphy of the Lower Ordovician St. George Group, western Newfoundland: the interaction between eustasy and tectonics. Can. J. Earth Sci. 1987, 24, 1927–1951. [Google Scholar] [CrossRef]
- Knight, I.; Azmy, K.; Boyce, W.D.; Lavoie, D. Tremadocian Carbonate Rocks of the Lower St. George Group, Port au Port Peninsula, Western Newfoundland: Lithostratigraphic Setting of Diagenetic, Isotopic and Geochemical Studies. Current Res. Nfld. Labrador Dep. Nat. Resour. 2008. [Google Scholar]
- Burden, E.; Burden, D.; Parsons, G. Finding the Parts: A Searchable Database and Report of Petroleum Geology and Geophysics Literature for Paleozoic Basins of Newfoundland and Labrador. Petroleum Exploration Enhancement Program Final Report; 2014. Available online: http://www.nr.gov.nl.ca/nr/energy/petroleum/onshore/peep.html (accessed on 4 January 2017). [Google Scholar]
- Knight, I.; James, N.P.; Lane, T.E. The Ordovician St. George unconformity, Northern Appalachians; the relationship of plate convergence at the St. Lawrence Promontory to the Sauk/Tippecanoe Sequence boundary. GSA Bull. 1991, 103, 1200–1225. [Google Scholar] [CrossRef]
- James, N.P.; Stevens, R.K. Stratigraphy and correlation of the Cambro-Ordovician Cow Head Group, western Newfoundland. Geol. Surv. Can. Bull. 1986, 366, 143. [Google Scholar]
- Palmer, S.E.; Burden, E.; Waldron, J.W.F. Stratigraphy of the Curling Group (Cambrian), Humber Arm Allochthon, Bay of Islands. Current Res. Nfld. Labrador Dep. Mine. Energy, 2001. [Google Scholar]
- Botsford, J. Stratigraphy and sedimentology of Cambro-Ordovician deep-water sediments, Bay of Islands, western Newfoundland. Ph.D. Thesis, Memorial University of Newfoundland, St. John’s, Newfoundland, NL, Canada, 2001. [Google Scholar]
- Hinchey, A.M.; Knight, I.; Kilfoil, G.; Hicks, L. Geological Overview and Hydrocarbon Potential of Cambrian–Ordovician Strata of the Outer Humber Zone, Western Newfoundland. Current Res. Nfld. Labrador Dep. Nat. Resour. 2015. [Google Scholar]
- Quinn, L. Middle Ordovician foredeep fill in western Newfoundland. In Current Perspectives in the Appalachian—Caledonide Orogeny; Special Paper 41; Hibbard, J.P., van Staal, C.R., Cawood, P.A., Eds.; Geological Association of Canada: St. John’s, NL, Canada, 1995; pp. 43–63. [Google Scholar]
- Stockmal, G.S.; Slingsby, A.; Waldron, J.W.F. Deformation styles at the Appalachian structural front, western Newfoundland: Implications of new industry seismic reflection data. Can. J. Earth Sci. 1998, 35, 1288–1306. [Google Scholar] [CrossRef]
- MacAuley, G. Organic Geochemistry of Some Cambro-Ordovician Outcrop Samples, Western Newfoundland; Open File Report 1503; Geological Survey of Canada: Ottawa, ON, Canada, 1987.
- Weaver, F.; Macko, S.A. Source rocks of Western Newfoundland. Org. Geochem. 1987, 13, 411–421. [Google Scholar] [CrossRef]
- Fowler, M.G.; Hamblin, A.P.; Dawkins, D.; Knight, I. Petroleum geochemistry and hydrocarbon potential of Cambrian and Ordovician rocks of Western Newfoundland. Bull. Can. Petrol. Geol. 1995, 42, 187–213. [Google Scholar]
- Williams, S.H.; Burden, E.T.; Mukhopadhyay, P.K. Thermal maturity and burial history of Paleozoic rocks in western Newfoundland. Can. J. Earth Sci. 1998, 35, 1307–1322. [Google Scholar] [CrossRef]
- Kunkle, D. Fracture System and Hydraulic and Acoustic Properties of Bedrock at Parsons Pond, Western Newfoundland. Unpublished BSc. Thesis, Memorial University of Newfoundland, St. John’s, NL, Canada, 1986. [Google Scholar]
- Brooker, T.; Contact Exploration Inc. Final Well Report Parsons Pond #1. 2004. Available online: http://www.nr.gov.nl.ca/nr/publications/energy/final_well_report.html (accessed on 4 January 2017). [Google Scholar]
- Nalcor Energy—Oil and Gas Inc. Final Well Report for Nalcor Energy et al. Seamus #1 at Permit 03-103, western Newfoundland. 2010. Available online: http://www.nr.gov.nl.ca/nr/publications/energy/final_well_report.html (accessed on 4 January 2017). [Google Scholar]
- Nalcor Energy—Oil and Gas Inc. Final Well Report for Nalcor Energy et al. Finnegan #1 at Permit 03-102, Western Newfoundland. 2010. Available online: http://www.nr.gov.nl.ca/nr/publications/energy/final_well_report.html (accessed on 4 January 2017). [Google Scholar]
- Goldstein, R.H. Petrographic Analysis of Fluid Inclusions; Samson, I., Anderson, A., Marshall, D., Eds.; Mineralogical Association of Canada: Ottawa, ON, Canada, 2003; Volume 32, pp. 9–53. [Google Scholar]
- Bodnar, R.J. Revised equation and table for determining the freezing point depression of H2O-NaCl solutions. Geochim. Cosmochim. Acta 1993, 57, 683–684. [Google Scholar] [CrossRef]
- McLimans, R.K. Application of fluid inclusions to migration of oil and diagenesis in petroleum reservoirs. Appl. Geochem. 1987, 2, 505–604. [Google Scholar] [CrossRef]
- Bodnar, R.J. Petroleum migration in the Miocene Monterey formation, California, USA: Constraints from fluid inclusion studies. Miner. Mag. 1990, 54, 295–304. [Google Scholar] [CrossRef]
- George, S.C.; Ruble, T.E.; Dutkiewicz, A.; Eadington, P.J. Assessing the maturity of oil trapped in fluid inclusions using molecular geochemistry data and visually-determined fluorescence colours. Appl. Geochem. 2001, 16, 451–473. [Google Scholar] [CrossRef]
- Allan, J.R.; Wiggins, W.D. Dolomite Reservoirs: Geochemical Techniques for Evaluating Origin and Distribution; AAPG Continuing Education Course Note Series; Amer Assn of Petroleum Geologists: Tulsa, OK, USA, 1993; Volume 36. [Google Scholar]
- Stasiuk, L.D.; Snowdon, L.R. Fluorescence micro-spectrometry of synthetic and natural hydrocarbon fluid inclusions: crude oil chemistry, density and application to petroleum migration. Appl. Geochem. 1997, 12, 229–241. [Google Scholar] [CrossRef]
- Bourdet, J.; Eadington, P. Fluorescence and Infrared Spectroscopy of Inclusion Oil; Technical Report EP129625; CSIRO: Canberra, Australia, 2012.
- Gillespie, H.; Burden, E.; Osadetz, K. Fluorescence Microscopy as a Proxy to Determine the Thermal Maturation and API Gravity of Naturally Occurring Crude Oils or Oil Inclusions. Petroleum Exploration Enhancement Program Final Report; 2012. Available online: http://www.nr.gov.nl.ca/nr/energy/petroleum/onshore/peep.html (accessed on 4 January 2017). [Google Scholar]
- Blamey, N.; Azmy, K.; Conliffe, J. Geochemistry and diagenetic history of the Ordovician Lower Head Formation Sandstones, Western Newfoundland, Canada. Can. J. Earth Sci. 2016, 53, 1501–1510. [Google Scholar] [CrossRef]
- Conliffe, J.; Azmy, K.; Gleeson, S.A.; Lavoie, D. Fluids associated with hydrothermal dolomitization in St. George Group, western Newfoundland, Canada. Geofluids 2010, 10, 422–437. [Google Scholar] [CrossRef]
- Conliffe, J.; Azmy, K.; Greene, M. Dolomitization of the lower Ordovician Catoche formation: Implications for hydrocarbon exploration in western Newfoundland. Mar. Petrol. Geol. 2012, 30, 161–173. [Google Scholar] [CrossRef]
- Conliffe, J.; Burden, E.; Wilton, D. The Use of Integrated Fluid Inclusion Studies in Constraining the Petroleum Charge History at Parson’s Pond, Western Newfoundland. Petroleum Exploration Enhancement Program Final Report; 2012. Available online: http://www.nr.gov.nl.ca/nr/energy/petroleum/onshore/peep.html (accessed on 4 January 2017). [Google Scholar]
© 2017 by the authors. Licensee MDPI, Basel, Switzerland. This article is an open access article distributed under the terms and conditions of the Creative Commons Attribution (CC BY) license ( http://creativecommons.org/licenses/by/4.0/).