Article

Pressure–Temperature–Fluid Constraints for the Poona Emerald Deposits, Western Australia: Fluid Inclusion and Stable Isotope Studies

1
Department of Earth Sciences, Simon Fraser University, Burnaby, BC V5A 1S6, Canada
2
Western Australian Museum, Locked Bag 49, Welshpool DC, WA 6986, Australia
3
Department of Earth Sciences, Carleton University, Ottawa, ON K1S 5B6, Canada
*
Author to whom correspondence should be addressed.
Minerals 2016, 6(4), 130; https://doi.org/10.3390/min6040130
Submission received: 13 November 2016 / Revised: 26 November 2016 / Accepted: 30 November 2016 / Published: 9 December 2016
(This article belongs to the Special Issue Fluid Inclusions: Study Methods, Applications and Case Histories)

Abstract

:
Emerald from the deposits at Poona shows micrometre-scale chemical, optical, and cathodoluminescence zonation. This zonation, combined with fluid inclusion and isotope studies, indicates early emerald precipitation from a single-phase saline fluid of approximately 12 weight percent NaCl equivalent, over the temperature range of 335–525 °C and pressures ranging from 70 to 400 MPa. The large range in pressure and temperature likely reflects some post entrapment changes and re-equilibration of oxygen isotopes. Secondary emerald-hosted fluid inclusions indicate subsequent emerald precipitation from higher salinity fluids. Likewise, the δ18O-δD of channel fluids extracted from Poona emerald is consistent with multiple origins yielding both igneous and metamorphic signatures. The combined multiple generations of emerald precipitation, different fluid compositions, and the presence of both metamorphic and igneous fluids trapped in emerald, likely indicate a protracted history of emerald precipitation at Poona conforming to both an igneous and a metamorphic origin at various times during regional lower amphibolite to greenschist facies metamorphism over the period ~2710–2660 Ma.

1. Introduction

Emerald is one of the best host minerals for fluid inclusion studies. Fluid inclusions in emerald are mentioned on the first page of the most famous of fluid inclusion manuscripts [1] and reference is made to an even earlier publication on two-phase (liquid–vapour) fluid inclusions in emerald [2]. Emerald crystals from Poona contain elongate two-phase c-axis-parallel fluid inclusions and this paper presents new data on the fluids responsible for emerald precipitation at Poona. Poona is an emerald mining district located approximately 75 km to the northwest of the town of Cue in Western Australia (Figure 1). Other mines in the area have produced primarily tin, lithium, and beryllium. The primary source of beryllium is beryl with lesser chrysoberyl. Emerald was discovered at Poona in 1909 and gem quality emeralds have been produced from the area [3]. Most of the emerald extracted from the Poona district came from the Aga Khan mine, with total production in the area in excess of 23,000 carats [4]. Much of the emerald material extracted from the area was too pale in colour and only a small amount was of value.
Emerald forms in a variety of geological settings [5,6]. The common theme of these settings is an environment rich in beryllium and rich in chromium and/or vanadium, the two dominant chromophores for emerald. Beryllium and the two chromophores are generally not found in the same geological settings. Therefore, specialized geological conditions combining, elevated Be, Cr, and V concentrations with sufficient temperatures, pressures and fluid-rich conditions are required. In general, emerald deposits are broken into three main deposit models. The first and most prevalent requires granitic and preferably pegmatitic intrusions into Cr (±V) rich rocks, such as ultramafic and mafic rocks, or derivative shales. Beryllium-enriched silica-saturated fluids exsolved from granitic rocks interact with intruded country rocks precipitating emerald and beryl (cf. [7]). The second emerald deposit model involves a similar process. However, the fluids are regional metamorphic fluids transported via temperature differentials, gravity flow, or tectonic movement. The fluids are silica-saturated beryllium-rich fluids derived from metamorphism of, or interaction with, granitic and quartzofeldspathic sedimentary rocks. These fluids interact with Cr (±V) enriched rocks forming emerald, with Habachtal in Austria being a classic example [8]. The third deposit model for emerald formation still involves a similar mix of chemistry, but occurs at relatively low temperatures of approximately 350 °C, and relies on reducing fluids [9,10,11]. As is always the case with deposit models, they should be considered end-members, with most deposits potentially formed via a combination of two or three endmembers.
The Poona emerald deposits have been studied by a number of researchers [4,13,14,15,16]. These are challenging deposits to classify as the local geology consists of poly-metamorphosed and deformed rocks with multiple localized granitic intrusions. This study utilizes fluid inclusions, stable isotopes, mineral chemistry, and petrology to determine the geological conditions responsible for the emerald mineralization at Poona. Early studies [4,13] on the Poona emerald genesis concluded that emerald deposits formed during contact metamorphism and pegmatititic hydrothermal processes are related to granite intrusion. A metamorphic origin for the Poona emerald deposits was suggested by [14]. Subsequently a detailed petrographic study [15] postulated that emerald formation is restricted to multiple geological scenarios involving a combined igneous and subsequent metamorphic precipitation.
Early work at Poona included a preliminary petrographic description of fluid inclusion (FI) types and morphologies from Poona [13], but this work was superceded by the more detailed FI microthermometric study [4]. However, that work was based on the older classification system [17] and the data from [4] has been integrated in this study where possible. The early petrographic study [4] identified multiple fluid inclusion types (FITs) including seven primary FITs and two secondary FITs. That study also briefly discussed pseudo-secondary fluid inclusions, and these were classified as part of the primary FITs. Although extensive, study [4] did not take advantage of growth-zoned emerald to uniquely identify primary fluid inclusions and utilize fluid inclusions assemblages (FIAs) as per [18]. FIAs are synchronous assemblages and linking FIAs to growth zones establishes an FIA as primary. This is consistent with the [17] classification, clearly relates fluids to crystal growth, may establish relative timing between different fluid generations, and can establish unambiguous pressure, temperature, and fluid conditions during crystal formation. Post entrapment changes were also identified [4] in all fluid inclusion types including decrepitation and necking-down [17]. Using the more modern FIA approach, “primary” FIs from [4] would not be classified as primary and his photographic and microthermometric evidence is consistent with most of these seven primary FITs classified as secondary based on assemblages, lack of growth zones, and indications of post-entrapment changes. Secondary FIs from [4] are consistent with our determinations, but even these show evidence of post-entrapment changes and cannot be clearly related to emerald formation; and thus provide limited formational information.
Our study builds upon the previous fluid inclusion research [4] and targets specific primary FIs within zoned emerald to establish formational conditions. These zoned emeralds were carefully selected and represent mineralization from the preferred zones of emerald formation at the phlogopite schist and pegmatite interface [3,4]. We include only FIAs and FIs petrographically and microthermometrically deemed to have undergone minimal post-entrapment changes. The intent of this research was to determine if a more detailed fluid inclusion study combined with oxygen isotope thermometry and sourcing studies could discriminate between the existing models to determine a single mode of emerald precipitation or provide further validation of the combined igneous and metamorphic model [15].

2. Geological Setting

The emerald deposits of the Poona region occur in the northern Murchison Domain of the Youanmi Terrane that forms part of the mineral-rich Archean Yilgarn Craton. The northern Murchison Domain contains autochthonous volcano-sedimentary greenstone sequences (2820–2700 Ma) that include intrusive mafic–ultramafic rocks, and extensive suites of granitic rocks (2815–2600 Ma) that accompanied and post-dated greenstone belt volcanism [19]. Generally, the metamorphic grade in this region varies from lower amphibolite facies to lower greenschist and prehnite–pumpellyite facies. The greenstone sequences and some granitic suites have been multiply deformed. This included a ~2675 Ma deformation event and extensive strike-slip shearing during a late ~2660–2630 Ma event that was followed by post-tectonic granite emplacement up until approximately 2600 Ma [19].
Three suites of granitic rocks occur in the region of the Poona emerald deposits. The older Annean Supersuite (2787–2733 Ma) is dominantly comprised of metamorphosed and deformed tonalite–trondhjemite–granodiorite, that is relatively low in SiO2 and K2O, and high in MgO, and probably was derived from a mid to lower crustal source [20]. The Big Bell Suite (2720–2690 Ma), comprised of tonalite to monzogranite, probably was derived from a mid-crustal source [20] and was emplaced syn-tectonically during the D3 regional deformation (2710–2660 Ma). The post-tectonic Bald Rock Supersuite (2640–2605 Ma) includes the Walganna Suite of biotite ± muscovite monzogranite to syenogranite and the Wogala Suite of fluorite-bearing alkali granite. These granites are the most fractionated in the Murchison Domain, being relatively high in SiO2, Y, Cs, Rb and Th, and low in MgO and Sr, and having comparatively large negative Eu anomalies. They probably were derived from a shallow crustal source [20]. The Wogala Suite alkali granites are a possible source for Li, Be, F, Sn, Ta pegmatites that occur across the region [19,21].
Host rocks to the Poona emerald deposits (Figure 1) are predominantly metamorphosed and sheared Youanmi Terrane greenstones comprising mafic–ultramafic phlogopite–tremolite–talc-chlorite schists and amphibolite that contain pegmatite and granodiorite intrusives [4]. Emerald mineralisation at Poona forms a distinct E–W trending zone defined by the dominant foliation within the country rock schists and the strike of pegmatite veins, metadolerite dykes and elongate quartz ridges [4]. The major pegmatites strike 270° with a dip of ~25° S, however pegmatite veins also vary from the E–W trend and crosscut all structures and lithologies, suggesting that some pegmatites post-date deformation [4]. This E–W trending foliation (D2 of [4]) probably formed during the regional D3 deformation from ~2710–2660 Ma [19]. This deformation produced tight E–W trending folds of greenstones in the area south of the Weld Range (NE of Poona) and has been linked to a period of widespread emplacement of granitic rocks in the NE Murchison Domain [19]. A subsequent phase of regional deformation (D4) produced N-NNE-trending folds and strike slip shear zones, foliations and metamorphic mineral elongation lineations within and along the margins of the Mount Magnet-Meekatharra structural corridor [19]. These D4 structures formed over the period ~2660–2630 Ma [19]. The greenstones at Poona were folded to produce a large northerly plunging syncline (which probably is a D4 structure) with a change in the orientation of the greenstone foliation of NE–SW dipping to the W to NW–SE dipping to the E [4].
Some pegmatite and granodiorite intrusives at Poona were pre- or syn-tectonic, as suggested by their conformable orientation within the regional tectonic fabric and boudinaged textures (cf. [4,8]), and this might indicate that they were related to the Big Bell Suite (2724–2690 Ma), comprising foliated tonalite to monzogranite, which is part of the Austin Downs Supersuite.
Three styles of emerald mineralisation have been identified in the Poona area [15].
(a)
Emerald associated with quartz–feldspar pegmatites of the Poona pegmatite field [21]. These pegmatites are poorly zoned to unzoned and contain quartz, albite, microcline, oligoclase, beryl, muscovite and garnet [21]. They are generally enclosed by phlogopite schist and emeralds are most common proximal to pegmatite-schist contacts. The deepest green emeralds occur in the phlogopite schists adjacent to the pegmatites [3]. Lithium-bearing pegmatites also occur in the area and can contain white to light green beryl (not emerald) associated with lepidolite, cassiterite, columbite–tantalite, fluorite, garnet and apatite [21]. The distinction between the emerald–beryl-bearing and Li-bearing pegmatites suggests that there were at least two generations of pegmatite emplacement in the Poona field derived from different source magmas [4].
(b)
Emerald associated with ruby, sapphire, topaz, alexandrite and chrysoberyl occurs in banded quartz–muscovite–fluorite–margarite–beryl greisen veins in phlogopite matrix. Accessory minerals include zircon, monazite, cassiterite, apatite, chlorite and plagioclase. Deep green emerald is rare in this style of mineralisation where beryl is commonly colourless to light green.
(c)
Quartz–margarite–topaz veins and lenses in phlogopite schist (Poona East emerald mine). Emerald occurs hosted by phlogopite schist adjacent to the margins of these veins. Crystals vary from light green to deep green and may be zoned. These quartz–margarite–topaz veins probably were originally beryl, lepidolite and zinnwaldite-bearing pegmatites that contained accessory ferrotantalite–ferrocolumbite.
Generally, the better emerald mineralisation at Poona is associated with phlogopite schists adjacent to syn-tectonic pegmatites and granodiorite intrusives, that were probably emplaced during regional metamorphism over the period ~2710–2660 Ma, and may have been derived from the Big Bell Suite granites [4,19,20]. The Bald Rock Supersuite granites are the most likely source of the post-tectonic Li, Be and Sn-bearing pegmatites at Poona due to their degree of fractionation and shallow crustal source [19,20]. These conclusions about the timing of pegmatite emplacement and emerald mineralisation have been drawn based on the regional geological framework for the Northern Murchison Domain [19,20]. However, local geochronological data are sparse and a detailed geochronological study of the Poona emerald field is required to resolve timing uncertainties but is beyond the scope of this study.

3. Materials and Methods

3.1. Sampling

In this study, we examined crystals of emerald-green beryl from quartz and pegmatite veins hosted in phlogopite schist from three specimens in the Simpson-MDC Collection at the Western Australian Museum (specimen numbers MDC 200, 729, 1811). These specimens contain generally pale to medium green crystals of beryl and dark green emerald in quartz–feldspar pegmatite and adjacent phlogopite schist. Their locations are shown in Figure 1. Sample MDC 200 was derived from the Aga Khan mine, which was historically the largest in the field. Sample MDC 729 came from ML 73 in the SE of the field and MDC 1811 was sampled from Ryans Reward ML 45, now called the Reward Open Cut (Pit A of [4]). The Reward Open Cut comprised phlogopite schist with kaolinised pegmatite pods of formerly green beryl-bearing pegmatite [4]. The pods were interpreted as boudinaged segments of a once continuous pegmatite vein and emeralds were commonly associated with seams of coarse fluorite within the phlogopite schist in the Reward Open Cut.

3.2. Mineral Composition Data

Electron microprobe analyses of beryl were performed at Carleton University using an automated 4 spectrometer Camebax MBX electron probe by the wavelength dispersive X-ray analysis method (WDX). Operating conditions were: 15 KV accelerating potential and a beam current of 20 nano-amperes (nA). Counting times were up to 50 s or 40,000 accumulated counts. X-ray lines were chosen to minimize or eliminate possible elemental interferences. Raw X-ray data were converted to elemental weight % via the Cameca PAP matrix correction program. For the elements considered, the following standards, X-ray lines and crystals were used: synthetic spinel, Al Kα, TAP; Camargo olivine, Mg Kα, TAP; albite, Si Kα, TAP; wollastonite, Ca Kα, PET; MnTi, Ti Kα, PET; YVO4, V Kα, PET; synthetic chromite, Cr Kα, LIF; MnTiO3, Mn Kα, LIF; synthetic fayalite, Fe Kα, LIF: barite, Ba Kα, PET; microcline, K Kα, PET; synthetic cesium doped glass, Cs Lα, PET; scandium metal, Sc Kα, PET; tugtupite, Cl Kα, PET; jadeite, Na Kα, TAP. H2O was measured via a manometer during stable isotope analyses and an average value used to complement the probe analyses. Oxygen was calculated by stoichiometry and Be was calculated by difference.

3.3. Fluid Inclusion Measurements

For this study, 56 fluid inclusions from the emerald at the contact between pegmatite and phlogopite schist were targeted for microthermometric measurements. Initial petrographic work was completed in order to identify different fluid inclusion assemblages in both quartz and emerald. Fluid inclusions measurements were completed with a Linkam THMS-G 600 heating–freezing stage attached to an Olympus BX51 microscope (Linkam Scientific Instruments, Tadworth, UK) equipped with 5, 10, 50 and 100 × long working distance Olympus objectives. The stage is capable of measurements in the range of −190 to 400 °C. Prior to collecting heating and cooling measurements, the stage was calibrated with two synthetic fluid inclusion standards. The first yields phase transitions for pure H2O at 0.0 and 374.1 °C. The second standard comprises H2O–CO2 fluid inclusions and is used to calibrate the stage at −56.6 °C to the melting of solid CO2. The stage was periodically tested against the standards and results were always within ±0.2 °C for the two low temperature phase transitions and within ±1.0 °C of the higher temperature phase transition. To avoid post-entrapment volume changes in the measured fluid inclusions, low temperature measurements were performed prior to the high temperature measurements as per [17]. The temperatures for the first melting, ice melting, clathrate melting, and total homogenisation were recorded.

3.4. Stable Isotope Measurements

Stable isotope studies were performed on emerald and quartz from the samples described above and analyzed at Queen’s University. Emerald and quartz pairs in textural equilibrium were identified in hand specimen and via petrographic study. These individual emerald and quartz pairs were extracted from the hand specimens and polished thin section offcuts, then crushed and sieved. The size fraction between 0.1 and 0.2 mm was hand-picked to obtain mineral separates free of mineral inclusions. The samples were then washed in a 10 wt % HCl solution, cleaned in successive baths of acetone and distilled water and sent for analyses. Extraction, trapping and measurement of channel water, from emerald above 800 °C and subsequent hydrogen isotope analyses were performed using the combined methods of [22,23] via high temperature conversion and direct continuous flow to a Finnigan Delta Plus XP mass spectrometer (Thermo-Electron, Langenselbold, Germany). Structural oxygen isotope compositions of emerald and quartz were determined via laser silicate fluorination using the BrF5 method [24]. Stable isotope measurements were made using a dual inlet Finnigan MAT 252 isotopic ratio mass spectrometer and are reported in units per mil (‰) relative to the standard Vienna standard mean ocean water (VSMOW).

4. Emerald Petrography and Composition

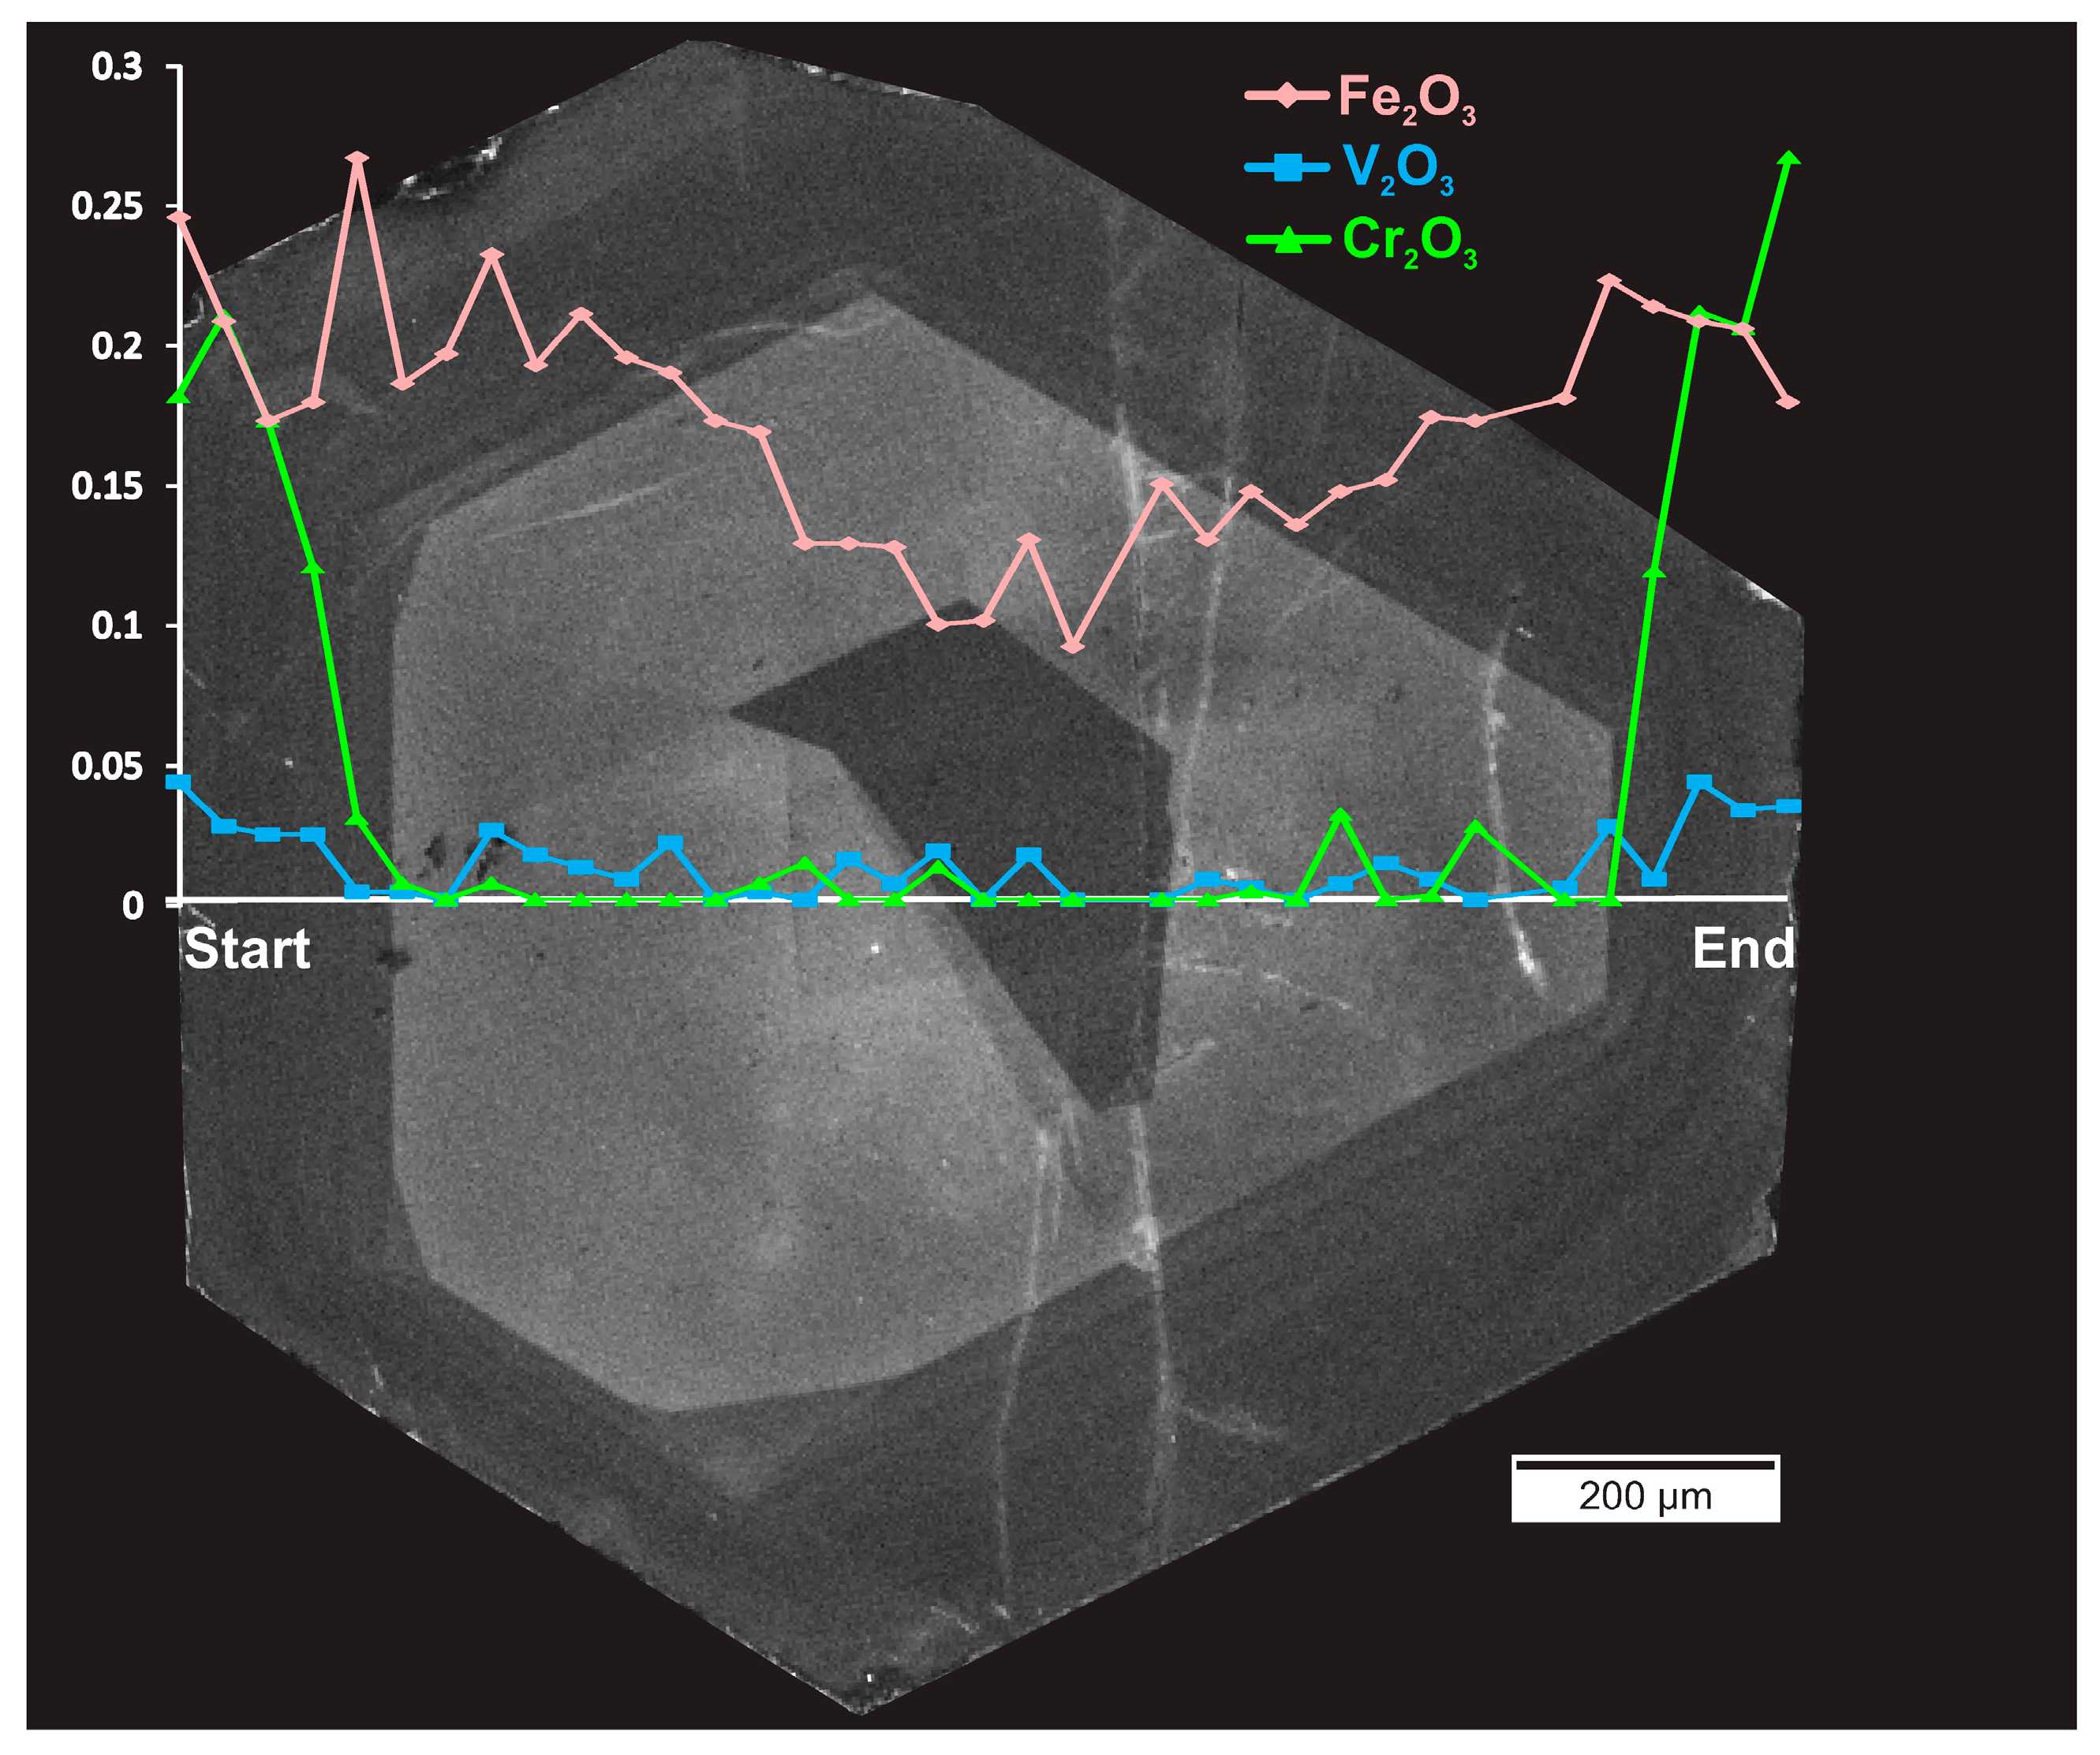
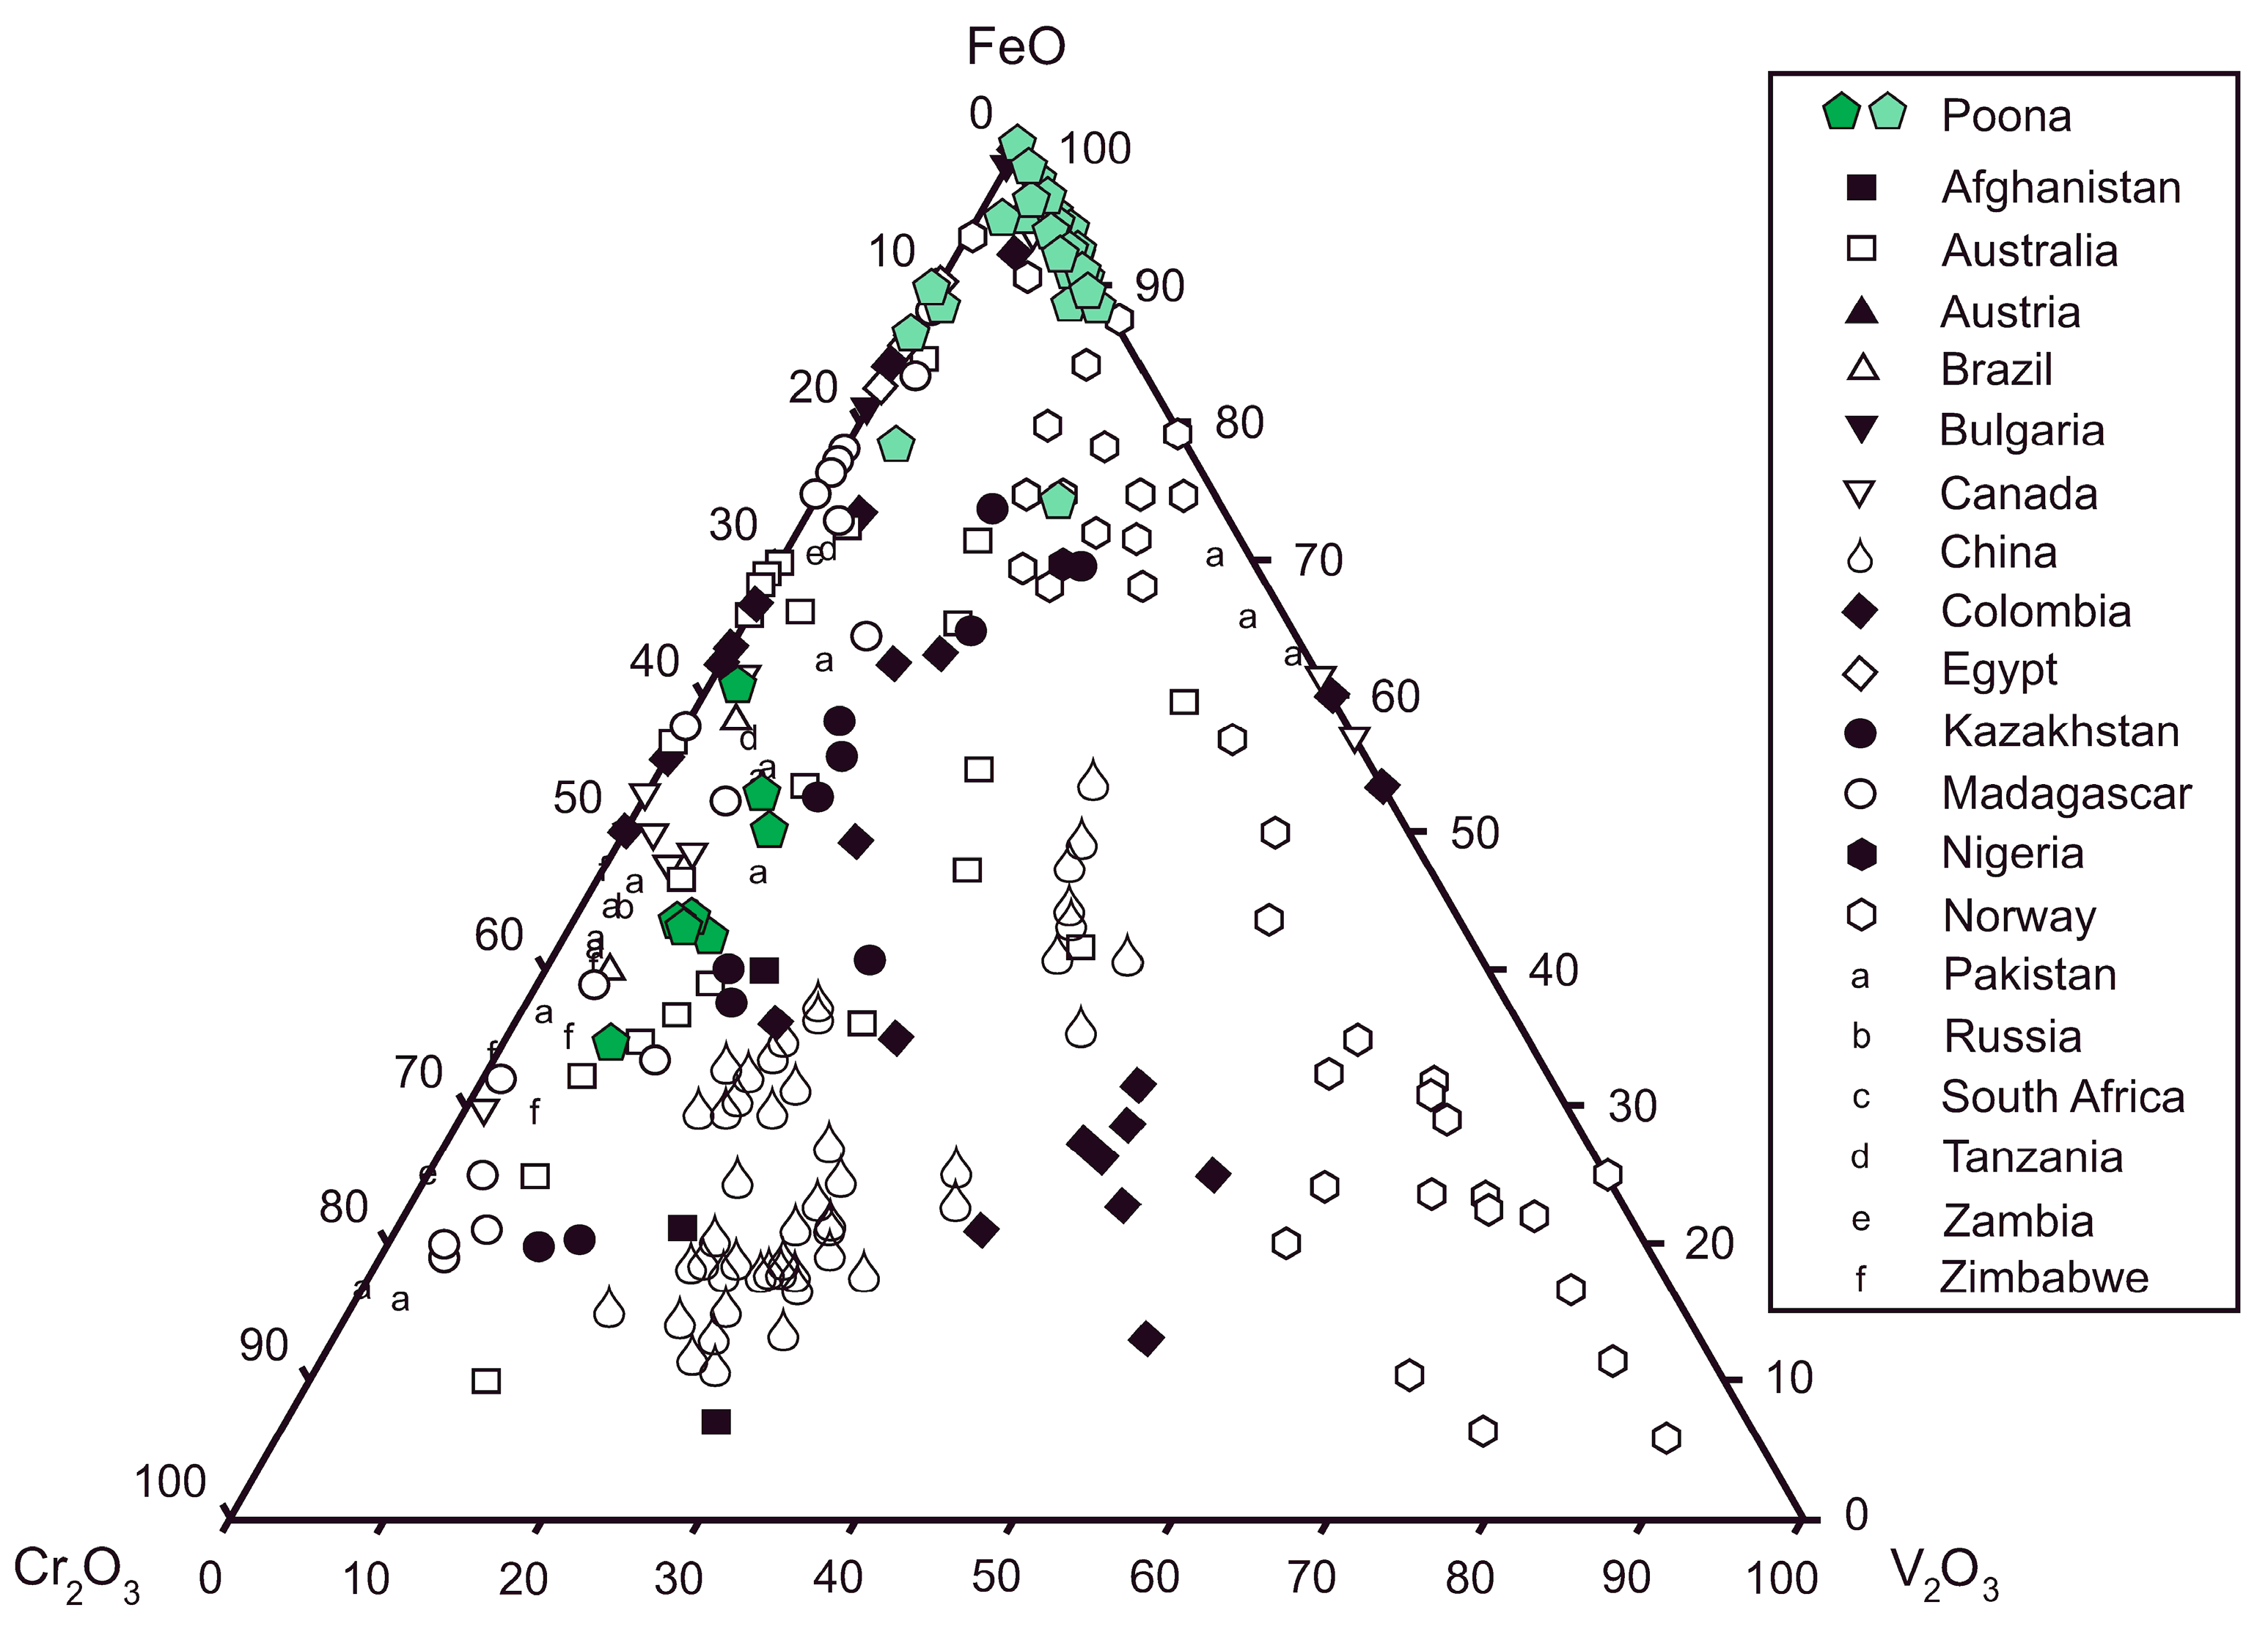
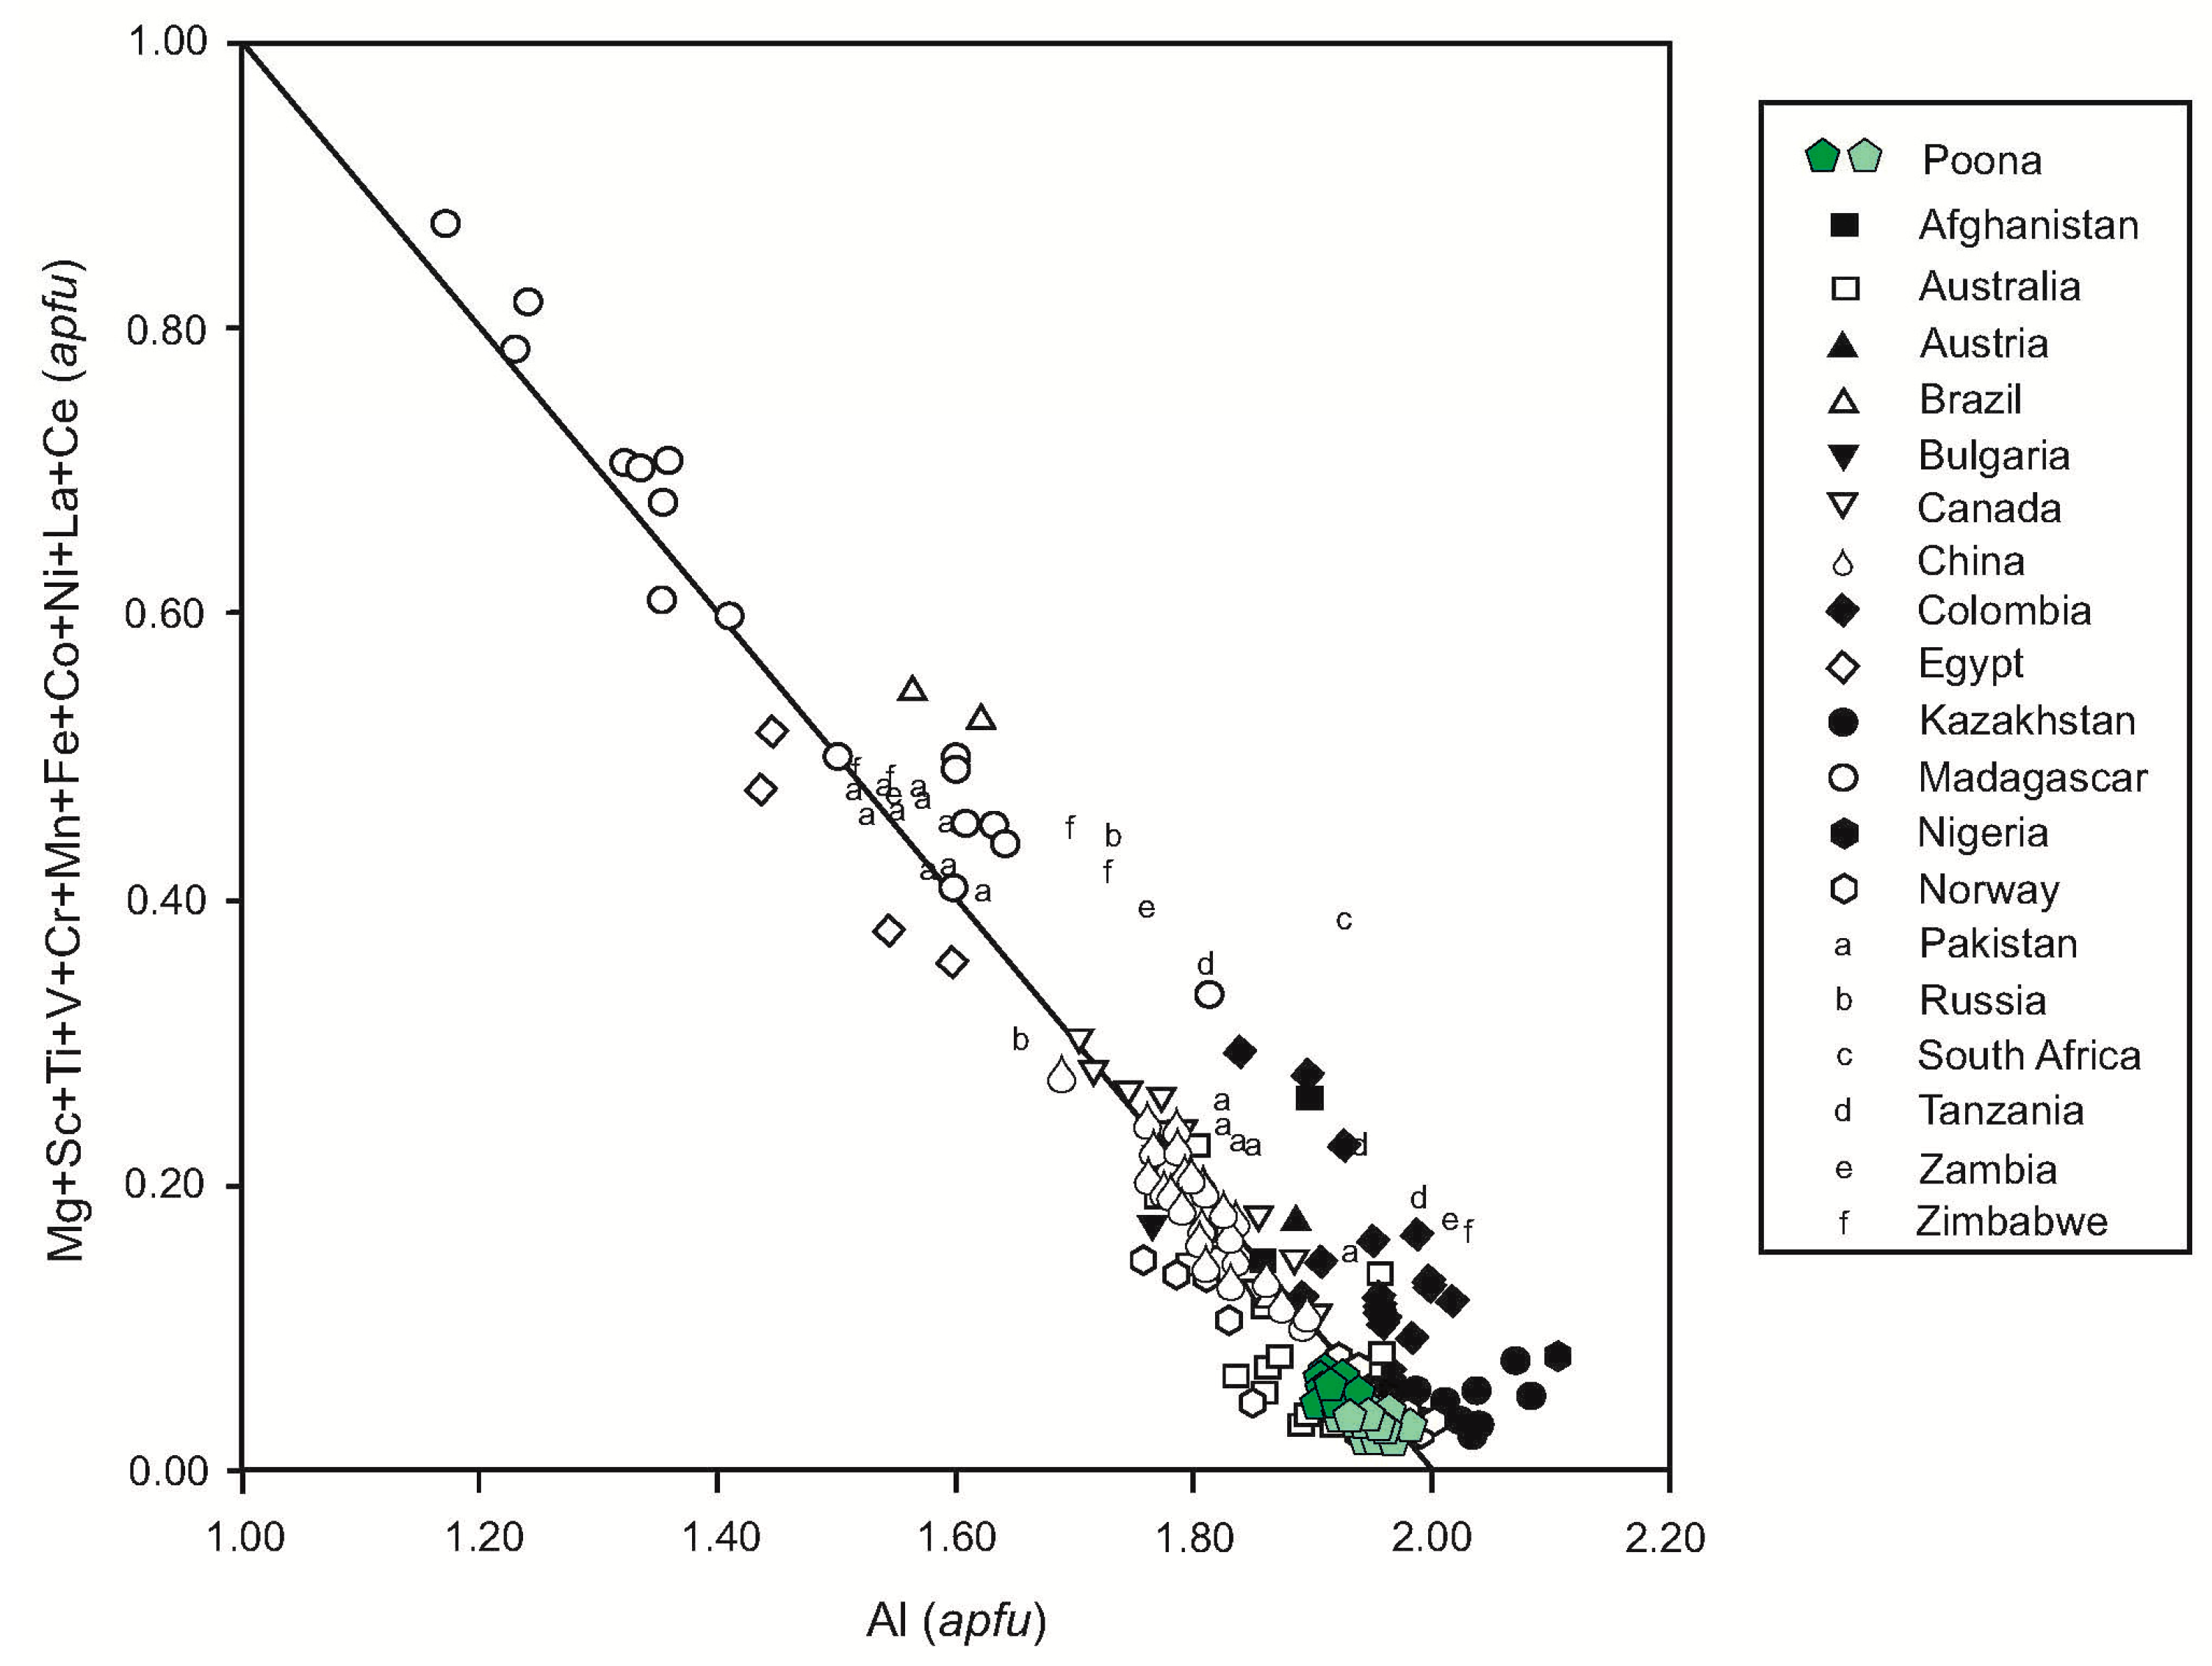
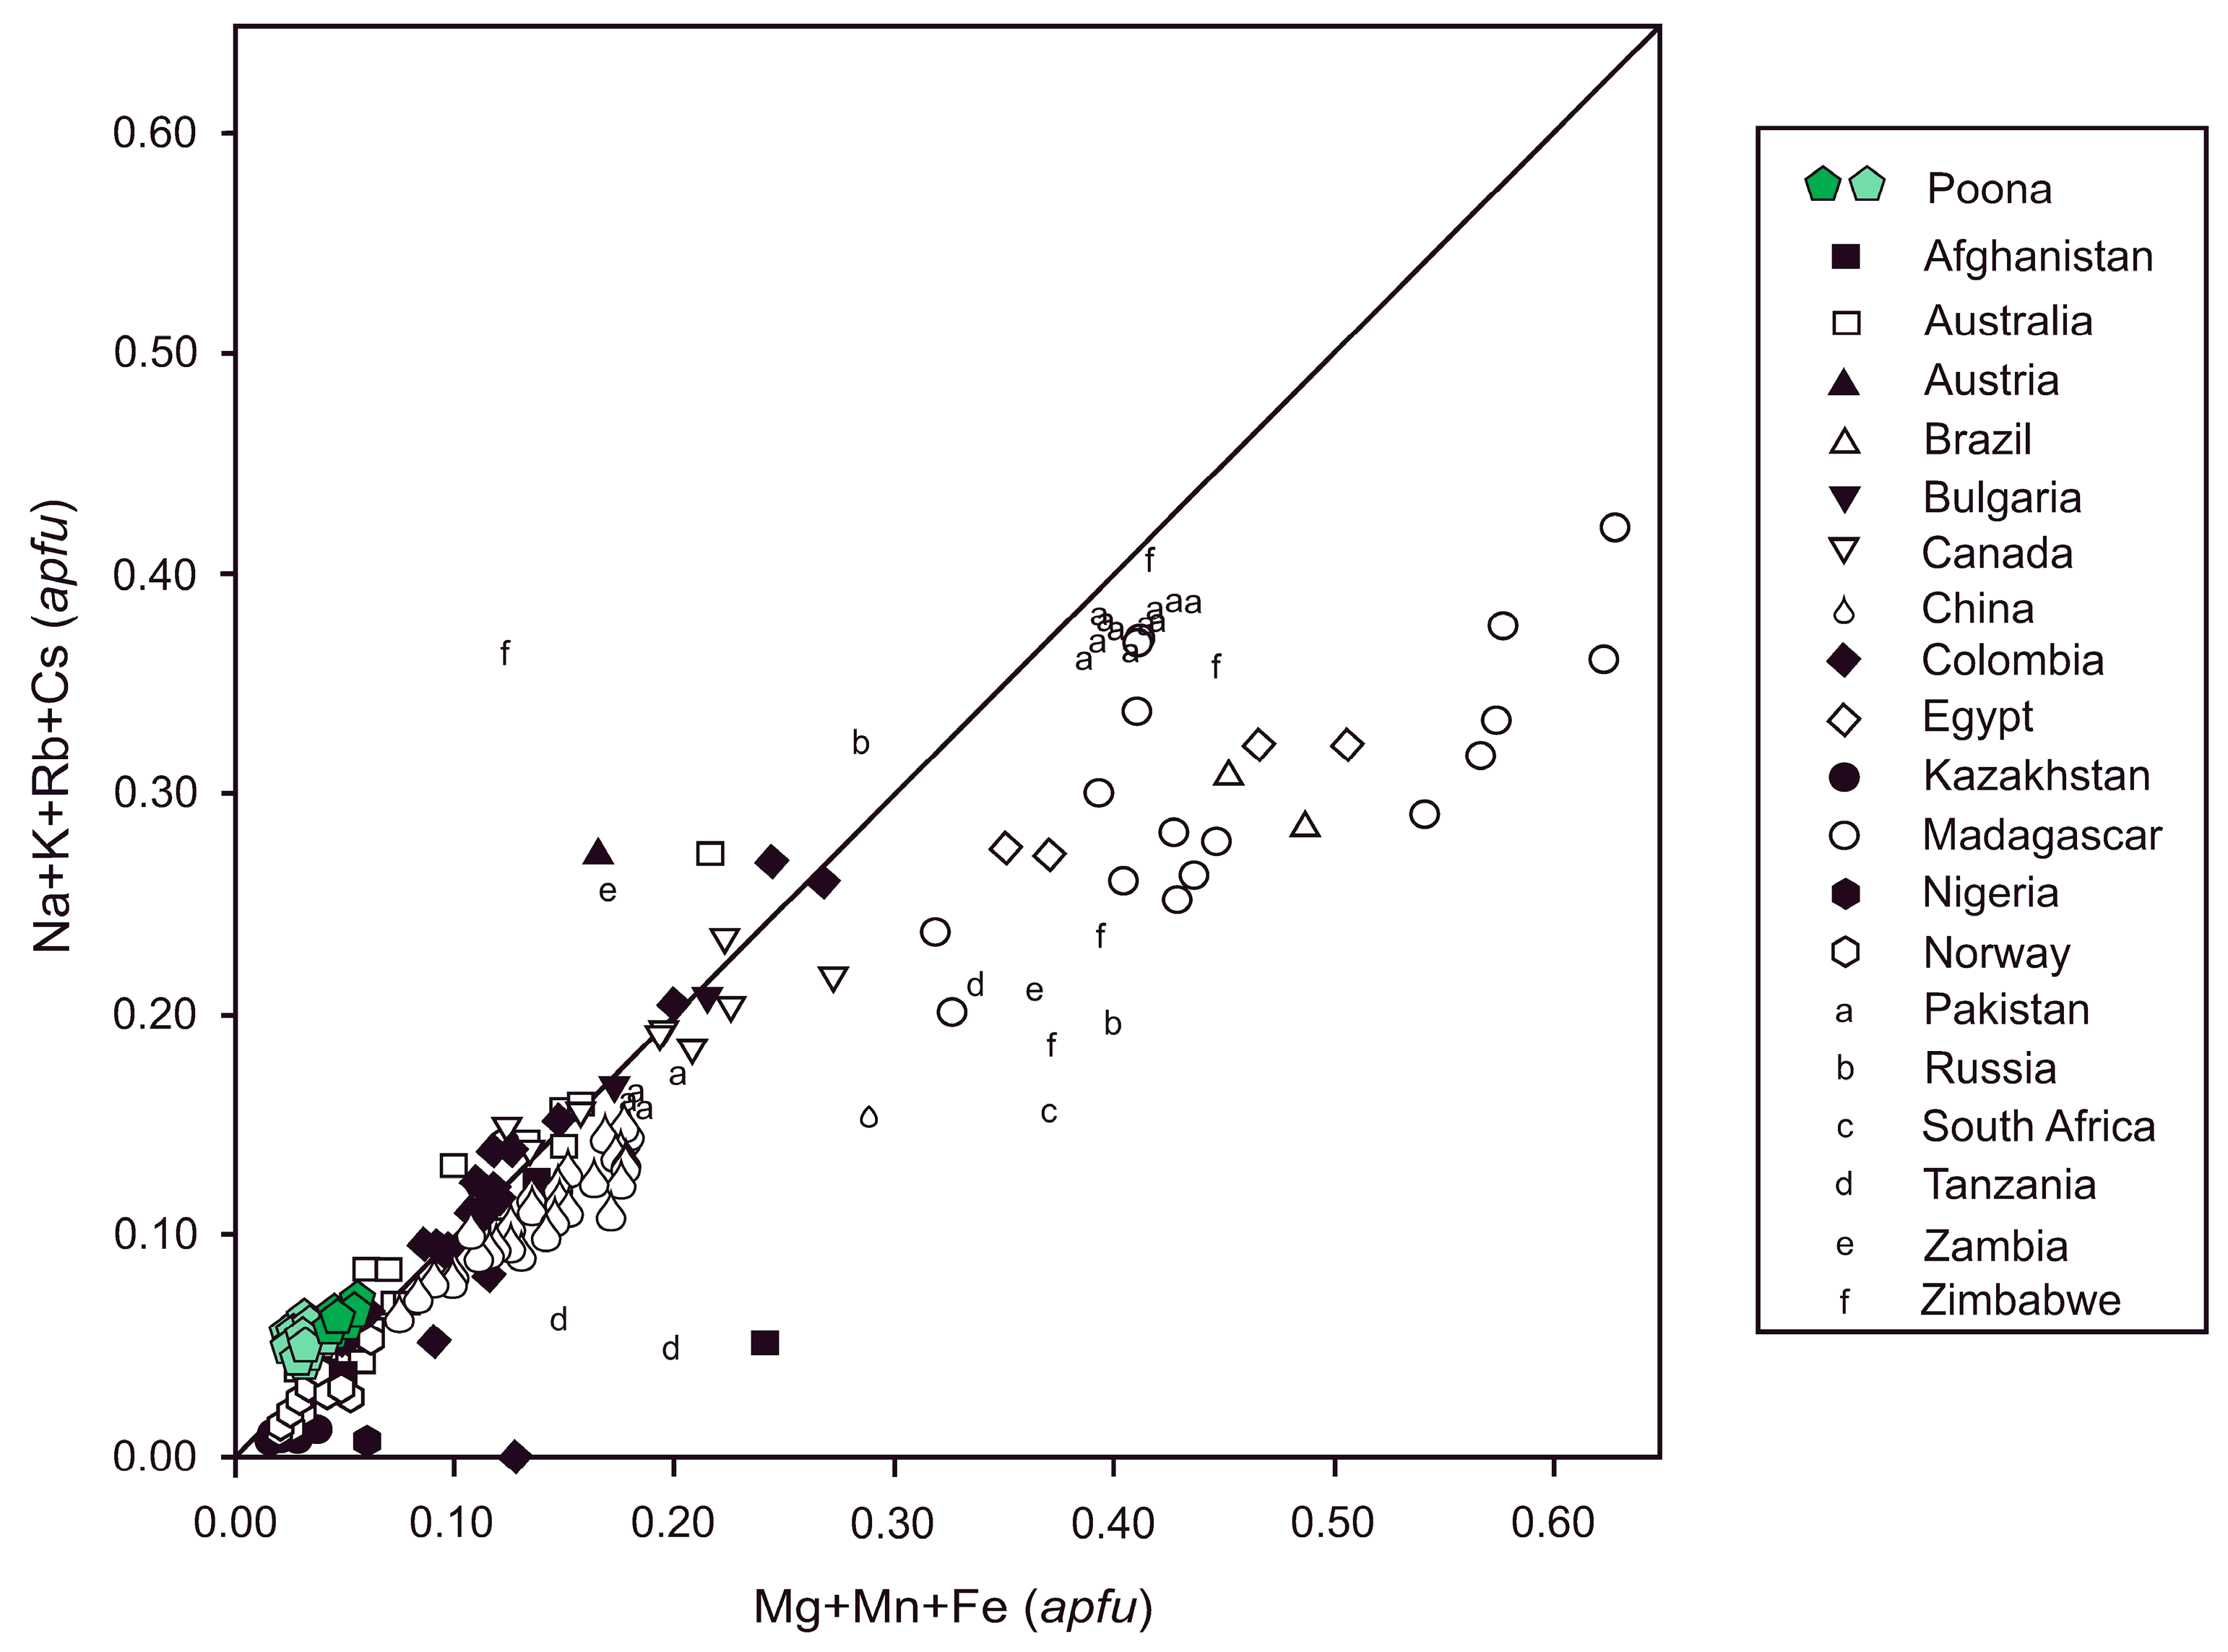
Colour zoning in Poona emerald crystals is rare but observed [4,15]. In our specimens, it is generally absent optically, both in hand specimen and plane polarized thin section petrography. In transmitted light, emerald in the pegmatite adjacent to the phlogopite schist displays rare zoning under crossed nicols (Figure 2). More pronounced zoning is observed during cathodoluminescence (CL) studies with the zonation corresponding to changes in chemical composition (Figure 3; Table 1). Quartz in our study displayed no optical or CL zoning. Cores of some emerald show resorption and subsequent reprecipitation of additional growth zones, indicating multiple emerald mineralizing events consistent with [15]. Electron microprobe analyses were conducted traversing multiple growth zones across the emerald crystal shown in Figure 2, perpendicular to the growth zones and the c-axis of the crystal. Cr, V, and Fe concentrations determined by electron microprobe varied from one growth zone to another with the outer zones often enriched in Cr and to a lesser extent V and Fe (Figure 3) showing decreased CL emission. However, the core of the emerald is also dark, indicating that other elements may also be responsible for CL emission or quenching. Interestingly the intensity of CL emission from the Poona emerald is generally the opposite of what is normally observed in emerald with the Cr and V enriched zones generally being more CL active (cf. [25]). There is a good agreement between Cr and V concentration with a relatively poor correlation between these elements and Fe. Overall, the Poona emerald is chromium dominant, with the colour zones in the emerald crystal resulting in the observed colourless beryl cores and green emerald outer zones. A similar trend, but also the reverse trend of green (Cr-rich) cores enclosed by outer zones of colourless beryl has been documented [4]. Since substitution occurs at the Y site in the crystal structure of beryl, the variations in colour are attributed to complicated substitutions at this site and/or slight variations in fluid composition, with values of Cr2O3, V2O3, and Fe2O3, ranging up to 0.27, 0.04, 0.28 wt % respectively. The concentrations of Fe, Cr, and V have been plotted relative to emerald analyses worldwide (Figure 4). The elemental concentrations from this study and past data [3,4,16] are in good agreement. However, as noted by previous researchers, emerald from these deposits is zoned and variable in chemical composition. The more chromium-rich zones of the crystal are plotted in dark and the colourless beryl in light on Figure 4. It is easily identifiable that the concentrations of Cr have resulted in this spread in the data. Notably, the Poona emerald displays chemical overlap with deposits in Madagascar, Afghanistan, Colombia, and other Australian emerald deposits. Selected cation concentrations relative to Al and Mg + Mn + Fe respectively are plotted in Figure 5 and Figure 6. There is a difference between the colour zonations highlighted by the cation concentrations versus Al, as substitution occurs at this site with varying compositions of chromium and vanadium. The Na2O values from this study range from 0.21 to 0.37 and slightly lower, but in agreement with previously published electron microprobe data [16], with values ranging up to 0.49 and one anomalous value at 0.89 wt % Na2O. Electron microprobe data from another study [3] reported one Na2O value of 0.48 wt %. Na concentrations are important as they are proportional to water contents within emerald [26].
Previous mass-spectrometric studies of fluids trapped within the channels in beryl and within fluid inclusions have been used to characterize the quantitative and qualitative compositions of fluids within emerald [26,28,29]. Water within the structural channels of emerald has been characterized as Type I and Type II, based on the orientation of the water molecule within the c axis [30]. The Type I water is free of alkalis and unbonded. Type II water is coordinated to alkali cations: Na+, K+, Rb+ and Cs+ with two water molecules bonded to a Na+ ion. Depending on the concentration of Na+, enrichment in molecular H2O can be predicted. Earlier studies [6,26] fit existing data to equations:
H2O = 0.84958 × Na2O + 0.8373
H2O = 0.87860 × Na2O + 1.2680
respectively with H2O and Na2O measured in wt %.
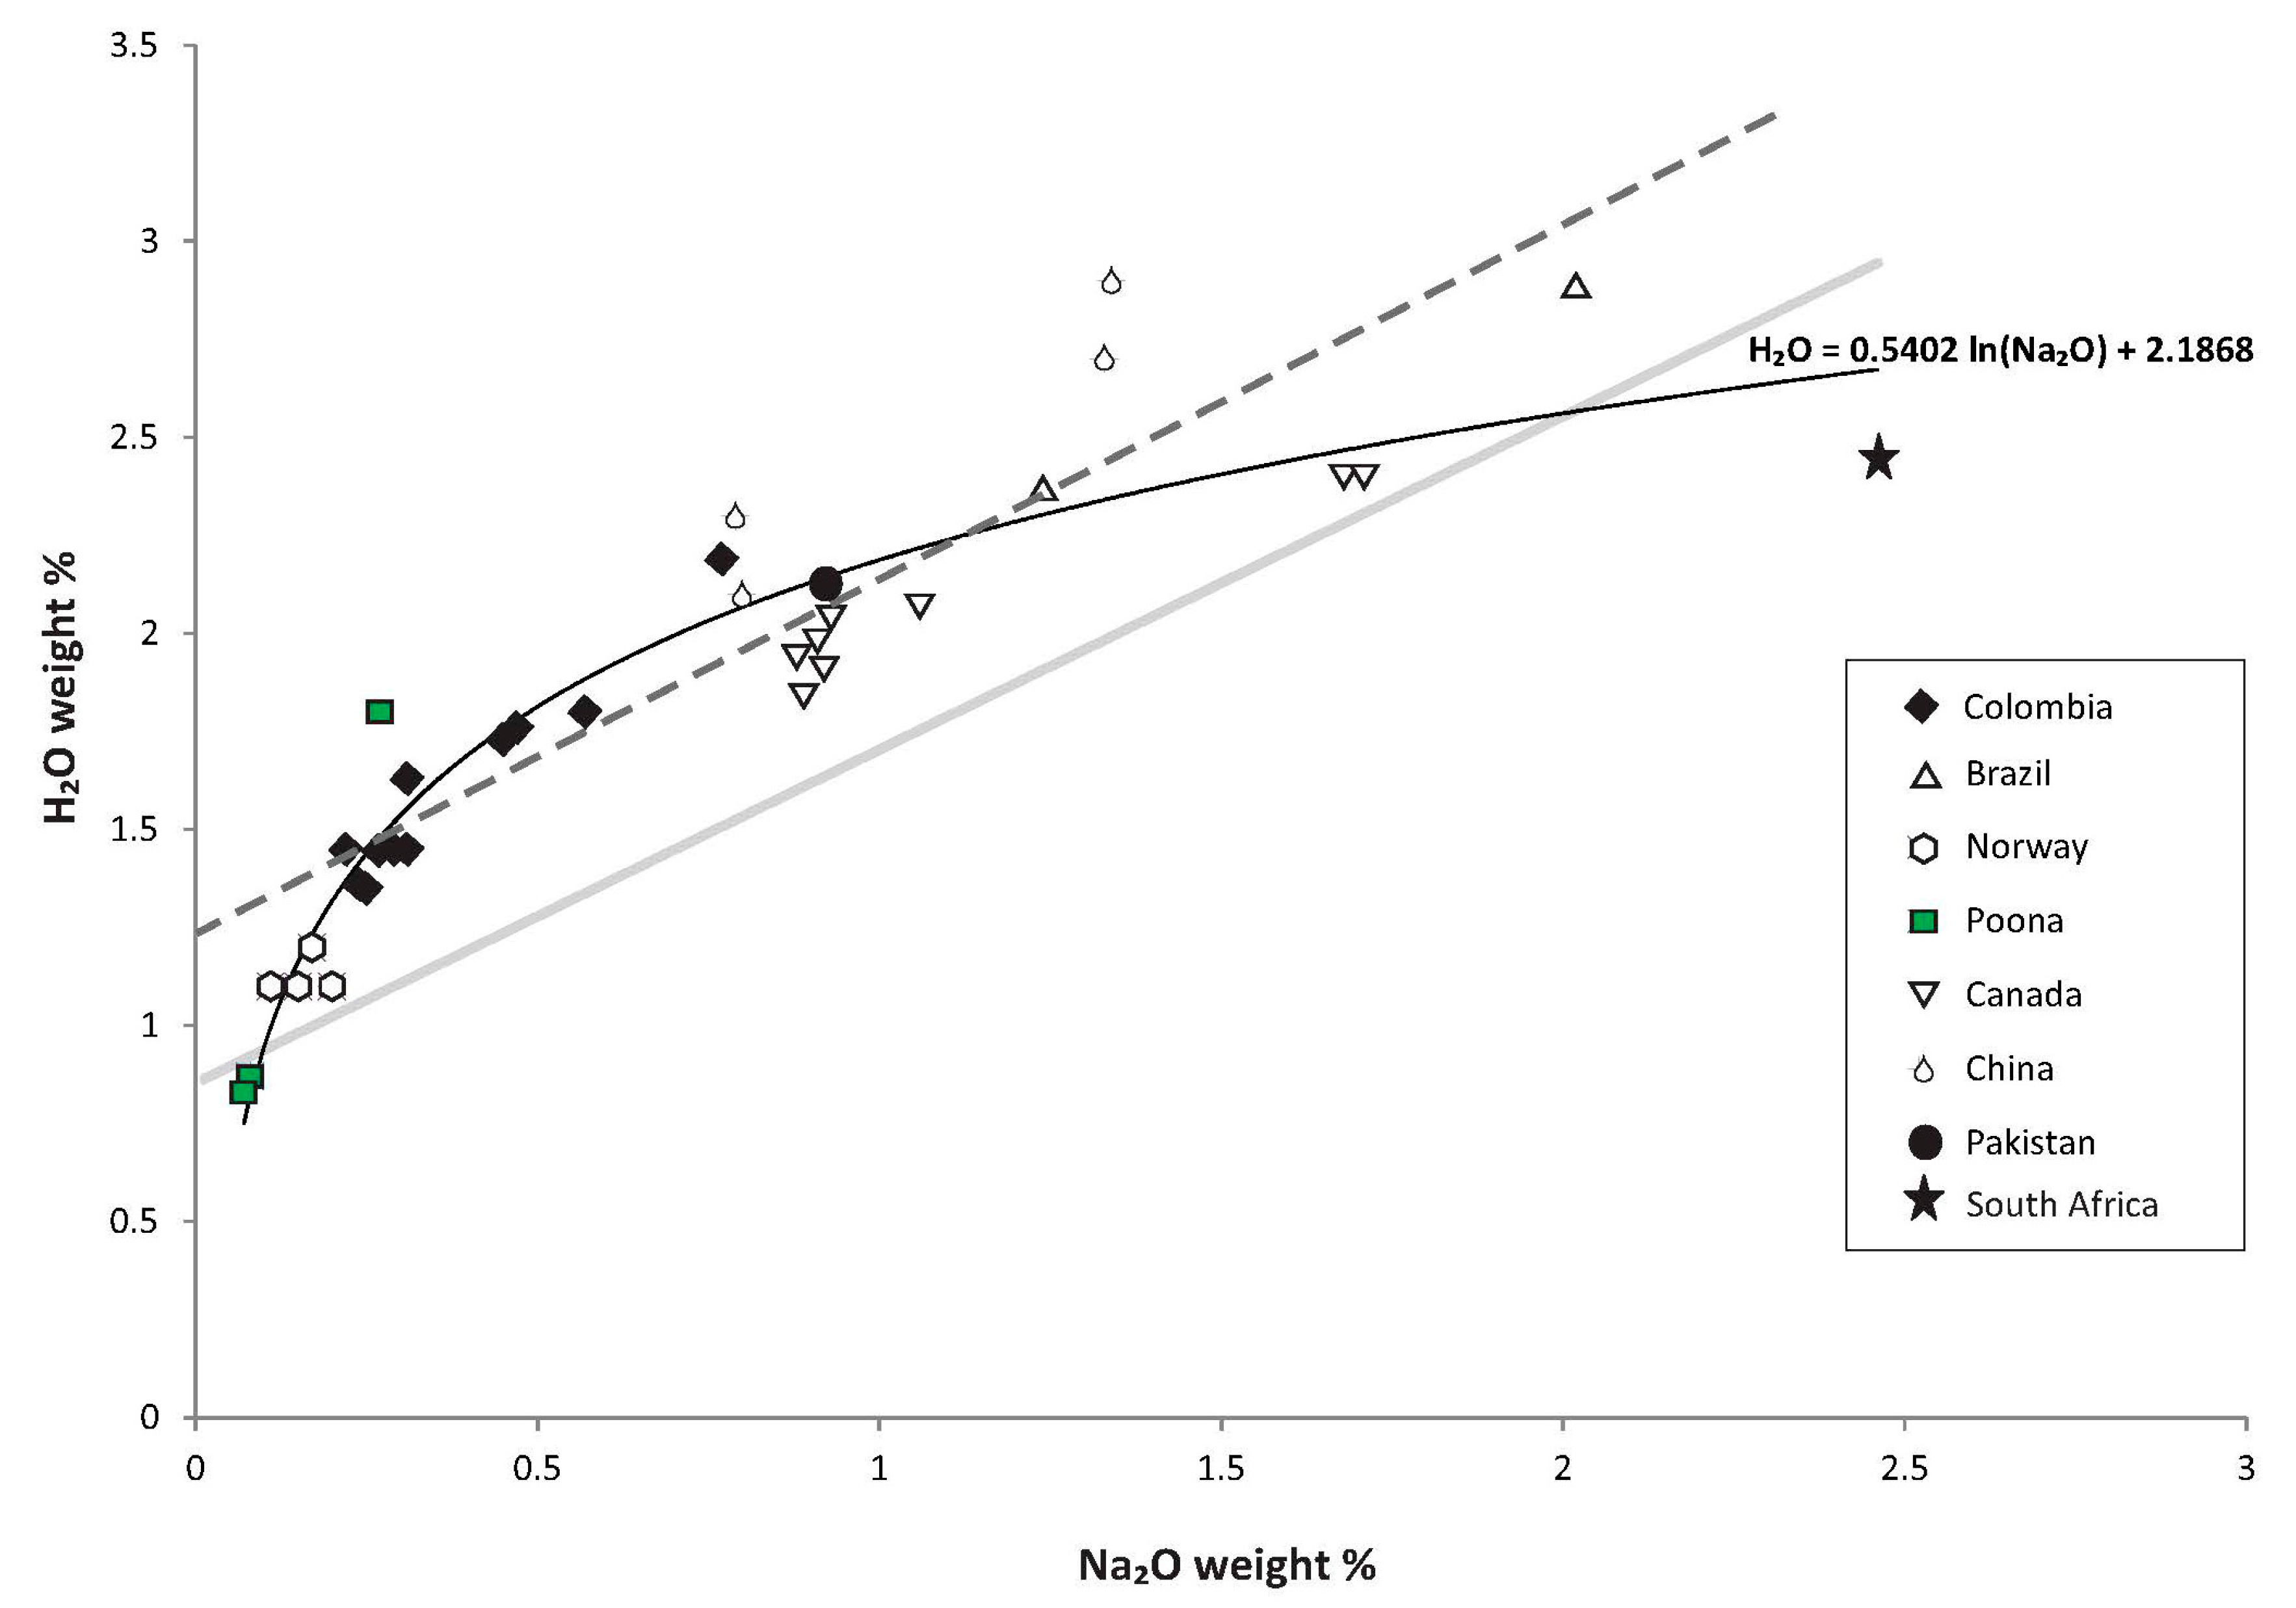
A water content of 1.8 wt % was measured in this study via mass spectrometry for the same sample as the electron microprobe data. These new data, as well as recently published H2O-rich emerald data and Na2O contents, and the original data [26,28] have been combined (Figure 7; Table 2) and are best defined by the relationship:
H2O = 0.5401 ln Na2O + 2.1867
with H2O and Na2O measured in wt %.
This new equation has an r2 of 0.88 and extends the prediction of H2O contents from higher Na2O concentrations to lower values and trends towards the theoretical minimum of zero values for both H2O and Na2O.

5. Fluid Inclusions

Reconnaissance petrography identified three samples containing emerald-bearing pegmatitic or quartz vein materials with varying amounts of phlogopite rich attached wallrock. Doubly polished plates for fluid inclusion study were prepared. Samples of coexisting quartz and emerald from the same three samples were chosen for stable isotopes studies.
Fluid inclusion petrography identified four dominant Fluid Inclusion Types (FITs) present in both the emerald and coexisting quartz. FIT-1 is a CO2-absent two-phase (vapour + brine) assemblage represented by abundant primary fluid inclusions. FIT-2 FIs display similar liquid to vapour ratios as FIT-1. However, microthermometry reveals the FIT-1 FIs and FIT-2 FIs have markedly different salinities and eutectic temperatures. FIT-3 is composed of CO2-bearing two-phase (vapour + brine) fluid inclusions. It resembles FIA-1 in terms of the liquid to vapour ratios, but additional phase changes due to the presence of CO2 easily distinguish between FIT-1 and FIT-2. The fourth FIT comprises three-phase (brine + vapour + halite ± solid) fluid inclusions. The FIs studied occur as planes of inclusions along healed fractures, growth zones or as isolated inclusions. Growth zones observed in zoned emerald (Figure 3) make it possible to identify emerald-hosted primary fluid inclusions belonging to FIT-1, based on timing relationships between fluid inclusions and mineral growth characteristics [17,18,35] or with c-axis parallel primary-fluid-inclusions (Figure 8) as in [7,25]. FIT-1 primary fluid inclusions occur in both the Cr-enriched (emerald) and clear beryl zones within the same crystal. FIT-2, FIT-3 and FIT-4 occur as isolated FIs or as secondary FIs cutting growth zones, indicating a poly-fluid history for these rocks consistent with their poly-metamorphic history. As emerald is host to and has thus trapped four different FITs, there is also a protracted history of emerald/beryl saturation for these rocks. Especially FIT-2 FIs which are the most abundant FIT in the Poona samples and this abundance makes it unlikely that these FIs formed from a more regional fluid and are not the result of localized beryl saturation along occasional fractures. All the additional FITs identified in [4] were observed in our quartz and emerald fluid inclusion plates. However, as these could be identified as necked-down [17], metastable, or of indeterminable origin [18], our efforts concentrated on the FIT-1 FIs as these were the only FIs unambiguously identifiable as primary and thus capable of yielding valid pressure, temperature, and fluid compositional data. The microthermometric measurements from FITs 1, 2 and 3 are presented in Table 3. The vapour bubble in primary FIT-1 inclusions occupies approximately 15% of the fluid inclusion volume with the brine comprising the remaining inclusion volume. FIT-3 FIs have approximately a 0.25 vapour fill ratio. FIT-4FIs have a highly variable vapour fill, and halite cube size proportion, but in general both the vapour bubble and halite each represent approximately 15 vol % of the FI. FIT-1 morphologies are dominantly elongate negative crystal shapes with lesser amounts of square-shaped inclusions (Figure 8). FIT-2, -3 and -4 inclusions tend to be ellipsoidal.

Microthermometry

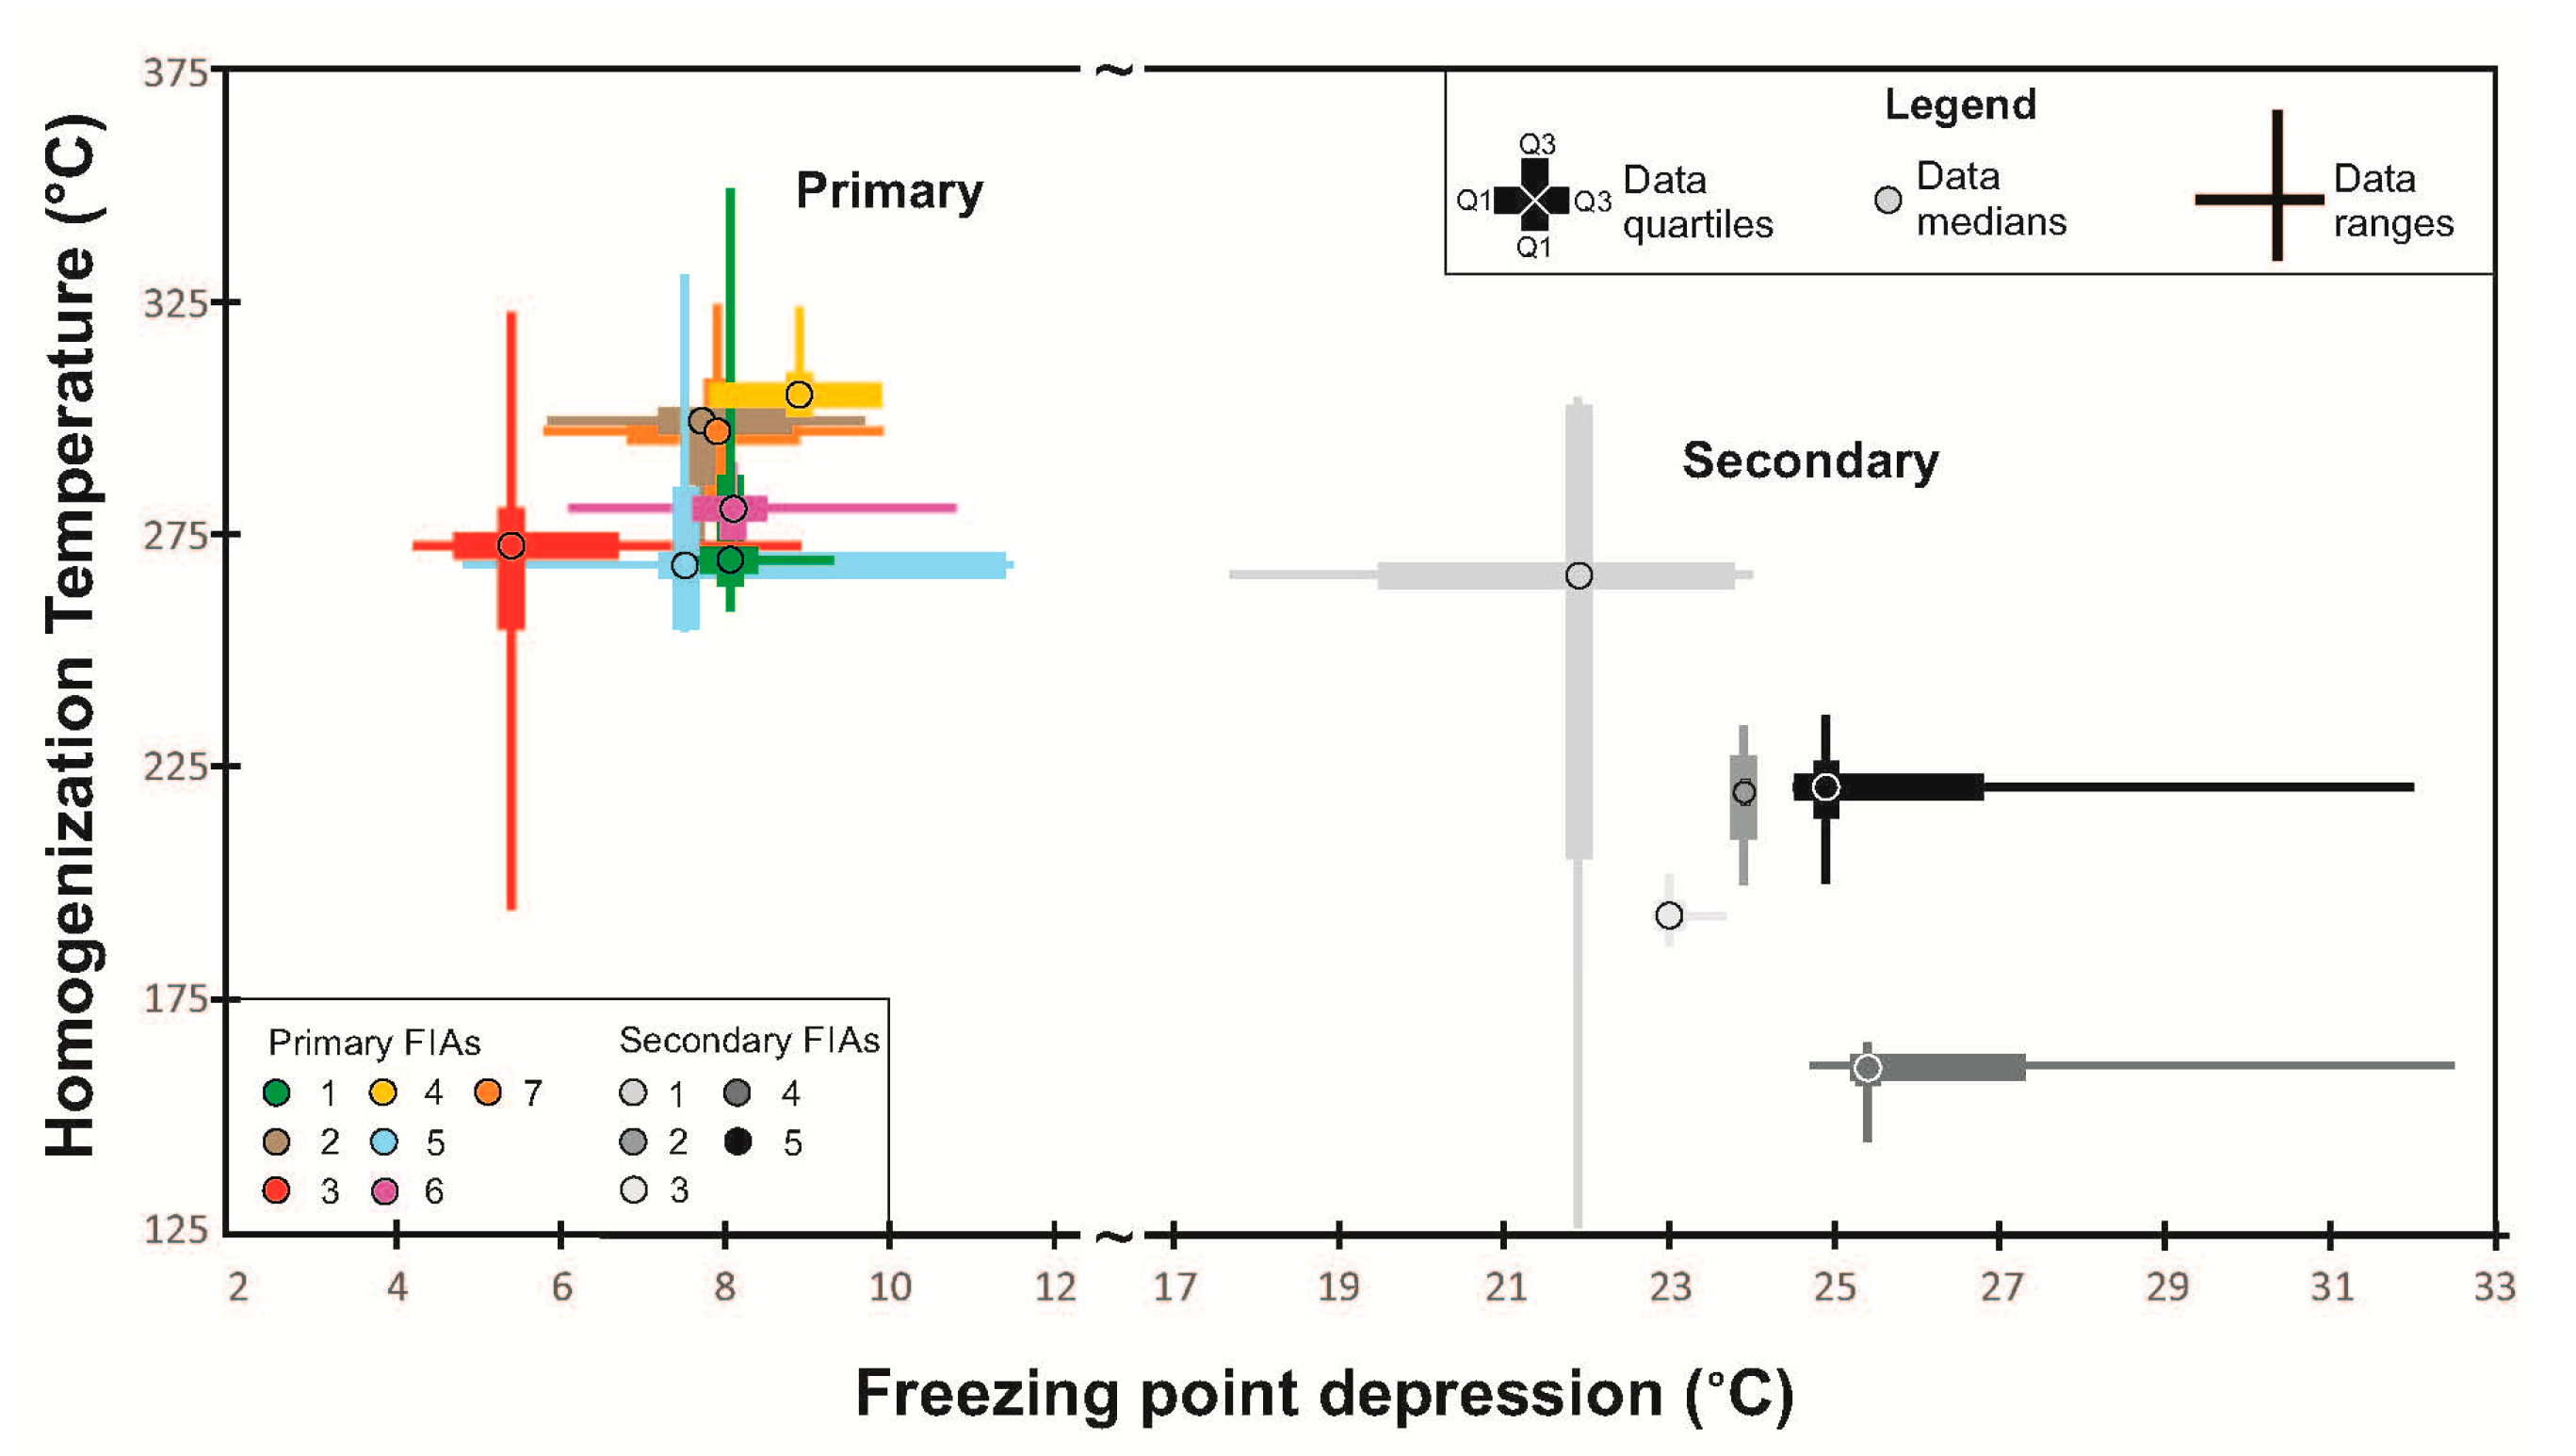
Rapid cooling of the primary FIT-1 FIs from room temperature results in the nucleation of ice at approximately −45 °C. Upon further cooling to −160 °C, no other phase changes were observed. Heating the inclusions from this temperature resulted in the first melting of ice over the temperature range −39 to −19 °C. This range in eutectic temperatures would indicate another chloride species, in addition to NaCl is present in the FIT-1 fluid inclusions. No compressible gases were detected. Further heating resulted in the final ice melt temperatures which range from −4.2 to −11.5 °C. These correspond to NaCl equivalents of 6.7 to 15.5 wt %. Heating the inclusions from room temperature resulted in continuous decreases in the size of the vapour bubbles. With the exceptions of one high temperature and one low temperature outlier, the total homogenisation of the primary fluid inclusions from vapour into the liquid phase occurred over the temperature range of 251 to 324 °C (Figure 9).
FIT-2 FIs petrographically display similar phase ratios to FIT-1 FIs. However, the FIT-2 FIs have lower ice melting, and correspondingly higher salinities than the FIT-1 FIs. Upon cooling from room temperature FIT-2 FIs nucleate ice at approximately −75 °C. Continued cooling to −160 °C results in no additional phase nucleation. Heating results in the FIs becoming discoloured at approximately −60 °C, probably due to an abundance of cracking within the ice phase. The inclusions then become clear over the temperature range −53 to −47 °C. This is likely the result of the appearance of a liquid phase filling cracks within the ice. Continued heating results in final ice melting temperatures of −17.5 to −32.5 °C. Melting points well below the H2O–NaCl eutectic, in marked contrast to the melting first melting temperatures recorded for the FIT-1 FIs, indicate other chlorides are present [36,37,38] and are possibly dominant. Continued heating results in a progressive decrease in bubble size with total homogenisation to the liquid phase occurring over the temperature range 126 to 302 °C. As these inclusions were not related to the primary fluid inclusions, no further work was performed on this FIT.
FIT-3 FIs also petrographically resemble the FIT-1 FIs and it was necessary to perform microthermometric measurements on a small subset of these inclusions to ensure they were not secondary FIAs of FIT-1. They are markedly different in composition than FITs 1 and 2 having a carbonic as well aqueous components. Upon cooling from room temperature the FIT-3 FIs display the characteristic double jerk of aqueous-carbonic FIs. Clathrate nucleates at approximately −35 °C, followed by ice nucleation at approximately −50 °C. Upon further cooling to −160 °C no other phase nucleations were observed. Although the nucleation of CO2-ice should have been visible, it was not observed, this was probably due to the amount of CO2 within the inclusions being relatively small and thus any CO2-ice deposited from the vapour was too small to observe or all of the CO2 was consumed during clathrate formation. Heating the FIs from −160 °C resulted in discolouration of the FIs at approximately −70 °C. Continued heating resulted in clathrate and ice melting over the ranges 1.5 to 3.4 and −7.6 to −5.9 °C respectively. Continued heating resulted in continued size diminishment of the vapour bubble until total homogenisation of the vapour phase into the liquid over the temperature range 310 to 343 °C (Table 3). Again, as these inclusions were not related to the primary fluid inclusions, no further work was performed on this FIT. Similarly, for FIT-4 FIs, as the petrography, secondary nature, phase proportions, and identifiable post-entrapment changes indicated no possible genetic relation to FIT-1 FIs, our study concentrated on fluids directly relatable to emerald precipitation and capable of yielding information pertaining to pressure, temperature and fluid conditions for emerald growth. Petrographically, these FITs are consistent with those previously described [4].

6. Stable Isotopes

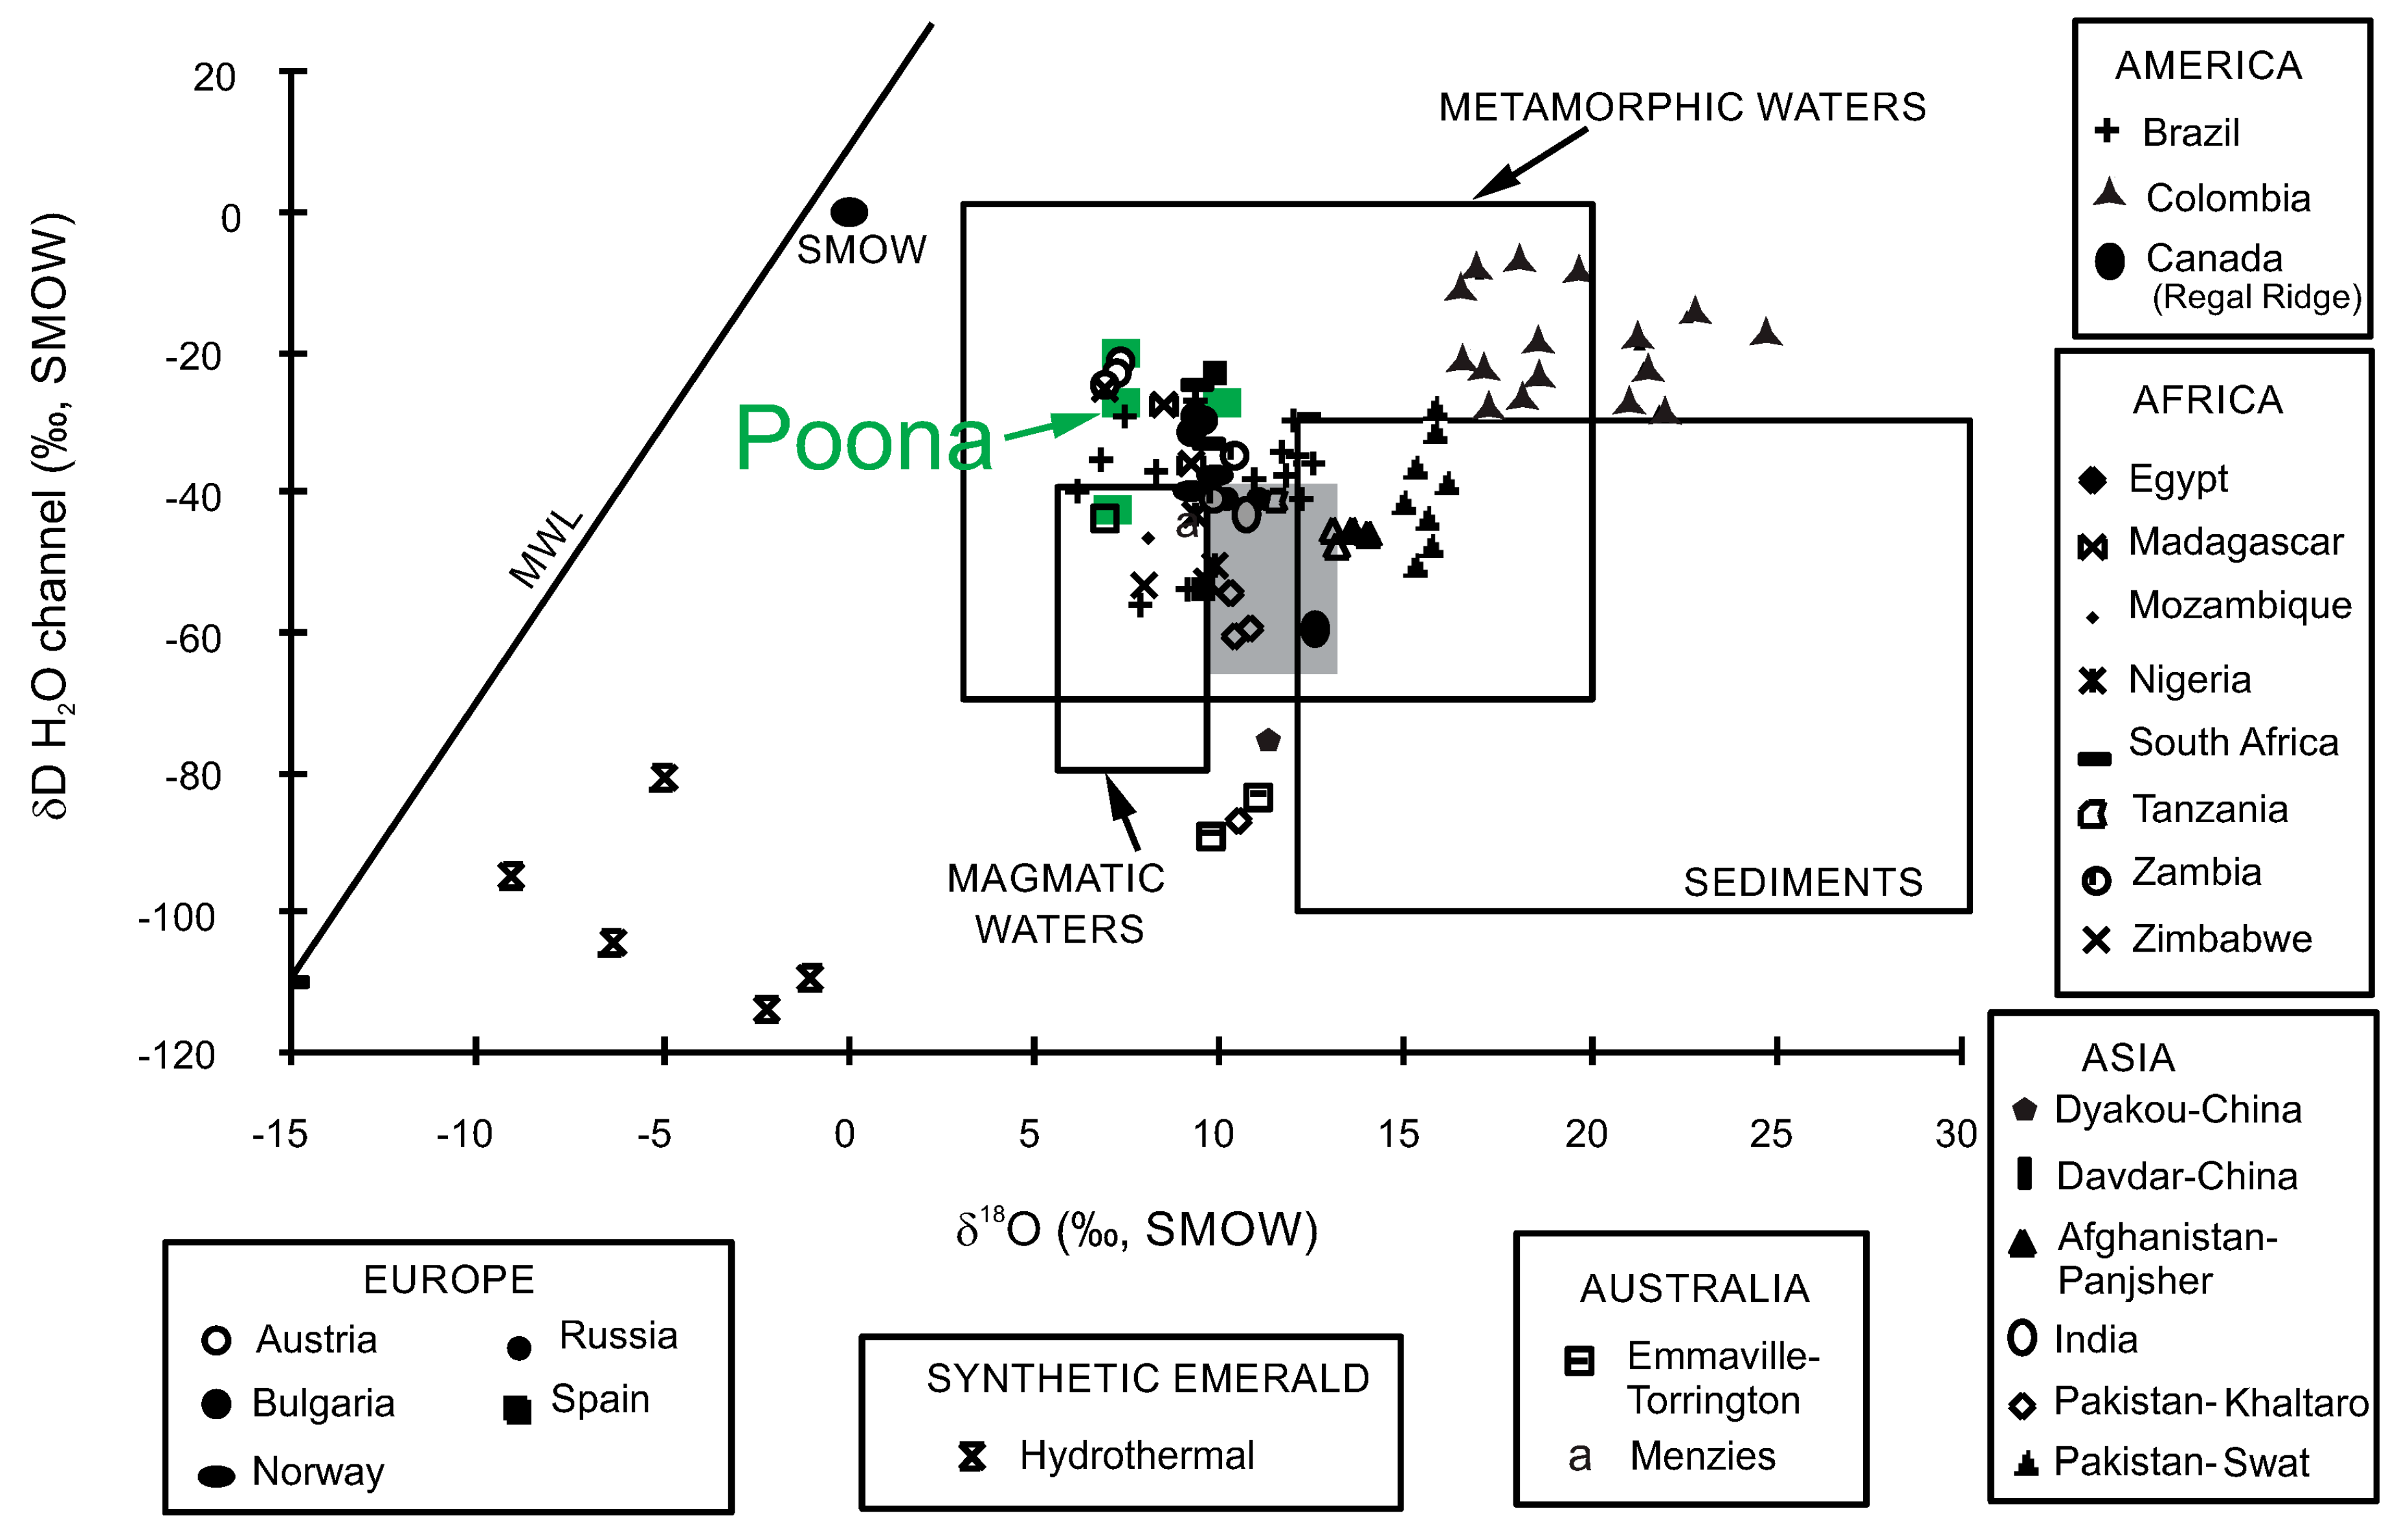
Beryl crystallises in a hexagonal symmetry and is structured with interconnected six-membered rings of silica tetrahedra producing c-axis parallel channels. These channels accommodate aqueous fluids and dissolved cations to maintain charge balance within the beryl. The fluids trapped within the channel contribute minimally to the overall δ18O of the beryl host but contain the only hydrogen as molecular H2O within the beryl structure and represent the original formational fluid in equilibrium with the beryl during crystallization [23]. Extraction and trapping of the channel fluids above 800 °C and subsequent δD analyses have been used in conjunction with δ18O analyses of the beryl to distinguish between different emerald deposits, determine fluid source and deposit type [28]. Oxygen and hydrogen stable isotope ratios from emerald and its channel fluids at Poona (Table 4) yield δ18O values ranging from 7.6‰ to 10.1‰ and δD values from −20‰ to −55‰ relative to the VSMOW international standard. The oxygen isotope results are in good agreement with the previous emerald δ18O analyses of 7.0‰ and 7.5‰ [29]. The δD values from this study vary slightly from the −43.8‰ of [6]. Overlap in the δ18O-δD signatures (Figure 10) is consistent with an igneous origin [4,13,39,40,41] or with a metamorphic origin [14] or combined metamorphic–igneous genesis [15]. The limited δ18OVSMOW data for quartz and beryl (Table 2) yield quartz–beryl fractionation values for the Poona emerald occurrence of 2.3‰, 2.2‰, 1.0‰, and 1.2‰. These correspond to a relatively large range of equilibrium temperatures of 335 to 525 °C using an empirically derived equation [31]. Despite a large range in temperatures, these data can be combined with fluid inclusion isochores from the primary FIs and be used to place some constraints on formational conditions for the Poona emerald.

7. Pressure–Temperature–Fluid Constraints

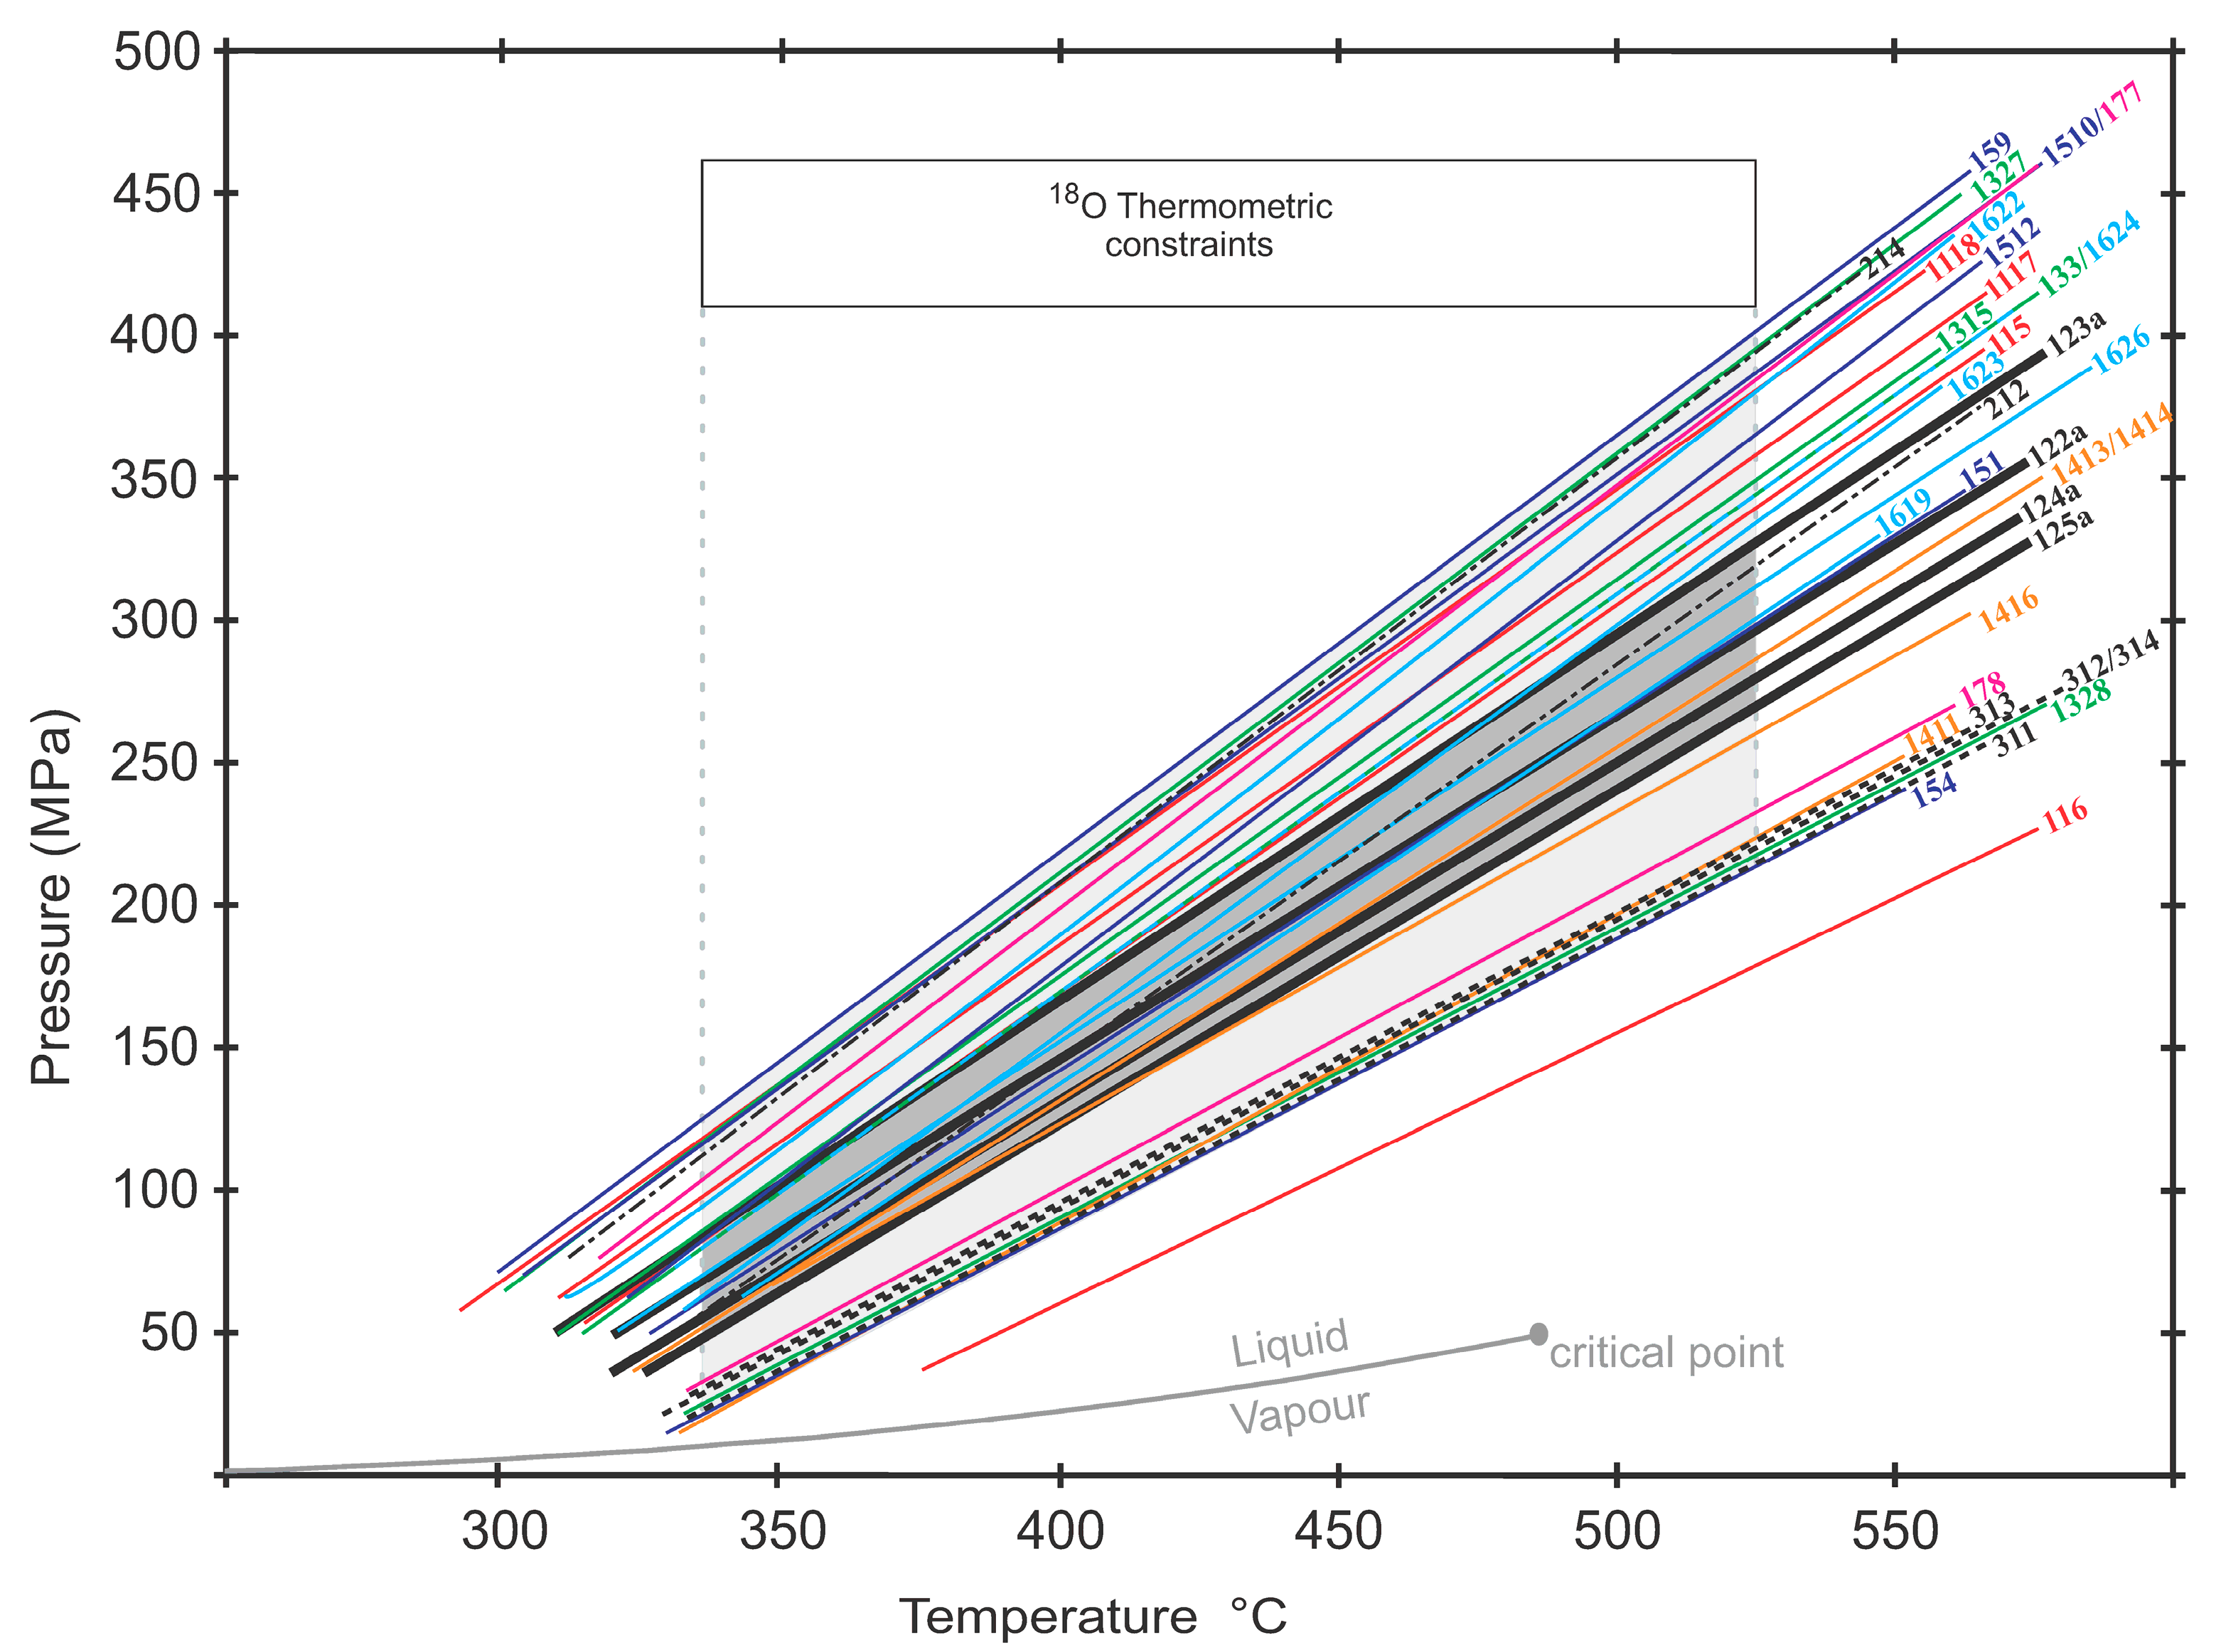
Ice melting temperatures for the primary FIT-1 FIs correspond to brines of moderate salinity. All individual fluid inclusion isochores were calculated via the ISOC program [43] and are shown on Figure 11. These derived isochores were intersected with the independently obtained temperatures from the δ18O equilibrium between emerald and quartz to place estimates on the pressures and temperatures of formation for these emerald occurrences. The FI eutectic temperatures and ice melting temperatures measured for some of the FIs indicate the presence of an additional salt or salts [36,37,38], based on eutectic or first-melting temperatures below the H2O–NaCl–KCl eutectic. FI residua from quartz samples were analysed semi-quantitively via energy dispersive analysis in an SEM and some Ca and K were identified. However, given the range of analysed Ca to K and Na ratios and the impossibility of identifying the FIA of the breached FIs, only isochores for the FIs having melting temperatures and phase assemblages consistent with modelling in the binary system H2O–NaCl were calculated. The trapping conditions range from 335 to 525 °C and 70 to 400 Mpa and the trapping conditions for the primary fluid inclusions are contained in the one-phase (liquid) field for a 12 wt % saline brine (Figure 11). The combined fluid inclusion isochoric constraints and the oxygen isotope thermometry are shown as a dark grey region on Figure 11.

8. Discussion

One of the challenges of research in a depleted mining camp is the dearth of representative samples. The Poona emerald mines were exhausted and have been closed since last century, but fortunately suitable specimens exist in museum and university collections. This study centres on three important samples. These samples are typical of emerald mineralization in the Poona region as they were collected at the interface between the pegmatites and the phlogopite schist, which has been identified by previous workers as the most productive geological setting for emerald occurrence [3,4]. Our samples contain zoned emerald and the presence of these growth zones has been used to discriminate between primary fluid inclusions trapped contemporaneously with emerald growth and a variety of secondary inclusions [4], not relatable to the major phase of emerald precipitation. Additionally, our quartz occurs in textural equilibrium with the emerald from our samples and these mineral pairs have been used for fluid inclusion petrography, stable isotope thermometry and fluid tracing. Thus, our samples are petrographically representative of the defined geological setting for emerald precipitation at Poona. In consultation with additional local experts a study of clear beryl in the pegmatites is certainly feasible, but we deem the probability of finding more representative emerald, especially zoned emerald from the pegmatite-schist-interface from further field work low, and have concentrated on our existing specimens.
The primary FIs from the zoned emerald are the focus of this study and every effort has been made to relate these to the richest zones of emerald production and to use the method of FIAs to best characterize formational conditions for emerald. However, despite the careful petrography and FIA classification, it is clear (Table 3, Figure 11) that some FIs and FIAs have suffered post entrapment changes and these changes are manifested as large ranges in the salinities and homogenisation temperatures within individual FIAs. Concentrating on the primary FIAs, we draw two important inferences from these data ranges. The first being that there is a tendency towards increased scatter within an FIA with increased severity of post entrapment changes. Secondly, based on the first observation, the FIA showing the least amount of scatter likely represents the FIA experiencing the least amount of post-entrapment changes and thus more closely resembles the pressure, temperature and fluid composition characteristic of emerald precipitation, with the caveat that it is also possible that the FIA displaying the smallest range in microthermometric measurements could also be interpreted as the assemblage with the greatest degree of post-entrapment re-equilibration. However, we deem this the more complicated and less probable scenario, as necking down [17] is the more commonly observed outcome of post-entrapment changes in FIs and this is generally observed as increased variance in the homogenisation temperatures, and to a lesser extent the salinities, of the resulting FIs.
Secondary FIs from the later FITs (2, 3 and 4) are trapped as planes of FIs crosscutting both quartz and emerald from our studied samples. As these later FITs are all liquid dominant and homogenise to the liquid, they cannot represent conjugates of a boiling system with FIT-1 and thus must represent subsequent fluids passing through emerald bearing rocks after the precipitation of the zoned emerald in our samples. The secondary FIs measured in this study (sample MDC729, Table 2) reveal the secondary fluid has a much higher salinity, near halite saturation. The literature did not reveal any studies of zoned primary minerals within the later regional igneous or metamorphic rocks, thus we deemed it unlikely that a regional reconnaissance FI study would reveal primary FIs relatable to these later fluid events, but should zoned minerals occur in the surrounding rocks, this might provide an area for further research.
The large temperature range for emerald precipitation is limited by the oxygen isotope thermometry of quartz–beryl/emerald pairs. This range is large despite careful efforts to select quartz–emerald pairs displaying textural equilibrium in hand specimen and thin section. The highest temperature is derived from sample MDC1811 (Figure 3), comprising zoned emerald crystals. Sample size and limited sample material were a limitation for the δ18O analyses, but it is possible that the variation in stable isotope numbers is due to later metamorphic resetting, initial differences in the fluids depositing the dark versus clear zones in the emerald, or an unidentifiable zoning in the quartz. The quartz did not display any growth zones, and it is possible that the different zones in the emerald could correspond to potential but unidentifiable zones in the quartz. It is also possible that our limited sample size for emerald and quartz sampled various proportions of two mismatched precipitation events of the quartz and beryl (cf. [7]). The range in δDVSMOW values from −22 to −55 shows two small but distinct data sets, three points with higher δD values corresponding to a distinctly metamorphic fluid, while the second data set of two points of lower δD values overlaps both the igneous and metamorphic fluid fields (Figure 11). Thus, the stable isotopes, as do the fluid inclusion studies, reveal two distinct fluids and these two distinct δD data sets combined with the geological observations are consistent with a combined magmatic and metamorphic origin for the Poona emerald [15].
Chromium, released to the fluid via the early breakdown of Cr-rich chlorite [4], was locally available to form emerald, but subsequently and/or distal to this, the chlorite Cr concentrations were too low to form emerald. This model would be consistent with boundary layer effects [44] and could account for the zoning observed in some of the emerald as chlorite was ultimately entirely consumed. The fluids precipitating the beryl and emerald layers would be very similar in terms of salinity, pressure and temperature but would have variable local Cr concentrations depending on proximity to chlorite breakdown. These differences would be subtle and not detectable by microthermometry. Likewise, localised differences or boundary layer effects could similarly contribute to localized differences in oxygen isotope values in the fluid phase precipitating the zoned emerald. Our data neither supports nor contradicts the hypothesis of Cr-enriched fluids via the breakdown of Cr-rich chlorite, but the localized subtle changes in fluid chemistry is certainly consistent with the salinities in FIAs in our zoned emerald.
The chemistry of the Poona emerald zonation ranges up to 0.27 wt % Cr2O3 with lesser concentrations of V2O3. These values are in good agreement with the analyses of early researchers and with the historical observations of zoning within the Poona emerald [13]. This zoning generally takes the form of relatively clear cores rimmed with emerald as in Figure 3, but reverse zoned emerald ranging from beryl with approximately 0.1 wt % Cr2O3 at the edges to a core with one anomalous value of 1.46 wt % Cr2O3 and an average in the range of 0.3 wt % Cr2O3 are documented [4]. The Poona emerald shows distinct cathodoluminescence banding, ranging from light to dark blue. Uncharacteristically for emerald, the high Cr regions of the Poona emerald have limited CL emission, while the colourless (low-Cr) zones emit dominantly blue wavelength light. However, there is not a clear relationship between the abundance of CL and chemical composition, as the core of one studied emerald yielded very low CL emissions and had the lowest concentrations of Fe, Cr, and V (Figure 3) in direct contrast to the central and outer rim chemistry and CL emission levels. Clearly, there are other chromophores or CL quenching elements in the Poona emerald, but this is beyond the scope of this present study.
The genesis of emerald deposits is often controversial with the majority of emeralds worldwide interpreted to have formed by a Be-rich fluid interacting with a source of Cr (±V). A common classification scheme for emerald deposits delineates a Type 1 deposit related to a granitic intrusion and Type 2 deposits controlled by tectonic structures [5,45]. The zoned nature of the emerald, the polymetamorphic history of the region and the diverse fluid inclusion assemblages trapped within emerald is indicative of multiple generations of emerald precipitation at Poona. Hypotheses for the genesis of emerald at Poona range from metamorphic to igneous origins, and combined metamorphic–igneous origins [15]. The greenstone sequence at Poona is a raft that was surrounded and intruded by multiple generations of granites over a period of ~100 million years. Some pegmatite and granodiorite intrusives at Poona were either pre- or syn-tectonic and the temperature and pressure ranges determined in this study for emerald mineralisation are consistent with the greenschist to lower amphibolite facies regional metamorphism (335–525 °C; 70–400 MPa). Field relations and refinements of the geochronological framework for the northern Murchison Domain suggest that the granodiorite intrusives and syn-tectonic pegmatites at Poona may have been emplaced within the period ~2710–2660 Ma (the age range of D3 deformation [19]), and were related to the Big Bell Suite granitoids (2720–2690 Ma). Pegmatites have also been described crosscutting the regional tectonic fabric [4] and these probably were derived from the later post-tectonic, fractionated Bald Rock Supersuite granites that intruded the area (~2620 Ma; 2640–2605 Ma).

9. Conclusions

The Poona emerald displays chemical and colour zoning at the micrometre scale. This zoning is expressed chemically as major variations in Cr, V, and Fe concentrations, and is reflected optically in the colour of the emerald/beryl, and in terms of blue cathodoluminescence emission. The CL emissions range from very low CL emission in zones of elevated Cr ±V concentrations to relatively higher CL emissions at blue wavelengths in areas of lesser concentrations of Cr ±V and elevated Fe. This is inconsistent with previous studies of CL in emerald and cannot be sufficiently explained in terms of Cr, V, and Fe concentrations and requires additional research.
New channel water concentration data for the Poona emerald supports a proportional relationship between Na2O contents and channel water concentration, initially defined as a linear relationship. This study incorporates the new Poona data with subsequent and existing literature data to define a logarithmic relationship between Na2O and H2O channel water concentrations yielding a better fit at the theoretical zero level and maximum concentrations of approximately 3 wt % H2O consistent with observed literature values.
New fluid inclusion data, combined with 18O and D isotope thermometry and fluid sourcing diagrams, are consistent with multiple generations of emerald precipitation, likely occurring during syn-tectonic pegmatite emplacement and regional lower amphibolite to greenschist facies metamorphism from ~2710–2660 Ma. Combined primary emerald-hosted fluid inclusion and stable isotope thermometry are consistent with the major phase of emerald precipitating over the temperature range of 335–525 °C and pressures ranging from 70 to 400 MPa from a single-phase saline fluid of approximately 12 wt % NaCl equivalent. The secondary emerald-hosted FITs identified in this study and previous studies, are less clearly defined in terms of pressure and temperatures conditions, but are consistent with emerald precipitation from multiple fluids throughout the protracted history of these rocks. Likewise, the exact timing of the secondary FIs cannot be clearly established, but their secondary nature and differing fluid compositions is consistent with a subsequent metamorphic generation of emerald/beryl overprinting a primary igneous emerald/beryl generation at Poona.

Acknowledgments

The isotopic work by QFIR Stable Isotope Lab at Queen’s University is gratefully acknowledged. NSERC funding to D.M., R.G., and S.E. is also gratefully acknowledged. Brendan Griffin kindly loaned a copy of Franchitto (1990) to P.D. Tim Ivanic from the GSWA provided very helpful advice about the regional geology at Poona. Two anonymous reviews are acknowledged.

Author Contributions

D.M. and P.D. oversaw the entire project, field work, sample selection, performed the bulk of the petrographic analyis, integrated all existing background literature and wrote the manuscript. S.E. performed the bulk of the fluid measurements and assisted with figure preparation. R.G. contributed some fluid inclusion analyses. L.L. contributed to the literature review and early work on the Na vs. H2O data fits for emerald composition. P.J. performed the electron microprobe analyses.

Conflicts of Interest

The authors declare no conflict of interest.

References

  1. Sorby, H.C. On the microscopical structure of crystals, indicating the origin of minerals and rocks. Geol. Soc. Lond. 1858, 14, 453–500. [Google Scholar] [CrossRef]
  2. Brewster, D. On the existence of two new fluids in the cavities of minerals, which are immiscible, and possess remarkable physical properties. Trans. R. Soc. Edinb. 1826, 10, 1–45. [Google Scholar] [CrossRef]
  3. Simpson, E.S. Minerals of Western Australia; Western Australia Government Printer: Perth, Australia, 1948.
  4. Franchitto, A. Emerald, Green- and Colourless-Beryl Mineralization at Poona, Murchison Province, Western Australia; University of Western Australia: Crawley, Australia, 1990. [Google Scholar]
  5. Schwarz, D.; Giuliani, G. Emerald Deposits—A review. Aust. Gemmol. 2001, 21, 17–23. [Google Scholar]
  6. Groat, L.A.; Giuliani, G.; Marshall, D.D.; Turner, D. Emerald deposits and occurrences: A review. Ore Geol. Rev. 2008, 34, 87–112. [Google Scholar] [CrossRef]
  7. Loughrey, L.; Marshall, D.; Ihlen, P.; Jones, P. Boiling as a mechanism for colour zonations observed at the Byrud emerald deposit, Eidsvoll, Norway: Fluid inclusion and stable isotope and Ar-Ar studies. Geofluids 2013, 13, 542–558. [Google Scholar] [CrossRef]
  8. Grundmann, G.; Morteani, G. Emerald mineralization during regional metamorphism: The Habachtal (Austria) and Leysdorp (Transvaal, South Africa) deposits. Econ. Geol. 1989, 84, 1835–1849. [Google Scholar] [CrossRef]
  9. Ottaway, T.; Wicks, F.; Bryndzia, L.; Keyser, T.K.; Spooner, E.T.C. Formation of the Muzo hydrothermal emerald deposit in Colombia. Nature 1994, 369, 552–554. [Google Scholar] [CrossRef]
  10. Giuliani, G.; Cheilletz, A.; Arboleda, C.; Carrillo, V.; Rueda, F.; Baker, J.H. An evaporitic origin of the parent brines of Colombian emeralds: Fluid inclusion and sulphur isotopic evidence. Eur. J. Mineral. 1995, 7, 151–165. [Google Scholar]
  11. Hewton, M.; Marshall, D.; Ootes, L.; Loughrey, L.; Creaser, R. Colombian-style emerald mineralization in the northern Canadian Cordillera: Integration into a regional Paleozoic fluid flow regime. Can. J. Earth Sci. 2013, 50, 857–871. [Google Scholar] [CrossRef]
  12. Van Kranendonk, M.J.; Ivanic, T.J. A new lithostratigraphic scheme for the northeastern Murchison Domain, Yilgarn Craton. Geol. Surv. West. Aust. Annu. Rev. 2009, 2007, 35–53. [Google Scholar]
  13. Graindorge, J.M. A gemmological study of emerald from Poona, Western Australia. Aust. Gemmol. 1974, 12, 75–80. [Google Scholar]
  14. Keeling, J. Review of a new theory on emerald formation in schist-hosted deposits. Aust. Gemmol. 1991, 17, 440–442. [Google Scholar]
  15. Grundmann, G.; Morteani, G. Alexandrite, emerald, sapphire, ruby and topaz in a biotite-phlogopite fels from the Poona, Cue district, Western Australia. Aust. Gemmol. 1998, 20, 159–167. [Google Scholar]
  16. Schwarz, D. Australian emeralds. Aust. Gemmol. 1991, 17, 488–501. [Google Scholar]
  17. Roedder, E. Fluid Inclusions; Mineralogical Society of America: Chantilly, VA, USA, 1984. [Google Scholar]
  18. Goldstein, R. Petrographic Analysis of Fluid Inclusions. In Fluid Inclusions: Analysis and Interpretation; Samson, I., Anderson, A., Marshall, D., Eds.; Mineralogical Association of Canada: Quebec City, QC, Canada, 2003; Volume 32, pp. 9–53. [Google Scholar]
  19. Van Kranendonk, M.J.; Ivanic, T.J.; Wingate, M.T.D.; Kirkland, C.L.; Wyche, S. Long-lived, autochthonous development of the Archean Murchison Domain, and implications for Yilgarn Craton tectonics. Precambr. Res. 2013, 229, 49–92. [Google Scholar] [CrossRef]
  20. Ivanic, T.J.; van Kranendonk, M.J.; Kirkland, C.L.; Wyche, S.; Wingate, M.T.D.; Belousova, E.A. Zircon Lu-Hf isotopes and granite geochemistry of the Murchison Domain of the Yilgarn Craton: Evidence for reworking of Eoarchean crust during Meso-Neoarchean plume-driven magmatism. Lithos 2012, 148, 112–127. [Google Scholar] [CrossRef]
  21. Jacobson, M.I.; Calderwood, M.A.; Grguric, B.A. Guidebook to the Pegmatites of Western Australia; Hesperian Press: Perth, Australia, 2007. [Google Scholar]
  22. Kyser, T.K.; O’Neil, J.R. Hydrogen isotope systematics of submarine basalt. Geochim. Cosmochim. Acta 1984, 48, 2123–2133. [Google Scholar] [CrossRef]
  23. Taylor, R.P.; Fallick, A.E.; Breaks, F.W. Volatile evolution in Archean rare-element granitic pegmatites: Evidence from the hydrogen-isotopic composition of channel H2O in beryl. Can. Mineral. 1992, 30, 877–893. [Google Scholar]
  24. Clayton, R.; Mayeda, T. The use of bromine pentafluoride in the extraction of oxygen from oxides and silicates for isotopic analysis. Geochim. Cosmochim. Acta 1963, 27, 43–52. [Google Scholar] [CrossRef]
  25. Loughrey, L.; Marshall, D.; Jones, P.; Millsteed, P.; Main, A. Pressure-temperature-fluid constraints for the Emmaville-Torrington emerald deposit, New South Wales, Australia: Fluid inclusion and stable isotope studies. Cent. Eur. J. Earth Sci. 2012, 4, 287–299. [Google Scholar] [CrossRef]
  26. Zimmermann, J.; Giuliani, G.; Cheilletz, A.; Arboleda, C. Mineralogical significance of fluids in channels of Colombian emeralds: A mass-spectrometric study. Int. Geol. Rev. 1997, 39, 425–437. [Google Scholar] [CrossRef]
  27. Marshall, D.; Pardieu, V.; Loughrey, L.; Jones, P.; Xue, G. Conditions for emerald formation at Davdar, China; fluid inclusion, trace element and stable isotope studies. Mineral. Mag. 2012, 76, 213–226. [Google Scholar] [CrossRef]
  28. Giuliani, G.; France-Lanord, C.; Zimmerman, J.L.; Cheilletz, A.; Arboleda, C.; Charoy, B.; Coget, P.; Fontan, F.; Giard, D. Fluid composition, δD of channel H2O and δ18O of lattice oxygen in beryls: Genetic implications for Brazilian, Colombian, and Afghanistani emerald deposits. Int. Geol. Rev. 1997, 39, 400–424. [Google Scholar] [CrossRef]
  29. Giuliani, G.; France-Lanord, C.; Coget, P.; Schwarz, D.; Cheilletz, A.; Branquet, Y.; Giard, D.; Martin-Izard, A.; Alexandrov, P.; Piat, D.H. Oxygen isotope systematic of emerald: Relevance of its origin and geological significance. Mineral. Depos. 1998, 31, 513–519. [Google Scholar] [CrossRef]
  30. Wood, D.L.; Nassau, K. The characterization of beryl and emerald by visible and infrared absorption spectroscopy. Am. Mineral. 1968, 53, 777–800. [Google Scholar]
  31. Xue, G.; Marshall, D.; Zhang, S.; Ullrich, T.; Bishop, T.; Groat, L.; Thorkelson, D.; Giuliani, G.; Fallick, A. Conditions for Early Cretaceous emerald formation at Dyakou, China: Fluid Inclusion, Ar-Ar, and stable isotope studies. Econ. Geol. 2010, 105, 375–394. [Google Scholar] [CrossRef]
  32. Marshall, D.; Groat, L.; Falck, H.; Giuliani, G.; Neufeld, H. The Lened emerald prospect, Northwest Territories, Canada: Insights from fluid inclusions and stable isotopes, with implications for Northern Cordilleran emerald. Can. Mineral. 2004, 42, 1523–1539. [Google Scholar] [CrossRef]
  33. Neufeld, H. The Tsa Da Glisza (Regal Ridge) Emerald Occurrence, Southeastern Yukon Territory, Canada: Descriptive, Genetic, and Exploration Models. Master’s Thesis, University of British Columbia, Vancouver, BC, Canada, 2004. [Google Scholar]
  34. Hammarstrom, J.M. Mineral Chemistry of Emeralds and Associated Minerals from Pakistan and Afghanistan: An Electron Microprobe Study. In Emeralds of Pakistan: Geology, Gemmology and Genesis; Kazmi, A.H., Snee, L.W., Eds.; Van Nostrand Reinhold: New York, NY, USA, 1989; pp. 125–500. [Google Scholar]
  35. Bodnar, R.J. Petrographic Analysis of Fluid Inclusions. In Fluid Inclusions: Analysis and Interpretation; Samson, I., Anderson, A., Marshall, D., Eds.; Mineralogical Association of Canada: Quebec City, QC, Canada, 2003; Volume 32, pp. 1–8. [Google Scholar]
  36. Bodnar, R.J. Introduction to Aqueous-Electrolyte Fluid Inclusions. In Fluid Inclusions: Analysis and Interpretation; Samson, I., Anderson, A., Marshall, D., Eds.; Mineralogical Association of Canada: Quebec City, QC, Canada, 2003; Volume 32, pp. 81–100. [Google Scholar]
  37. Crawford, M.L. Phase Equilibria in Aquous Fluid Inclusions. In Short Course in Fluid Inclusions: Applications to Petrology; Hollister, L.S., Crawford, M.L., Eds.; Mineralogical Association of Canada: Quebec City, QC, Canada, 1981; Volume 6, pp. 5–100. [Google Scholar]
  38. Oakes, C.S.; Bodnar, R.J.; Simonson, J.M. The system NaCl-CaCl2-H2O 1. The vapor-saturated ice liquidus. Geochim. Cosmochim. Acta 1990, 54, 603–610. [Google Scholar] [CrossRef]
  39. Sinkankas, J. Emerald and Other Beryls; Chilton Book Co.: Radnor, PA, USA, 1981. [Google Scholar]
  40. Kazmi, A.H.; Snee, L.W. Geology of the World Emerald Deposits: A Brief Review. In Emeralds of Pakistan: Geology, Gemmology and Genesis; Kazmi, A.H., Snee, L.W., Eds.; Van Nostrand Reinhold: New York, NY, USA, 1989; pp. 165–228. [Google Scholar]
  41. Groat, L.A.; Giuliani, G.; Marshall, D.D.; Turner, D. Emerald. In Geology of Gem Deposits; Groat, L.A., Ed.; Mineralogical Association of Canada: Quebec City, QC, Canada, 2014; Volume 44, pp. 135–174. [Google Scholar]
  42. Sheppard, S.M.F. Characterisation and Isotopic Variations in Natural Waters. In Stable Isotopes in High Temperature Geological Processes; Valley, J.W., Taylor, H.P., O’Neil, J.R., Eds.; Mineralogical Society of American Review Mineralogical Bookcrafters, Inc.: Chelsea, MI, USA, 1986; Volume 16, pp. 165–183. [Google Scholar]
  43. Bakker, R.J. Package FLUIDS 1. Computer programs for analysis of fluid inclusion data and for modelling bulk fluid properties. Chem. Geol. 2003, 194, 3–23. [Google Scholar] [CrossRef]
  44. London, D. The origin of primary textures in granitic pegmatites. Can. Mineral. 2009, 47, 697–724. [Google Scholar] [CrossRef]
  45. Schwarz, D.; Giuliani, G.; Grundmann, G.; Glas, M. Die Entstehung der Smaragde, ein Vieldisskutiertes Thema. In Smaragd, der kostbarste Beryll, der teuerste Edelstein; Schwarz, D., Hochleitner, R., Eds.; ExtraLapis Verlag: Munich, Germany, 2001; Volume 21, pp. 68–73. [Google Scholar]
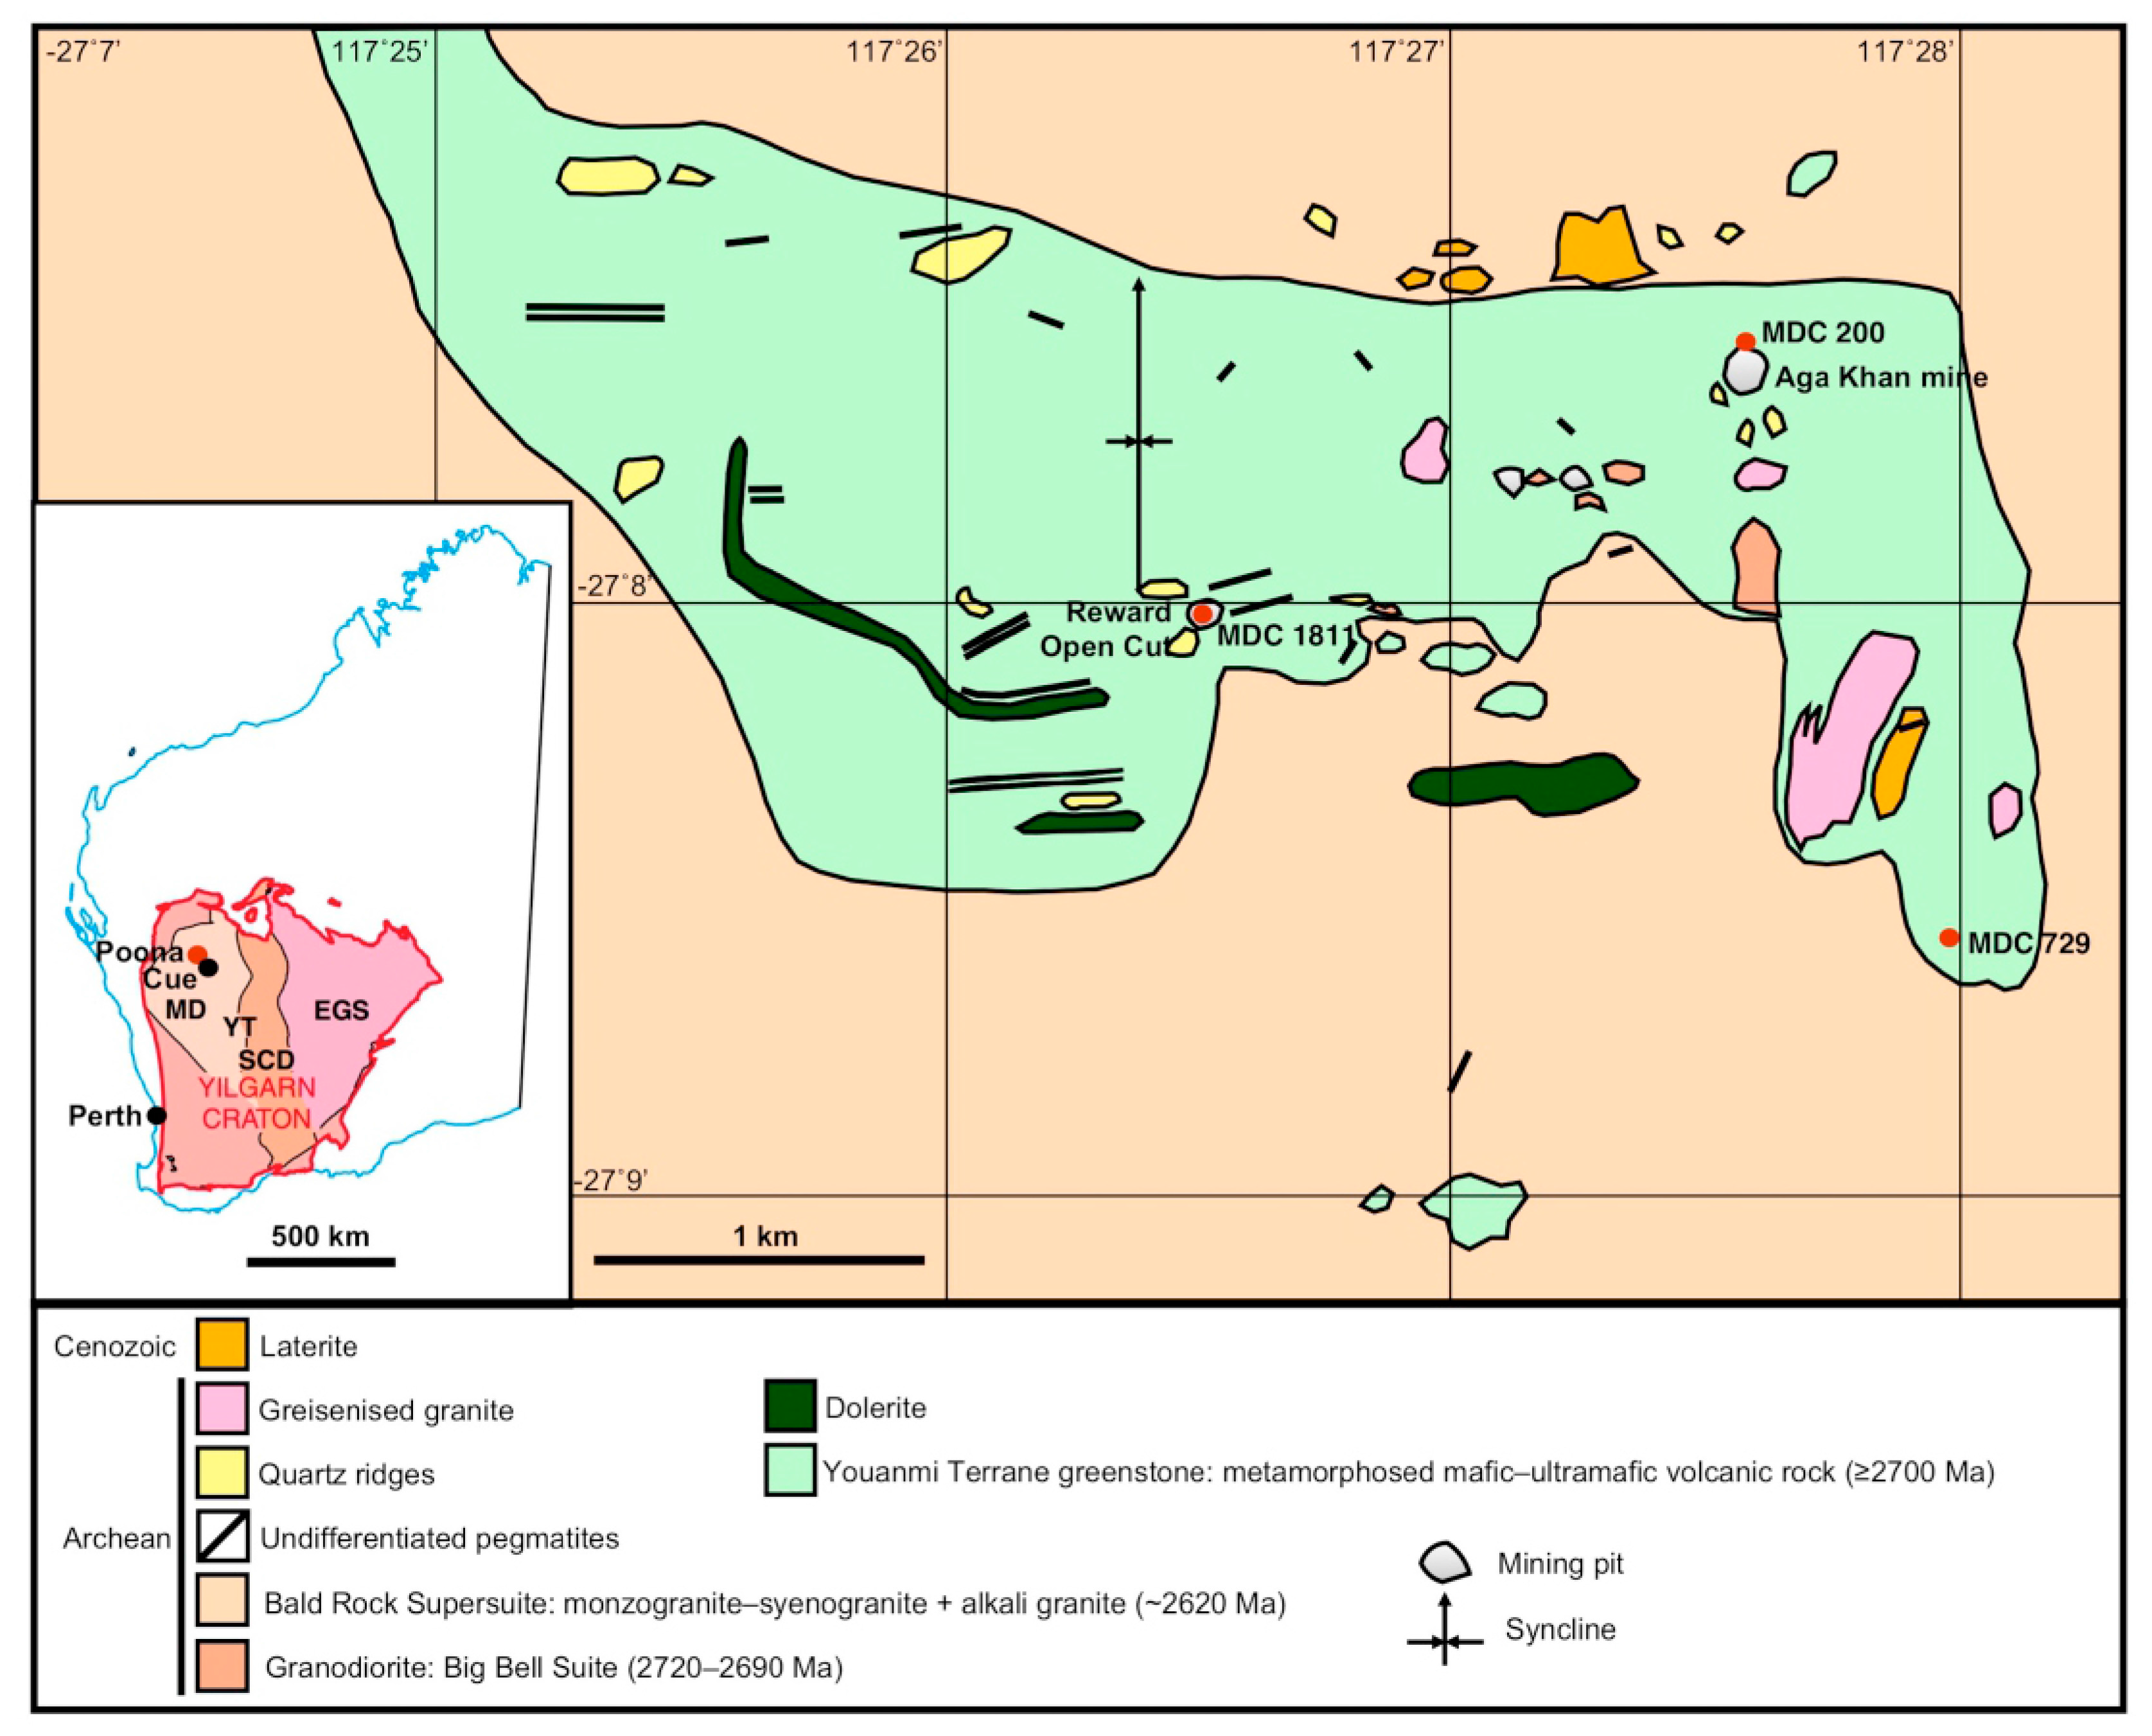
Figure 1. Index map (inset) and interpreted geological map of the Poona mineral field, Yilgarn Craton, Western Australia showing specimen localities (modified after [4,12], YT—Youanmi Terrane, MD—Murchison Domain, SCD—Southern Cross Domain, EGS—Eastern Goldfields Superterrane).
Minerals 06 00130 g001
Figure 2. Emerald in pegmatite from the Poona region. Quartz (qtz), altered potassic feldspar (ksp) and muscovite (mu) are in textural equilibrium with the emerald (brl). The emerald is clear in plane polarized light, but shown here under crossed polars exhibits growth zoning. Sample MDC1811.
Minerals 06 00130 g002
Figure 3. Electron microprobe data for FeO, Cr2O3, and V2O3 superimposed on a cathodoluminescence image of the emerald shown in Figure 2. The emerald displays multiple growth zones including a partially resorbed core. The outer zones are dark in CL and correspond to enriched concentrations of FeO, Cr2O3, and V2O3.
Minerals 06 00130 g003
Figure 4. Ternary FeO–Cr2O3–V2O3 (wt %) plots of Poona emerald compositions (dark and light green hexagons, corresponding to emerald and green beryl respectively) superimposed on the worldwide emerald compositions from literature data compiled in [6,7,25,27]. Data are normalized from wt % microprobe analyses (Table 1), with Fe data reported as FeO. Other Australian emerald data are from Menzies and Emmaville-Torrington.
Minerals 06 00130 g004
Figure 5. Al versus the sum of other Y-site cations, in atoms per formula unit. The Poona emerald compositions are superimposed on worldwide emerald data compiled from the literature in [6,7,25,27]. The dark and light green hexagons correspond to emerald vs. beryl compositions in the Poona samples.
Minerals 06 00130 g005
Figure 6. Mg + Mn + Fe versus monovalent channel-site cations, in atoms per formula unit. The Poona compositions (dark and light green hexagons) are superimposed on worldwide emerald data compiled from the literature in [6,7,25,27].
Minerals 06 00130 g006
Figure 7. Channel H2O versus emerald Na2O contents for a variety of emerald deposits. Comparison to the new fit (Equation (3)) is shown in black signature relative to the previously derived equations of [6,26] shown in grey solid and dashed signatures respectively.
Minerals 06 00130 g007
Figure 8. Photomicrograph of an assemblage of primary two-phase fluid inclusions occurring within growth zones in beryl (Figure 2). The fluid inclusions are oriented with their long axes parallel to the c-axis of the host crystal, as is typical of primary fluid inclusions in emerald [7,25]. Photomicrograph taken in plane polarised light.
Minerals 06 00130 g008
Figure 9. Two-dimensional box and whisker plot for two-phase liquid-rich fluid primary and secondary fluid inclusions from Poona emerald. Total homogenisation and ice melting temperatures are shown on the ordinate and abscissa axes respectively. The number of fluid inclusions measured for the primary assemblages are 4, 4, 5, 4, 5, 5, and 2 respectively. All secondary assemblages had four inclusions per assemblage. Data ranges less than the Q1 and Q3 conjugates are not shown.
Minerals 06 00130 g009
Figure 10. Channel δD H2O versus δ18O for the Poona emerald (green rectangles; Table 4) superimposed on data from a number of world localities compiled from [6,28]. The isotopic compositional fields are from [42], including the extended (Cornubian) magmatic water box (grey). MWL = Meteoric Water Line, SMOW = standard mean ocean water.
Minerals 06 00130 g010
Figure 11. Pressure–temperature diagram showing all of the individual FI isochores for the FIT-1, 2, and three Poona fluid inclusions hosted in emerald. The pressure–temperature constraints from the stable isotope thermometry combined with all of the isochores and the FIA displaying the least amount of post-entrapment-changes (Table 3, FIT-1, FIA-2) are shown in light and dark grey shaded areas respectively. The individual isochores are labelled with the first digit representing the FIT, the second digit representing the FIA, and the fourth and/or third digits representing the individual FI number from Table 3. The liquid–vapour curve for a 12 wt % NaCl–H2O fluid, derived from the data of [36], is shown in grey with grey text.
Minerals 06 00130 g011
Table 1. Weight percent oxide values from Electron microprobe analyses+ of the Poona emerald along traverse line indicated in Figure 3.
OxideTrav 1Trav 2Trav 3Trav 4Trav 5Trav 6Trav 7Trav 8Trav 9Trav 10Trav 11Trav 12Trav 13Trav 14Trav 15Trav 16Trav 17Trav 18
SiO266.4965.9366.3065.8765.6265.6565.7666.1765.8966.7165.4565.7866.3866.4966.7166.2965.0165.66
TiO20.010.000.010.000.000.020.010.010.000.010.000.000.000.010.010.000.020.00
Al2O318.0017.8417.9017.7217.8818.3118.1618.4918.1418.3418.3618.2418.3718.2018.3218.3318.2018.16
Sc2O30.010.010.000.000.020.020.020.020.030.010.020.010.020.020.020.010.020.00
V2O30.040.030.020.020.000.000.000.030.020.010.010.020.000.000.000.010.010.02
Cr2O30.180.210.170.120.030.010.000.010.000.000.000.000.000.010.010.000.000.01
BeO18.8213.7013.7613.6413.6413.6813.6813.8013.7013.8613.6513.7013.8113.8113.8613.7913.5613.65
MgO0.230.250.220.150.250.120.120.130.130.120.120.120.130.130.130.130.130.10
CaO0.000.010.000.010.010.010.010.010.010.000.010.010.010.000.000.010.000.01
MnO0.000.000.000.000.000.000.000.000.000.000.000.000.010.000.000.000.000.00
FeO0.230.190.150.160.250.170.180.210.170.190.180.170.150.150.110.110.110.08
Na2O0.330.330.290.250.330.250.260.250.250.250.260.290.280.290.280.300.290.28
K2O0.020.030.020.010.010.020.010.010.000.010.010.020.010.020.010.010.020.02
Rb2O0.000.000.000.000.000.000.000.000.000.000.000.000.000.000.000.000.000.00
Cs2O0.060.060.080.090.230.120.120.140.120.090.120.120.110.110.120.100.100.09
H2O a1.581.591.521.431.601.441.461.431.451.441.451.511.501.511.511.531.531.49
Total101.00100.16100.4499.4899.8699.8199.78100.6999.92101.0699.6399.99100.78100.74101.10100.6299.0199.58
OxideTrav19Trav20Trav22Trav23Trav24Trav25Trav26Trav27Trav28Trav29Trav31Trav32Trav33Trav34Trav35Trav36Trav37
SiO265.8766.0166.1165.8765.6766.6065.7066.2166.3465.8565.8266.5765.9966.3566.2466.0565.91
TiO20.020.000.000.020.010.010.010.000.020.010.000.000.000.010.000.010.00
Al2O318.2818.1418.4918.2518.2618.3918.3918.3118.1618.3318.1918.2418.0918.1917.7317.7317.87
Sc2O30.010.000.000.010.020.010.020.020.010.000.020.020.020.020.020.020.01
V2O30.000.020.000.000.010.000.000.010.010.010.000.000.030.010.040.030.03
Cr2O30.000.000.000.000.000.000.000.030.000.000.030.000.000.120.210.210.27
BeO13.7013.7113.7713.7113.6713.8513.6913.7713.7713.7113.6913.8213.7213.8113.7413.7113.70
MgO0.110.100.110.120.120.110.120.110.110.110.100.120.170.200.250.260.21
CaO0.000.000.000.000.010.000.000.020.000.000.010.010.010.000.010.010.00
MnO0.000.000.000.000.000.000.000.000.000.000.000.000.000.000.010.000.00
FeO0.080.110.080.130.110.130.120.130.130.160.150.160.200.190.190.190.16
Na2O0.260.280.280.270.260.250.250.240.220.220.210.240.270.280.320.330.37
K2O0.010.020.020.010.010.020.010.010.020.010.010.010.010.000.020.020.00
Rb2O0.000.000.000.000.000.000.000.000.000.000.000.000.000.000.000.000.00
Cs2O0.110.110.100.110.090.080.100.090.110.090.100.110.140.190.070.040.06
H2O a1.461.511.511.481.461.431.431.421.381.371.351.411.481.501.571.581.65
Total99.90100.01100.46100.0099.69100.9099.84100.36100.2999.8799.68100.70100.13100.87100.43100.18100.24
All analyses are calculated based on 18 oxygen and three beryllium. a H2O calculated via Equation (3).
Table 2. Channel H2O and Na2O contents (weight %) of various emerald deposits worldwide.
LocalityChannel H2OEmerald Na2OLocalityChannel H2OEmerald Na2O
Colombia Canada
Yacopi2.190.77Mountain River2.41.68
Pava1.630.31Mountain River2.41.71
Coscuez1.760.47Tsa da Glisza2.071.06
Tequendama1.80.57Tsa da Glisza1.910.92
Cincho1.730.45Lened2.040.93
Vega1.360.24Lened1.980.91
Oriente1.350.25Lened1.920.91
Palo Aranado1.450.31Lened1.840.89
Guala1.450.22Lened1.940.88
Klein1.450.27China
Brazil Davdar2.10.80
Carnaíba2.371.24Davdar2.30.79
Santa Terezinha2.882.02Dyakou2.91.34
Norway Dyakou2.71.34
Byrud1.10.15South Africa
Byrud1.10.2Ledysorp2.452.46
Byrud1.10.11Australia
Byrud1.20.17Emmaville-Torrington0.870.08
Pakistan Emmaville-Torrington0.830.07
Khaltaro2.120.92Poona 1 (this study)1.80.27
1 Concentrations of H2O obtained by stable isotope analyses and quadrupole mass spectrometry. Na2O contents obtained by microprobe analysis on a CAMECA Camebax microprobe. Data compiled from this study and other data from the literature [6,7,8,11,25,26,27,28,31,32,33,34].
Table 3. Emerald-hosted fluid inclusion microthermometric measurements.
FIA/FITSampleTm-iceTfmTm-clathrateSalinity * (wt % NaCl eq.)Th-tot
MDC1811 Chip 2 (Primary)
5−7.4 11.0272.5
1/16−7.8 11.5347.1
17−8.1 11.8267.2
18−9.3−27 13.2259.9
2a−5.3−23 8.3282.7
2/13a−5.5−23 8.5272.5
4a−9.8−22 13.7297.3
5a−7.7 11.3300.9
1a−6.7 10.1184.9
3−4.2 6.7269.1
3/115−8.9 12.7273.8
27−4.5 7.2251.3
28−7.1 10.6323.4
11−7.8 11.4324.3
13−9.9−18 13.8297.6
4/114−9.9−18 13.8297.6
16−7.8−22 11.4306.9
1−4.8−39 7.6283.9
4−7.2 10.7331.1
5/19−9.9 13.8256.4
10−5.8−24 8.9256.1
12−7.5−19 11.1269.4
19−8.1 11.8289.2
22−10.8−21 14.8268.3
6/123−7.6 11.2280.0
24−8.5 12.3274.5
26−6.1 9.3280.9
7/17−11.5 15.5265.3
8−11.4 15.4324.4
MDC1811 Chip 1 (Secondary)
1−5.9−381.5 317.1
1/32−7.6 3.1 343.2
3−6.3−403.4 310.5
4−6.6 3.2 328.8
MDC729 Chip 1 (Secondary)
1−24.0 125.7
2−20.1−47 22.4301.9
1/23−23.7 234.0
4−17.7 20.7299.0
1−23.9 229.3
2−23.8−52 226.2
2/23−23.9−53 201.8
4−24.0 213.5
1−22.8 193.9
2−23.0−48 203.8
3/23−23.7 197.3
4−23.0 190.9
MDC729 Chip 2 (Secondary)
1−32.5 166.3
4/22−25.3 152.0
3−24.7 171.1
4−25.5 166.6
1−25.1 218.7
5/22−24.6 235.1
3−24.5 223.4
4−32.0 201.7
All temperatures reported in degrees Celsius, Tfm = ice first-melting temperature, Tm ice = Ice melting temperature, Th vap = vapour homogenization temperature into the liquid. * Salinites are calculated as per [36].
Table 4. Stable isotope data+ from Poona quartz and beryl/emerald.
Sample NumberMineralδ18O (‰ VSMOW)Channel H2O (Weight %)δD (‰ VSMOW)
MDC 200-1beryl10.11.7−27
MDC 200-2beryl7.61.8−20
MDC1811beryl7.61.8−27
MDC729beryl7.42.7−55
Poona *beryl7.02.5−44
MDC 200-1quartz12.3
MDC 200-2quartz9.9
MDC 1811quartz8.6
MDC729quartz8.6
* data from [6].