
Pressure–Temperature–Fluid Constraints for the Poona Emerald Deposits, Western Australia: Fluid Inclusion and Stable Isotope Studies

Abstract
:1. Introduction
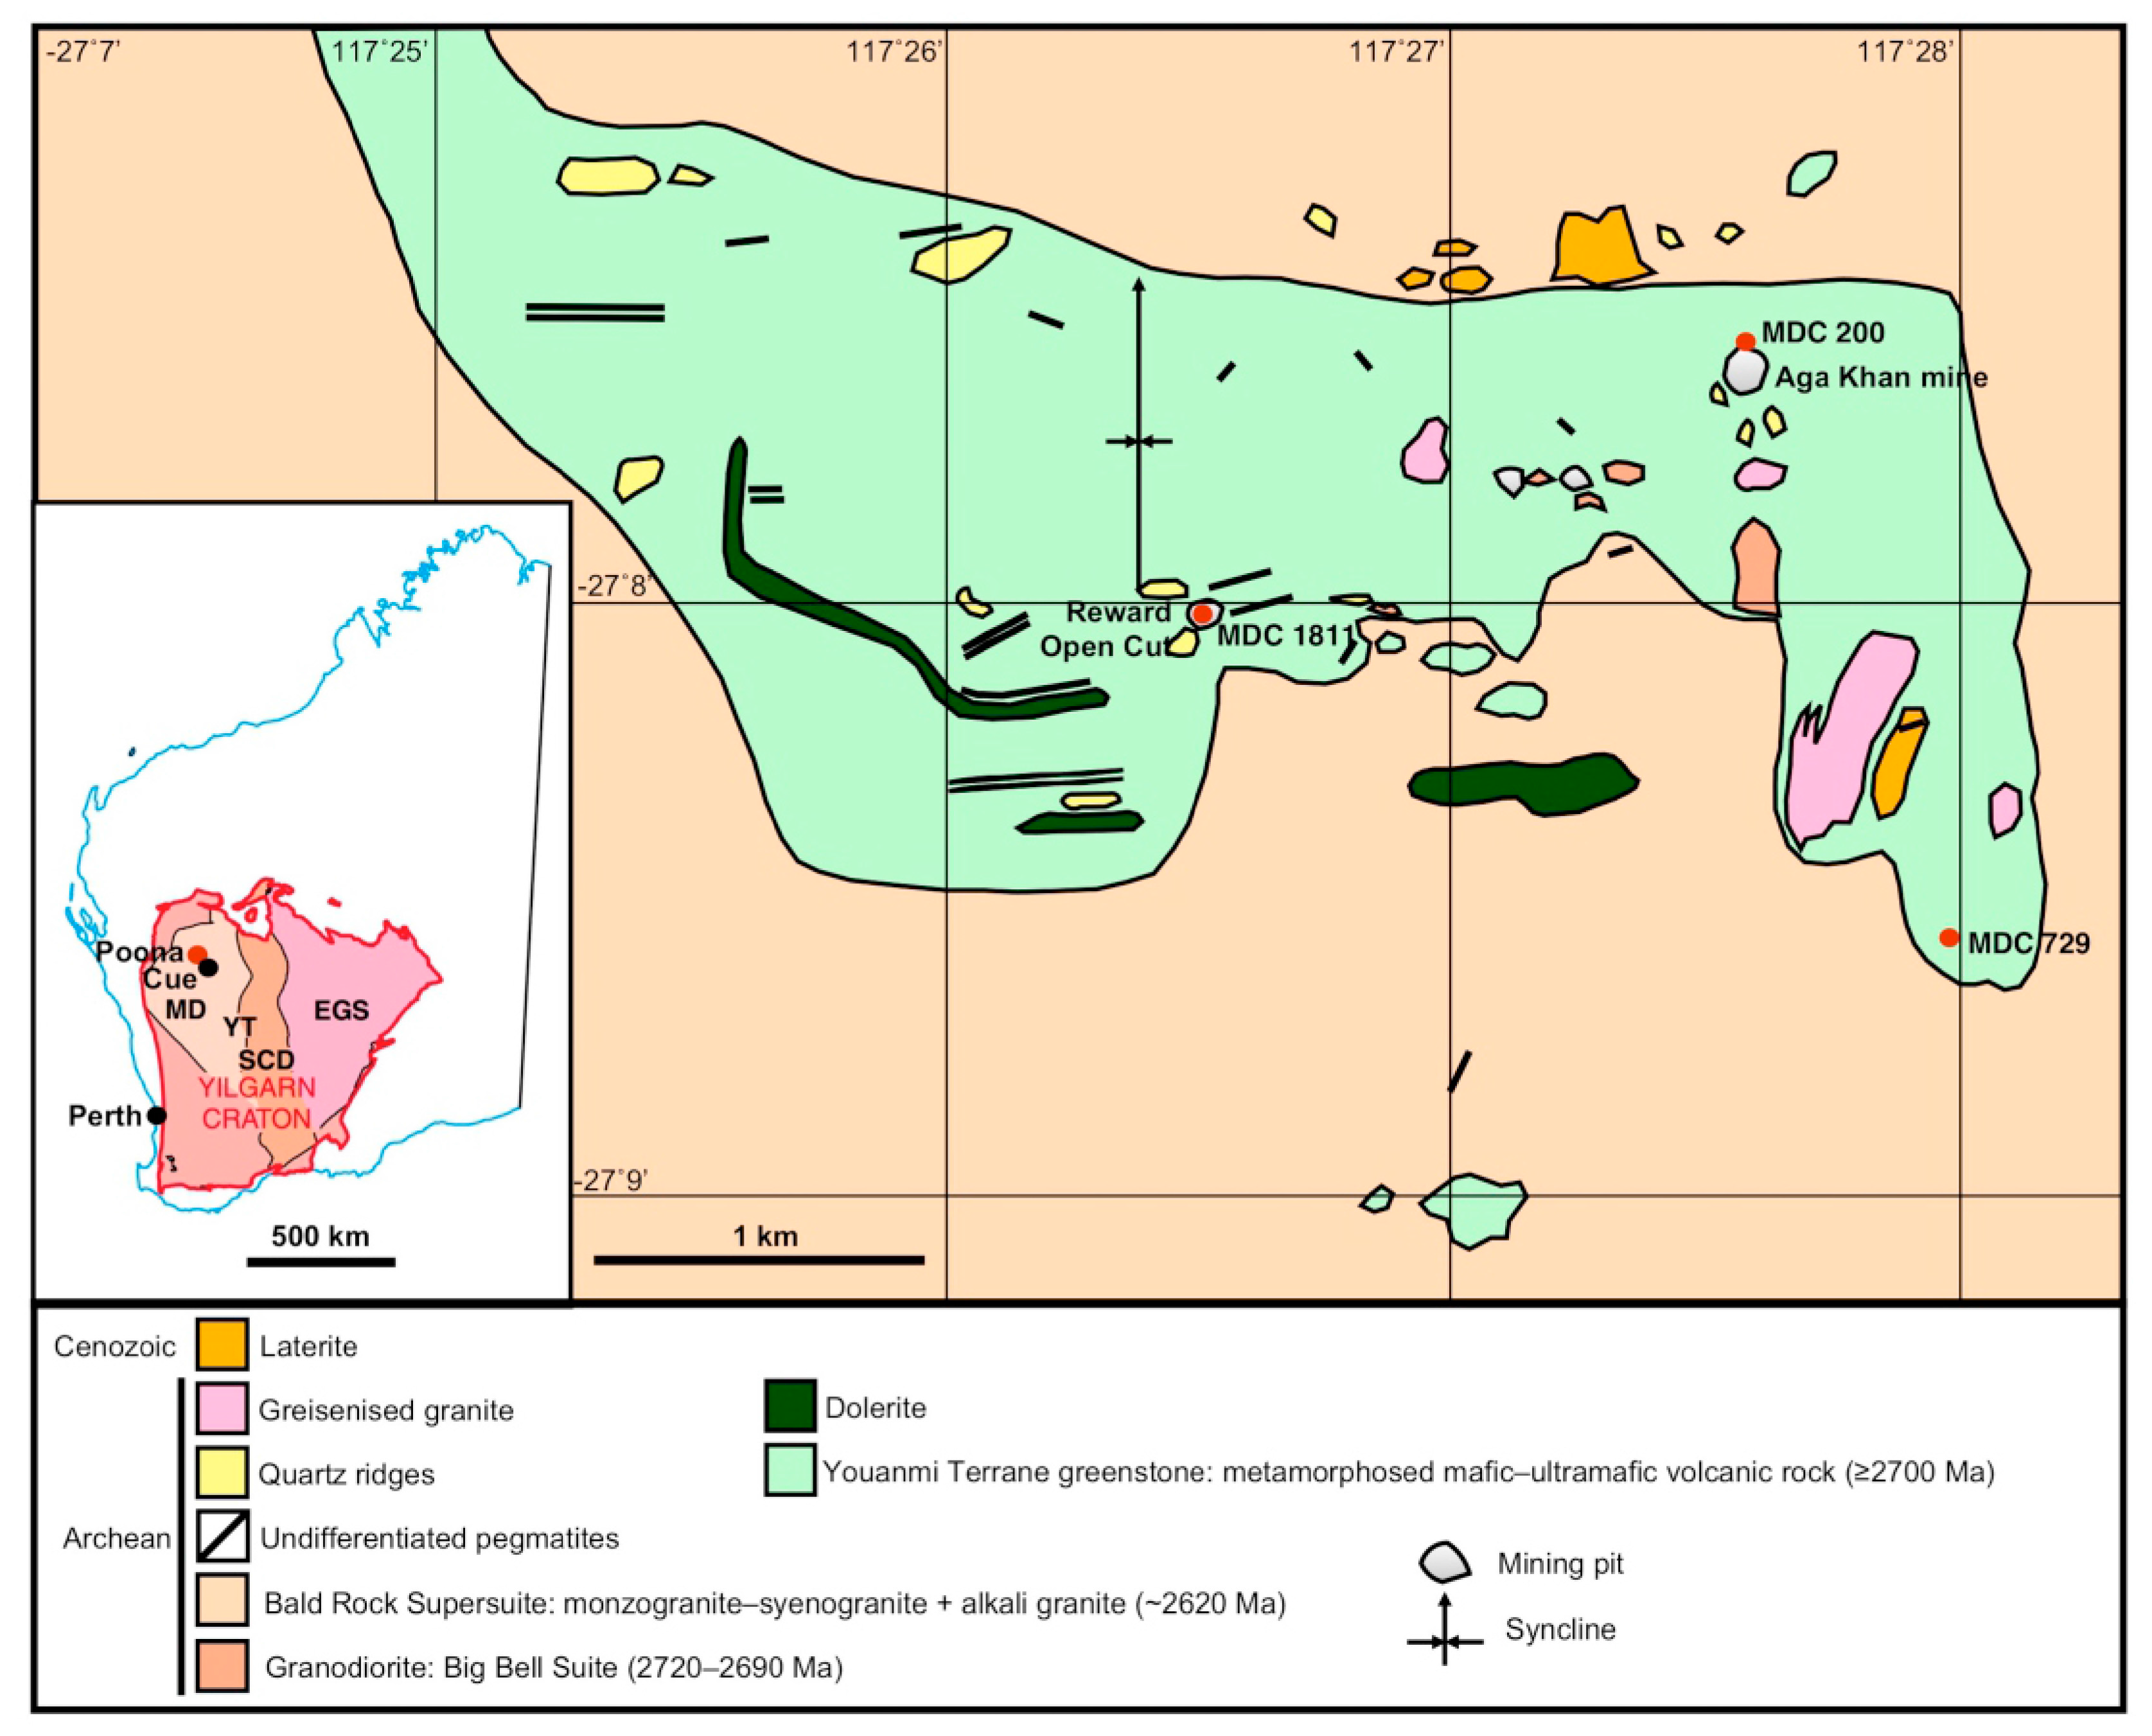
2. Geological Setting
- (a)
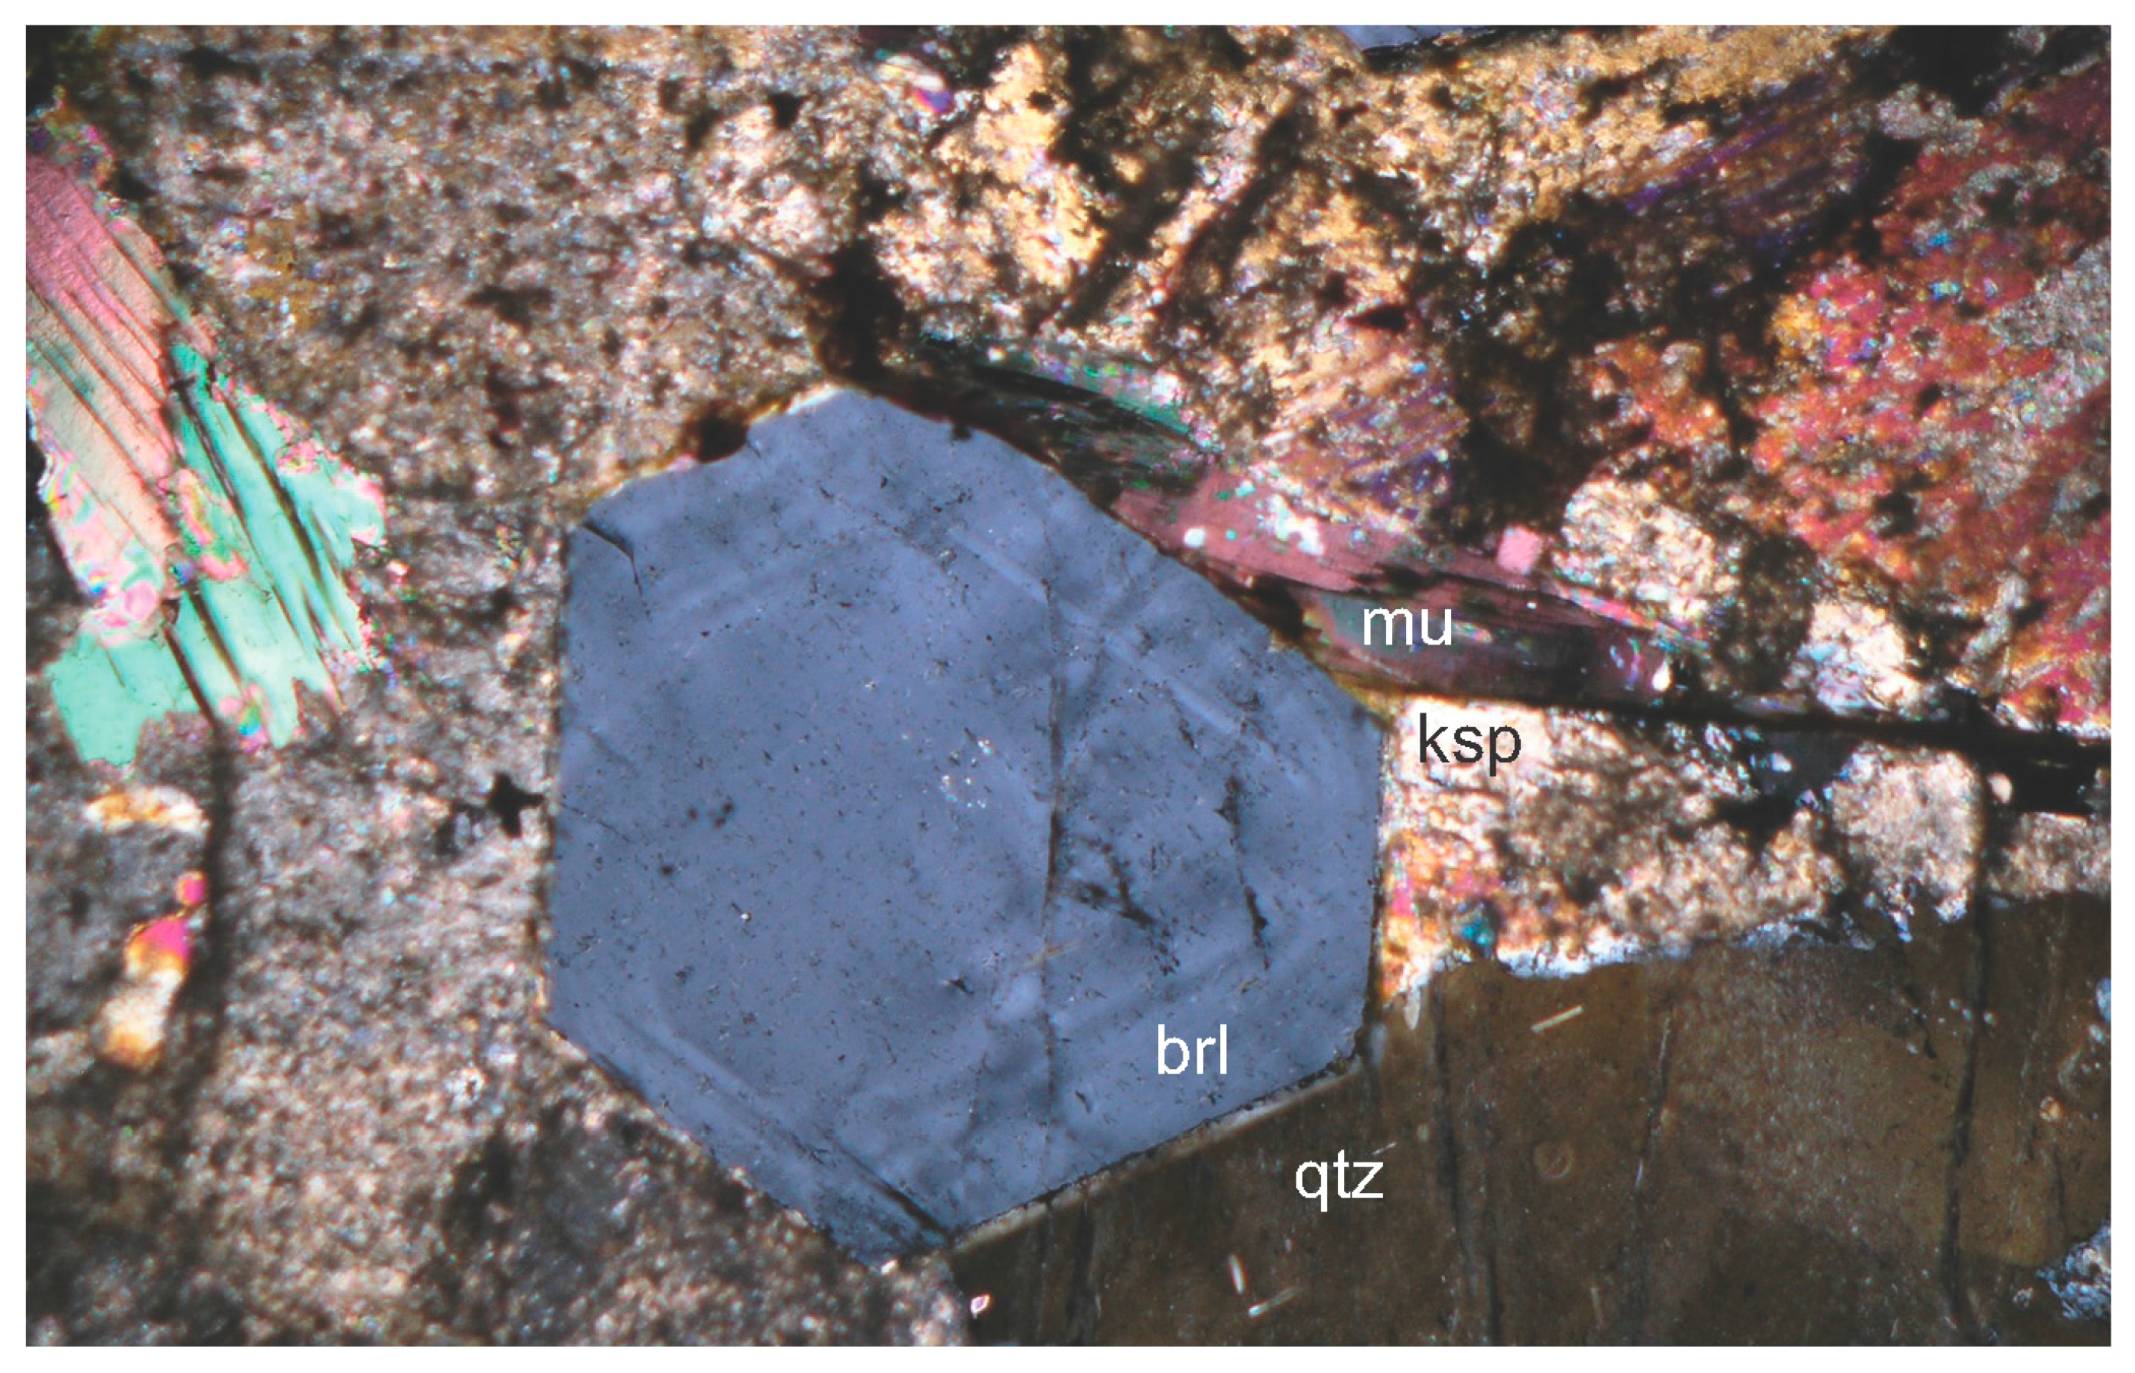
- Emerald associated with quartz–feldspar pegmatites of the Poona pegmatite field [21]. These pegmatites are poorly zoned to unzoned and contain quartz, albite, microcline, oligoclase, beryl, muscovite and garnet [21]. They are generally enclosed by phlogopite schist and emeralds are most common proximal to pegmatite-schist contacts. The deepest green emeralds occur in the phlogopite schists adjacent to the pegmatites [3]. Lithium-bearing pegmatites also occur in the area and can contain white to light green beryl (not emerald) associated with lepidolite, cassiterite, columbite–tantalite, fluorite, garnet and apatite [21]. The distinction between the emerald–beryl-bearing and Li-bearing pegmatites suggests that there were at least two generations of pegmatite emplacement in the Poona field derived from different source magmas [4].
- (b)
- Emerald associated with ruby, sapphire, topaz, alexandrite and chrysoberyl occurs in banded quartz–muscovite–fluorite–margarite–beryl greisen veins in phlogopite matrix. Accessory minerals include zircon, monazite, cassiterite, apatite, chlorite and plagioclase. Deep green emerald is rare in this style of mineralisation where beryl is commonly colourless to light green.
- (c)
- Quartz–margarite–topaz veins and lenses in phlogopite schist (Poona East emerald mine). Emerald occurs hosted by phlogopite schist adjacent to the margins of these veins. Crystals vary from light green to deep green and may be zoned. These quartz–margarite–topaz veins probably were originally beryl, lepidolite and zinnwaldite-bearing pegmatites that contained accessory ferrotantalite–ferrocolumbite.
3. Materials and Methods
3.1. Sampling
3.2. Mineral Composition Data
3.3. Fluid Inclusion Measurements
3.4. Stable Isotope Measurements
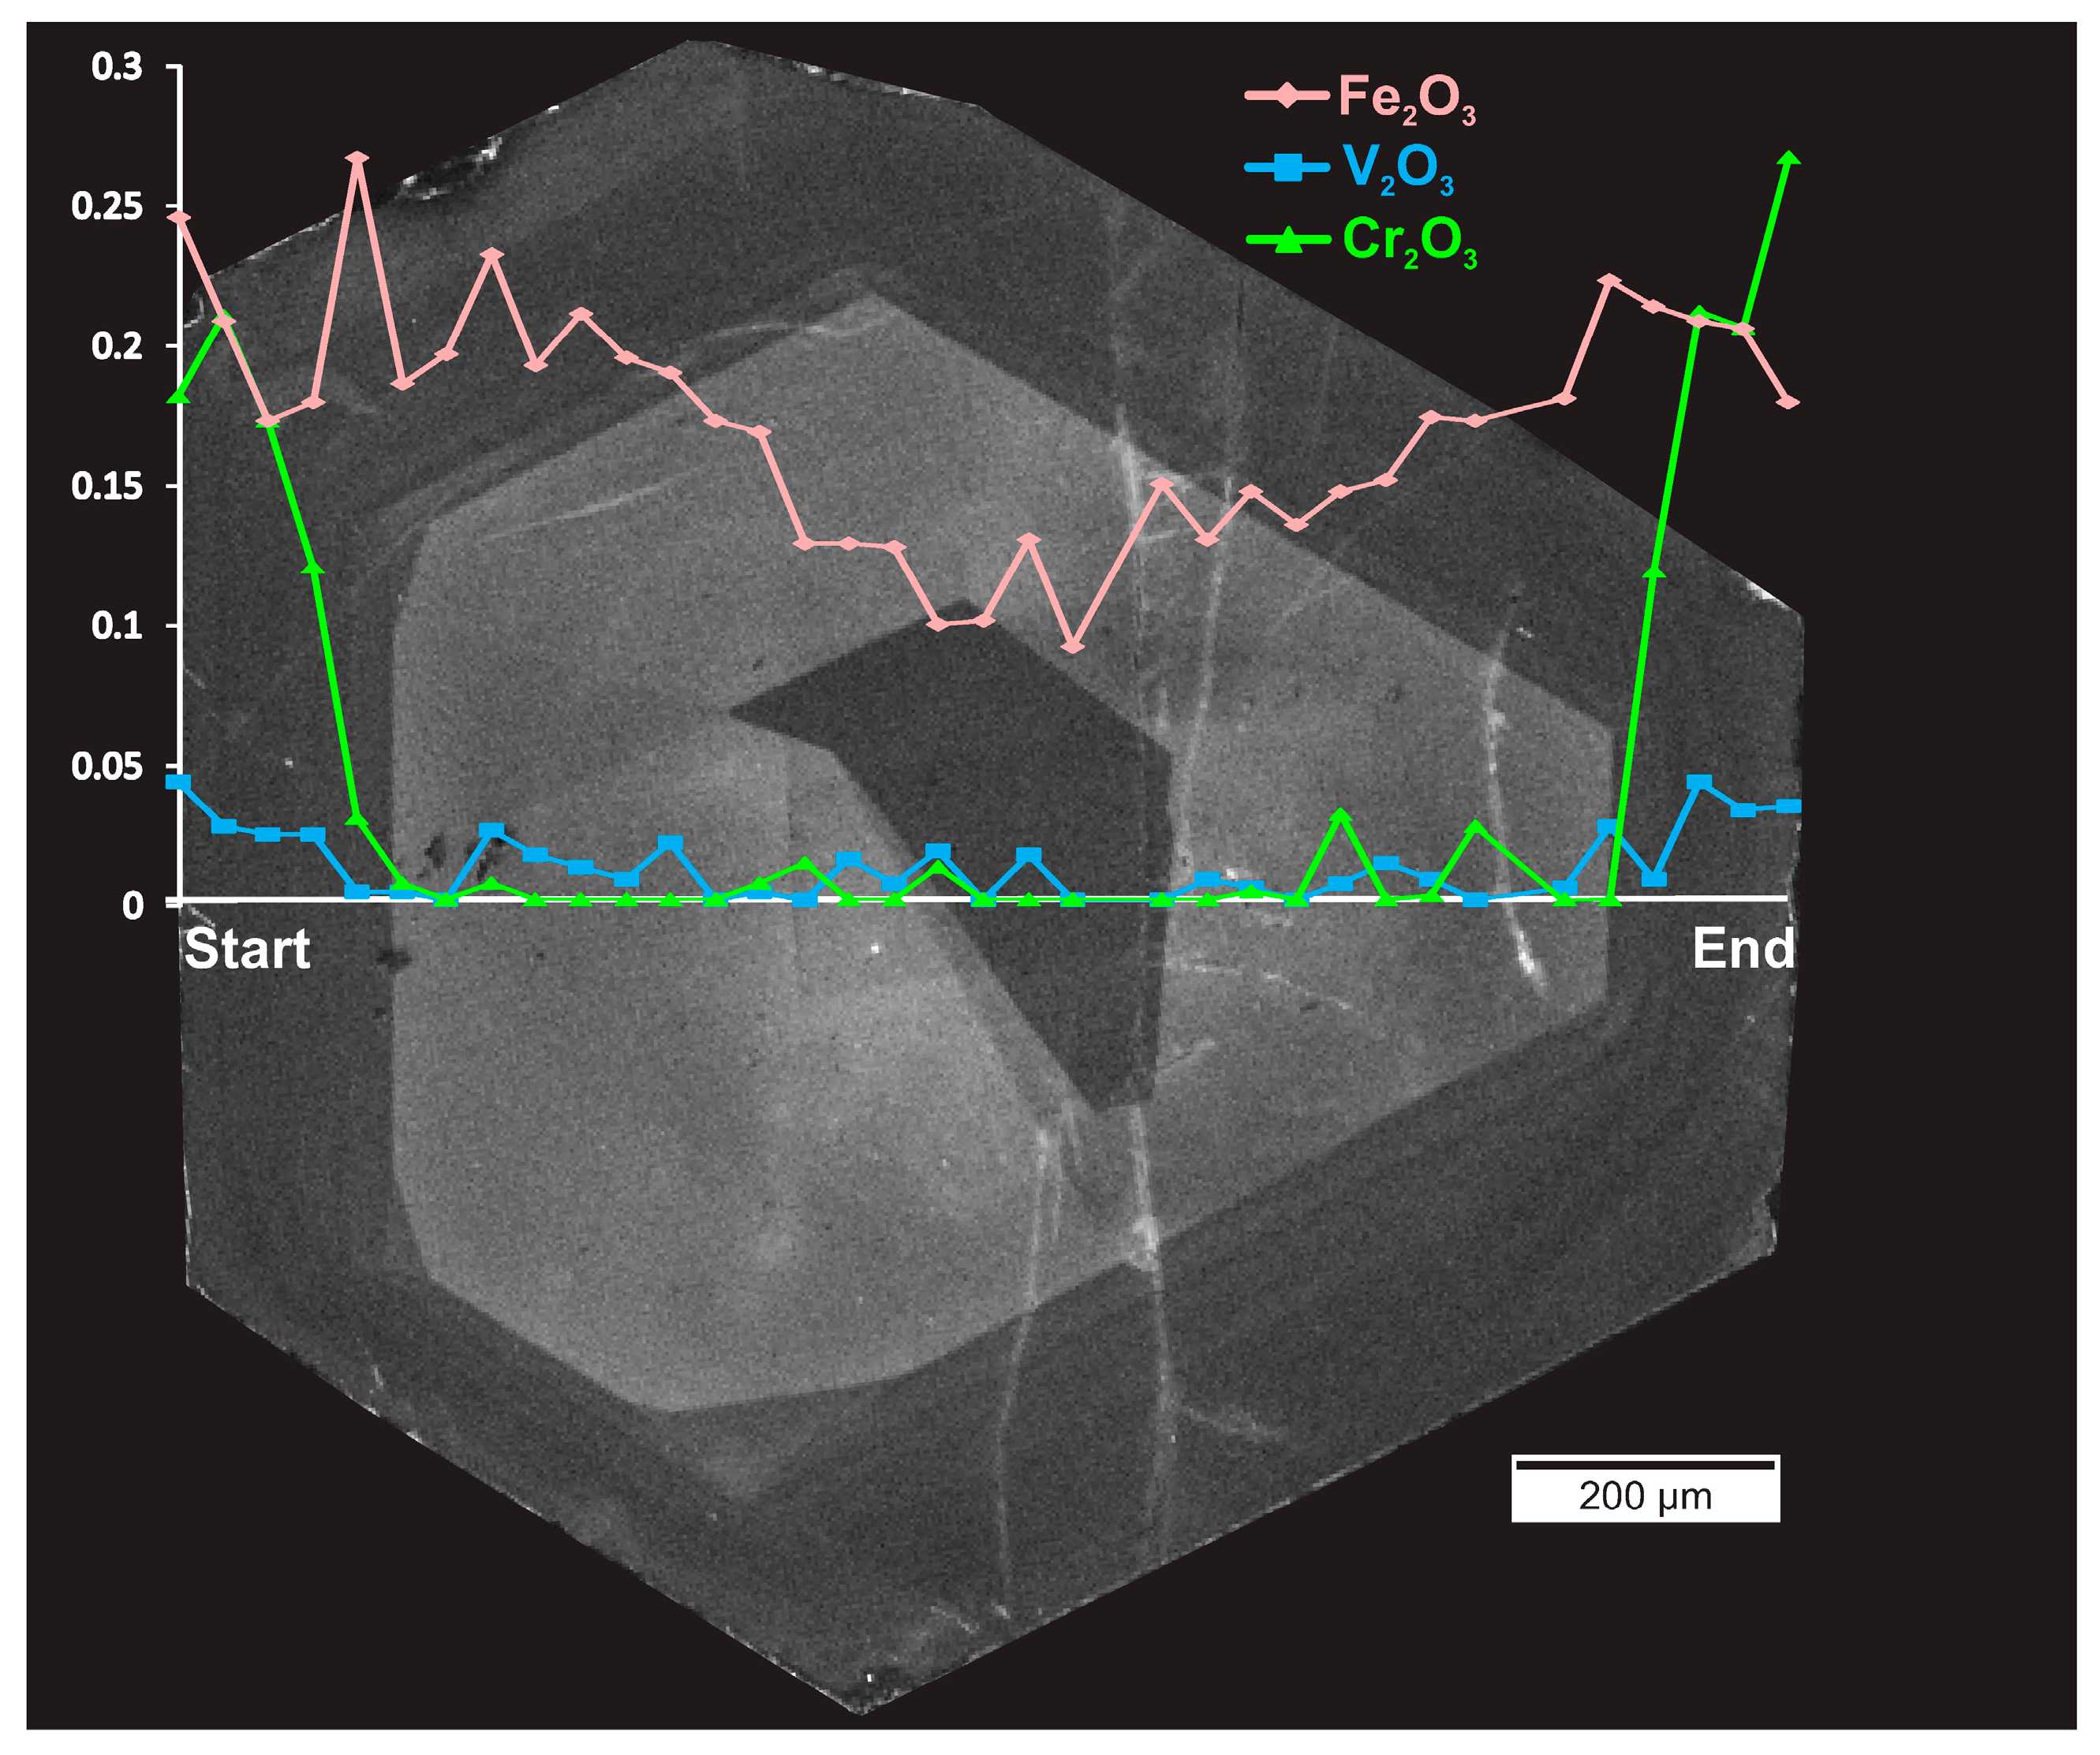
4. Emerald Petrography and Composition
5. Fluid Inclusions
Microthermometry
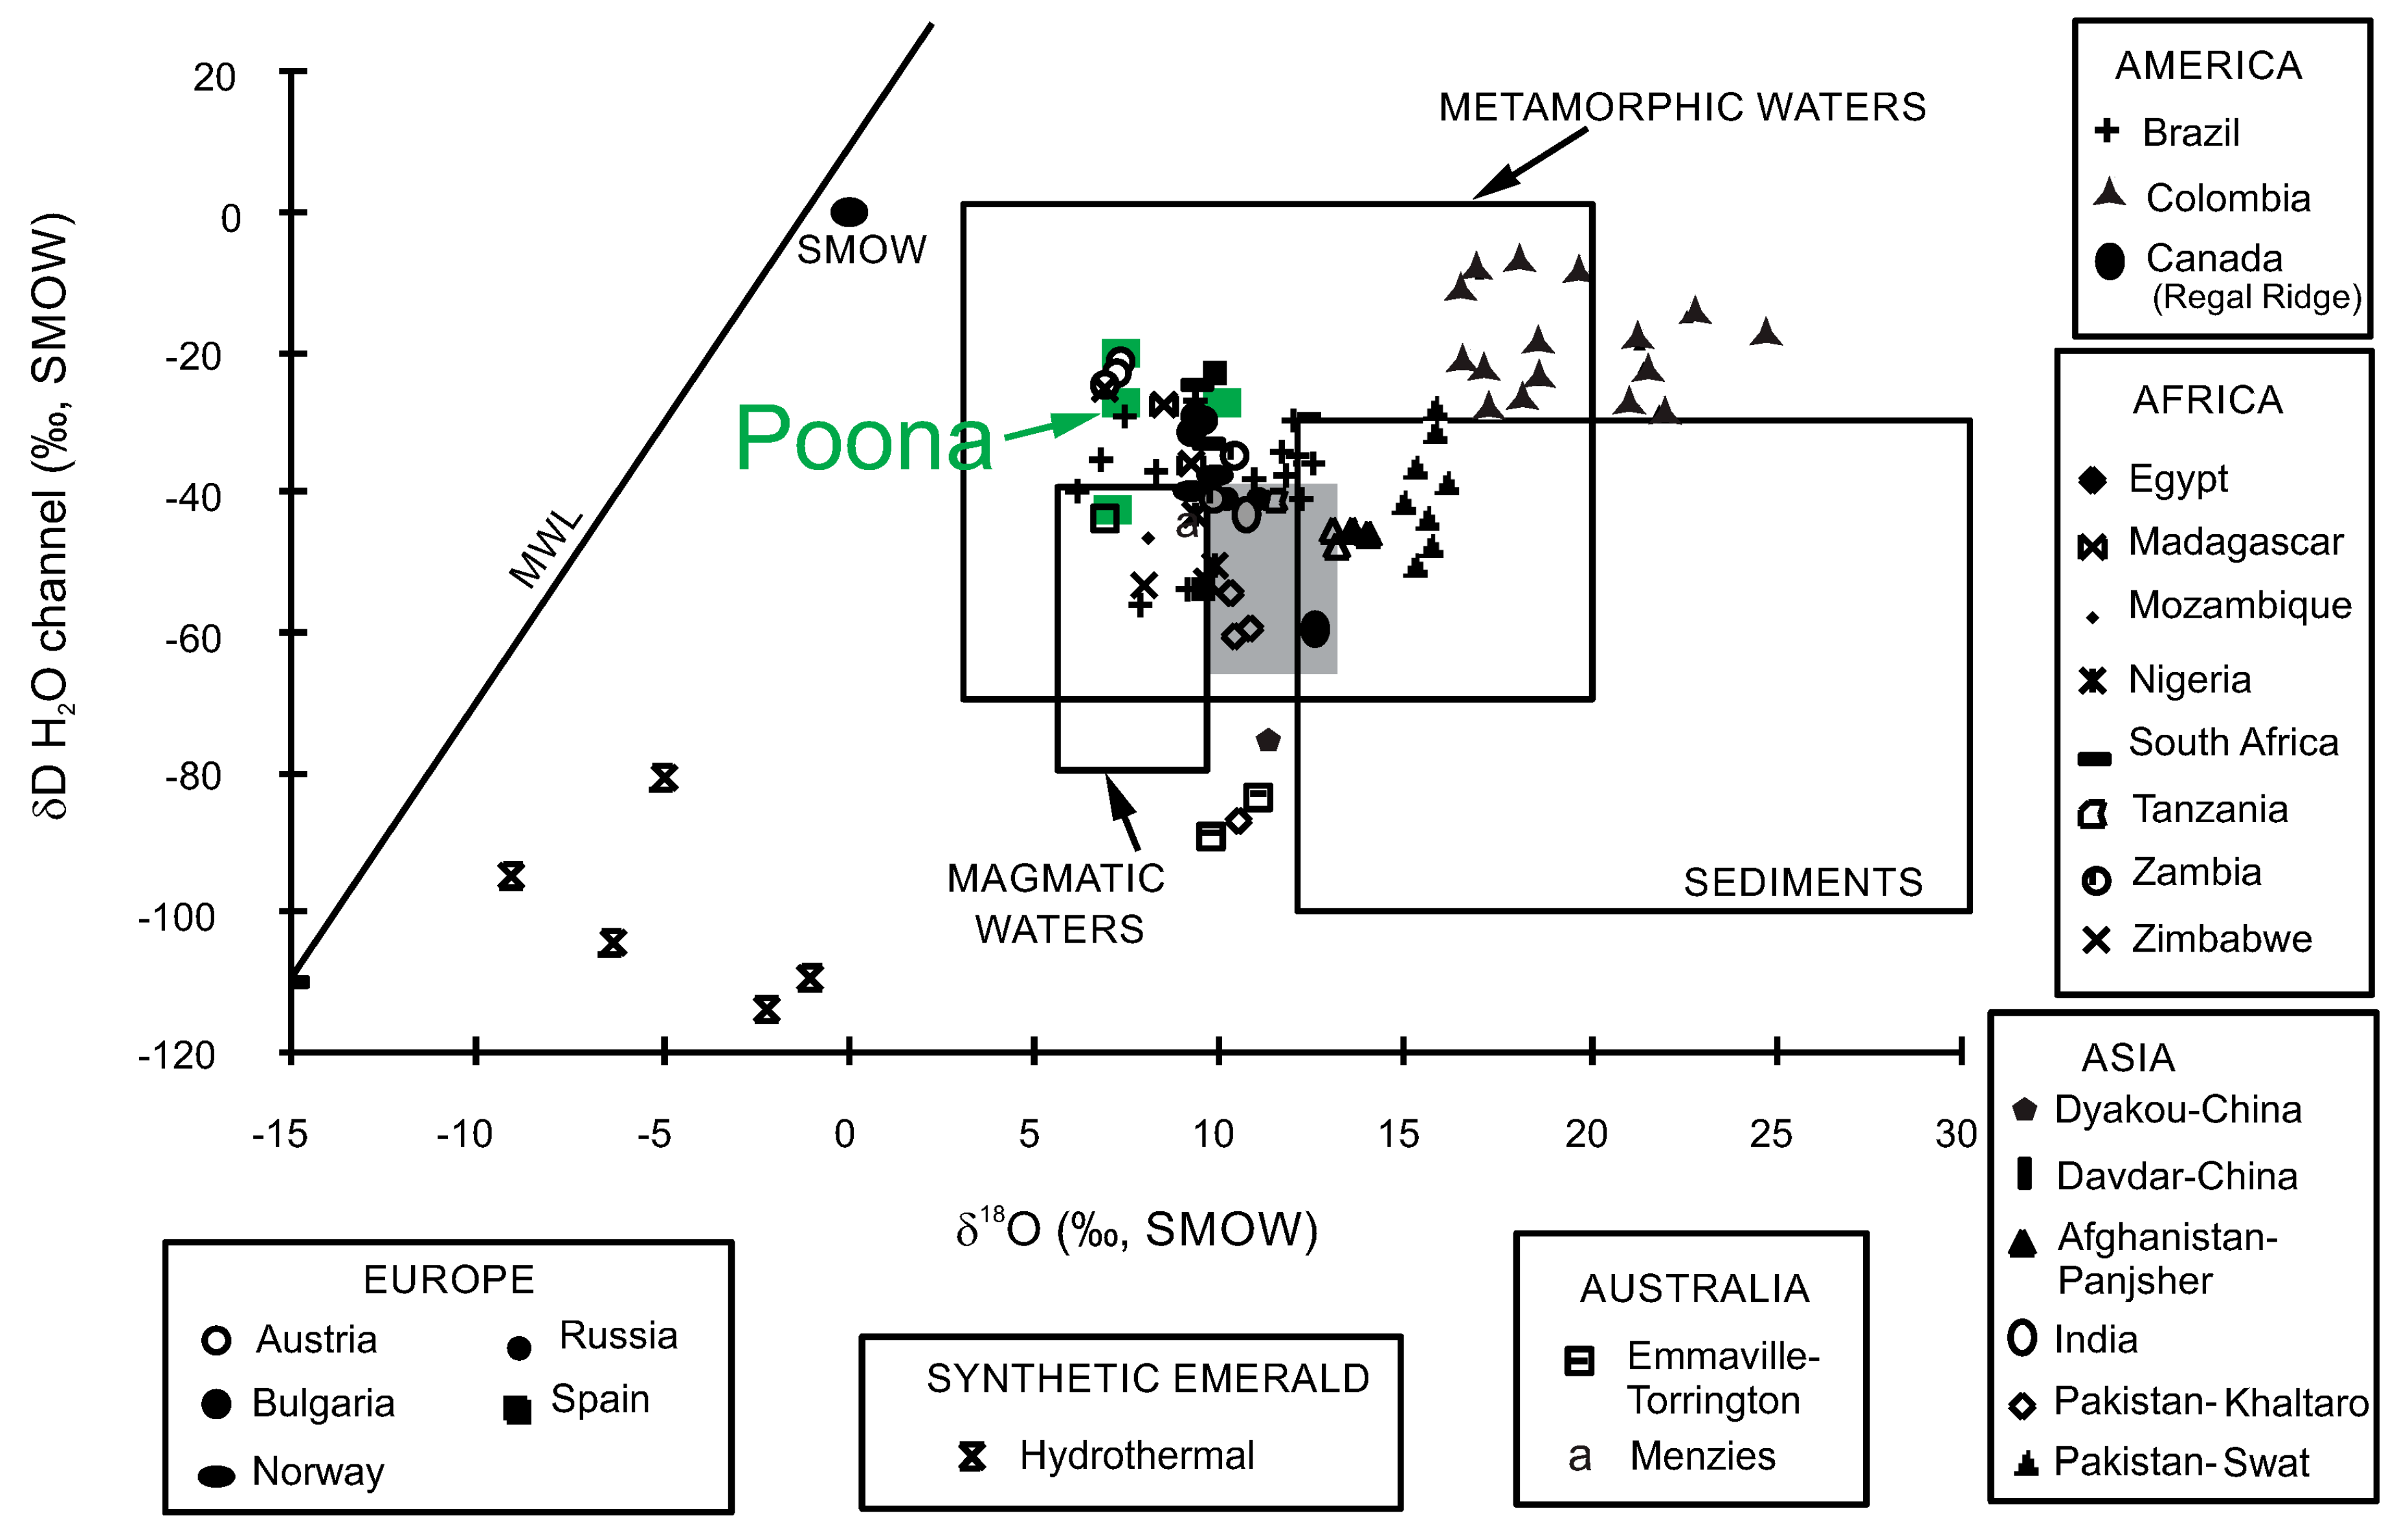
6. Stable Isotopes
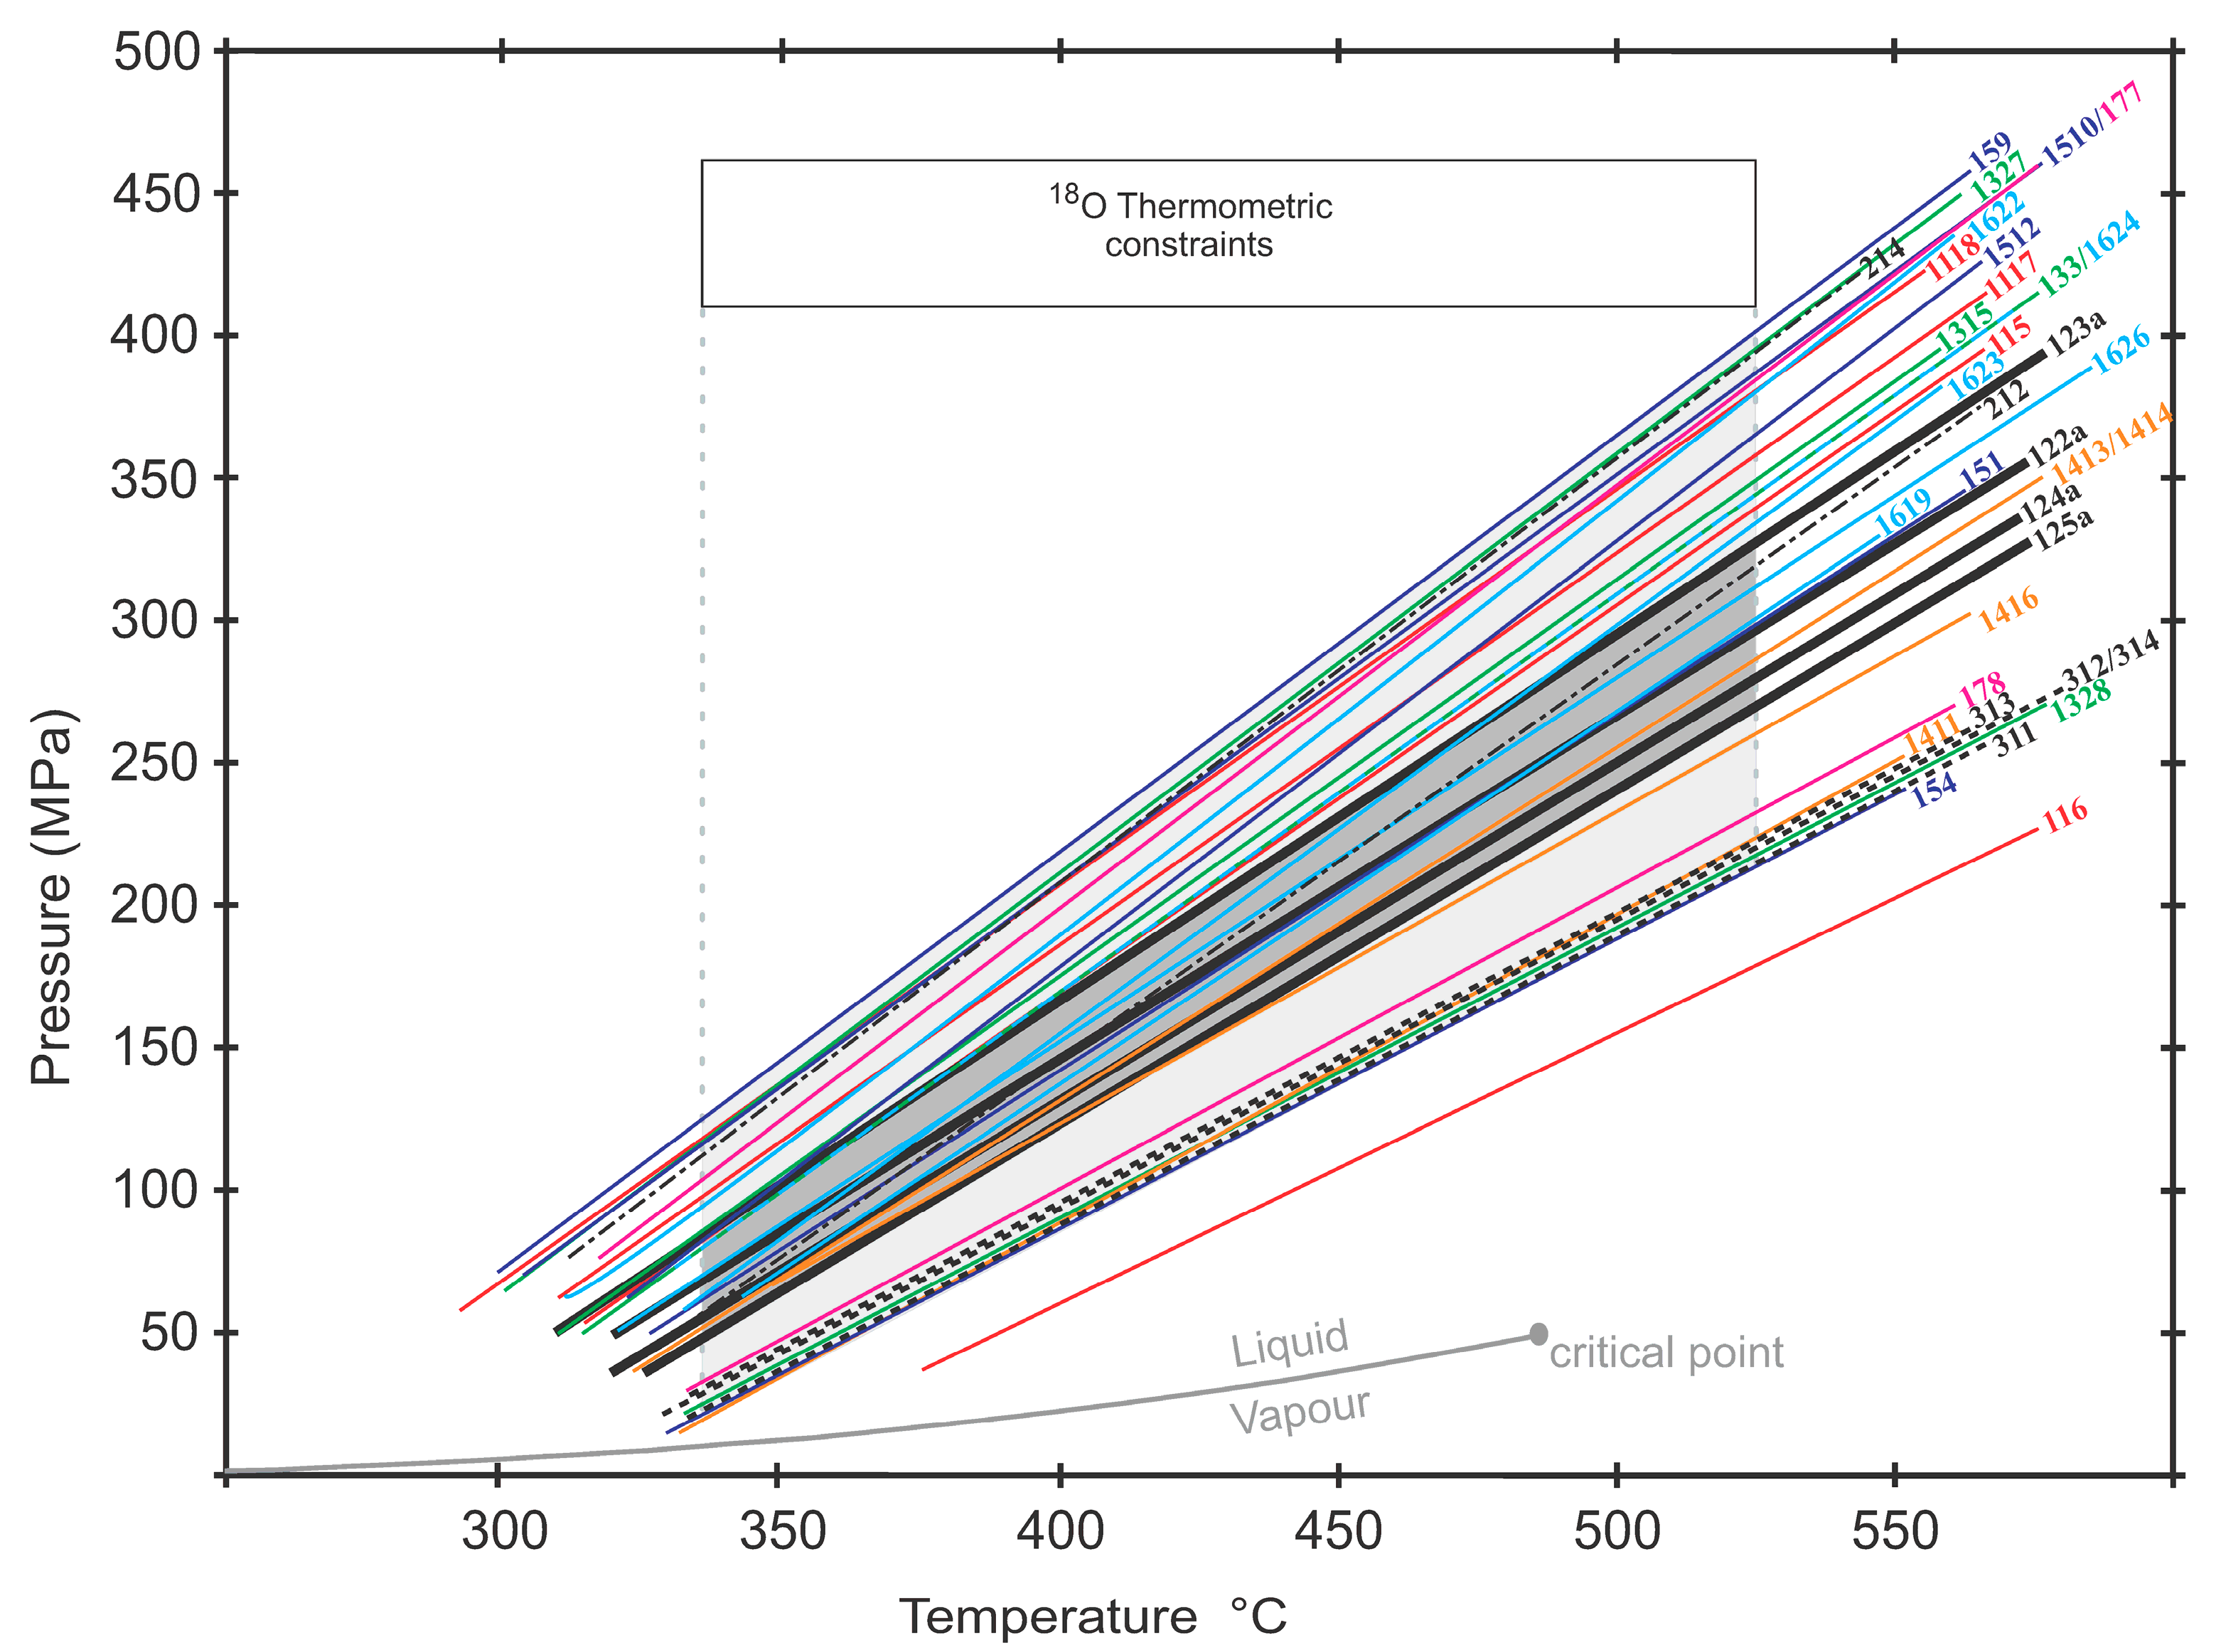
7. Pressure–Temperature–Fluid Constraints
8. Discussion
9. Conclusions
Acknowledgments
Author Contributions
Conflicts of Interest
References
- Sorby, H.C. On the microscopical structure of crystals, indicating the origin of minerals and rocks. Geol. Soc. Lond. 1858, 14, 453–500. [Google Scholar] [CrossRef]
- Brewster, D. On the existence of two new fluids in the cavities of minerals, which are immiscible, and possess remarkable physical properties. Trans. R. Soc. Edinb. 1826, 10, 1–45. [Google Scholar] [CrossRef]
- Simpson, E.S. Minerals of Western Australia; Western Australia Government Printer: Perth, Australia, 1948.
- Franchitto, A. Emerald, Green- and Colourless-Beryl Mineralization at Poona, Murchison Province, Western Australia; University of Western Australia: Crawley, Australia, 1990. [Google Scholar]
- Schwarz, D.; Giuliani, G. Emerald Deposits—A review. Aust. Gemmol. 2001, 21, 17–23. [Google Scholar]
- Groat, L.A.; Giuliani, G.; Marshall, D.D.; Turner, D. Emerald deposits and occurrences: A review. Ore Geol. Rev. 2008, 34, 87–112. [Google Scholar] [CrossRef]
- Loughrey, L.; Marshall, D.; Ihlen, P.; Jones, P. Boiling as a mechanism for colour zonations observed at the Byrud emerald deposit, Eidsvoll, Norway: Fluid inclusion and stable isotope and Ar-Ar studies. Geofluids 2013, 13, 542–558. [Google Scholar] [CrossRef]
- Grundmann, G.; Morteani, G. Emerald mineralization during regional metamorphism: The Habachtal (Austria) and Leysdorp (Transvaal, South Africa) deposits. Econ. Geol. 1989, 84, 1835–1849. [Google Scholar] [CrossRef]
- Ottaway, T.; Wicks, F.; Bryndzia, L.; Keyser, T.K.; Spooner, E.T.C. Formation of the Muzo hydrothermal emerald deposit in Colombia. Nature 1994, 369, 552–554. [Google Scholar] [CrossRef]
- Giuliani, G.; Cheilletz, A.; Arboleda, C.; Carrillo, V.; Rueda, F.; Baker, J.H. An evaporitic origin of the parent brines of Colombian emeralds: Fluid inclusion and sulphur isotopic evidence. Eur. J. Mineral. 1995, 7, 151–165. [Google Scholar]
- Hewton, M.; Marshall, D.; Ootes, L.; Loughrey, L.; Creaser, R. Colombian-style emerald mineralization in the northern Canadian Cordillera: Integration into a regional Paleozoic fluid flow regime. Can. J. Earth Sci. 2013, 50, 857–871. [Google Scholar] [CrossRef]
- Van Kranendonk, M.J.; Ivanic, T.J. A new lithostratigraphic scheme for the northeastern Murchison Domain, Yilgarn Craton. Geol. Surv. West. Aust. Annu. Rev. 2009, 2007, 35–53. [Google Scholar]
- Graindorge, J.M. A gemmological study of emerald from Poona, Western Australia. Aust. Gemmol. 1974, 12, 75–80. [Google Scholar]
- Keeling, J. Review of a new theory on emerald formation in schist-hosted deposits. Aust. Gemmol. 1991, 17, 440–442. [Google Scholar]
- Grundmann, G.; Morteani, G. Alexandrite, emerald, sapphire, ruby and topaz in a biotite-phlogopite fels from the Poona, Cue district, Western Australia. Aust. Gemmol. 1998, 20, 159–167. [Google Scholar]
- Schwarz, D. Australian emeralds. Aust. Gemmol. 1991, 17, 488–501. [Google Scholar]
- Roedder, E. Fluid Inclusions; Mineralogical Society of America: Chantilly, VA, USA, 1984. [Google Scholar]
- Goldstein, R. Petrographic Analysis of Fluid Inclusions. In Fluid Inclusions: Analysis and Interpretation; Samson, I., Anderson, A., Marshall, D., Eds.; Mineralogical Association of Canada: Quebec City, QC, Canada, 2003; Volume 32, pp. 9–53. [Google Scholar]
- Van Kranendonk, M.J.; Ivanic, T.J.; Wingate, M.T.D.; Kirkland, C.L.; Wyche, S. Long-lived, autochthonous development of the Archean Murchison Domain, and implications for Yilgarn Craton tectonics. Precambr. Res. 2013, 229, 49–92. [Google Scholar] [CrossRef]
- Ivanic, T.J.; van Kranendonk, M.J.; Kirkland, C.L.; Wyche, S.; Wingate, M.T.D.; Belousova, E.A. Zircon Lu-Hf isotopes and granite geochemistry of the Murchison Domain of the Yilgarn Craton: Evidence for reworking of Eoarchean crust during Meso-Neoarchean plume-driven magmatism. Lithos 2012, 148, 112–127. [Google Scholar] [CrossRef]
- Jacobson, M.I.; Calderwood, M.A.; Grguric, B.A. Guidebook to the Pegmatites of Western Australia; Hesperian Press: Perth, Australia, 2007. [Google Scholar]
- Kyser, T.K.; O’Neil, J.R. Hydrogen isotope systematics of submarine basalt. Geochim. Cosmochim. Acta 1984, 48, 2123–2133. [Google Scholar] [CrossRef]
- Taylor, R.P.; Fallick, A.E.; Breaks, F.W. Volatile evolution in Archean rare-element granitic pegmatites: Evidence from the hydrogen-isotopic composition of channel H2O in beryl. Can. Mineral. 1992, 30, 877–893. [Google Scholar]
- Clayton, R.; Mayeda, T. The use of bromine pentafluoride in the extraction of oxygen from oxides and silicates for isotopic analysis. Geochim. Cosmochim. Acta 1963, 27, 43–52. [Google Scholar] [CrossRef]
- Loughrey, L.; Marshall, D.; Jones, P.; Millsteed, P.; Main, A. Pressure-temperature-fluid constraints for the Emmaville-Torrington emerald deposit, New South Wales, Australia: Fluid inclusion and stable isotope studies. Cent. Eur. J. Earth Sci. 2012, 4, 287–299. [Google Scholar] [CrossRef]
- Zimmermann, J.; Giuliani, G.; Cheilletz, A.; Arboleda, C. Mineralogical significance of fluids in channels of Colombian emeralds: A mass-spectrometric study. Int. Geol. Rev. 1997, 39, 425–437. [Google Scholar] [CrossRef]
- Marshall, D.; Pardieu, V.; Loughrey, L.; Jones, P.; Xue, G. Conditions for emerald formation at Davdar, China; fluid inclusion, trace element and stable isotope studies. Mineral. Mag. 2012, 76, 213–226. [Google Scholar] [CrossRef]
- Giuliani, G.; France-Lanord, C.; Zimmerman, J.L.; Cheilletz, A.; Arboleda, C.; Charoy, B.; Coget, P.; Fontan, F.; Giard, D. Fluid composition, δD of channel H2O and δ18O of lattice oxygen in beryls: Genetic implications for Brazilian, Colombian, and Afghanistani emerald deposits. Int. Geol. Rev. 1997, 39, 400–424. [Google Scholar] [CrossRef]
- Giuliani, G.; France-Lanord, C.; Coget, P.; Schwarz, D.; Cheilletz, A.; Branquet, Y.; Giard, D.; Martin-Izard, A.; Alexandrov, P.; Piat, D.H. Oxygen isotope systematic of emerald: Relevance of its origin and geological significance. Mineral. Depos. 1998, 31, 513–519. [Google Scholar] [CrossRef]
- Wood, D.L.; Nassau, K. The characterization of beryl and emerald by visible and infrared absorption spectroscopy. Am. Mineral. 1968, 53, 777–800. [Google Scholar]
- Xue, G.; Marshall, D.; Zhang, S.; Ullrich, T.; Bishop, T.; Groat, L.; Thorkelson, D.; Giuliani, G.; Fallick, A. Conditions for Early Cretaceous emerald formation at Dyakou, China: Fluid Inclusion, Ar-Ar, and stable isotope studies. Econ. Geol. 2010, 105, 375–394. [Google Scholar] [CrossRef]
- Marshall, D.; Groat, L.; Falck, H.; Giuliani, G.; Neufeld, H. The Lened emerald prospect, Northwest Territories, Canada: Insights from fluid inclusions and stable isotopes, with implications for Northern Cordilleran emerald. Can. Mineral. 2004, 42, 1523–1539. [Google Scholar] [CrossRef]
- Neufeld, H. The Tsa Da Glisza (Regal Ridge) Emerald Occurrence, Southeastern Yukon Territory, Canada: Descriptive, Genetic, and Exploration Models. Master’s Thesis, University of British Columbia, Vancouver, BC, Canada, 2004. [Google Scholar]
- Hammarstrom, J.M. Mineral Chemistry of Emeralds and Associated Minerals from Pakistan and Afghanistan: An Electron Microprobe Study. In Emeralds of Pakistan: Geology, Gemmology and Genesis; Kazmi, A.H., Snee, L.W., Eds.; Van Nostrand Reinhold: New York, NY, USA, 1989; pp. 125–500. [Google Scholar]
- Bodnar, R.J. Petrographic Analysis of Fluid Inclusions. In Fluid Inclusions: Analysis and Interpretation; Samson, I., Anderson, A., Marshall, D., Eds.; Mineralogical Association of Canada: Quebec City, QC, Canada, 2003; Volume 32, pp. 1–8. [Google Scholar]
- Bodnar, R.J. Introduction to Aqueous-Electrolyte Fluid Inclusions. In Fluid Inclusions: Analysis and Interpretation; Samson, I., Anderson, A., Marshall, D., Eds.; Mineralogical Association of Canada: Quebec City, QC, Canada, 2003; Volume 32, pp. 81–100. [Google Scholar]
- Crawford, M.L. Phase Equilibria in Aquous Fluid Inclusions. In Short Course in Fluid Inclusions: Applications to Petrology; Hollister, L.S., Crawford, M.L., Eds.; Mineralogical Association of Canada: Quebec City, QC, Canada, 1981; Volume 6, pp. 5–100. [Google Scholar]
- Oakes, C.S.; Bodnar, R.J.; Simonson, J.M. The system NaCl-CaCl2-H2O 1. The vapor-saturated ice liquidus. Geochim. Cosmochim. Acta 1990, 54, 603–610. [Google Scholar] [CrossRef]
- Sinkankas, J. Emerald and Other Beryls; Chilton Book Co.: Radnor, PA, USA, 1981. [Google Scholar]
- Kazmi, A.H.; Snee, L.W. Geology of the World Emerald Deposits: A Brief Review. In Emeralds of Pakistan: Geology, Gemmology and Genesis; Kazmi, A.H., Snee, L.W., Eds.; Van Nostrand Reinhold: New York, NY, USA, 1989; pp. 165–228. [Google Scholar]
- Groat, L.A.; Giuliani, G.; Marshall, D.D.; Turner, D. Emerald. In Geology of Gem Deposits; Groat, L.A., Ed.; Mineralogical Association of Canada: Quebec City, QC, Canada, 2014; Volume 44, pp. 135–174. [Google Scholar]
- Sheppard, S.M.F. Characterisation and Isotopic Variations in Natural Waters. In Stable Isotopes in High Temperature Geological Processes; Valley, J.W., Taylor, H.P., O’Neil, J.R., Eds.; Mineralogical Society of American Review Mineralogical Bookcrafters, Inc.: Chelsea, MI, USA, 1986; Volume 16, pp. 165–183. [Google Scholar]
- Bakker, R.J. Package FLUIDS 1. Computer programs for analysis of fluid inclusion data and for modelling bulk fluid properties. Chem. Geol. 2003, 194, 3–23. [Google Scholar] [CrossRef]
- London, D. The origin of primary textures in granitic pegmatites. Can. Mineral. 2009, 47, 697–724. [Google Scholar] [CrossRef]
- Schwarz, D.; Giuliani, G.; Grundmann, G.; Glas, M. Die Entstehung der Smaragde, ein Vieldisskutiertes Thema. In Smaragd, der kostbarste Beryll, der teuerste Edelstein; Schwarz, D., Hochleitner, R., Eds.; ExtraLapis Verlag: Munich, Germany, 2001; Volume 21, pp. 68–73. [Google Scholar]


| Oxide | Trav 1 | Trav 2 | Trav 3 | Trav 4 | Trav 5 | Trav 6 | Trav 7 | Trav 8 | Trav 9 | Trav 10 | Trav 11 | Trav 12 | Trav 13 | Trav 14 | Trav 15 | Trav 16 | Trav 17 | Trav 18 |
| SiO2 | 66.49 | 65.93 | 66.30 | 65.87 | 65.62 | 65.65 | 65.76 | 66.17 | 65.89 | 66.71 | 65.45 | 65.78 | 66.38 | 66.49 | 66.71 | 66.29 | 65.01 | 65.66 |
| TiO2 | 0.01 | 0.00 | 0.01 | 0.00 | 0.00 | 0.02 | 0.01 | 0.01 | 0.00 | 0.01 | 0.00 | 0.00 | 0.00 | 0.01 | 0.01 | 0.00 | 0.02 | 0.00 |
| Al2O3 | 18.00 | 17.84 | 17.90 | 17.72 | 17.88 | 18.31 | 18.16 | 18.49 | 18.14 | 18.34 | 18.36 | 18.24 | 18.37 | 18.20 | 18.32 | 18.33 | 18.20 | 18.16 |
| Sc2O3 | 0.01 | 0.01 | 0.00 | 0.00 | 0.02 | 0.02 | 0.02 | 0.02 | 0.03 | 0.01 | 0.02 | 0.01 | 0.02 | 0.02 | 0.02 | 0.01 | 0.02 | 0.00 |
| V2O3 | 0.04 | 0.03 | 0.02 | 0.02 | 0.00 | 0.00 | 0.00 | 0.03 | 0.02 | 0.01 | 0.01 | 0.02 | 0.00 | 0.00 | 0.00 | 0.01 | 0.01 | 0.02 |
| Cr2O3 | 0.18 | 0.21 | 0.17 | 0.12 | 0.03 | 0.01 | 0.00 | 0.01 | 0.00 | 0.00 | 0.00 | 0.00 | 0.00 | 0.01 | 0.01 | 0.00 | 0.00 | 0.01 |
| BeO | 18.82 | 13.70 | 13.76 | 13.64 | 13.64 | 13.68 | 13.68 | 13.80 | 13.70 | 13.86 | 13.65 | 13.70 | 13.81 | 13.81 | 13.86 | 13.79 | 13.56 | 13.65 |
| MgO | 0.23 | 0.25 | 0.22 | 0.15 | 0.25 | 0.12 | 0.12 | 0.13 | 0.13 | 0.12 | 0.12 | 0.12 | 0.13 | 0.13 | 0.13 | 0.13 | 0.13 | 0.10 |
| CaO | 0.00 | 0.01 | 0.00 | 0.01 | 0.01 | 0.01 | 0.01 | 0.01 | 0.01 | 0.00 | 0.01 | 0.01 | 0.01 | 0.00 | 0.00 | 0.01 | 0.00 | 0.01 |
| MnO | 0.00 | 0.00 | 0.00 | 0.00 | 0.00 | 0.00 | 0.00 | 0.00 | 0.00 | 0.00 | 0.00 | 0.00 | 0.01 | 0.00 | 0.00 | 0.00 | 0.00 | 0.00 |
| FeO | 0.23 | 0.19 | 0.15 | 0.16 | 0.25 | 0.17 | 0.18 | 0.21 | 0.17 | 0.19 | 0.18 | 0.17 | 0.15 | 0.15 | 0.11 | 0.11 | 0.11 | 0.08 |
| Na2O | 0.33 | 0.33 | 0.29 | 0.25 | 0.33 | 0.25 | 0.26 | 0.25 | 0.25 | 0.25 | 0.26 | 0.29 | 0.28 | 0.29 | 0.28 | 0.30 | 0.29 | 0.28 |
| K2O | 0.02 | 0.03 | 0.02 | 0.01 | 0.01 | 0.02 | 0.01 | 0.01 | 0.00 | 0.01 | 0.01 | 0.02 | 0.01 | 0.02 | 0.01 | 0.01 | 0.02 | 0.02 |
| Rb2O | 0.00 | 0.00 | 0.00 | 0.00 | 0.00 | 0.00 | 0.00 | 0.00 | 0.00 | 0.00 | 0.00 | 0.00 | 0.00 | 0.00 | 0.00 | 0.00 | 0.00 | 0.00 |
| Cs2O | 0.06 | 0.06 | 0.08 | 0.09 | 0.23 | 0.12 | 0.12 | 0.14 | 0.12 | 0.09 | 0.12 | 0.12 | 0.11 | 0.11 | 0.12 | 0.10 | 0.10 | 0.09 |
| H2O a | 1.58 | 1.59 | 1.52 | 1.43 | 1.60 | 1.44 | 1.46 | 1.43 | 1.45 | 1.44 | 1.45 | 1.51 | 1.50 | 1.51 | 1.51 | 1.53 | 1.53 | 1.49 |
| Total | 101.00 | 100.16 | 100.44 | 99.48 | 99.86 | 99.81 | 99.78 | 100.69 | 99.92 | 101.06 | 99.63 | 99.99 | 100.78 | 100.74 | 101.10 | 100.62 | 99.01 | 99.58 |
| Oxide | Trav19 | Trav20 | Trav22 | Trav23 | Trav24 | Trav25 | Trav26 | Trav27 | Trav28 | Trav29 | Trav31 | Trav32 | Trav33 | Trav34 | Trav35 | Trav36 | Trav37 | |
| SiO2 | 65.87 | 66.01 | 66.11 | 65.87 | 65.67 | 66.60 | 65.70 | 66.21 | 66.34 | 65.85 | 65.82 | 66.57 | 65.99 | 66.35 | 66.24 | 66.05 | 65.91 | |
| TiO2 | 0.02 | 0.00 | 0.00 | 0.02 | 0.01 | 0.01 | 0.01 | 0.00 | 0.02 | 0.01 | 0.00 | 0.00 | 0.00 | 0.01 | 0.00 | 0.01 | 0.00 | |
| Al2O3 | 18.28 | 18.14 | 18.49 | 18.25 | 18.26 | 18.39 | 18.39 | 18.31 | 18.16 | 18.33 | 18.19 | 18.24 | 18.09 | 18.19 | 17.73 | 17.73 | 17.87 | |
| Sc2O3 | 0.01 | 0.00 | 0.00 | 0.01 | 0.02 | 0.01 | 0.02 | 0.02 | 0.01 | 0.00 | 0.02 | 0.02 | 0.02 | 0.02 | 0.02 | 0.02 | 0.01 | |
| V2O3 | 0.00 | 0.02 | 0.00 | 0.00 | 0.01 | 0.00 | 0.00 | 0.01 | 0.01 | 0.01 | 0.00 | 0.00 | 0.03 | 0.01 | 0.04 | 0.03 | 0.03 | |
| Cr2O3 | 0.00 | 0.00 | 0.00 | 0.00 | 0.00 | 0.00 | 0.00 | 0.03 | 0.00 | 0.00 | 0.03 | 0.00 | 0.00 | 0.12 | 0.21 | 0.21 | 0.27 | |
| BeO | 13.70 | 13.71 | 13.77 | 13.71 | 13.67 | 13.85 | 13.69 | 13.77 | 13.77 | 13.71 | 13.69 | 13.82 | 13.72 | 13.81 | 13.74 | 13.71 | 13.70 | |
| MgO | 0.11 | 0.10 | 0.11 | 0.12 | 0.12 | 0.11 | 0.12 | 0.11 | 0.11 | 0.11 | 0.10 | 0.12 | 0.17 | 0.20 | 0.25 | 0.26 | 0.21 | |
| CaO | 0.00 | 0.00 | 0.00 | 0.00 | 0.01 | 0.00 | 0.00 | 0.02 | 0.00 | 0.00 | 0.01 | 0.01 | 0.01 | 0.00 | 0.01 | 0.01 | 0.00 | |
| MnO | 0.00 | 0.00 | 0.00 | 0.00 | 0.00 | 0.00 | 0.00 | 0.00 | 0.00 | 0.00 | 0.00 | 0.00 | 0.00 | 0.00 | 0.01 | 0.00 | 0.00 | |
| FeO | 0.08 | 0.11 | 0.08 | 0.13 | 0.11 | 0.13 | 0.12 | 0.13 | 0.13 | 0.16 | 0.15 | 0.16 | 0.20 | 0.19 | 0.19 | 0.19 | 0.16 | |
| Na2O | 0.26 | 0.28 | 0.28 | 0.27 | 0.26 | 0.25 | 0.25 | 0.24 | 0.22 | 0.22 | 0.21 | 0.24 | 0.27 | 0.28 | 0.32 | 0.33 | 0.37 | |
| K2O | 0.01 | 0.02 | 0.02 | 0.01 | 0.01 | 0.02 | 0.01 | 0.01 | 0.02 | 0.01 | 0.01 | 0.01 | 0.01 | 0.00 | 0.02 | 0.02 | 0.00 | |
| Rb2O | 0.00 | 0.00 | 0.00 | 0.00 | 0.00 | 0.00 | 0.00 | 0.00 | 0.00 | 0.00 | 0.00 | 0.00 | 0.00 | 0.00 | 0.00 | 0.00 | 0.00 | |
| Cs2O | 0.11 | 0.11 | 0.10 | 0.11 | 0.09 | 0.08 | 0.10 | 0.09 | 0.11 | 0.09 | 0.10 | 0.11 | 0.14 | 0.19 | 0.07 | 0.04 | 0.06 | |
| H2O a | 1.46 | 1.51 | 1.51 | 1.48 | 1.46 | 1.43 | 1.43 | 1.42 | 1.38 | 1.37 | 1.35 | 1.41 | 1.48 | 1.50 | 1.57 | 1.58 | 1.65 | |
| Total | 99.90 | 100.01 | 100.46 | 100.00 | 99.69 | 100.90 | 99.84 | 100.36 | 100.29 | 99.87 | 99.68 | 100.70 | 100.13 | 100.87 | 100.43 | 100.18 | 100.24 |
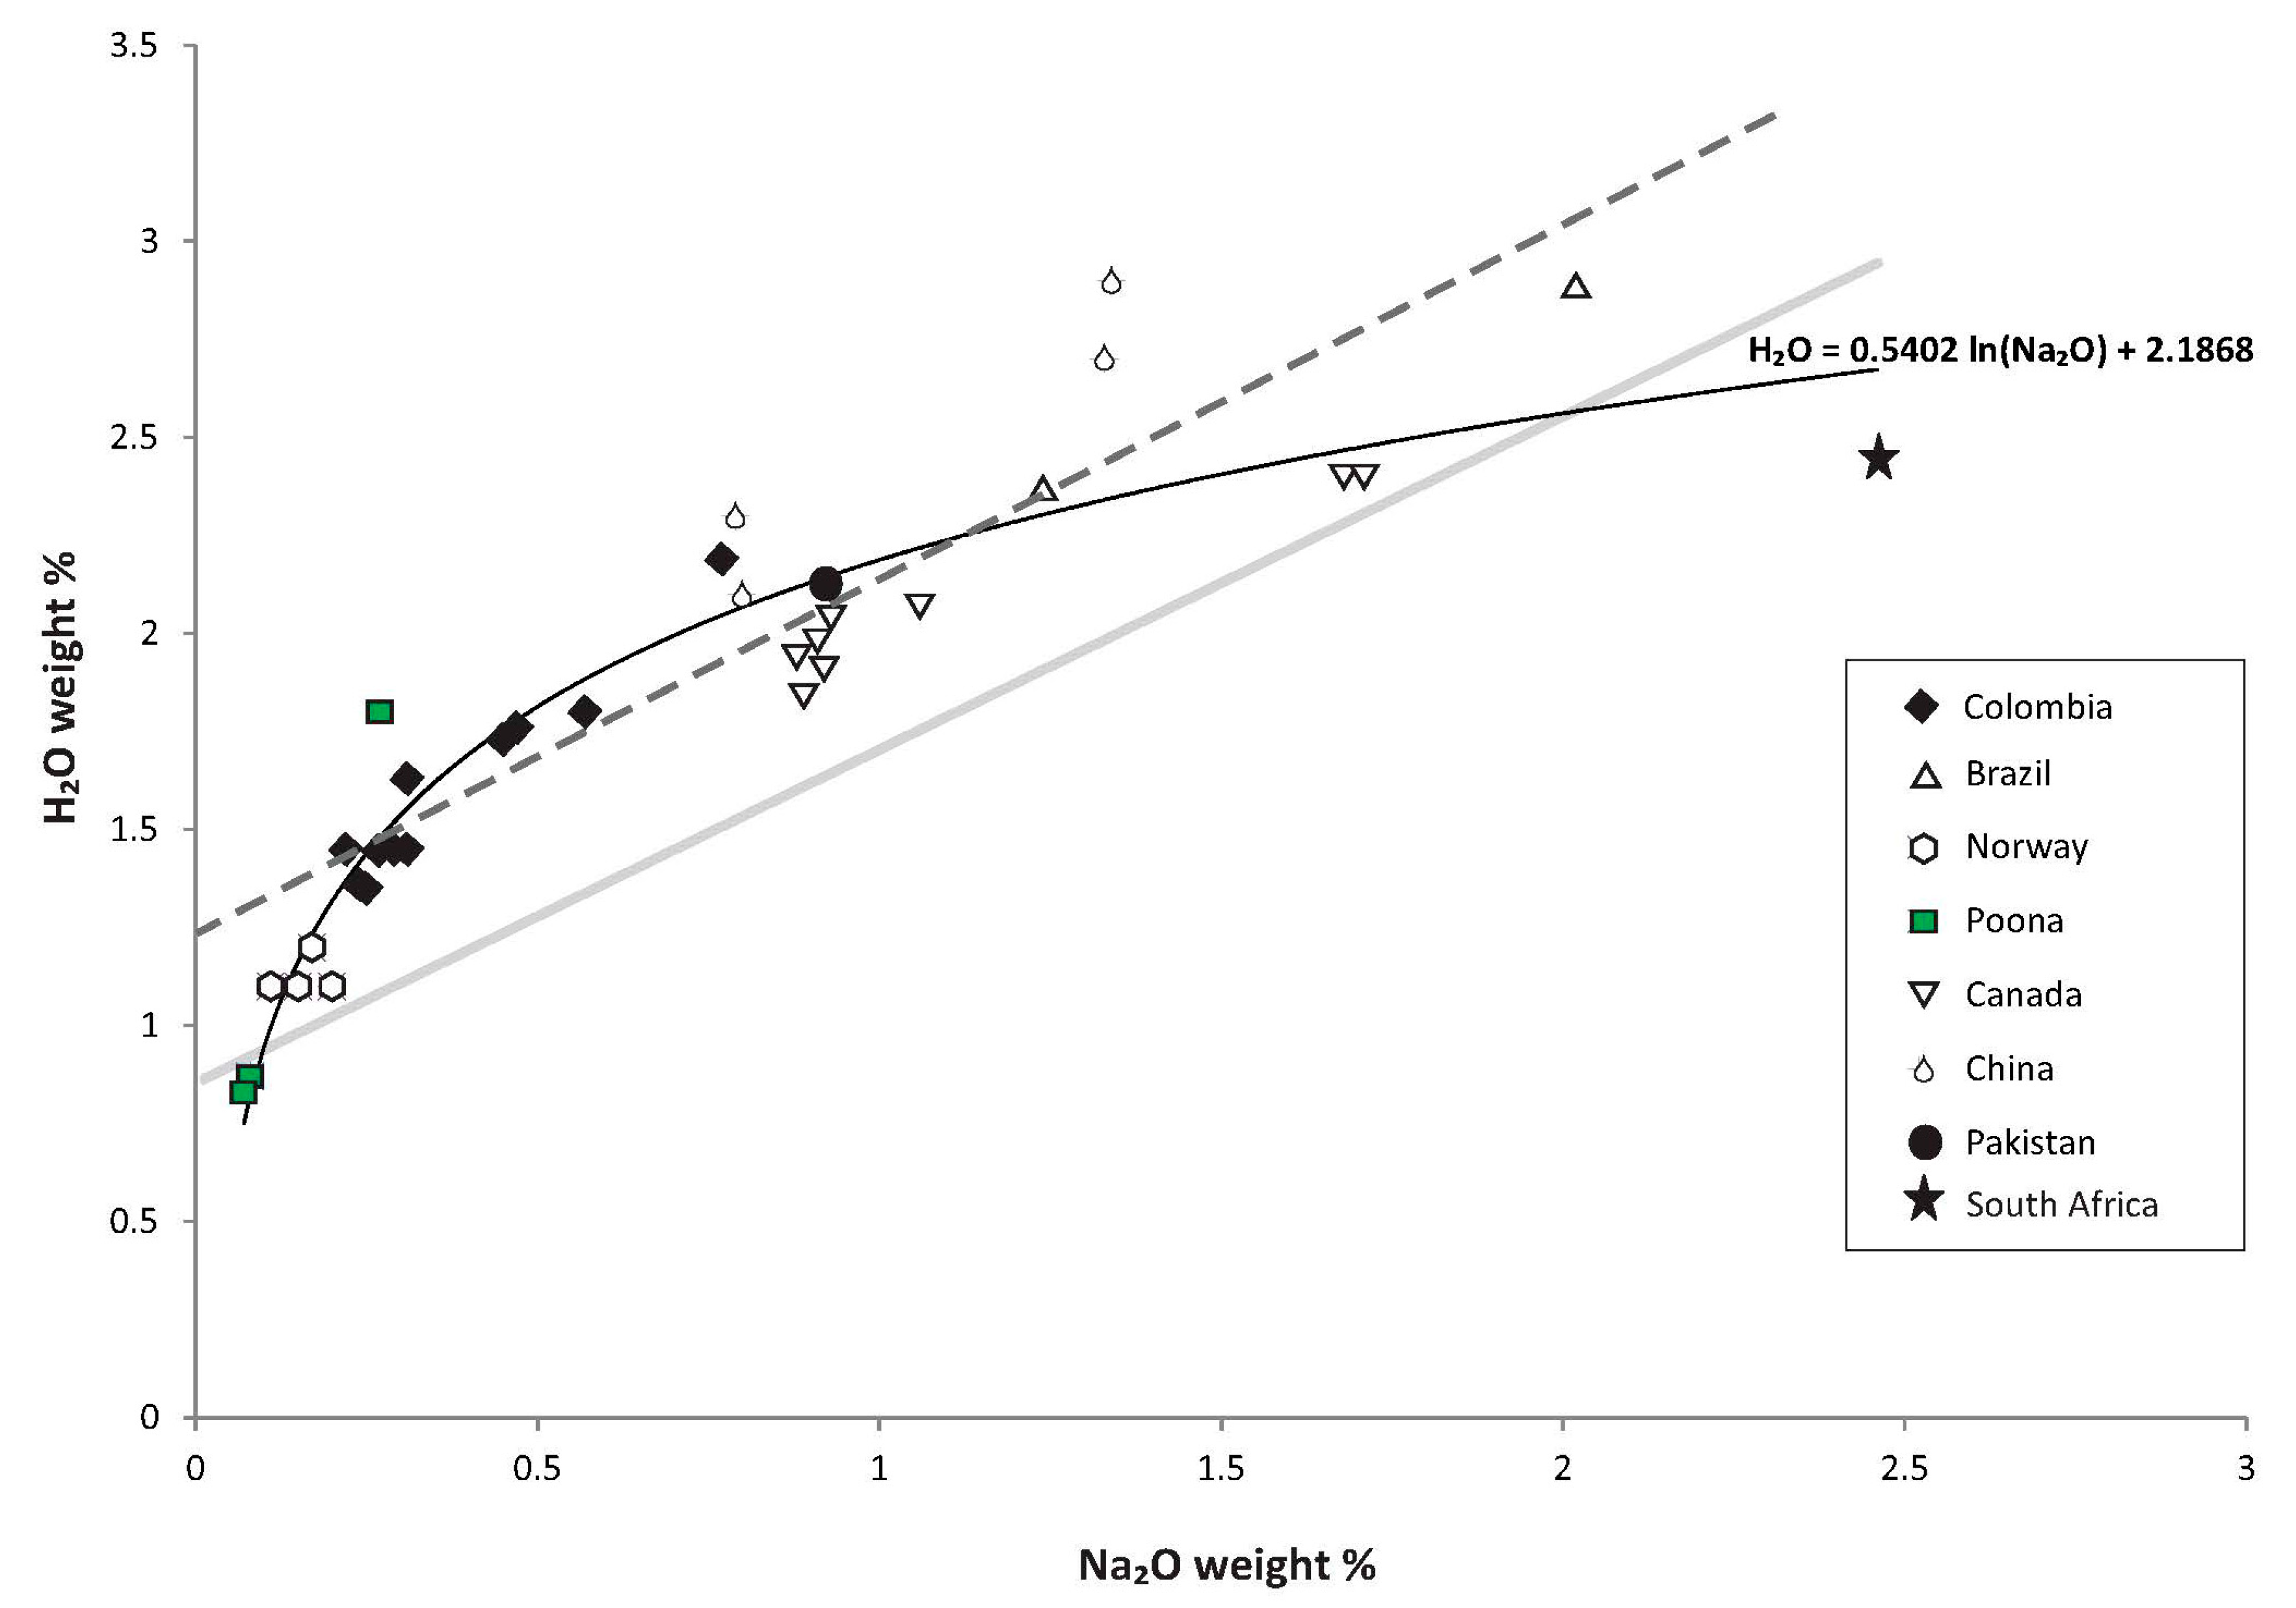
| Locality | Channel H2O | Emerald Na2O | Locality | Channel H2O | Emerald Na2O |
|---|---|---|---|---|---|
| Colombia | Canada | ||||
| Yacopi | 2.19 | 0.77 | Mountain River | 2.4 | 1.68 |
| Pava | 1.63 | 0.31 | Mountain River | 2.4 | 1.71 |
| Coscuez | 1.76 | 0.47 | Tsa da Glisza | 2.07 | 1.06 |
| Tequendama | 1.8 | 0.57 | Tsa da Glisza | 1.91 | 0.92 |
| Cincho | 1.73 | 0.45 | Lened | 2.04 | 0.93 |
| Vega | 1.36 | 0.24 | Lened | 1.98 | 0.91 |
| Oriente | 1.35 | 0.25 | Lened | 1.92 | 0.91 |
| Palo Aranado | 1.45 | 0.31 | Lened | 1.84 | 0.89 |
| Guala | 1.45 | 0.22 | Lened | 1.94 | 0.88 |
| Klein | 1.45 | 0.27 | China | ||
| Brazil | Davdar | 2.1 | 0.80 | ||
| Carnaíba | 2.37 | 1.24 | Davdar | 2.3 | 0.79 |
| Santa Terezinha | 2.88 | 2.02 | Dyakou | 2.9 | 1.34 |
| Norway | Dyakou | 2.7 | 1.34 | ||
| Byrud | 1.1 | 0.15 | South Africa | ||
| Byrud | 1.1 | 0.2 | Ledysorp | 2.45 | 2.46 |
| Byrud | 1.1 | 0.11 | Australia | ||
| Byrud | 1.2 | 0.17 | Emmaville-Torrington | 0.87 | 0.08 |
| Pakistan | Emmaville-Torrington | 0.83 | 0.07 | ||
| Khaltaro | 2.12 | 0.92 | Poona 1 (this study) | 1.8 | 0.27 |
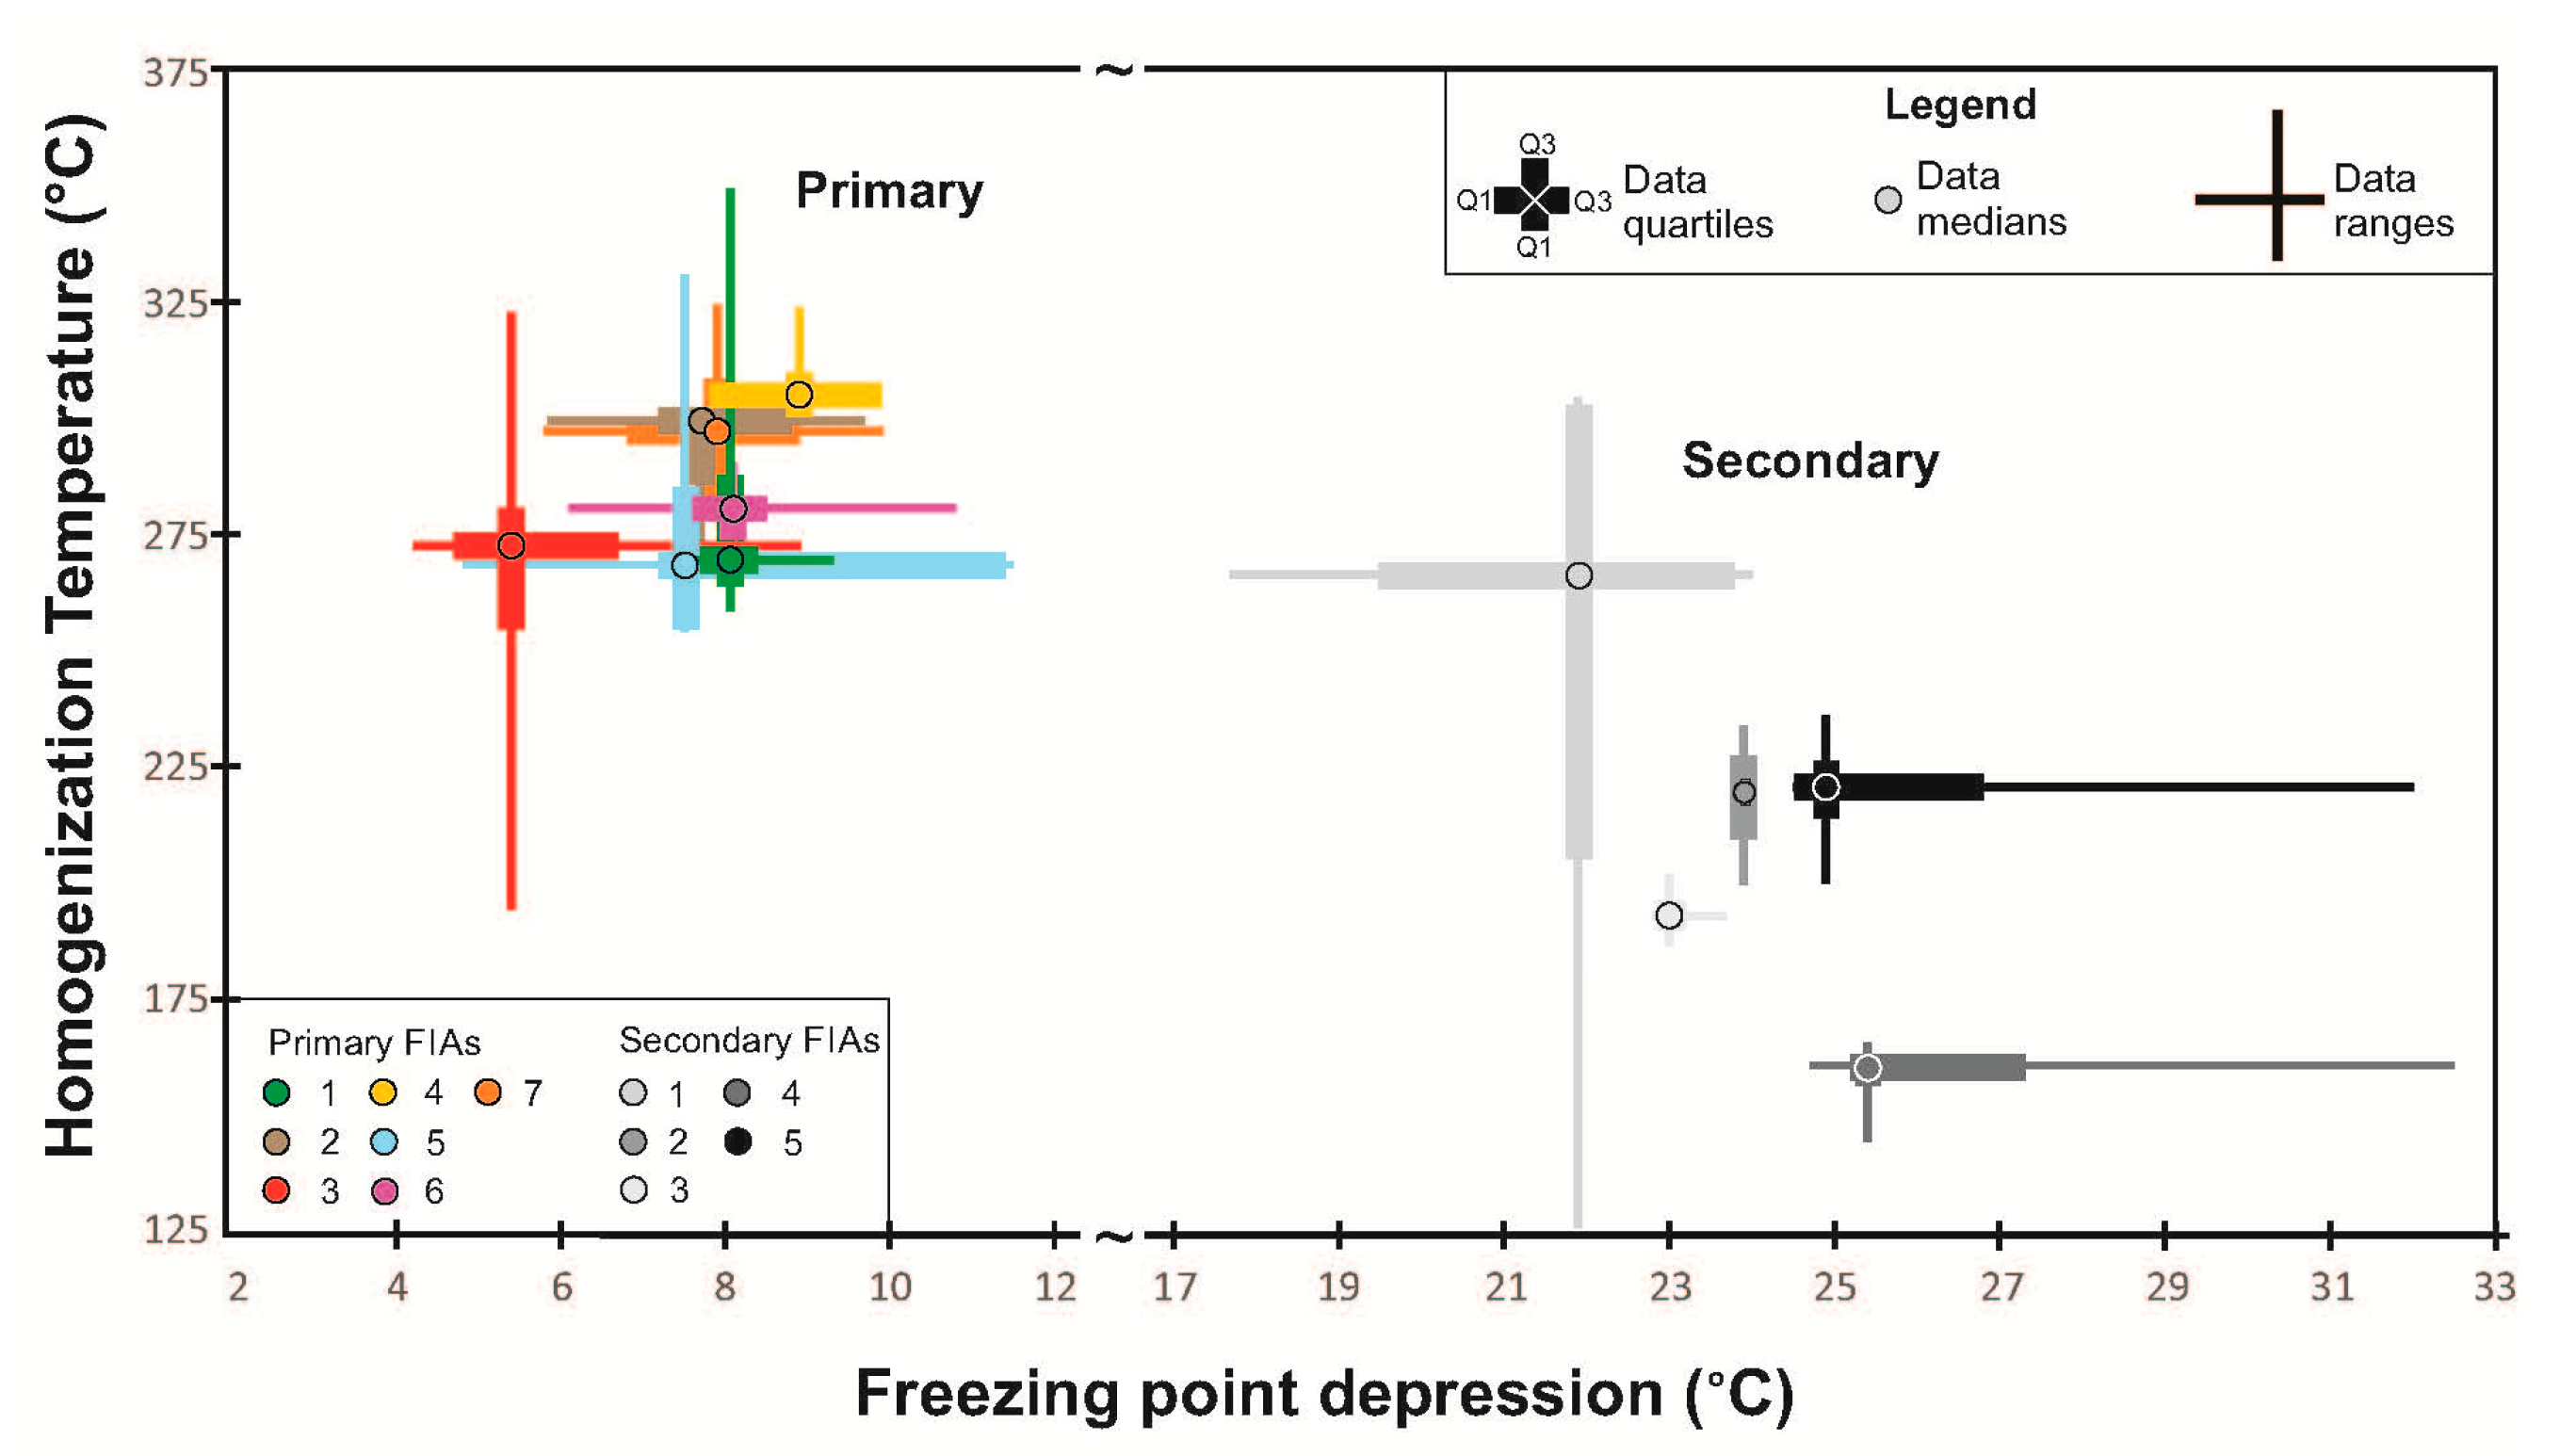
| FIA/FIT | Sample | Tm-ice | Tfm | Tm-clathrate | Salinity * (wt % NaCl eq.) | Th-tot |
|---|---|---|---|---|---|---|
| MDC1811 Chip 2 (Primary) | ||||||
| 5 | −7.4 | 11.0 | 272.5 | |||
| 1/1 | 6 | −7.8 | 11.5 | 347.1 | ||
| 17 | −8.1 | 11.8 | 267.2 | |||
| 18 | −9.3 | −27 | 13.2 | 259.9 | ||
| 2a | −5.3 | −23 | 8.3 | 282.7 | ||
| 2/1 | 3a | −5.5 | −23 | 8.5 | 272.5 | |
| 4a | −9.8 | −22 | 13.7 | 297.3 | ||
| 5a | −7.7 | 11.3 | 300.9 | |||
| 1a | −6.7 | 10.1 | 184.9 | |||
| 3 | −4.2 | 6.7 | 269.1 | |||
| 3/1 | 15 | −8.9 | 12.7 | 273.8 | ||
| 27 | −4.5 | 7.2 | 251.3 | |||
| 28 | −7.1 | 10.6 | 323.4 | |||
| 11 | −7.8 | 11.4 | 324.3 | |||
| 13 | −9.9 | −18 | 13.8 | 297.6 | ||
| 4/1 | 14 | −9.9 | −18 | 13.8 | 297.6 | |
| 16 | −7.8 | −22 | 11.4 | 306.9 | ||
| 1 | −4.8 | −39 | 7.6 | 283.9 | ||
| 4 | −7.2 | 10.7 | 331.1 | |||
| 5/1 | 9 | −9.9 | 13.8 | 256.4 | ||
| 10 | −5.8 | −24 | 8.9 | 256.1 | ||
| 12 | −7.5 | −19 | 11.1 | 269.4 | ||
| 19 | −8.1 | 11.8 | 289.2 | |||
| 22 | −10.8 | −21 | 14.8 | 268.3 | ||
| 6/1 | 23 | −7.6 | 11.2 | 280.0 | ||
| 24 | −8.5 | 12.3 | 274.5 | |||
| 26 | −6.1 | 9.3 | 280.9 | |||
| 7/1 | 7 | −11.5 | 15.5 | 265.3 | ||
| 8 | −11.4 | 15.4 | 324.4 | |||
| MDC1811 Chip 1 (Secondary) | ||||||
| 1 | −5.9 | −38 | 1.5 | 317.1 | ||
| 1/3 | 2 | −7.6 | 3.1 | 343.2 | ||
| 3 | −6.3 | −40 | 3.4 | 310.5 | ||
| 4 | −6.6 | 3.2 | 328.8 | |||
| MDC729 Chip 1 (Secondary) | ||||||
| 1 | −24.0 | 125.7 | ||||
| 2 | −20.1 | −47 | 22.4 | 301.9 | ||
| 1/2 | 3 | −23.7 | 234.0 | |||
| 4 | −17.7 | 20.7 | 299.0 | |||
| 1 | −23.9 | 229.3 | ||||
| 2 | −23.8 | −52 | 226.2 | |||
| 2/2 | 3 | −23.9 | −53 | 201.8 | ||
| 4 | −24.0 | 213.5 | ||||
| 1 | −22.8 | 193.9 | ||||
| 2 | −23.0 | −48 | 203.8 | |||
| 3/2 | 3 | −23.7 | 197.3 | |||
| 4 | −23.0 | 190.9 | ||||
| MDC729 Chip 2 (Secondary) | ||||||
| 1 | −32.5 | 166.3 | ||||
| 4/2 | 2 | −25.3 | 152.0 | |||
| 3 | −24.7 | 171.1 | ||||
| 4 | −25.5 | 166.6 | ||||
| 1 | −25.1 | 218.7 | ||||
| 5/2 | 2 | −24.6 | 235.1 | |||
| 3 | −24.5 | 223.4 | ||||
| 4 | −32.0 | 201.7 | ||||
| Sample Number | Mineral | δ18O (‰ VSMOW) | Channel H2O (Weight %) | δD (‰ VSMOW) |
|---|---|---|---|---|
| MDC 200-1 | beryl | 10.1 | 1.7 | −27 |
| MDC 200-2 | beryl | 7.6 | 1.8 | −20 |
| MDC1811 | beryl | 7.6 | 1.8 | −27 |
| MDC729 | beryl | 7.4 | 2.7 | −55 |
| Poona * | beryl | 7.0 | 2.5 | −44 |
| MDC 200-1 | quartz | 12.3 | ||
| MDC 200-2 | quartz | 9.9 | ||
| MDC 1811 | quartz | 8.6 | ||
| MDC729 | quartz | 8.6 |
© 2016 by the authors; licensee MDPI, Basel, Switzerland. This article is an open access article distributed under the terms and conditions of the Creative Commons Attribution (CC-BY) license (http://creativecommons.org/licenses/by/4.0/).
Share and Cite
Marshall, D.; Downes, P.J.; Ellis, S.; Greene, R.; Loughrey, L.; Jones, P. Pressure–Temperature–Fluid Constraints for the Poona Emerald Deposits, Western Australia: Fluid Inclusion and Stable Isotope Studies. Minerals 2016, 6, 130. https://doi.org/10.3390/min6040130
Marshall D, Downes PJ, Ellis S, Greene R, Loughrey L, Jones P. Pressure–Temperature–Fluid Constraints for the Poona Emerald Deposits, Western Australia: Fluid Inclusion and Stable Isotope Studies. Minerals. 2016; 6(4):130. https://doi.org/10.3390/min6040130
Chicago/Turabian StyleMarshall, Dan, Peter J. Downes, Sarah Ellis, Robert Greene, Lara Loughrey, and Peter Jones. 2016. "Pressure–Temperature–Fluid Constraints for the Poona Emerald Deposits, Western Australia: Fluid Inclusion and Stable Isotope Studies" Minerals 6, no. 4: 130. https://doi.org/10.3390/min6040130
APA StyleMarshall, D., Downes, P. J., Ellis, S., Greene, R., Loughrey, L., & Jones, P. (2016). Pressure–Temperature–Fluid Constraints for the Poona Emerald Deposits, Western Australia: Fluid Inclusion and Stable Isotope Studies. Minerals, 6(4), 130. https://doi.org/10.3390/min6040130