
Mo and Ni Removal from Drinking Water Using Zeolitic Tuff from Jordan

Abstract
:1. Introduction
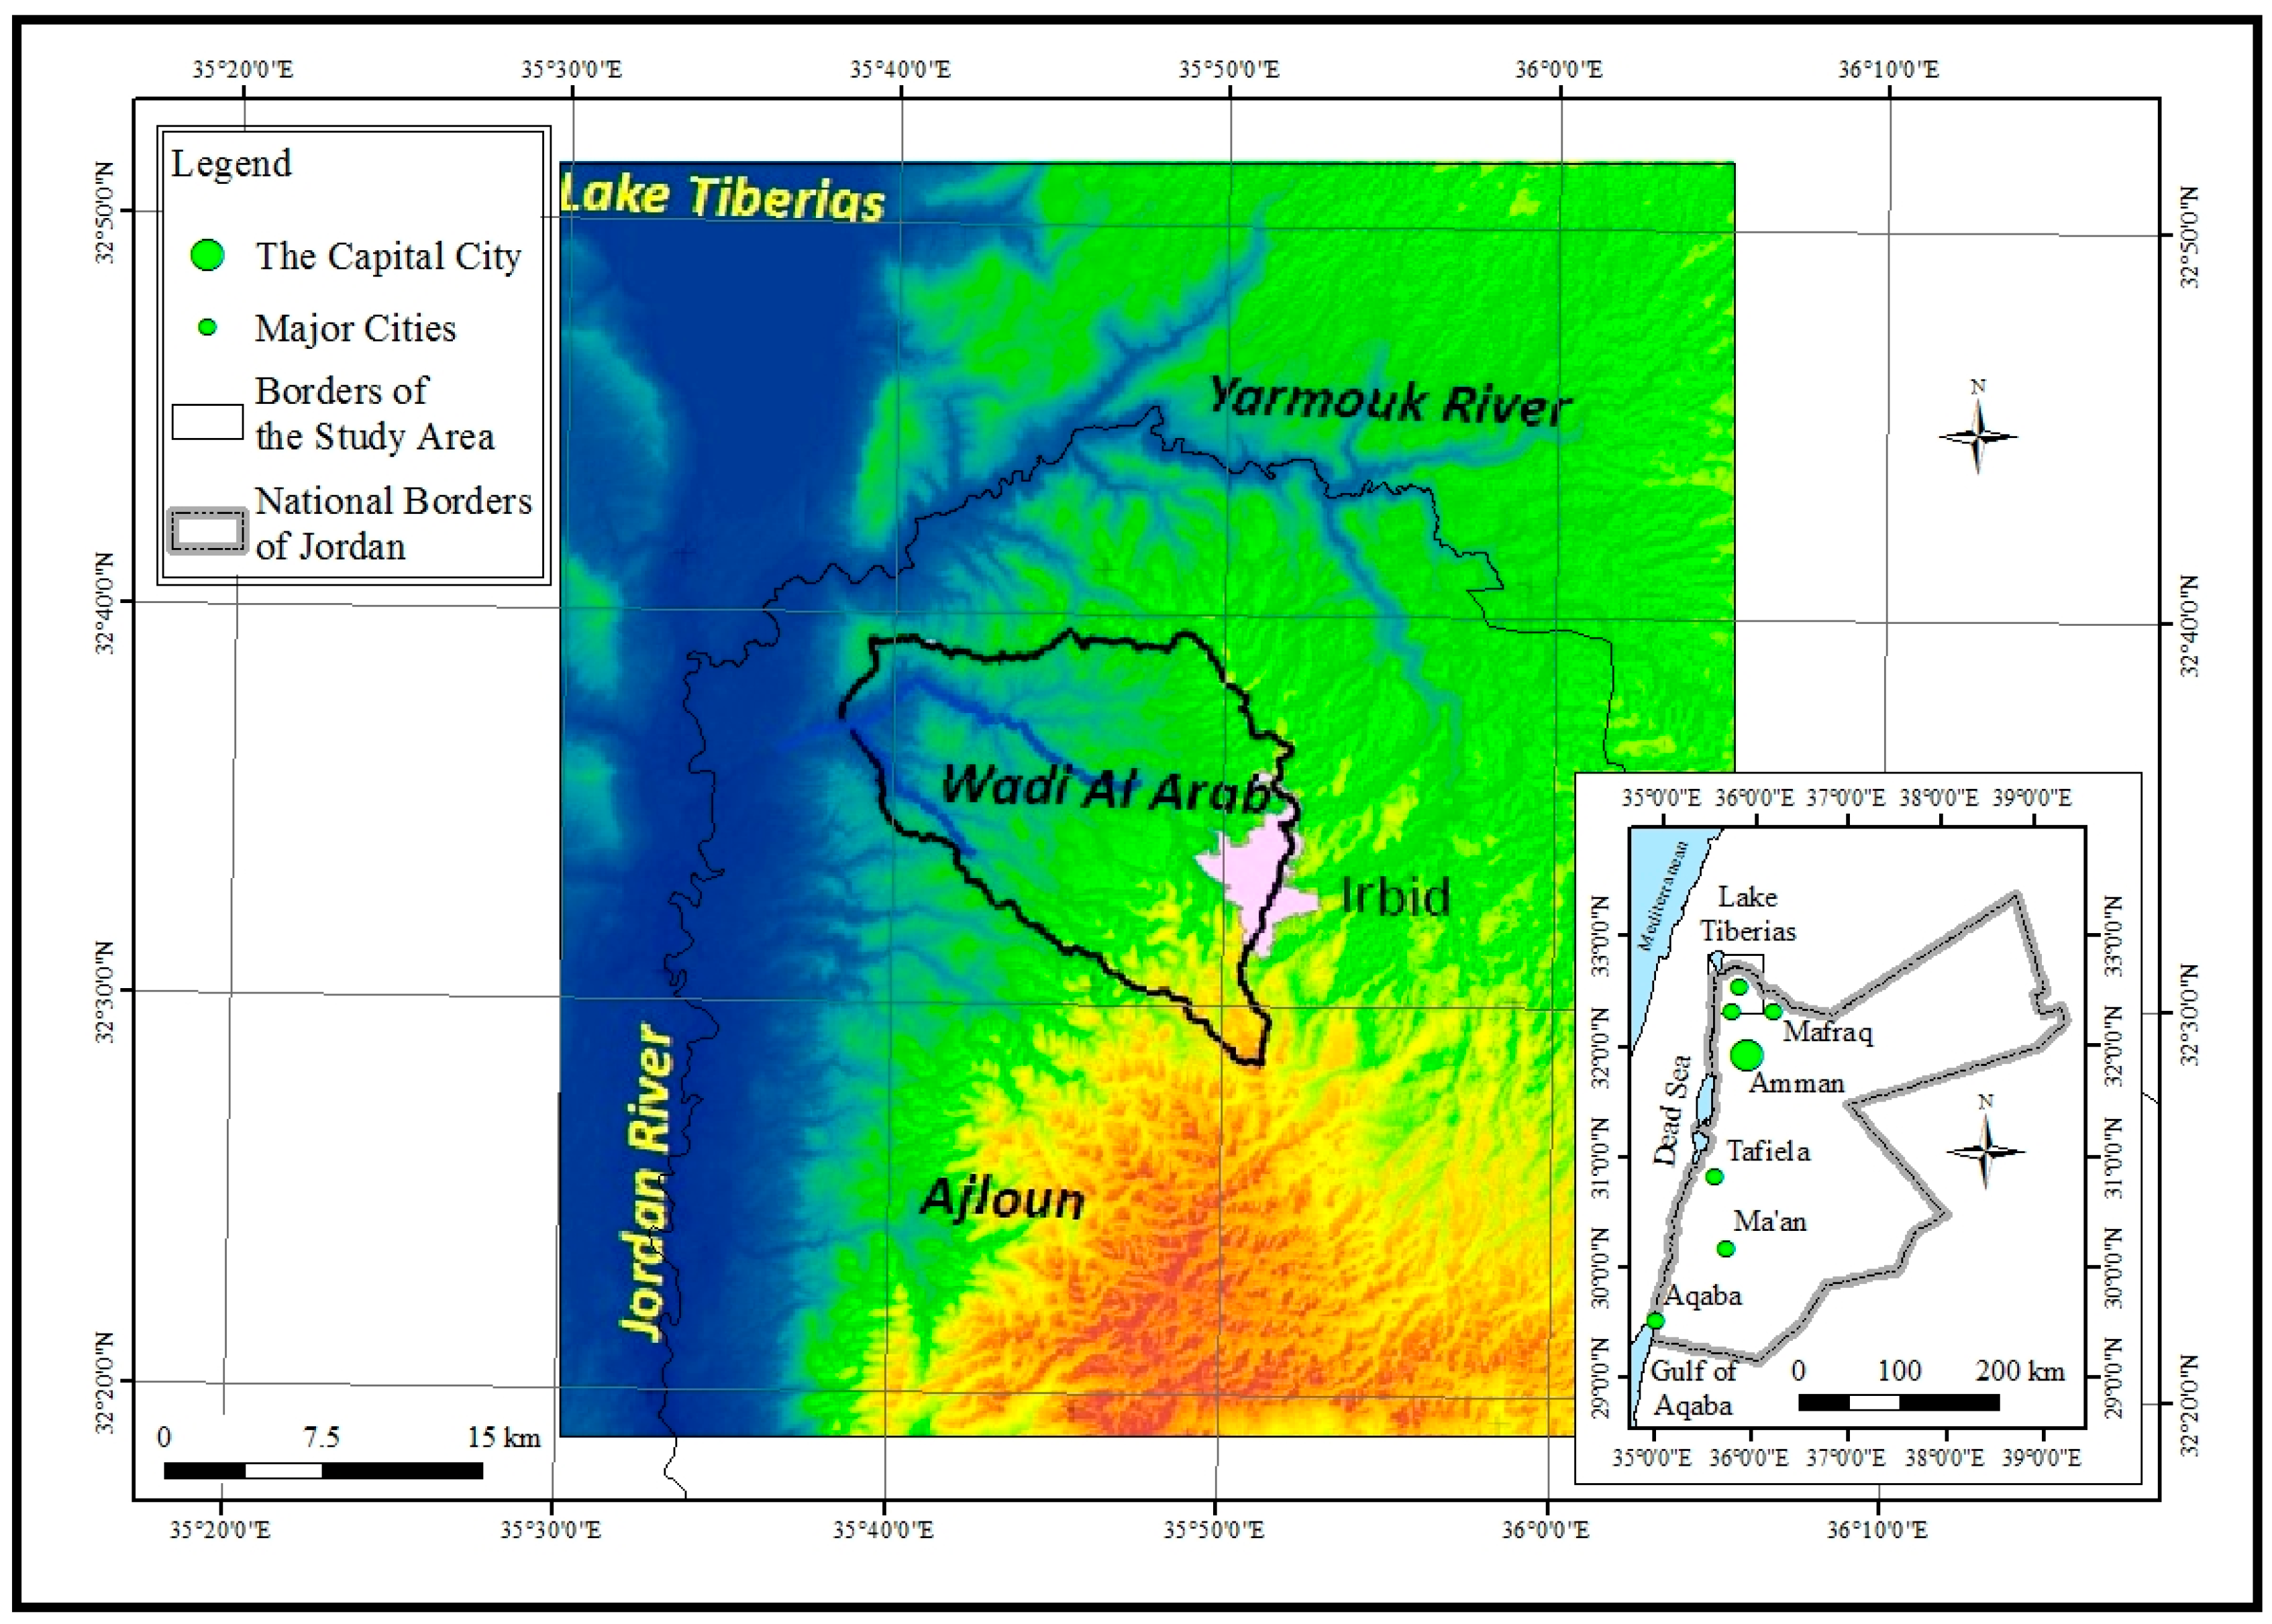
2. Materials
3. Results
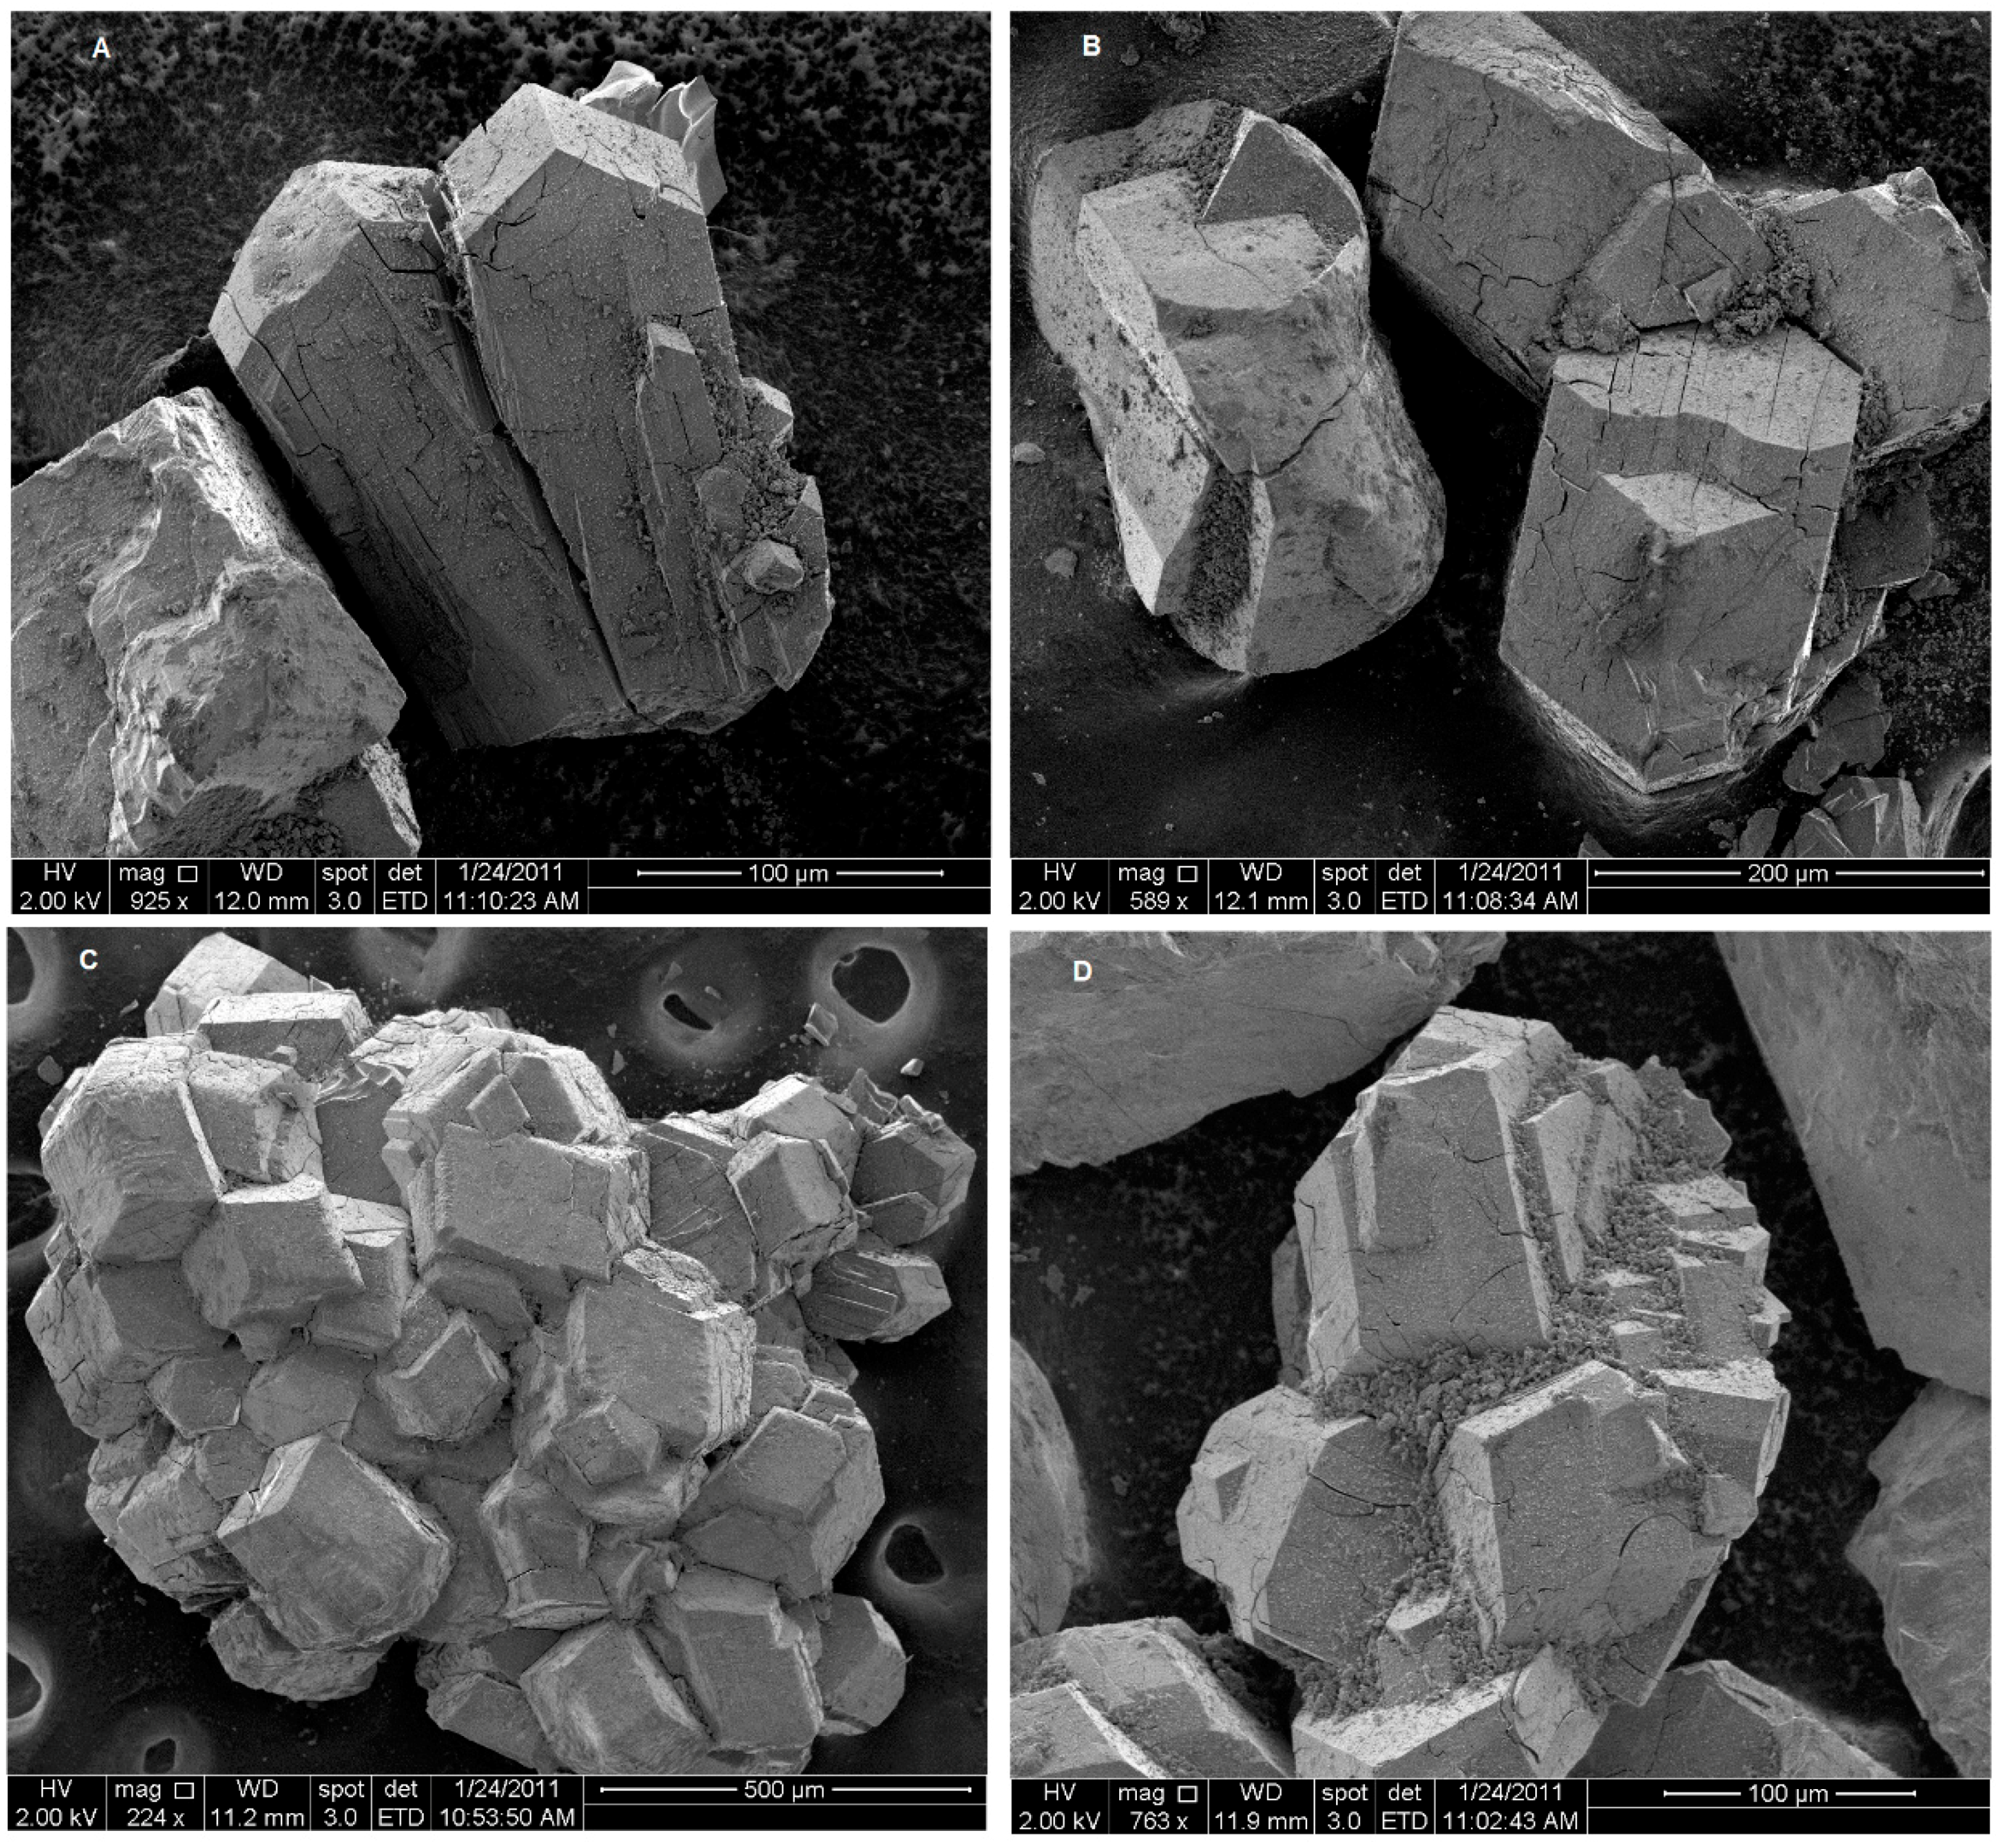
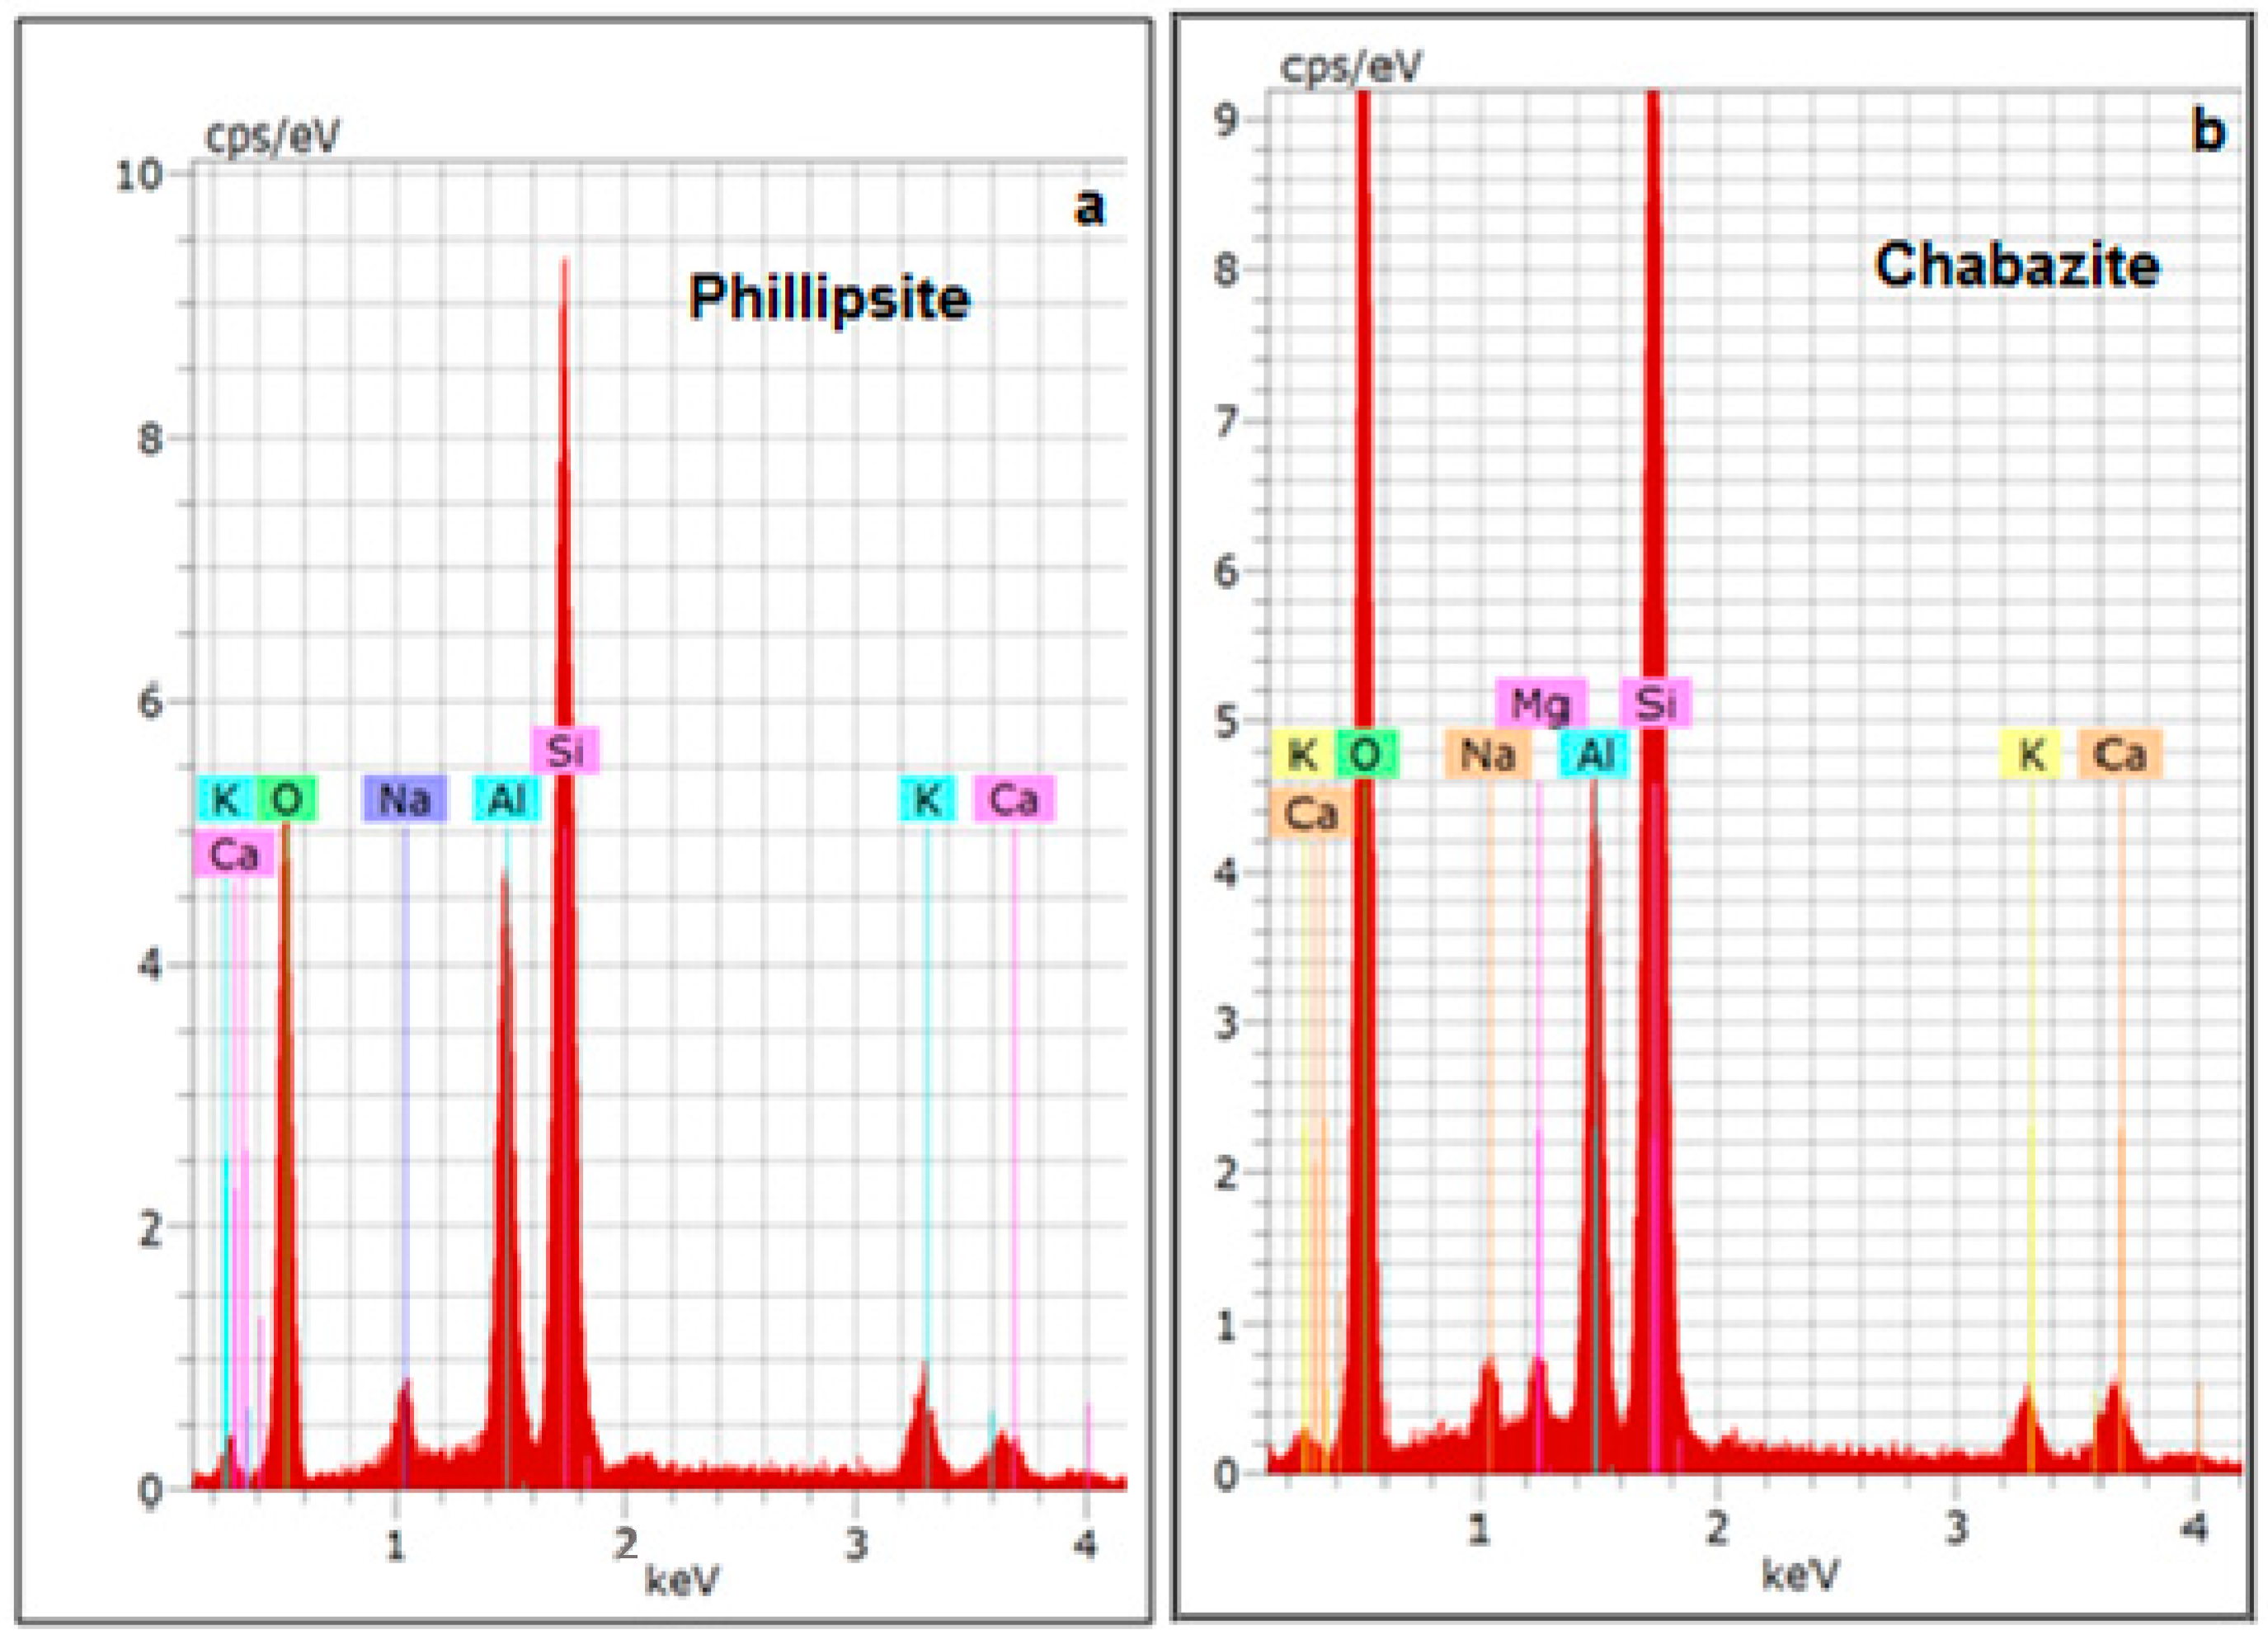
3.1. Characterization of the Zeolitic Tuff
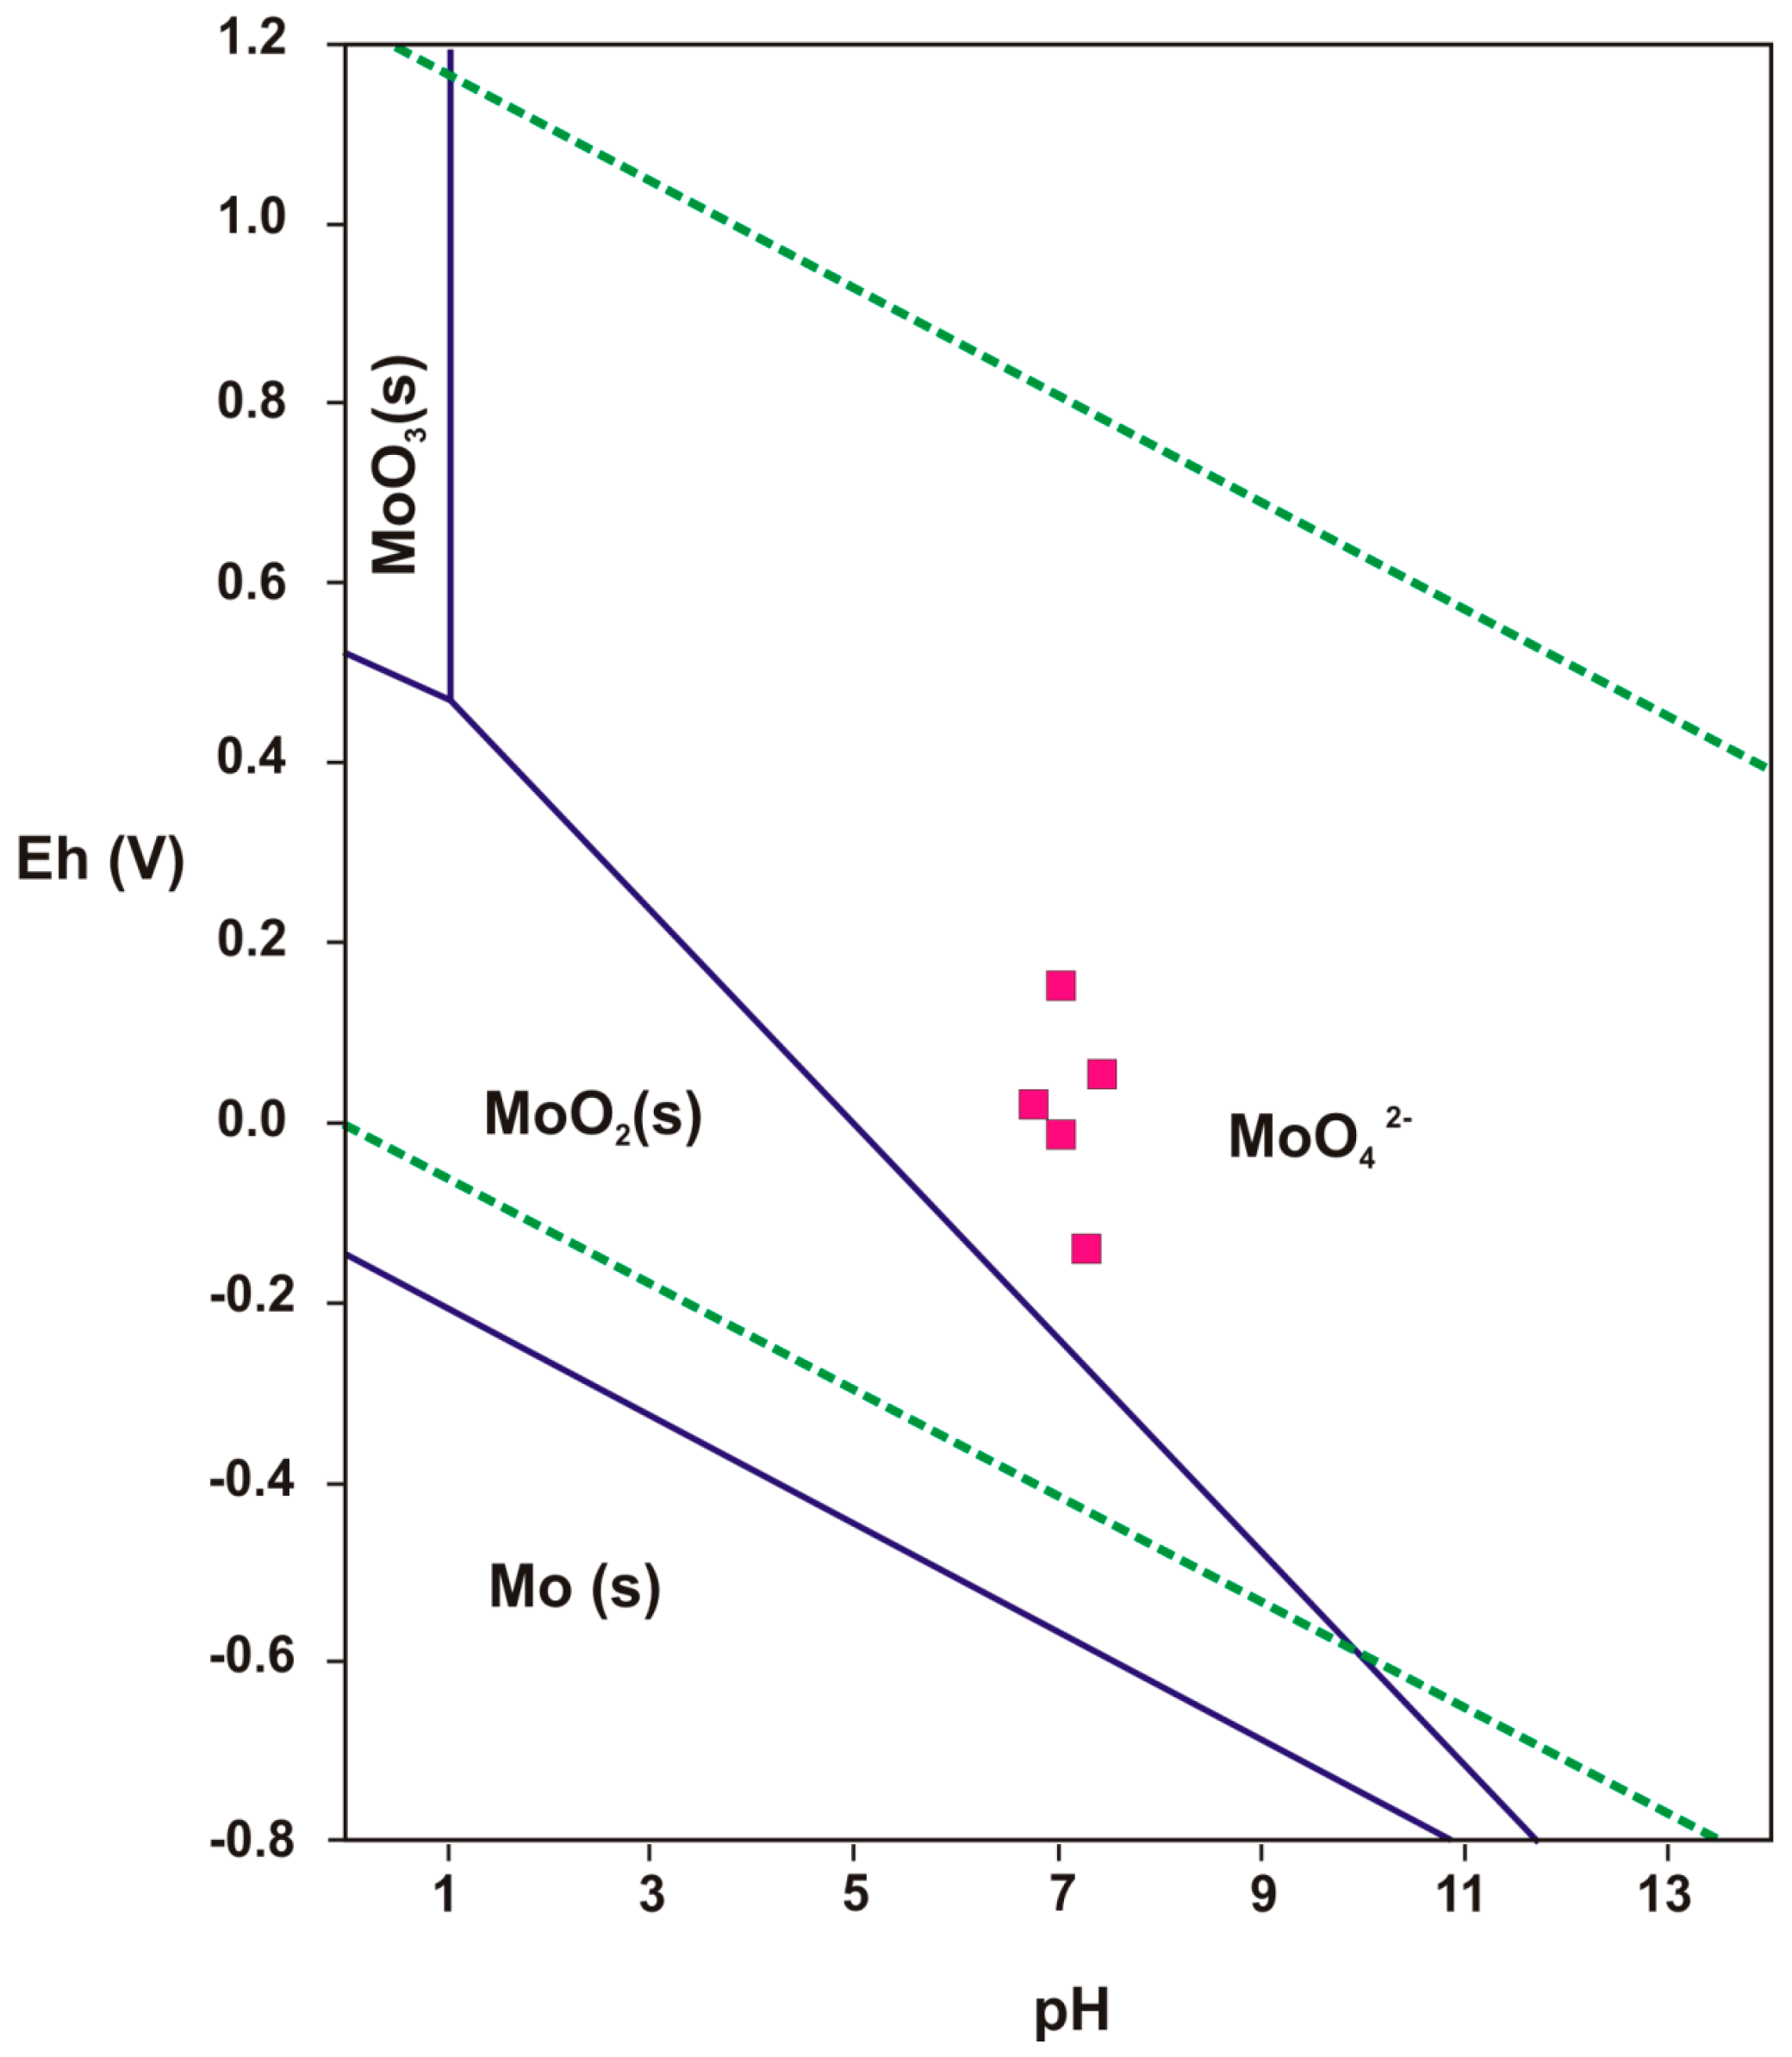
3.2. Characterization of the Water Samples
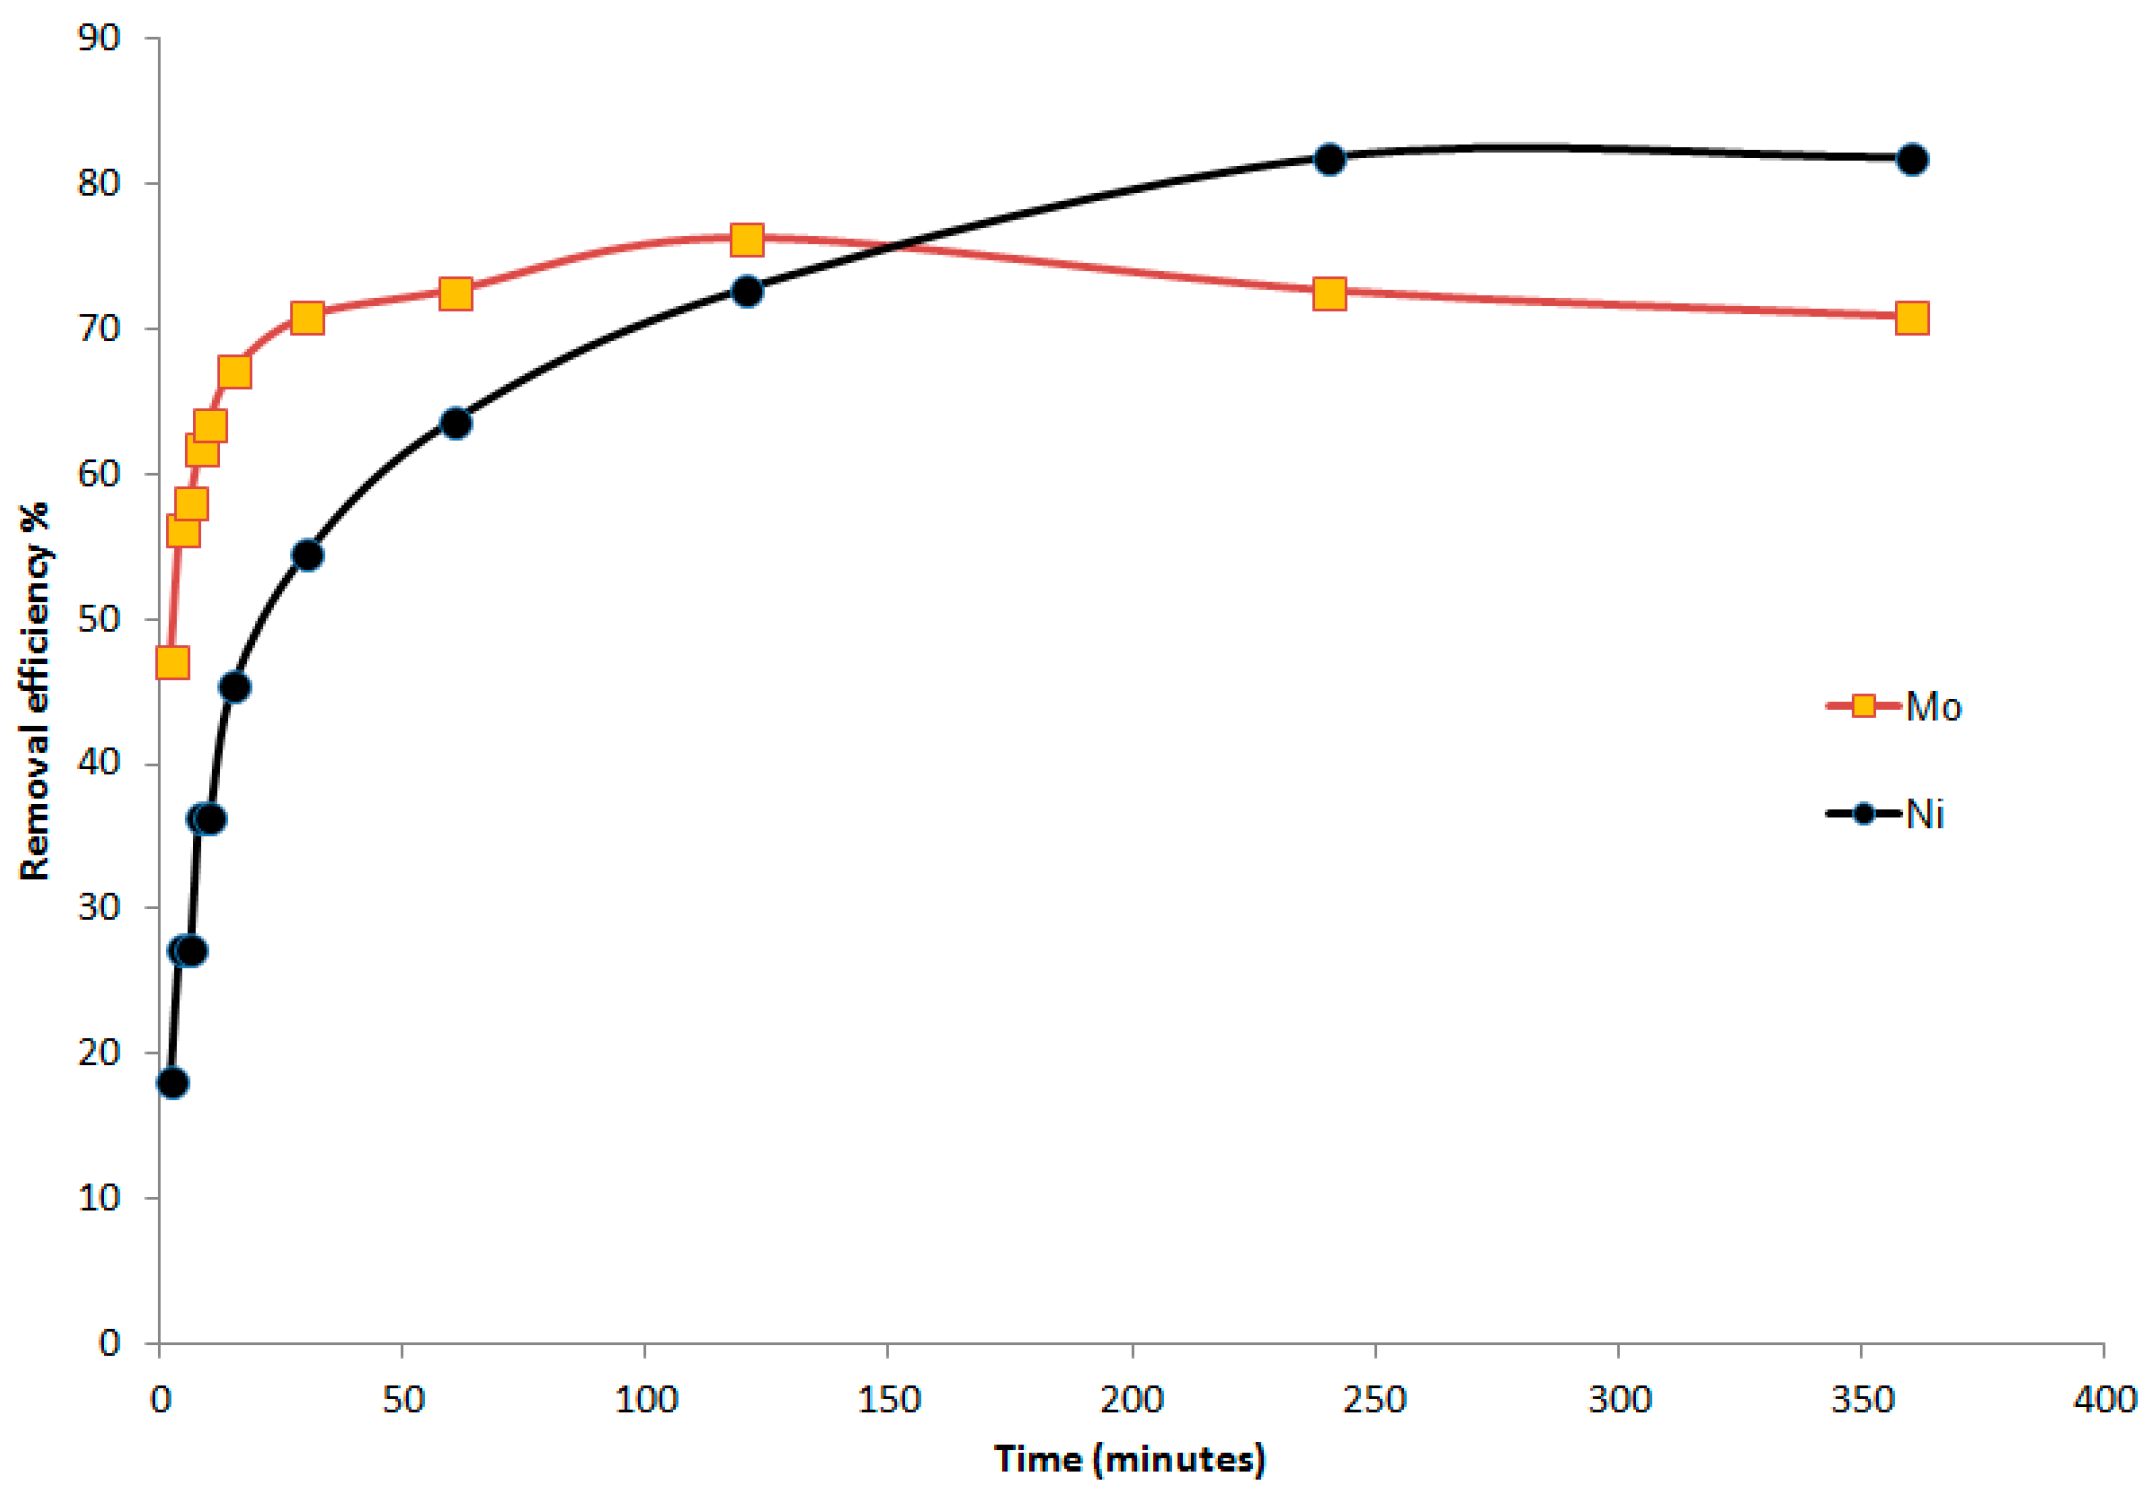
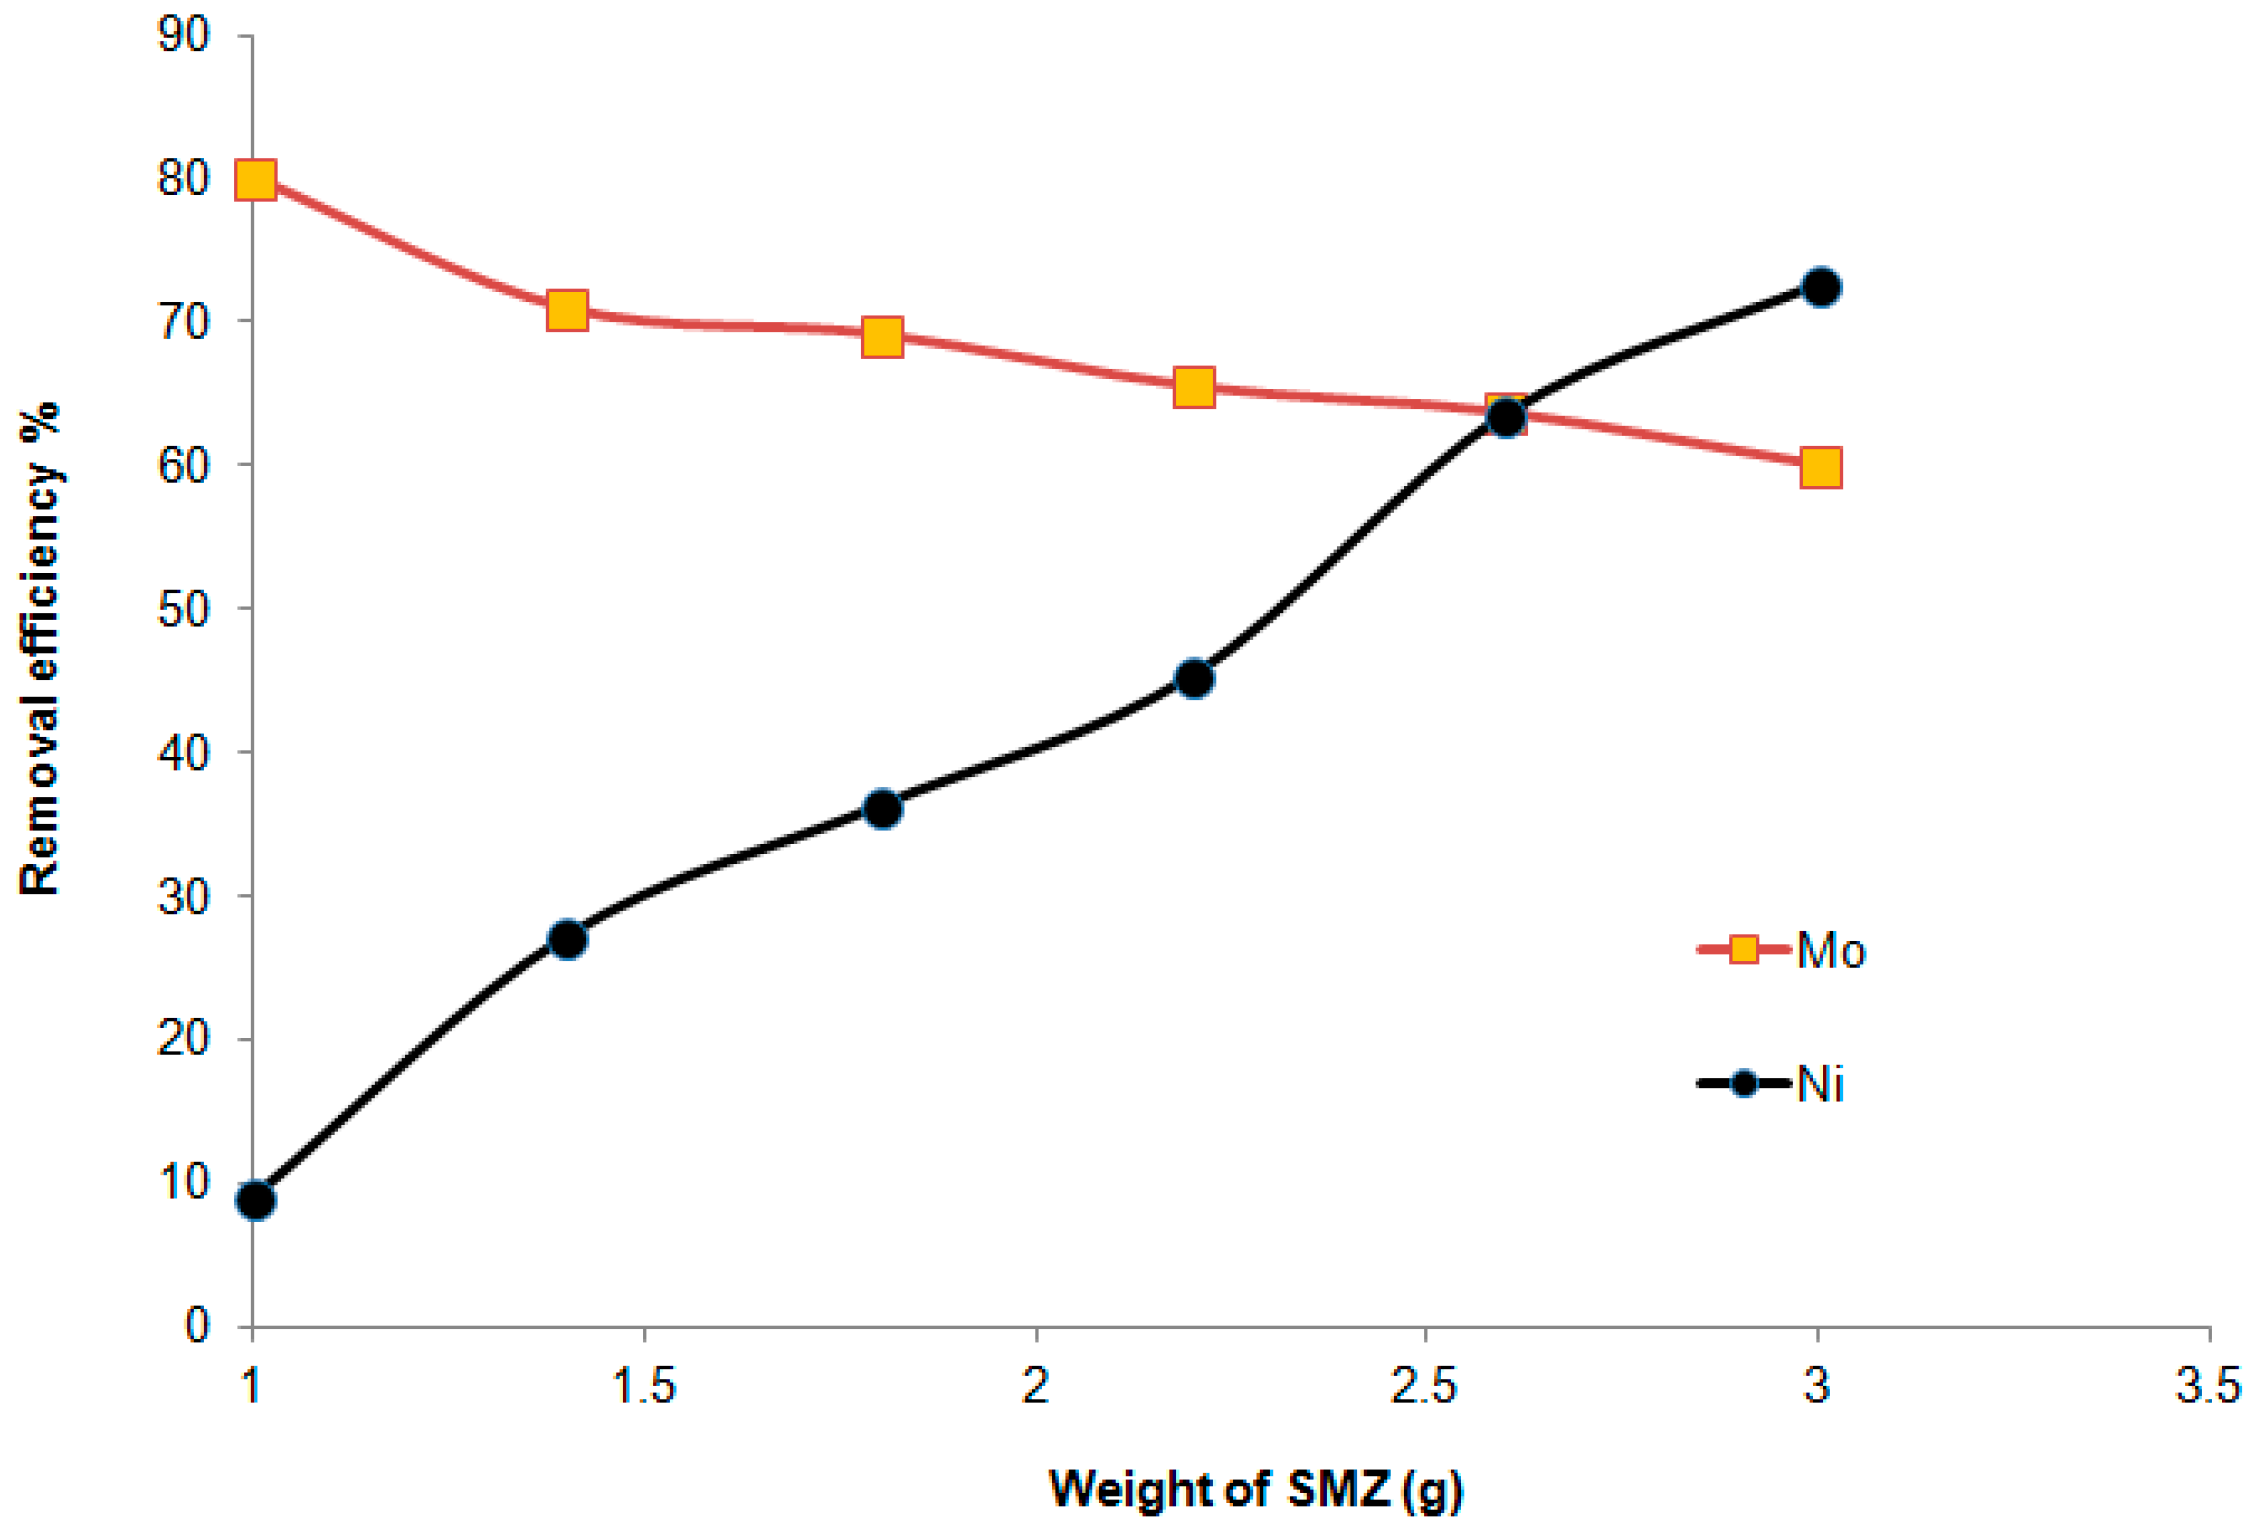
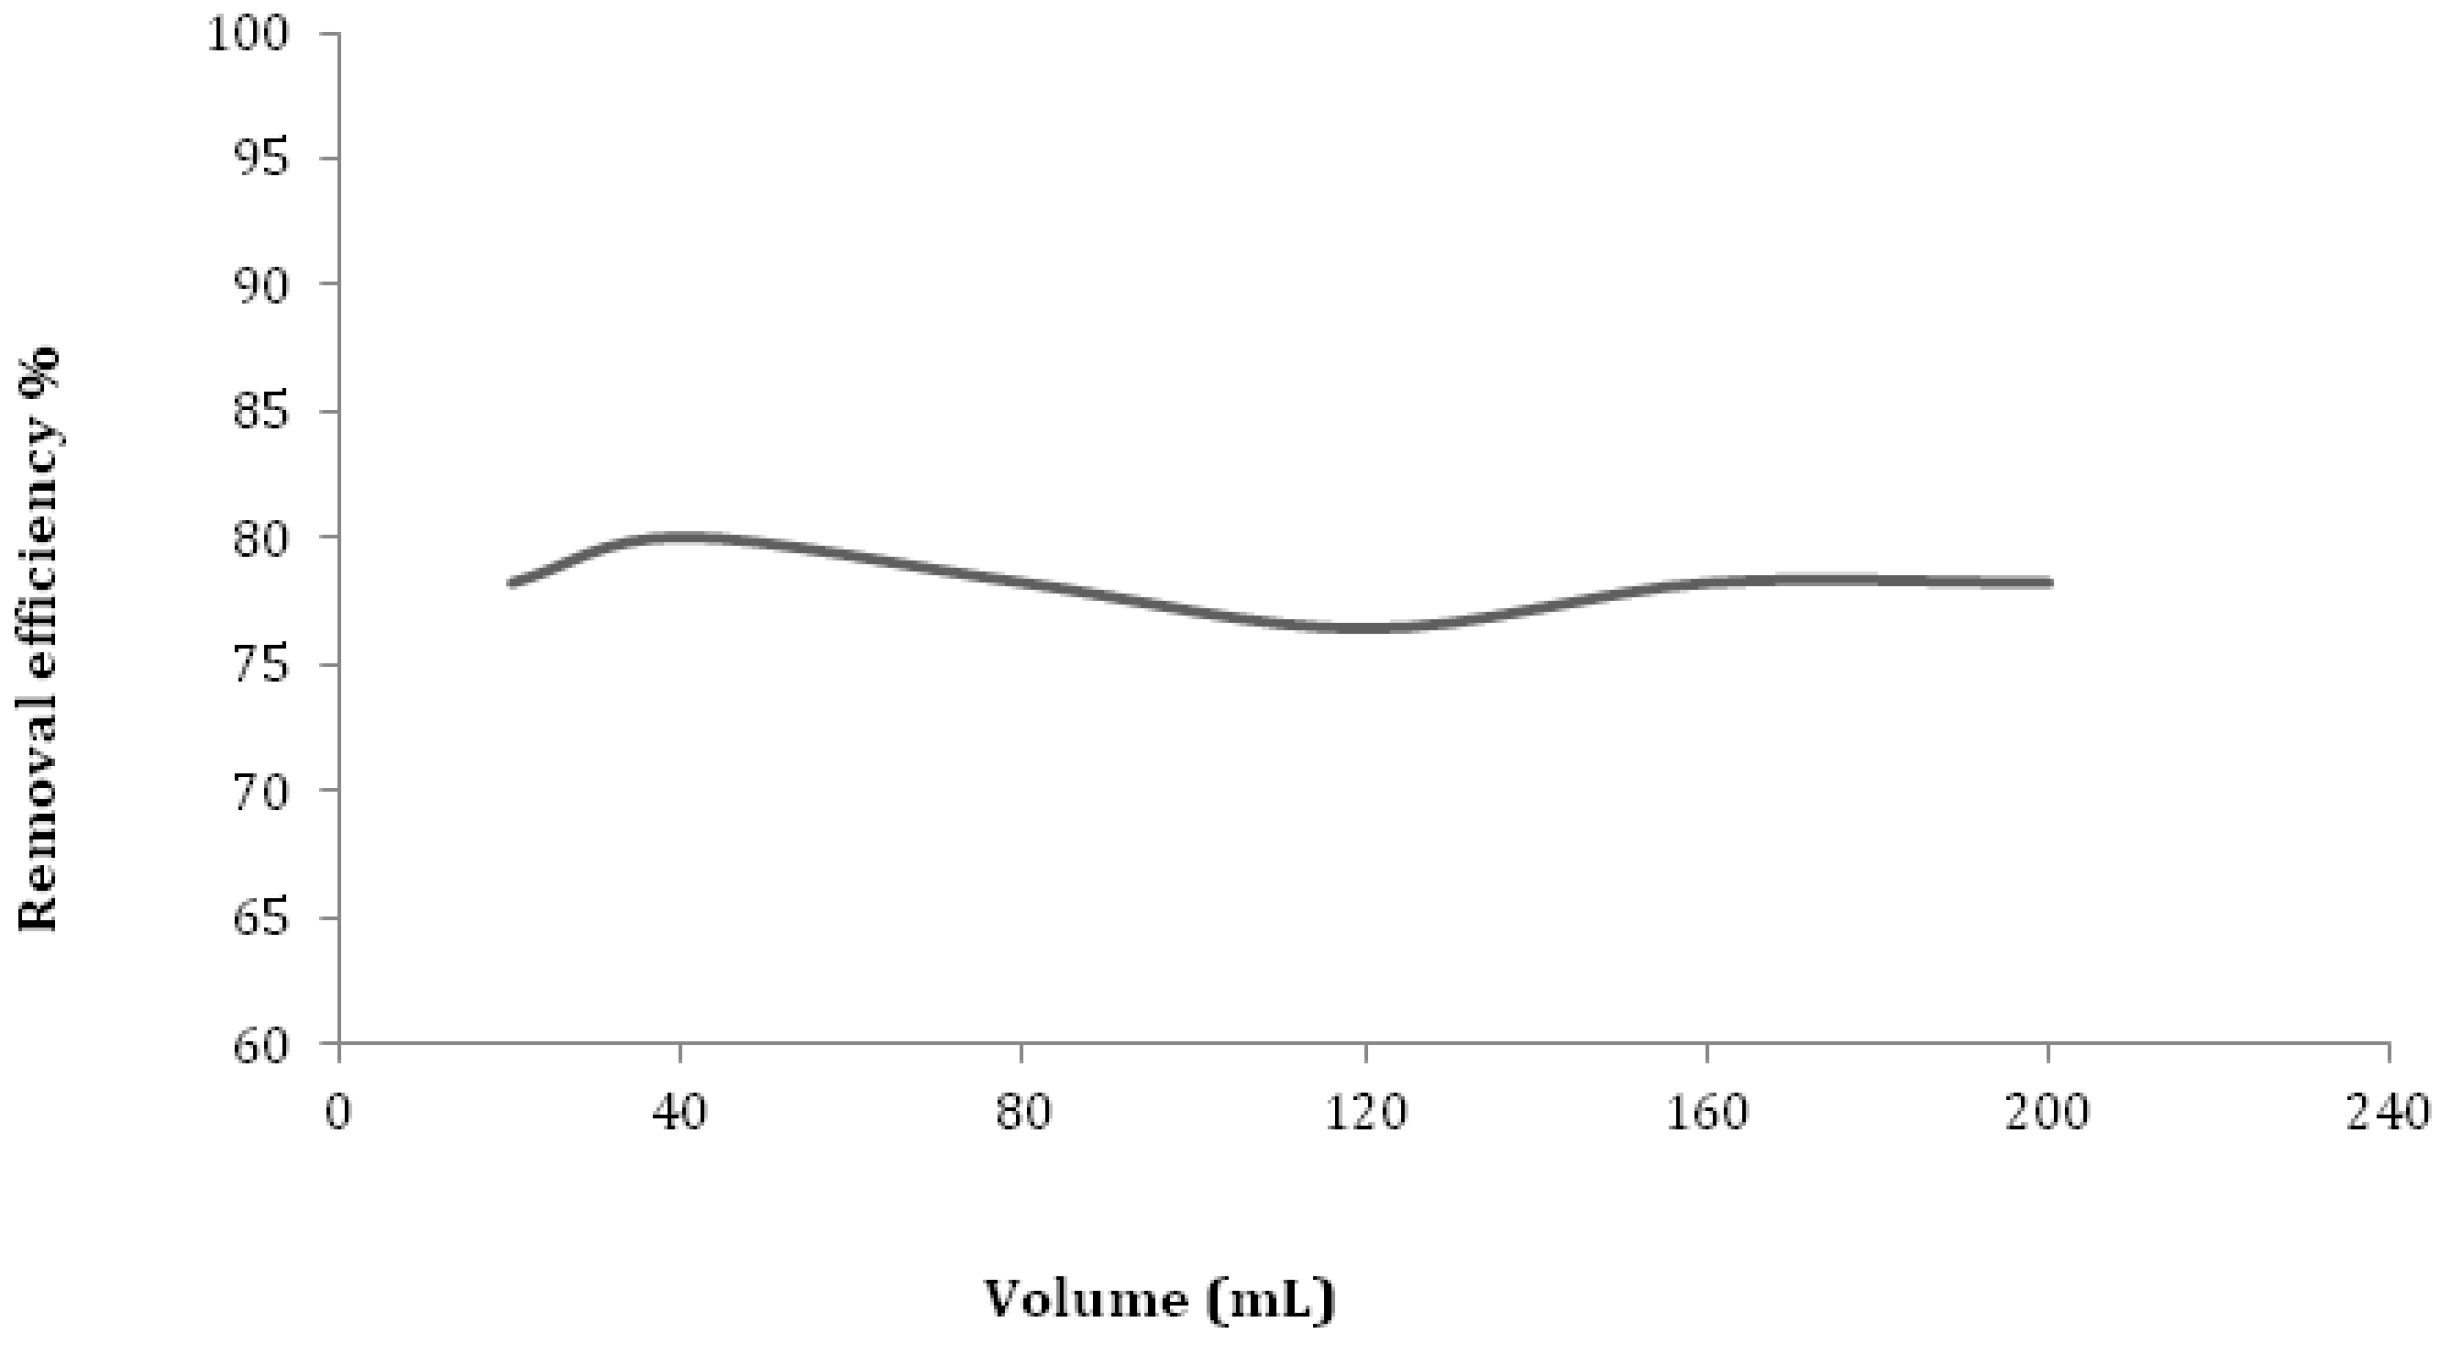
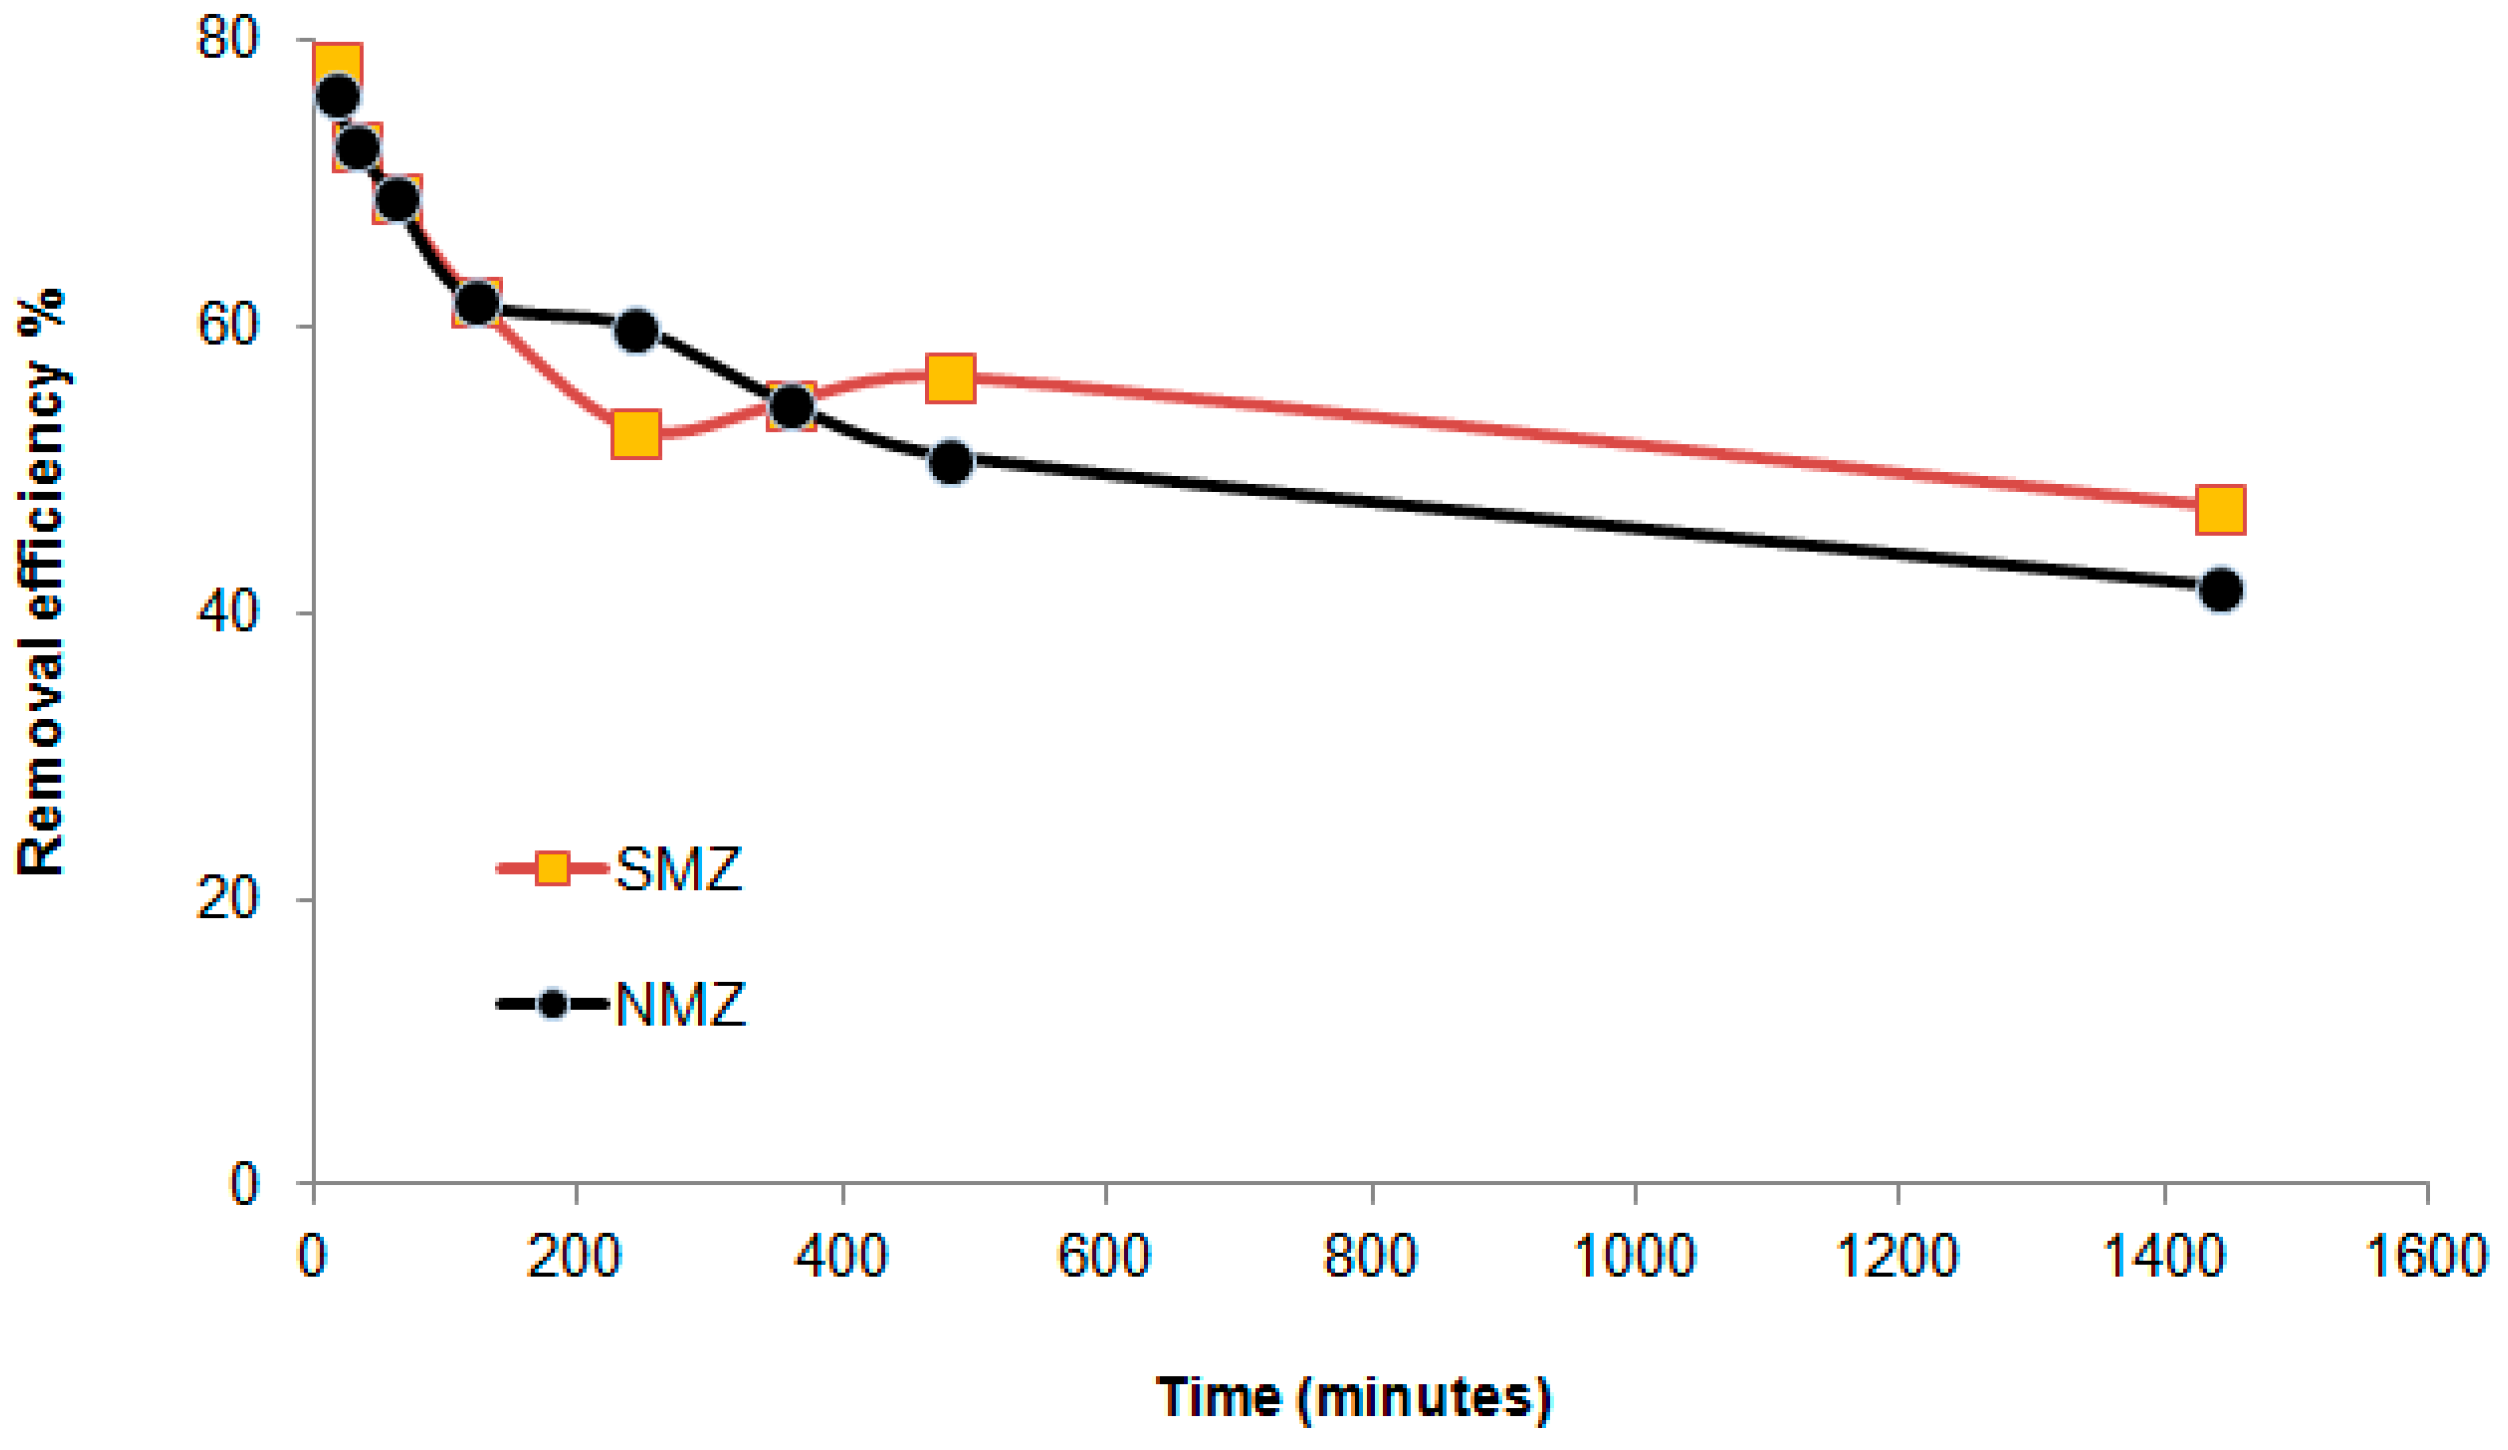
3.3. Batch Experiment Results
3.3.1. Efficiency of the Faujasite–Phillipsite Tuff (HN)
3.3.2. Efficiency of the Phillipsite–Chabazite Tuff
4. Discussion and Conclusions
Acknowledgments
Author Contributions
Conflicts of Interest
References
- Mielke, J.E. Composition of the Earth’s crust and distribution of the elements. In Review of Research on Modern Problems in Geochemistry; Siegel, F.R., Ed.; UNESCO Report; The United Nations Educational, Scientific and Cultural Organization (UNESCO): Paris, France, 1979; pp. 13–37. [Google Scholar]
- Wedepohl, K.H. The composition of the crust. Geochim. Cosmochim. Acta 1995, 59, 1217–1232. [Google Scholar] [CrossRef]
- Kuroda, P.K.; Sandell, E.B. Geochemistry of molybdenum. Geochim. Cosmoch. Acta 1954, 6, 35–63. [Google Scholar] [CrossRef]
- Scientific Committee on Food (SCF). Opinion of the Scientific Committee on Food on the Tolerable upper Intake Level of Molybdenum. SCF/CS/NUT/UPPLEV/22 Final. 2000. Available online: http://ec.europa.eu/food/fs/sc/scf/out80h_en.pdf (accessed on 19 July 2016).
- Wang, D. Redox chemistry of molybdenum in natural waters and its involvement in biological evolution. Front. Microbiol. 2012, 3, 427. [Google Scholar] [CrossRef] [PubMed]
- World Health Organization (WHO). Molybdenum in Drinking-Water: Background Document for Development of WHO Guidelines for Drinking-Water Quality. WHO/SDE/WSH/03.04/11/Rev/1. 2011. Available online: http://www.who.int/water_sanitation_health/dwq/chemicals/molybdenum.pdf (accessed on 19 July 2016).
- Kabata-Pendias, A.; Mukherjee, A.B. Trace Elements from Soil to Human; Springer-Verlag: Berlin, Germany, 2007; pp. 39–45. [Google Scholar]
- Das, A.K.; Chakraborty, R.; Cervera, M.L.; de la Guardia, M. A review on molybdenum determination in solid geological samples. Talanta 2007, 71, 987–1000. [Google Scholar] [CrossRef] [PubMed]
- Valle, T.I. Geochemistry of molybdenum in the Aquia Aquifer, Maryland, USA. Master’s Thesis, Faculty of the Graduate School, The University Texas at Arlington, Arlington, TX, USA, 2009. [Google Scholar]
- Brookins, D.G. Eh-pH Diagrams for Geochemistry; Spring-Verlag: New York, NY, USA, 1988; p. 176. [Google Scholar]
- Ure, A.M.; Berrow, M.L. The chemical constituents of soils. In Environmental Chemistry; Bowen, H.J.M., Ed.; Royal Society of Chemistry, Burlington House: London, UK, 1982; pp. 94–202. [Google Scholar]
- McGrath, S.P. Chromium and nickel. In Heavy Metals in Soil; Alloway, B.J., Ed.; Chapman and Hall: London, UK, 1995; pp. 139–155. [Google Scholar]
- Koppelman, M.H.; Dillard, J.G. A study of the adsorption of Ni(II) and Cu(II) by clay minerals. Clays Clay Miner. 1977, 25, 457–462. [Google Scholar] [CrossRef]
- World Health Organization (WHO). Chapter 6.10 Nickel. In Air Quality Guidelines for Europe, 2nd ed.; European Series No. 91; WHO Regional Publications: Copenhagen, Denmark, 2000. [Google Scholar]
- Abu Al Rous, M.N. Investigation and a Reconnaissance Survey of Molybdenum (Mo) Concentrations in Groundwater Used for Drinking Water in Wadi El Arab Area, Northern Jordan. Master’s Thesis, Hashemite University, Zarqa, Jordan, 2013. [Google Scholar]
- Al Kuisi, M.; Al-Hwaiti, M.; Mashal, K.; Abed, A.M. Spatial distribution patterns of molybdenum (Mo) concentrations in potable groundwater in Northern Jordan. Environ. Monit. Assess. 2015. [Google Scholar] [CrossRef] [PubMed]
- El-Naqa, A.R.; Ibrahim, K.M.; Abu Alrous, M. A preliminary survey of molybdenum (Mo) in groundwater used as potable water in Wadi Al Arab Catchment area, Northern Jordan. Manuscript in preparation.
- Misaelides, P. Application of natural zeolites in environmental remediation: A short review. Microporous Mesoporous Mater. 2011, 144, 15–18. [Google Scholar] [CrossRef]
- Bowman, R.S. Applications of surfactant-modified zeolites to environmental remediation. Microporous Mesoporous Mater. 2003, 61, 43–56. [Google Scholar] [CrossRef]
- Ibrahim, K.M. Geology, Mineralogy, Chemistry, Origin and Uses of the Zeolites Associated with Quaternary Tuffs of North East Jordan. Ph.D. Thesis, Royal Holloway, University of London, Egham, UK, 1996. [Google Scholar]
- Ibrahim, K.; Jbara, H. Removal of paraquat from synthetic wastewater using phillipsite–faujasite tuff from Jordan. J. Hazard. Mater. 2009, 163, 82–86. [Google Scholar] [CrossRef] [PubMed]
- Rawajfih, Z.; Al Mohammad, H.; Nsour, N.; Ibrahim, K. Study of equilibrium and thermodynamic adsorption of α-picoline, β-picoline, and γ-picoline by Jordanian zeolites: Phillipsite and faujasite. Microporous Mesoporous Mater. 2010, 132, 401–408. [Google Scholar] [CrossRef]
- Al Dwairi, R.; Ibrahim, K.M.; Khoury, H.N. Potential use of faujasite–phillipsite and phillipsite–chabazite tuff in purification of treated effluent from domestic wastewater treatment plants. Environ. Earth Sci. 2014, 71, 5071–5078. [Google Scholar] [CrossRef]
- Hussein, M.M.; Khader, K.M.; Musleh, S.M. Characterization of raw zeolite and surfactant-modified zeolite and their use in removal of selected organic pollutants from water. Int. J. Chem. Sci. 2014, 12, 815–884. [Google Scholar]
- Al-Haj-Ali, A.; Marashdeh, L.M. Removal of aqueous chromium (III) ions using Jordanian natural zeolite tuff in batch and fixed bed modes. Jordan J. Earth Environ. Sci. 2014, 6, 45–51. [Google Scholar]
- Ibrahim, K.M.; Nasser Ed-Deen, T.; Khoury, H. Use of natural chabazite-phillipsite tuff in wastewater treatment from electroplating factories in Jordan. Environ. Geol. 2002, 41, 547–551. [Google Scholar] [CrossRef]
- Shammout, N. Removal of Selected Heavy Metals Using Jordanian Zeolites. Master’s Thesis, University of Jordan, Amman, Jordan, 1993. [Google Scholar]
- Shaheen, S.M.; Derbalah, A.S.; Moghanm, F.S. Removal of heavy metals from aqueous solution by zeolite in competitive sorption system. Int. J. Environ. Sci. Dev. 2012, 3, 362–367. [Google Scholar] [CrossRef]
- Kitsopoulos, K.P. Cation-exchange capacity (CEC) of zeolitic volcaniclastic materials: Applicability of the ammonium acetate saturation (AMAS) method. Clays Clay Miner. 1999, 47, 688–696. [Google Scholar] [CrossRef]
- Li, Z.; Burt, T.; Bowman, R.S. Sorption of ionizable organic eolutes by surfactant-modified zeolite. Environ. Sci. Technol. 2000, 43, 3756–3760. [Google Scholar] [CrossRef]
- Rice, E.W.; Baird, R.B.; Eaton, A.D.; Clesceri, L.S. Standard Methods for the Examination of Water and Wastewater; American Water Works Association and Water Environment Federation: New York, NY, USA, 2012. [Google Scholar]
- Diale, P.P.; Muzenda, E.; Zimba, J. A study of South African natural zeolites properties and applications. In Proceedings of the World Congress on Engineering and Computer Science 2 WCECS 2011, San Francisco, CA, USA, 19–21 October 2011.
- Wisconsin Department of Health. Molybdenum in Drinking Water, Public Health Service, U.S. Department of Health and Human Services P-00150 (Rev. 08/2013). Available online: https://www.dhs.wisconsin.gov/publications/p0/p00150.pdf (accessed on 19 July 2016).
- Fletcher, T.; Stephenson, G.L.; Muncaster, B.; Wren, C.D.; Spry, D.J. Scientific Criteria Document for the Development of an Interim Provincial Water Quality Objective for Molybdenum; Ontario Ministry of Environment and Energy, Standard Development Branch: Toronto, ON, Canada, 1997.
- Canadian Council of Ministers of the Environment. Molybdenum, Canadian Water Quality Guidelines for the Protection of Aquatic Life: CCME Water Quality Index 1.0, User’s Manual. Canadian Environmental Quality Guidelines. 1999. Available online: http://ceqg-rcqe.ccme.ca/download/en/195 (accessed on 19 July 2016).
- Jordanian Standards 286. Jordanian Standards for Drinking Water. 2008. Available online: http://ocid.nacse.org/rewab/docs/JS286_Drinking_Water_2008_ar.pdf (accessed on 17 September 2016).
- Abdul-Jaber, Q.; Khoury, H.N. Unusual mineralization in the Maqarin area (north Jordan) and the occurrence of some rare minerals in the marbles and the weathered rocks. N. Jahrb. Geol. Palaeontol. Abh. 1998, 208, 603–629. [Google Scholar]
- National Institute of Advanced Industrial Science and Technology. Atlas of Eh-pH Diagrams Intercomparison of Thermodynamic Databases; Geological Survey of Japan Open File Report No. 419; National Institute of Advanced Industrial Science and Technology: Tokyo, Japan, 2005. [Google Scholar]
- Colella, C. Recent Advances in Natural Zeolite Applications Based on External Surface Interaction with Cations and Moleculs. Stud. Surf. Sci. Catal. 2007, 170, 2063–2073. [Google Scholar]
- Arbuznikov, A.; Vasilyev, V.; Goursot, A. Relationships between the structure of a zeolite and its adsorption properties. Surf. Sci. 1998, 397, 395–405. [Google Scholar] [CrossRef]
- Ames, L. Zeolite cation selectivity. Can. Miner. 1965, 8, 325–333. [Google Scholar]
- Ziyath, A.M.M. Removal of Toxic Metals in Multi Metal System Using Sorbents for Potential Application to Urban Stormwater Treatment. Ph.D. Thesis, Queensland University of Technology, Brisbane, Australia, 2012. [Google Scholar]
- Faghihian, H.; Malekpour, A.; Maragheh, M.G. Adsorption of molybdate ion by natrolite and clinoptilolite-rich tuffs. J. Environ. Pollut. 2002, 18, 181–189. [Google Scholar] [CrossRef]
- Nishihama, S.; Yoshizuka, K. Ion exchange adsorption of molybdenum with zeolitic adsorbent. J. Environ. Eng. Manag. 2009, 19, 365–369. [Google Scholar]
- Faghihian, H.; Malekpour, A.; Maragheh, M.G. Modification of clinoptilolite by surfactants for molybdate (99Mo) adsorption from aqueous solutions. J. Sci. Islam. Repub. Iran 2003, 14, 239–245. [Google Scholar]
- Verbinnen, B.; Block, C.; Hannes, D.; Lievens, P.; Vaclavikova, M.; Stefusova, K.; Gallios, G.; Vandecasteele, C. Removal of molybdate anions from water by adsorption on zeolite-supported magnetite. Water Environ. Res. 2012, 84, 753–760. [Google Scholar] [CrossRef] [PubMed]


| Chemical Analysis (wt %) | Tall Mufteya (TM) | Jabal Hannoun (HN) (1) |
|---|---|---|
| SiO2 (wt %) | 38.49 | 40.05 |
| TiO2 | 0.90 | 2.61 |
| Al2O3 | 14.43 | 16.23 |
| Fe2O3 | 11.00 | 8.30 |
| MgO | 7.76 | 6.70 |
| CaO | 10.35 | 4.45 |
| Na2O | 2.42 | 3.84 |
| K2O | 1.73 | 2.77 |
| LOI | 12.41 | 14.50 |
| Total | 99.49 | 99.45 |
| Grain size (mm) | 1–0.3 mm | 1–0.3 mm |
| Surface area (m2)/g) | 60.32 | 87.61 (2) |
| CEC (meq/100 g) | 180 | 154 |
| AEC (meq/100 g) | 121 | |
| Mineralogy | ||
| Zeolite minerals | phillipsite, chabazite | faujasite, phillipsite |
| Zeolite grade (wt %) | 55 | 65 (3) |
| Well No. | 5 | 11 | 12 | 13 |
|---|---|---|---|---|
| Mo Conc. μg/L | 550 | 790 | 330 | 400 |
| pH | 7.25 | 7.05 | 7.01 | 6.93 |
| Eh (mV) | 80 | 140 | −20 | 30 |
| EC (μS/cm) | 765 | 818 | 805 | 840 |
| Turbidity (NTU) | 0.46 | 0.4 | 0.70 | 0.24 |
| Temperature °C | 26° | 27.9° | 27° | 26° |
| Major Ions | Conc. (mg/L) |
| Ca | 103.78 |
| Mg | 35.65 |
| Cl | 44.00 |
| Na | 21.89 |
| Si | 9.438 |
| Trace Elements | Conc. (μg/L) |
| Mo | 550 |
| Sr | 552.42 |
| Ba | 116.52 |
| Br | 141 |
| Ni | 110 |
© 2016 by the authors; licensee MDPI, Basel, Switzerland. This article is an open access article distributed under the terms and conditions of the Creative Commons Attribution (CC-BY) license (http://creativecommons.org/licenses/by/4.0/).
Share and Cite
Ibrahim, K.M.; Khoury, H.N.; Tuffaha, R. Mo and Ni Removal from Drinking Water Using Zeolitic Tuff from Jordan. Minerals 2016, 6, 116. https://doi.org/10.3390/min6040116
Ibrahim KM, Khoury HN, Tuffaha R. Mo and Ni Removal from Drinking Water Using Zeolitic Tuff from Jordan. Minerals. 2016; 6(4):116. https://doi.org/10.3390/min6040116
Chicago/Turabian StyleIbrahim, Khalil M., Hani N. Khoury, and Randa Tuffaha. 2016. "Mo and Ni Removal from Drinking Water Using Zeolitic Tuff from Jordan" Minerals 6, no. 4: 116. https://doi.org/10.3390/min6040116
APA StyleIbrahim, K. M., Khoury, H. N., & Tuffaha, R. (2016). Mo and Ni Removal from Drinking Water Using Zeolitic Tuff from Jordan. Minerals, 6(4), 116. https://doi.org/10.3390/min6040116