3.1. Appearance and Physical Properties
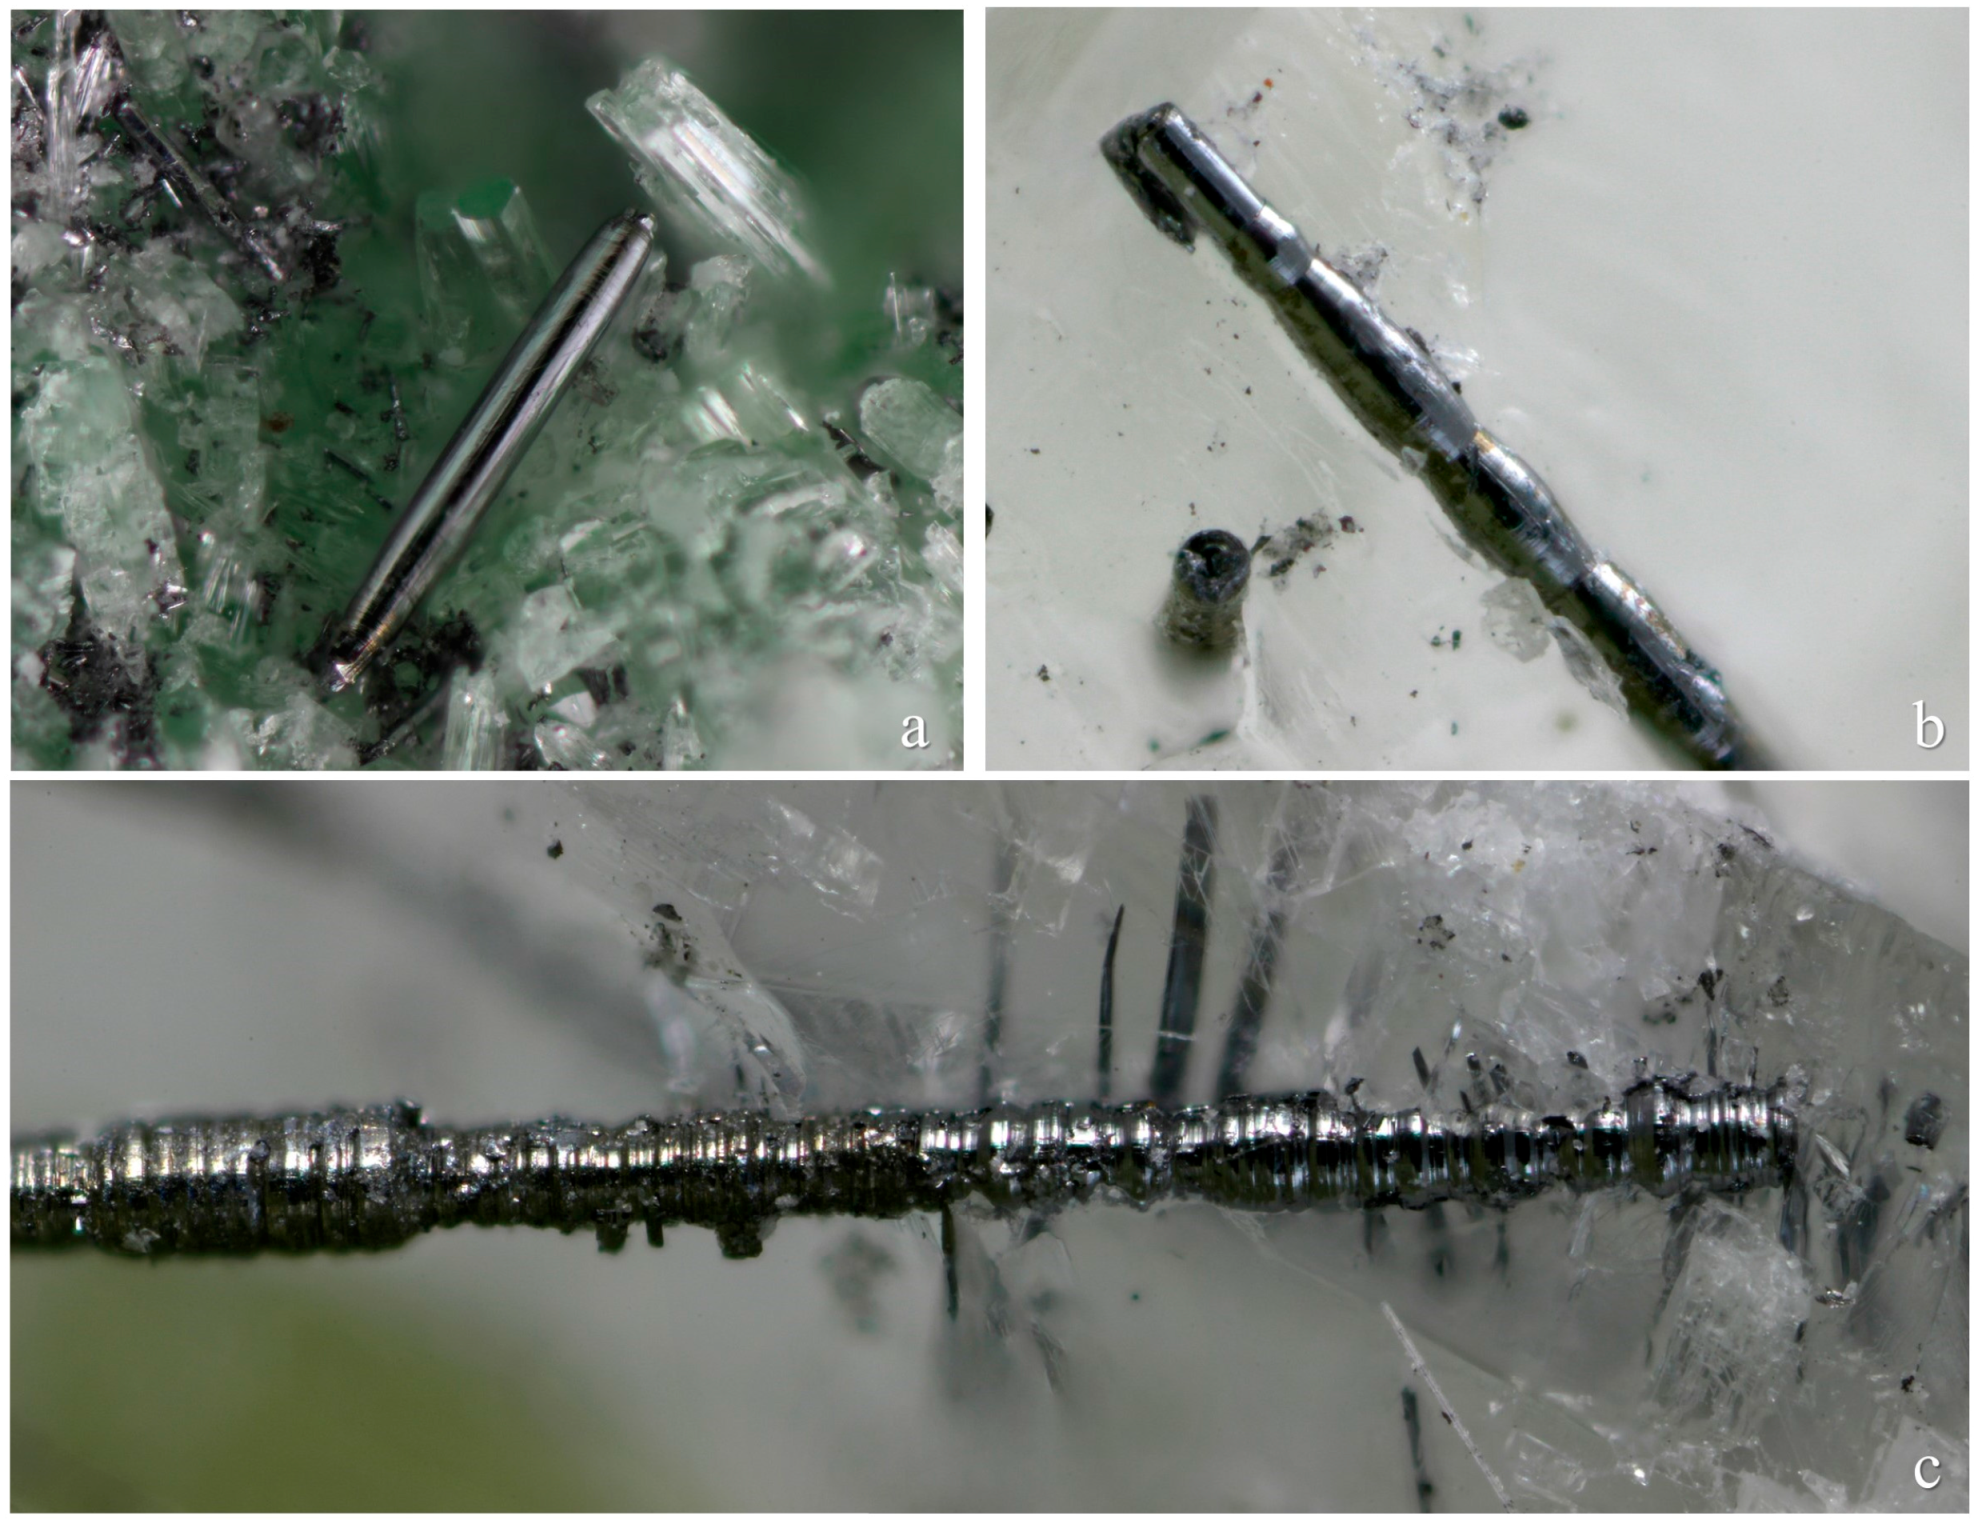
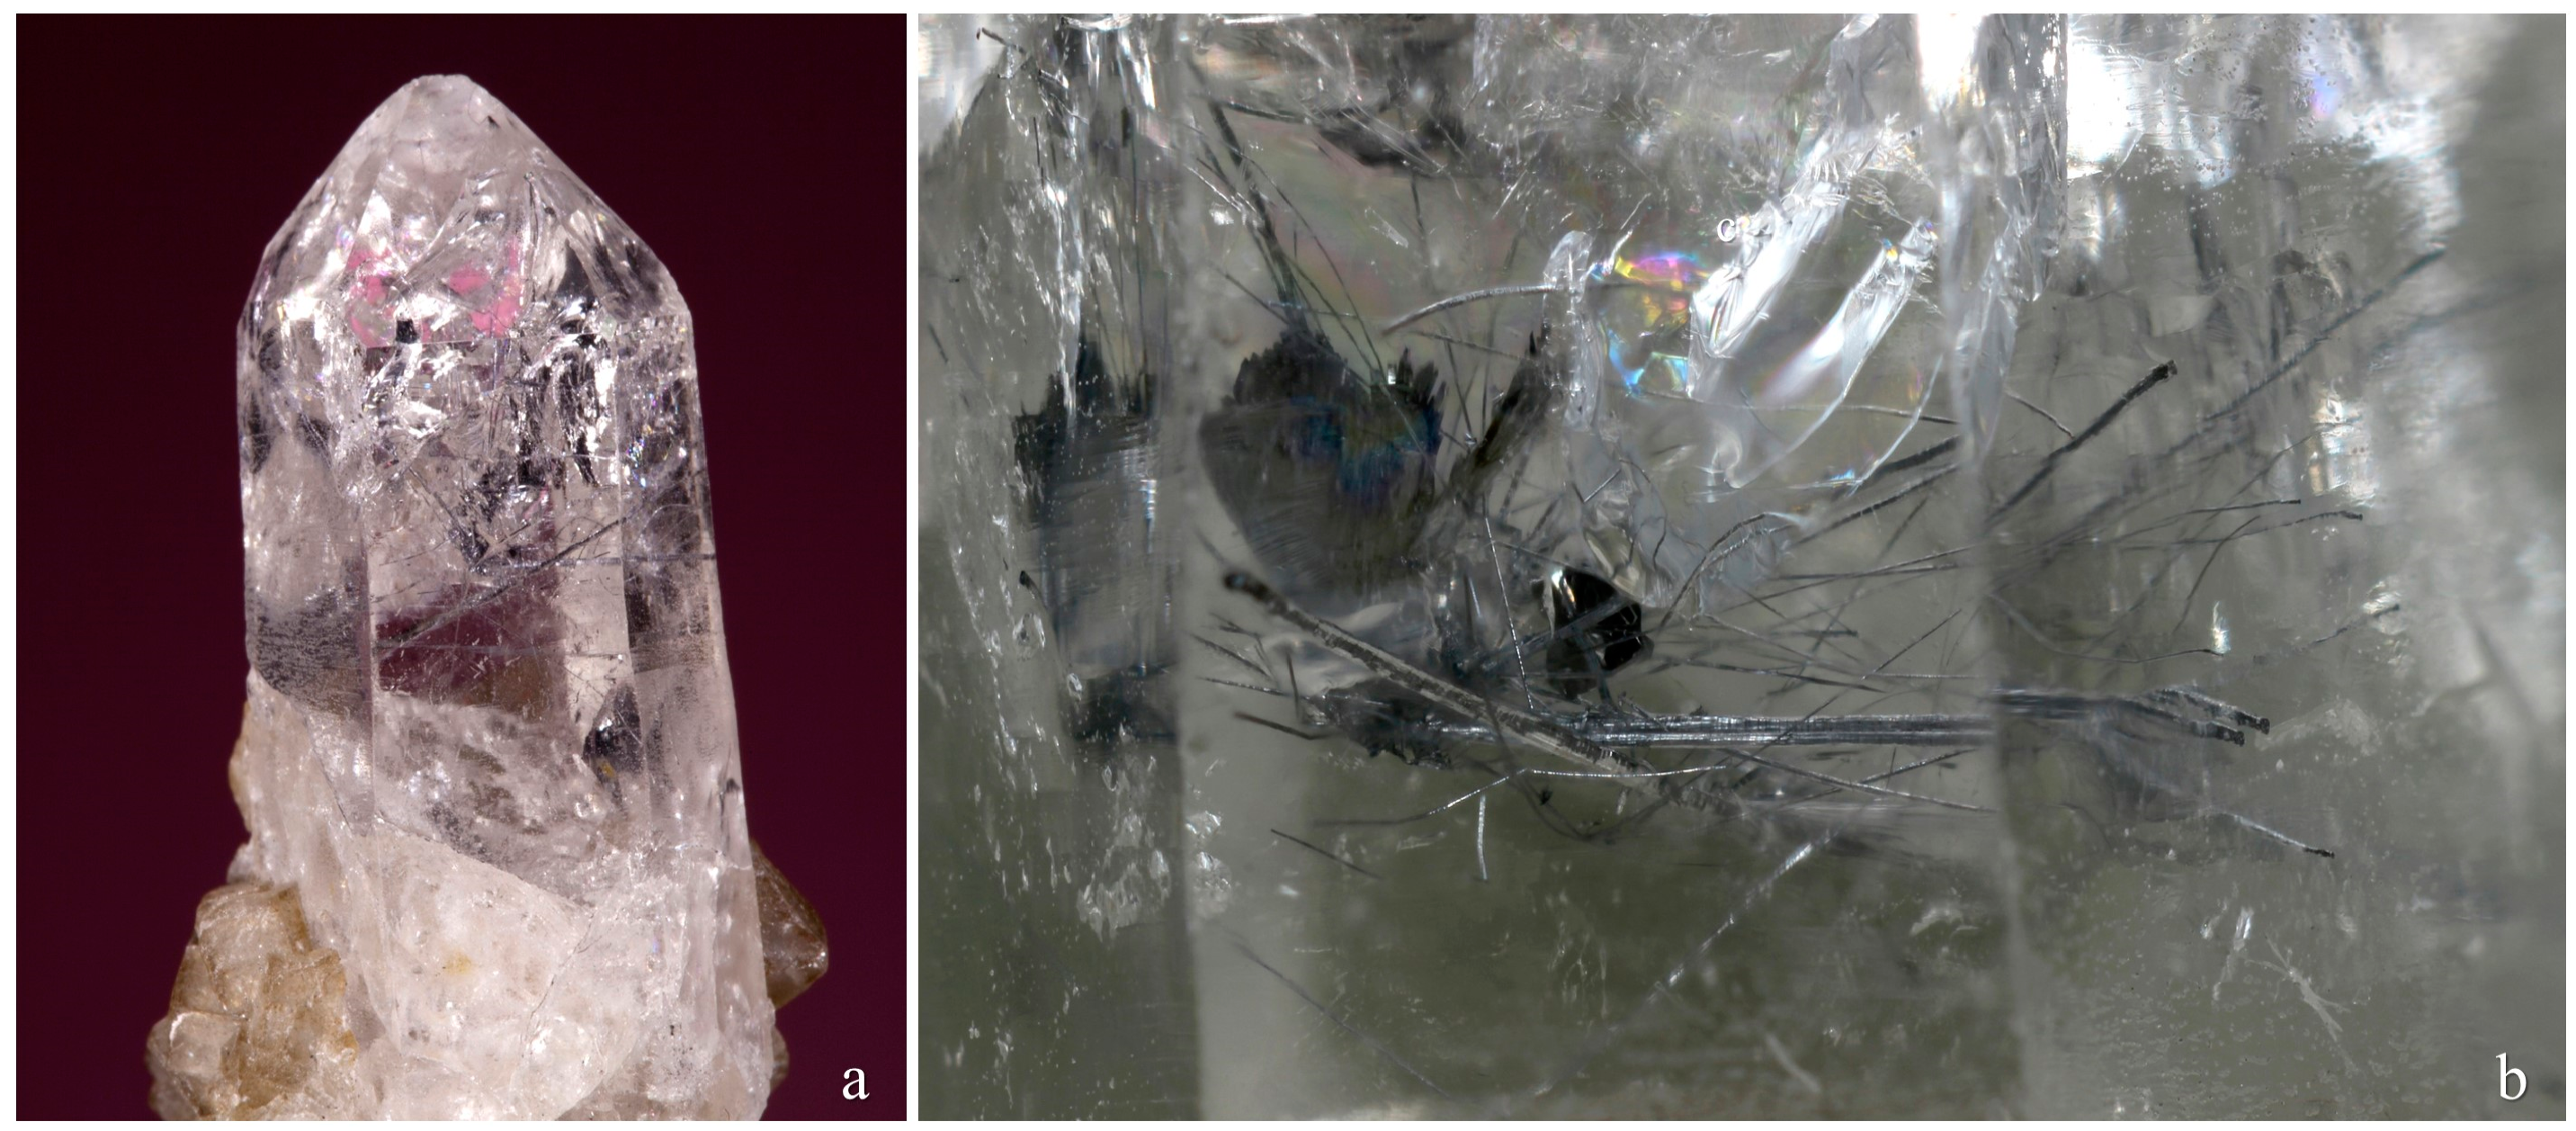
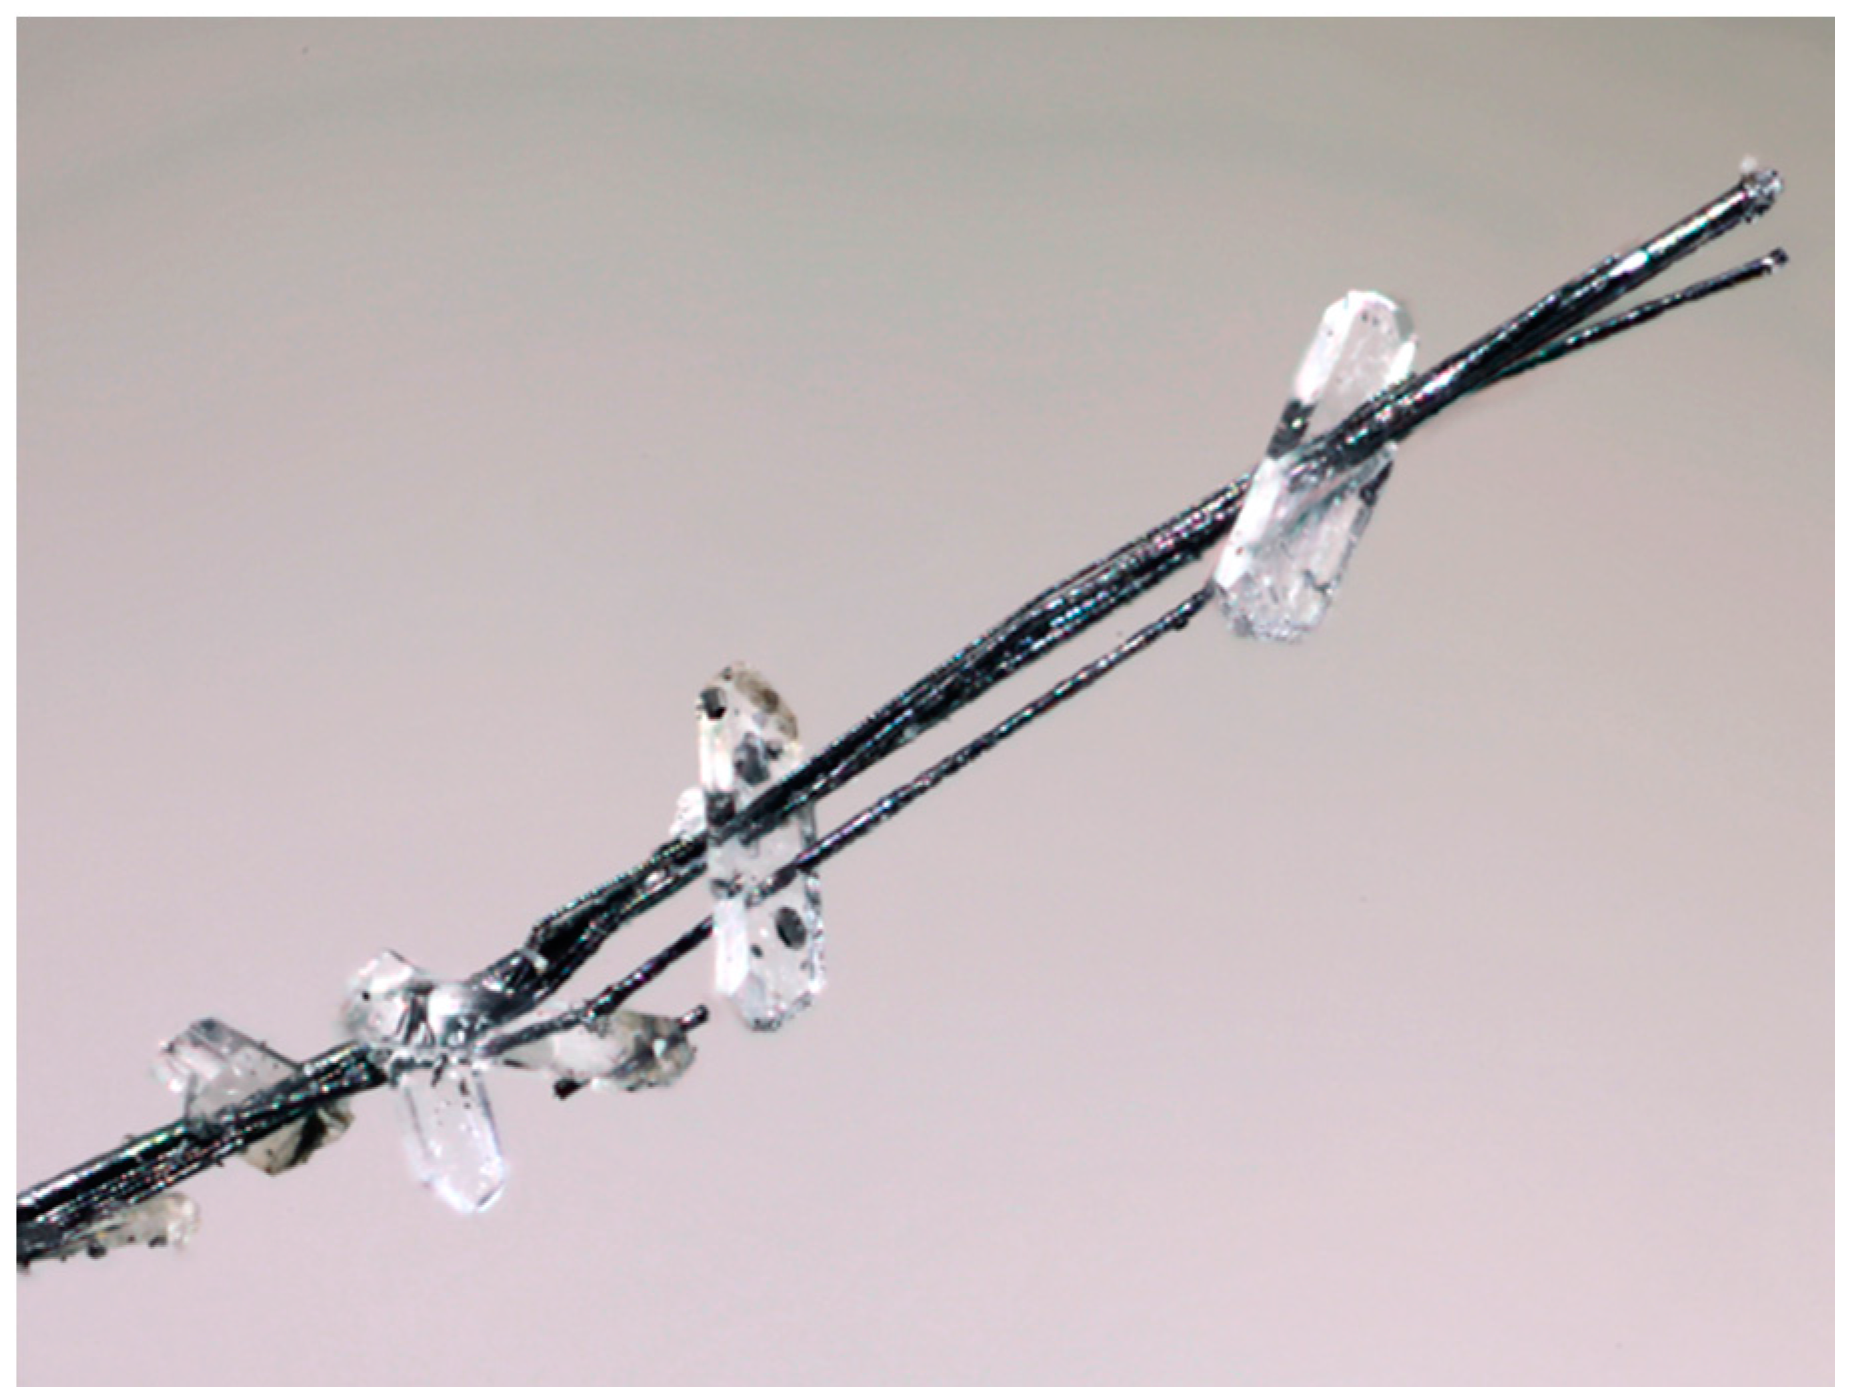
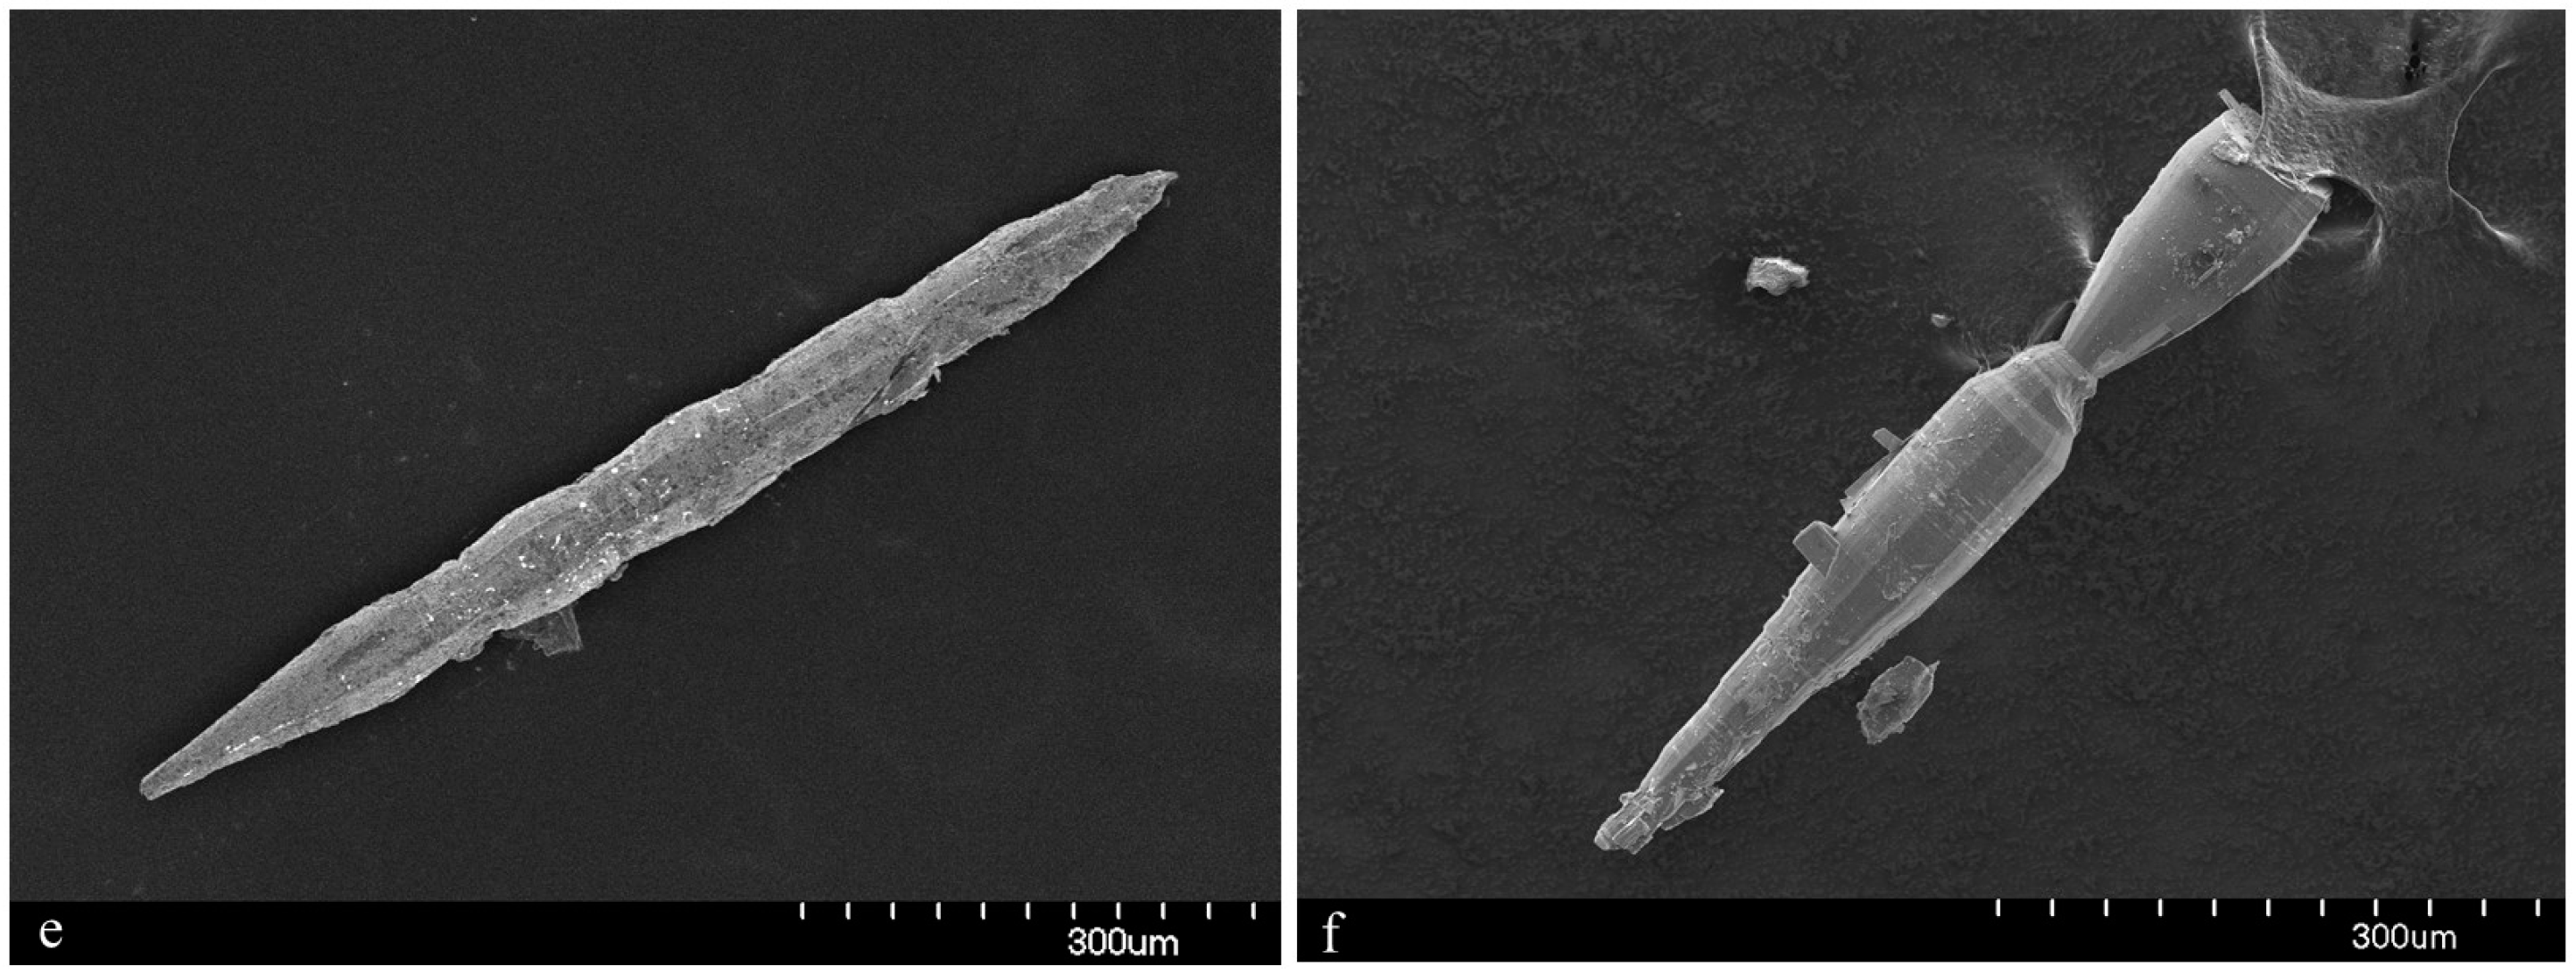
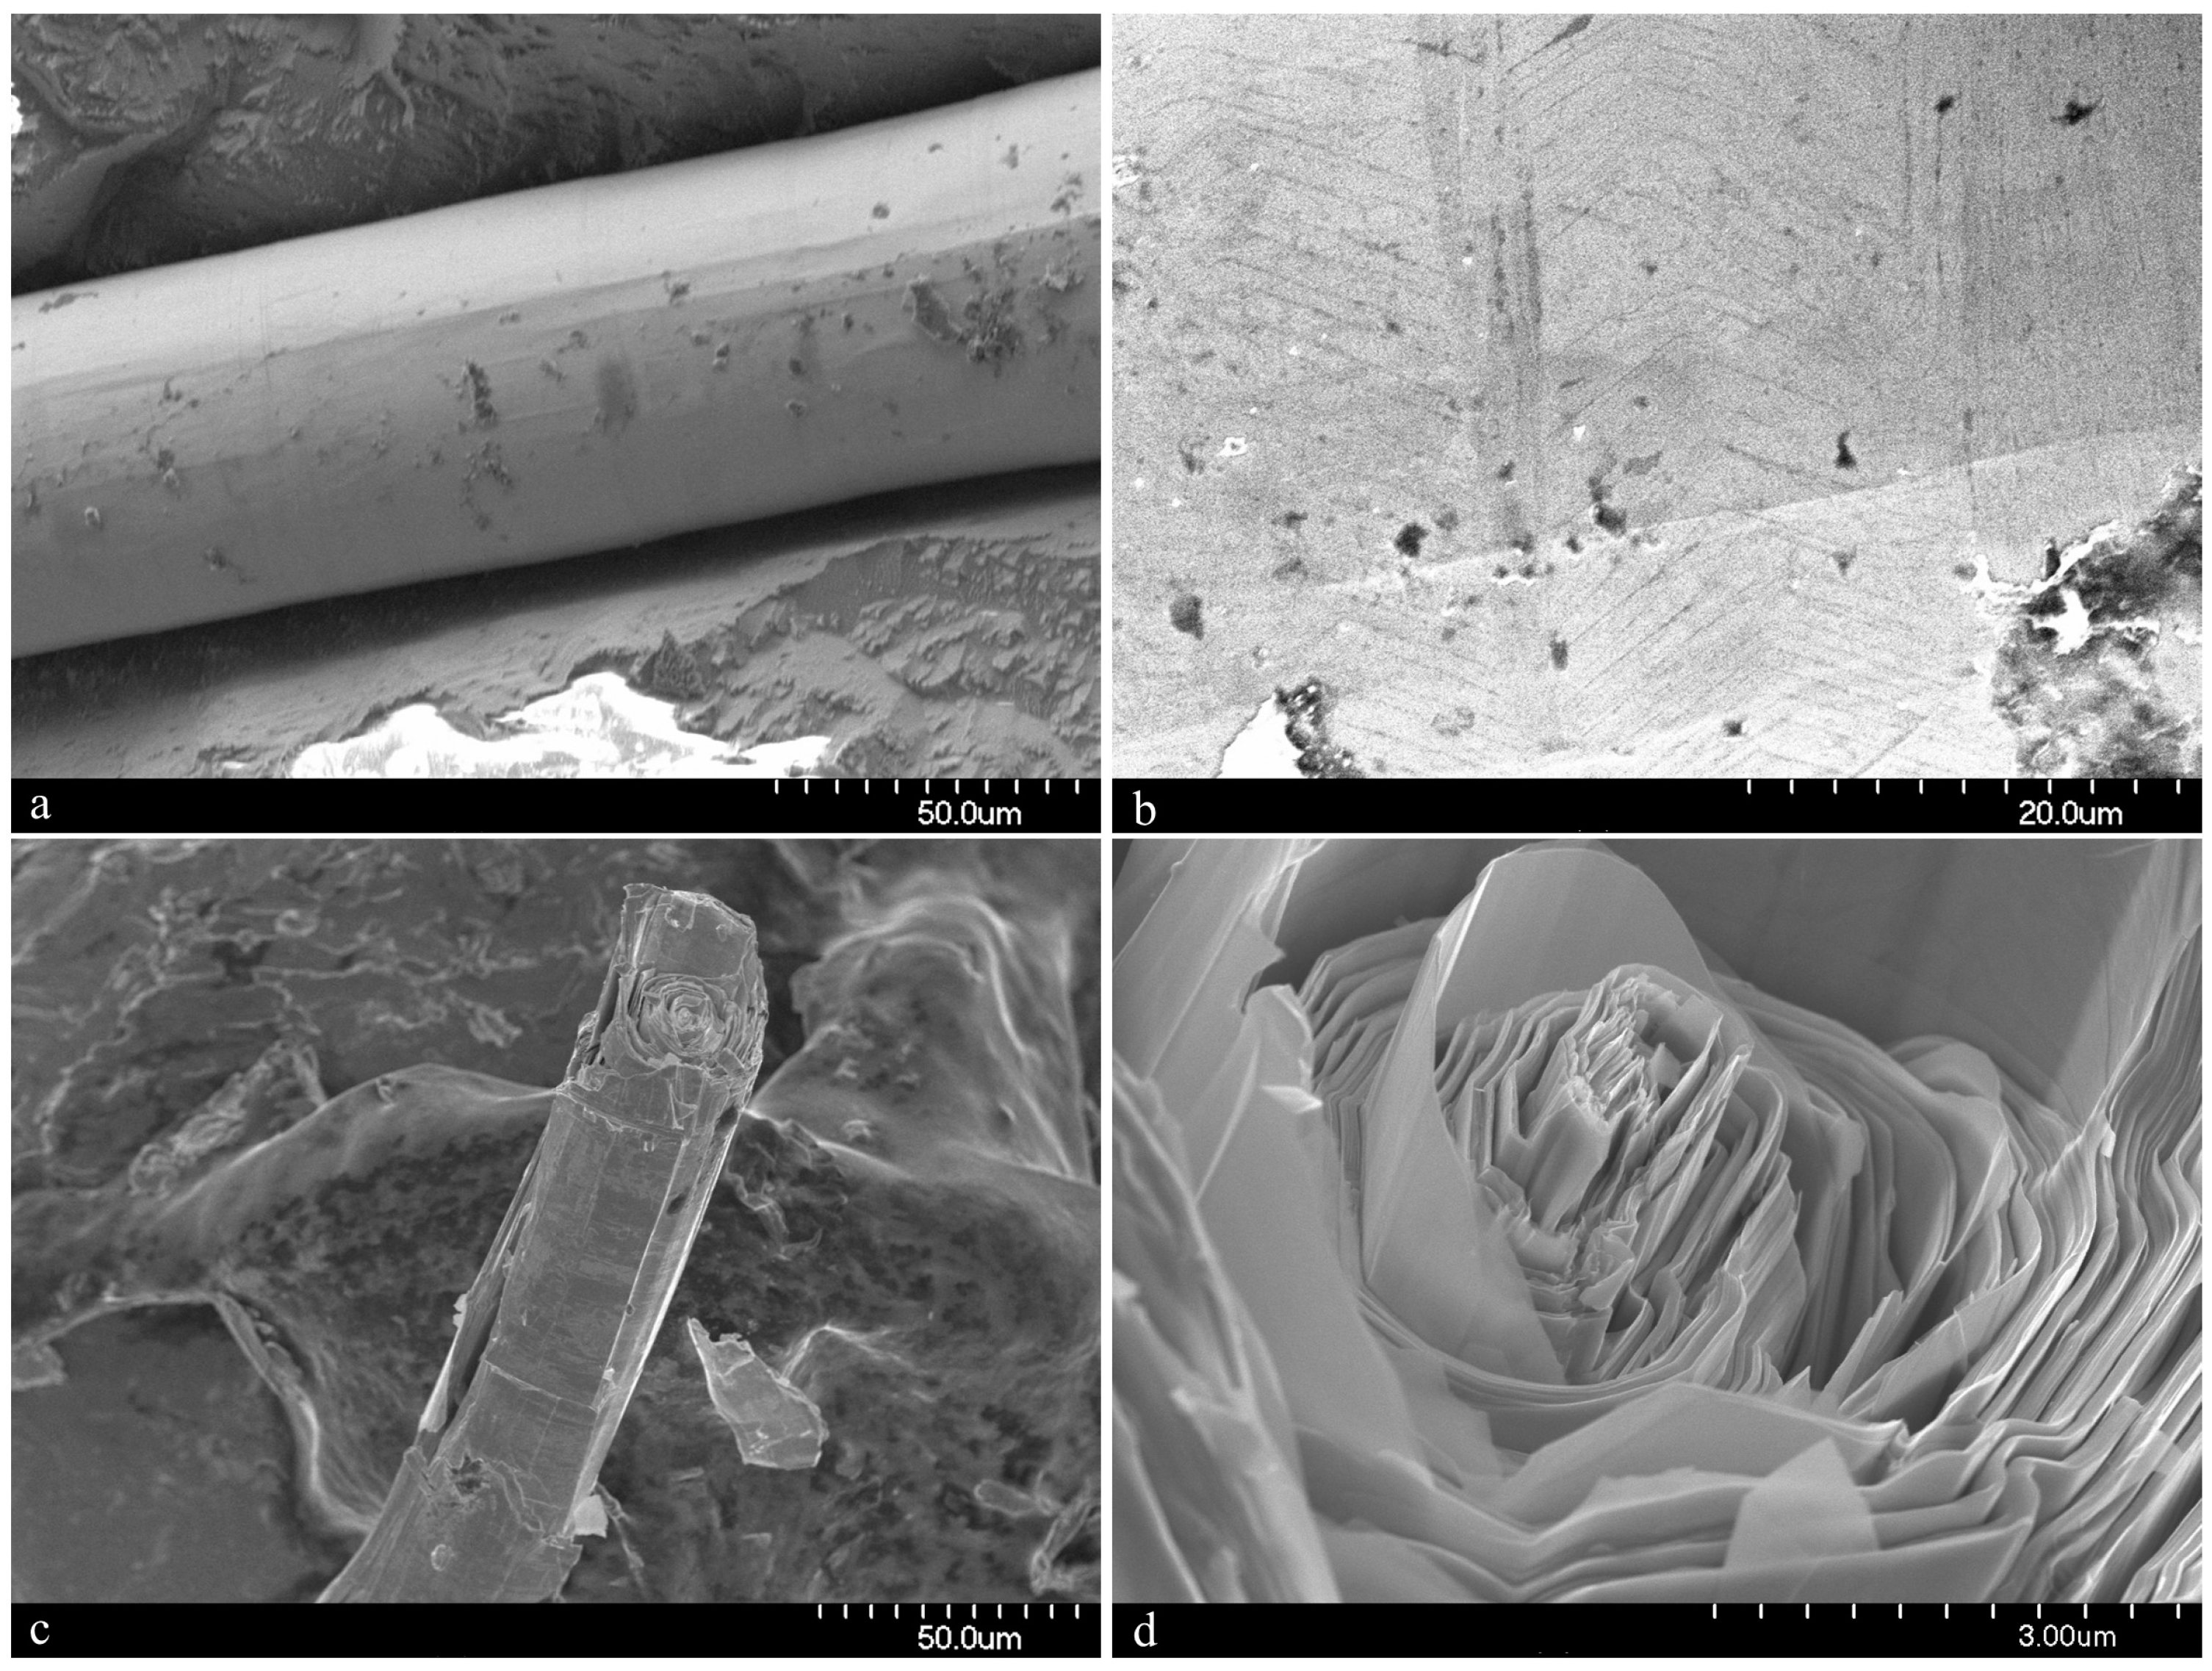
Merelaniite occurs individually and in clusters as dark gray metallic whiskers of circular cross-section (
Figure 1,
Figure 2,
Figure 3,
Figure 4 and
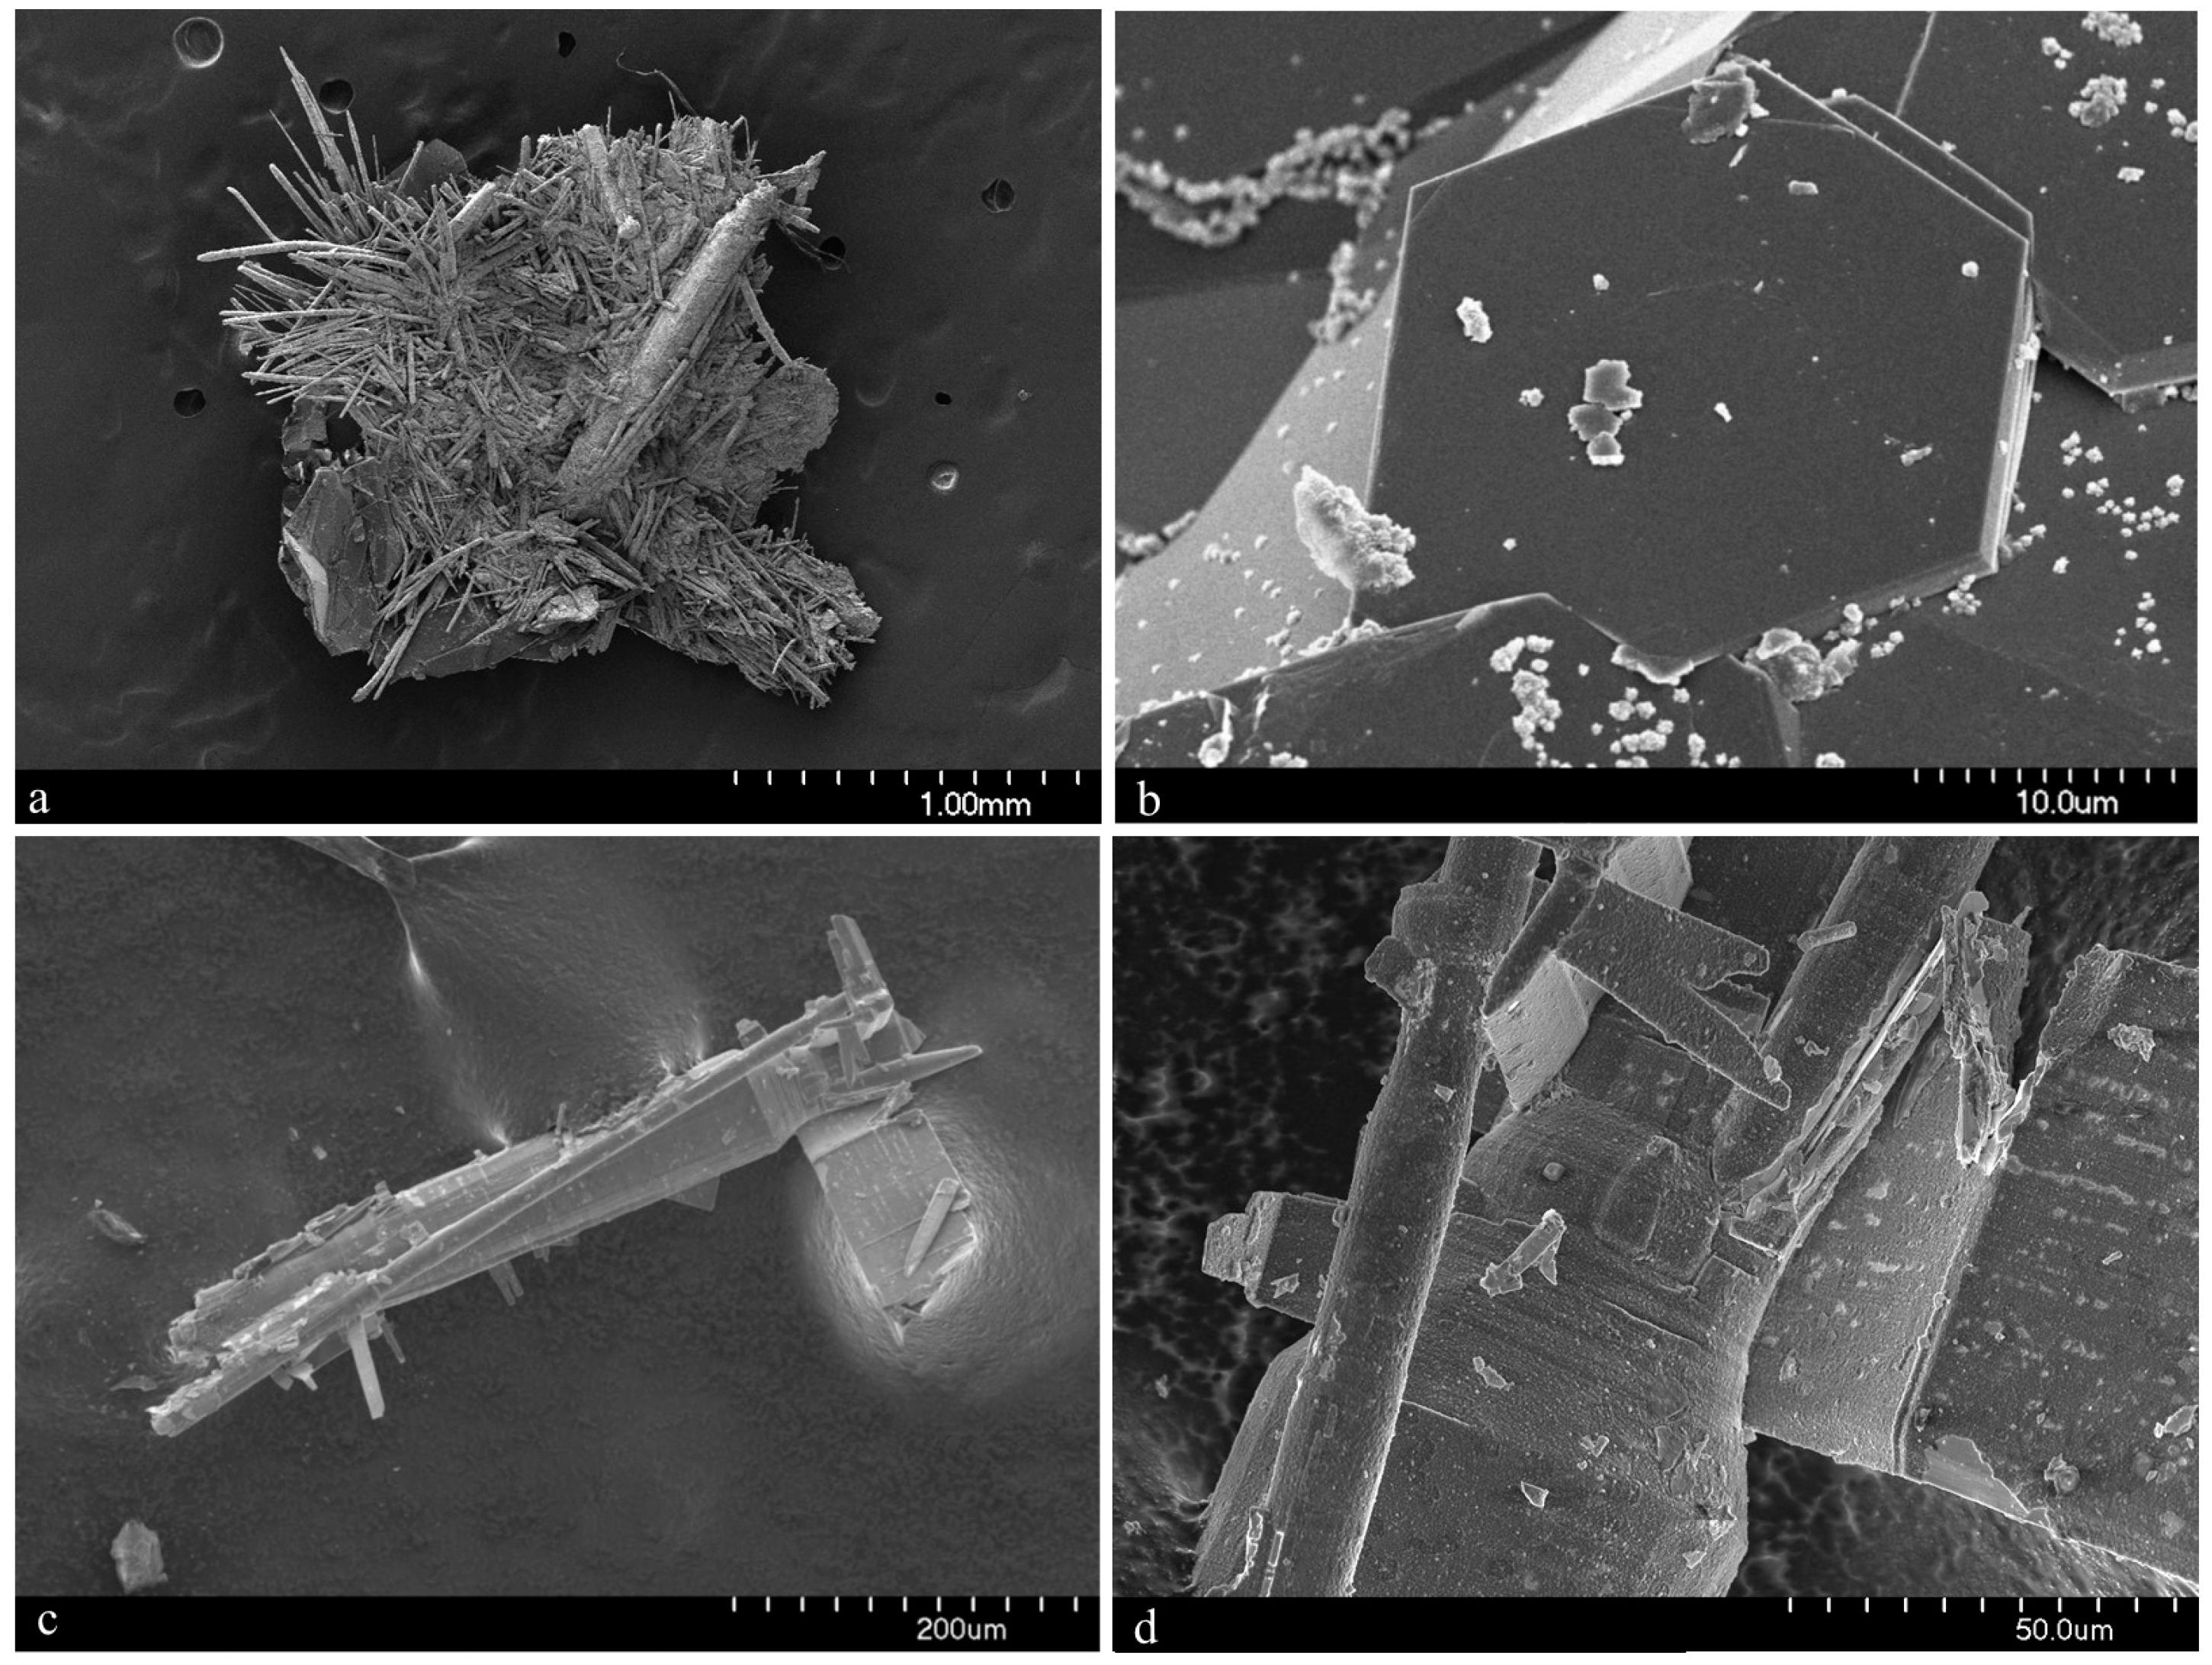
Figure 5). On further inspection, especially by scanning electron microscopy, the whiskers are revealed to be composed of tightly coiled layers and are perhaps better described as “scrolls” (
Figure 5c,d), although this is not often visible under optical microscopy. It is similar in its appearance to other minerals of the cylindrite-type.
The whiskers commonly have a varying diameter along their length (
Figure 1b,c and
Figure 4c–f), and in some examples parts of the individual lamella can be observed “peeling” away from the main cylinder or scroll (
Figure 1c and
Figure 4c,d), a process which may in part lead to the undulations observed. The whiskers regularly terminate in a conical shape (
Figure 1a and
Figure 4e,f). When viewed end on under scanning electron microscopy, broken whiskers reveal the lamellar nature of the scroll-like structure (
Figure 5c,d). As a member of the extended cylindrite group of minerals, traditional crystals are not observed. Instead the scroll-like whiskers are the manifestation of a single tightly coiled flat crystal.
In the holotype specimen, the richest known example found to date, some whiskers were a little over 10 mm in length, with 12 mm being the longest individual recorded so far. The thickness, however, is never more than 100 μm. More regularly the whiskers are no more than a millimeter in length and just tens of microns in width.
Although merelaniite has been found on a number of different specimens, most of the whiskers studied during this investigation and all of those designated as “part of holotype” were isolated from just one specimen, an extremely large alabandite crystal (11 cm in maximum dimension), that contained a crevice filled with a chaotic mass of loosely bound merelaniite whiskers inter-grown with equally loosely aggregated graphite crystals (see reference [
7] (
Figure 5d,g, pp. 42–25), and reference [
10] (p. 43)), along with some rounded brown titanite crystals and colorless diopside crystals (the graphite, titanite and diopside crystals all range in size from one to a few hundred micrometers across). It is our understanding that this specimen is now in private hands; however, before it was purchased a volume of whiskers from the main crevice and a smaller crevice were removed for study by JAJ with permission of its then owner, Simon Harrison. Samples were subsequently passed to MSR and LB for further study. The whiskers removed from this sample (initially numbered 3665 and 3666) and used during the characterization of the material are deposited within several institutional mineral collections as noted in the Introduction.
The physical characteristics of merelaniite are summarized as follows:
Habit: massive
Forms: needles—cylindrical whiskers (tightly packed scrolls)
Twinning: None observed
Color: dark-gray, metallic
Streak: dark-gray to black
Luster: metallic; opaque
Fluorescence: not fluorescent in SW or LW UV light
Hardness (Mohs): impossible to determine accurately due to size and scroll-like lamellar nature of the material
Tenacity: malleable, flexible
Cleavage: perfect on {001}
Fracture: splintery
Density (meas.): not determined due to paucity of material
Density (calc.) = 4.895 g·cm−3 (from ideal formula, unit-cell volumes of the two pseudo-layers and Z = 1)
3.3. Raman Spectroscopy
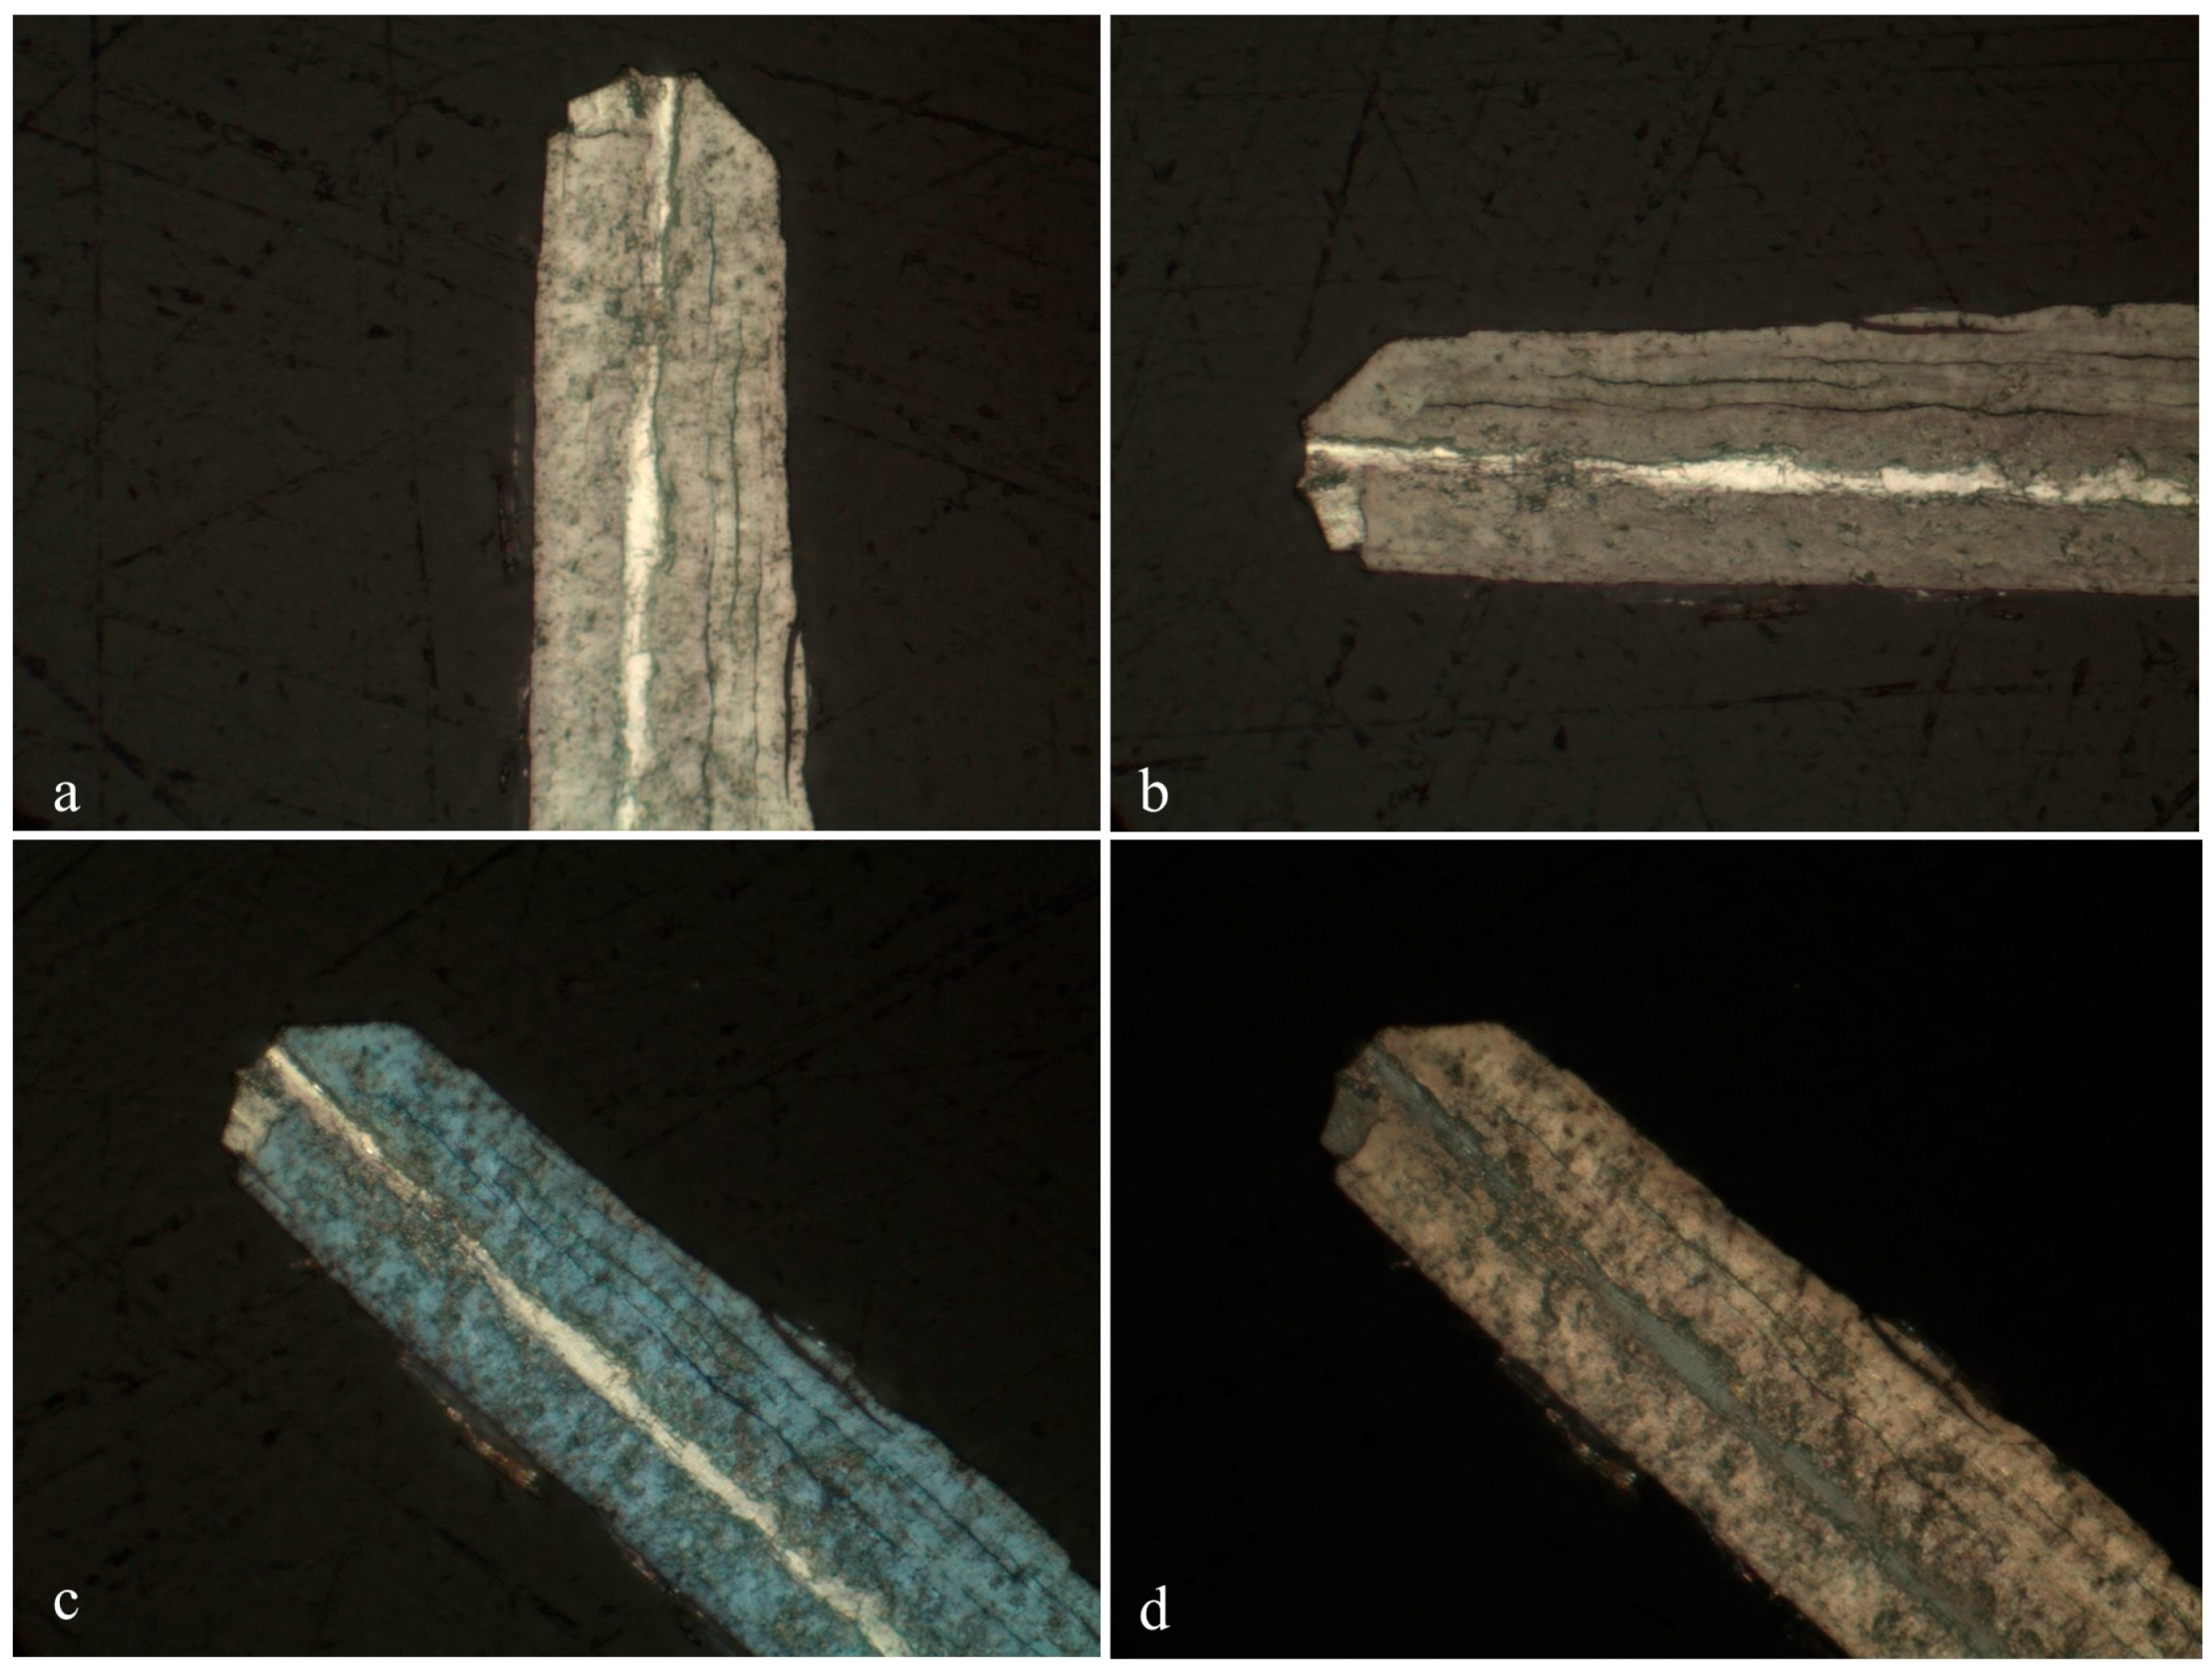
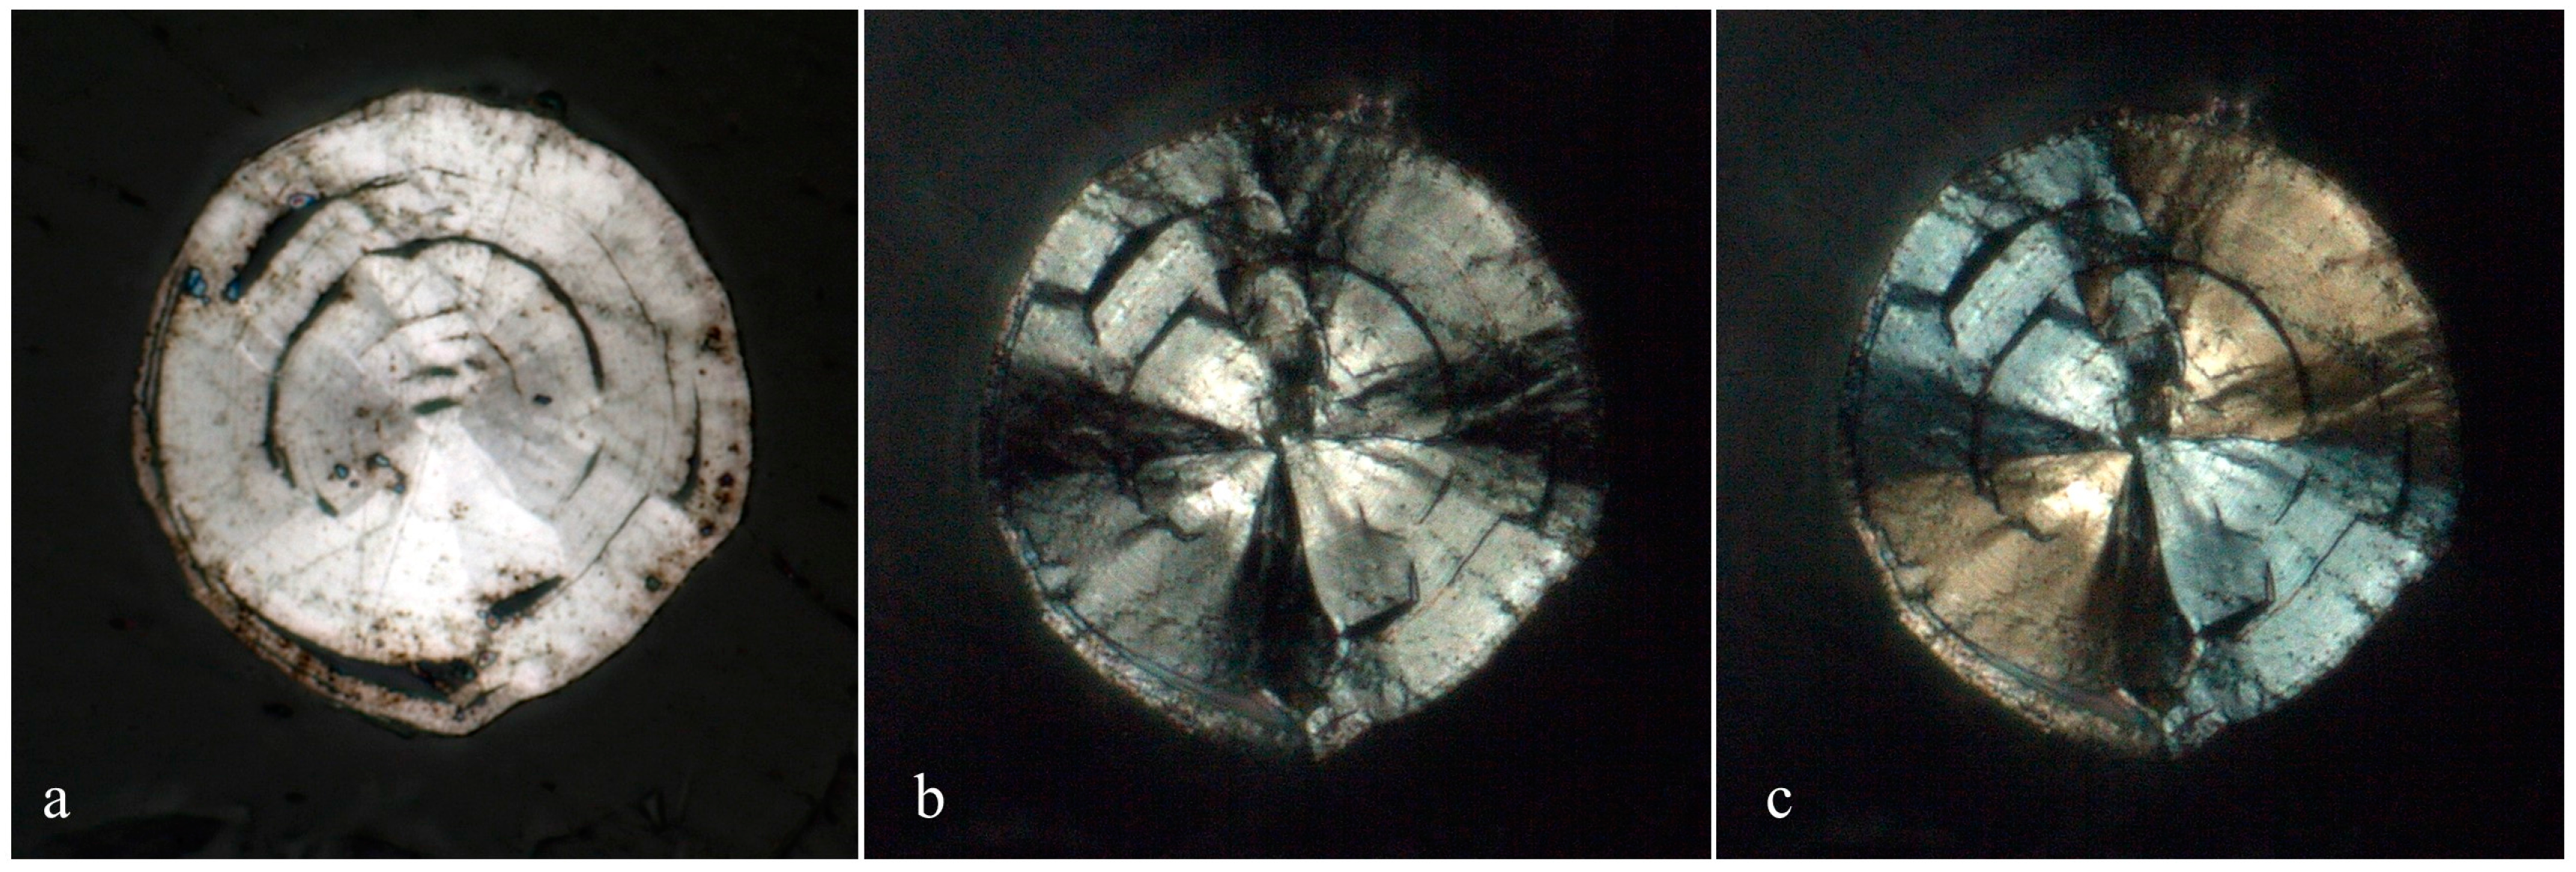
Raman spectroscopy was performed on a curved surface of a cylindrical whisker freshly exposed from enclosing calcite (piece of sample 3323) using dilute acetic acid, and on the polished sections of the samples shown in
Figure 6 and
Figure 7. The spectra shown in
Figure 8 were collected at Miami University (Oxford, OH, USA) using a Renishaw inVia Raman spectrometer (Renishaw plc, Wotton-under-Edge, Gloucestershire, UK) in backscattering geometry, with unpolarized incident laser radiation at 633-nm and 785-nm wavelengths, respective diffraction gratings with 1800 lines/mm and 1200 lines/mm, a 50× objective lens, and a laser spot size of approximately 2 μm. A neutral density filter was used to reduce the power of the laser at the sample to less than 3 mW to avoid sample heating effects (peak shifts and broadening) and sample damage. Laser-induced damage was observed at higher power levels that led to the occurrence of intense but spurious bands at 319, 870, and 930 cm
−1.
Although the relative intensities vary to some degree with respect to sample and excitation wavelength, all of the spectra show prominent Raman peaks at 324, 379, 390, and 401 cm
−1, with the peak at 401 cm
−1 typically being the most intense. A less prominent peak is also observed in most spectra near 350 cm
−1. An intense broad band manifests between 133 and 245 cm
−1, while less intense broad bands are centered near approximately 450, 570, and 780 cm
−1. The broad band at 570 cm
−1 appears to be two bands centered at 568 and 621 cm
−1 when using 785-nm radiation. Raman shifts greater than 900 cm
−1 were not observed in any spectra except for several reproducible bands at 916, 1176, 1374, and 1619 cm
−1 that can be seen in the spectrum of a polished whisker (3666ax2) excited with 633-nm radiation midway between the whisker axis and the surface. These peaks did not manifest from this sample using 785-nm radiation. Preliminary spectra were taken at Michigan Technological University with a LabRAM HR800 Raman spectrometer (HORIBA Jobin Yvon, Edison, NJ, USA) in backscattering geometry using polarized 633-nm radiation. These showed only slight changes in the relative peak intensities upon rotation of the whisker axis from parallel to perpendicular relative to the incident direction of polarization of the laser. Note that the spectrum from the brightly reflecting region near the whisker axis (3666ax2 core) is virtually indistinguishable from the spectrum from the natural surface of whisker 3323. A comparative search of Raman spectra of minerals in the RRUFF database using the CrystalSleuth program [
12] yielded no satisfactory matches.
In backscattering geometry, bulk MoS
2 exhibits three Raman peaks at approximately 33.5, 383.6 and 408.7 cm
−1, corresponding to
(interlayer shear),
(in-plane), and
(out-of-plane) vibrational modes, respectively [
13]. The
and
peaks systematically broaden and shift to approximately 386 (
) and 403 cm
−1 (
), as the number of MoS
2 layers decreases from bulk to few-layers and ultimately to monolayer thickness. MoS
2 also exhibits several other strong first-order and second-order Raman peaks due to resonant Raman scattering when incident laser wavelengths 633 and 594 nm are employed [
13,
14]. On the other hand, while the high symmetry of bulk PbS precludes first-order Raman scattering, polycrystalline PbS thin films and PbS nanocrystals exhibit a broad band at 206 cm
−1, and overlapping broad bands at 410 and 462 cm
−1 [
15]. Although merelaniite’s Raman spectra have some qualitative resemblance to the first-order Raman spectra of MoS
2 and other dichalcogenides, further studies of polarized Raman scattering using different excitation laser wavelengths will be necessary in order to more fully characterize its Raman spectrum.
3.4. Chemical Data
Several merelaniite whiskers (n = 5) from the loose pieces of BM 2016,100 were mounted onto a low-adhesive substrate, carefully placing the whiskers so as to mount them in a variety of perpendicular, inclined, and parallel orientations relative to the long axis of the whisker. They were then set in epoxy resin and polished using aluminum oxide abrasives to produce a flat surface (Probe Block P19396 of specimen BM 2016,100). Several of the perpendicular and parallel whiskers set successfully. Of those, two (one parallel and one perpendicular to the polished surface) were selected for electron microprobe analysis based on their superior homogeneity. Electron backscatter imaging showed clearly that other whiskers had increased chemical heterogeneity compared with the two selected and were therefore less suitable for chemical analysis. The two fragments studied were each about 50 μm in diameter, and the one set parallel was several hundred μm in length. Transects across each sample were performed using a CAMECA SX100 Microprobe (CAMECA, Gennevilliers, France) in WDS mode at the Natural History Museum in London using an accelerating voltage of 20 kV, a beam current of 20 nA, and a spot size of 1 μm. Full spectrometer scans were performed beforehand in order to ascertain exactly which elements were present within the sample. The elements, S (ZnS), V [Pb5(VO4)3Cl], Mn (MnTiO3), Fe (Fe-metal), As (GaAs), Mo (Mo-metal), Sb (Sb-metal), W (W-metal), Pb (PbSe), Se (PbSe), Bi and Te (Bi2Te3), and Cu (Cu-metal) were sought and calibrated against appropriate standards (shown in parentheses). Obvious candidates, Ge and Zn, based on associated mineralogy present were sought for but found to be entirely lacking across all five samples. Te and Fe were observed in some samples, but not those ultimately chosen for the characterization of merelaniite.
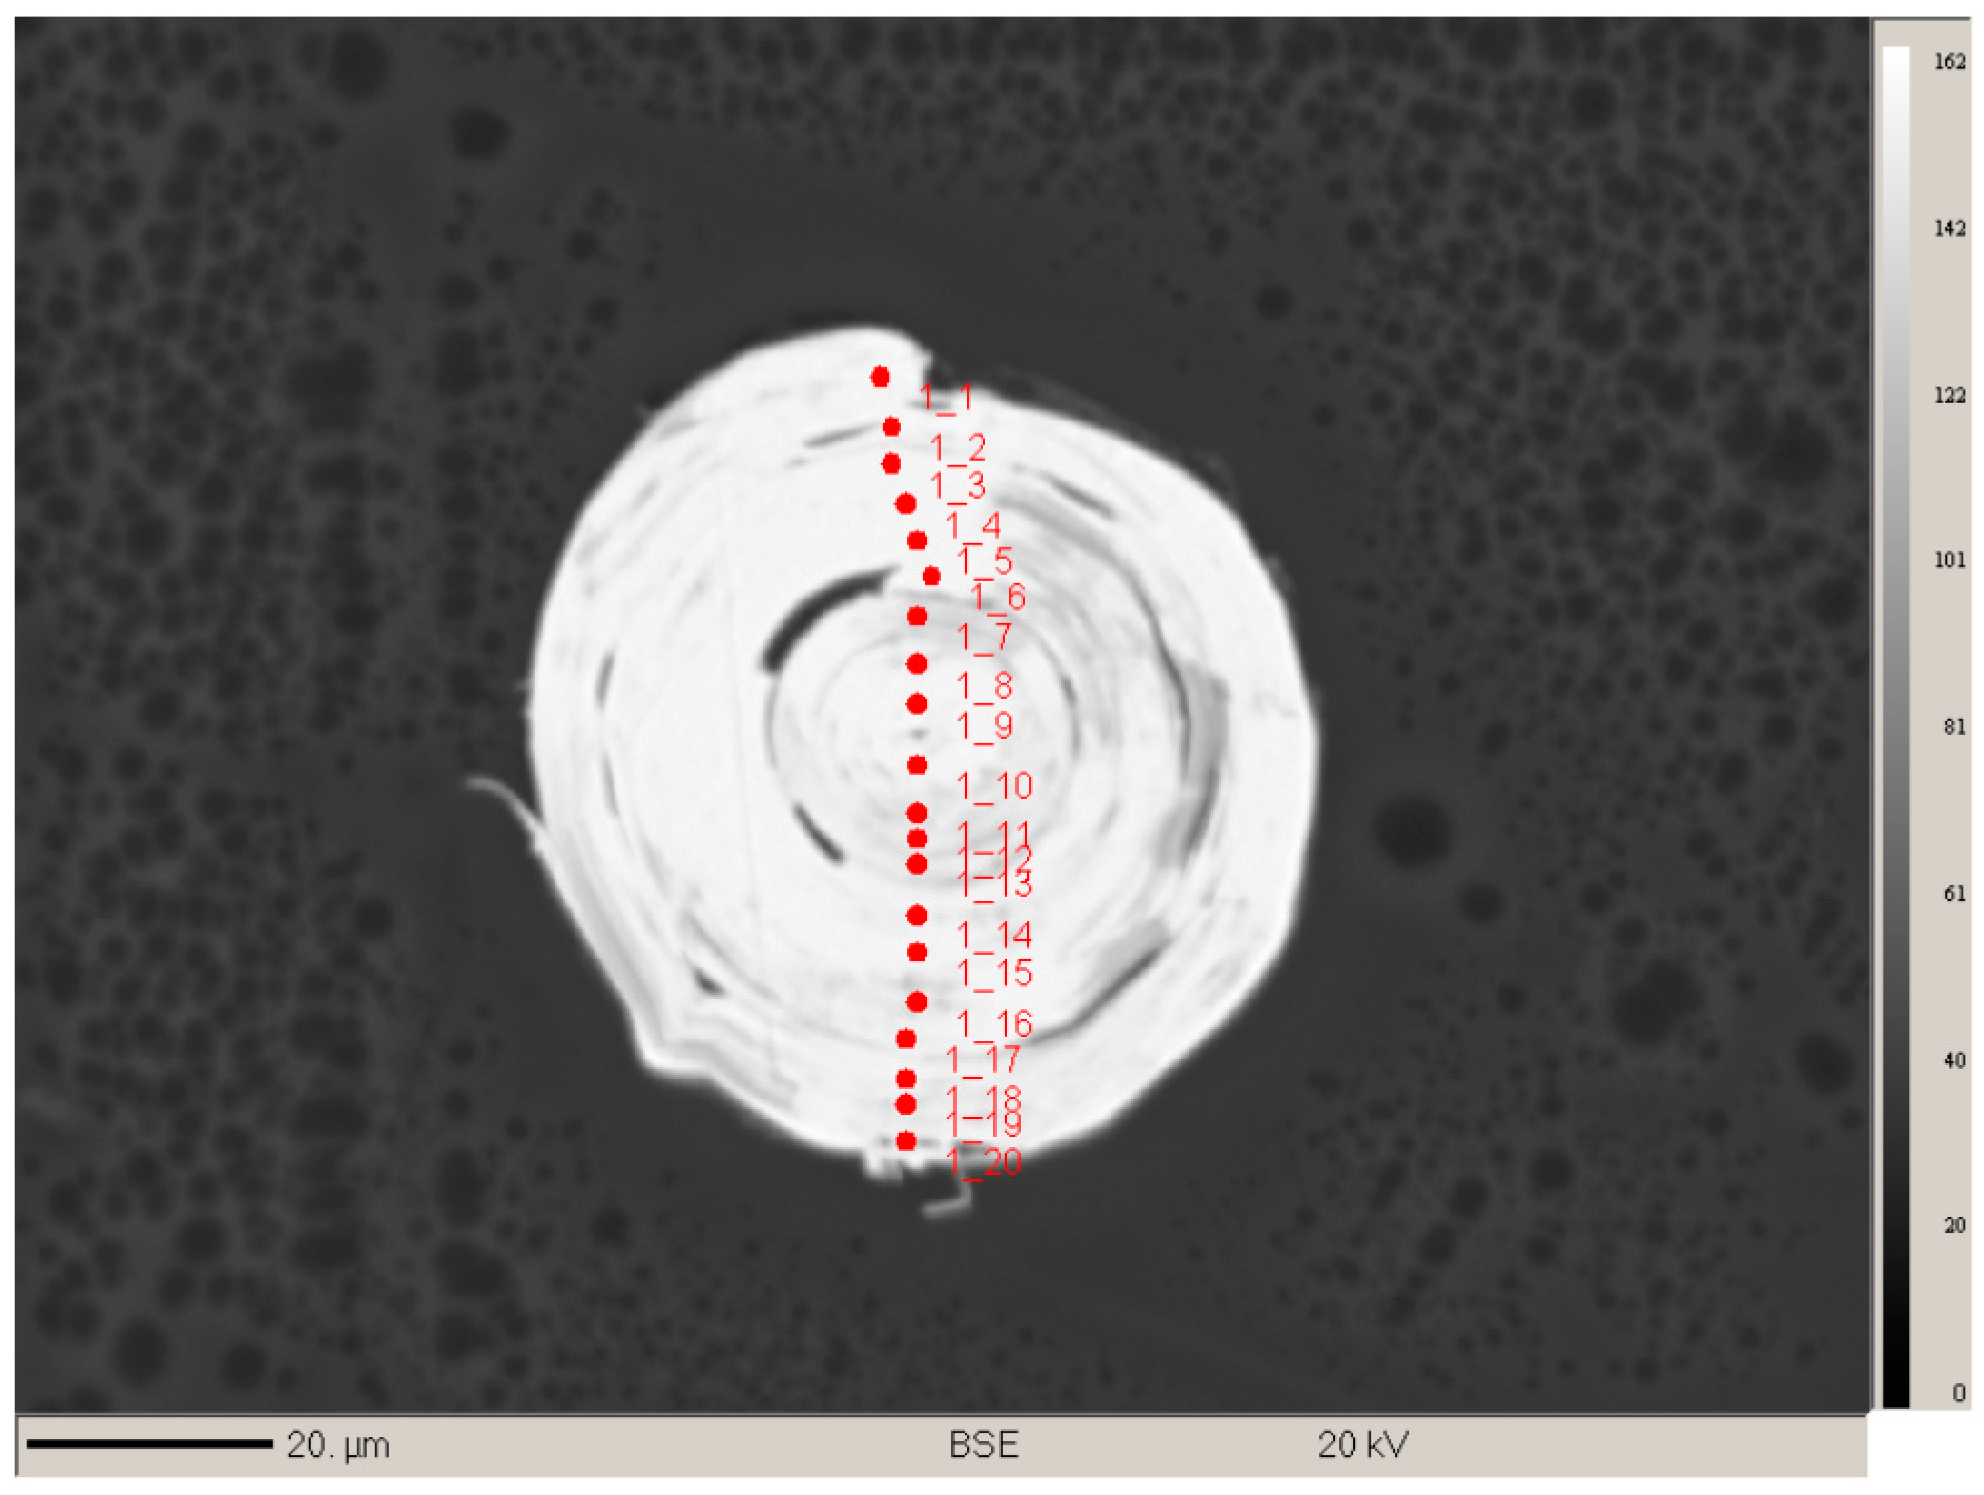
A total of 41 spot analyses were performed over the two whiskers; 20 on the whisker in perpendicular orientation (
Figure 9) and 21 on the whisker aligned in a parallel orientation. All 20 analyses on the perpendicular sample could be seen to correspond to the same phase but showed minor variations in total that are likely due to the analysis of micro-voids and epoxy which can be seen to exist between the scroll-like layers on the sample image (
Figure 9). Only totals over 95% (by weight) were used to determine average quantitative data and those between 90%–95% were used to spot chemical trends. Totals under 90% were not included in the analysis. The whisker aligned parallel shows a bimodal composition, the “core” of which is the same as the 20 analyses from the perpendicular specimen. Combining all the analyses with totals above 95% resulted in 13 being used for the determination of an “average” empirical formula. It should be noted that using all 25 results that were above 90% produces an almost identical stoichiometry. Analyses from the 13 best data points are presented in
Table 2, where corrections were applied for overlaps of Te/Sb, Bi/Pb, Bi/As, Sb/Bi, Sb/As, Sb/Mo, Pb/Mo, Pb/Bi, As/Bi, Mo/S, Mo/Pb, and Mo/Bi.
The empirical formula calculated on the basis of 15 anions per formula unit is Mo4.33Pb4.00As0.10V0.86Sb0.43Bi0.33Mn0.05W0.05Cu0.03(S14.70Se0.30)Σ15. The simplified formula is Mo4Pb4VSbS15, with a metal:sulfide (M:S) ratio of 2:3.
3.5. Crystallography
Single-crystal X-ray studies were carried out at the CRIST centre of the University of Florence, Italy, using an Oxford Diffraction Xcalibur diffractometer (Oxford Diffraction, Oxford, UK) equipped with a CCD detector, and using graphite-monochromatized MoKα radiation (λ = 0.71073 Å).
All the members of the cylindrite homologous series (see
Appendix A and references [
16,
17,
18,
19]) exhibit a combination of a pseudo-tetragonal (pseudo-quadratic layer, labeled
Q) with a pseudo-hexagonal layer (labeled
H). The
Q layer is a (100) slab of the PbS/NaCl archetype, two to four atoms thick (for instance, two in cylindrite, four in franckeite); the
H layer is a CdI
2-type layer that can be one-octahedron thick (as in cylindrite) or two-octahedra thick (as in cannizzarite) [
19]. Although cylindrite-like synthetic compounds with
H layers of the NbS
2/TaS
2-type (with cations in a triangular prismatic coordination, one, two or three layers thick, and van der Waals bonding between
H layers in the multiple-layer cases) have been described ([
20] and references therein), merelaniite (with MoS
2 layers) represents the first case of triangular-prismatic coordination of the
H layers occurring in nature. In the following, the
a and
b directions are parallel to the layers, and
c is the layer-stacking direction, and
aH is parallel to
bQ. The orientation of the
a and
b directions relative to the whisker axis is currently unknown.
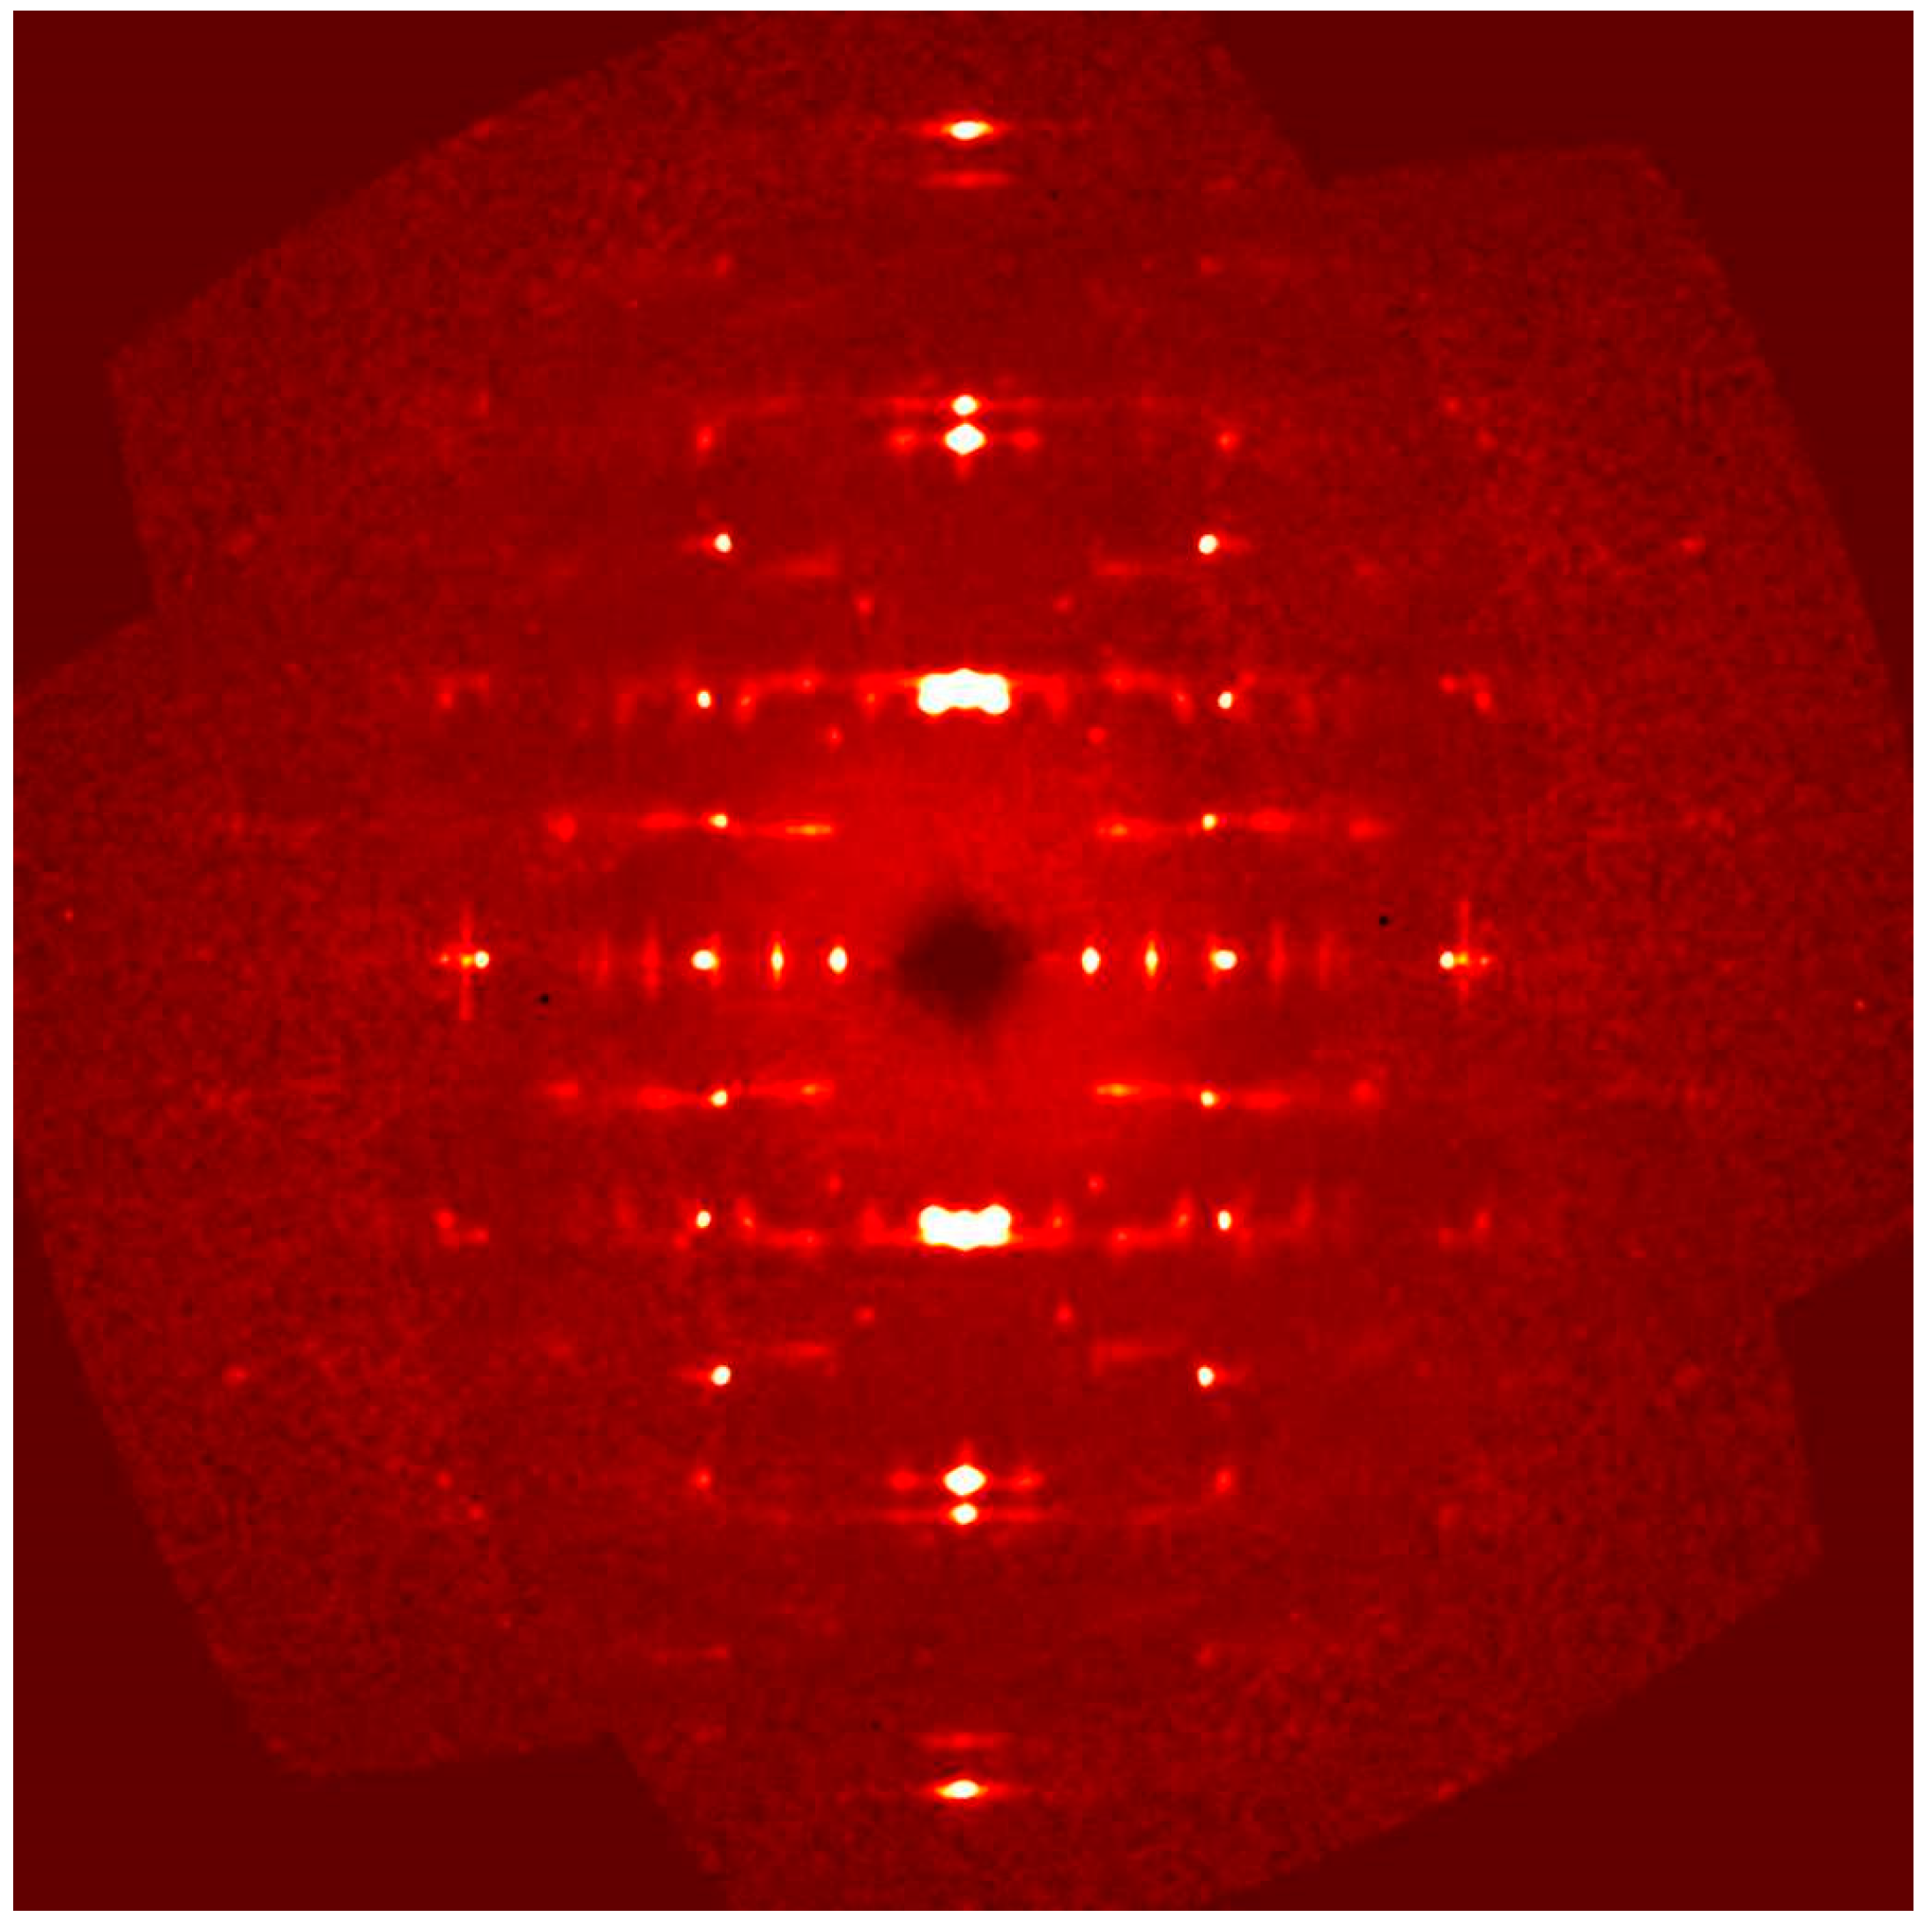
Although the diffraction quality was very poor (
Figure 10), we were able to determine the cell values for the two centered pseudo-tetragonal and pseudo-hexagonal sublattices (
H and
Q pseudo-layers, respectively):
Q pseudo-layer: (obtained by least-squares refinement of 41 reflections)
| Triclinic | Space group: C1 or C |
| a = 5.929(8) Å | b = 5.961(5) Å | c = 12.03(1) Å |
| α = 91.33(9)° | β = 90.88(5)° | γ = 91.79(4)° |
| V = 425(2) Å3 | Z = 4 |
H pseudo-layer: (obtained by least-squares refinement of 29 reflections)
| Triclinic | Space group: C1 or C |
| a = 5.547(9) Å | b = 3.156(4) Å | c = 11.91(1) Å |
| α = 89.52(9)° | β = 92.13(5)° | γ = 90.18(4)° |
| V = 208(2) Å3 | Z = 2 |
About 35 small fragments were studied with an Oxford Diffraction Excalibur PX Ultra diffractometer fitted with a 165 mm diagonal Onyx CCD detector and using copper radiation (CuK
α, λ = 1.54138 Å) at the CRIST centre of the University of Florence, Italy. Most of the grains did not diffract as “single-crystals” and, for this reason, overexposed (from 10 to 60 h) rotation photographs were collected. The program
CrysAlis RED was used to convert the observed diffraction rings to a conventional powder diffraction pattern (
Table 3 and
Table 4). The X-ray diffraction pattern was indexed according to the two centered pseudo-tetragonal and pseudo-hexagonal sublattices (
H and
Q pseudo-layers, respectively). The least squares refinement gave the following values:
Q pseudo-layer:
| Triclinic | Space group: C1 or C |
| a = 5.9249(8) | b = 5.987(3) | c = 12.077(6) Å |
| α = 90.61(3)° | β = 90.04(2)° | γ = 89.95(3)° |
| V = 428.4(9) Å3 | Z = 4 |
H pseudo-layer:
| Triclinic | Space group: C1 or C |
| a = 5.5503(6) | b = 3.1536(8) | c = 11.877(1) Å |
| α = 90.00(1)° | β = 90.05(1)° | γ = 89.92(2)° |
| V = 207.9(7) Å3 | Z = 2 |
Comparisons of merelaniite’s crystallographic data with other members of the cylindrite homologous series are presented in
Appendix A.
The X-ray diffraction study was coupled with a transmission electron microscope (TEM) investigation, which was done by means of a JEOL JEM-2010 TEM (Akishima, Tokyo, Japan) operating at 200 keV and 0.3 pA/cm2 current density. Selected area electron diffraction (SAED) patterns were obtained with the intermediate lens adjusted to produce cross-over at the back focal plane. Some samples were prepared by crushing whiskers mechanically in ethanol and allowing drops of the mixture to evaporate on a copper TEM grid. In addition, after many failed attempts, one sample was successfully prepared using a Leica Ultracut UCT ultramicrotome (Leica Microsystems, Vienna, Austria) on a whisker embedded in epoxy and cut normal to the whisker axis using a DiATOME diamond knife (DiATOME, Hatfield, PA, USA). High-resolution TEM images were obtained from crushed and ultramicrotomed samples, and SAED patterns were obtained from the ultramicrotomed sample.
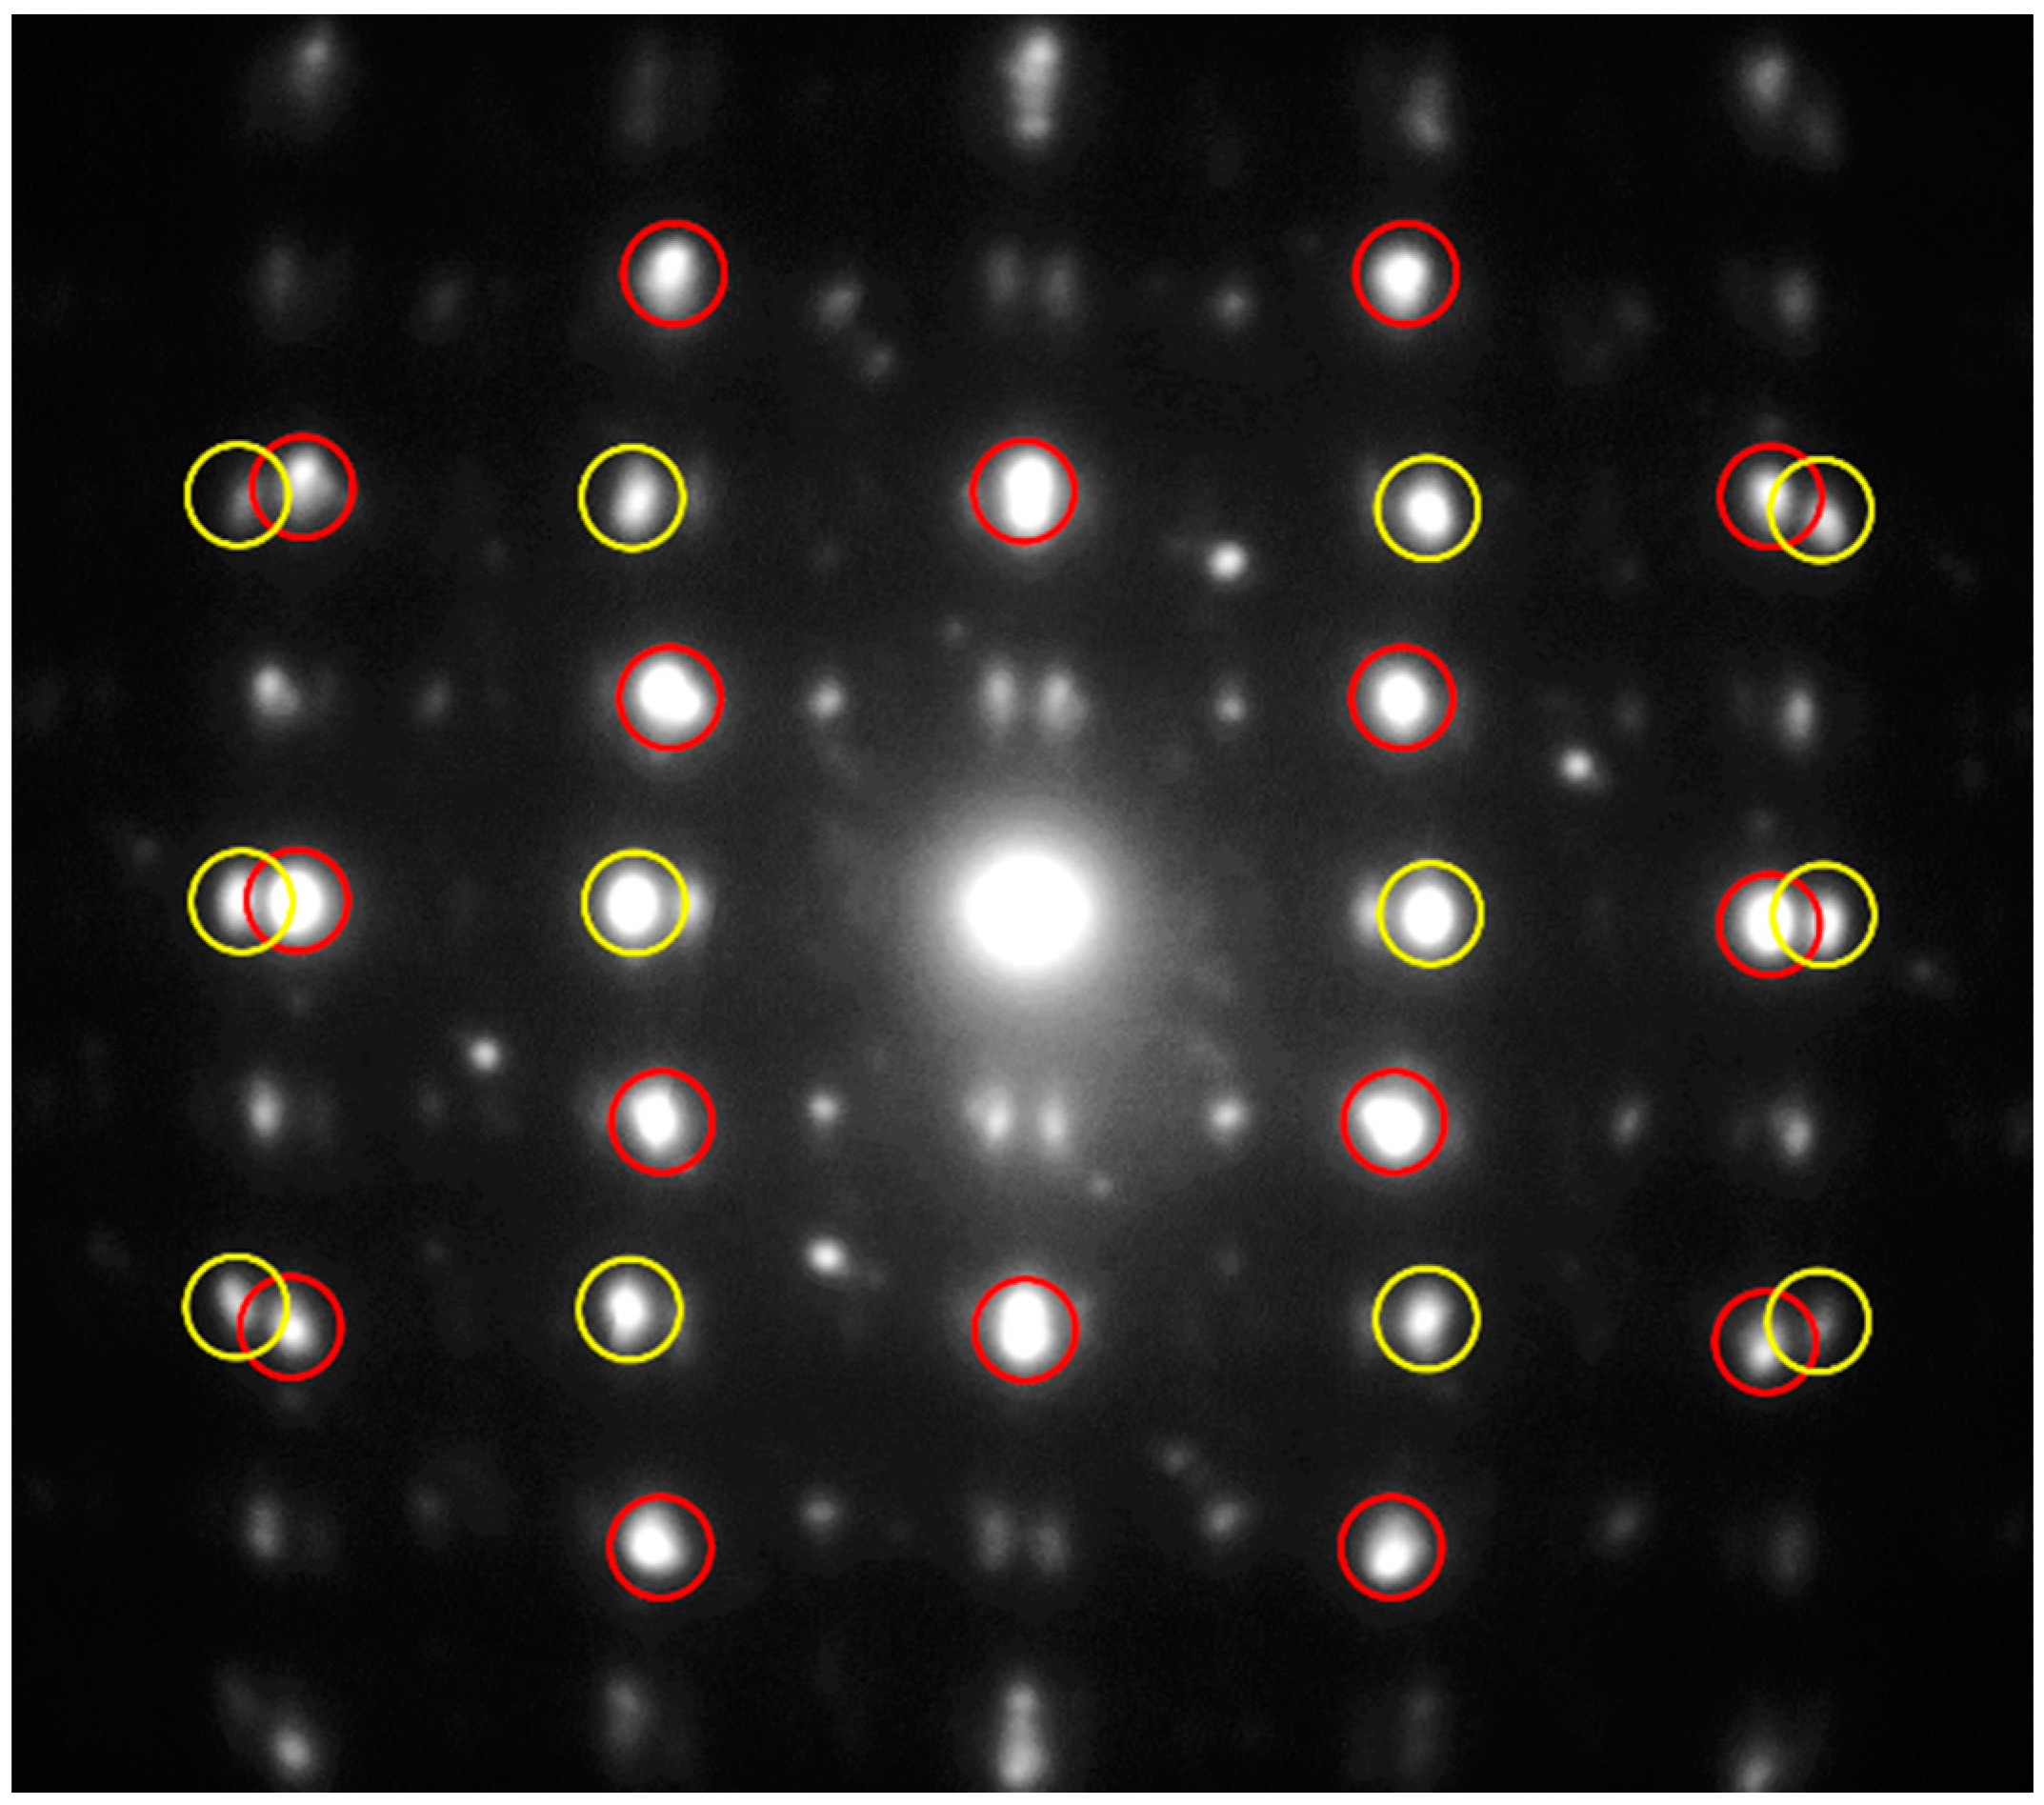
In
Figure 11 a selected area electron diffraction pattern of the
hk0 layer is presented. The two centered pseudo-tetragonal and pseudo-hexagonal sublattices are clearly visible (red and yellow circles refer to the
H and
Q pseudo-layers, respectively). An estimation of the cell edges of the red centered cell (
Q pseudo-layer) gave
a ≈ 5.93 and
b ≈ 5.97 Å, whereas the cell edges of the yellow centered cell (
H pseudo-layer) are
a ≈ 5.58 and
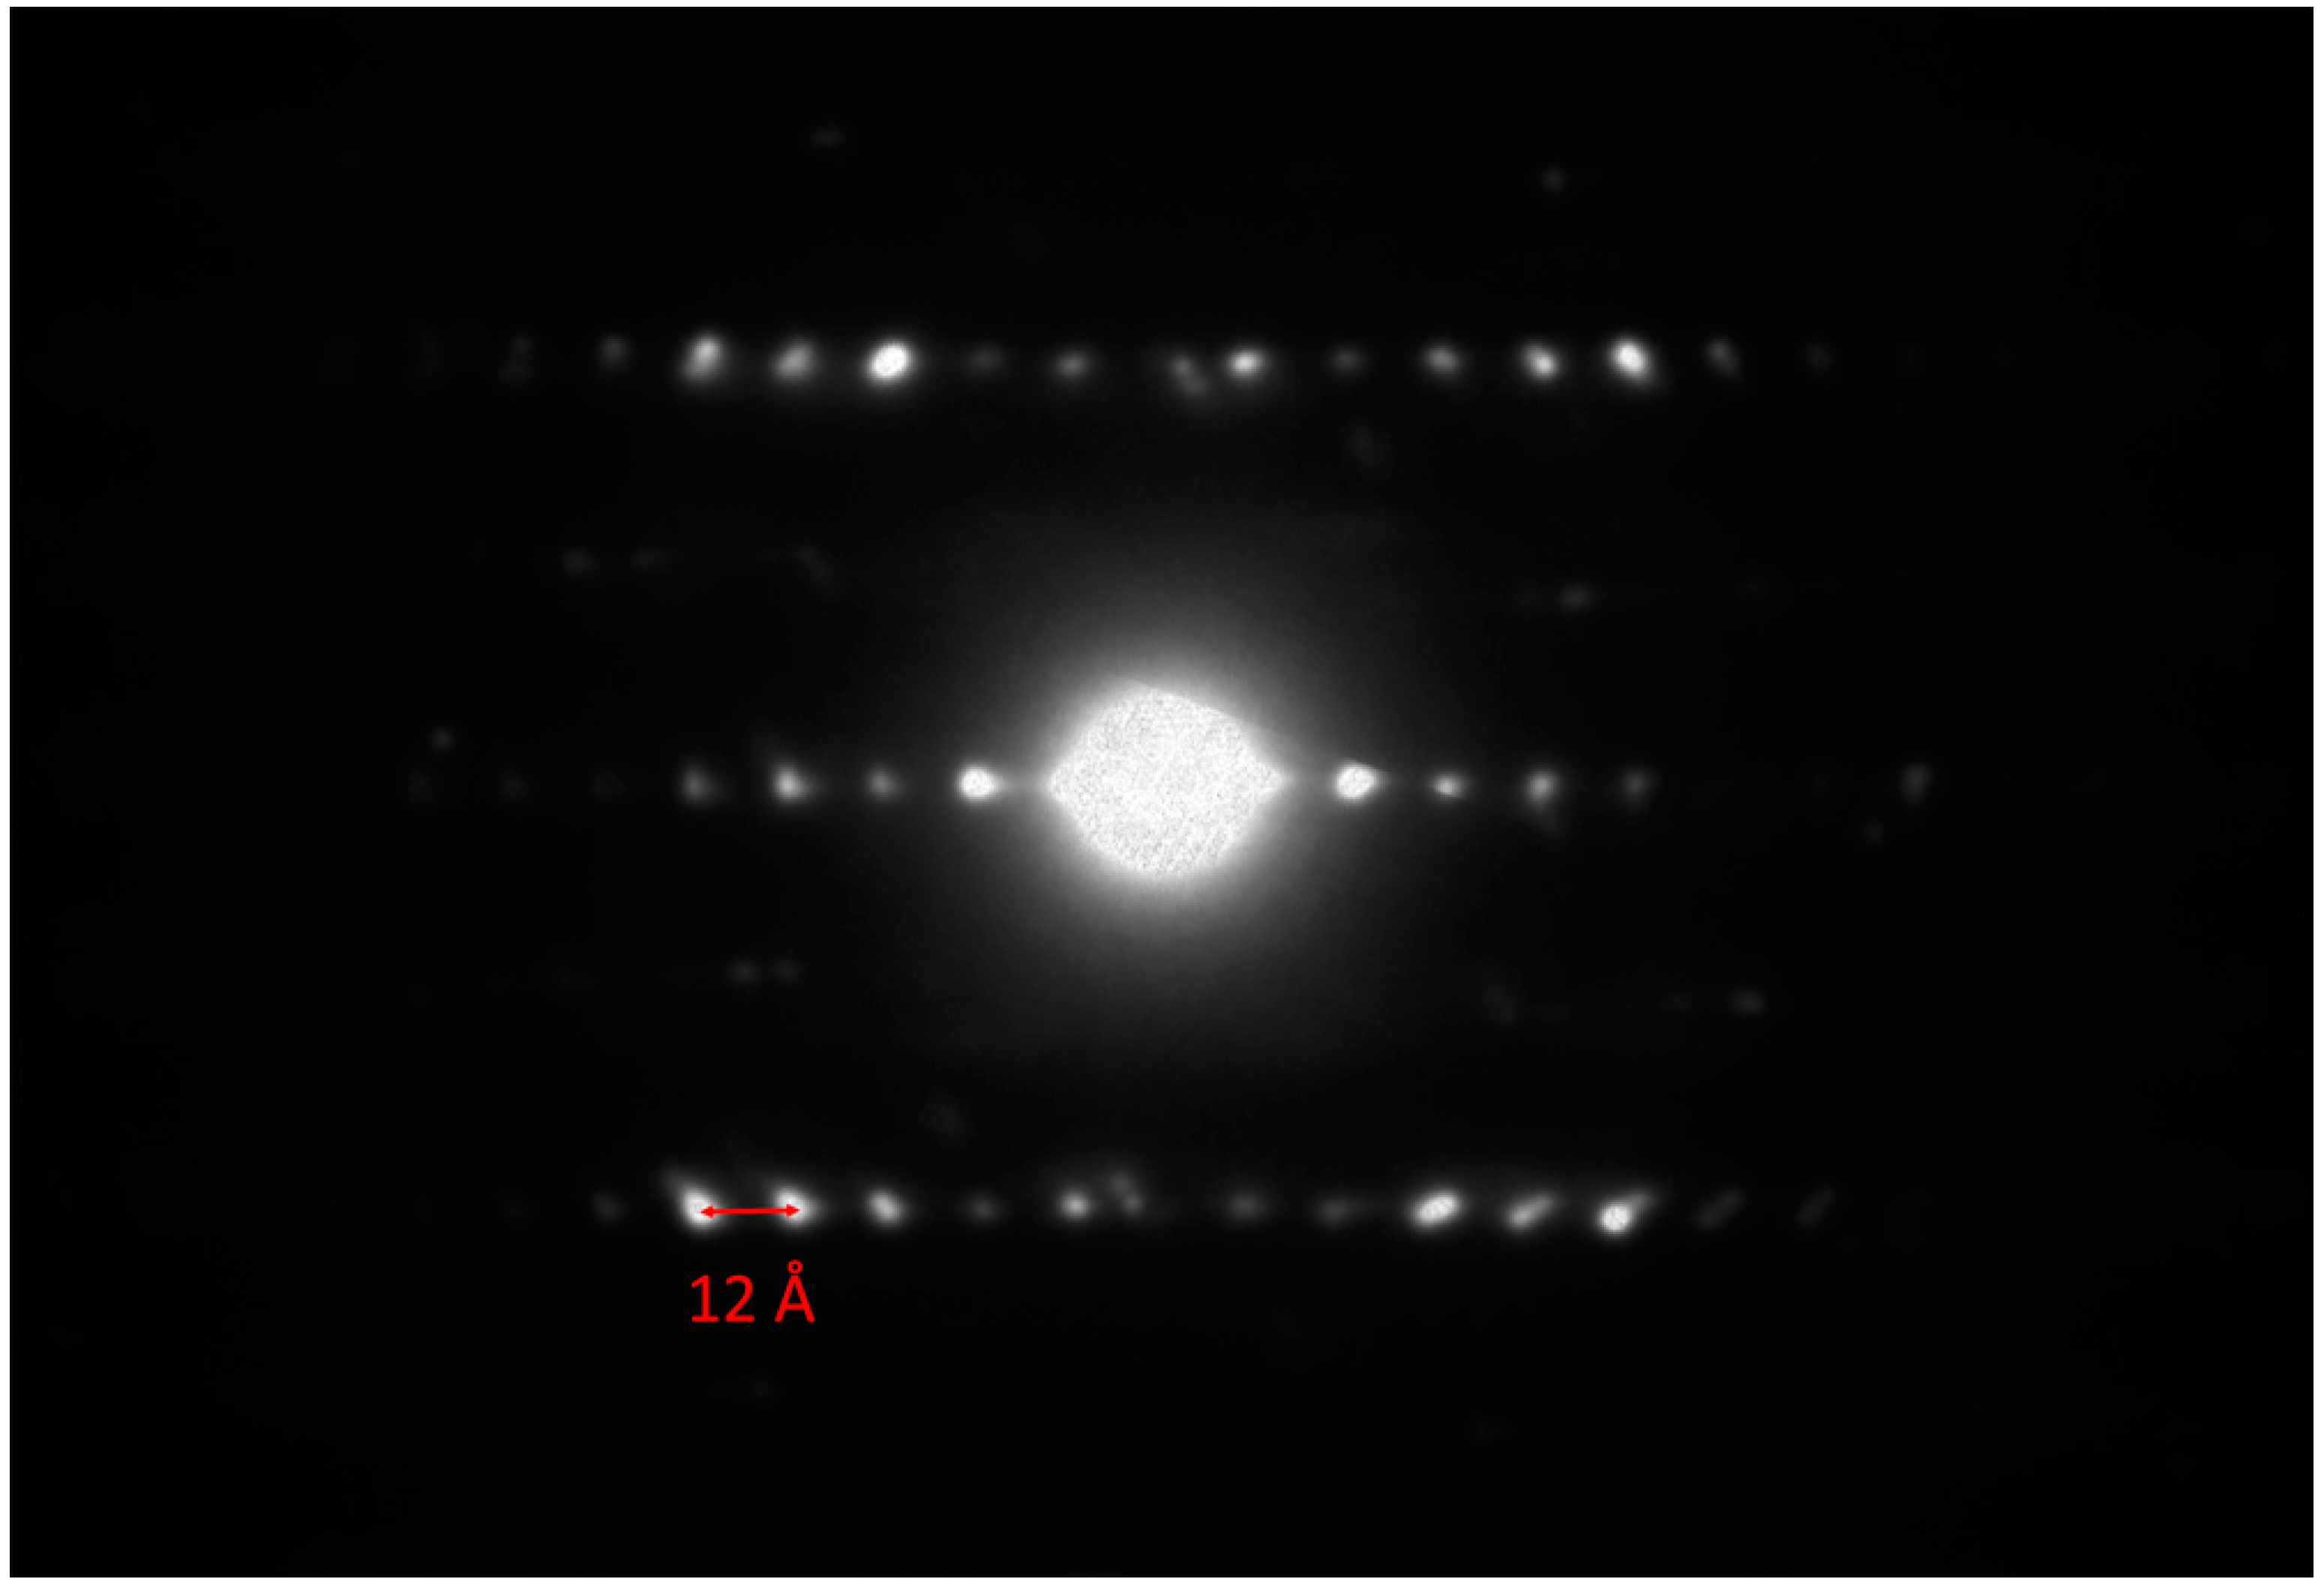
b ≈ 3.21 Å. The electron diffraction pattern down (010) is shown in
Figure 12. A value of ≈12 Å for the
c-axis can be measured, which is in agreement with the
c-axis of the 2
H polytype of molybdenite (i.e., 12.3 Å [
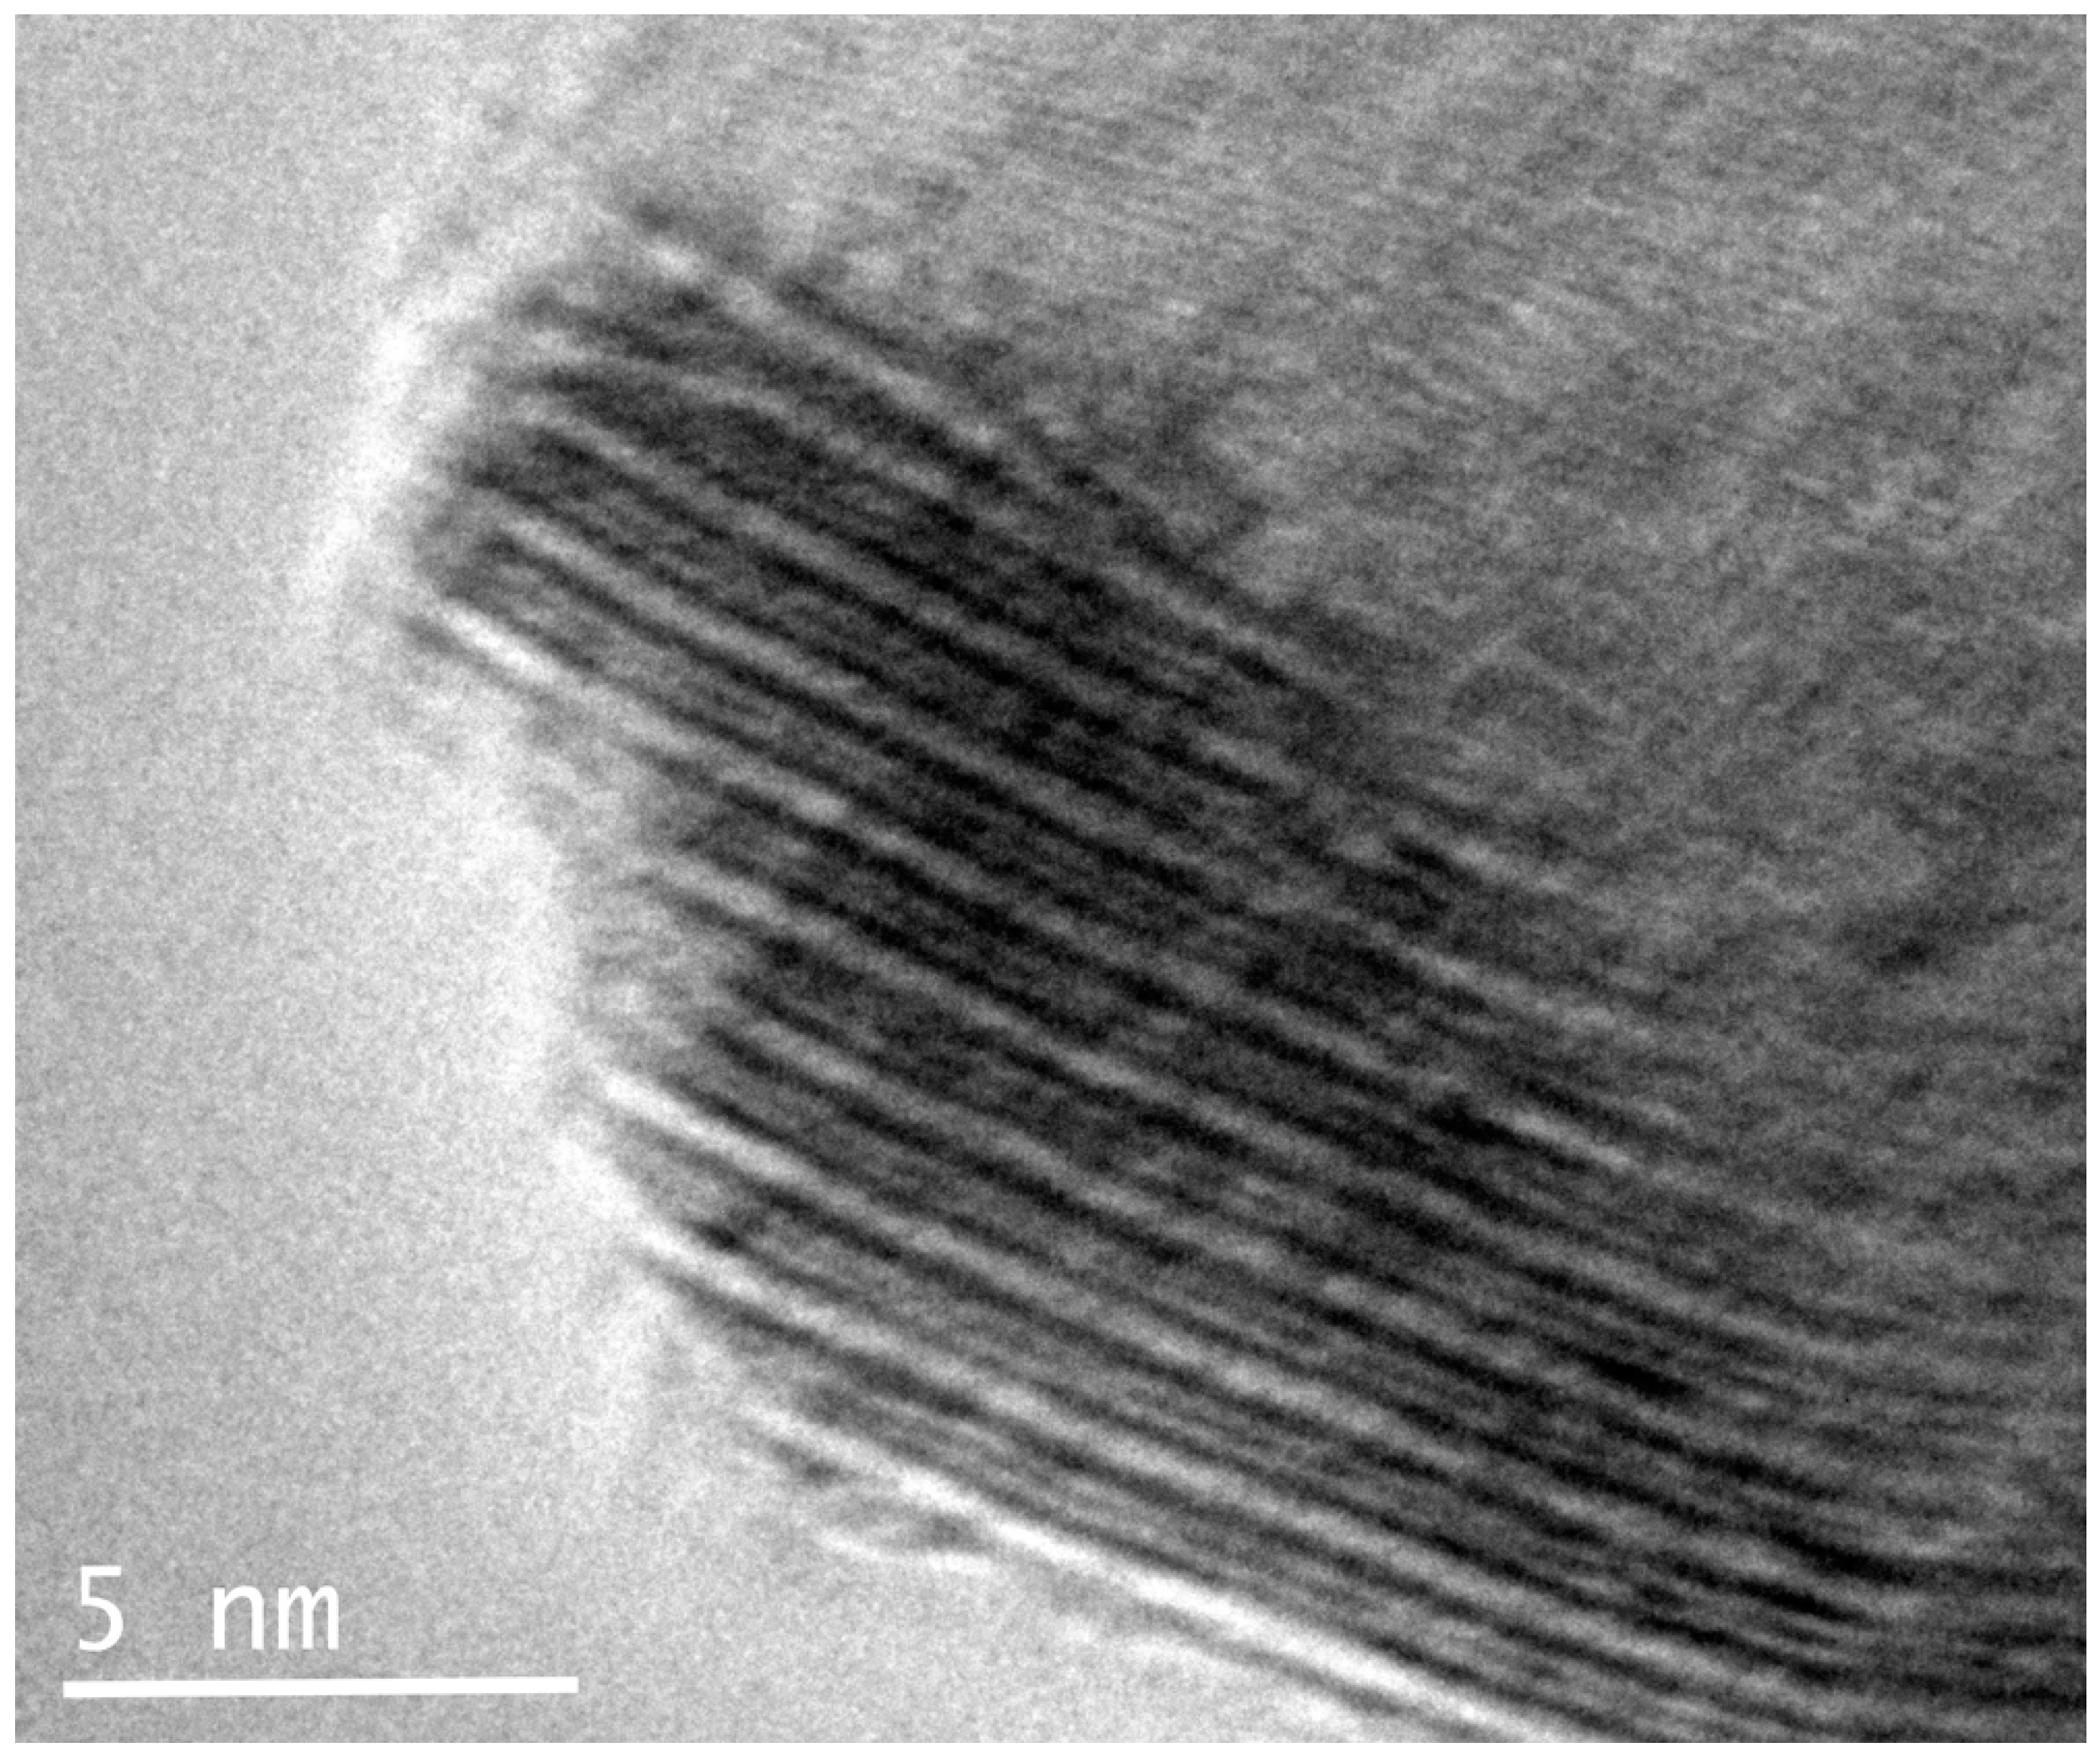
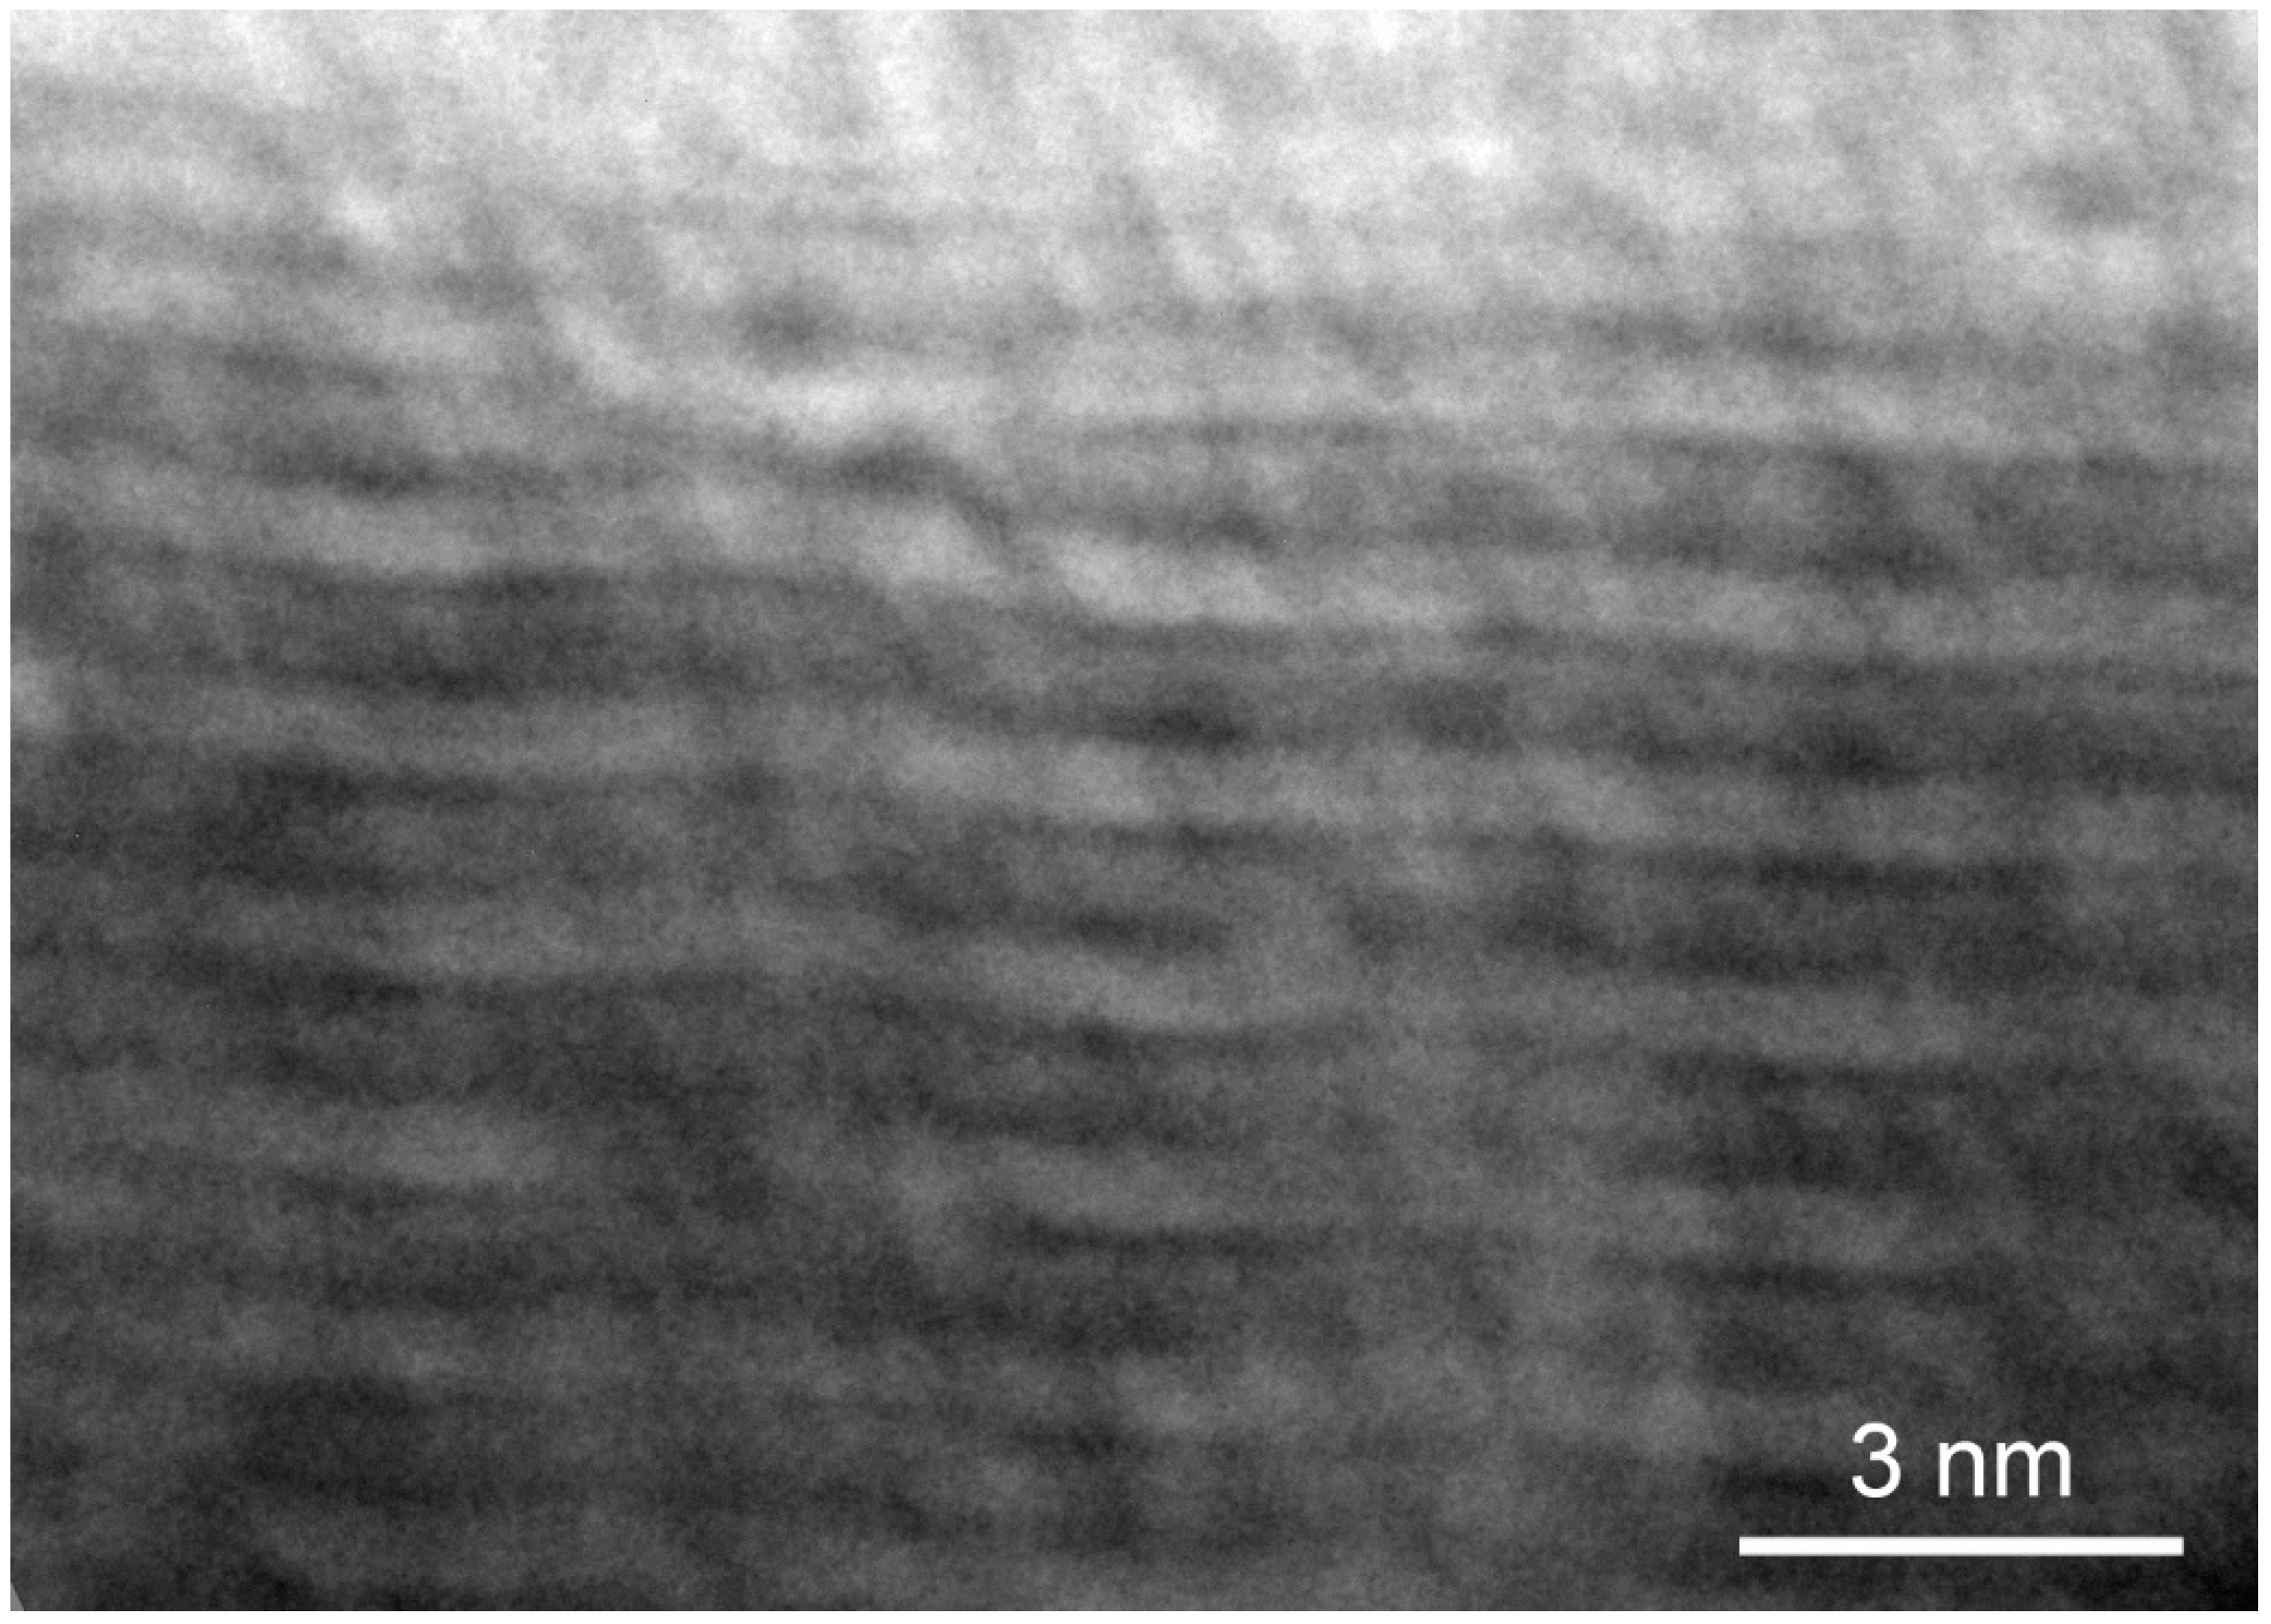
21]). The alternation of the two centered pseudo-layers is also clearly visible in the high-resolution TEM image shown in
Figure 13, and the
c-axis of about 12 Å is confirmed. The undulating curved appearance of the PbS-type and MoS
2-type modules stacked along the (001) is a typical feature of the members of the cylindrite group [
22,
23] (
Figure 14).
