Article

Chemical Environment of Unusually Ge- and Pb-Rich Willemite, Tres Marias Mine, Mexico

by
Bernhardt Saini-Eidukat
1,*,†,
Frank Melcher
2,†,
Jörg Göttlicher
3,† and
Ralph Steininger
3,†
1
Department of Geosciences, North Dakota State University, Fargo, ND 58108, USA
2
Chair of Geology and Economic Geology, Peter-Tunner-Straße 5, Leoben 8700, Austria
3
Karlsruhe Institute of Technology, Institute for Synchrotron Radiation, Hermann-von-Helmholtz-Platz 1, Eggenstein-Leopoldshafen D-76344, Germany
*
Author to whom correspondence should be addressed.
These authors contributed equally to this work.
Minerals 2016, 6(1), 20; https://doi.org/10.3390/min6010020
Submission received: 30 December 2015 / Revised: 8 February 2016 / Accepted: 23 February 2016 / Published: 9 March 2016

Abstract

:
The Tres Marias carbonate-hosted Zn-Ge deposit in Chihuahua, Mexico contains willemite [Zn2SiO4] with unusually high concentrations of minor and trace elements (e.g., Pb, Ge, As, P, V); Pb concentrations are as high as 2 wt %, and Ge may reach 4000 ppm (average 900 ppm). Electron microprobe analyses and synchrotron X-ray fluorescence maps show that Zn and Ge, as well as Zn and Pb are negatively correlated, whereas Ge and Pb are positively correlated across zoned willemite crystals. In cathodoluminescence (CL) images, those areas of willemite having high trace element concentrations have no, or low CL intensities, whereas zones low in trace elements (except for P) display bright blue CL colors. X-ray absorption fine structure (XAFS) spectroscopy was used to characterize the chemical nature of Ge and Pb in willemite. Comparisons to reference spectra of natural and artificial substances points to the presence of Ge4+ and Pb2+ in Tres Marias willemite. No evidence for Pb4+ was detected. Oscillatory zonation reflects trace element incorporation into willemite from the oxidation of primary Ge-bearing sphalerite and galena (PbS) by siliceous aqueous fluids.

1. Introduction

Germanium (Ge) is a high technology metal in great demand for use in the manufacture of optics and sensors, computer chips, solar cells, and as a catalyst in plastics manufacturing. Most Ge is recovered as a byproduct from processing zinc sulfide ore, or from combustion products of Ge-bearing lignites [1,2,3]. Investigating the chemical behavior of trace elements in willemite is of interest not only because of its use as an ore of non-sulfide zinc [4] but also for understanding chemical substitution mechanisms, and the controls on its luminescence and other electronic properties [5,6].
While the geochemistry of germanium has been reviewed [7,8], very few detailed chemical data on Ge in willemite, and in related minerals such as hemimorphite, are available in the literature. Willemite from Franklin, N.J. and New Mexico contains up to 350 ppm Ge [9]. Willemite in the Tsumeb deposit contains up to 1280 ppm Ge [10]. Zinc silicates in concentrate leach residues that are stoichiometrically equivalent to willemite contain 800 to 1500 ppm Ge and from 4000 to 8100 ppm Pb [11]. Ore from the Beltana deposit in the Flinders Range of Australia contains up to 50 ppm Ge in willemite, and a range of 0.4–2.5 wt % Pb [12]. Willemite from the Bou Arhous deposit [13] in Morocco contains over 1000 ppm Ge [14].
The substitution of Pb for Zn raises the interrelated questions of the oxidation state, ionic radius, and substitution mechanism of Pb in the crystal structure. Tetravalent, tetrahedrally coordinated lead, IVPb4+, has an ionic radius of 0.65 Å, similar to 0.60 Å for IVZn2+ [15]. In this case, Pb would exist in a sp3 hybridized form, and following arguments concerning Fe [16] and Mn [17] substitution into willemite, it might preferentially enter the slightly larger Zn(2) position. Charge balance, perhaps in the form of vacancies, would also be required. If the Pb exists as the much larger Pb2+, with radius 1.19–1.49 Å, its s2 lone-electron pairs would likely lead to strong distortion of the site.
The present work provides the first X-ray absorption fine structure (XAFS) studies of the oxidation state of Ge and Pb in willemite which is naturally highly enriched in these elements. Understanding the oxidation state of these elements in the willemite structure is critical for understanding trace element substitution mechanisms for geochemical and technological applications.

2. Analytical Methods

Quantitative wavelength dispersive analyses of minerals were performed at the German Federal Institute for Geosciences and Natural Resources (BGR), Hanover, on polished thin sections using a CAMECA SX100 electron microprobe (CAMECA, Gennevilliers, France). For the analyses of willemite, the following lines were measured at 30 kV using the listed minerals as standards, for the number of seconds listed, and with average detection-limits given in ppm: Fe Kα, magnetite, 10 s, 300 ppm; Ca Kα DICR (chromian diopside) 10 s, 210 ppm; Mn Kα, rhodochrosite, 10 s, 300 ppm; Cu Kα, Cu°, 10 s, 370 ppm; Zn Kα, willemite, 10 s, 600 ppm; Si Kα, willemite, 10 s, 270 ppm; Al Kα, plagioclase, 10 s, 280 ppm; S Kα pentlandite, 10 s, 180 ppm; P Kα, apatite, 10 s, 360 ppm; V Kα, V°, 10 s, 300 ppm; As Lα, GaAs, 70 s, 480 ppm; Pb Mα, galena, 30 s, 620 ppm; Ga Kα, GaAs, 80 s, 200 ppm; Ge Kα, Ge°, 90 s, 230 ppm; Cd Lα, Cd°, 80 s, 400 ppm; Mo Lα, Mo°, 40 s, 260 ppm; Mg Kα, kaersutite, 10 s, 380 ppm; Ti Kα, kaersutite, 10 s, 100 ppm; K Kα, biotite, 10 s, 200 ppm; Cl Kα, tugtupite, 20 s, 100 ppm. The Pb Mα and the Ge Kα lines were also used to produce X-ray fluorescence maps. A defocused beam was used to analyze hemimorphite. Detection-limits for the hemimorphite and carbonate mineral analyses are provided in the tables.
Powder X-ray diffraction analysis was carried out at the BGR. Whole-rock chemical analyses were carried out at the BGR using X-ray fluorescence (XRF) on a Philips PW-2400 (Cr and Rh targets) (Philips, Amsterdam, The Netherlands), and with LECO methods (LECO, St. Joseph, MO, USA). Additional whole-rock analyses were carried out by Activation Laboratories of Canada using instrumental neutron activation analysis (INAA), and inductively coupled plasma-mass spectrometry (ICP-MS) following total digestion.
XAFS spectroscopy was carried out at the Synchrotron Umwelt-Labor X-ray SUL-X beamline of ANKA with a wiggler as synchrotron radiation source on the X-ray absorption near-edge spectroscopy XANES part of the Pb L3 edge (Pb L3 edge at ≈ 13.035 keV) and Ge K edge (≈11.103 keV) absorption spectra [18]. In both cases, Si(111) crystals were used as a monochromator. The prefocused beam was subsequently focused with a Kirkpatrick–Baez mirror system to the sample position. Spot sizes at the sample position were adjusted to about 20 µm (vert.) × 30 µm (hor.) for the Ge K-edge and to about 40 µm (vert.) × 70 µm (hor.) for the Pb L3-edge spectra by collimating the beam with slits at the intermediate focus. When measuring the Pb L3 edge XANES, the Ge Kα fluorescence emission is excited. The difference between the Pb Lα and the Ge Kα emission lines is about 600 eV. Effective energy resolution was adequate to distinguish these lines, even at higher count rates and shorter detector peaking times. In order to select suitable positions for the XAFS measurements, a mapping of fluorescence intensities of the emission lines for Pb (Pb Lα, about 10.5 keV) and Ge (Kα, about 9.9 keV) was carried out. Ore samples were prepared as thin or polished sections, and Kirkpatrick–Baez mirrors allowed final focusing of beam sizes sufficient to select different parts of the zoned crystals. Because of low element concentrations (Ge < 1 wt %; Pb about 2 wt %), the XAFS measurements of the samples were performed in fluorescence mode using a seven-element Si(Li) solid state detector (SGX Sensortech, formerly Gresham Scientific Instruments Ltd., Corcelles-Cormondreche, Switzerland).
Ge K-edge XAFS measurements suffer from the overlap of the Ge Kα emission (≈9.9 keV) with the strong Zn Kβ emission at about 9.57 keV (high Zn content of the minerals). To overcome this drawback, separation of the emission peaks and improvement of the signal to noise ratio could be achieved by choosing a long peaking time at a large sample to detector distance which reduces the total count rates that are dominated by Zn Kβ emission.
Reference materials containing the following Pb silicates (identification number) were acquired from the Smithsonian Institution, Washington, D.C. and measured: margarosanite [PbCa2Si3O9] (R18305), esperite [PbCa2(ZnSiO4)3] (C6175), and larsenite [PbZnSiO4] (C6174). Crystallites were separated under binocular microscope. Samples were mounted in two ways. First, approximately 10 to 18 mg of material was mixed with 100 mg cellulose and pressed into a 13 mm diameter pellet. Pb L3 XANES spectra were measured in transmission and fluorescence mode. A second mounting method was to place pulverized material on Kapton tape. X-ray diffraction (XRD) and XRF measurements were carried out on a number of crystallites to assure their identity. Reference compounds for Ge were GeO2, GeS2, briartite [Cu2(Fe,Zn)GeS4] and argyrodite [Ag8GeS6]. Transmission data were preferred because fluorescence data suffer from self absorption effects.
Energies were calibrated for the Pb L3 spectra to 13.035 eV (maximum of 1st derivative of the spectrum) with a foil of elemental Pb, and for the Ge K-edge at the Pt L3 edge to 11.564 eV (maximum of 1st derivative of the spectrum) at a Pt foil.
Because of the thickness of the samples, measurements for energy calibration could not be performed parallel to sample measurements. Energy calibration was checked and corrected before and after a series of XANES/extended x-ray absorption fine-structure spectroscopy (EXAFS) scans.
Two to four scans were measured on three sample spots at the Pb L3 edge, four scans at three samples’ positions for the Ge K edge spectra of willemite and Ge containing sphalerite each. For the reference spectra, one to two scans were sufficient for collecting data with a good signal to noise ratio. At the Pb L3 edge, only XANES spectra were recorded. At the Ge K-edge, EXAFS data up to k 13 are still noisy for the Ge measurements of willemite, and Fourier transformation is limited to k < 10.
XAFS data were pre-edge and post-edge background corrected using a linear and a polynomial function, respectively, and were normalized to an edge jump of one using the ATHENA program of the IFFEFIT software package [19]. In addition, the EXAFS functions and Fourier transforms have been extracted and calculated with the ATHENA program. EXAFS data have only been evaluated on a comparative basis and no fits have been performed.

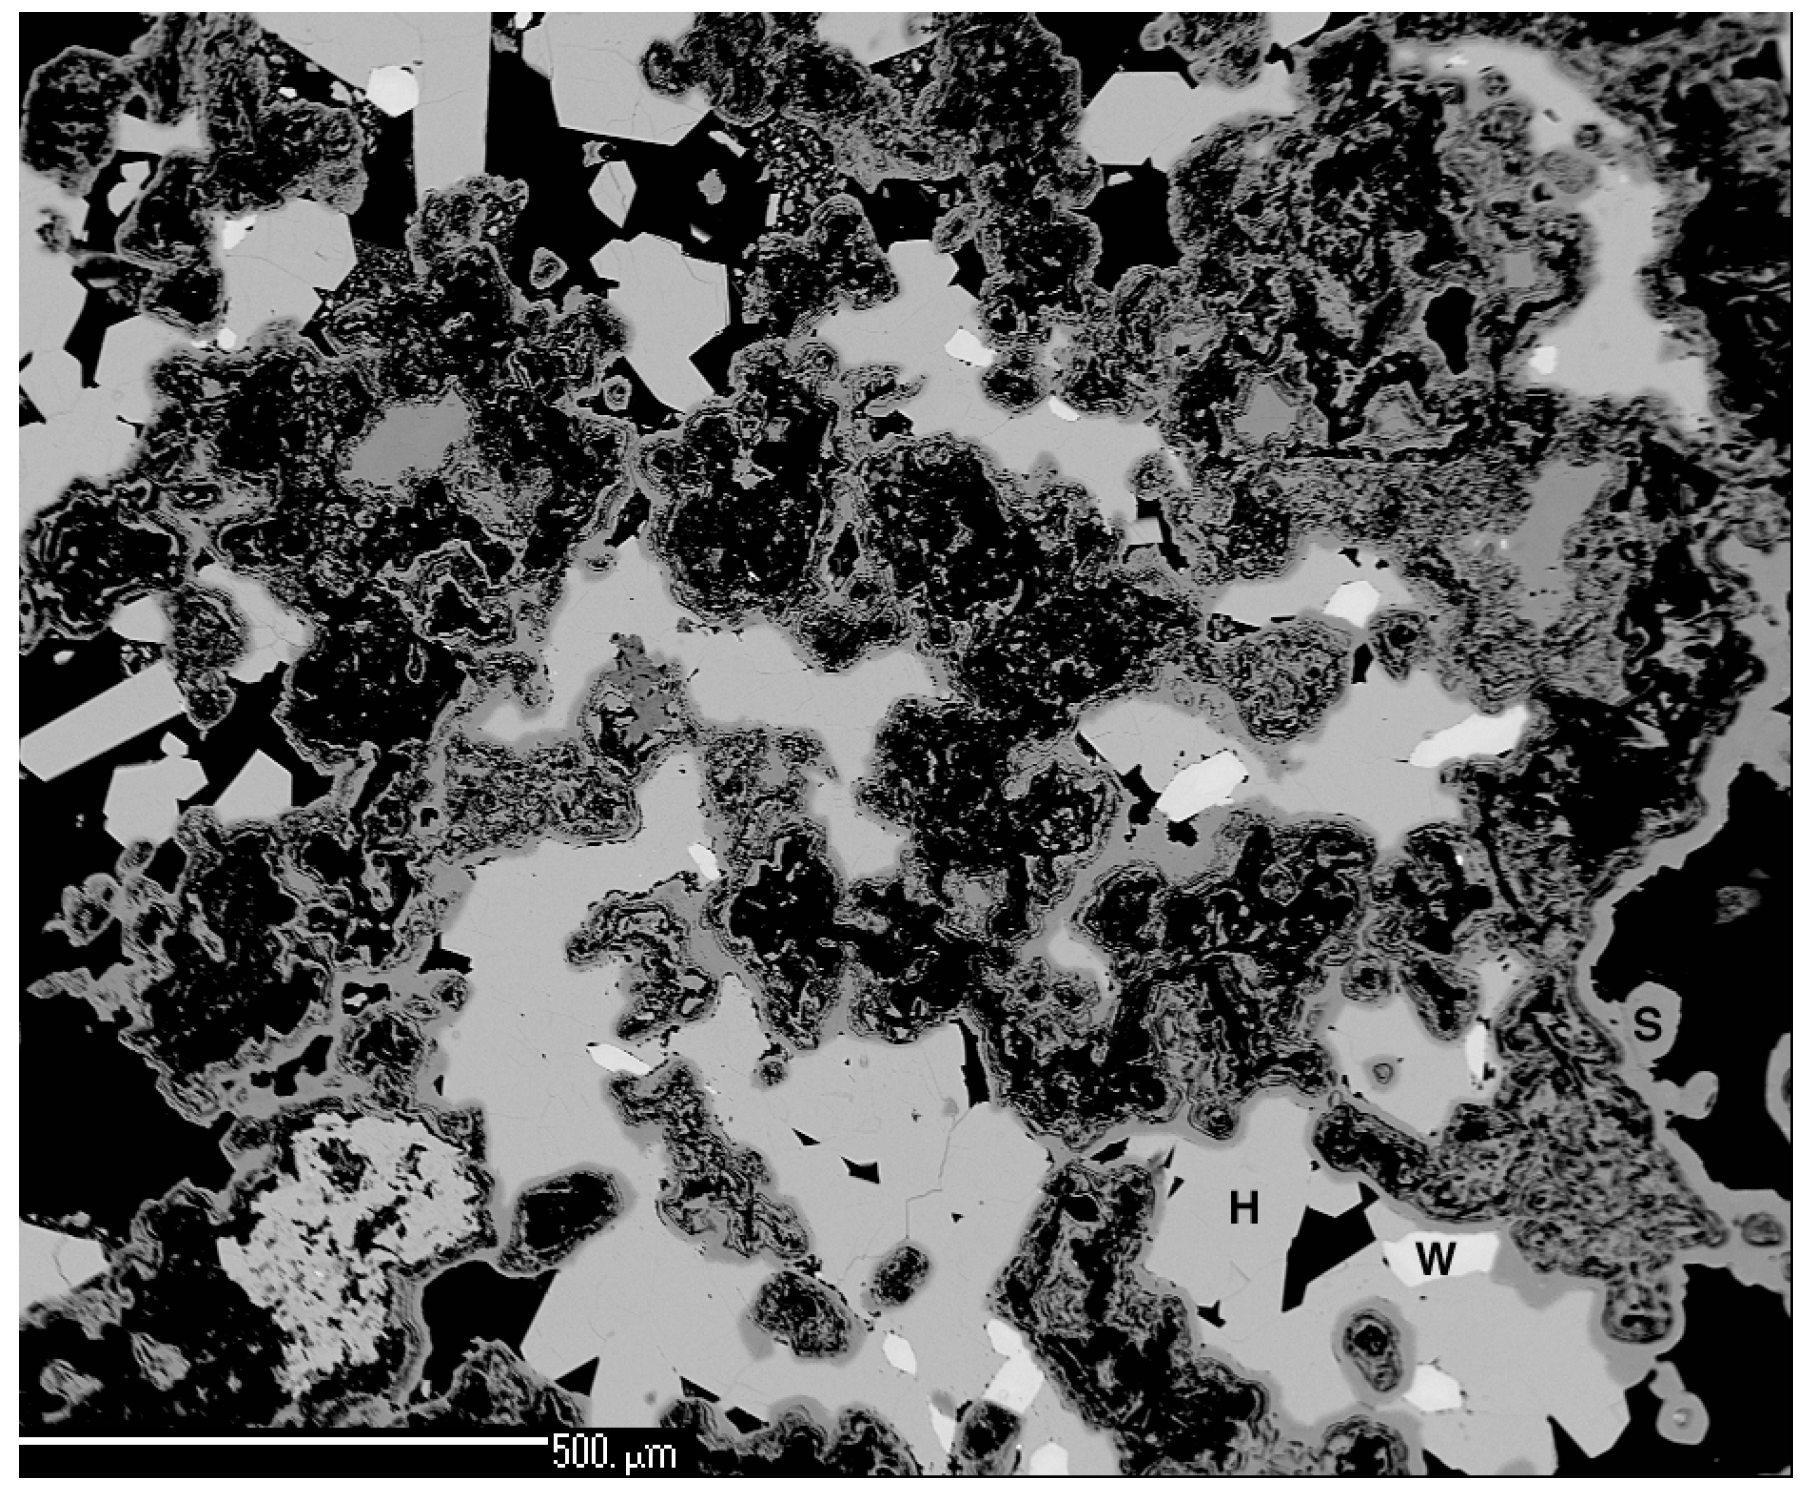
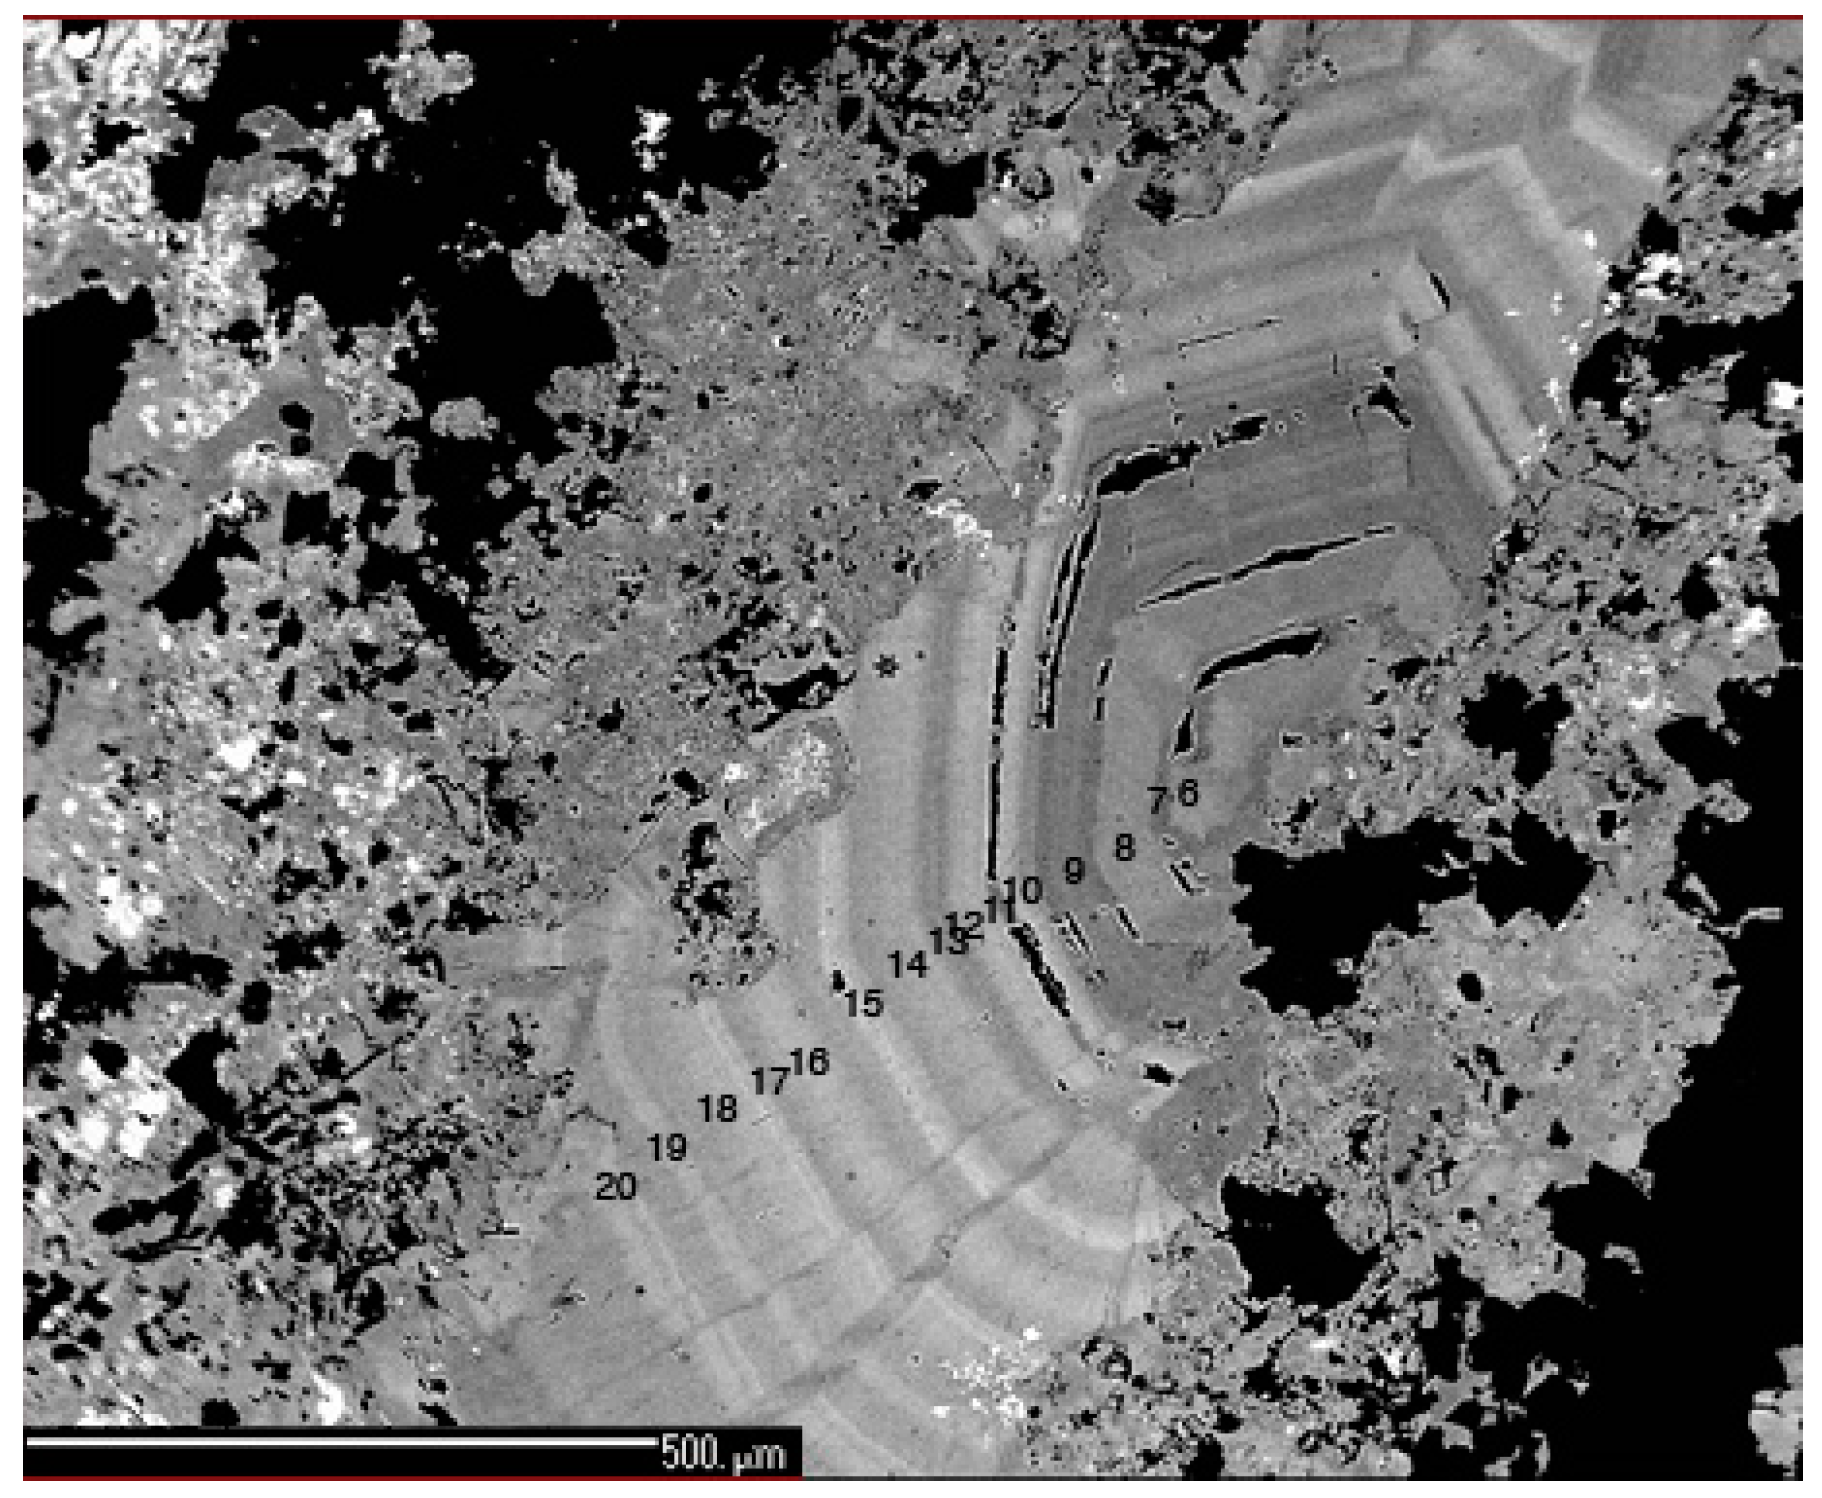
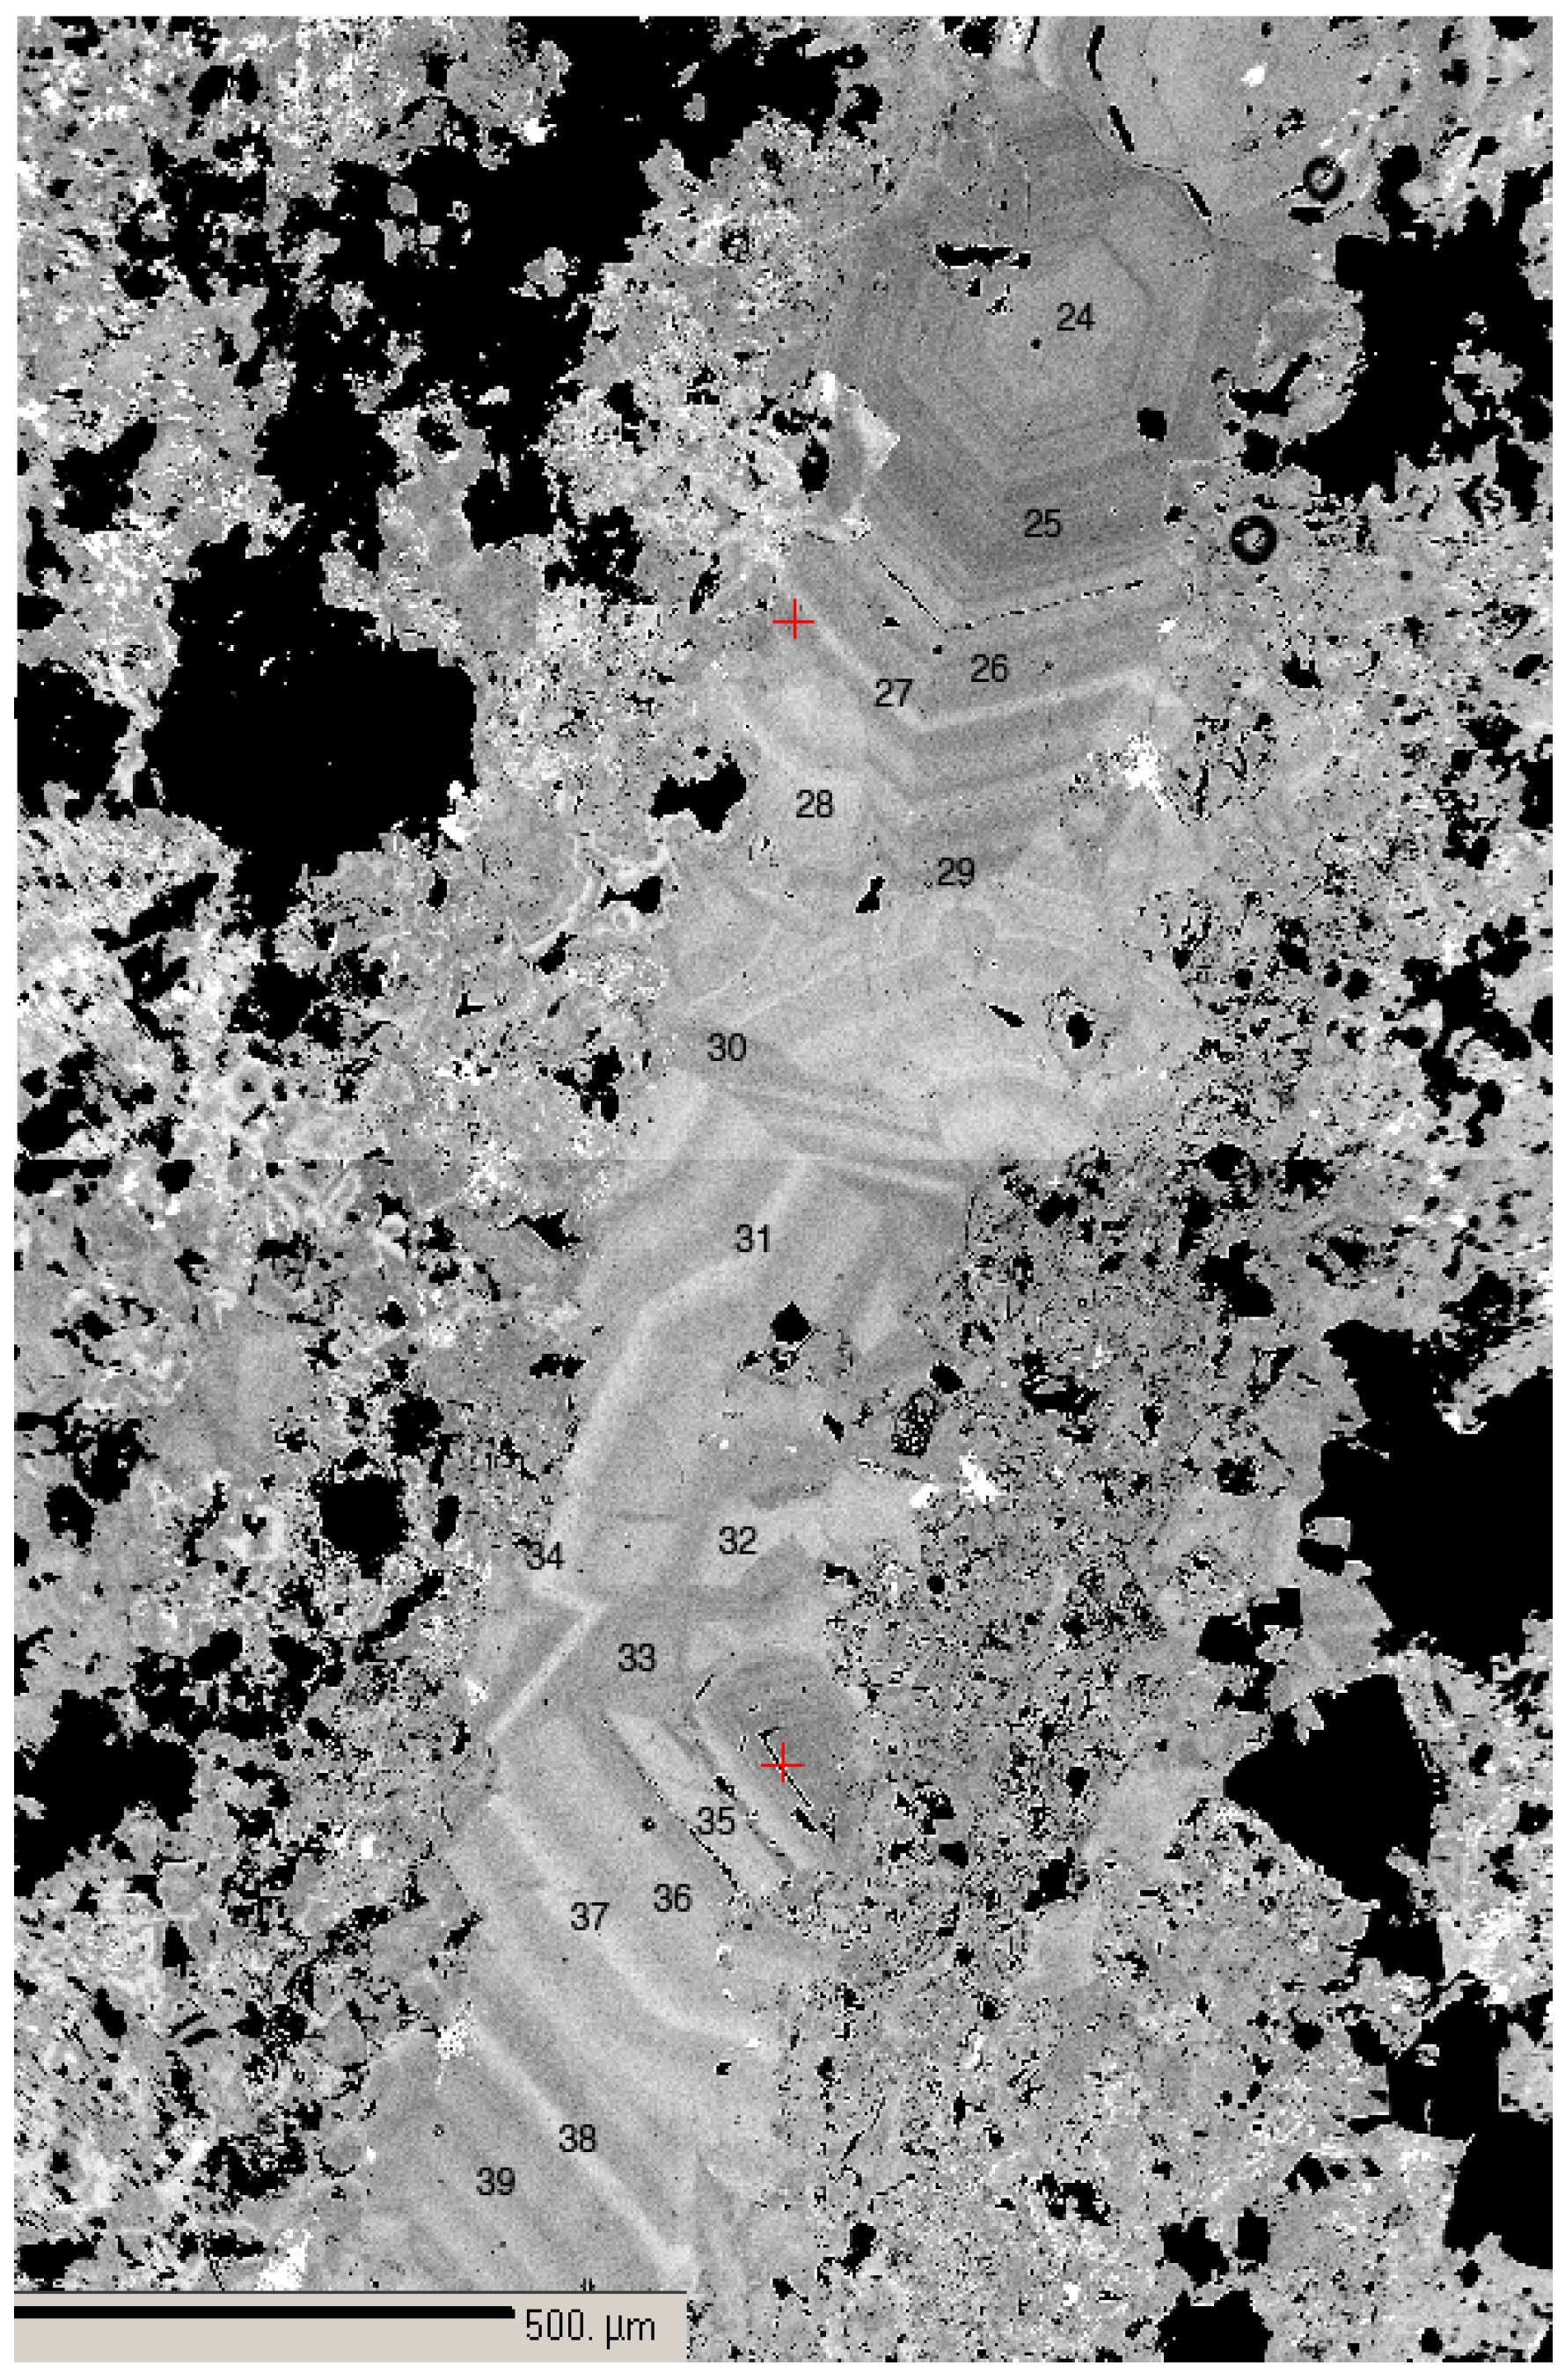
3. Sample Descriptions

Samples were collected from the Tres Marias ore body which occurs in a solution collapse breccia in Cretaceous age carbonate rocks [20]. In the deposit itself, two major ore types exist: a type consisting primarily of zinc and lead sulfides, and a type referred to as “oxidized ore”, i.e., nonsulfide ore, consisting of Zn-silicates, carbonates plus oxide minerals.
The willemite reported here is from two samples, TM06-15 and TM06-18, taken from mine level 6 and 6.5, respectively. Whole rock chemical analyses show these samples contain significant zinc, lead, and germanium, with subordinate Cd, As, and related elements (Table 1).
In hand sample, ore sample TM06-15 is porous, dense and cryptocrystalline. Powder X-ray diffraction analysis identified willemite, smithsonite, calcite, hemimorphite, quartz, and cerussite. Willemite occurs as fine-grained matrix material, and as well-crystallized white to tan vein fillings containing crystals up to approximately 1 mm across.
In polished section, willemite crystals in sample TM06-15 are transparent with high pink to blue interference colors (Figure 1). In some cases, distinct zoning is apparent in transmitted light. Similarly, using backscattered electron (BSE) imaging, lighter and darker areas indicate either oscillatory or irregular zoning. The brightness of these areas corresponds to measured variation in mean atomic weight.
The occurrence of willemite in sample TM06-18 differs markedly from that in TM06-15. In hand sample, the clay-like material is red-brown colored and friable. XRD analysis indicated the presence of an amorphous phase, plus goethite, hematite, quartz and halloysite. SEM and electron microprobe analyses show that much of the sample consists of blades of hemimorphite crystals with lengths up to approximately 100 µm, which surround willemite crystallites of 20–30 µm size (Figure 2). Thin rims of smithsonite surround hemimorphite and porous smithsonite. Cerussite and rare descloizite were also observed based on electron microprobe analysis.

4. Results

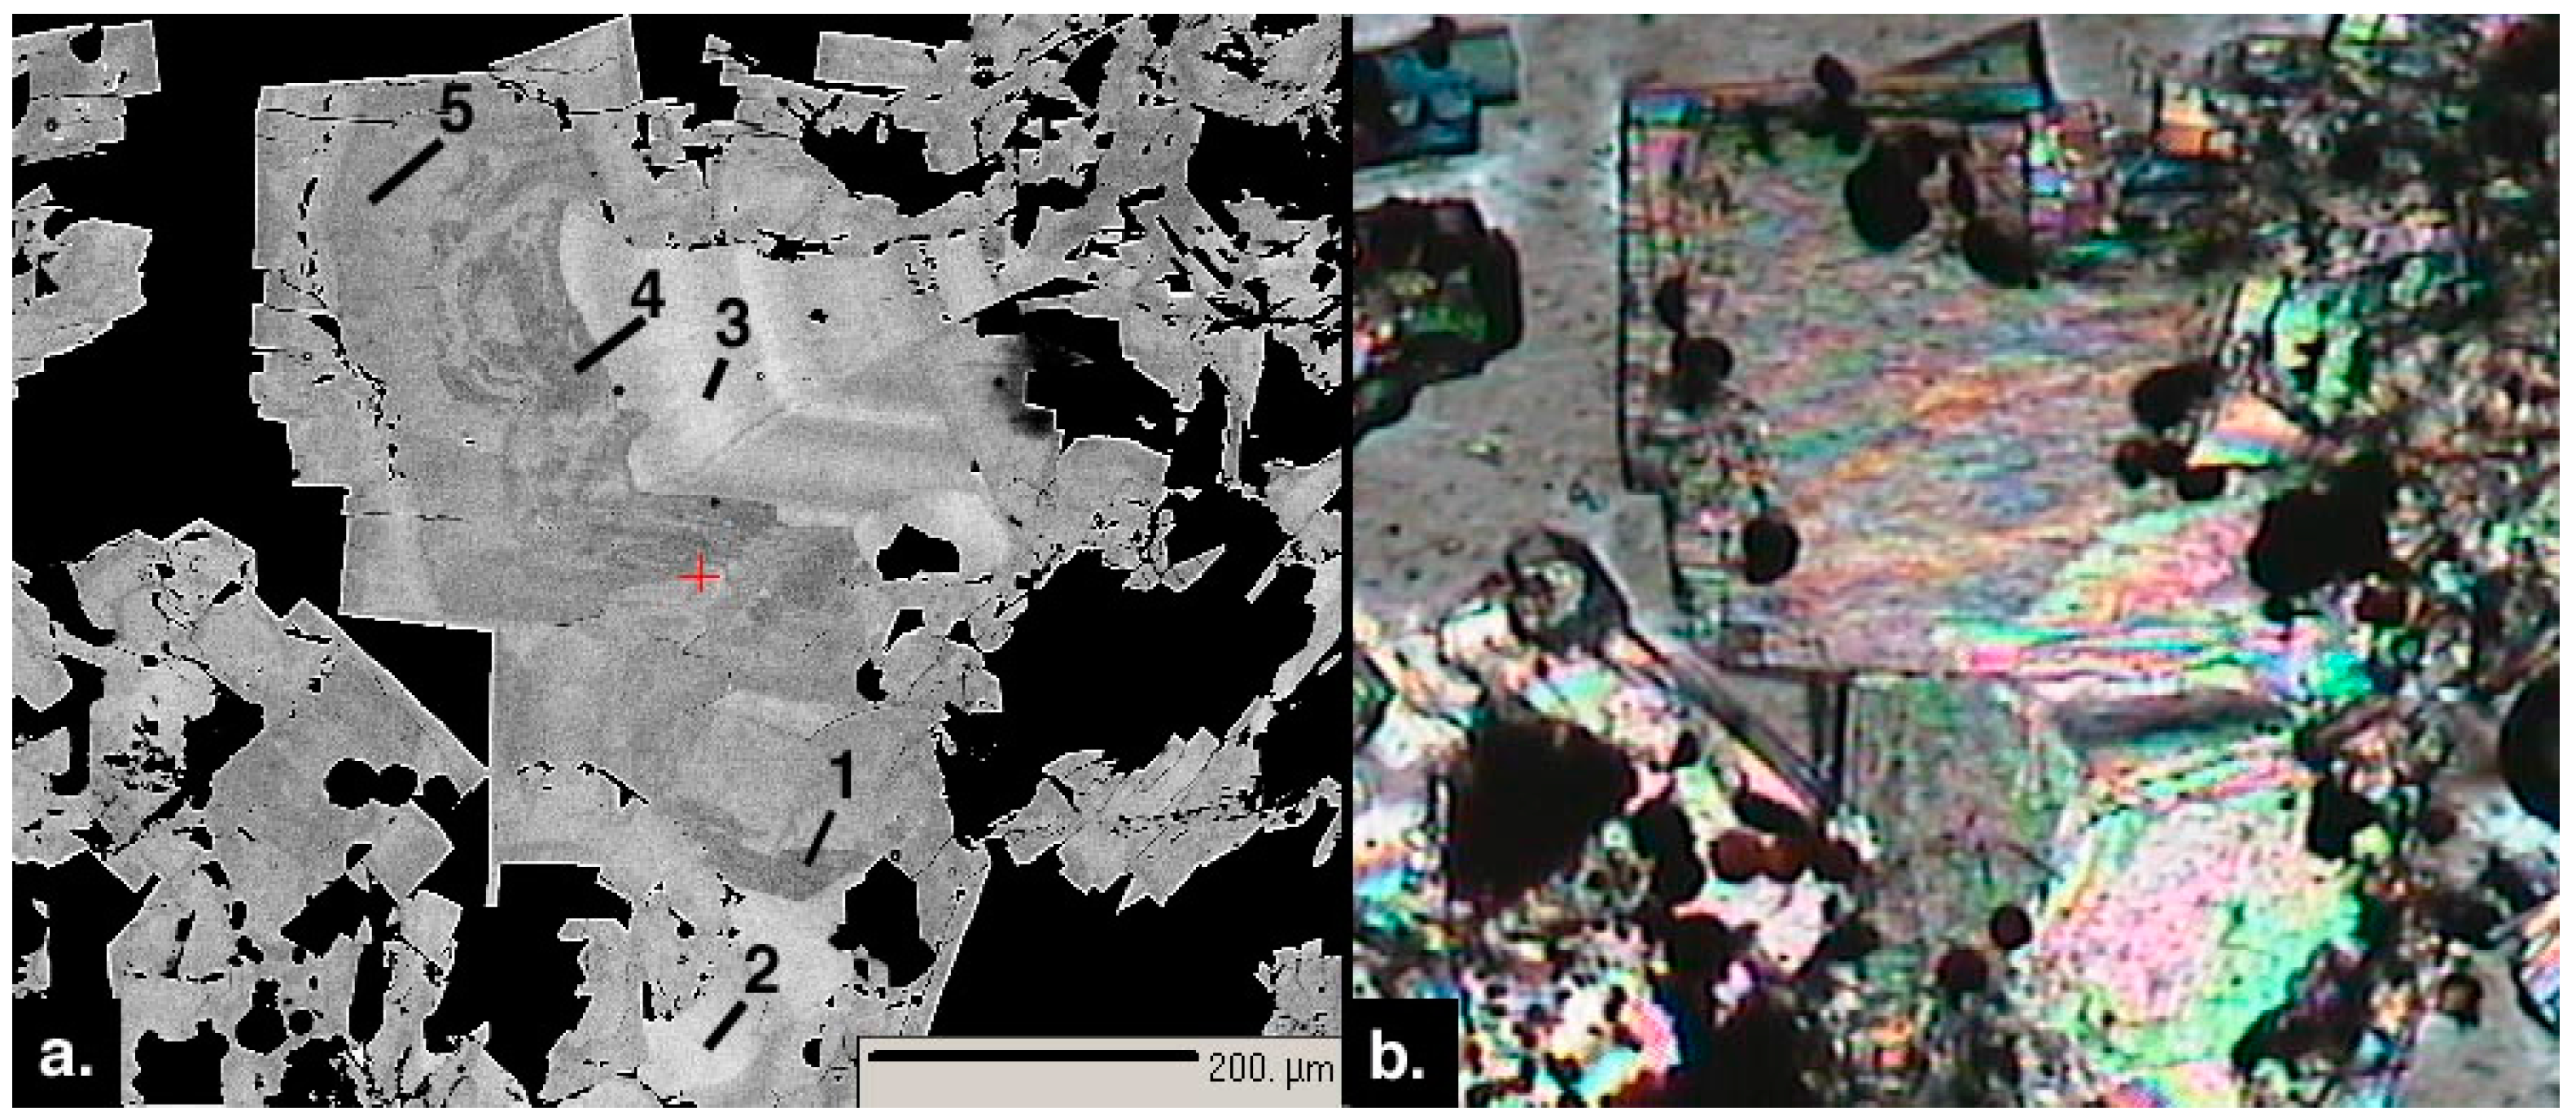
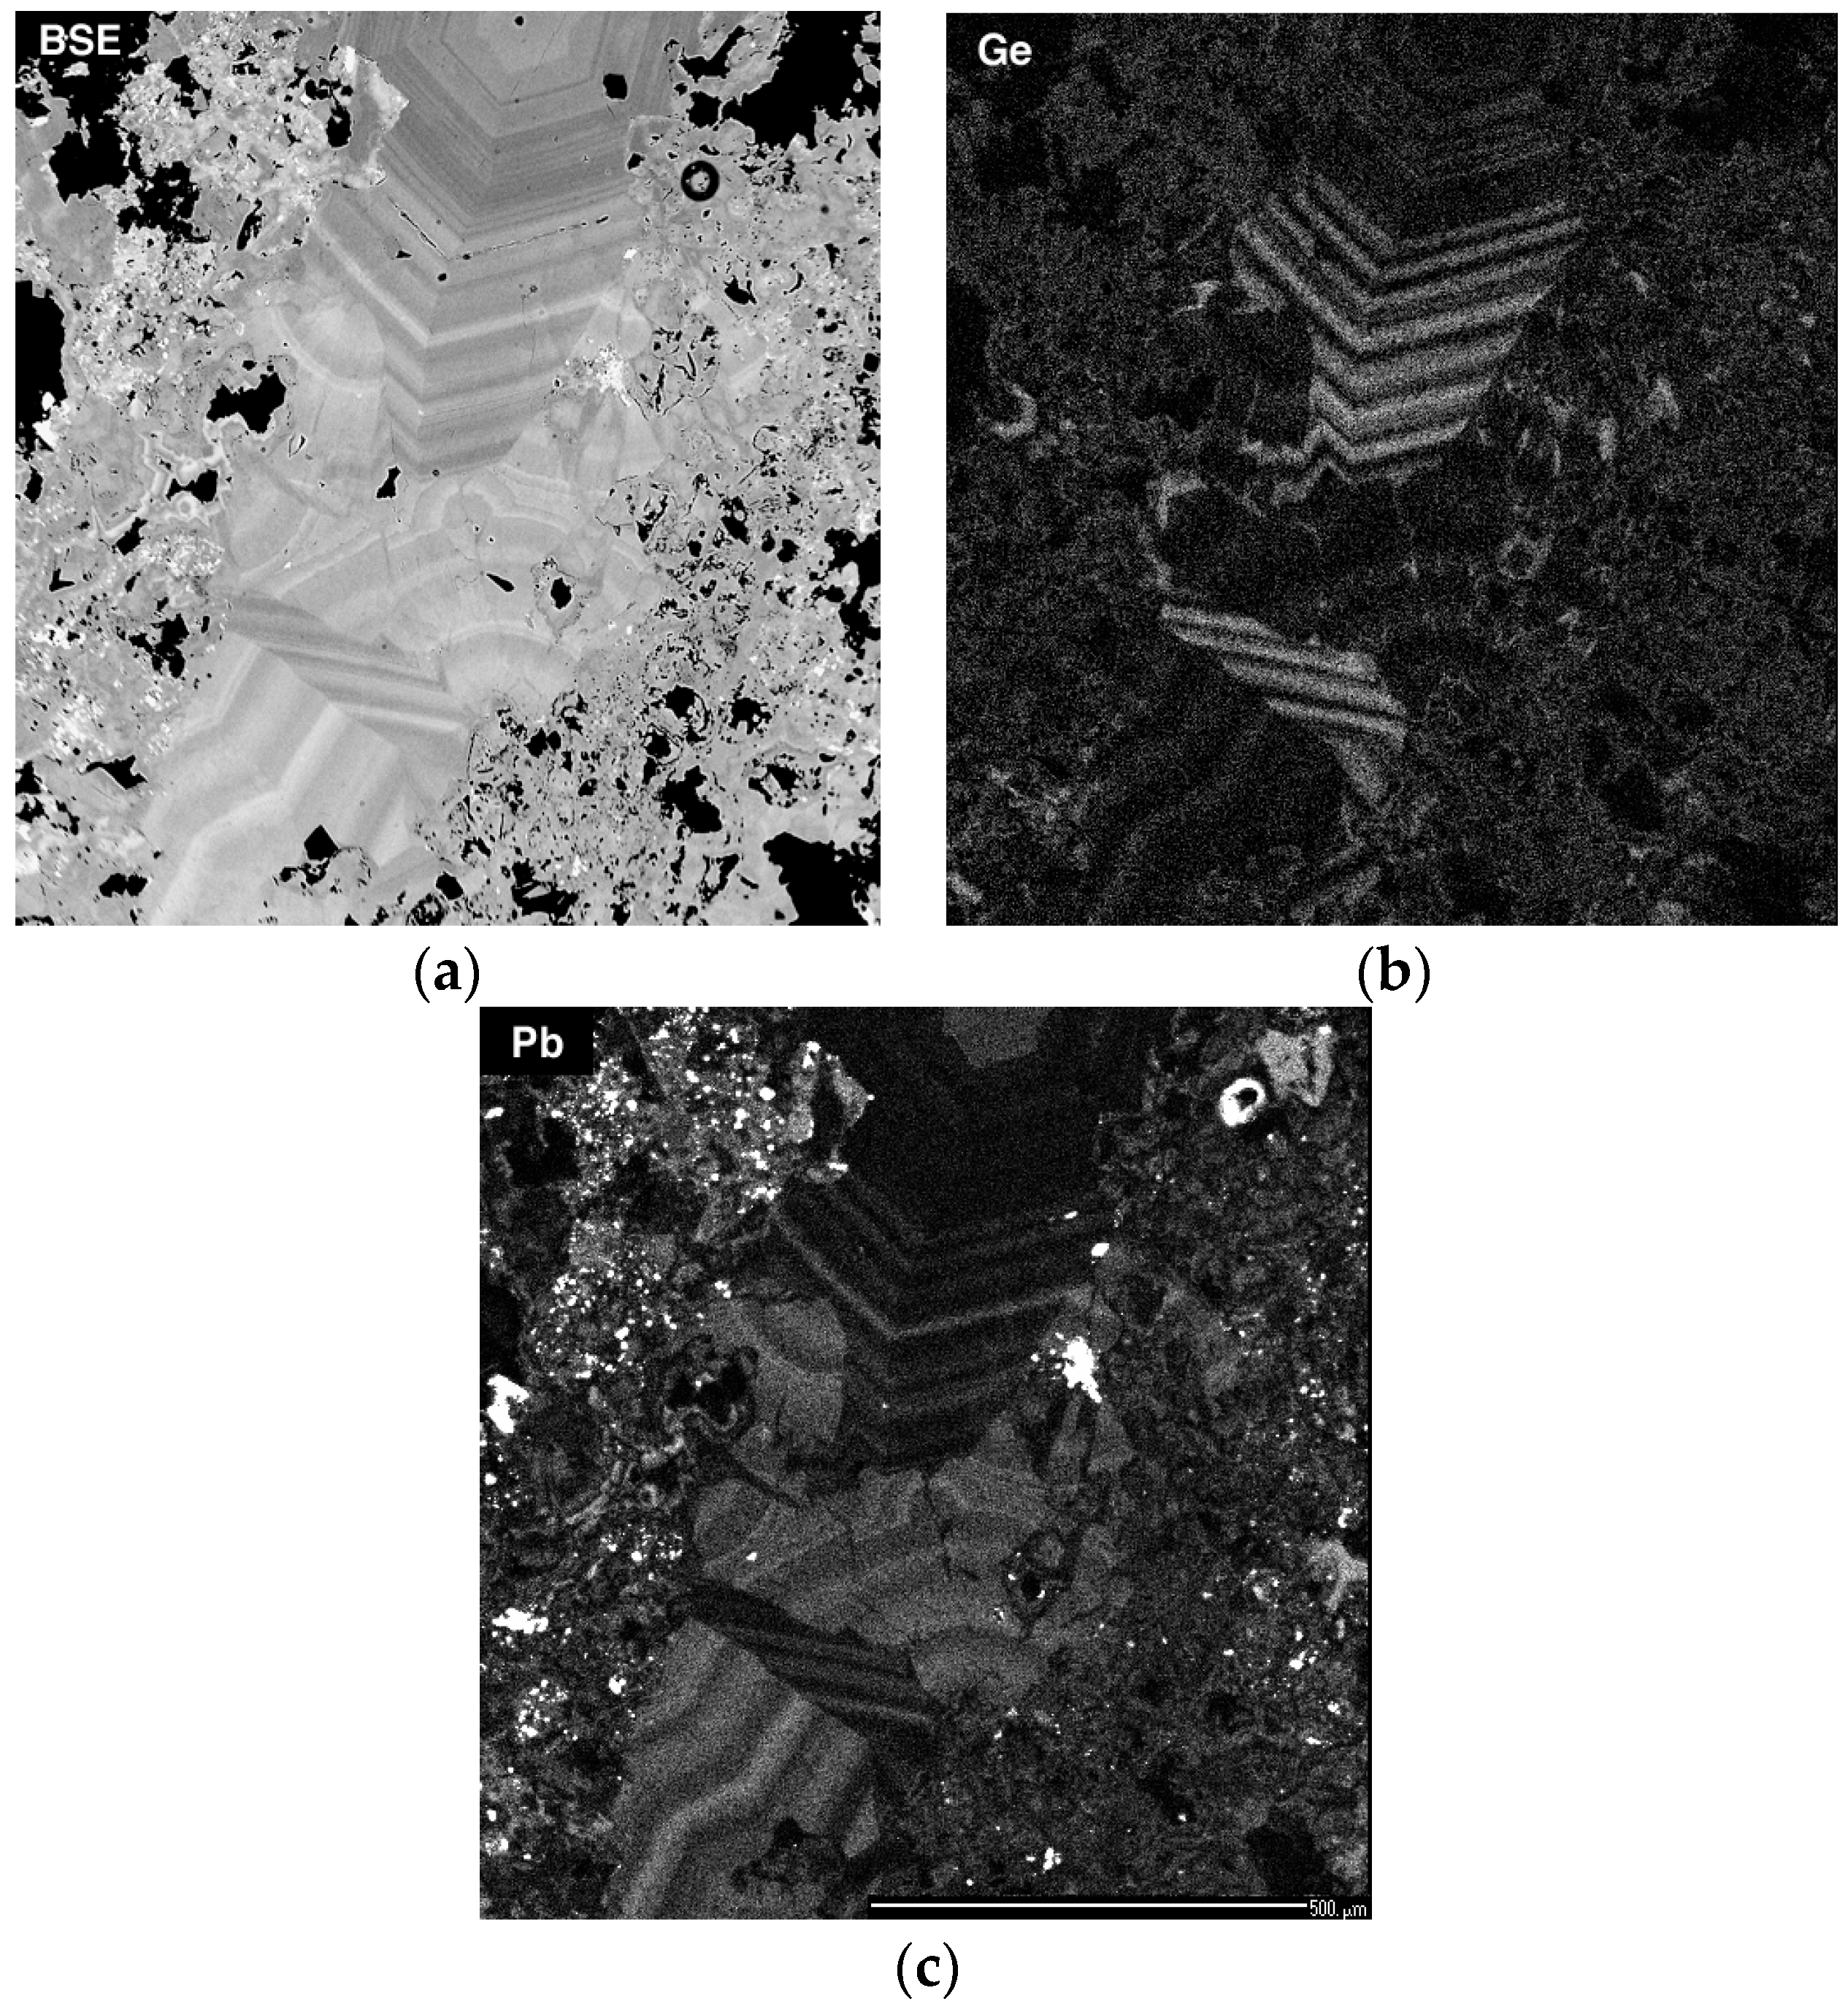
4.1. X-Ray Mapping and Microprobe Analyses
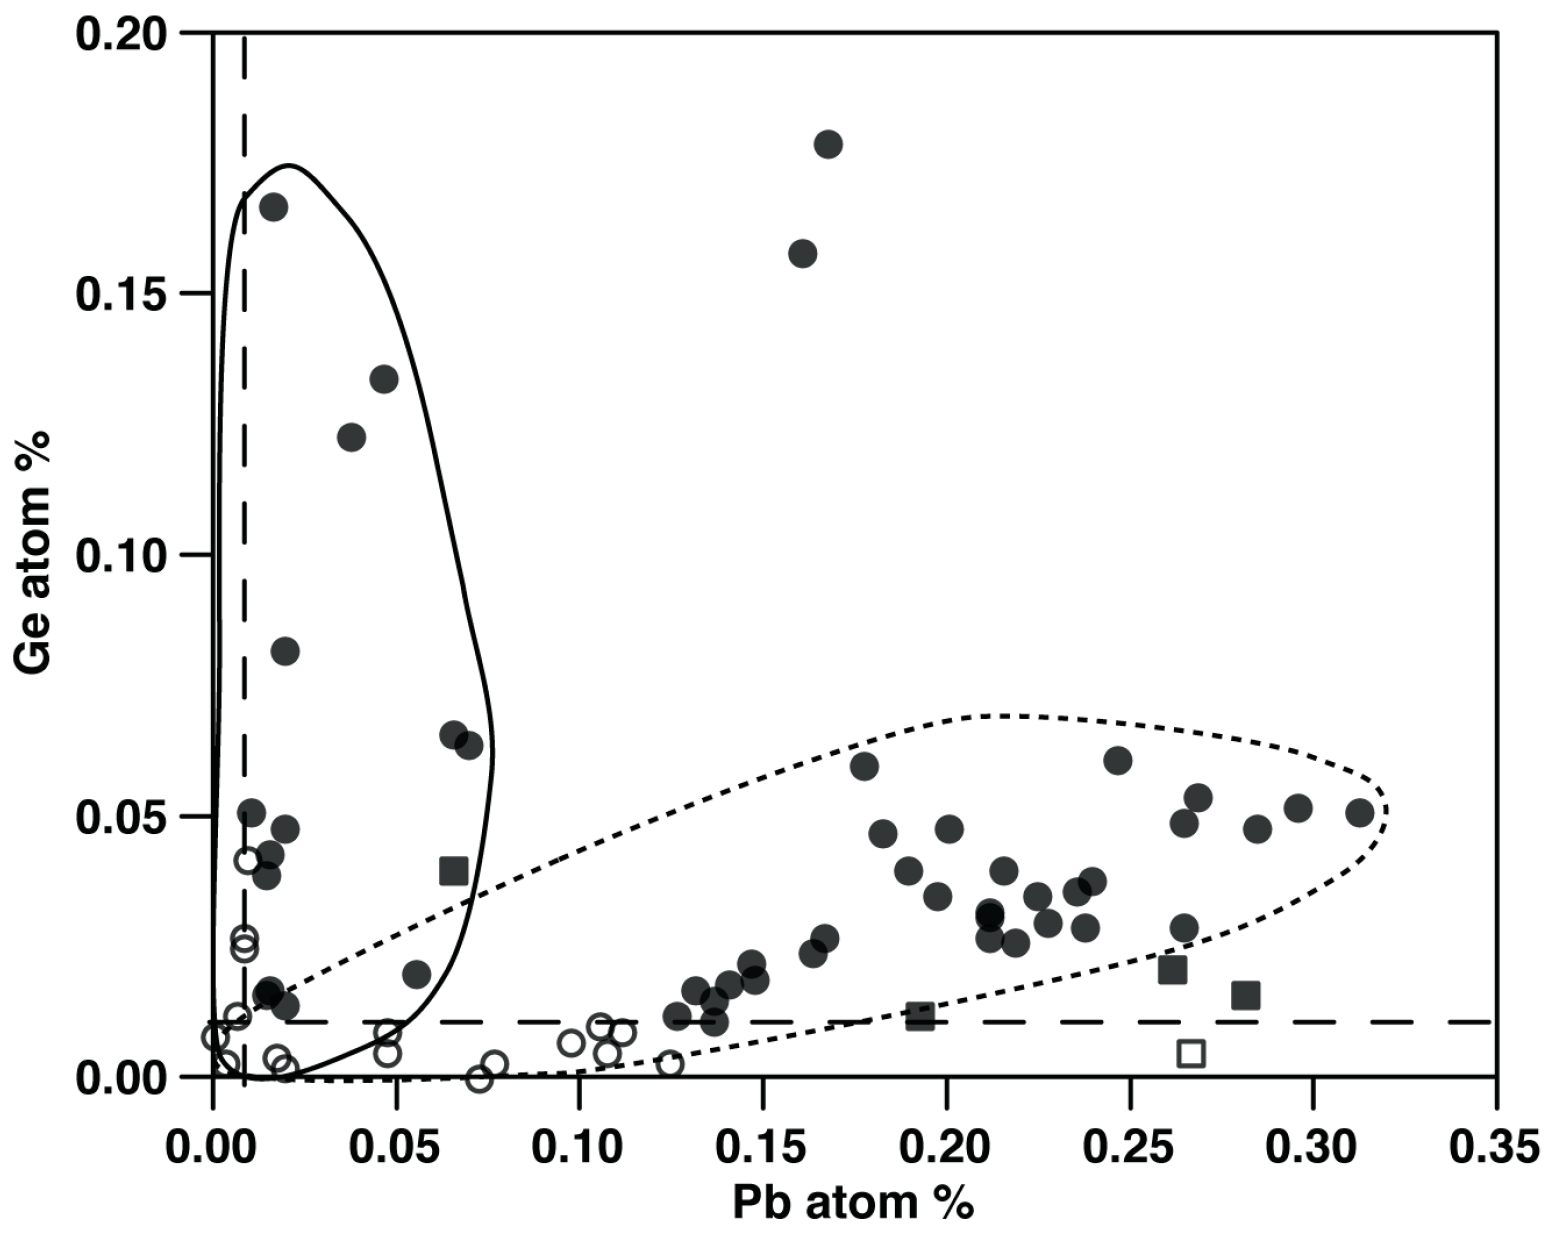
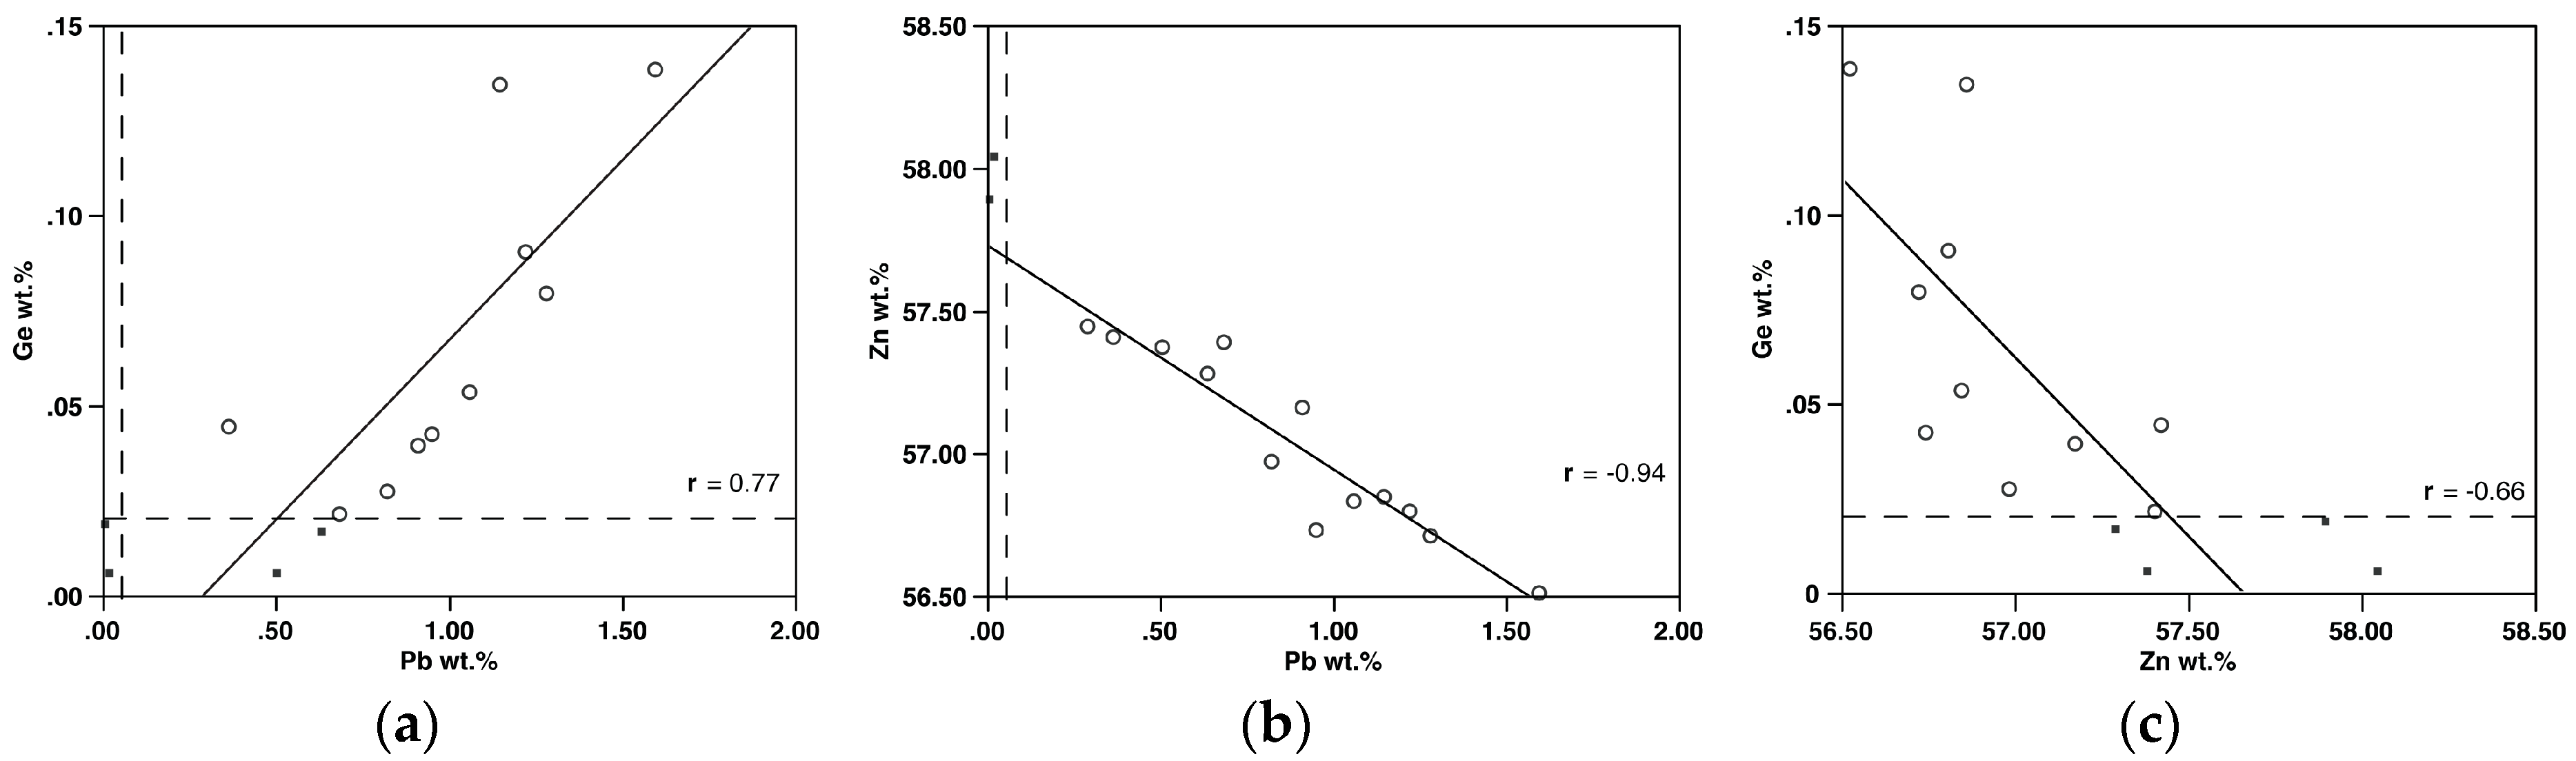
X-ray mapping (Figure 3) shows a distinct coincidence of high Pb and Ge in zoned crystals (and vice versa). Quantitative electron microprobe analyses were made along two profiles in single willemite crystals from sample TM06-15 (Figure 4 and Figure 5; Table S1). The width of the growth zones varies from a few to approximately 50 µm.
Results of electron microprobe analyses show the following trends (Figure 6):
(a)
Pb and Ge are positively correlated (r = 0.77). The Pb and Ge concentrations range from below the detection limits to over 1.5 wt % and 1400 ppm, respectively. Concentrations of both elements increase from core to rim, overprinting tandem oscillations between extreme values.
(b)
Pb and Zn are negatively correlated, with a slope near −1.0 (r = −0.94). The slope of this line is similar if data are plotted in wt % or in formula units.
(c)
Zn and Ge are also negatively correlated (r = −0.66).
In addition to analyses of the zoned crystals, analyses of fine-grained matrix willemite were conducted. When compositions from both samples are plotted in terms of atom % (Figure 7), two main trends become apparent: a low Ge-high Pb trend and a high Ge-low Pb trend. Two measurements with high Ge and intermediate Pb contents lie outside the main trends, and analyses from sample TM06-18 lie below the low Ge-high Pb trend. Concentrations of P, V, Fe and As were sporadically detected and may reach up to 1 wt % P2O5, As2O3 and FeO, and 0.15 wt % As2O3.
Hemimorphite in sample TM06-18 was studied for its trace element content, but no Ge was detected, even in cases where the hemimorphite is in contact with willemite crystals containing 900 ppm Ge. Of the trace elements measured, only Fe was above the detection limit, with an average concentration of 400 ppm. Smithsonite and cerussite in sample TM06-18 were also analyzed, and found to contain Ge at below detection limits. Cerussite contains between 0.6 and 5.8 wt % Zn, whereas smithsonite contains an average of 440 ppm Pb, 0.39 wt % Fe, 0.18 wt % Mg, and 0.18 wt % Ca. Cadmium content was below the limit of detection.

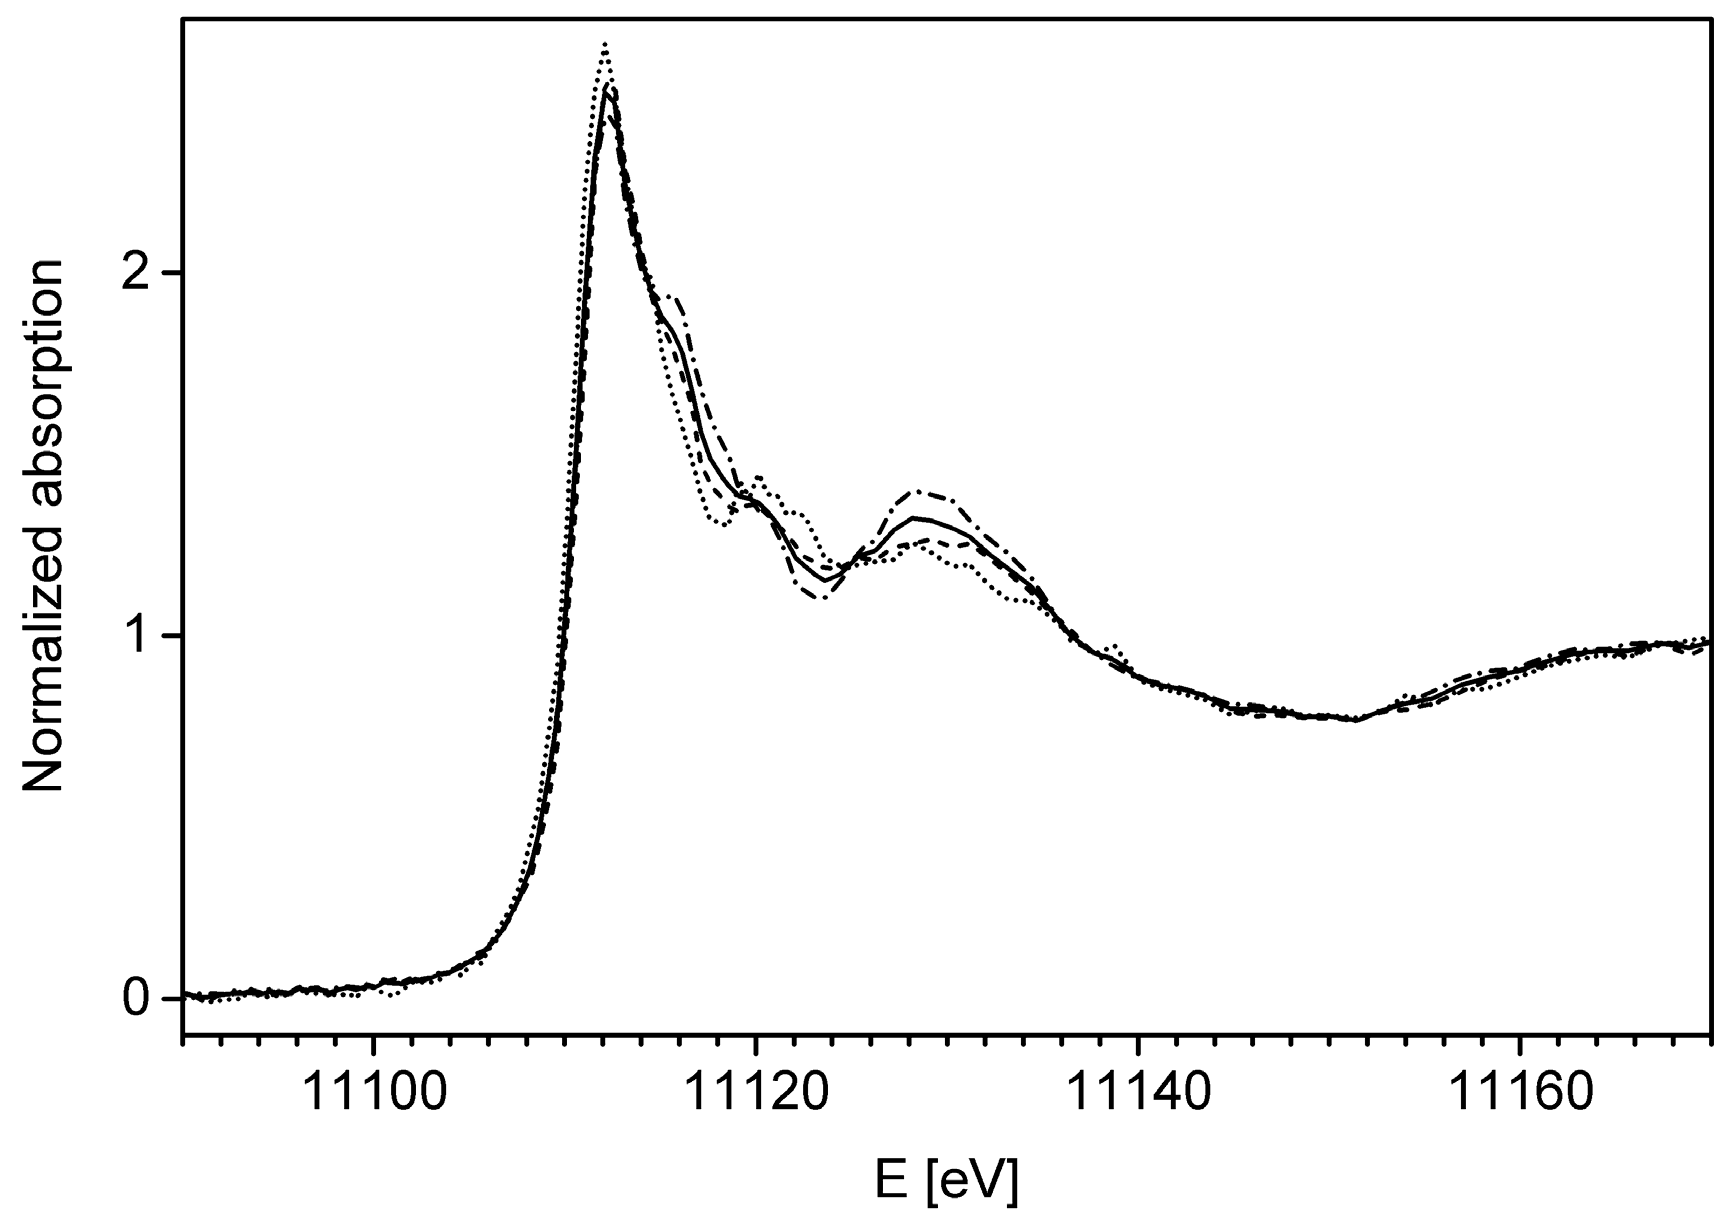
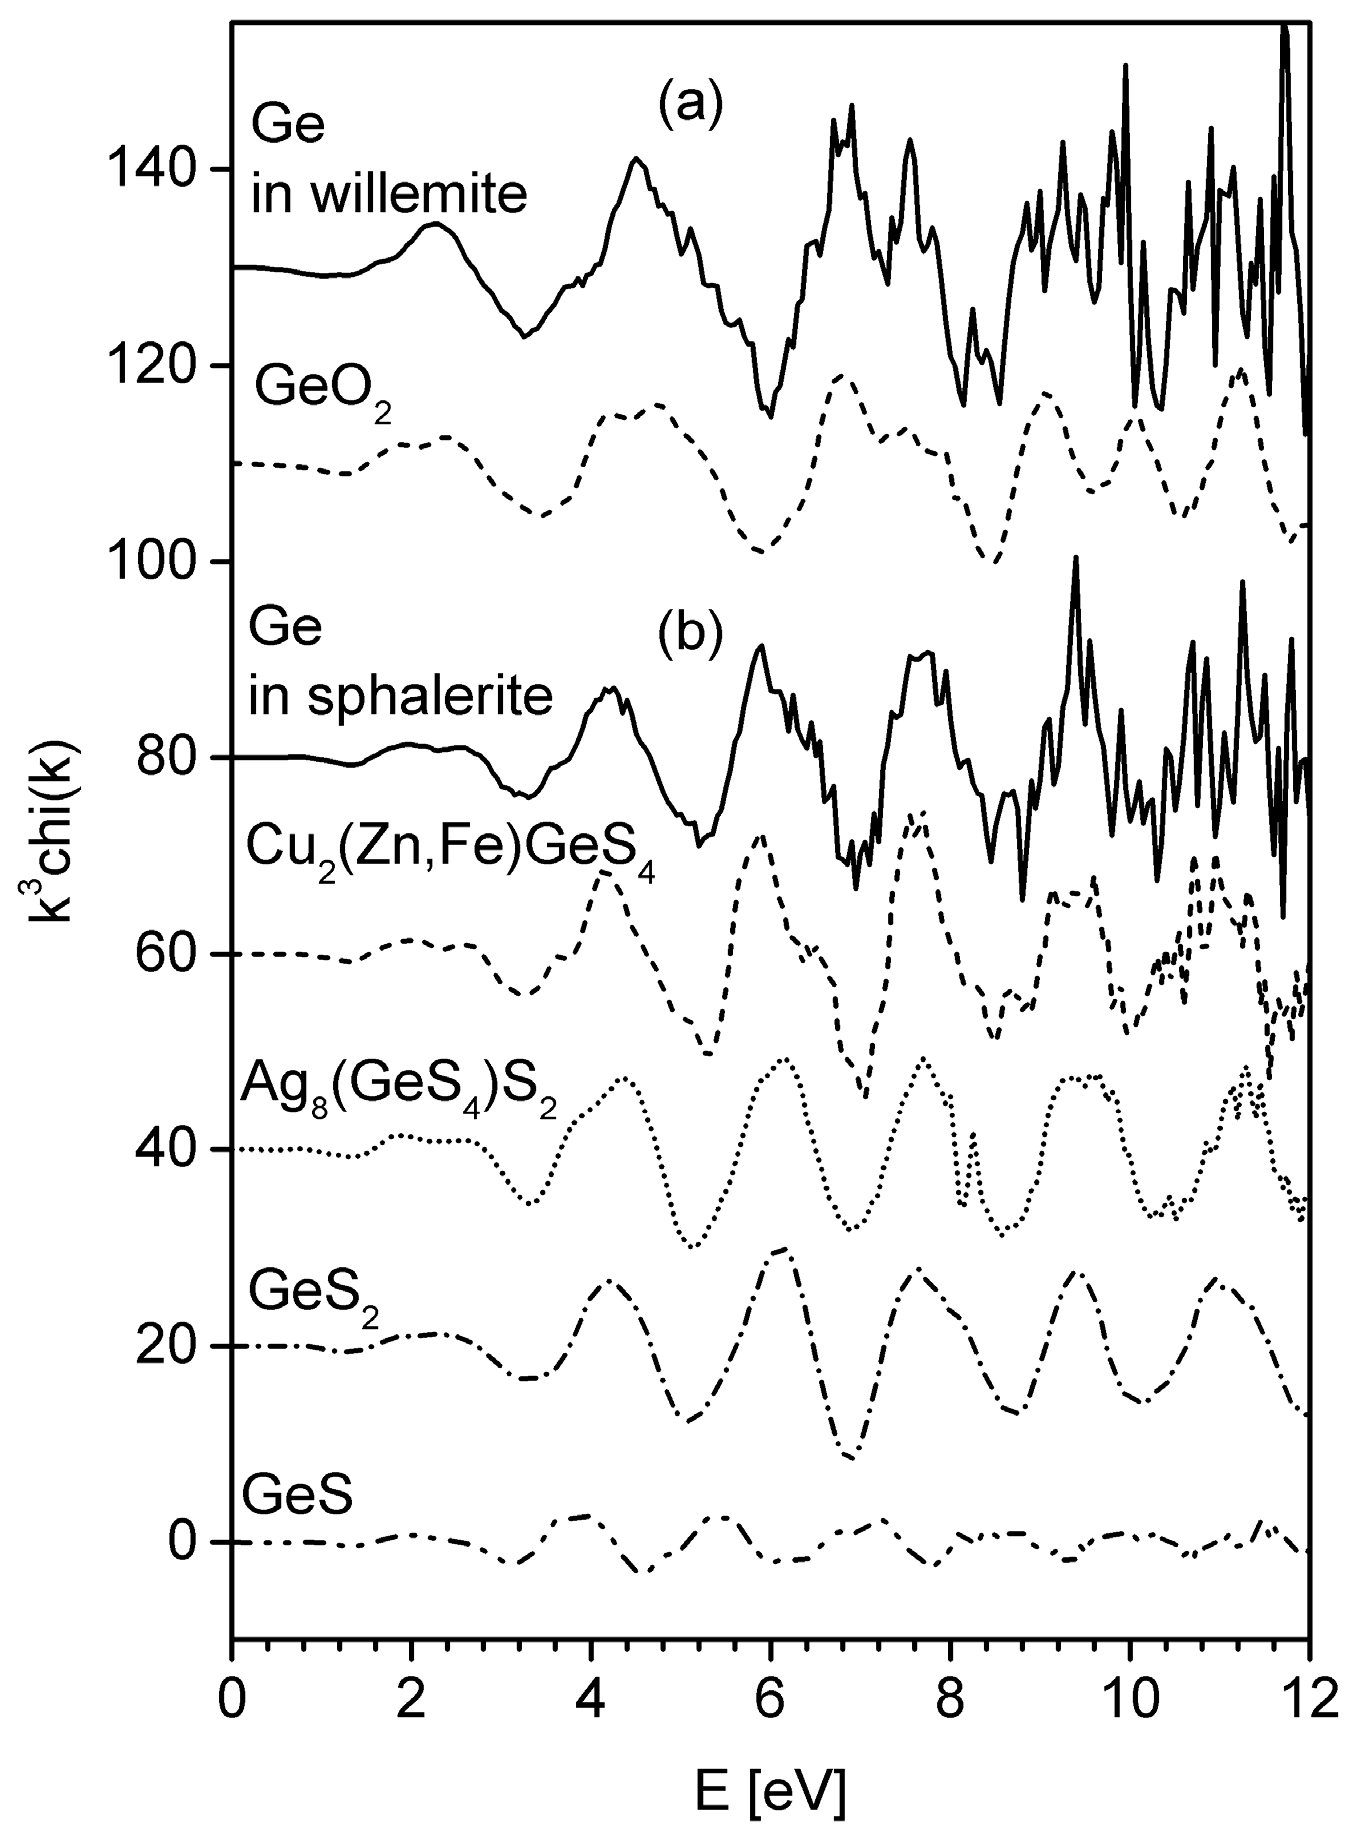
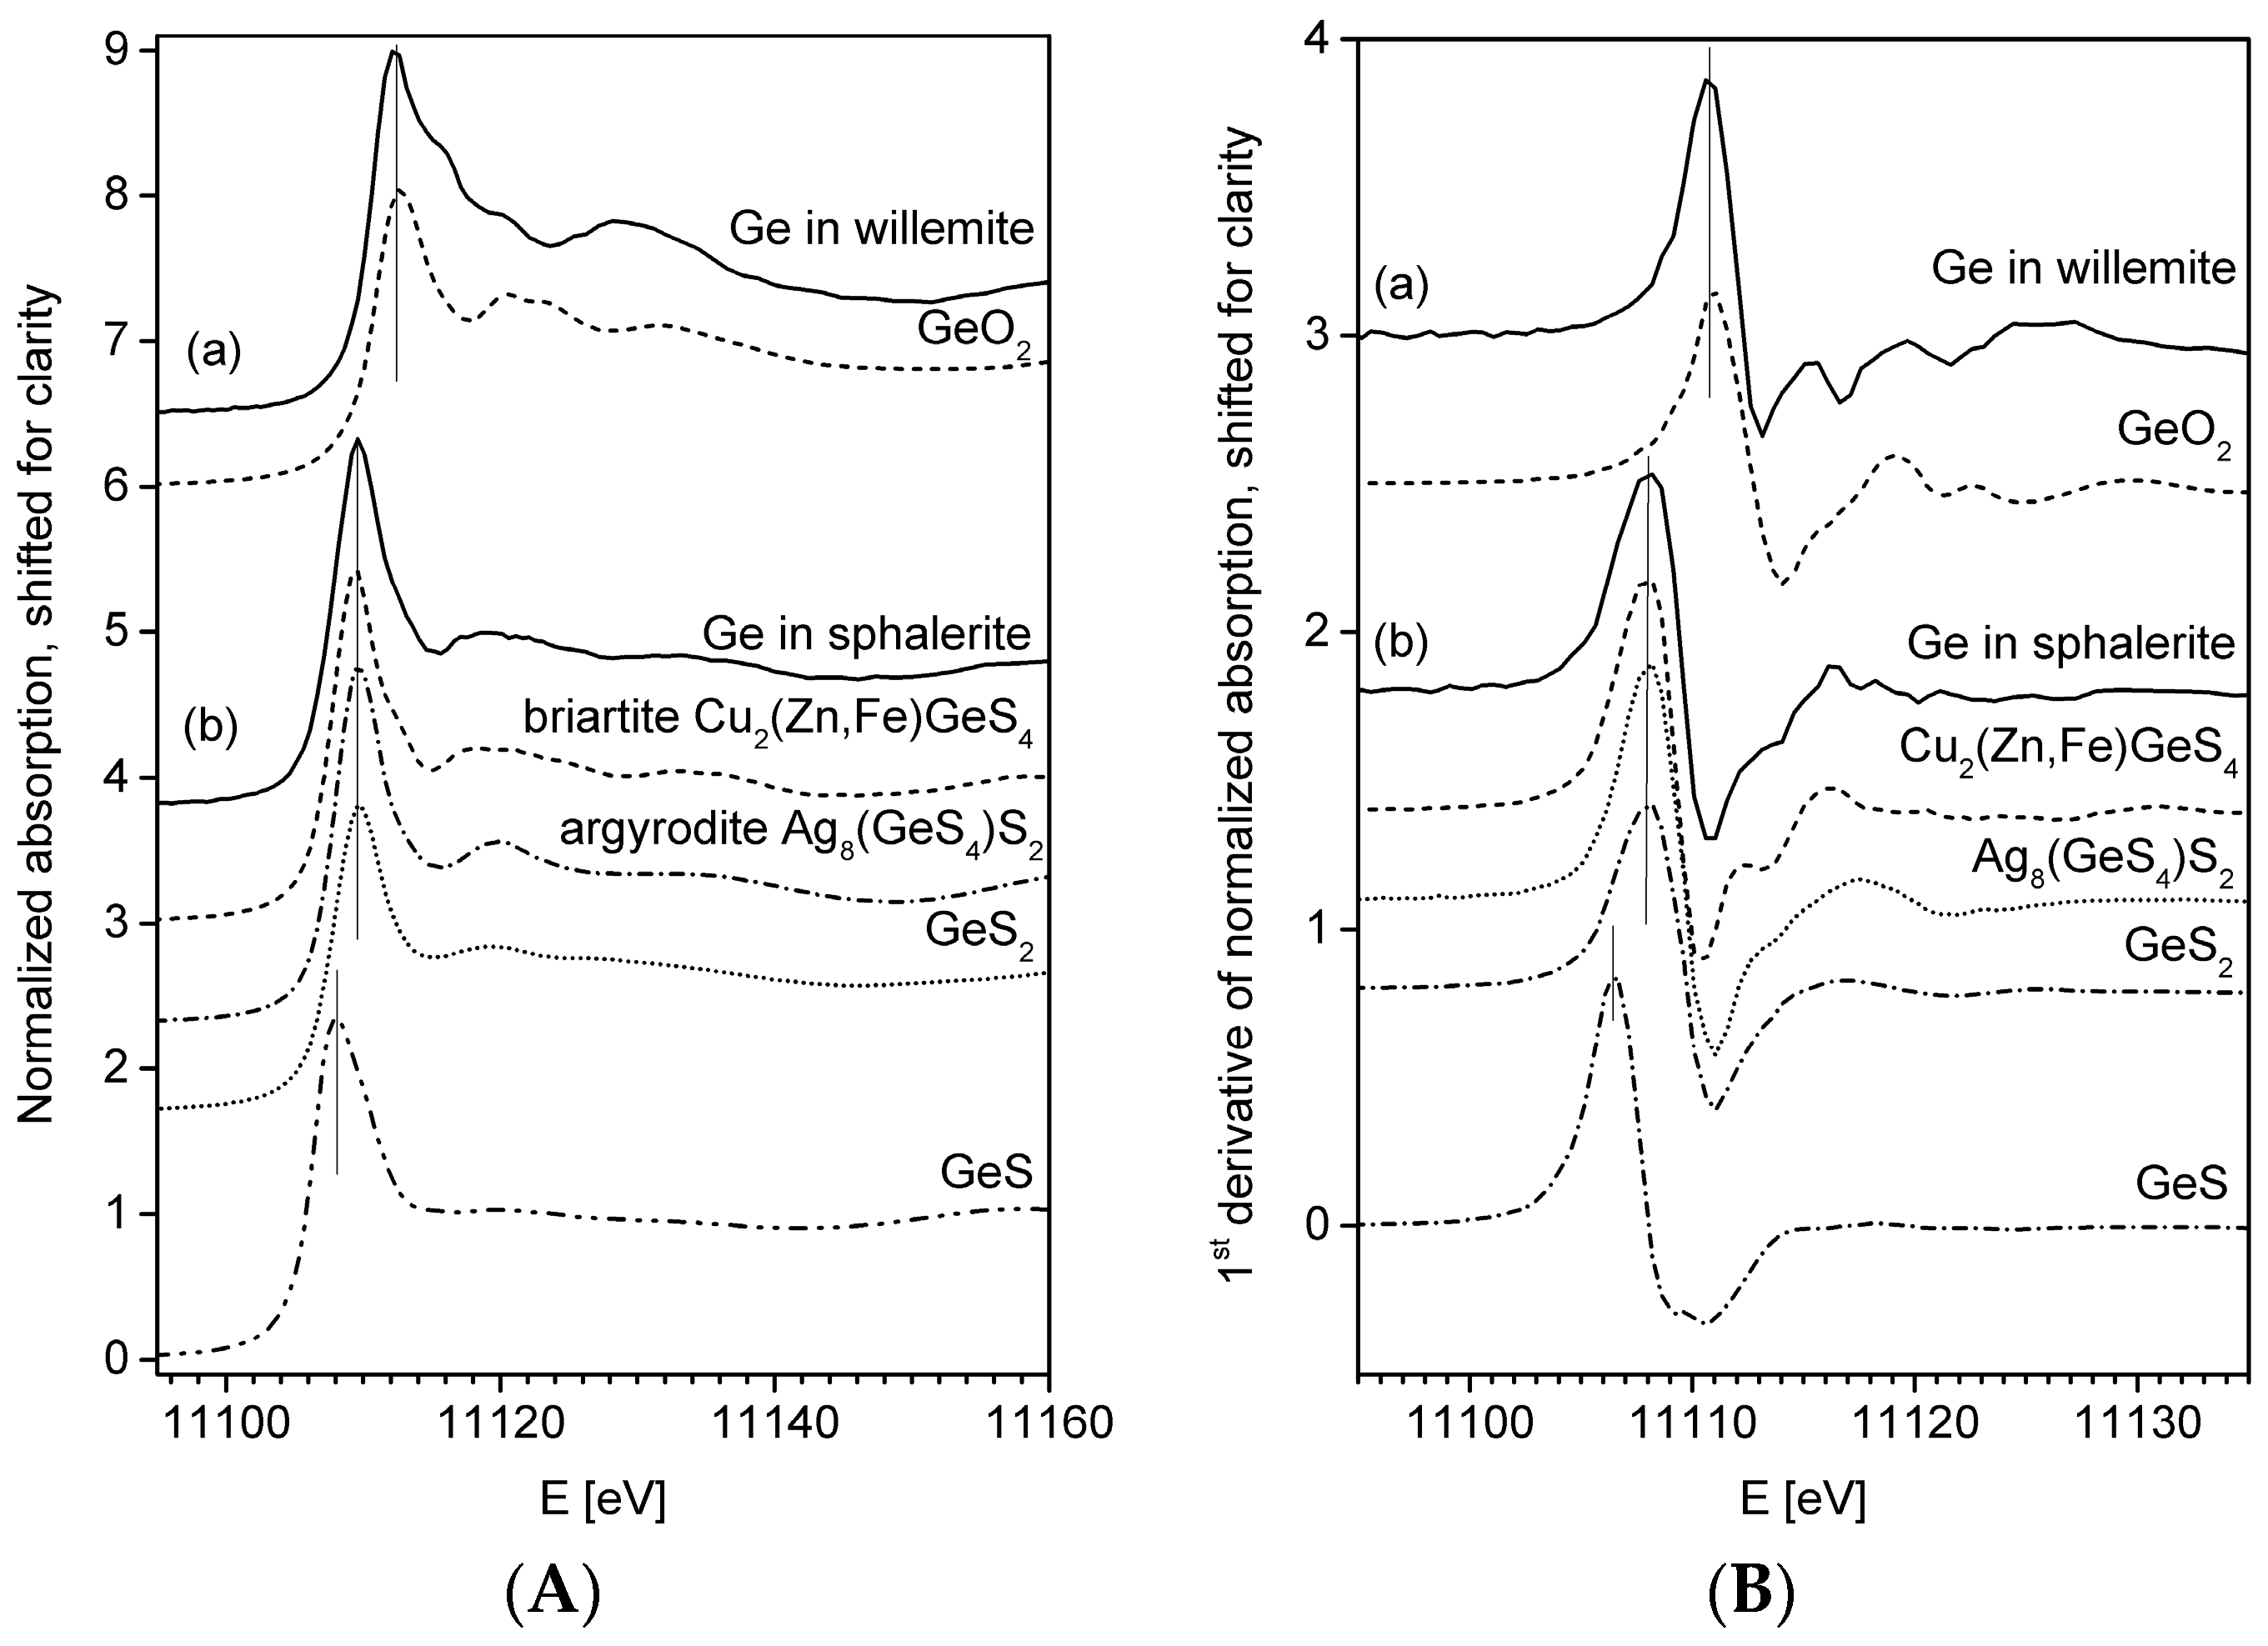
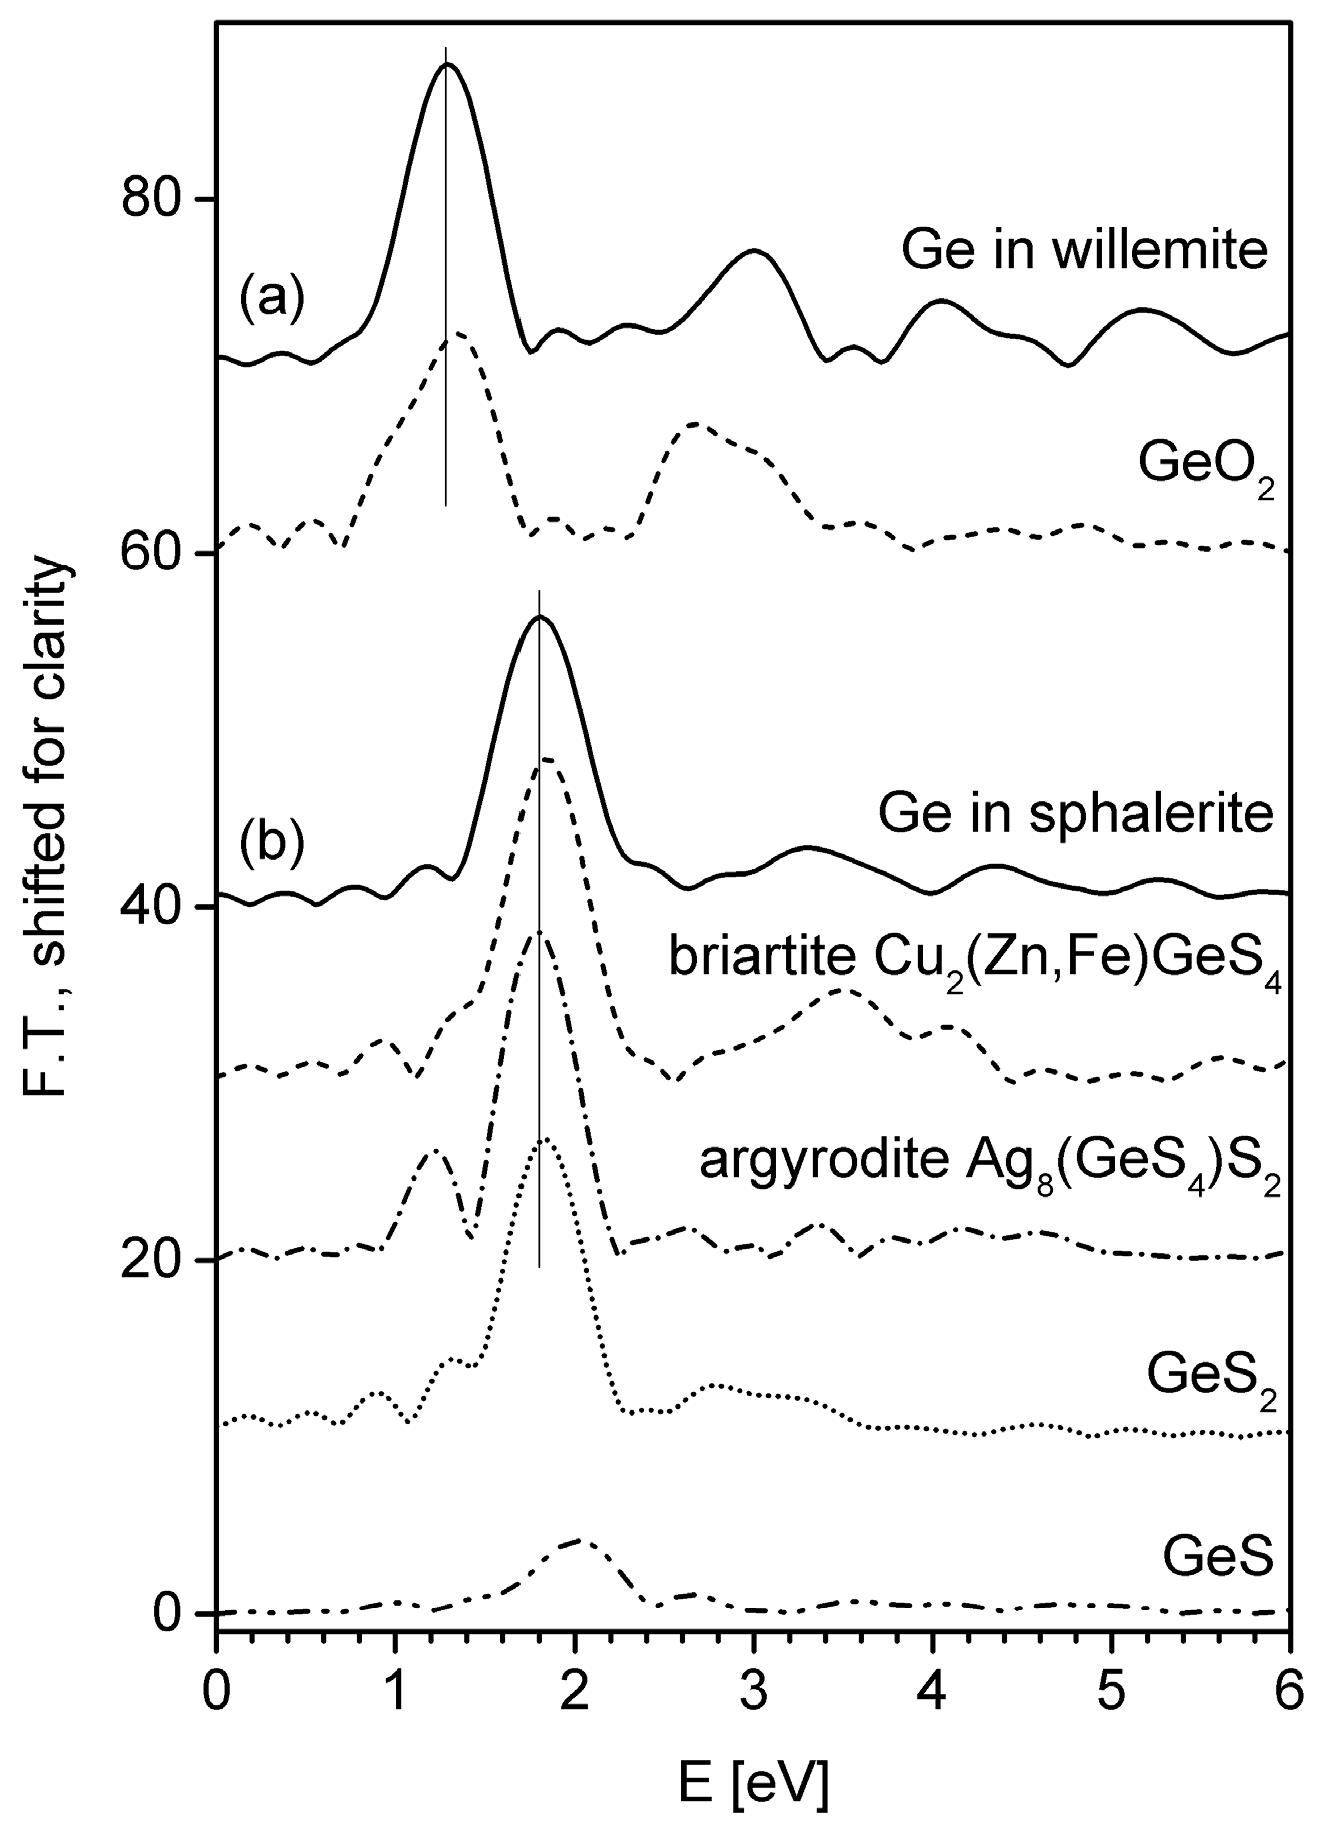
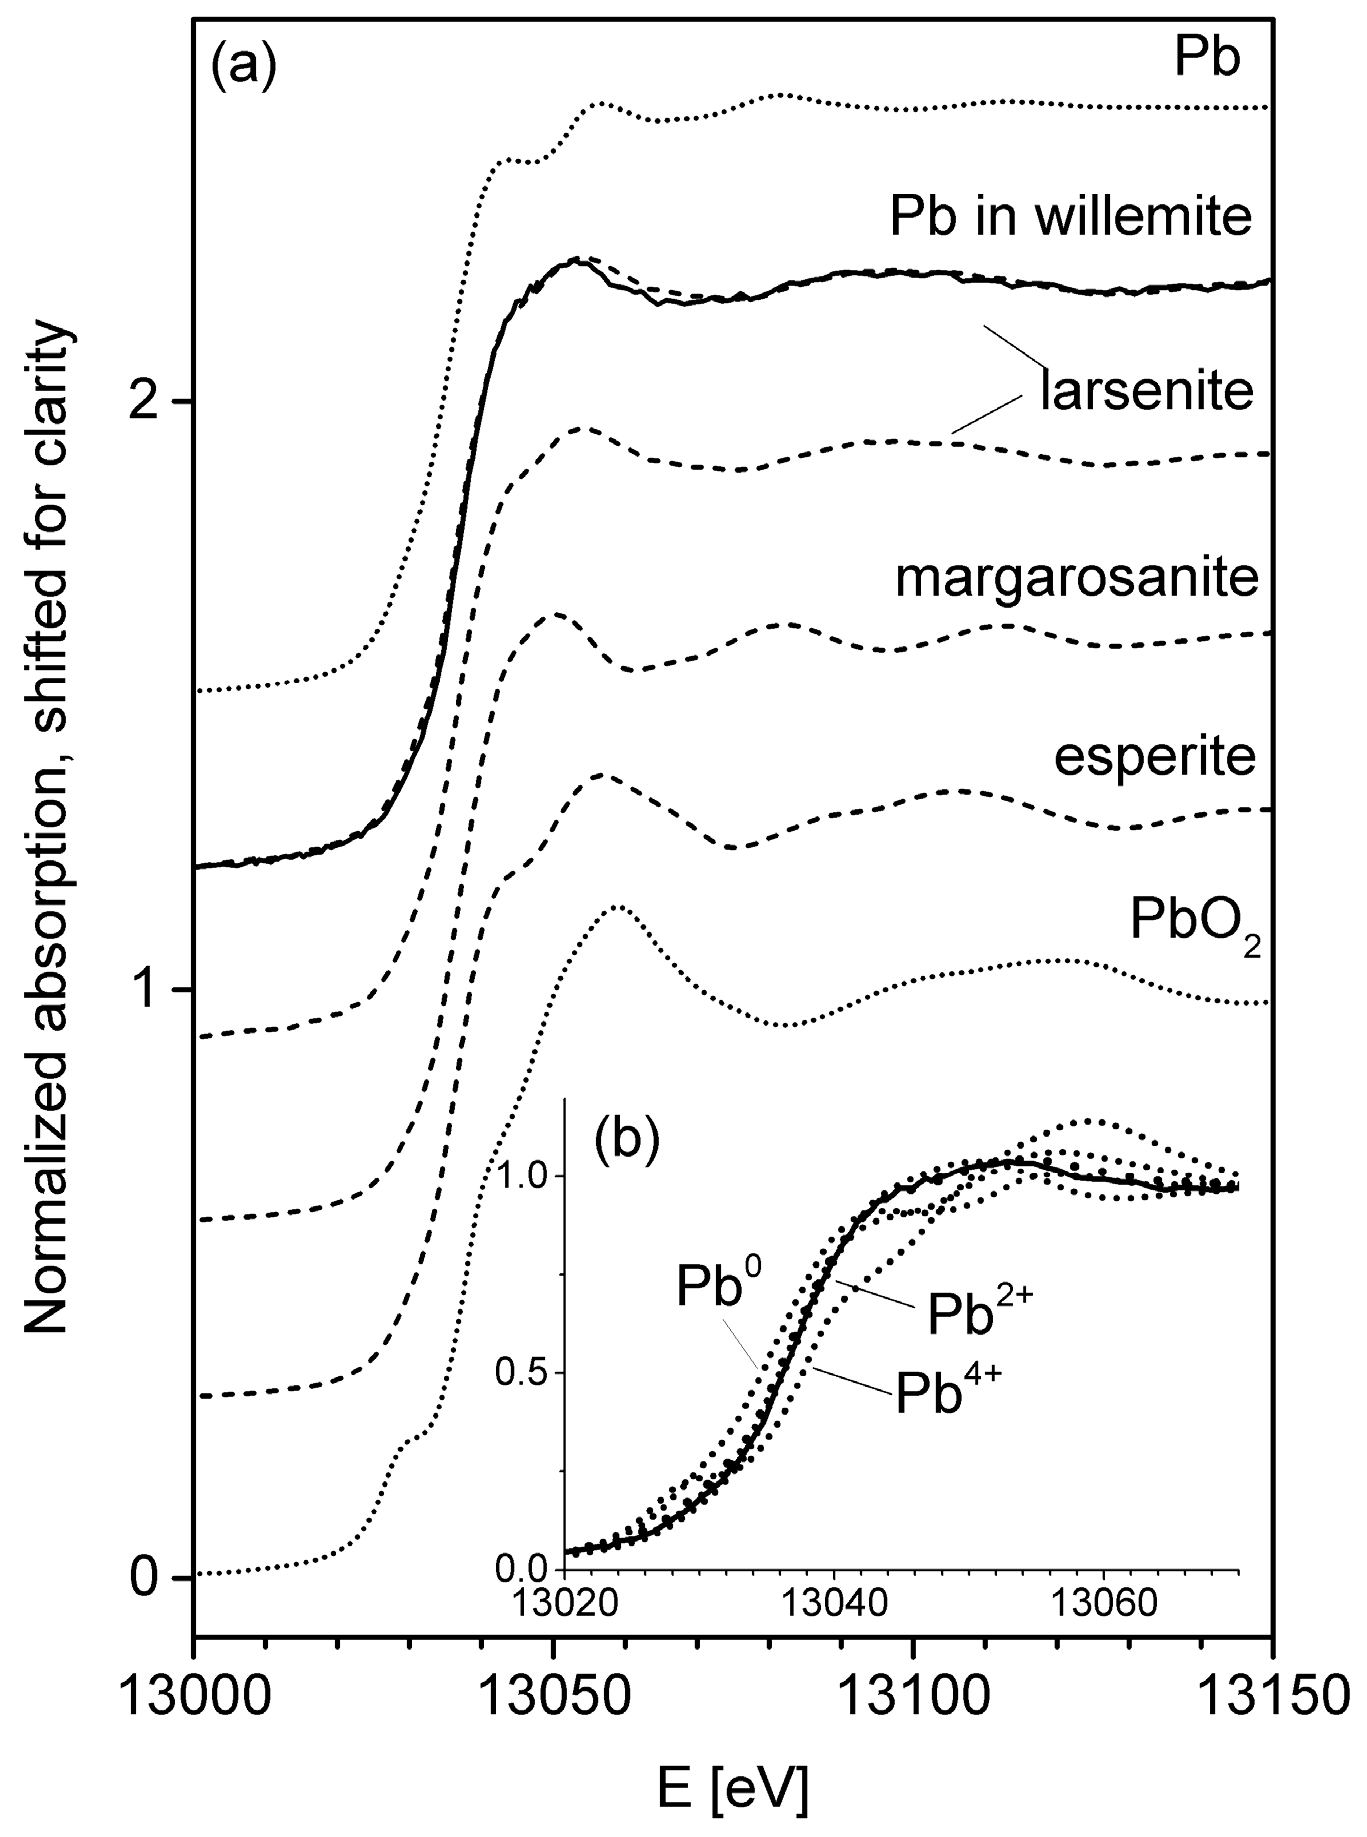
4.2. XAFS and XANES Analyses

Ge K XANES spectra measured at three different positions of the willemite part of the sample differ in their shape (Figure A1) due to crystal orientation effects on the polarized synchrotron beam. For further discussion, the averaged spectrum will be used, and is designated as the Ge K XANES/EXAFS spectrum of willemite.
The positions of the white line and of the maximum of the first derivative of the Ge K XANES spectrum of the willemite is very close to the one of a GeO2 reference spectrum, whereas the positions of Ge in sulfidic environment are located at about 2.7 eV lower energies (Figure 8).
The reference GeO2 has low quartz structure where Ge is coordinated by four oxygens in distances of 1.734 Å ([21], recalculated from Inorganic Crystal Structure Database (ICSD) No. 59624) in contrast to the six-fold oxygen coordination of GeO2 with rutile structure with four Ge-O distances of 1.872 Å and two of 1.902 Å ([22], recalculated from ICSD No. 9162). With an estimated phase shift of 0.44 Å, the Ge-O distance of Ge in willemite from the EXAFS Fourier Transform results to about 1.73 Å and, hence, is very close to the Ge-O distance in GeO2 with low quartz structure (Figure 9).
Ge-S distances in Ge-containing sphalerite are similar to the Ge-S distances in briartite, argyrodite, and GeS2 (Figure 9). Ge is also four-fold coordinated in these structures. Average Ge-S distances calculated from several ICSD entries are for briartite 2.24 Å ([23], ICSD No. 627304; [24] ICSD No. 47165; [25] ICSD No. 627306), for argyrodite 2.2 Å ([26]; ICSD No. 100079), and for GeS2 2.21 Å ([27] ICSD No. 31685; [28] ICSD No. 16951). With an estimated phase shift of 0.39 Å the Ge-S distance of Ge in sphalerite is about 2.2 Å.
A comparison of the Pb L3 XANES spectrum of Pb in Tres Marias willemite shows that Pb is present as Pb2+. No evidence for Pb4+ was detected. A reference spectrum of the Pb2+ mineral larsenite [PbZnSiO4] is very similar to the sample spectrum (Figure 10a). In addition, spectra of the Pb2+-bearing minerals margarosanite [Pb(Ca,Mn2+)2(Si3O9)] and esperite [PbCa2(ZnSiO4)3] are similar to those of the sample and to the larsenite spectrum from its edge position. The inset (b) of Figure 10 shows the lower edge position of elemental Pb and the edge position of a Pb4+ reference [PbO2] at higher energies, and the good match of the spectrum of the sample with that of larsenite.

5. Discussion

Results presented here provide evidence for the chemical environment of Ge and Pb in natural willemite, and provide constraints on the substitution mechanisms for minor elements in the willemite structure. The chemical nature of Ge in silicates can be derived from Ge K-edge XANES and EXAFS spectra (Ge K-edge 11.103 keV) [18]. Ge-O distance, oxygen coordination number and comparison of the XANES resonances with reference compounds enable the distinction between Ge in tetrahedral and octahedral coordination. From Ge K XANES and EXAFS measurements, it is likely that Ge in willemite occurs as Ge4+ and is four-fold coordinated with oxygen, as expected because the ionic radius of Si4+ (0.39 Å) is close to that of Ge4+ (0.44 Å) and isomorphism of Ge4+ with Si4+ is most probable [9]. Lattice parameters of Zn2SiO4 and Zn2GeO4 are also similar (see below). Changes in lattice parameters are in the range of 0.00034 Å for a, b and 0.00023 Å for c (R-3H setting) for 1000 ppm Ge assuming a linear behavior. These small values explain why changes in lattice constants with substitution are not or are barely detectable.
Measurement of the XANES spectra of Pb in willemite indicates it is present as Pb2+. One interpretation of the positive correlation of concentrations of Pb with Ge in willemite is that these elements may be simultaneously accommodated in the willemite structure. The cosubstitution could be due to overall expansion of the lattice with increased Ge in the tetrahedral site. Support for this idea is the increase in cell parameters from a = 13.948 Å and c = 9.315 Å for willemite [16,29] to a = 14.284 Å and c = 9.547 Å for Zn2GeO4 [30]. Similarly, average IVM-O bond length increases from 1.6319 Å in synthetic Zn2SiO4 to 1.7628 Å in Zn2GeO4 [31]. However, as discussed in Section 1, Pb2+ is unlikely to simply replace Zn2+ at its tetrahedrally coordinated site due to its much larger size. This is also indicated by the similarities with the Pb L3 XANES spectrum of larsenite, where Pb is coordinated very differently. Following [4], an interstitial location of the larger Pb2+ ion in the willemite structure, charge compensated by a vacant Zn-site is more favorable. Another possibility is that Pb is accommodated as microdomains of larsenite or a similar mineral. Further work using TEM or Pb EXAFS might clarify the crystal structural setting of Pb in willemite.
Textural relationships from ore body to thin section scale indicate alteration of primary sulfides released Ge and Pb for incorporation into willemite, in the presence of quartz. Reference [32] discussed models of willemite formation from hydrothermal fluids and indicated that, at low temperatures, SO42− is the dominant sulfur species at greater than neutral pH and oxidizing conditions with quartz saturation. A possible reaction at Tres Marias is:
2 ( Zn , Ge , Pb ) S + H 4 SiO 4 ( aqueous ) + 4 O 2 = Zn 2 - x Pb x ( Si , Ge ) O 4 + 2 SO 4 ( aqueous ) 2 - + 4 H ( aqueous ) +
with additional Pb potentially being supplied to crystallizing willemite by reaction of subordinate galena in the ore.
Analyses of willemite from sample TM06-18 fall slightly below the main low Ge/Pb trend (Figure 7). These grains are enclosed in hemimorphite associated with smithsonite, whereas cerussite also occurs in this sample. The process of hydrothermal alteration that formed the hemimorphite-smithsonite-cerussite assemblage could have led to germanium loss from the willemite as aqueous germanic acid [33]), resulting in even lower Ge/Pb ratios. This released germanium may reside adsorbed onto oxide or other minerals elsewhere in the deposit, as it occurs in the oxidation zones of Tsumeb type Ge deposits [34] and at the Apex deposit, Utah [35].
In coals and related organic material, organic compounds account for the concentration of Ge [7]. Likewise in the Tres Marias deposit, the original source of Ge may have been migrating petroleum, now represented by extensive bitumen present in disseminated form in and around the orebody.
Willemite in the Tres Marias mine contains up to 1.5 wt % Ge substituting for IVSi; concomitantly, up to 2 wt % Pb substitutes for Zn. To our knowledge, these are the highest reported Ge contents in natural willemite. The mechanism of substitution may involve interstitial Pb2+ in the willemite structure. Some Ge-rich willemite contains little to no Pb, so the converse is not true. Willemite at Tres Marias incorporated Ge as primary Ge-bearing zinc sulfide was dissolved and reprecipitated by oxidizing siliceous aqueous fluids.

Supplementary Materials

The following are available online at www.mdpi.com/2075-163X/6/1/20/s1, Table S1: Compositions of willemite from the Tres Marias deposit.

Acknowledgments

This research was begun while Bernhardt Saini-Eidukat was a visiting senior researcher at the BGR funded by the German American Fulbright Commission; Frank Melcher was a senior researcher and head of the electron microprobe laboratory at the BGR. Thomas Oberthür’s support is greatly appreciated. We thank Dave Hackman and Roberto Chavez of War Eagle Mining for their support in the field. We acknowledge the Smithsonian Institution for reference material and the ANKA Ångströmquelle Karlsruhe for allocating beamtime. Bob Martin commented on an earlier version of this article. We thank Thomas Malcherek (University Hamburg) for discussions about Pb in the willemite structure.

Author Contributions

Bernhardt Saini-Eidukat and Frank Melcher carried out the geologic, petrographic and geochemical analyses; Jörg Göttlicher and Ralph Steininger carried out the XAFS/XANES analyses and interpretations.

Conflicts of Interest

The authors declare no conflict of interest. The founding sponsors had no role in the design of the study; in the collection, analyses, or interpretation of data; in the writing of the manuscript, and in the decision to publish the results.

Appendix A

X-Ray Absorption Spectroscopy at the Ge K-Edge

Ge K-edge X-ray absorption spectra have been recorded from three different sample positions (Figure A1). Variations in the shape of the spectra are most probably due to orientation effects of the crystallites to the polarized synchrotron beam. For further data evaluation, the three spectra have been merged. One should keep in mind that the merged spectrum is most probably not identical with the one of an assemblage of randomly orientated crystallites, but it can be used as an approximate spectrum for Ge in willemite here.
Figure A1. Ge K XANES spectra from three different positions on the willemite sample (dashed, dotted, dash-dotted). Variations in the shape of the spectra are most probably due to orientation effects of the crystallites to the polarized synchrotron beam. The merged spectrum (solid line) is used for further data interpretation in the manuscript.
Minerals 06 00020 g011
Figure A2. Ge K EXAFS spectra (k3chi(k)) for (a) willemite (solid line) compared to GeO2 (low quartz structure) (dashed line), and for (b) sphalerite (solid line) compared to briartite [Cu2(Fe,Zn)GeS4] (dashed line), argyrodite [Ag8(GeS4)S2] (dotted line), GeS2 (dashed-dotted line) and GeS (dash double dotted line).
Minerals 06 00020 g012

References

  1. Butterman, W.C.; Jorgenson, J.D. Mineral Commodity Profiles: Germanium; U.S. Geological Survey Open-File Report 2004–1218; U.S. Geological Survey: Reston, CA, USA, 2004.
  2. Melcher, F.; Buchholz, P. Germanium. In Critical Metals Handbook; Gunn, G., Ed.; Wiley-Blackwell: Hoboken, NJ, USA, 2014; pp. 177–204. [Google Scholar]
  3. U.S. Geological Survey. Mineral commodity summaries, 2015. Available online: minerals.usgs.gov/minerals/pubs/mcs/2015/mcs2015.pdf (accessed on 5 November 2015).
  4. Hitzman, M.W.; Reynolds, N.A.; Sangster, D.F.; Allen, C.R.; Carman, C.E. Classification, genesis and exploration guides for nonsulfide zinc deposits. Econ. Geol. 2003, 98, 685–714. [Google Scholar] [CrossRef]
  5. Wang, S.F.; Lü, M.K.; Gu, F.; Qi, Y.X.; Xu, D.; Yuan, D.R.; Cao, D.X. Effect of Pb2+ ions on the photoluminescence characteristics of Mn2+-doped Zn2SiO4. Appl. Phys. A 2005, 80, 871–874. [Google Scholar] [CrossRef]
  6. Yang, P.; Lü, M.K.; Song, C.F.; Liu, S.W.; Gu, F.; Wang, S.F. Photoluminescence of Pb2+ ions in sol-gel derived Zn2SiO4. Inorg. Chem. Commun. 2004, 7, 268–270. [Google Scholar] [CrossRef]
  7. Bernstein, L.R. Germanium geochemistry and mineralogy. Geochim. Cosmochim. Acta 1985, 49, 2409–2422. [Google Scholar] [CrossRef]
  8. Höll, R.; Kling, M.; Schroll, E. Metallogenesis of germanium—A review. Ore Geol. Rev. 2007, 30, 145–180. [Google Scholar] [CrossRef]
  9. Sheffer, H.W. The occurrence of germanium in willemite. Geochim. Cosmochim. Acta 1966, 30, 837–838. [Google Scholar] [CrossRef]
  10. Lombaard, A.F.; Günzel, A.; Innes, J.; Krüger, T.L. The Tsumeb lead-copper-zinc-silver deposit, South West Africa/Namibia. In Mineral Deposits of Southern Africa; Anhaeusser, C.R., Maske, S., Eds.; Geological Society of South Africa: Johannesburg, South Africa, 1986; Volume 2, pp. 1761–1782. [Google Scholar]
  11. Dutrizac, J.E.; Chen, T.T.; Longton, R.J. The mineralogical deportment of germanium in the Clarksville electrolytic zinc plant of Savage Zinc Inc. Metall. Mater. Trans. B 1996, 27, 567–576. [Google Scholar] [CrossRef]
  12. Groves, I.M.; Carman, C.E.; Dunlap, W.J. Geology of the Beltana willemite deposit, Flinders Range, South Australia. Econ. Geol. 2003, 98, 797–818. [Google Scholar] [CrossRef]
  13. Choulet, F.; Buatier, M.; Richard, J.; Barbanson, L.; Guéguan, R.; Ennaciri, A. Formation of supergene zinc silicates in carbonates: New advances from the Bou Arhous deposit (Morocco). In Proceedings of the 13th Biennial SGA Meeting, Nancy, France, 24–27 August 2015.
  14. Choulet, F. Personal communication. 2015. [Google Scholar]
  15. Shannon, R.D. Revised effective ionic radii and systematic studies of interatomic distances in halides and chalcogenides. Acta Crystallogr. 1976, A32, 751–767. [Google Scholar] [CrossRef]
  16. Ericsson, T.; Filippidis, A. Cation ordering in the limited solid solution Fe2SiO4-Zn2SiO4. Am. Mineral. 1986, 71, 1502–1509. [Google Scholar]
  17. Harper, K.; Griffen, D.T. Crystallographic consequences of Mn substitution in willemite. In Proceedings of the Abstracts, Geological Society of America Annual Meeting, Salt Lake City, UT, USA, 16–19 October 2005; Volume 37, p. 287.
  18. Gusken, E.; Nunes, C.C.; Dalmon, D.L.; Ono, E.; Santos, J.S.; Suzuki, C.K. Study of GeO2 addition in silica-germania glasses by XAS; Photon Factory Activity Report 2006 #24 Part B, Users’ Report 169, 9A/2006P020; The State University of Campinas, Faculty of Mechanical Engineering, Laboratory of Photonic Materials & Devices: Campinas, Brazil, 2007. [Google Scholar]
  19. Ravel, B.; Newville, M. ATHENA, ARTEMIS, HEPHAESTUS: Data analysis for X-ray absorption spectroscopy using IFEFFIT. J. Synchrotron Radiat. 2005, 12, 537–541. [Google Scholar] [CrossRef] [PubMed]
  20. Saini-Eidukat, B.; Melcher, F.; Lodziak, J. Zinc-germanium ores of the Tres Marias Mine, Chihuahua, Mexico. Miner. Depos. 2009, 44, 363–370. [Google Scholar] [CrossRef]
  21. Haines, J.; Cambon, O.; Philippot, E.; Chapon, L.; Hull, S. A neutron diffraction study of the thermal stability of the alpha-quartz-type structure in germanium dioxide. J. Solid State Chem. 2002, 166, 434–441. [Google Scholar] [CrossRef]
  22. Baur, W.H.; Khan, A.A. Rutile-type compounds. IV. SiO2, GeO2 and a comparison with other rutile-type structures. Acta Crystallogr. Sect. B 1971, 27, 2133–2139. [Google Scholar] [CrossRef]
  23. Nitsche, R.; Sargent, D.F.; Wild, P. Crystal growth of quaternary 122464 chalcogenides by iodine vapor transport. J. Cryst. Growth 1967, 1, 52–53. [Google Scholar] [CrossRef]
  24. Wintenberger, M. Etude de la structure cristallographique et magnetique de Cu2FeGeS4 et remarque sur la structure magnetique de Cu2MnSnS4. Mater. Res. Bull. 1979, 14, 1195–1202. (In French) [Google Scholar] [CrossRef]
  25. Guen, L.; Glaunsinger, W.S. Electrical, magnetic, and EPR studies of the quaternary chalcogenides Cu2AIIBIVX4 prepared by iodine transport. J. Solid State Chem. 1980, 35, 10–21. [Google Scholar] [CrossRef]
  26. Eulenberger, G. Die Kristallstruktur der Tieftemperaturmodifikation von Ag8GeS6. Monatshefte Chem. 1977, 108, 901–913. (In German) [Google Scholar] [CrossRef]
  27. Zachariasen, W.H. The crystal structure of germanium disulphide. J. Chem. Phys. 1936, 4, 618–619. [Google Scholar] [CrossRef]
  28. Prewitt, C.T.; Young, H.S. Germanium and silicon disulfides: Structure and synthesis. Science 1965, 149, 535–537. [Google Scholar] [CrossRef] [PubMed]
  29. Klaska, K.H.; Eck, J.C.; Pohl, D. New investigation of willemite. Acta Crystallogr. 1978, B34, 3324–3325. [Google Scholar] [CrossRef]
  30. Oribe, A.; Tanaka, K.; Morikawa, H.; Marumo, F. Refinement of Crystal Structure of Zn2GeO4; Report of the Research Laboratory on Engineering Materials; Tokyo Institute of Technology: Tokyo, Japan, 1987; pp. 7–12. [Google Scholar]
  31. Chichagov, A.V.; Belonozhko, A.B.; Lopatin, A.L.; Dokina, T.N.; Samokhvalova, O.L.; Ushakovskaya, T.V.; Shilova, Z.V. Information-calculating system on crystal structure data for minerals (MINCRYST). Kristallografiya 1990, 35, 610–616. [Google Scholar] [CrossRef]
  32. Brugger, J.; McPhail, D.C.; Wallace, M.; Waters, J. Formation of willemite in hydrothermal environments. Econ. Geol. 2003, 98, 819–835. [Google Scholar] [CrossRef]
  33. Wood, S.A.; Samson, I.M. The aqueous geochemistry of gallium, germanium, indium and scandium. Ore Geol. Rev. 2006, 28, 57–102. [Google Scholar] [CrossRef]
  34. Melcher, F. The Otavi Mountain Land in Namibia: Tsumeb, germanium and snowball earth. Mitt. Österreichischen Mineral. Ges. 2003, 148, 413–435. [Google Scholar]
  35. Dutrizac, J.E.; Jambor, J.L.; Chen, T.T. Host minerals for the gallium-germanium ores of the Apex mine, Utah. Econ. Geol. 1986, 81, 946–950. [Google Scholar] [CrossRef]
Figure 1. (a) Backscattered scanning electron micrograph; and (b) transmitted optical micrograph of zoned willemite in sample TM-06-15. Numbers indicate location of analyses in Table S1. Note the chemical zonation is not observable optically.
Minerals 06 00020 g001
Figure 2. Backscattered scanning electron micrograph showing textural relationships between willemite (bright, W), hemimorphite (intermediate, H) and smithsonite (dark, S) in sample TM06-18. Willemite analysis #40, Table S1 is from this sample.
Minerals 06 00020 g002
Figure 3. (a): Backscattered electron image; (b): Ge X-ray fluorescence map and (c): Pb X-ray fluorescence map of zoned willemite in sample TM-06-15.
Minerals 06 00020 g003
Figure 4. Backscattered scanning electron micrograph of zoned willemite, sample TM06-15. Numbers represent analyses, reported in Table S1.
Minerals 06 00020 g004
Figure 5. Backscattered scanning electron micrograph of zoned willemite, sample TM06-15. Numbers represent analyses, reported in Table S1.
Minerals 06 00020 g005
Figure 6. (a): Ge wt % vs. Pb wt %; (b) Zn wt % vs. Pb wt %; and (c) Ge vs. Zn wt % for the zoned willemite shown in Figure 4. Closed symbols plotting below the dashed line, which indicates detection limit, were not used in plotting regression line nor in calculating r value.
Minerals 06 00020 g006
Figure 7. Pb vs. Ge (atom %) in willemite. Circles: TM06-15; squares: TM06-18. Dotted line outlines low Ge-high Pb trend, while solid line outlines the high Ge-low Pb trend. Open symbols are below detection limits, which are indicated by dashed lines.
Minerals 06 00020 g007
Figure 8. (A) Ge K XANES spectra of Ge in (a) willemite (solid line) compared to GeO2 (dashed line) indicating Ge as Ge4+ in the oxidic environment of willemite; and (b) sphalerite (solid line) compared to briartite [Cu2(Fe,Zn)GeS4] (dashed line), argyrodite [Ag8(GeS4)S2] (dash-dotted line), GeS2 (dotted line) and GeS (dash double dotted line). The shift of the white line from Ge monosulfide to disulfides and oxides is indicated by vertical markers at about 1108.0, 1109.6, and 1112.3 eV, respectively. Energy has been calibrated at the Pt L3 edge to 11564 eV. Sample spectra were measured in fluorescence mode, reference spectra in transmission. (B) 1st derivative of Ge K XANES spectra of Ge in (a) willemite (solid line) compared to GeO2 (dashed line) indicating Ge as Ge4+ in the oxidic environment of willemite; and (b) sphalerite (solid line) compared to briartite [Cu2(Fe,Zn)GeS4] (dashed line), argyrodite [Ag8(GeS4)S2] (dash-dotted line), GeS2 (dotted line) and GeS (dash double dotted line). The shift of the maxima of the first derivatives from Ge monosulfide to disulfides and oxides is indicated by vertical markers at about 1106.5, 1108.0, and 1110.7 eV, respectively. Energy has been calibrated at the Pt L3 edge to 11564 eV.
Minerals 06 00020 g008
Figure 9. Fourier Transformations (F.T.), not phase shift corrected, of Ge K EXAFS spectra (weight k3, k range up to 11.5) for (a) willemite (solid line) compared to GeO2 (dashed line); and for (b) sphalerite (solid line) compared to briartite [Cu2(Fe,Zn)GeS4] (dashed line), argyrodite [Ag8(GeS4)S2] (dash-dotted line), GeS2 (dotted line) and GeS (dash double dotted line). The markers are located at a) Ge-O (a) and (b) Ge-S distances, indicating Ge-O distances in willemite are similar to the ones in GeO2 (low quartz structure), and Ge-S distances in Ge containing sphalerite are close to Ge-S distances in briartite, argyrodite and GeS2. Ge K EXAFS spectra (k3chi(k)) are presented in Figure A2.
Minerals 06 00020 g009
Figure 10. (a) Comparison of the averaged Pb L3 XANES spectrum for Pb containing Tres Marias willemite compared with the spectra of elemental Pb, of larsenite [PbZnSiO4] (Smithsonian C6174), margarosanite [Pb(Ca,Mn2+)2(Si3O9)] (Smithsonian C6175), and esperite [PbCa2(ZnSiO4)3] (Smithsonian R18305) as Pb2+ references, and PbO2 as Pb4+ reference. The inset (b) demonstrates the edge shift from elemental Pb via Pb2+ minerals to Pb4+ in PbO2. Sample and reference spectra were measured in fluorescence and transmission mode, respectively.
Minerals 06 00020 g010
Table 1. Whole rock chemical analyses of samples TM06-15 and TM06-18 from the Tres Marias Mine.
AnalyteTM06-15TM06-18Method 1AnalyteTM06-15TM06-18Method 1
wt %wt %ppmppm
SiO216.0328.681Ag0.86.86
TiO20.0040.0441As12006857
Al2O30.0716.971Au<2<27
Fe2O36.921.161Ba219131
MnO0.0070.0071Bi<1261
MgO0.030.151Cd17980.45
CaO4.030.341Ce<3187
Na2O<0.01<0.011Cr<81371
K2O0.010.261Cs<177
P2O50.0280.1371Cu32195
(SO3)4.220.955Ga5586
(F)<0.10<0.101Ge10703046
LOI3.214.73Ge12483441
Pb21.40.7284In0.26.56
Zn33.512.41Mo44997
C org0.230.302Nb20<51
C total2.030.702Ni6<51
CO28.992.00diffSb28221
Sum98.7598.84 Sc<251
Sr2524781
V4381686
W<30<181
Zr<9141
1: Analytical Methods: diff = by difference; 1: BGR-XRF; 2: BGR-LECO; 3: BGR-LOI; 4: Actlabs-ICP-OES; 5: Actlabs-TD-ICP; 6: Actlabs-FUS-MS; 7: Actlabs-INAA.

