
Loading Capacity and Deformation Characteristics of Tailings Based on a Fractal Geometrical Analysis of the Particle Microstructure


 and
and
Abstract
:1. Introduction
2. Theoretical Basis: Fractal Geometry
3. Equipment, Materials and Methods
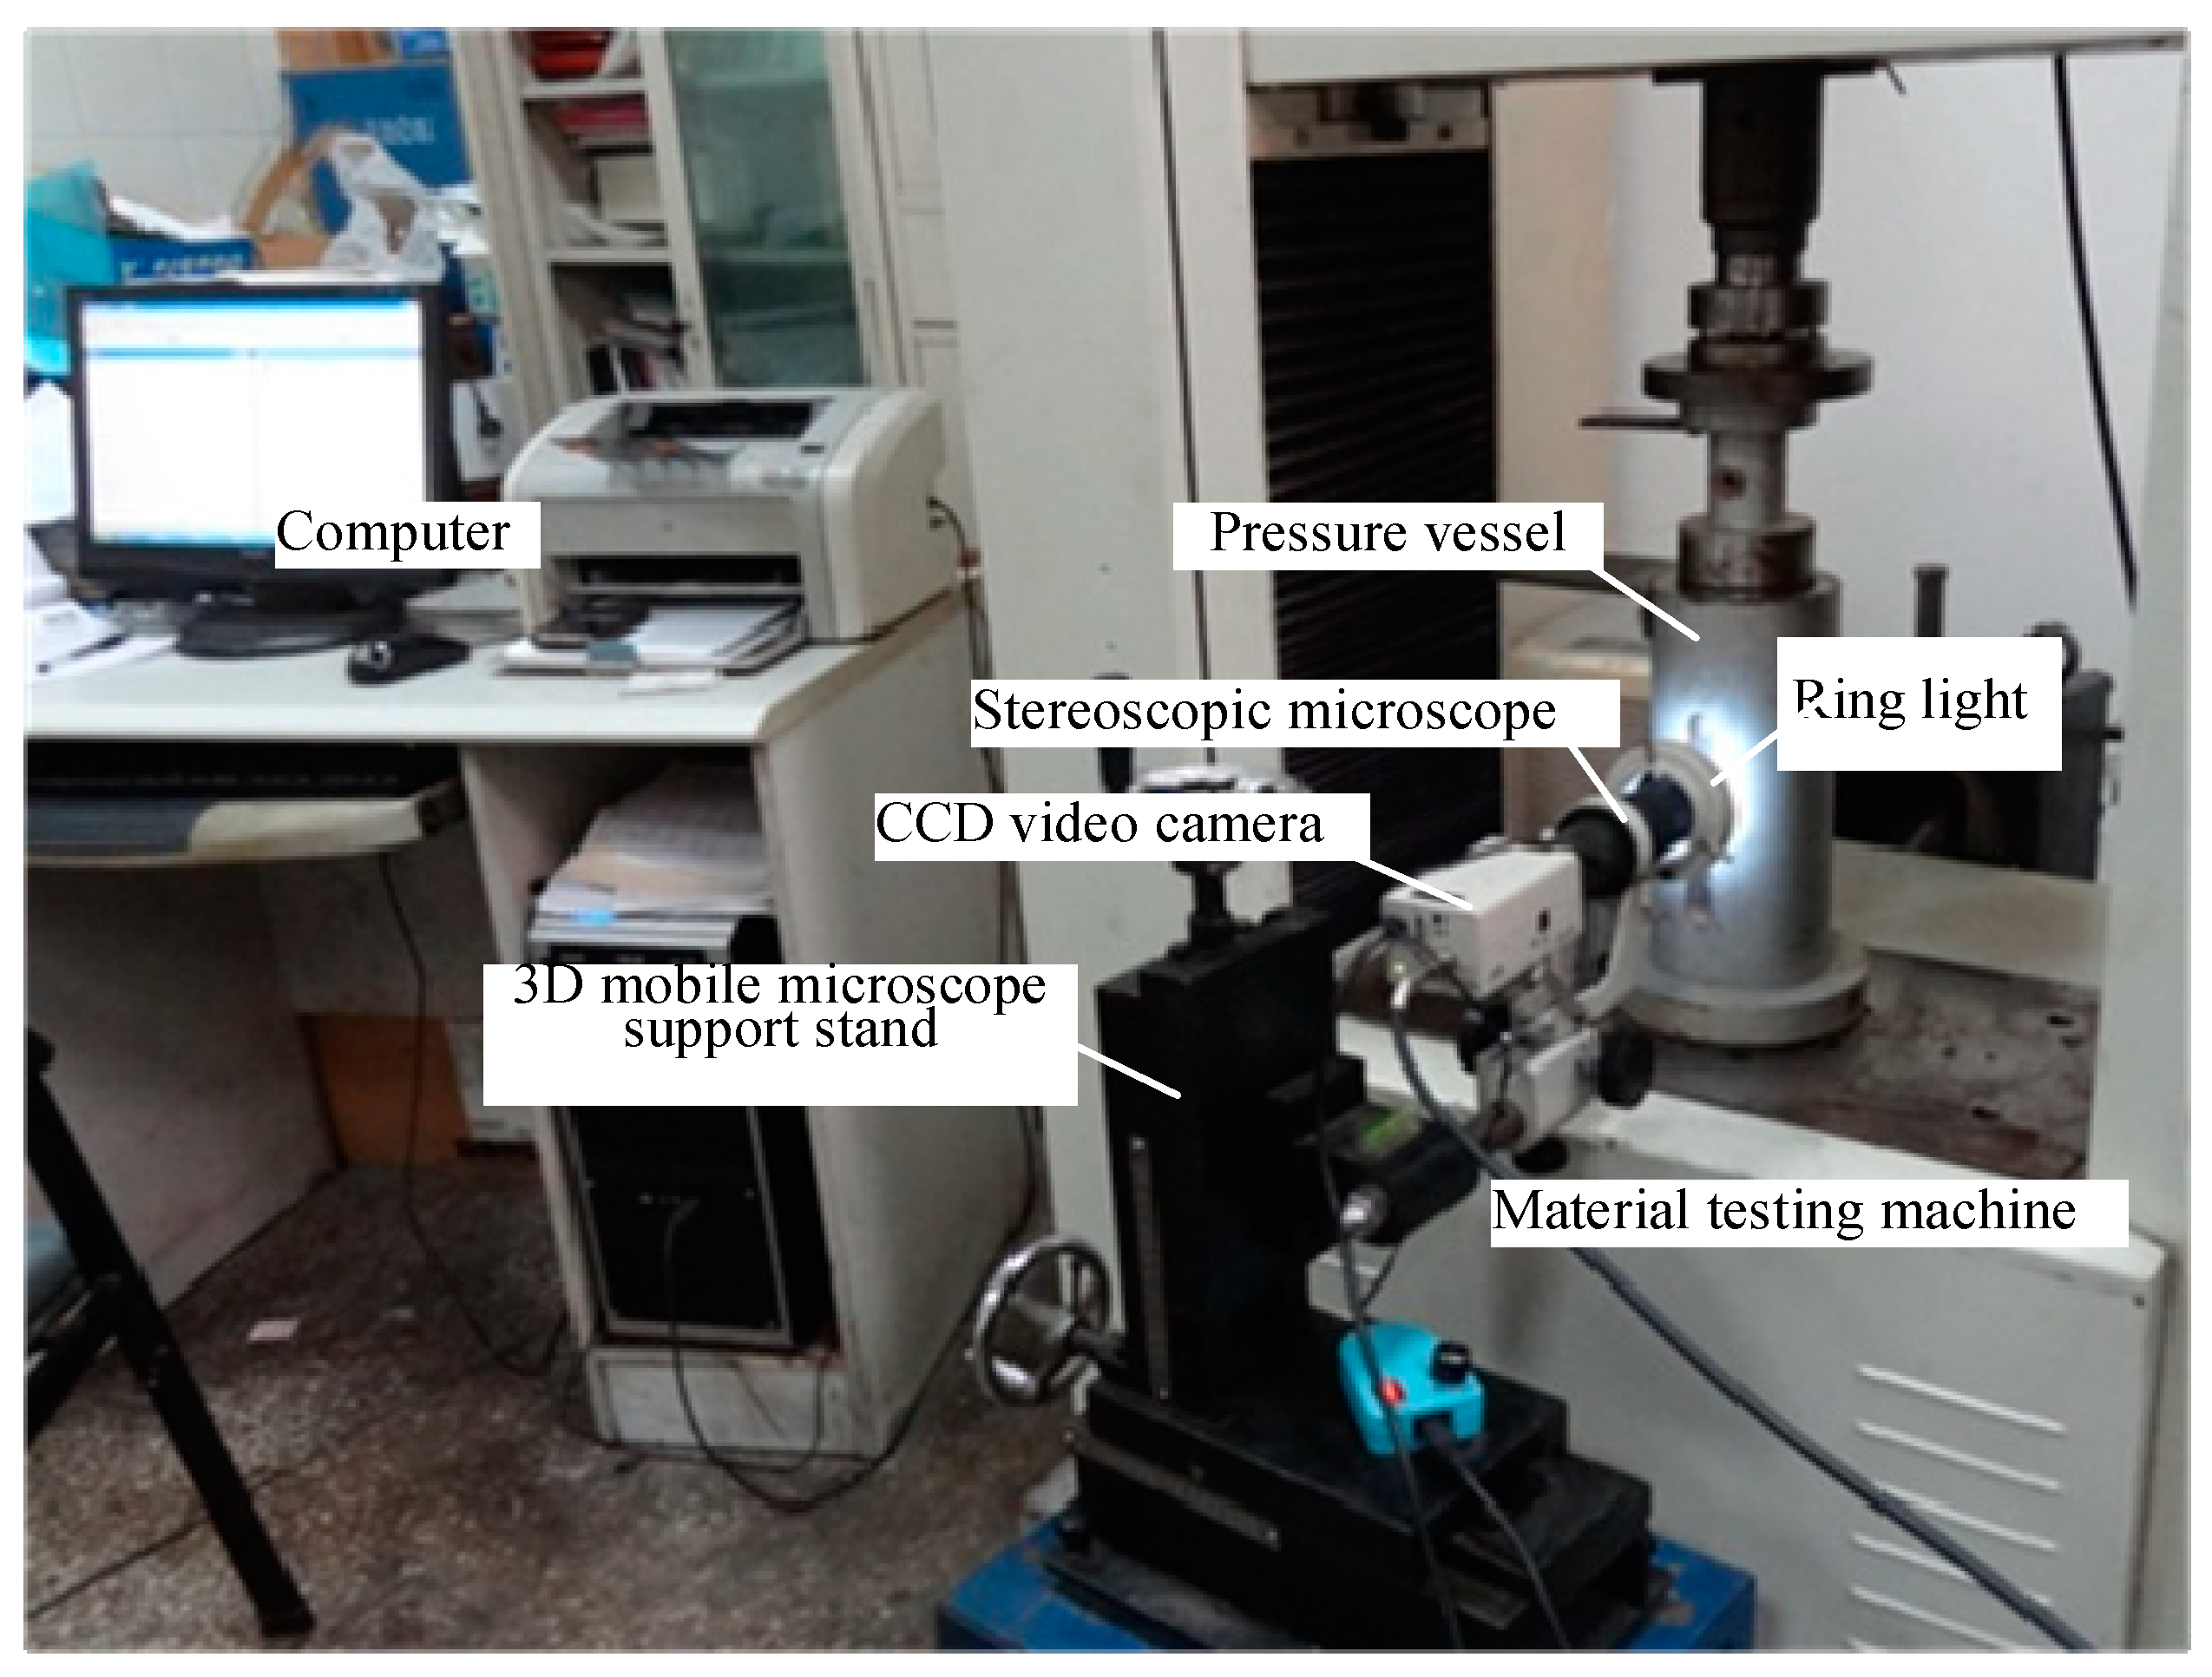
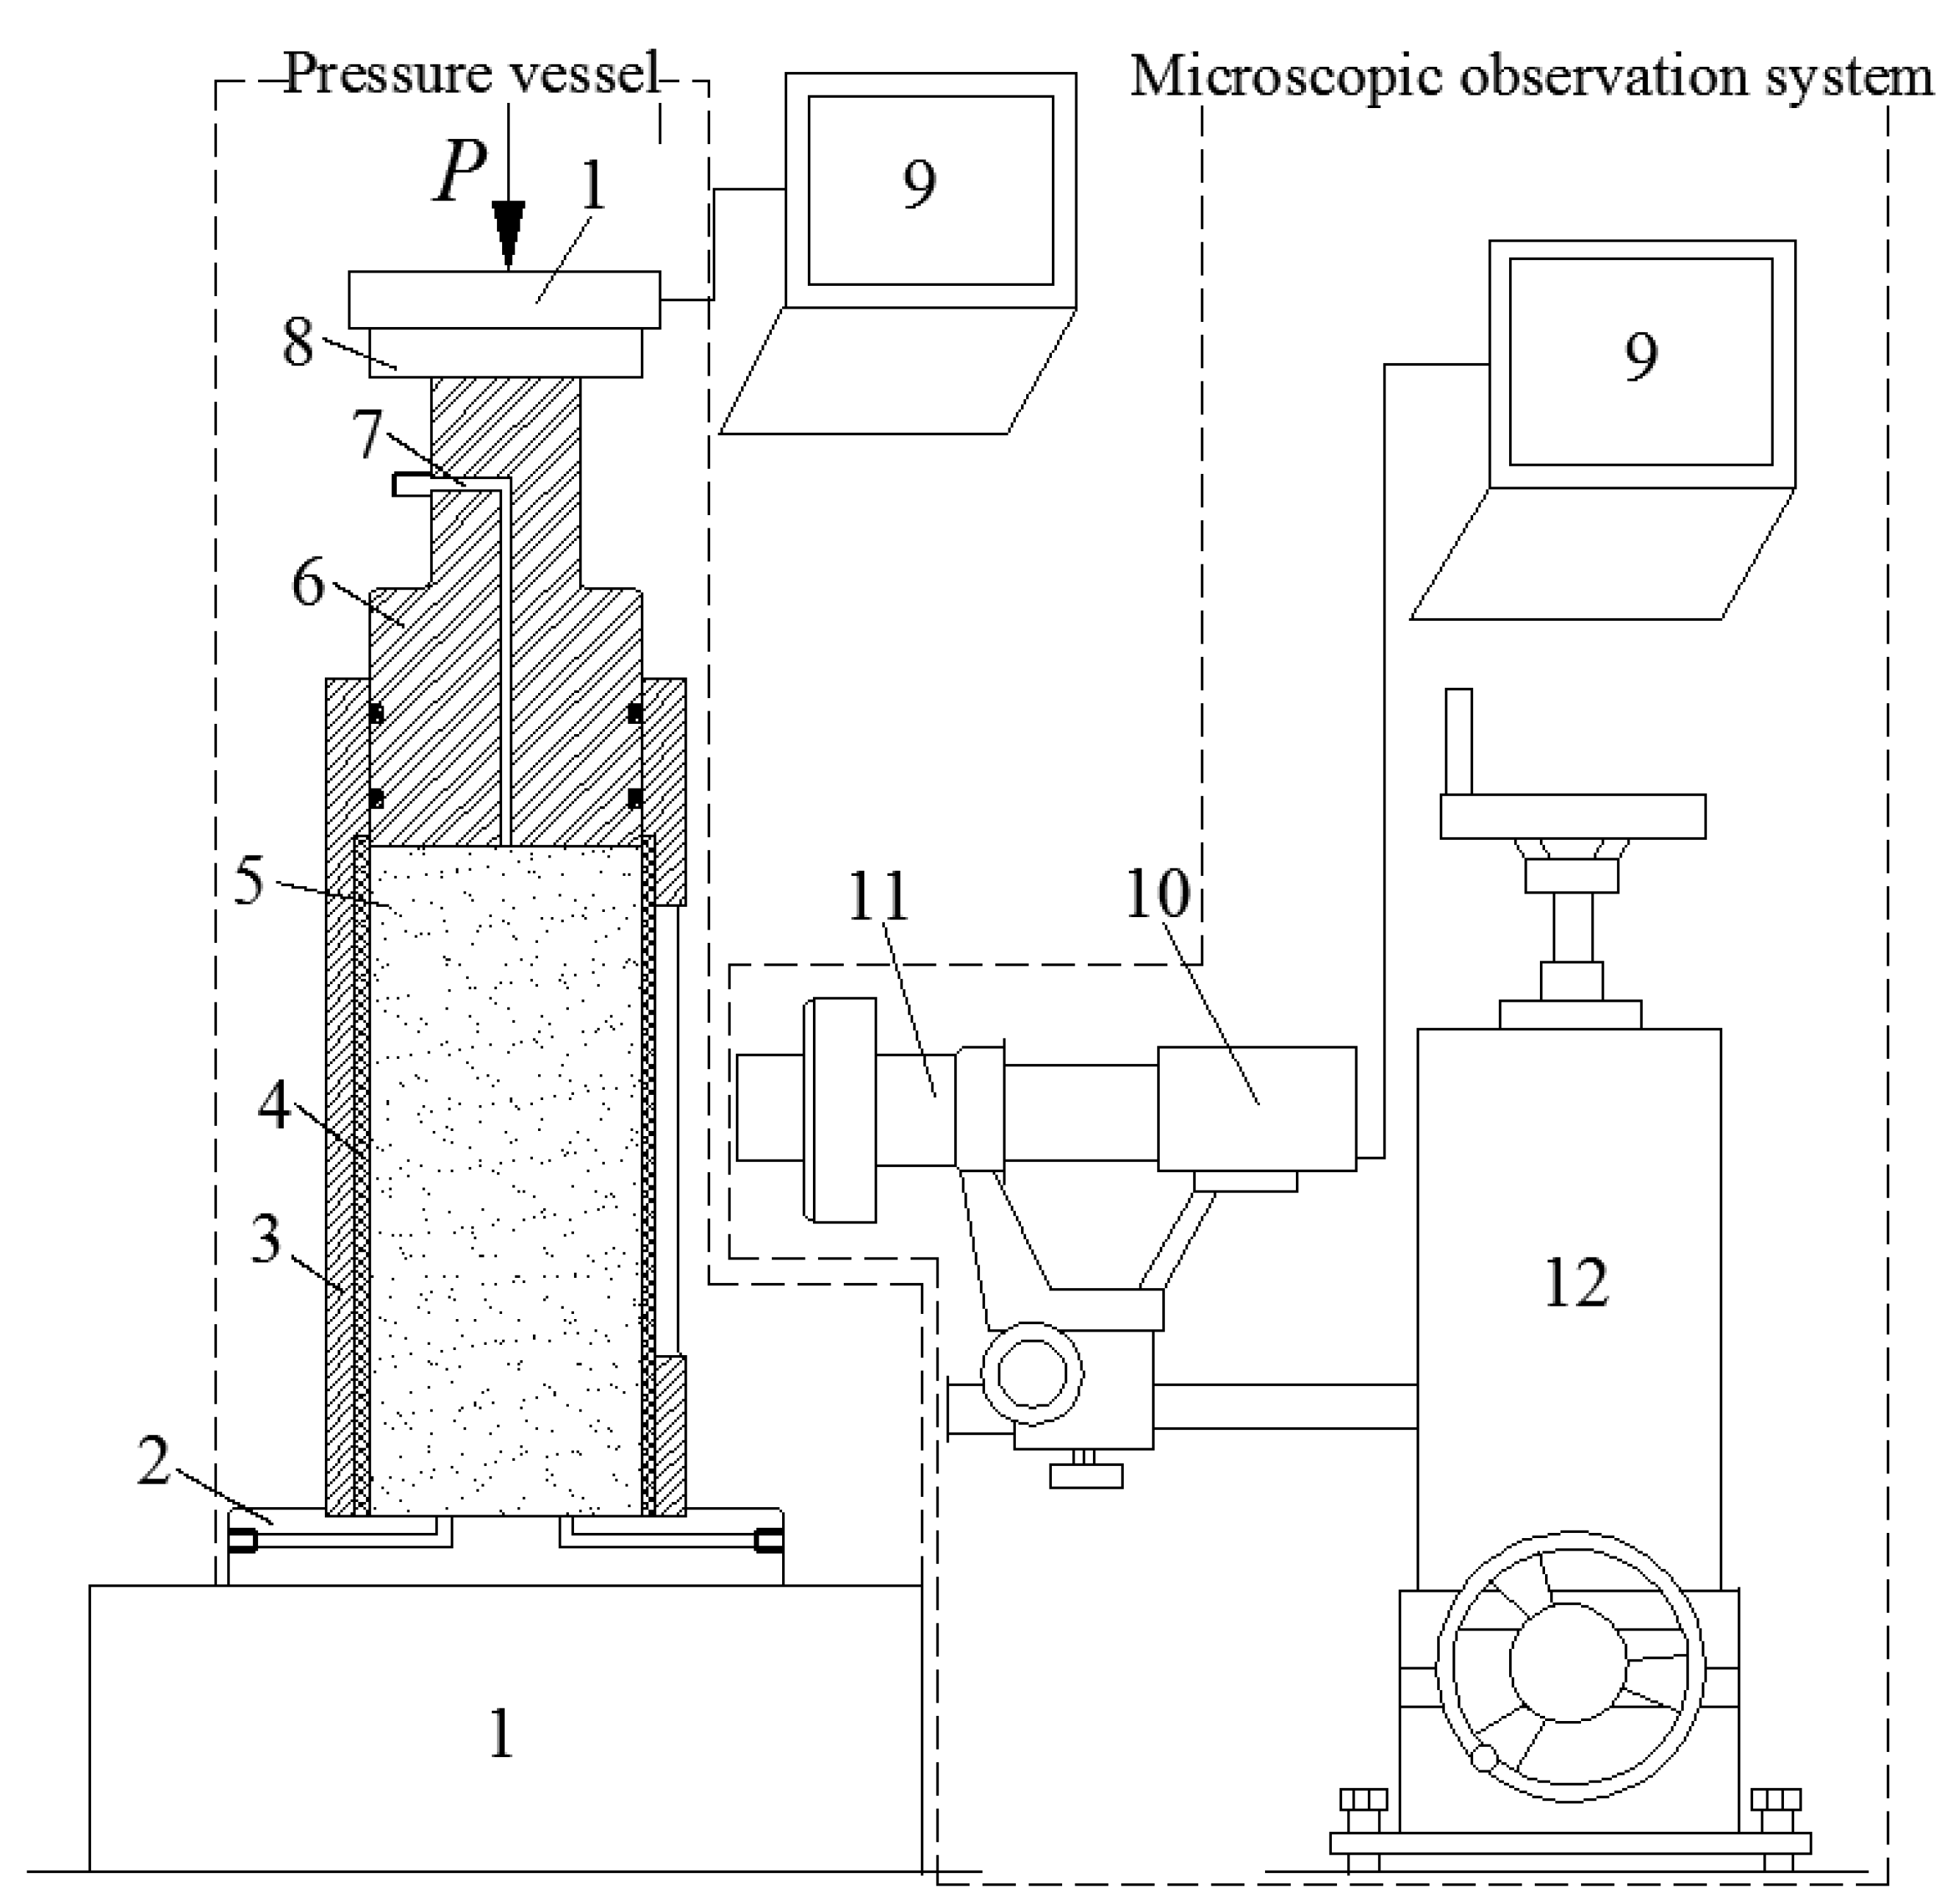
3.1. Equipment

| Material Creep Testing Machine | Pressure Chamber | Soil Pressure Sensor | |||||
|---|---|---|---|---|---|---|---|
| Maximum load/kN | Sensitivity/N | Load proportion | Pressure head maximum stroke/mm | Specimen size/mm × mm | Maximum pressure | Measurement range/kPa | Sensitivity/kPa |
| 30 | 0.1 | 1:250 | 50 | φ 100 × 200 | 2.5 MPa | 100–1500 | 10 |
| Microscopic observation system | |||||||
| Total amplifier rate | Field range/mm | Working distance/mm | Microscope regulation range/mm | Vertical bars regulation range /mm | Working face maximum height/mm | ||
| 7~180 | 30.77~4.44 | 100 | 43 | 80 | 120 | ||
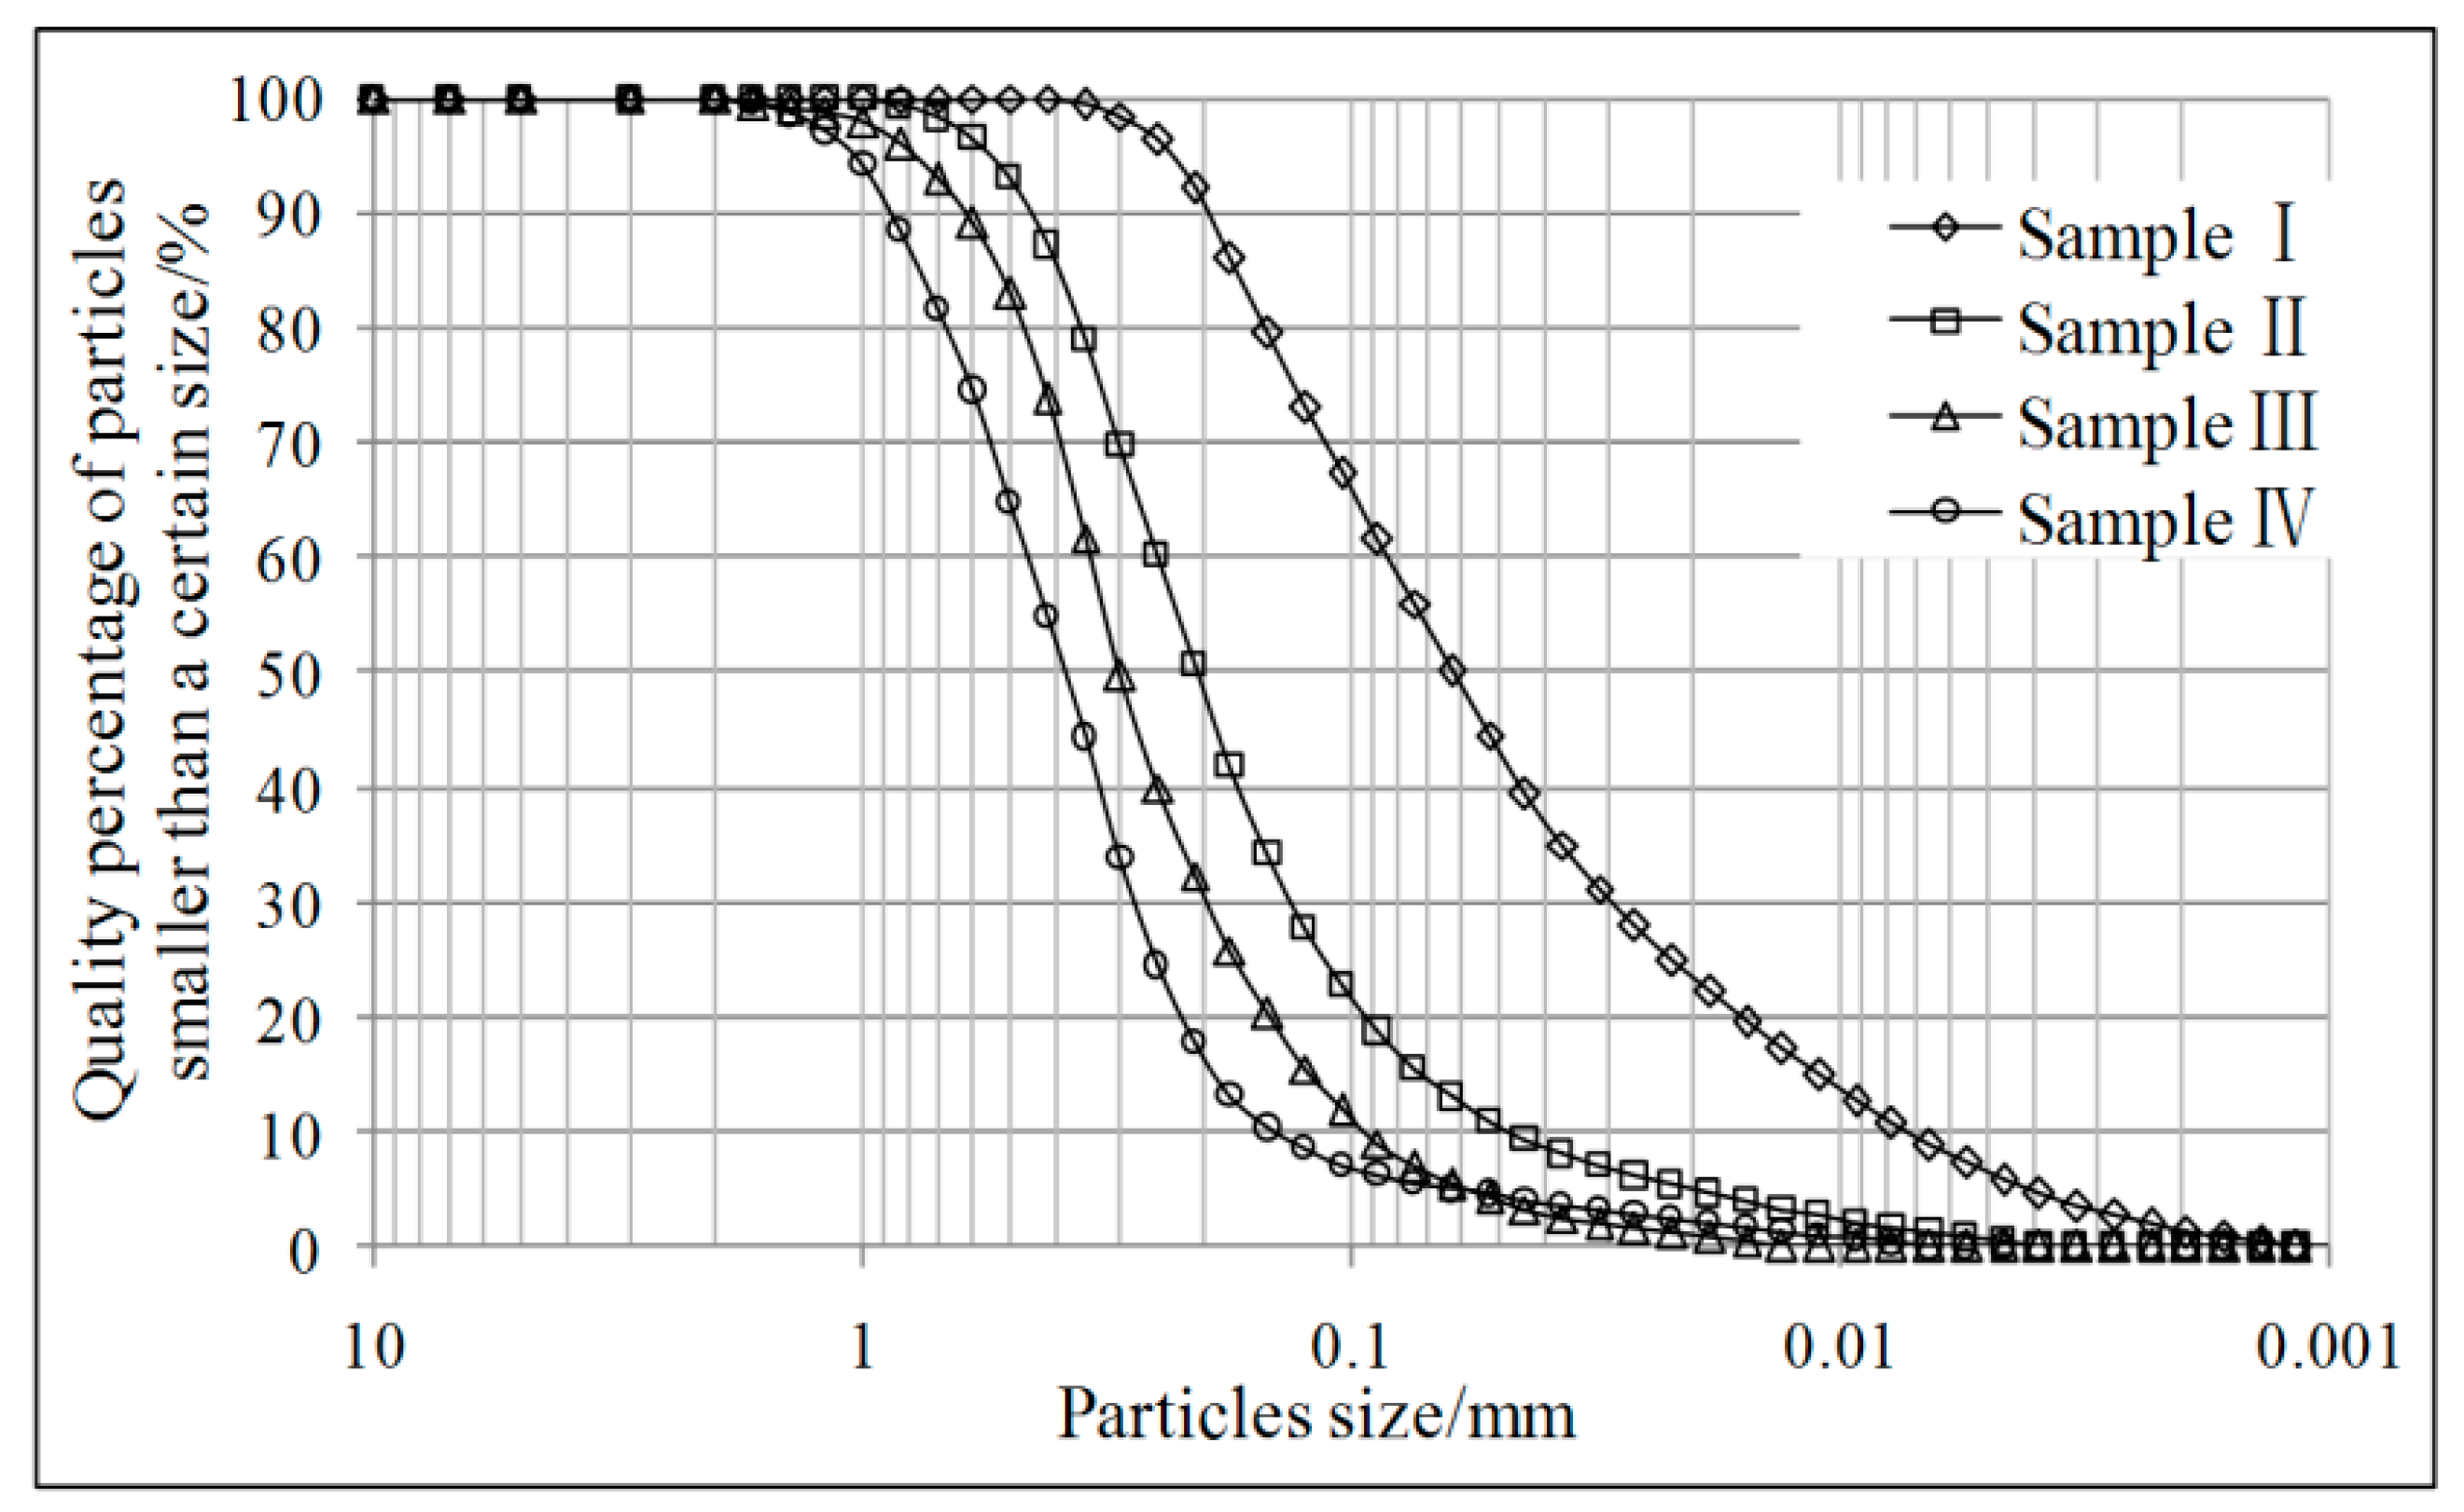
3.2. Materials

| Sample | Effective Diameter (d10)/μm | Median Diameter (d50)/μm | Control Grain Size (d60)/μm | Nonuniform Coefficient (Cu) | Curvature Coefficient (Cc) | Plastic Limit (PL)/% | Liquid Limit (LL)/% | Plastic Index (PI) | Classification |
|---|---|---|---|---|---|---|---|---|---|
| I | 7.29 | 73.59 | 100.4 | 13.77 | 1.58 | 17.4 | 25 | 7.6 | silt |
| II | 47.86 | 231.6 | 284.2 | 5.94 | 1.76 | - | - | - | silty sand |
| III | 94.53 | 361.3 | 435.4 | 4.61 | 1.34 | - | - | - | Medium sized sand |
| IV | 144.4 | 385.8 | 457.4 | 3.17 | 1.17 | - | - | - | Medium sized sand |
| Property | Results |
|---|---|
| pH a | 7.19 |
| Analyzed by XRF | Unit = mg/kg |
| Oxygen | 411,928.2 |
| Fluorine | 3,165.5 |
| Phosphorus | 531.4 |
| Sulfur | 5,496.2 |
| Titanium | 3,163.8 |
| Copper | 5,642.4 |
| Zinc | 218.5 |
| Arsenic | 1,940.6 |
| Rubidium | 282.9 |
| Strontium | 258.1 |
| Stibium | 567.4 |
| Barium | 109.4 |
| Lead | 177.2 |
| Bismuth | 139.1 |
| Stannum | 2,805.2 |
| Silicon | 132,678 |
| Aluminum | 18,341.7 |
| Iron | 229,218.2 |
| Magnesium | 13,302.9 |
| Calcium | 83,622.22 |
| Natrium | 363.8 |
| Kalium | 7,355.1 |
| Carbon | 6,150 |
| Other component | 72,542.2 |
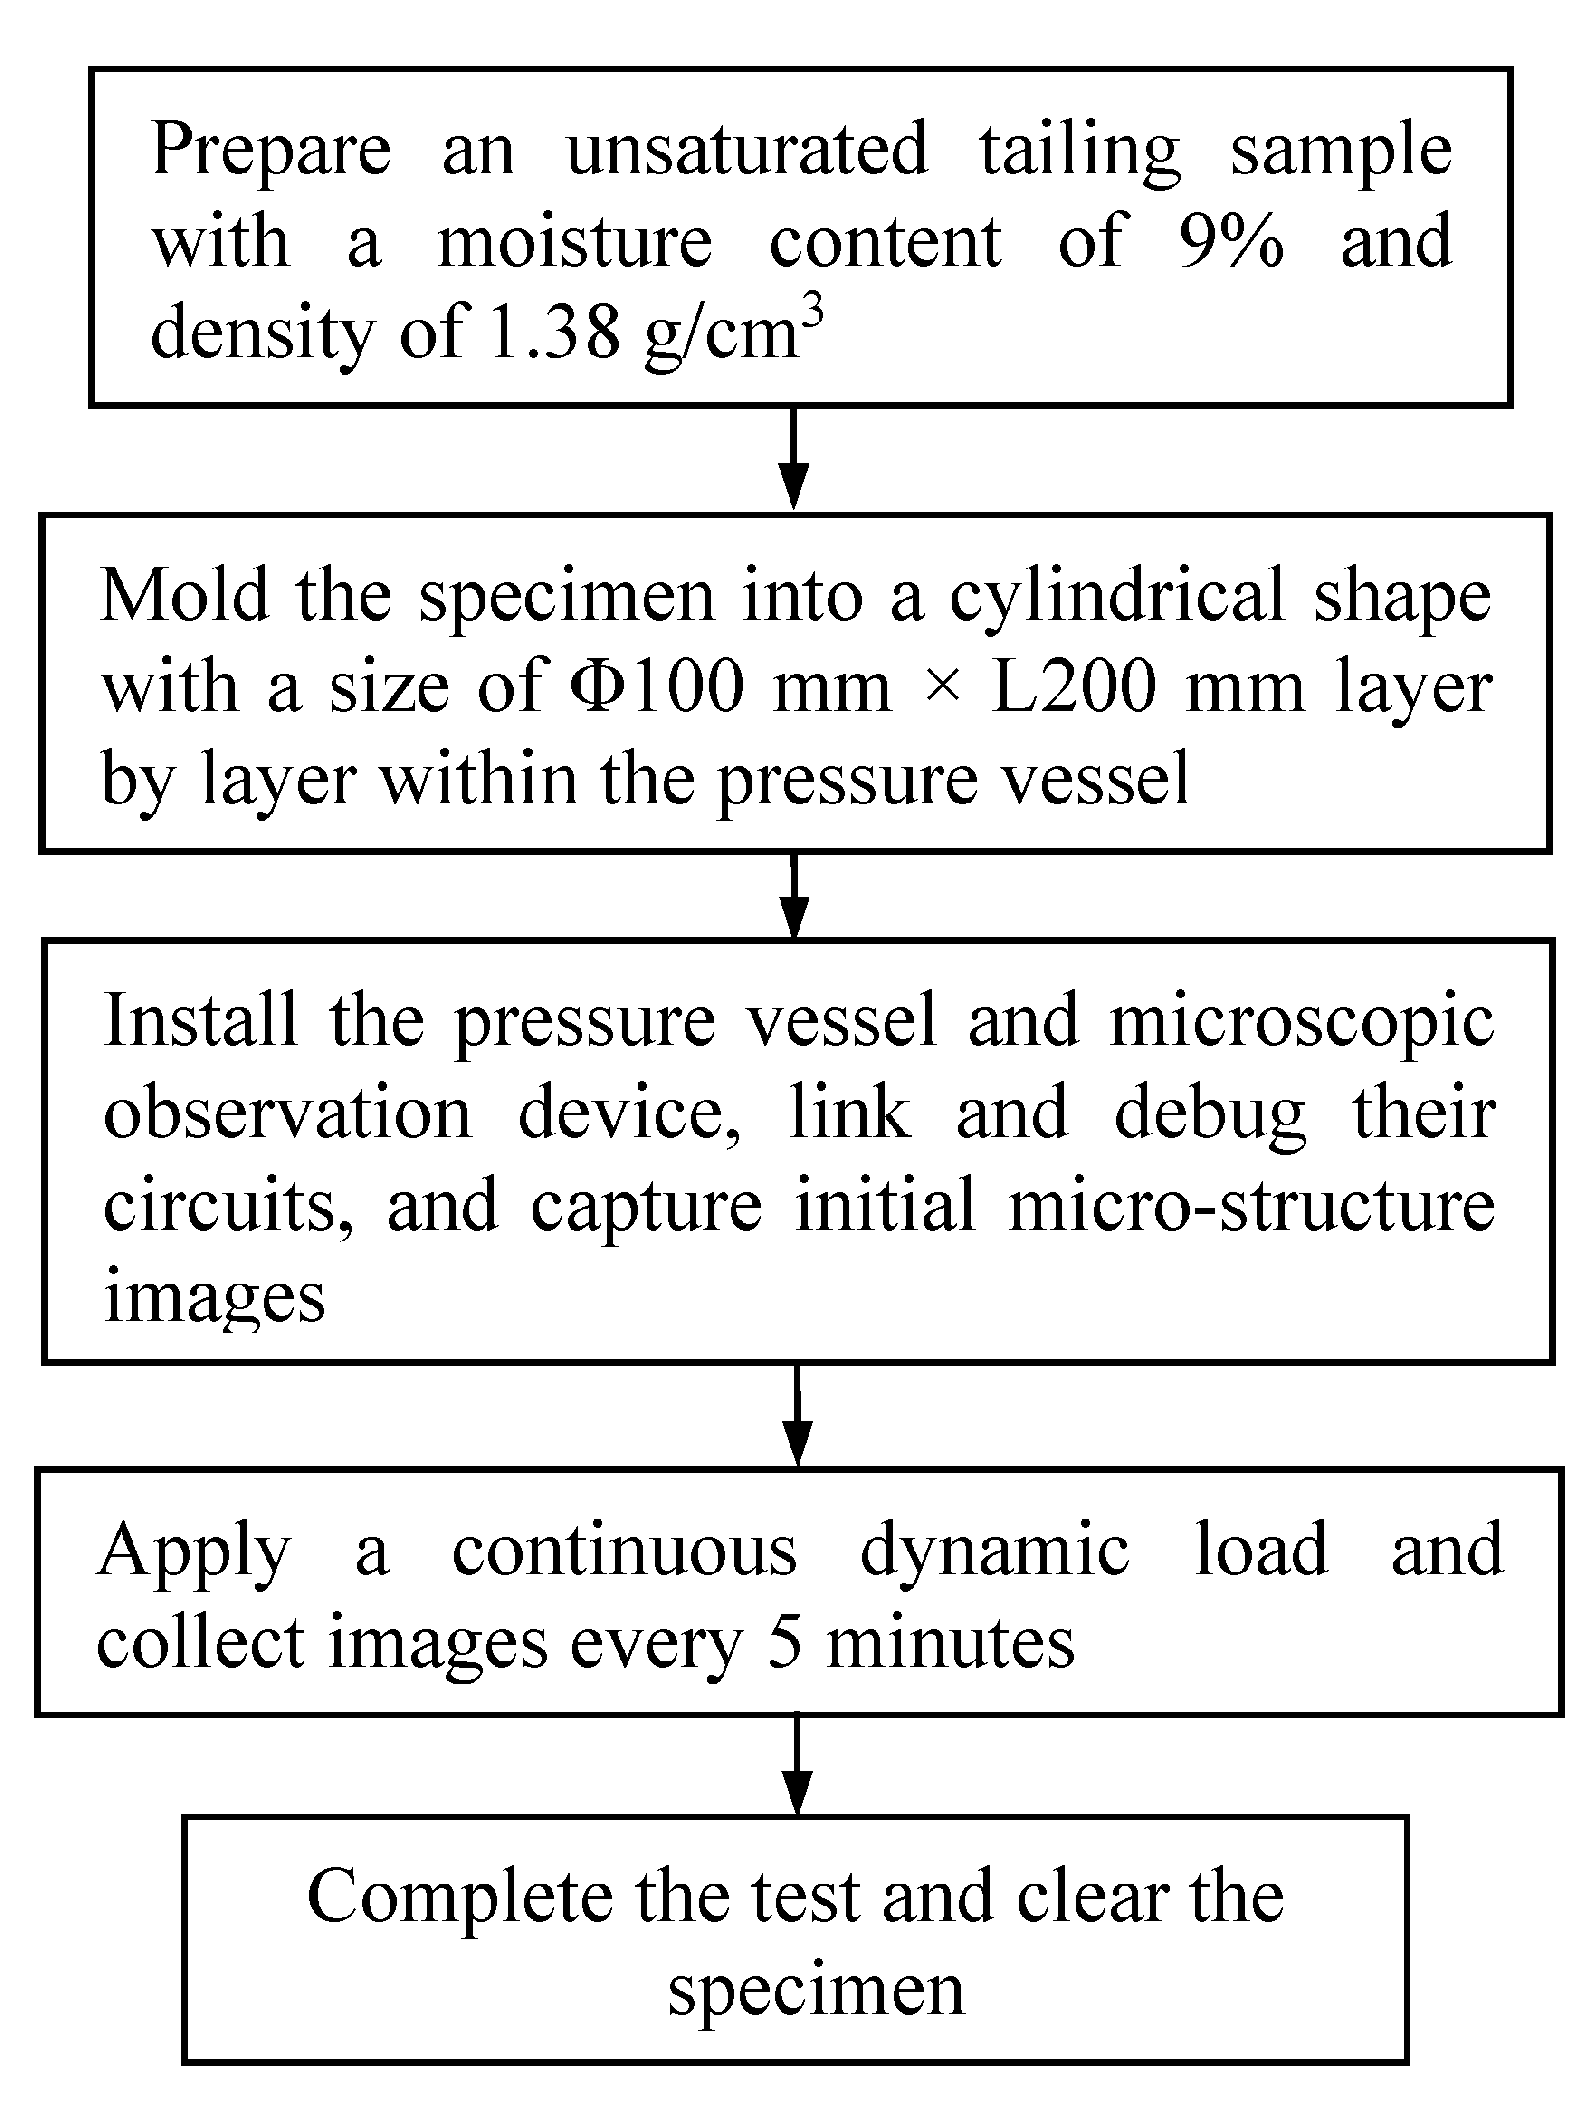
3.3. Measurement

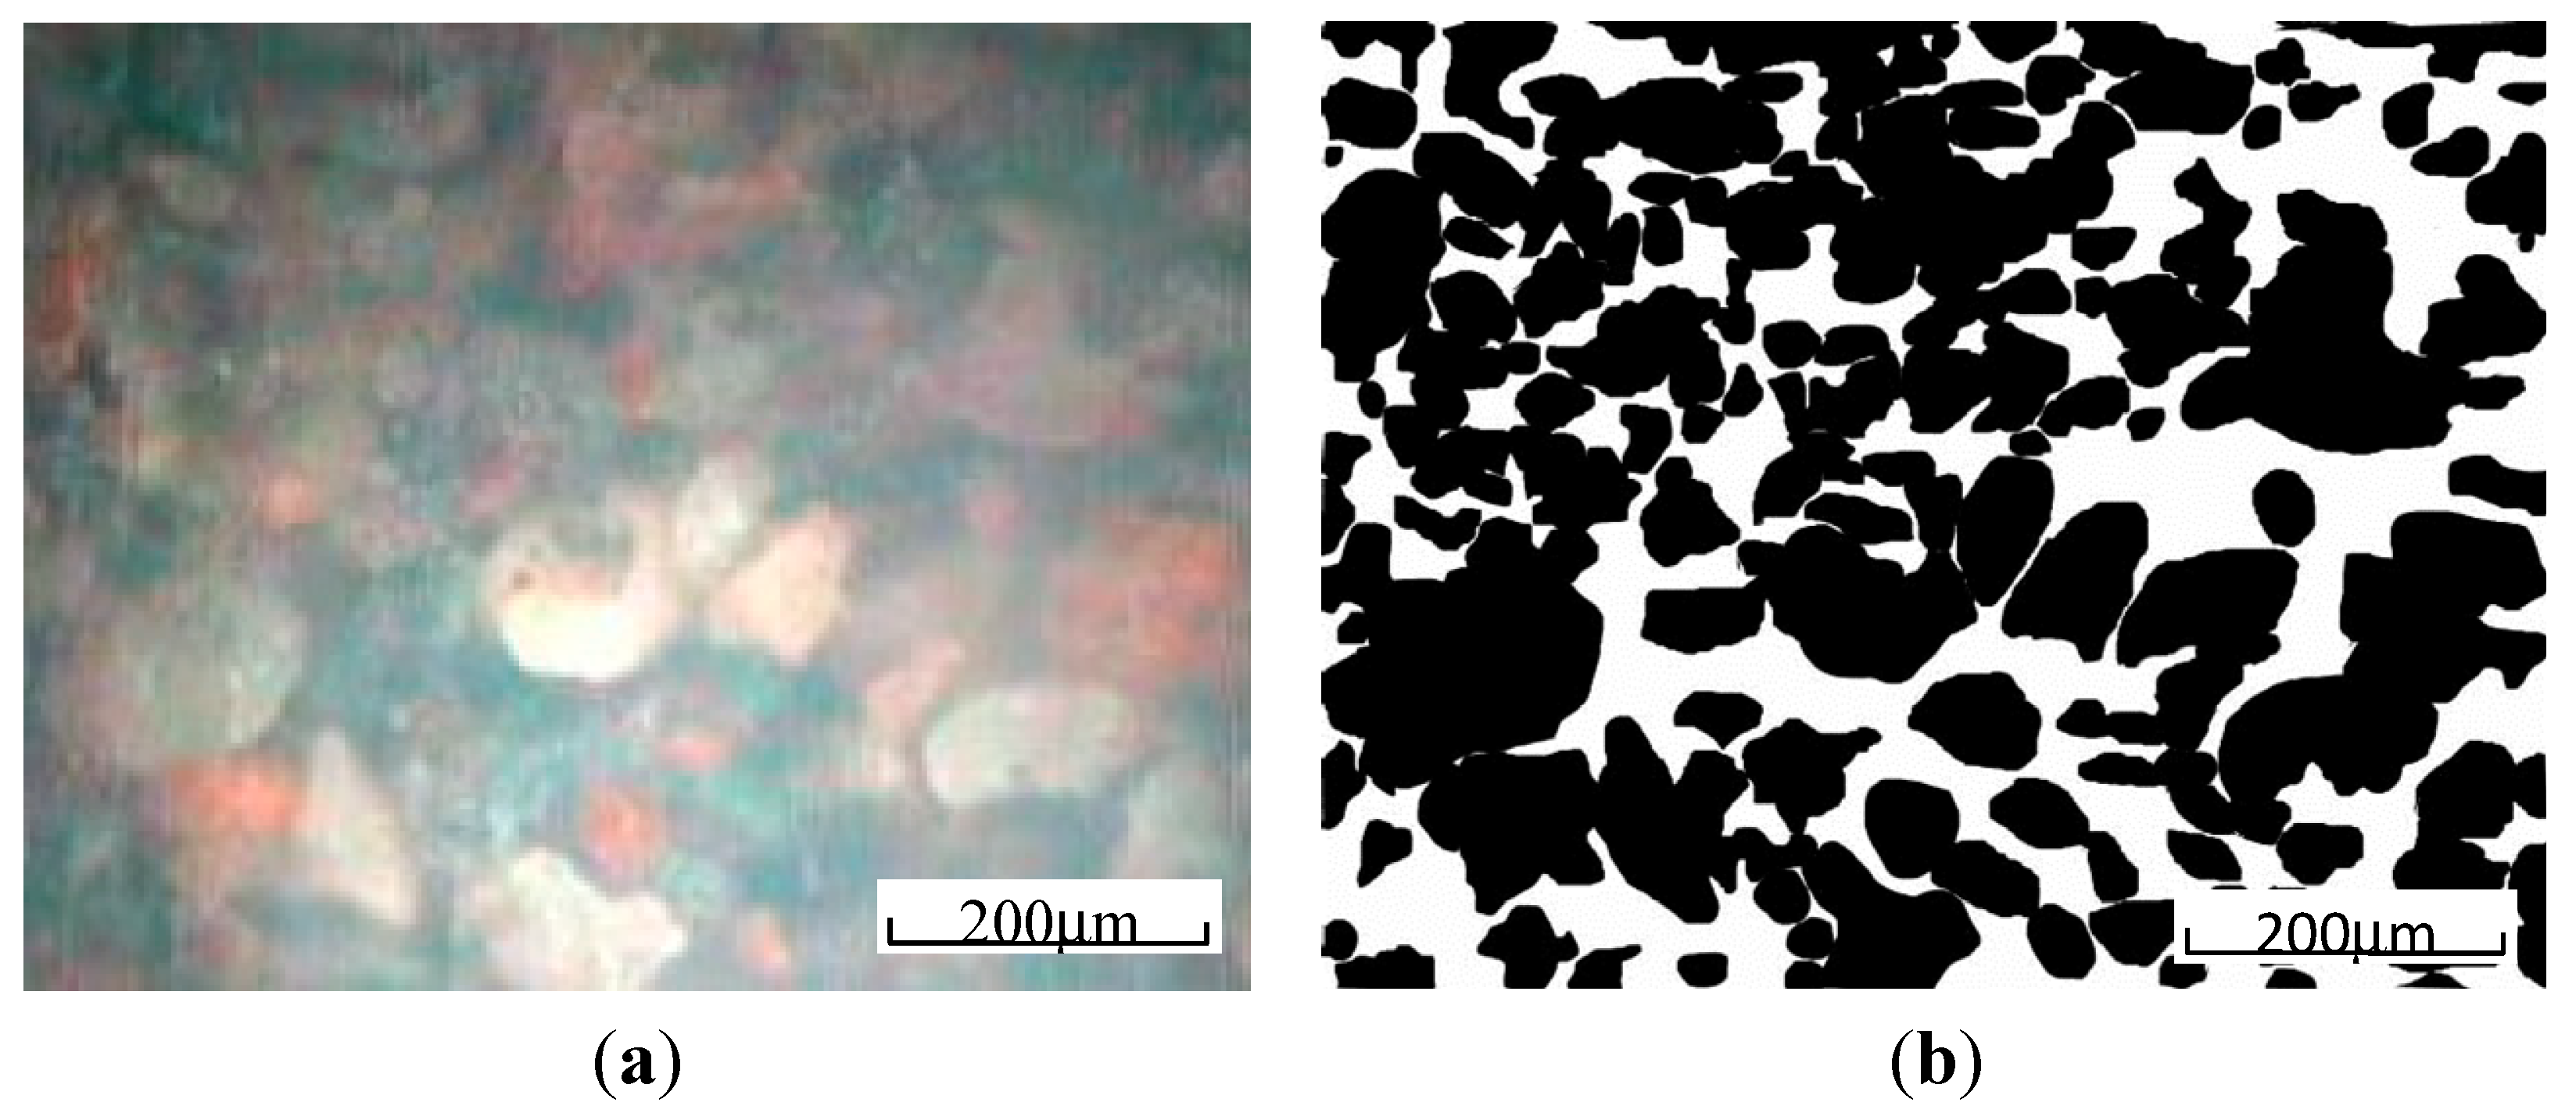
3.4. Obtaining the Eigenvalues of the Images
4. Results
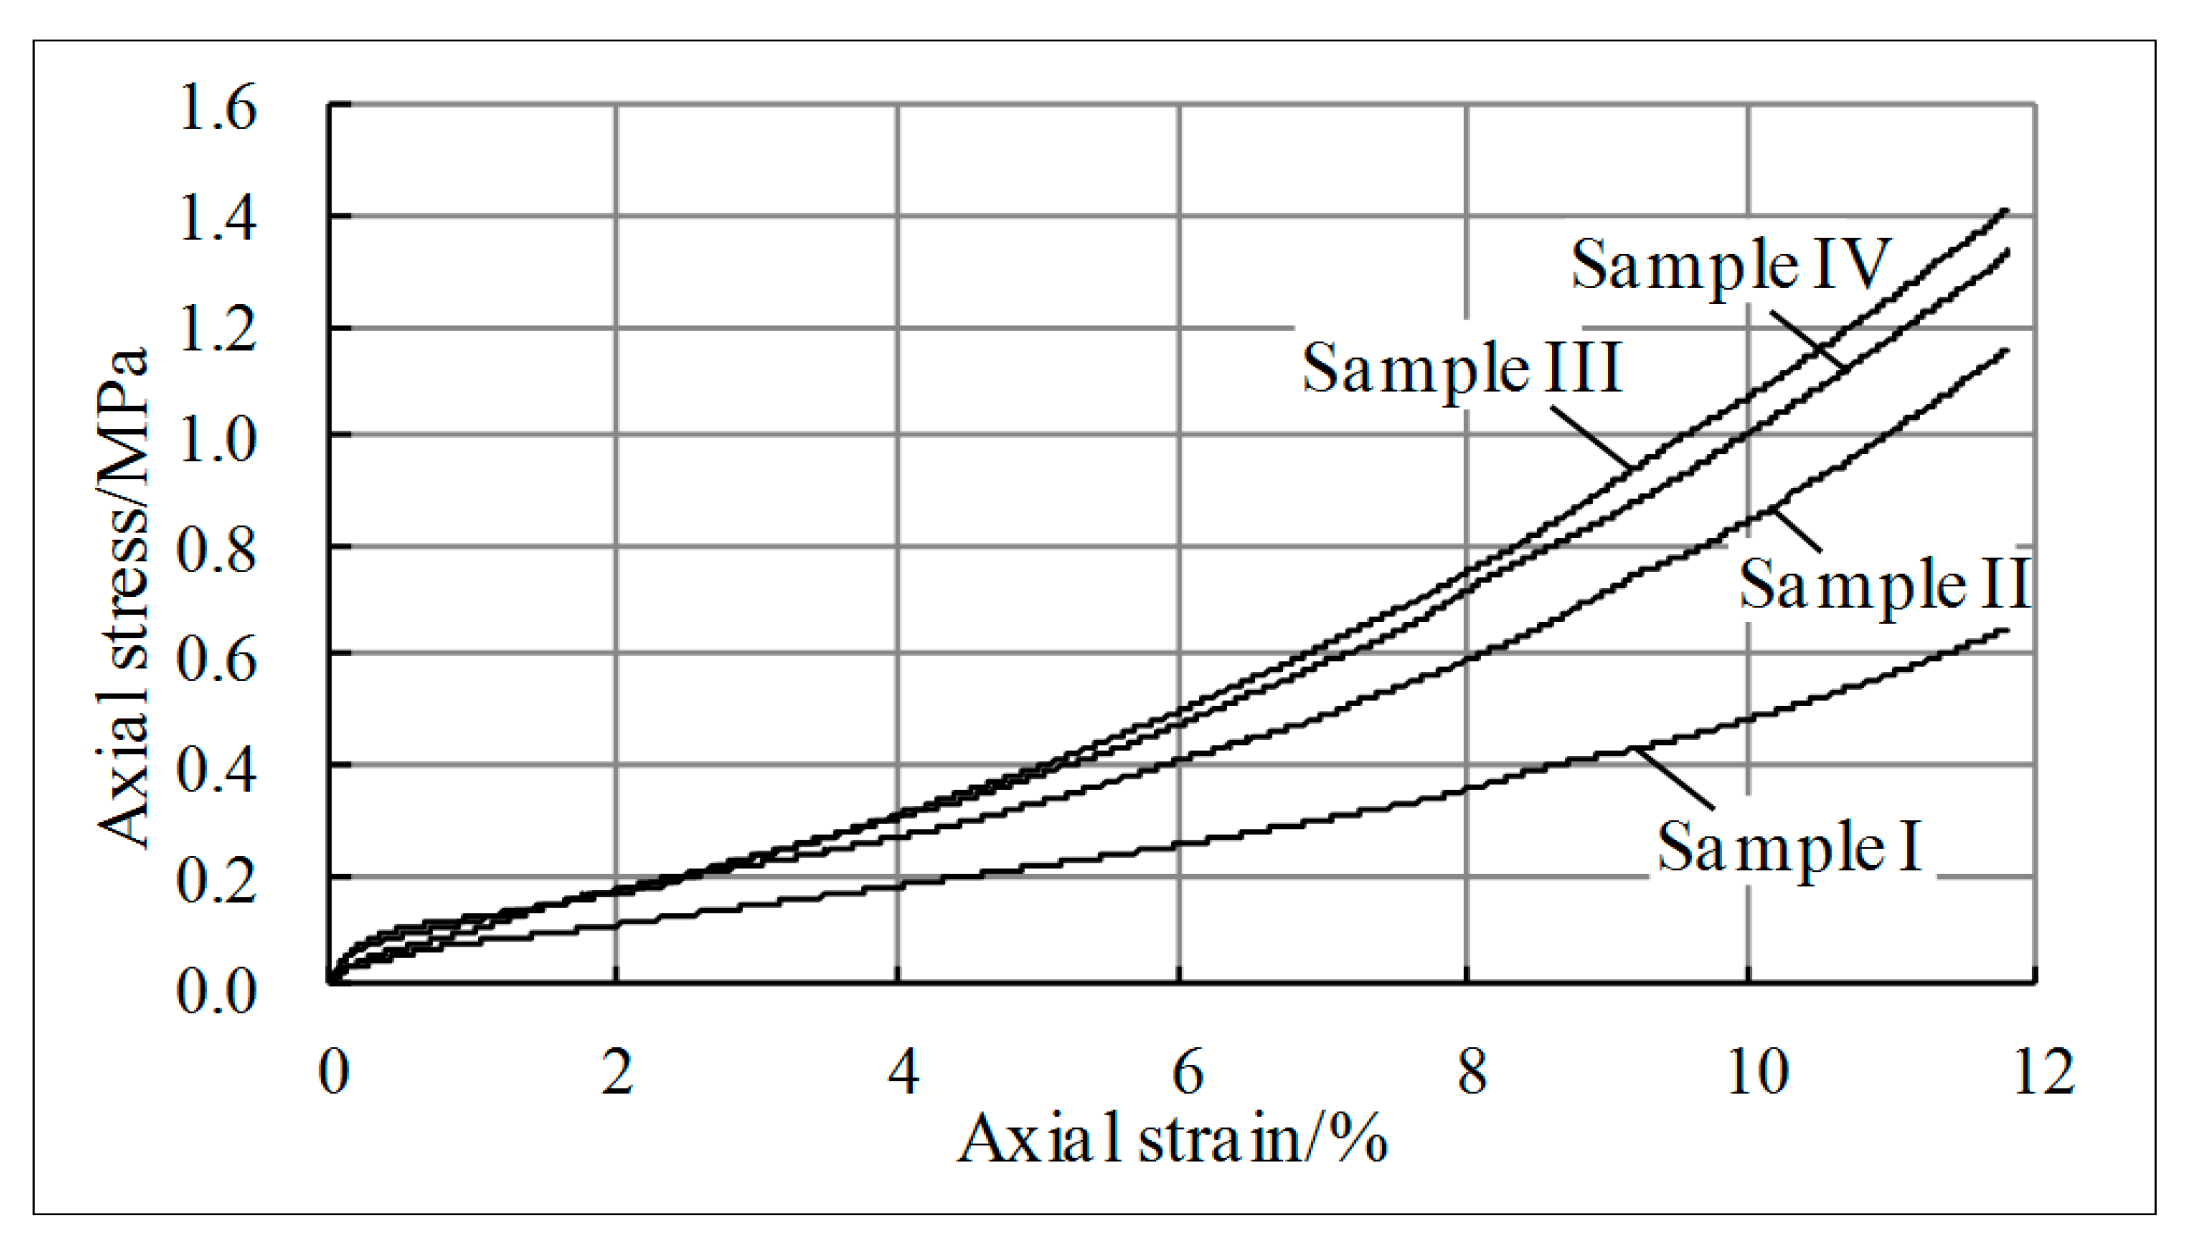
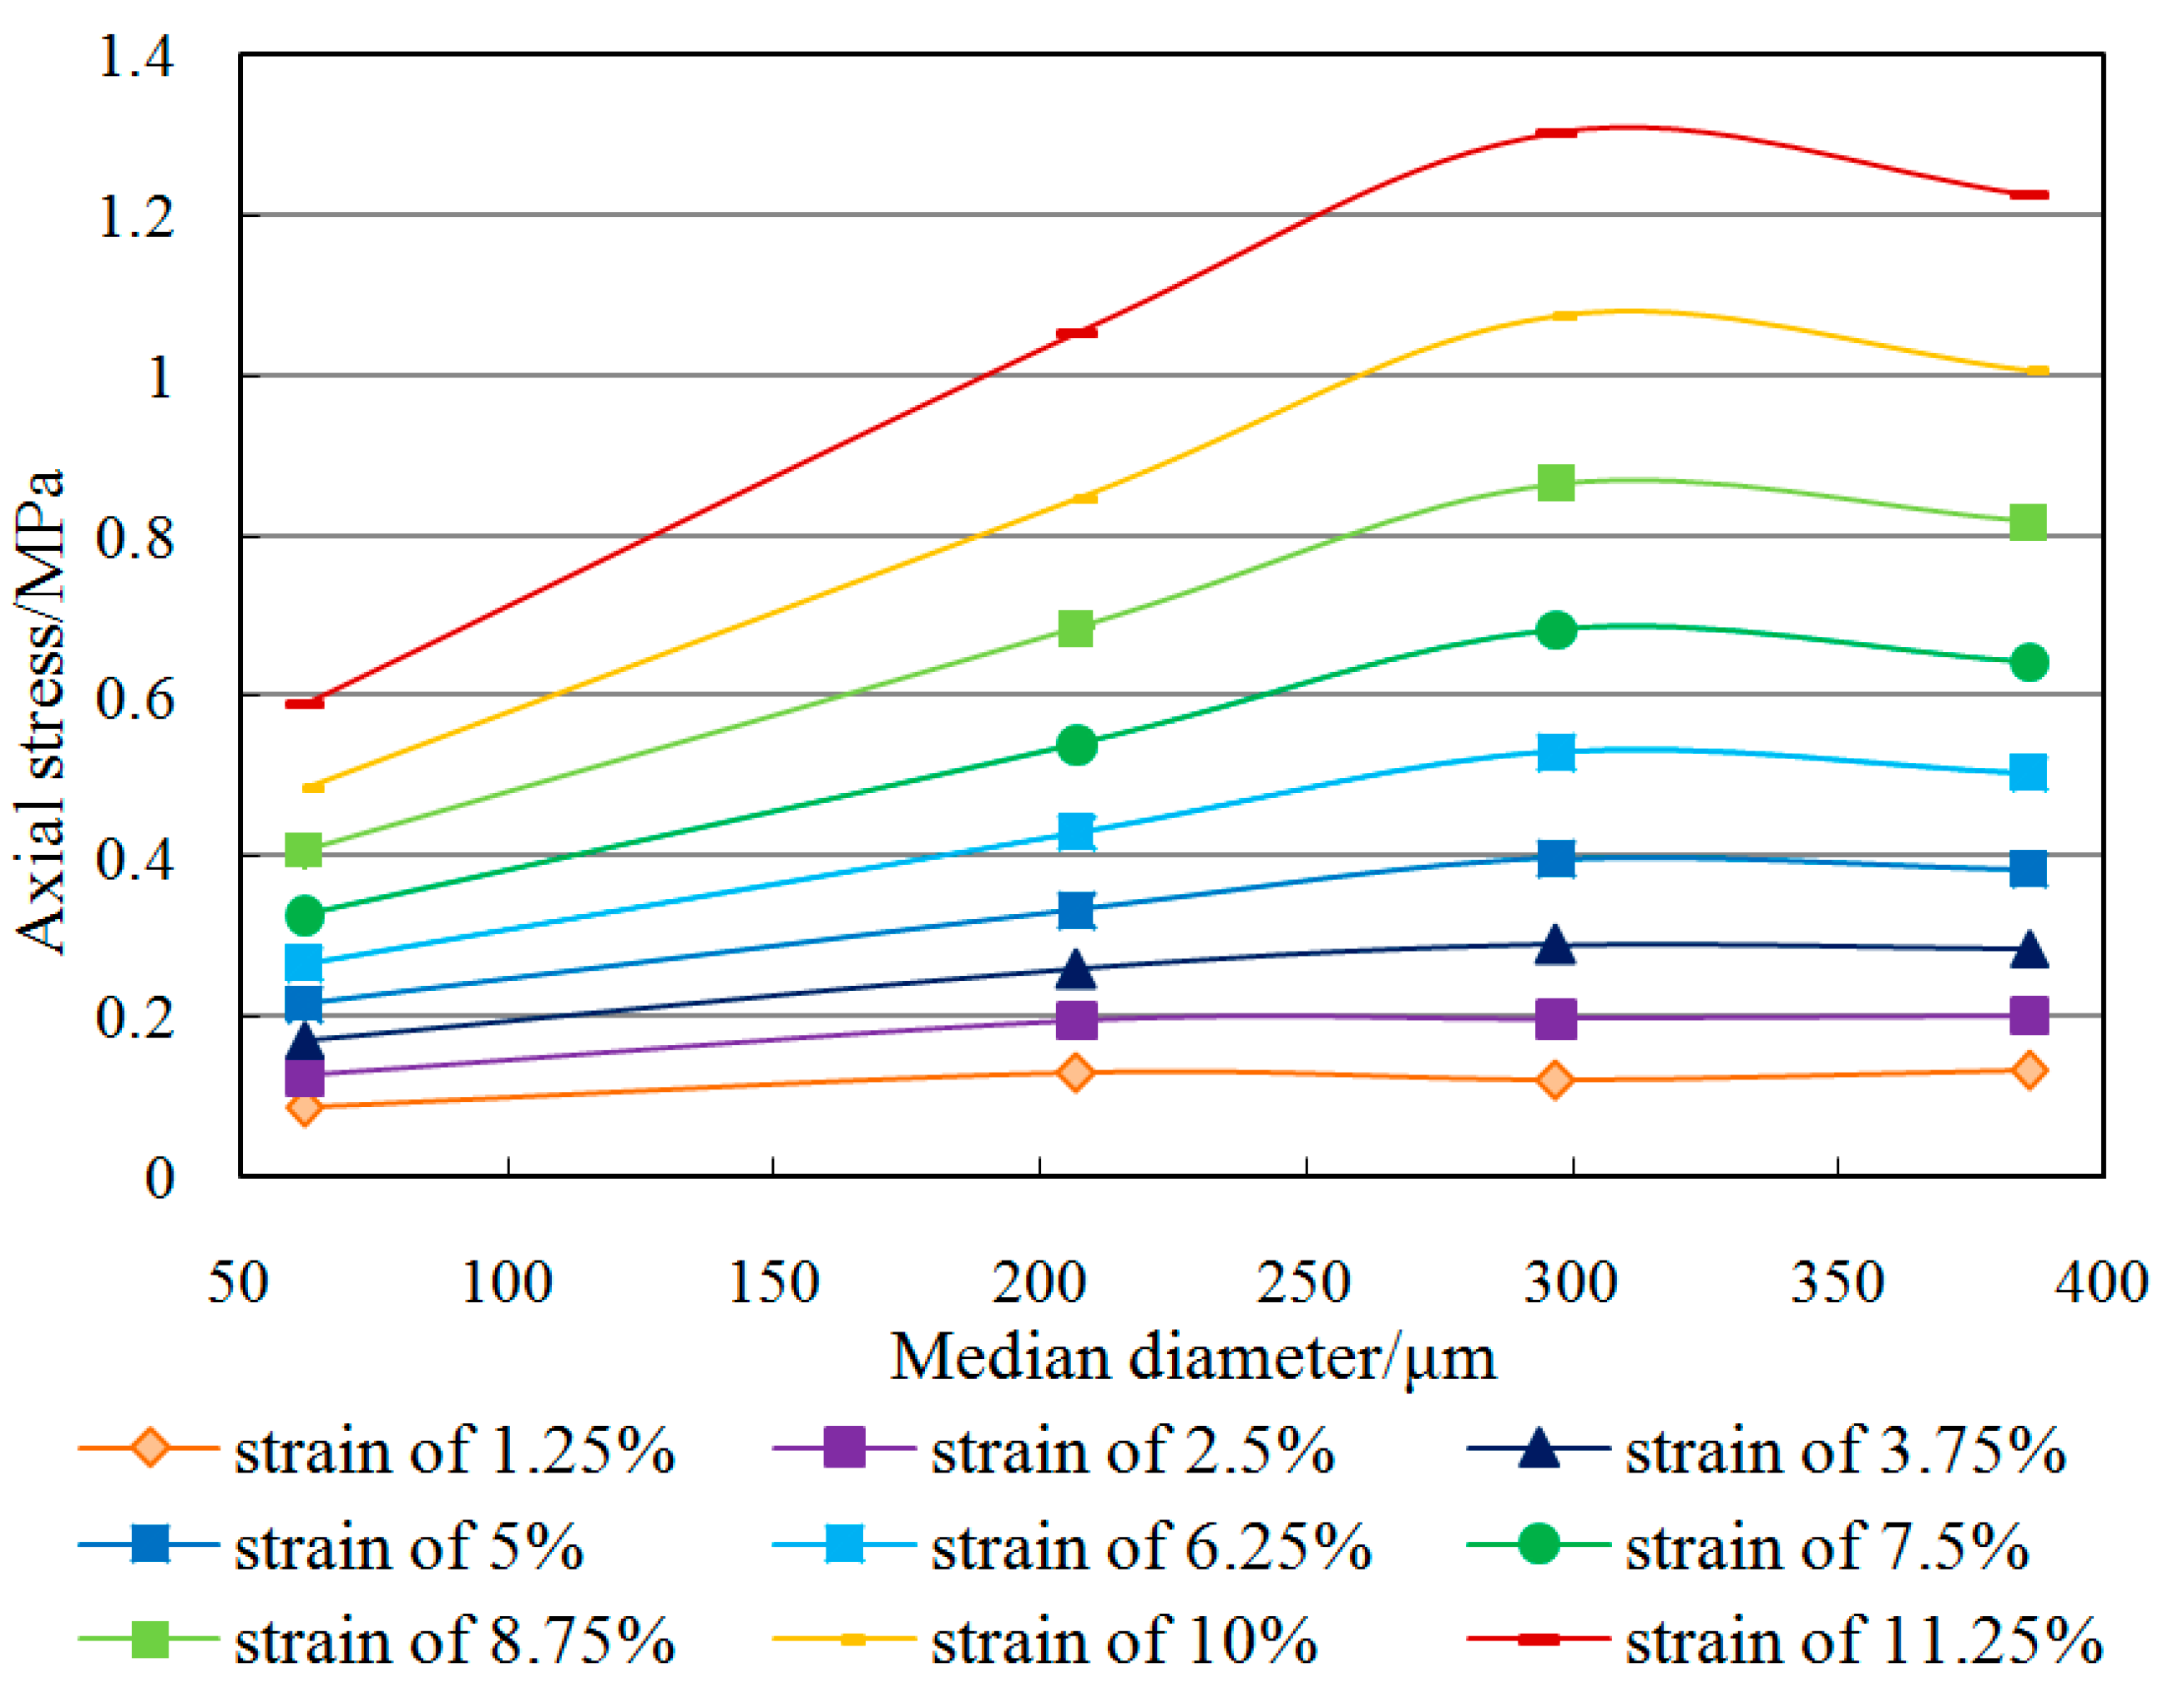
4.1. Loading Capacity of the Tailings


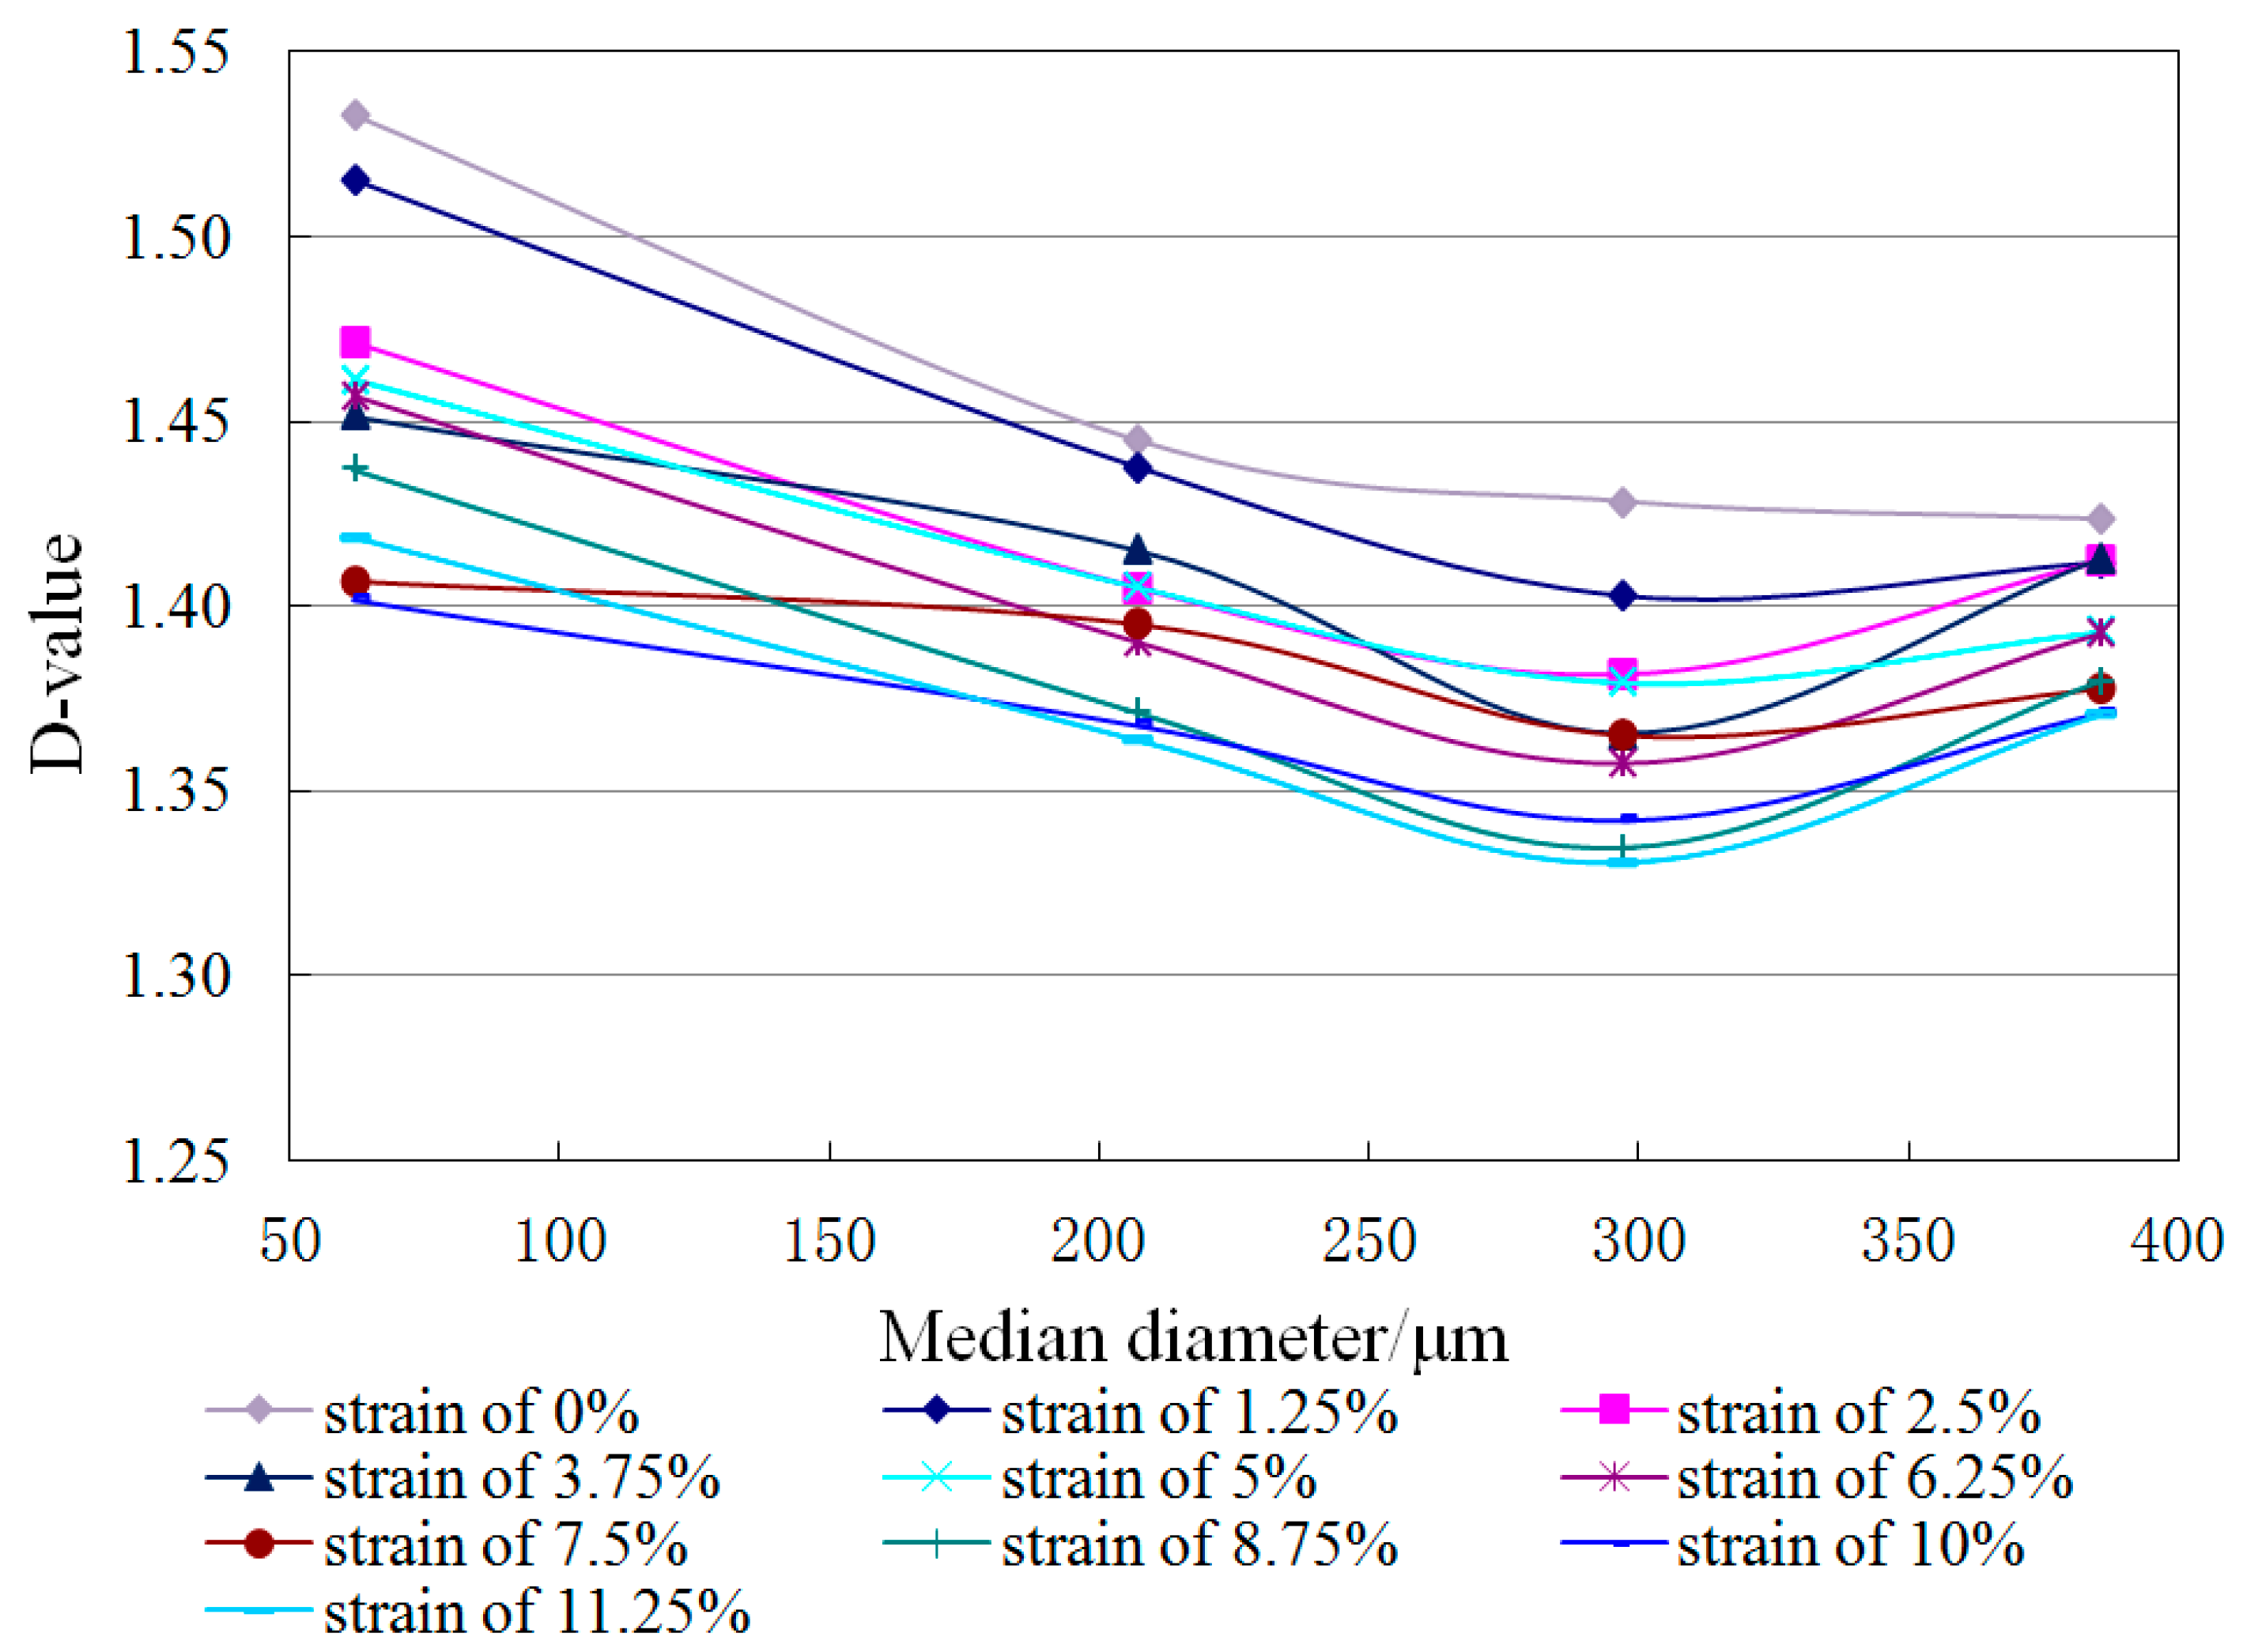
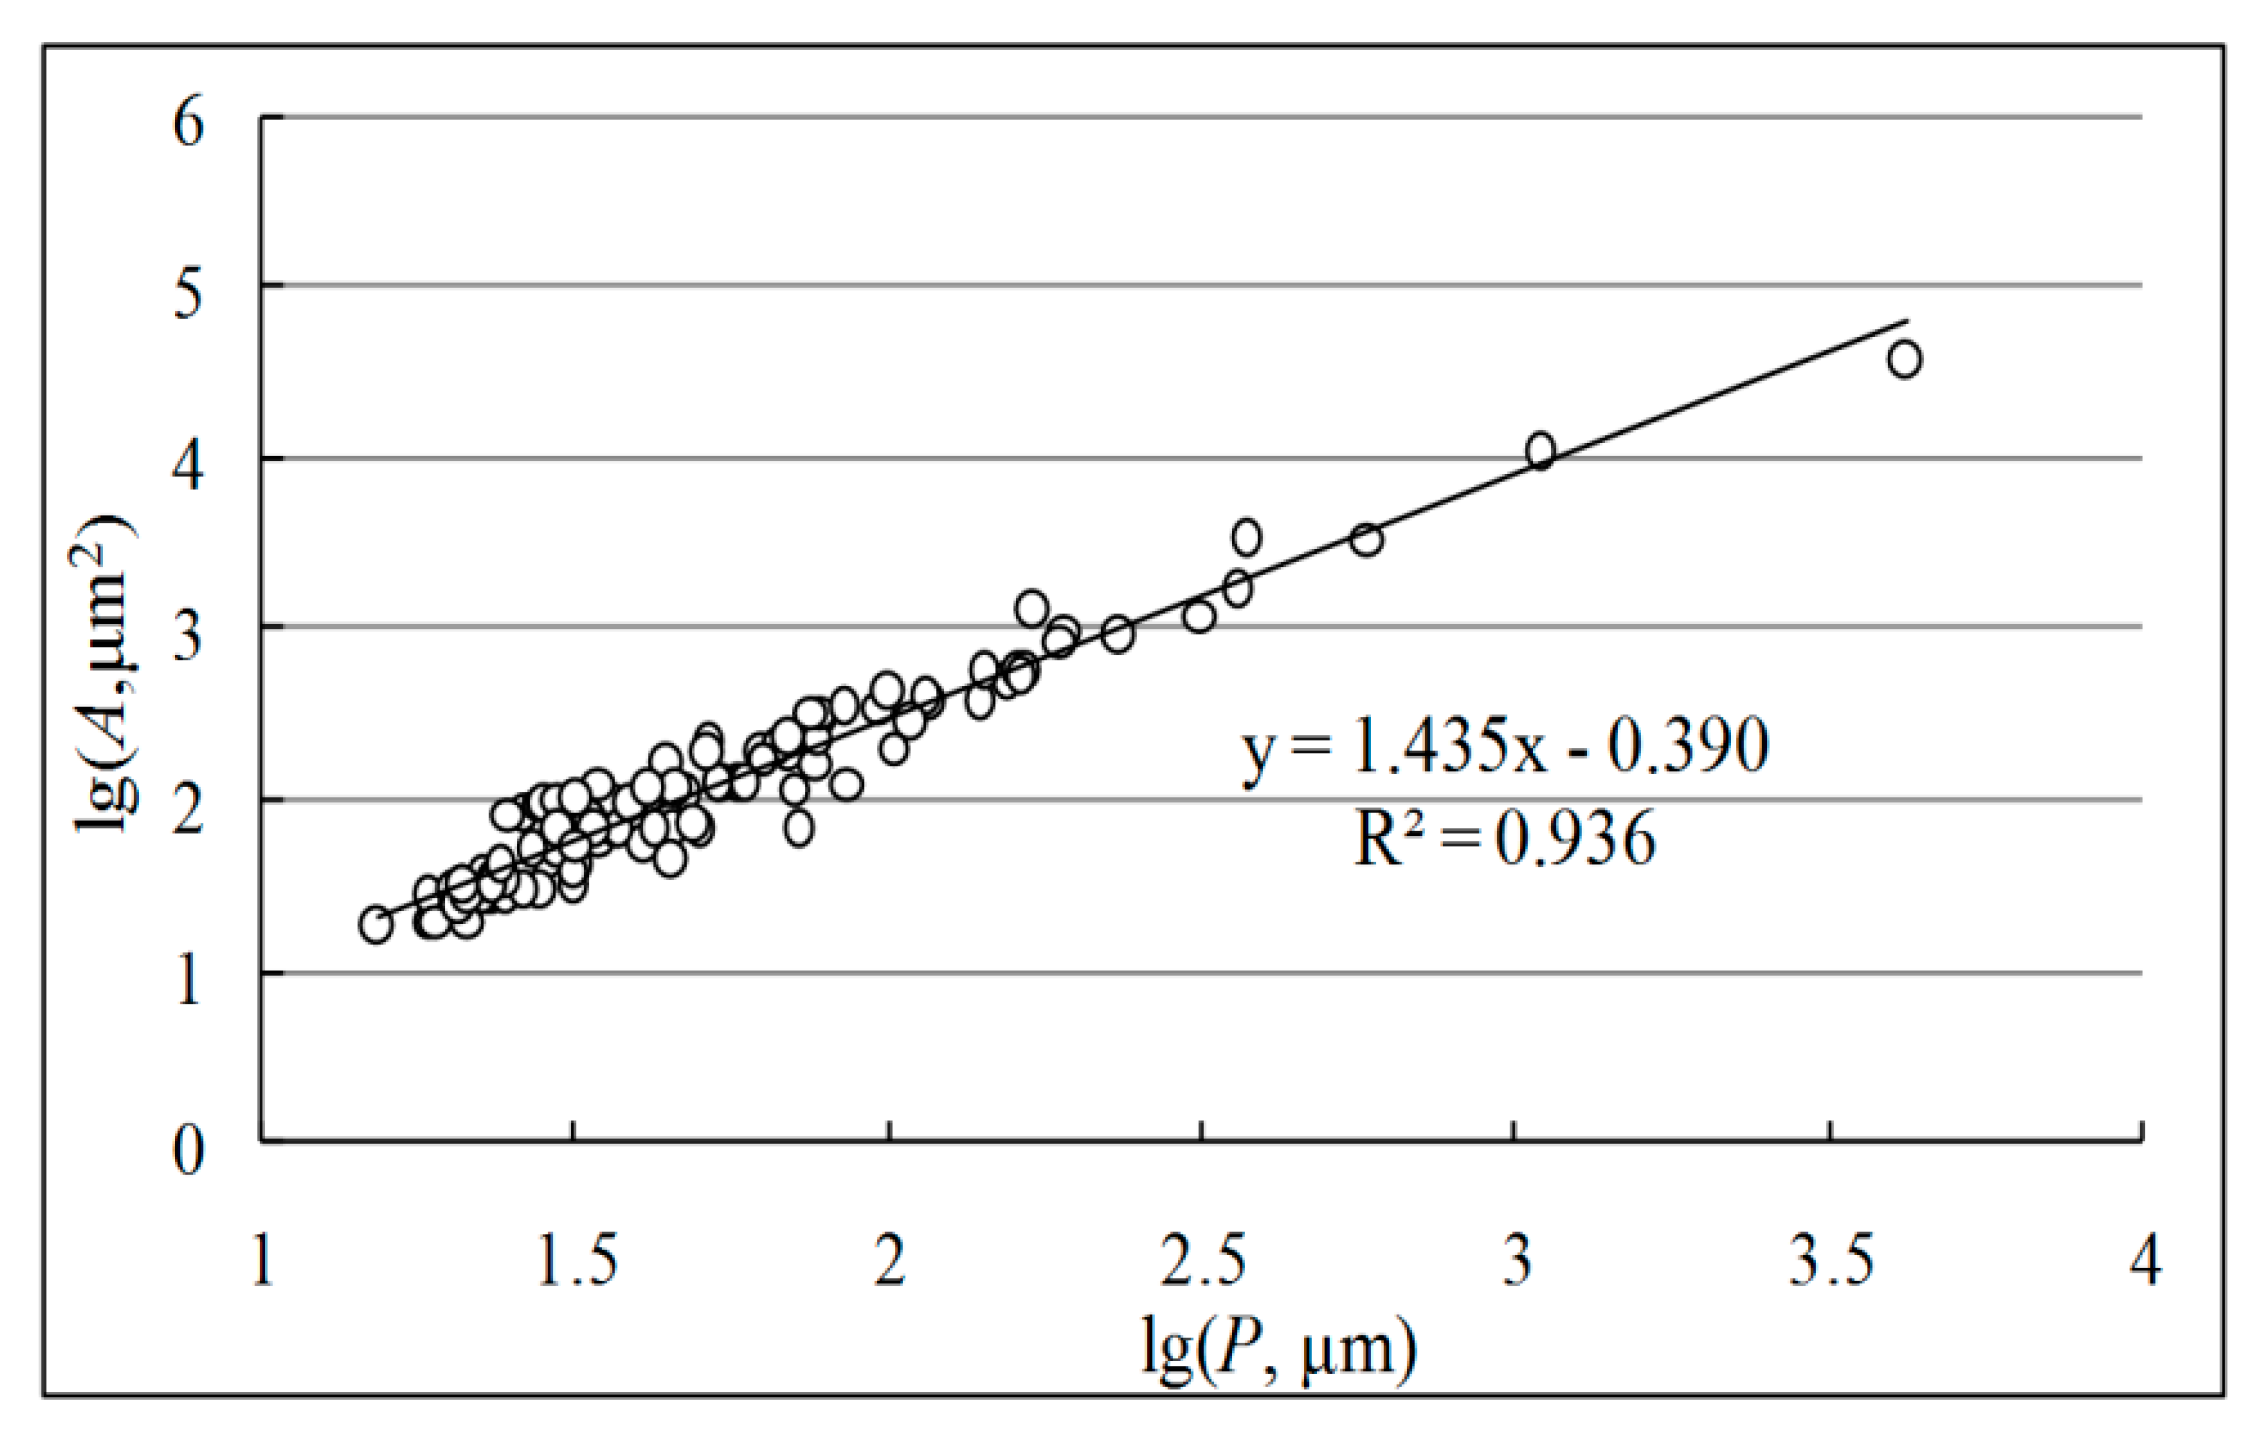
4.2. Fractal Features of the Particle Micro-Structures
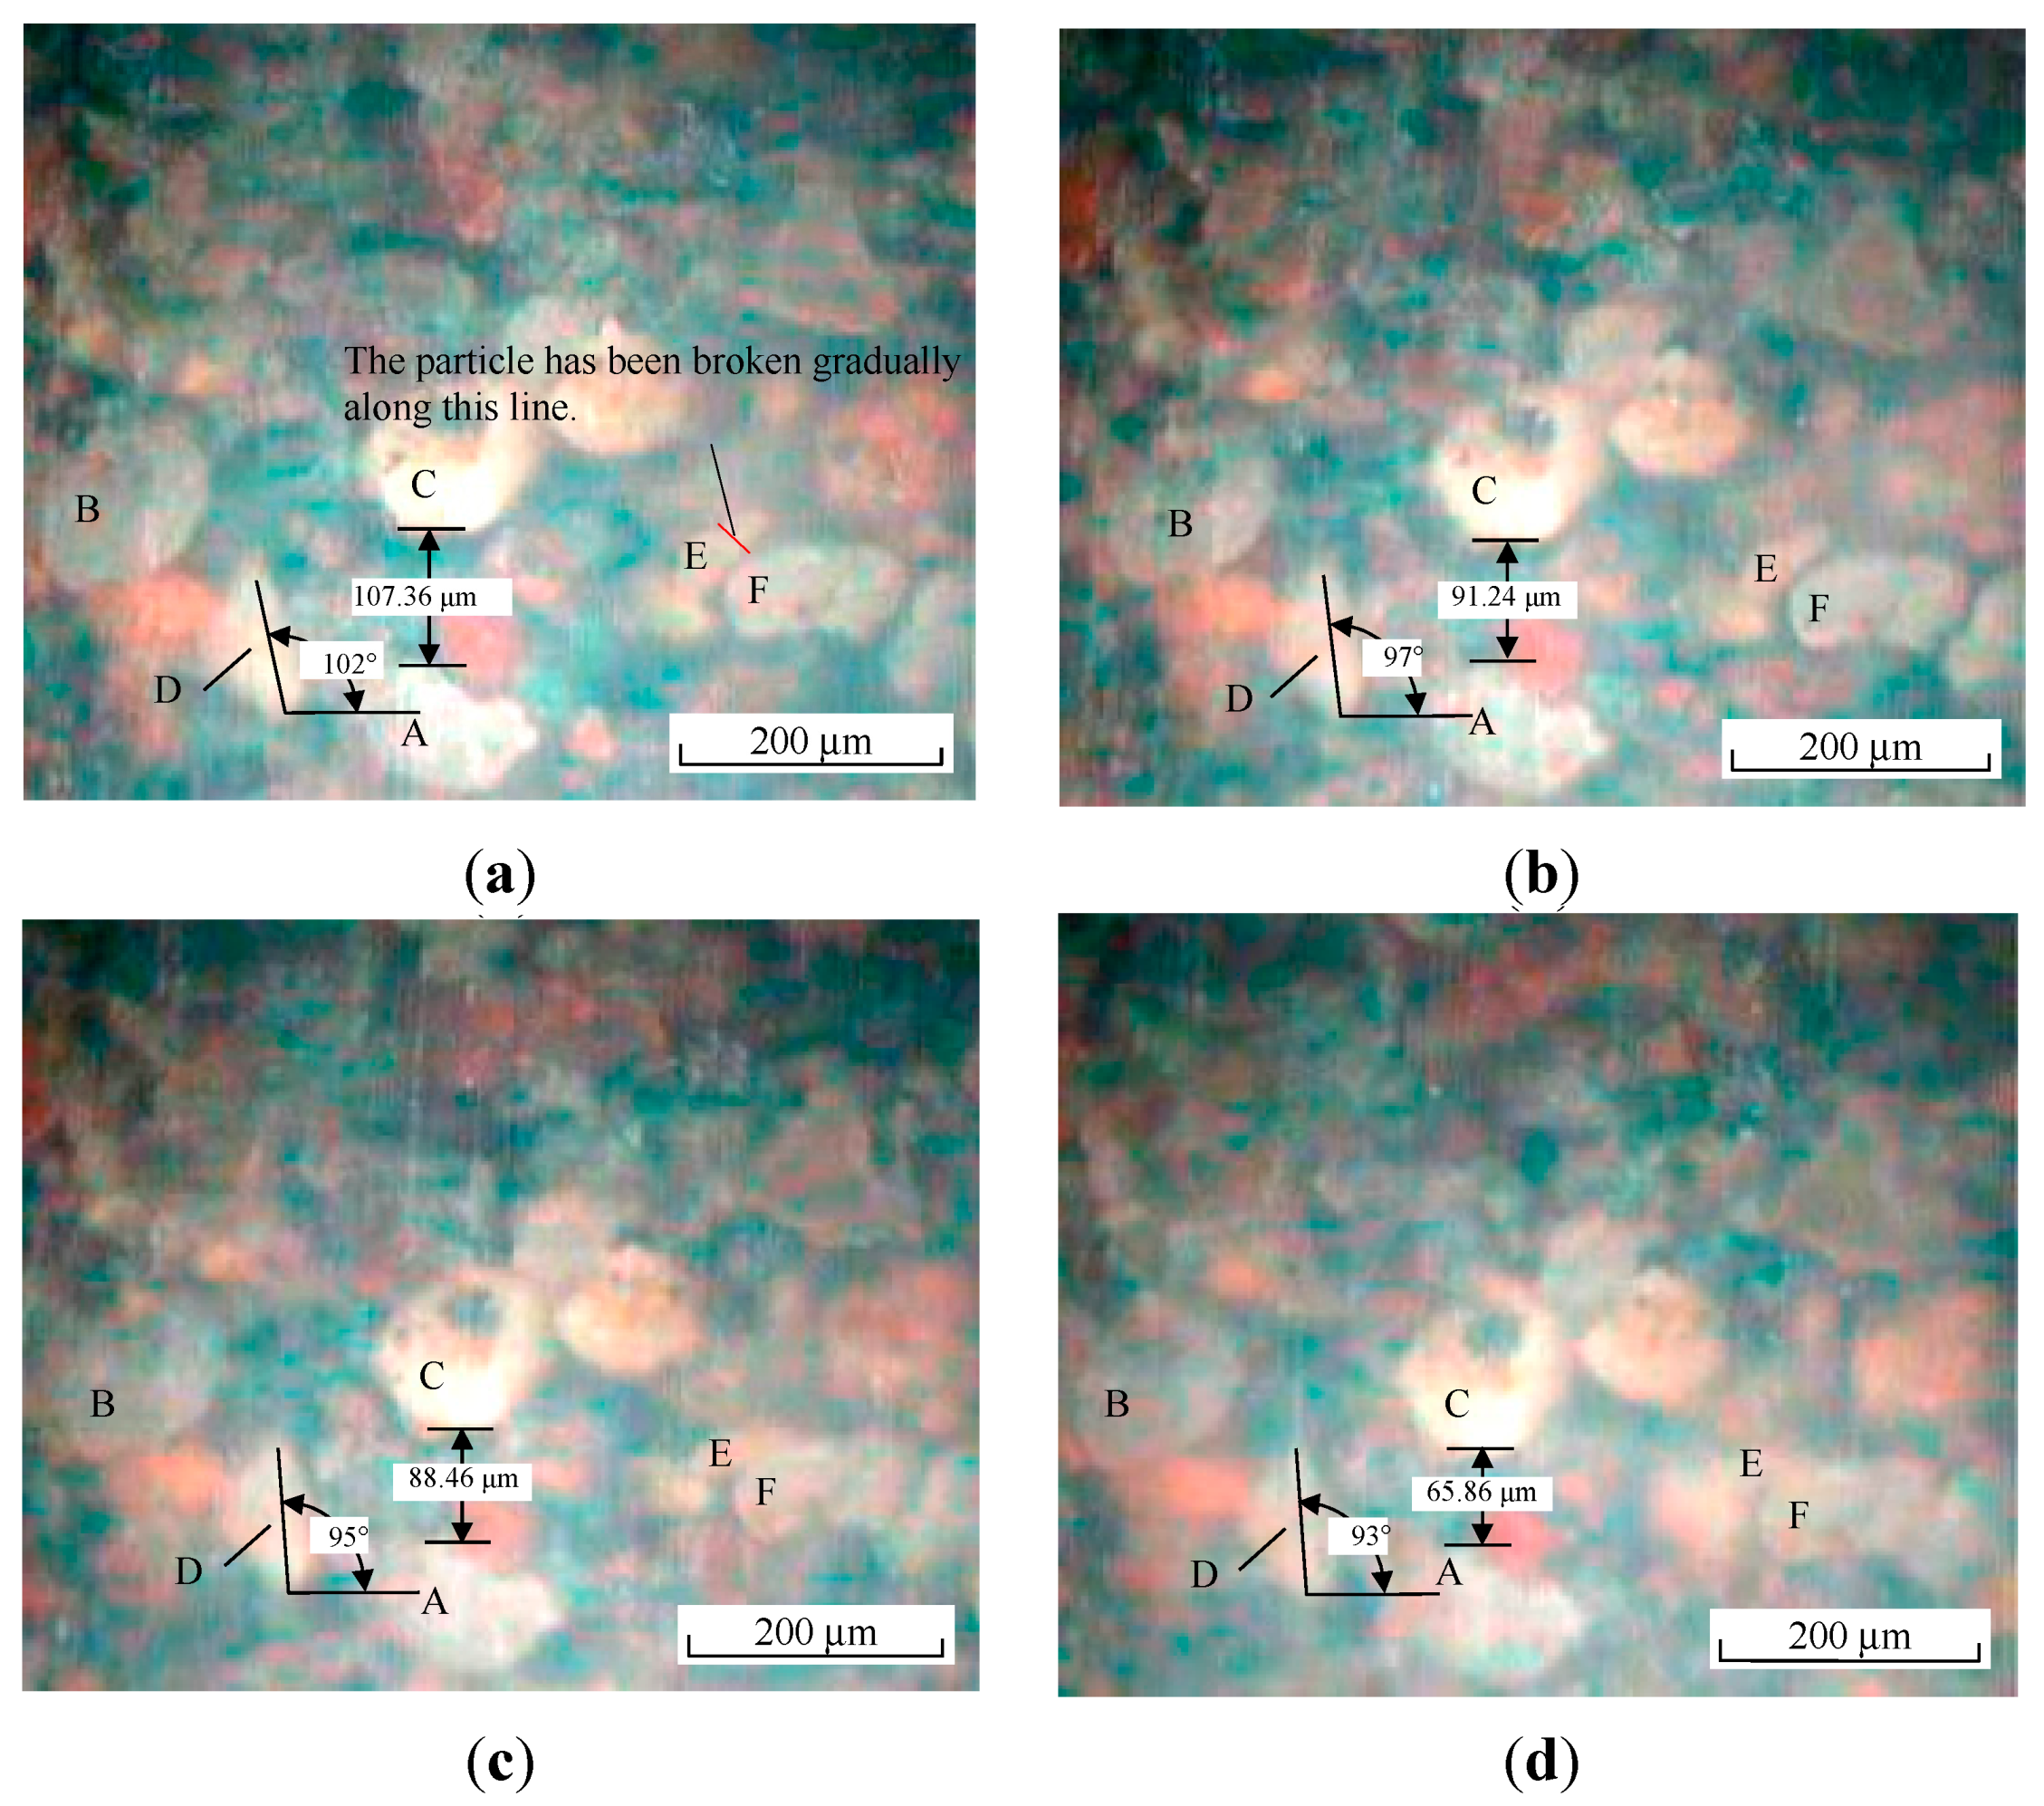
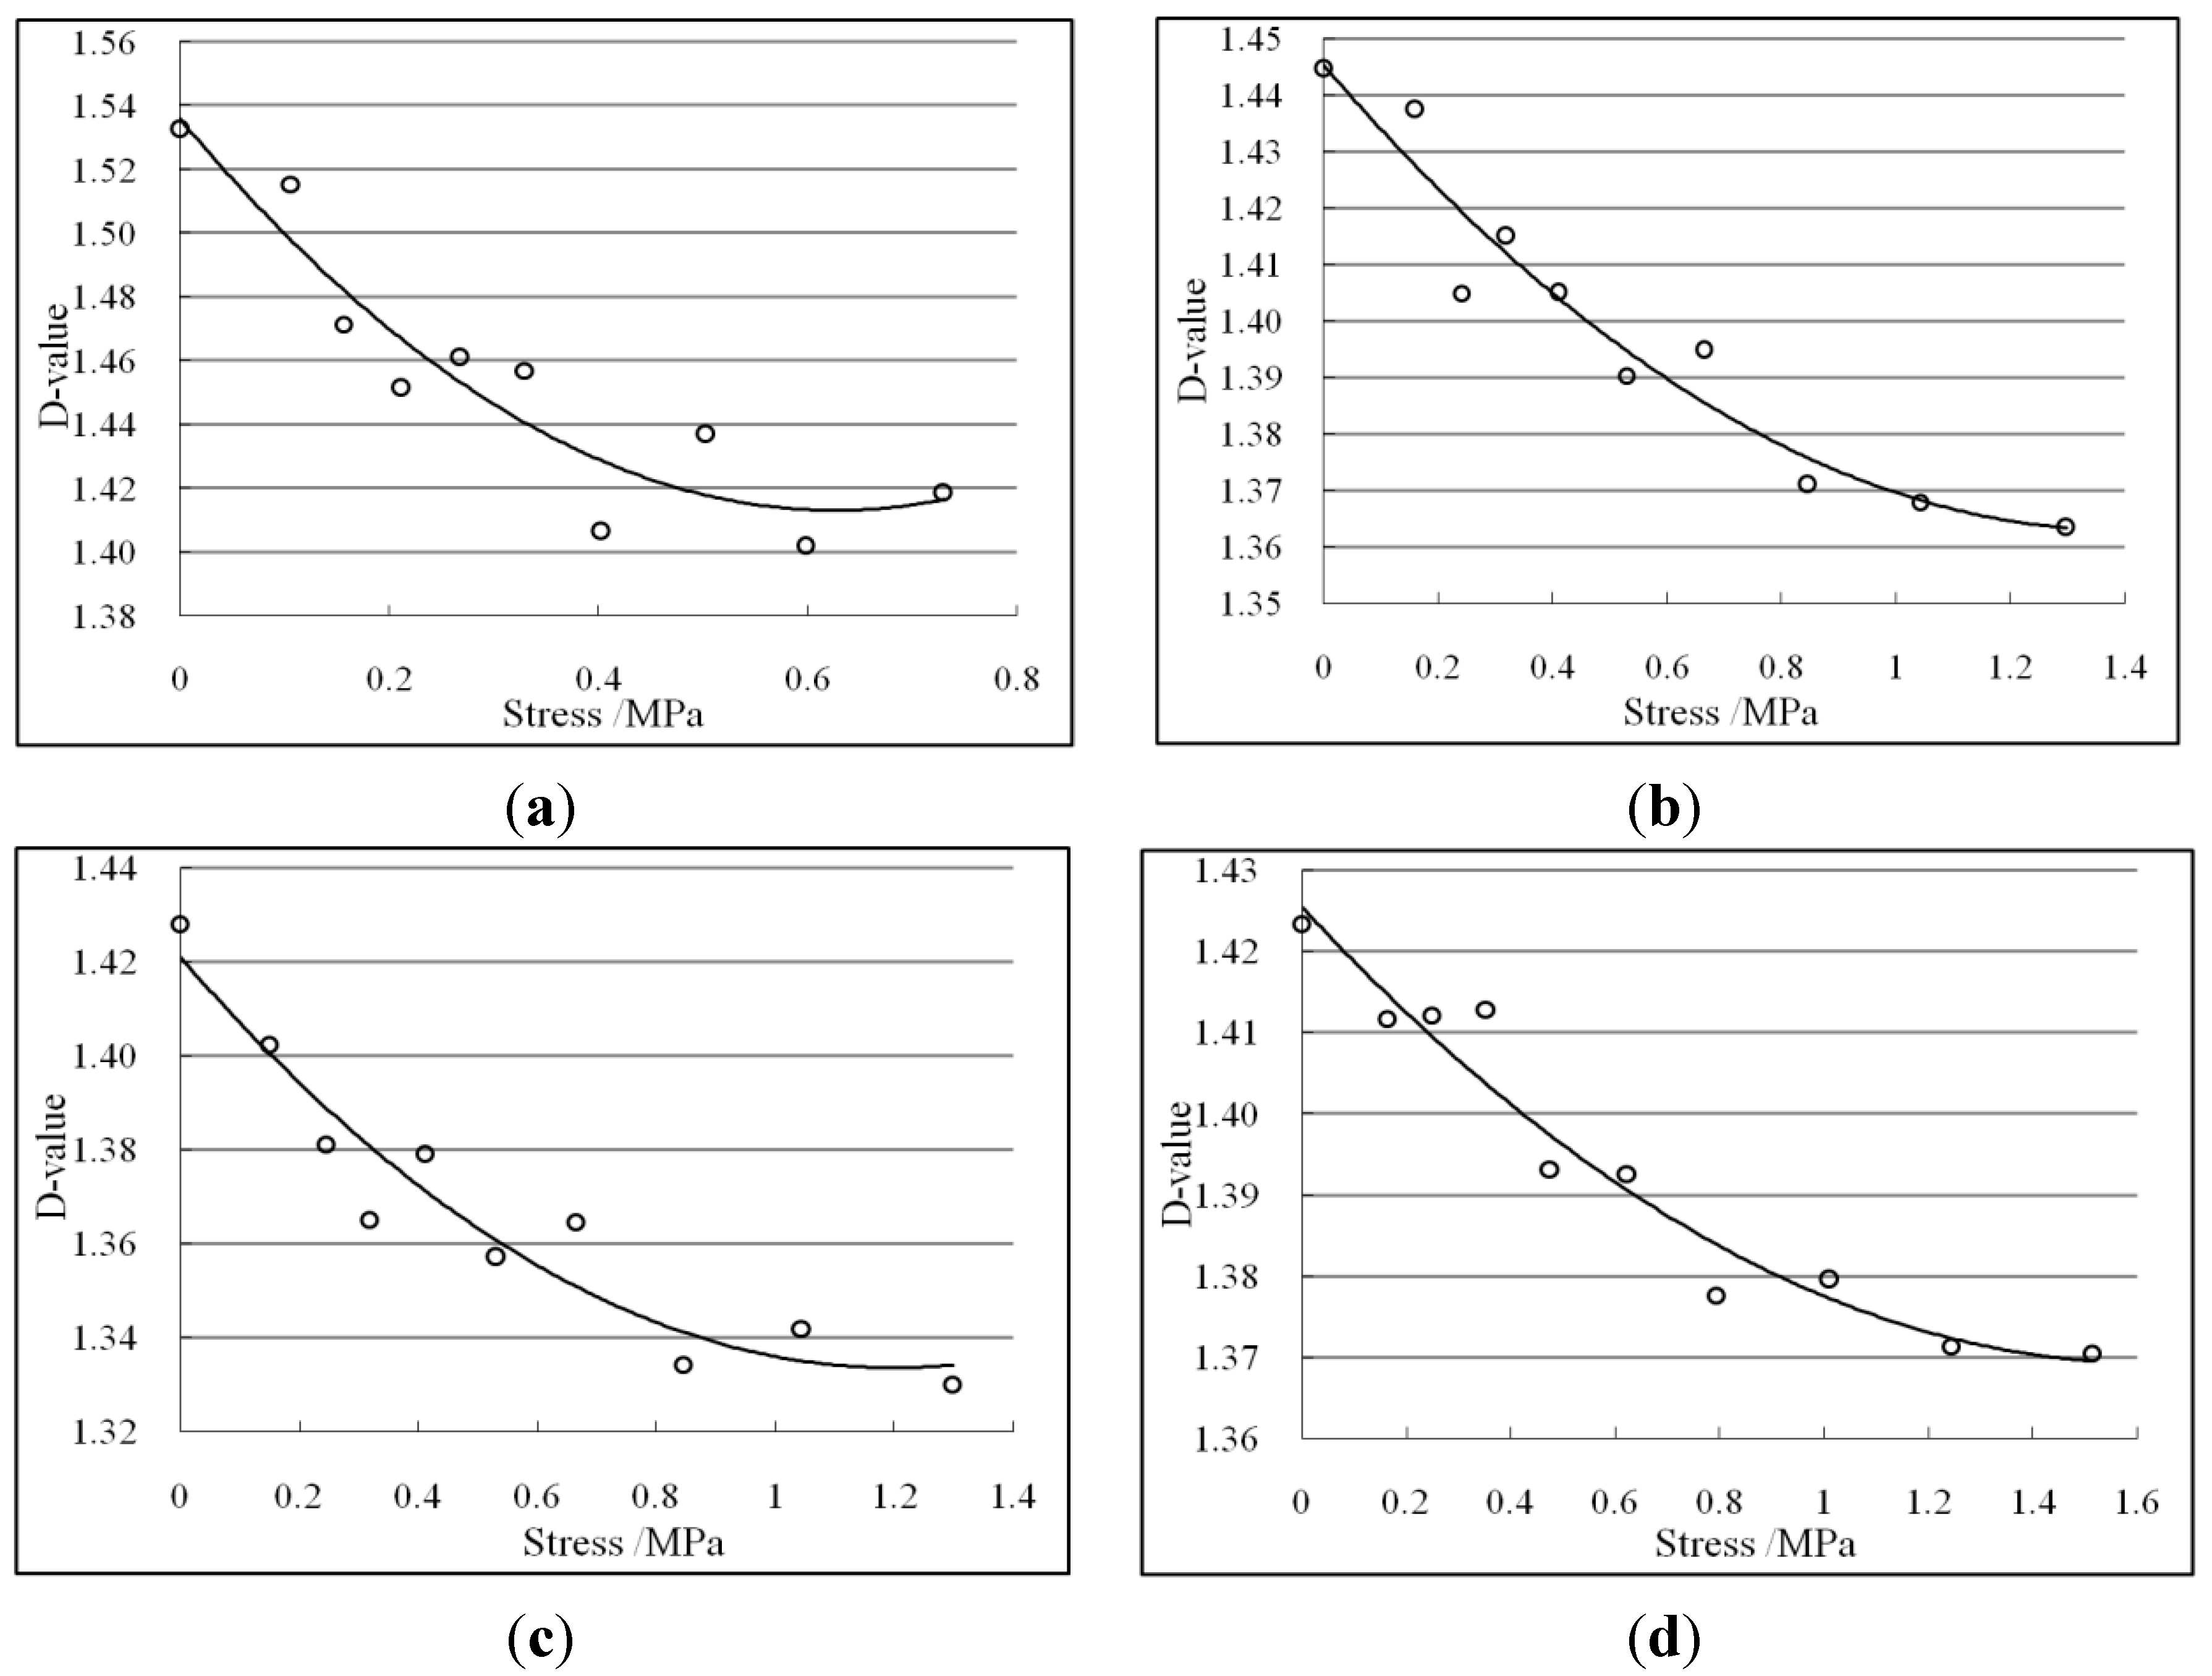
4.3. Deformation Features of the Particles’ Micro-Structure under Load


| Samples | Fitting Formulas | Relative Coefficients (R2) |
|---|---|---|
| I | 0.882 | |
| II | 0.936 | |
| III | 0.913 | |
| IV | 0.949 |
4.4. Influence of Stress on the PSD of the Tailings
| Sample Number | Effective Diameter d10/μm | Median Diameter d50/μm | Control Grain Size d60/μm | Nonuniform Coefficient Cu | Curvature Coefficient Cc | Plastic Limit PL/% | Liquid Limit LL/% | Plastic Index PI | Classification |
|---|---|---|---|---|---|---|---|---|---|
| I | 7.14 | 61.83 | 83.75 | 11.73 | 1.42 | 17.8 | 26.7 | 8.9 | silt |
| II | 40.07 | 206.9 | 248.5 | 6.20 | 1.49 | - | - | - | silty sand |
| III | 84.95 | 297.1 | 343.5 | 4.04 | 1.33 | - | - | - | medium-sized sand |
| IV | 98.63 | 323.4 | 389.2 | 3.95 | 1.24 | - | - | - | medium-sized sand |
| Sample | Size (mm) | |||||||
|---|---|---|---|---|---|---|---|---|
| L ≥ 0.25 | 0.25 > L ≥ 0.125 | 0.125 > L ≥ 0.075 | 0.075 > L ≥ 0.018 | 0.018 > L ≥ 0.01 | L < 0.01 | |||
| Percent by weight (%) | I | pre | 12.16 | 20.98 | 16.69 | 29.29 | 8.21 | 12.67 |
| post | 3.75 | 23.2 | 17.09 | 33.8 | 9.42 | 12.74 | ||
| II | pre | 46.56 | 29.39 | 10.22 | 9.76 | 2.77 | 1.3 | |
| post | 39.91 | 32.44 | 12.19 | 10.9 | 2.45 | 2.11 | ||
| III | pre | 67.75 | 20.07 | 5.31 | 6.2 | 0.67 | 0 | |
| post | 59.98 | 22.08 | 9 | 5.58 | 1.84 | 1.52 | ||
| IV | pre | 75.65 | 15.93 | 2.9 | 3.4 | 1.46 | 0.66 | |
| post | 64.55 | 17.91 | 5.58 | 6.33 | 2.45 | 3.18 | ||
5. Discussion
6. Conclusions
Acknowledgments
Author Contributions
Conflicts of Interest
References
- Shang, J.; Tang, M.; Miao, Z. Vacuum preload consolidation of reclaimed land: A case study. Can. Geotech. J. 1998, 35, 740–749. [Google Scholar] [CrossRef]
- Okagbue, C.O.; Yakubu, J.A. Limestone ash waste as a substitute for lime in soil improvement for engineering construction. Bull. Eng. Geol. Environ. 1999, 58, 107–113. [Google Scholar] [CrossRef]
- Eisazadeh, A.; Kassim, K.A.; Nur, H. Morphology and BET surface area of phosphoric acid stabilized tropical soils. Eng. Geol. 2013, 154, 36–41. [Google Scholar] [CrossRef]
- Yin, G.; Zhang, Q.; Wei, Z.; Jiang, C.; Wang, M.; Geng, W. Development and application of observation testing apparatus for micro-mechanics and deformation of tailings. Chin. J. Rock Mech. Eng. 2011, 30, 926–934. (In Chinese) [Google Scholar]
- Jiang, M.; Zhang, F.; Hu, H.; Cui, Y.; Peng, J. Structural characterization of natural loess and remolded loess under triaxial tests. Eng. Geol. 2014, 181, 249–260. [Google Scholar] [CrossRef]
- Zhang, J.; Wang, R.; Zhang, Y.; Chen, F. Advance in studies of soil grain crush. Rock Soil Mech. 2003, 24, 661–665. (In Chinese) [Google Scholar]
- Prosperini, N.; Perugini, D. Particle size distributions of some soils from the Umbria Region (Italy): Fractal analysis and numerical modeling. Geoderma 2008, 145, 185–195. [Google Scholar] [CrossRef]
- Tsallis, C. Introduction to Nonextensive Statistical Mechanics: Approaching a Complex World; Springer: New York, NY, USA, 2009; p. 14. [Google Scholar]
- Perfect, E. Fractal models for the fragmentation of rocks and soils: A review. Eng. Geol. 1997, 48, 185–198. [Google Scholar] [CrossRef]
- Giménez, D.; Perfect, E.; Rawls, W.J.; Pachepsky, Y. Fractal models for predicting soil hydraulic properties: A review. Eng. Geol. 1997, 48, 161–183. [Google Scholar] [CrossRef]
- Millán, H.; González-Posada, M.; Aguilar, M.; Domínguez, J.; Céspedes, L. On the fractal scaling of soil data: Particle-size distributions. Geoderma 2003, 117, 117–128. [Google Scholar] [CrossRef]
- Vallianatos, F.; Triantis, D.; Sammonds, P. Non-extensivity of the isothermal depolarization relaxation currents in uniaxial compressed rocks. Europhys. Lett. (EPL) 2011, 94, 68008. [Google Scholar] [CrossRef]
- Vallianatos, F. On the non-extensive nature of the isothermal depolarization relaxation currents in cement mortars. J. Phys. Chem. Solids 2012, 73, 550–553. [Google Scholar] [CrossRef]
- Vallianatos, F.; Benson, P.; Meredith, P.; Sammonds, P. Experimental evidence of a non-extensive statistical physics behavior of fracture in triaxially deformed Etna basalt using acoustic emissions. Europhys. Lett. (EPL) 2012, 97, 58002. [Google Scholar] [CrossRef]
- Vallianatos, F.; Triantis, D. Is pressure stimulated current relaxation in amphibolite a case of non-extensivity? Europhys. Lett. (EPL) 2012, 99, 18006. [Google Scholar] [CrossRef]
- Vallianatos, F.; Michas, G.; Benson, P.; Sammonds, P. Natural time analysis of critical phenomena: The case of acoustic emissions in triaxially deformed Etna basalt. Phys. A Stat. Mech. Appl. 2013, 392, 5172–5178. [Google Scholar] [CrossRef]
- Vallianatos, F.; Triantis, D. A non-extensive view of the Pressure Stimulated Current relaxation during repeated abrupt uniaxial load-unload in rock samples. Europhys. Lett. (EPL) 2013, 104, 68002. [Google Scholar] [CrossRef]
- Marone, C.; Scholz, C. Particle-size distribution and micro-structures within simulated gouge. J. Struct. Geol. 1989, 11, 799–814. [Google Scholar] [CrossRef]
- Sammis, C.G.; Biegel, R.L. Fractals, fault-gouge, and friction. Pure Appl. Geophys. 1989, 131, 255–271. [Google Scholar] [CrossRef]
- Ai, Y.; Chen, Z.; Guo, P.; Zeng, L.; Liu, H.; Da, Z.; Li, W. Fractal characteristics of synthetic soil for cut slope revegetation in the Purple soil area of China. Can. J. Soil Sci. 2012, 92, 277–284. [Google Scholar] [CrossRef]
- Buhl, E.; Kowitz, A.; Elbeshausen, D.; Sommer, F.; Dresen, G.; Poelchaud, M.H.; Reimold, W.U.; Schmitt, R.T.; Kenkmann, T. Particle size distribution and strain rate attenuation in hypervelocity impact and shock recovery experiments. J. Struct. Geol. 2013, 56, 20–33. [Google Scholar] [CrossRef]
- Vallejo, L.E.; Chik, Z. Fractal and laboratory analyses of the crushing and abrasion of granular materials. Geomech. Eng. 2009, 1, 323–335. [Google Scholar] [CrossRef]
- Yin, G.; Li, G.; Wei, Z.; Wan, L.; Shui, G.; Jing, X. Stability analysis of a copper tailings dam via laboratory model tests: A Chinese case study. Miner. Eng. 2011, 24, 122–130. [Google Scholar] [CrossRef]
- Yin, G.; Zhang, Q.; Wang, W.; Chen, Y.; Geng, W.; Liu, H. Experimental study on the mechanism effect of seepage on micro-structure of tailings. Saf. Sci. 2012, 50, 792–796. [Google Scholar] [CrossRef]
- Change, N.; Heymann, G.; Clayton, C. The effect of fabric on the behaviour of gold tailings. Géotechnique 2011, 61, 187–197. [Google Scholar] [CrossRef]
- Sun, X.; Wu, Z.; Huang, Y. Theory and Application of Fractal; University of Science and Technology Press: Beijing, China, 2003; pp. 39–41. (In Chinese) [Google Scholar]
- Chen, Q. The perimeter-area fractal model and its application to geology. Math. Geol. 1995, 27, 69–82. [Google Scholar] [CrossRef]
- Mandelbrot, B.P. The Fractal Theory of Nature; Freeman: New York, NY, USA, 1983; pp. 25–48. [Google Scholar]
- Imre, A.R.; Bogaert, J. The fractal dimension as a measure of the quality of habitats. Acta Biotheor. 2004, 52, 41–56. [Google Scholar] [CrossRef] [PubMed]
- Wang, B.; Shi, B.; Liu, Z.; Cai, Y. Fractal study on microstructure of clayey soil by GIS. Chin. J. Geotech. Eng. 2004, 26, 244–247. (In Chinese) [Google Scholar]
- Yuan, J. Geotechnical Test and Its Principle; Tongji University Press Press: Shanghai, China, 2003; p. 109. (In Chinese) [Google Scholar]
- Zhang, J. New advances in basic theories of sand dynamics. Chin. J. Geotech. Eng. 2012, 34, 1–50. (In Chinese) [Google Scholar]
- Chen, R.; Lei, W.; Li, Z. Anisotropic shear strength characteristics of a tailings sand. Environ. Earth Sci. 2014, 71, 5165–5172. [Google Scholar] [CrossRef]
- Vesic, A.S.; Clough, G.W. Behavior of granular materials under high stresses. J. Soil Mech. Found. Div ASCE 1968, 94, 661–688. [Google Scholar]
- Ghafghazi, M.; Shuttle, D.A.; DeJong, J.T. Particle breakage and the critical state of sand. Soils Found. 2014, 54, 451–461. [Google Scholar] [CrossRef]
- Kjaernsli, B.; Sande, A. Compressibility of some coarsegrained materials. In Proceedings of the 1st European Conference on Soil Mechanics and Foundation Engineering, Weisbaden, Germany, 15–18 October 1963; pp. 245–251.
- Wei, Z.; Yin, G.; Li, G.; Wang, J.; Wan, L.; Shen, L. Reinforced terraced fields method for fine tailings disposal. Miner. Eng. 2009, 22, 1053–1059. [Google Scholar] [CrossRef]
- Goktepe, A.B.; Sezer, A. Effect of particle shape on density and permeability of sands. Proc. Inst. Civ. Eng. Geotech. Eng. 2010, 163, 307–320. [Google Scholar] [CrossRef]
- Bonala, M.; Reddi, P. Fractal representation of soil cohesion. J. Geotech. Geoenviron. Eng. 1999, 125, 901–904. [Google Scholar] [CrossRef]
- Taşdemir, A. Fractal evaluation of particle size distributions of chromites in different comminution environments. Miner. Eng. 2009, 22, 156–167. [Google Scholar] [CrossRef]
- Altuhafi, F.N.; Coop, M.R. The effect of mode of loading on particle-scale damage. Soils Found. 2011, 51, 849–856. [Google Scholar] [CrossRef]
- Miao, G.; Airey, D. Breakage and ultimate states for a carbonate sand. Géotechnique 2013, 63, 1221–1229. [Google Scholar] [CrossRef]
- Stergiopoulos, C.H.; Stavrakas, I.; Triantis, D.; Vallianatos, F.; Stonham, J. Predicting fracture of mortar beams under three-point bending using non-extensive statistical modeling of electric emissions. Phys. A Stat. Mech. Appl. 2015, 419, 603–611. [Google Scholar] [CrossRef]
- Vallianatos, F. On the non-extensivity in Mars geological faults. Europhys. Lett. (EPL) 2013, 102, 28006. [Google Scholar] [CrossRef]
- Vallianatos, F.; Baziotis, I.; Udry, A.; Taylor, L.A. Application of non-extensive statistical physics on Martian nakhlites: A first-order approach on the crystal size distribution of pyroxene using Tsallis entropy. Europhys. Lett. (EPL) 2014, 108, 58002. [Google Scholar] [CrossRef]
- Zhang, Q.; Yin, G.; Chen, Y.; Geng, W.; Wang, W. Experimental Study on the Affecting Factors of the Shear Strength of Unsaturated Tailings. In Proceedings of 2011 International Symposium on Water Resource and Environmental Protection; Chang’an University Press: Xi’an, China, 2011; Volume 1, pp. 89–93. [Google Scholar]
© 2015 by the authors; licensee MDPI, Basel, Switzerland. This article is an open access article distributed under the terms and conditions of the Creative Commons Attribution license (http://creativecommons.org/licenses/by/4.0/).
Share and Cite
Zhang, Q.; Yin, G.; Fan, X.; Wei, Z.; Wang, W.; Nie, W. Loading Capacity and Deformation Characteristics of Tailings Based on a Fractal Geometrical Analysis of the Particle Microstructure. Minerals 2015, 5, 86-103. https://doi.org/10.3390/min5010086
Zhang Q, Yin G, Fan X, Wei Z, Wang W, Nie W. Loading Capacity and Deformation Characteristics of Tailings Based on a Fractal Geometrical Analysis of the Particle Microstructure. Minerals. 2015; 5(1):86-103. https://doi.org/10.3390/min5010086
Chicago/Turabian StyleZhang, Qiangui, Guangzhi Yin, Xiangyu Fan, Zuoan Wei, Wensong Wang, and Wen Nie. 2015. "Loading Capacity and Deformation Characteristics of Tailings Based on a Fractal Geometrical Analysis of the Particle Microstructure" Minerals 5, no. 1: 86-103. https://doi.org/10.3390/min5010086
APA StyleZhang, Q., Yin, G., Fan, X., Wei, Z., Wang, W., & Nie, W. (2015). Loading Capacity and Deformation Characteristics of Tailings Based on a Fractal Geometrical Analysis of the Particle Microstructure. Minerals, 5(1), 86-103. https://doi.org/10.3390/min5010086