Helium Production and Possible Projection

Abstract
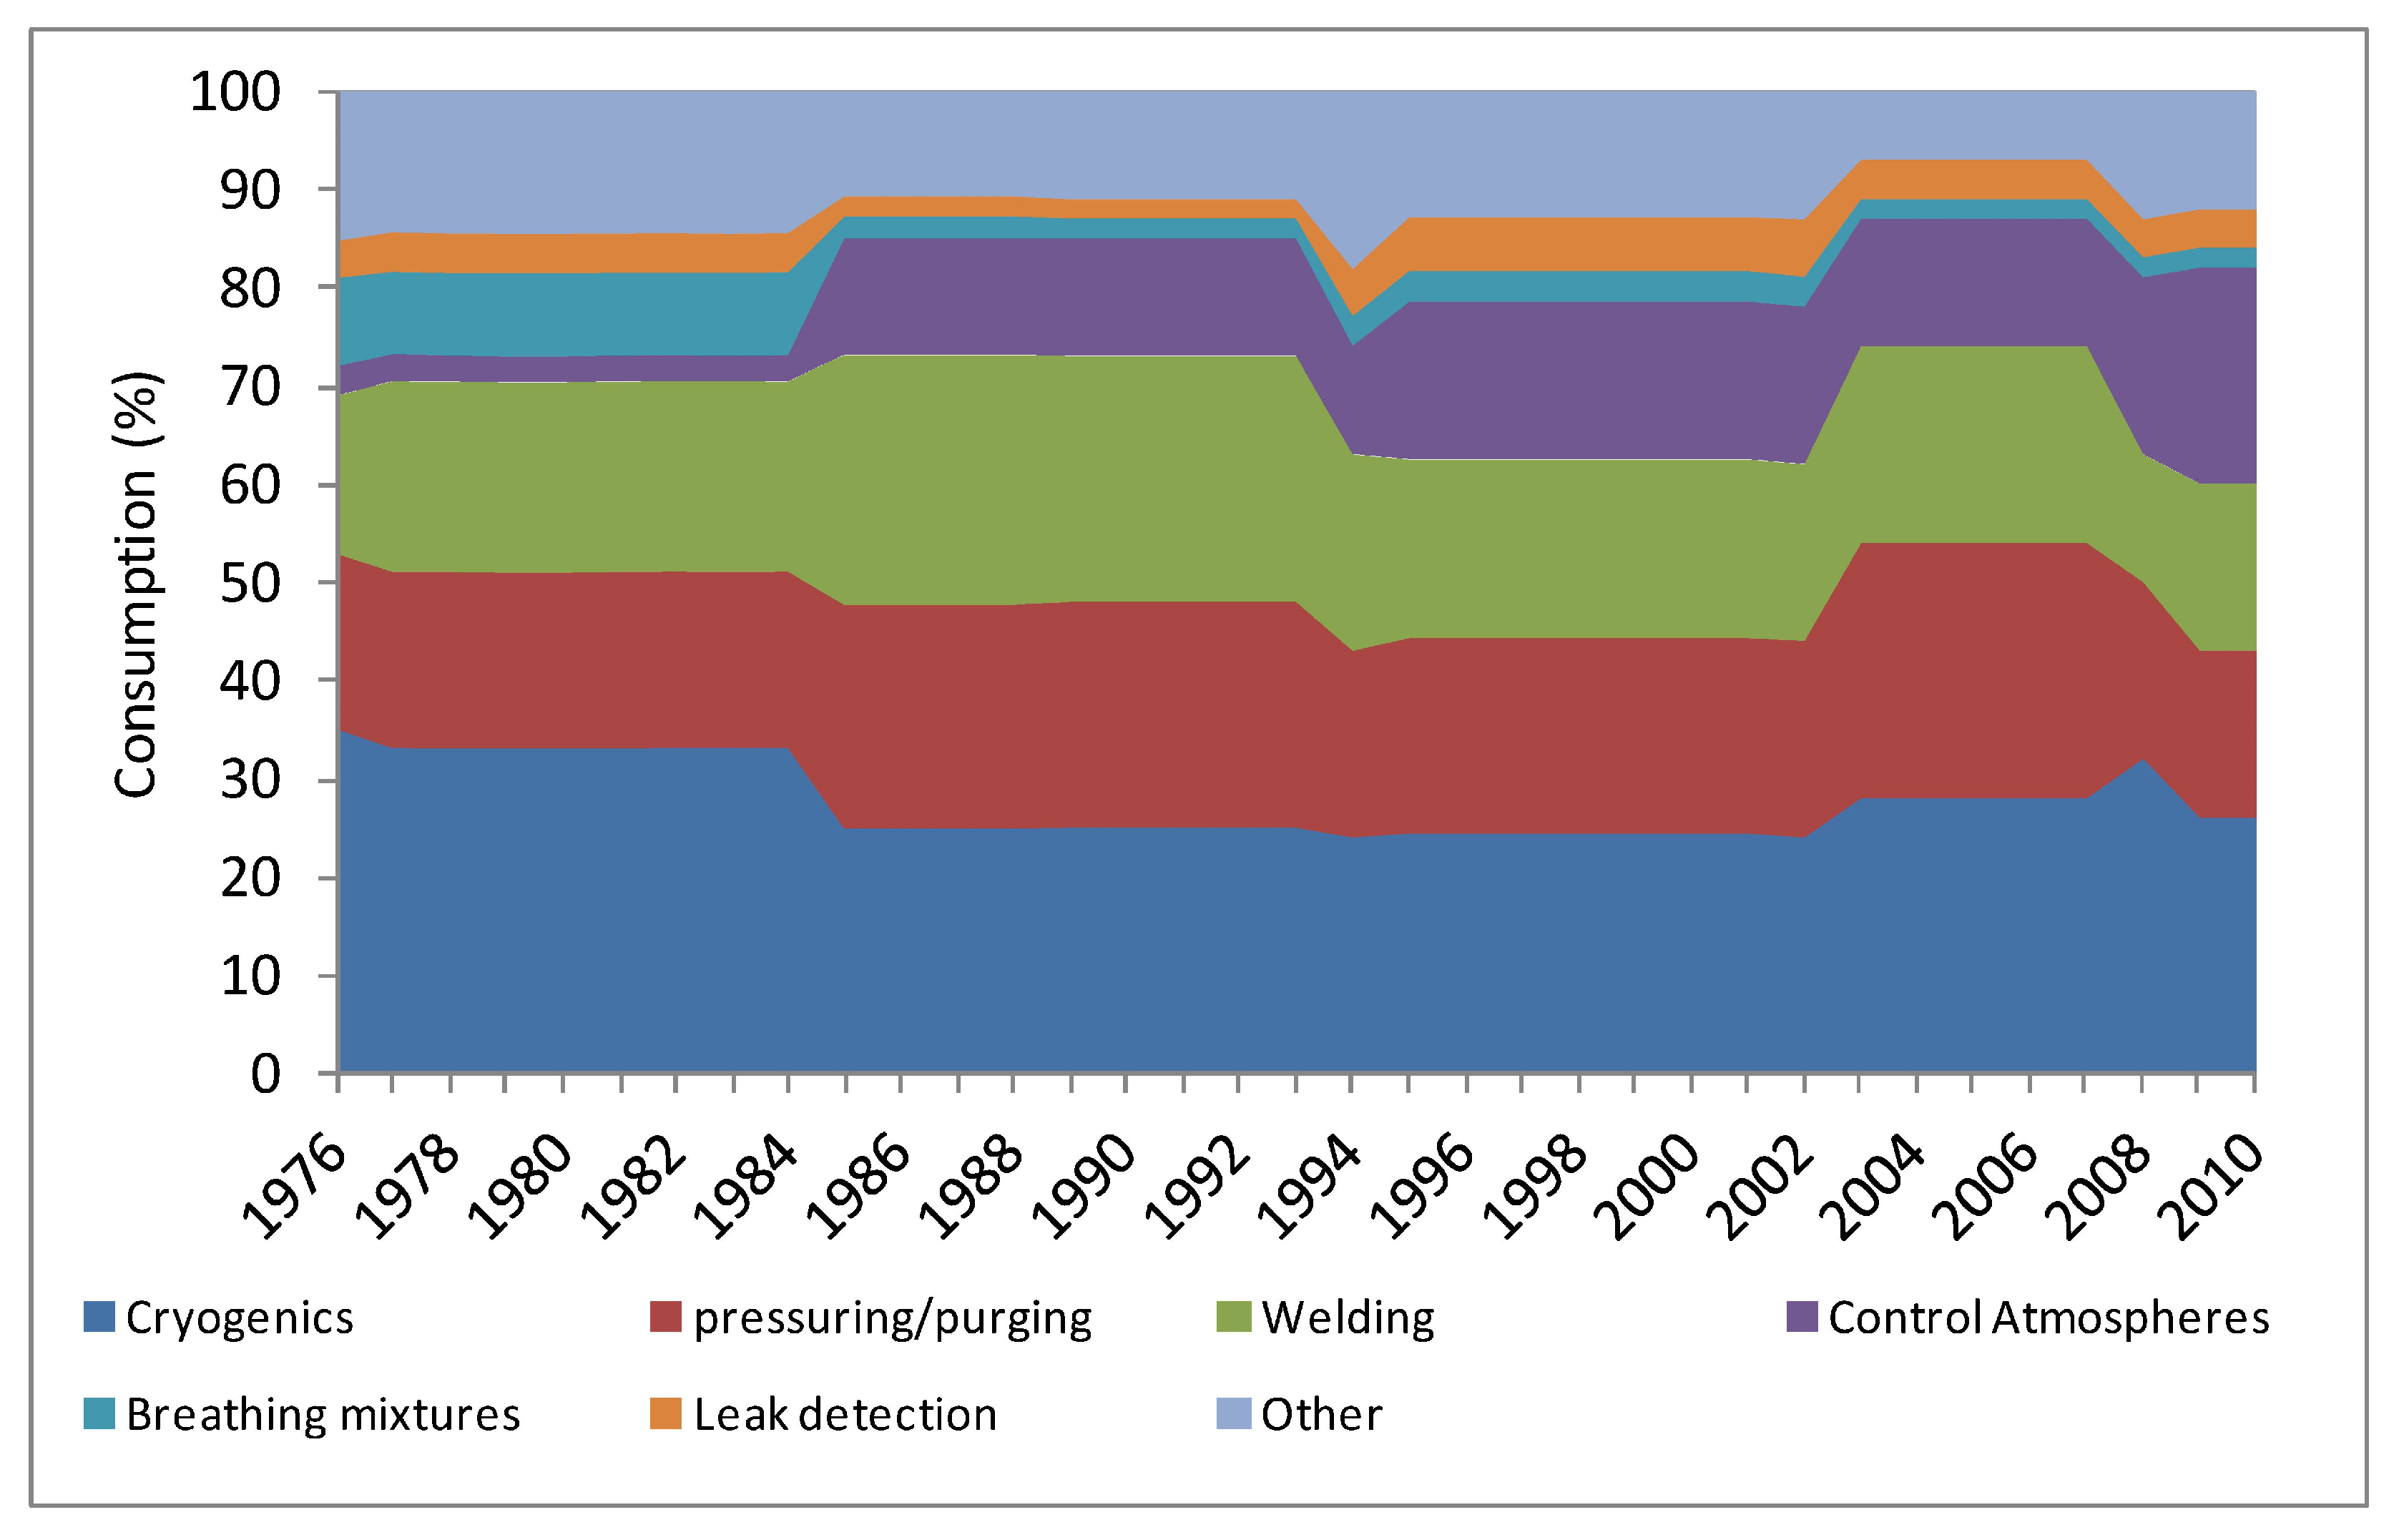
:1. Introduction

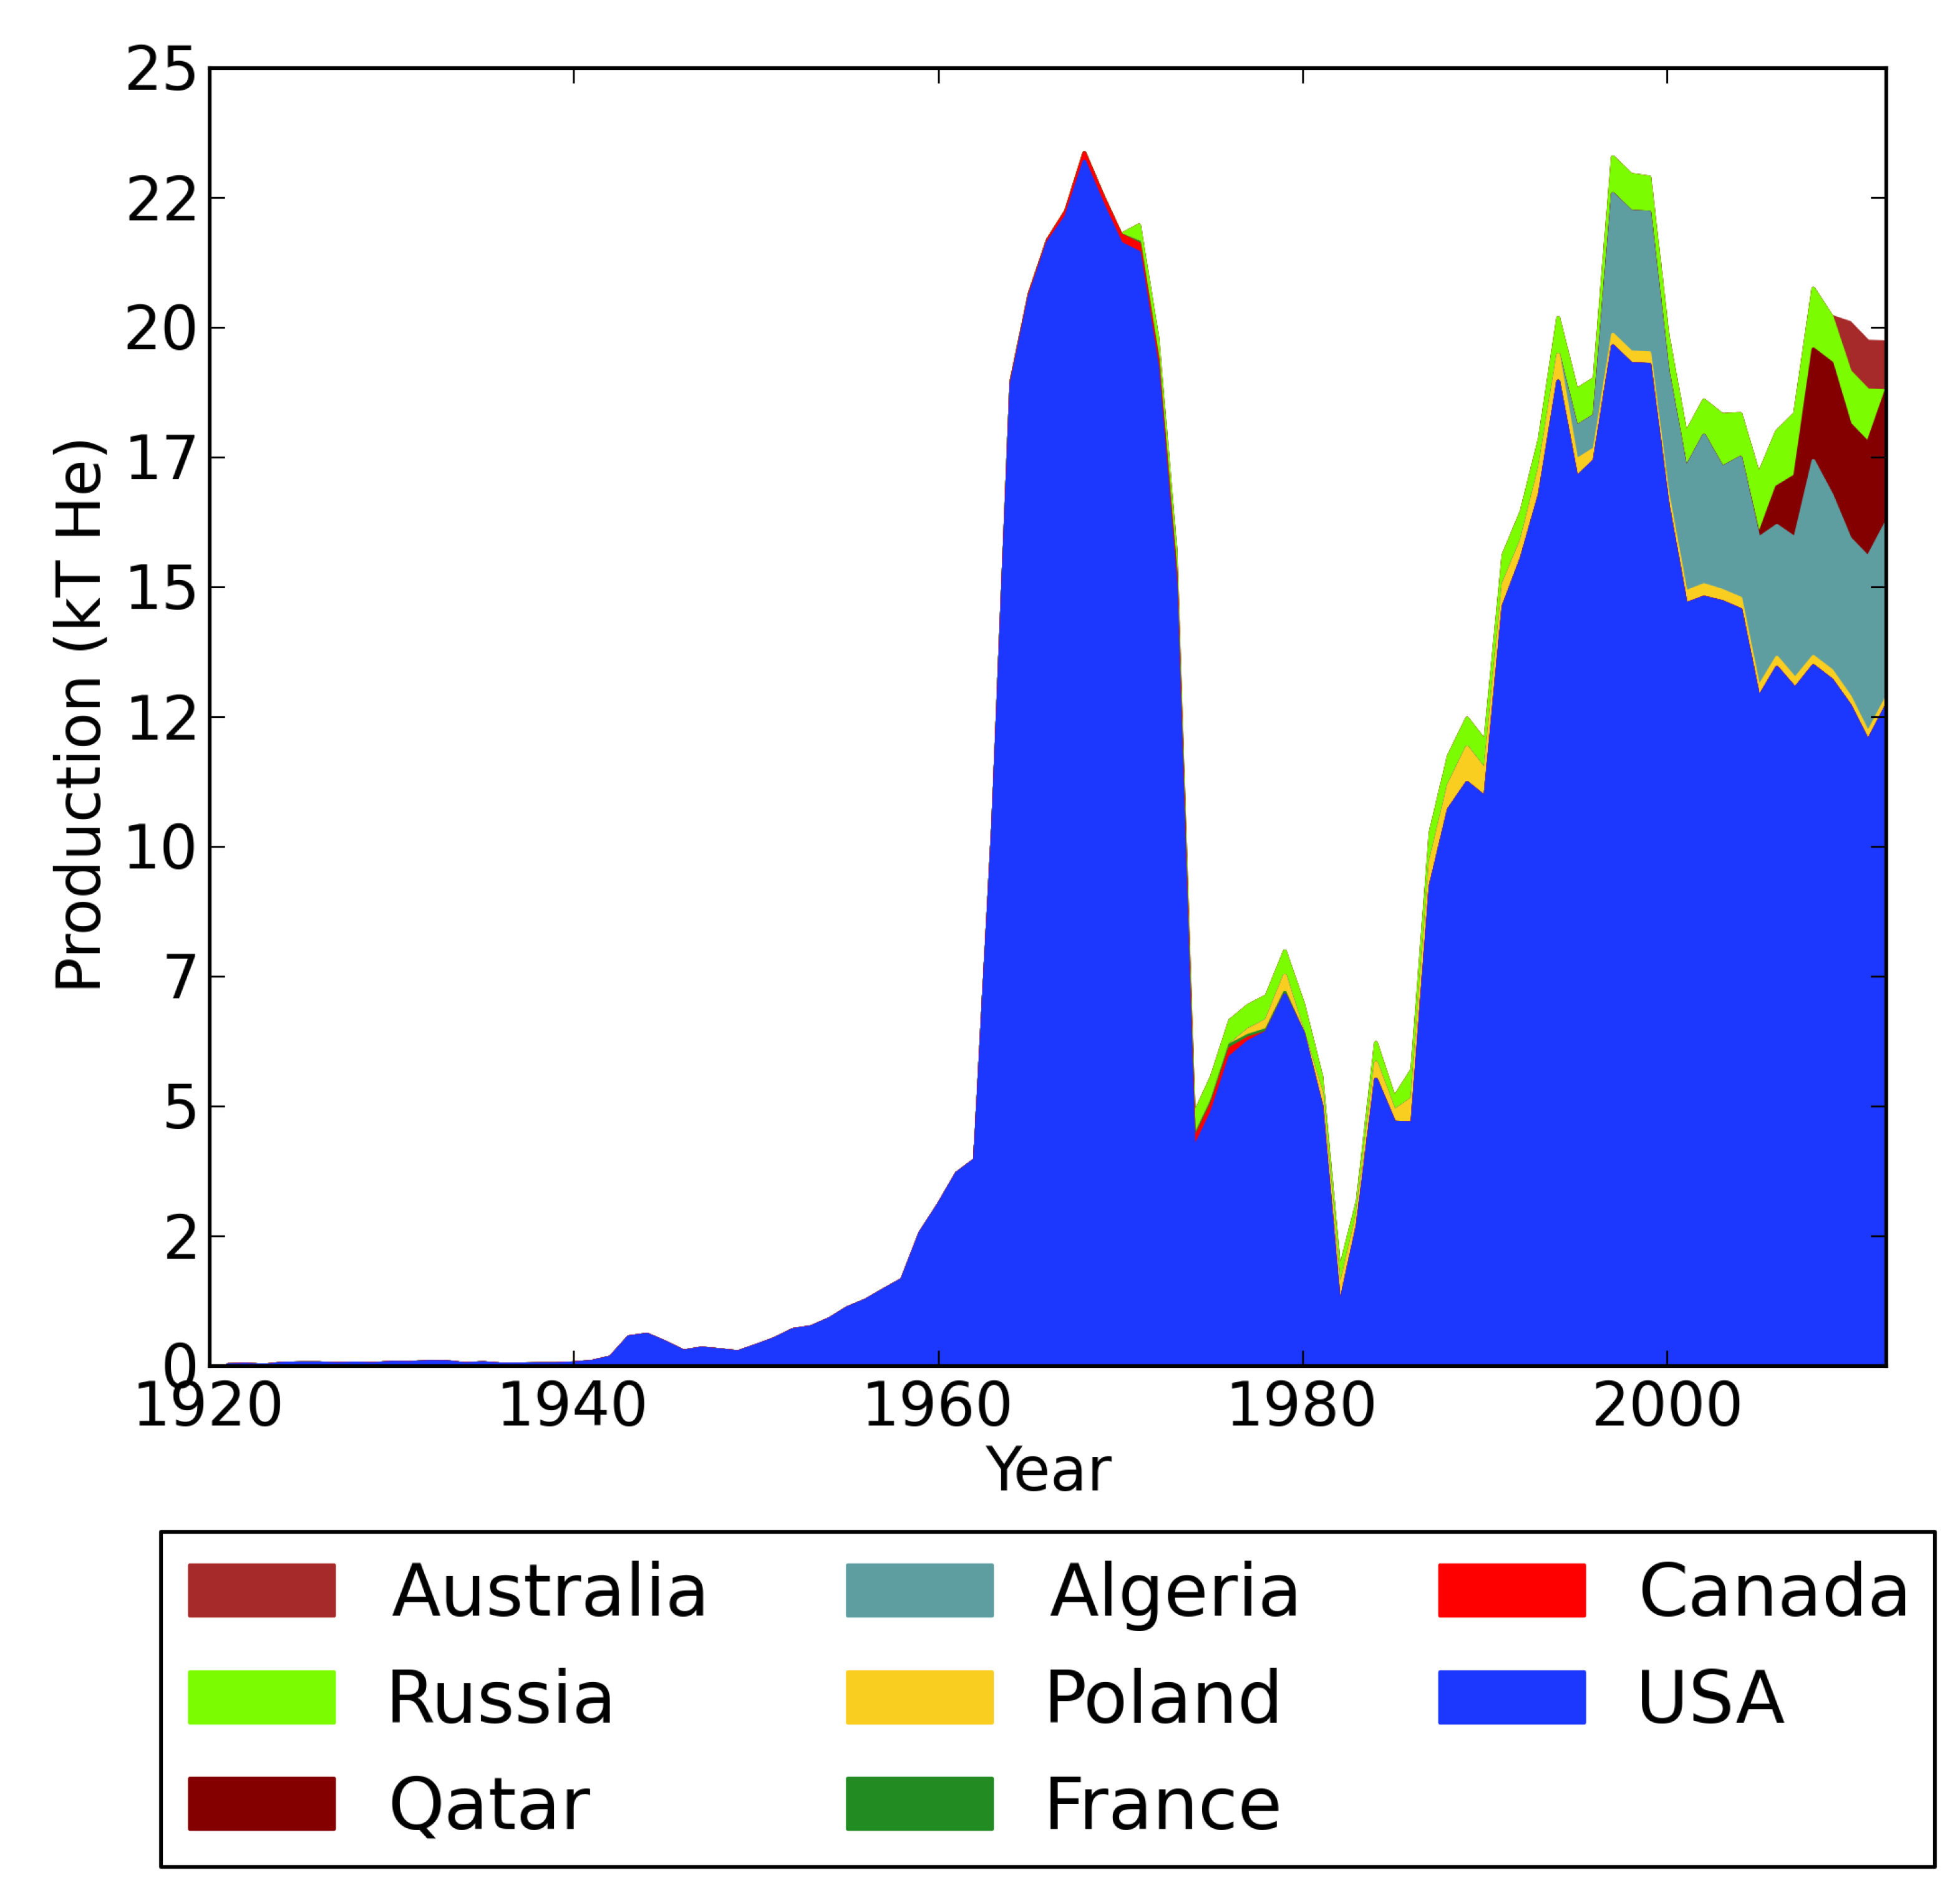
2. Historical Helium Production
2.1. Australia
2.2. Poland and Russia
- 1977–1979: The production for Poland and Russia combined is known [2]. It is assumed that Russia continues to produces 100 million cubic feet per year (≈470 t/year), which corresponds to the Russian production in 1976, and the rest of the production is attributed to Poland.
- 1980: The polish production plant was damaged in December, 1979, and came online late in 1980; hence it is assumed that all production for the non-free world in [2] is attributed to Russia.
- 1981–1985: The production for Poland and Russia combined is known from United States Geological Survey [2]; it is assumed that the Poland to Russia production ratio is 10:12.
- 1986–1988: No production numbers can be found in the literature. It is assumed that production is 100 million cubic feet per year (≈470 t/year) for Poland and 120 million cubic feet per year (≈360 t/year) for Russia, based on the production numbers before and after this period.
- 1989–1993: The Polish production numbers were obtained from Czapigo-Czapla [19]. Production numbers for Russia could not be determined and were estimated to be 120 million cubic feet per year (≈360 t/year) based on the production numbers before and after this period.
2.3. Canada
2.4. France
2.5. Algeria
2.6. Qatar
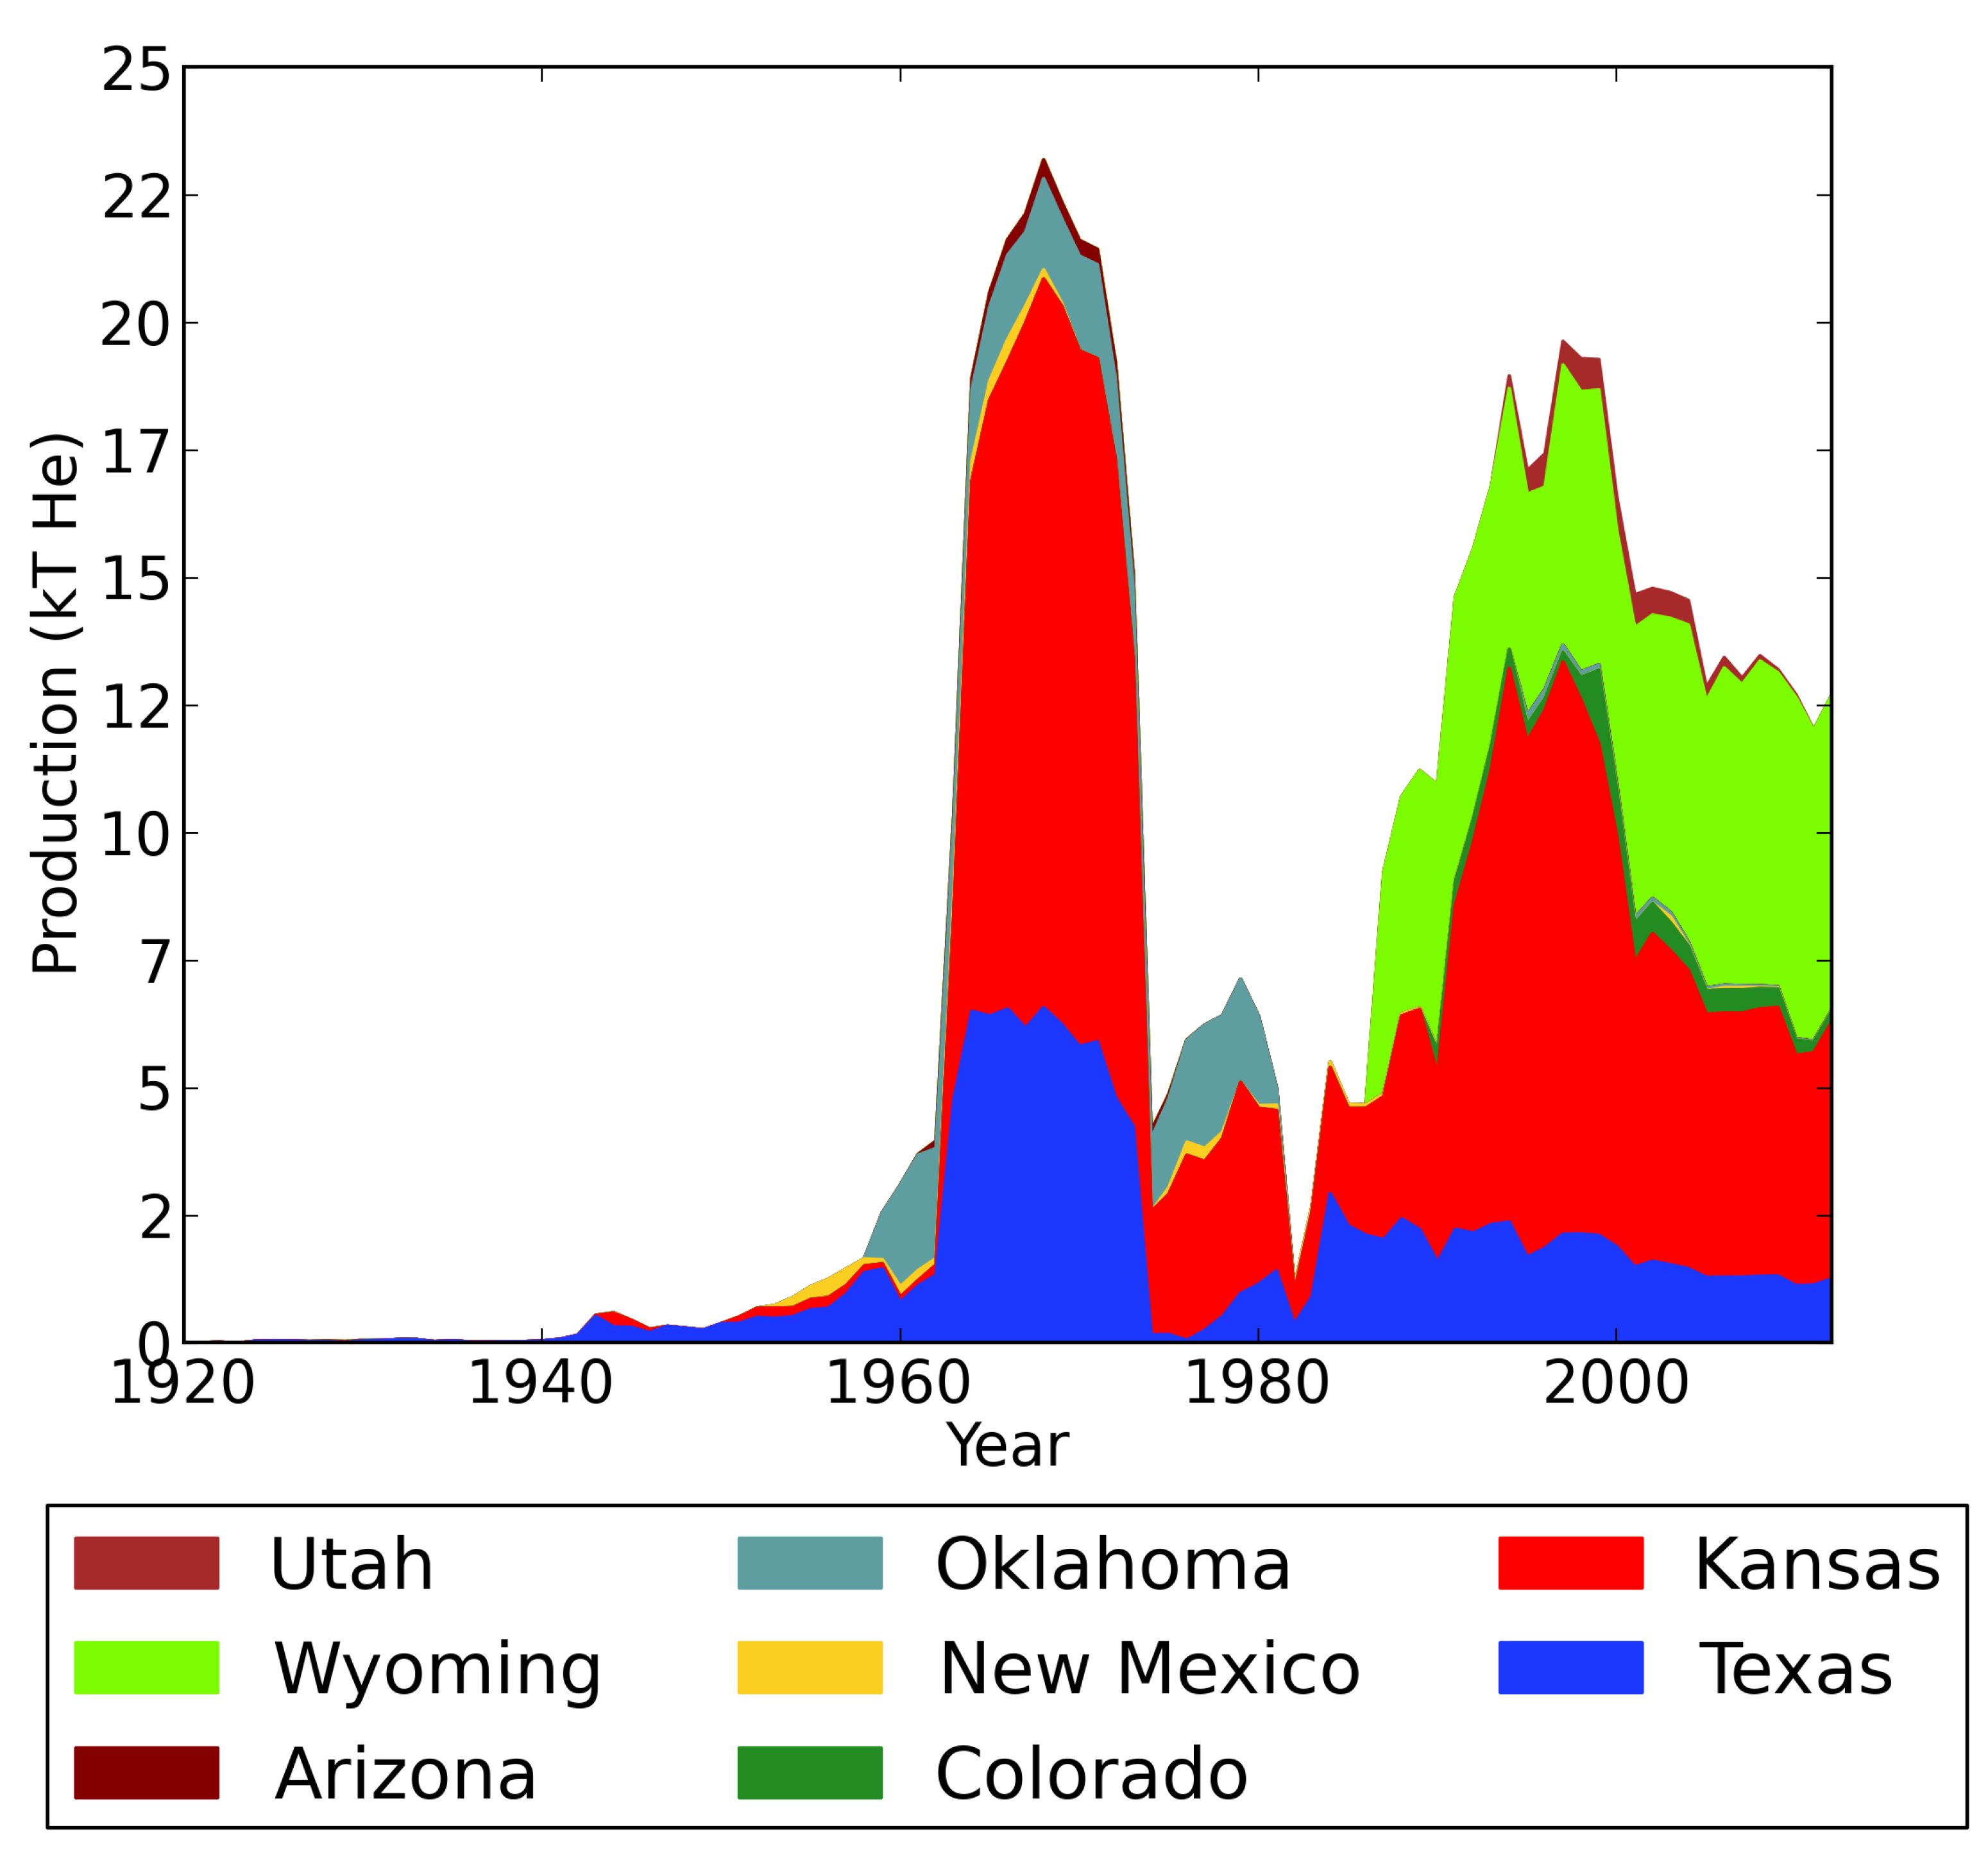
2.7. USA
2.7.1. Arizona
2.7.2. Colorado
- 1929–1930: During 1929 and 1930, 14 t of helium were produced [2], and this has been proportionally divided be each year based on the months of operation.
- 1990–1997: Production data between 1990 and 1997 could not be sourced and, hence, have been estimated. It is believed that during this period, the Archer plant was operating, and the following estimates were assumed: 1990, 469; 1991, 469; 1992, 469; 1993, 469; 1994, 376; 1995, 329; 1996, 235; 1997, 188. These numbers were assumed to give the Archer plant a production profile similar to the EnCana plant in Utah and the Ladder Creek plant in Colorado.
- 1998–2012: Since 1998, sales of helium from the Archer helium plant and Ladder Creek gas plant are available from Colorado Oil and Gas Conservation Commission [21]. The data is the monthly reporting data from the individual gas plants [21]. For the Archer helium plant, the sales included the units of the numbers. For the Ladder Creek plant, the sales data do not include units; as a result, the conversion of sales data to kilotonnes of helium produced was based on the knowledge that 9.7 kt of helium was produced in 2005 [22]. It is assumed that sales data are a good approximation to the production data, as the plants are not connected to the U.S. federal reserve pipeline [9].
2.7.3. Kansas and Texas
- 1921–1950: The production in Kansas came from the two small gas plants operating during 1927 to 1930 and 1943 to 1946. The cumulative production for these plants were known [2], and annual production numbers were estimated by proportioning production into the different years based on the months the plants operated. The production for Texas during this time was taken to be total USA production minus Kansas and Colorado production, as these were the only three states engaged in helium production.
- 1951–1973: During this time, annual helium production is available [22]. However, between 1959 and 1962, total USA production of helium from United States Geological Survey [22] is higher than from United States Geological Survey [2]. Helium production in Texas and Kansas in 1962 is available [2] and was used for 1962 production numbers. The production numbers from United States Geological Survey [22] between 1959 and 1961 for Texas were scaled to account for the discrepancy in total USA production from the two sources. The production numbers for Kansas were not scaled, as the 1962 for the two sources agreed.
- 1974–1976: During this period, production data for Texas is known [22], and Kansas production is taken as the difference between USA production and all other states’ production.
- 1977–1981: As production data is withheld for 1977–1981, the production for Kansas plus Texas is determined by the USA total minus all other states, and the proportion of production assigned to Kansas and Texas is determined by a linear extrapolation between the ratio in 1976 and 1982.
- 1982–1983: As crude production in Texas is withheld, the production for Kansas plus Texas is determined by the USA total minus all other states, and the proportion of production assigned to Kansas and Texas is determined by the ratio of the high purity production in those states [22].
- 1984: The production data in United States Geological Survey [22] includes production from stored production; hence, this data cannot be used directly. As a result, production in Kansas is taken as the ratio of increase in high purity plus crude production between 1983 and 1984 [22]. The production for Texas was assumed to be the USA total minus all other states’ production.
- 1985–1992: As production data is withheld for 1985–1992, the production for Kansas plus Texas is determined by the USA total minus all other states, and the proportion of production assigned to Kansas and Texas is determined by a linear extrapolation between the ratio in 1984 and 1993.
- 1993–1995: The production data in United States Geological Survey [22] includes helium from stored production; hence, the production for Kansas plus Texas is determined by the USA total minus all other states, and the proportion of production assigned to Kansas and Texas is determined by the ratio of the crude production in those states from United States Geological Survey [22].
- 1996–2000: As crude production data is withheld for 1996–2000, the production for Kansas plus Texas is determined by the USA total minus all other states, and the proportion of production assigned to Kansas and Texas is determined by a linear extrapolation between the ratio in 1995 and 2001.
- 2001: For 2001, the crude production of helium for Texas and Kansas individually is known and is within a 1% difference of the USA minus all other states’ production. As a result, the crude production values have been used.
- 2002–2012: The total production in Kansas and Texas was known by taking the USA total production minus all other states’ production. Further, in 2001, Kansas produced four times as much crude helium as Texas [22]. Texas’s and Kansas’s individual productions were estimated by assuming the four-to-one ratio remains the same. This is likely to lead to large errors in helium production for either Kansas or Texas; however, the combined production for the two states is correct.
2.7.4. New Mexico
- 1944: The production of 10.5 t of helium occurred at Shiprock, New Mexico, for the war effort [2].
- 1953–1970: Annual helium production statistics are available [22].
- 1975–1991: The production of helium occurred in each year between 1975 and 1991, with the exception of 1979 [2,22]. The production volumes of helium for these years were withheld [22]. It is known that the Beautiful Mountain and Big Gap Organ Rock reservoirs were discovered in 1975 and 1980, respectively. Both the cumulative production from these reservoirs and the helium content are known [23]. Helium production was estimated by assuming that Beautiful Mountain produced between 1975 and 1978 and Big Gap Organ Rock produced between 1980 and 1991. Annual production for these years was approximated by taking the total production to be the raw gas multiplied by the average gas content and assuming a typical gas reservoir production profile (sharp increase to a plateau followed by exponential decay, as indicated by Utah, Oklahoma and Colorado).
- 2001–2009: Annual production statistics from helium producing wells were obtained from New Mexico Tech [24]. The helium content of the these wells is known [23], and hence, the raw helium produced could be estimated. Although actual production statistics could not be sourced, these wells contained only trace amounts of hydrocarbons and were dedicated helium wells; hence, actual production is likely to be similar to raw production.
2.7.5. Oklahoma
- 1959–1981: During this time, annual helium production is available [22], with some exceptions: first, in 1977, the production numbers are withheld (hence, the production in that year was estimated), and between 1959 and 1962, the total USA production of helium from United States Geological Survey [22] is higher than from United States Geological Survey [2]. Helium production in Oklahoma in 1962 is available [2] and was used for 1962 production numbers. As with Kansas and Texas, the production numbers [22] between 1959 and 1961 were scaled to account for the discrepancy in the total USA production from the two sources.
- 1995–2012: The production of helium in Oklahoma resumed in 1995 [2,22]. Monthly raw gas production data by individual gas wells was obtained from Oklahoma Corporation Commission, Oil and Gas Division [25]. Between 1995 and 2008, the buyer of the raw gas was available, and the raw gas going to two gas plants that refined helium could be estimated. Between 2008 and 2012, the production for DCP Midstream Energy was obtained [25], and this company operated the only helium gas plant operational in Oklahoma during this time. These two sources agree well for the monthly production numbers in 2008 and were combined to obtain the raw gas produced in Oklahoma. The average helium content of the gas was estimated to be 1.85% [23]. As a result, the raw helium produced could be estimated for Oklahoma between 1995 and 2012. It is likely that actual helium production is lower than the raw helium production, as the helium produced is a by-product of natural gas; hence, some of the helium may have been vented.
2.7.6. Utah
2.7.7. Wyoming
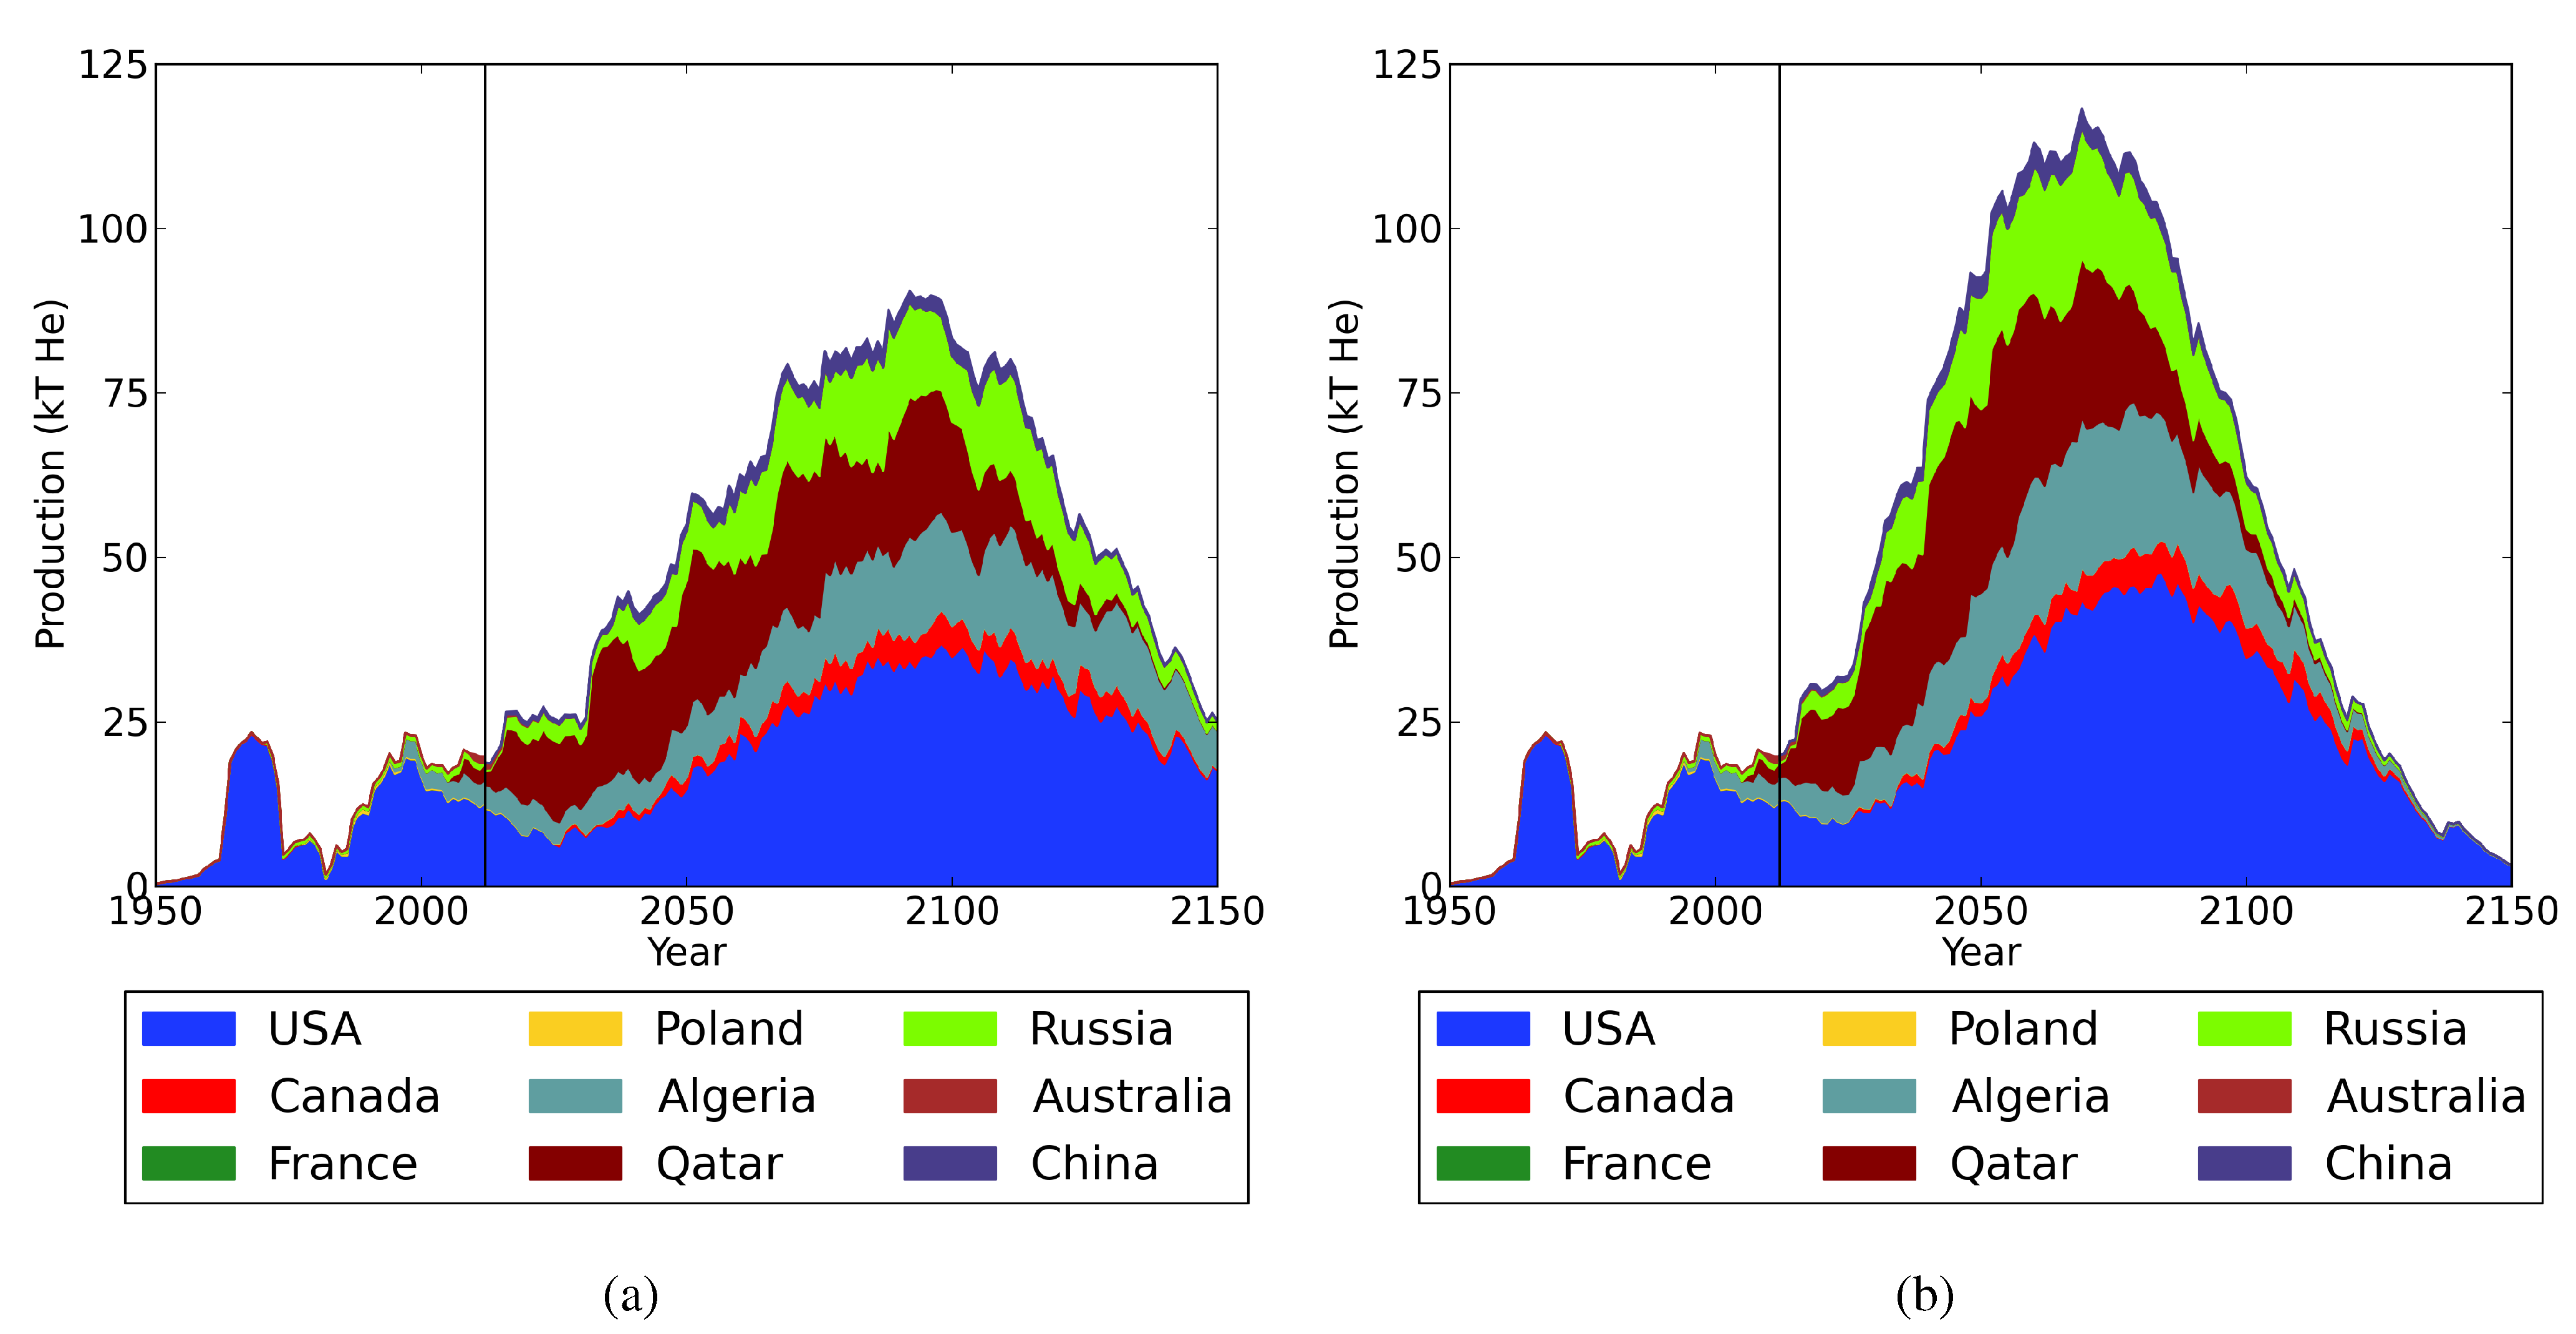
3. Helium Projections Using Country and Regional USA Data
3.1. Helium URR
4. Results and Discussion

| Region | Cumulative Production | Resources | URR |
|---|---|---|---|
| Mid Continent | 518 1 | 1629 | 2146 |
| Rocky Mountains | 169 2 | 1533 | 1702 |
| Atlantic | 0 | 156 | 156 |
| Gulf Coast | 0 | 76 | 76 |
| Alaska | 0 | 45 | 45 |
| North Central | 0 | 34 | 34 |
| Pacific | 0 | 19 | 19 |
| USA | 687 | 3491 | 4178 |
| Country | Cumulative Production | Resources (kt He) | Reference | URR |
|---|---|---|---|---|
| USA | 687 | 3491 | [30] | 4178 |
| Qatar | 14 | 1710 | [5] | 1723 |
| Algeria | 47 | 1388 | [5] | 1435 |
| Russia | 26 | 1151 | [5] | 1177 |
| Canada | 2 | 339 | [5] | 340 |
| China | 0 | 186 | [5] | 186 |
| Poland | 10 | 5 | [19] | 15 |
| Australia | 3 | 5 | Estimated 1 | 8 |
| World | 789 | 8275 | 9064 |


5. Conclusions
Electronic Supplementary Information
Acknowledgements
Conflicts of Interest
References
- Thomas, A. Medical Imaging: Why Helium Prevails. In The Future of Helium as a Natural Resource; Nuttall, W.J., Clarke, R.H., Glowacki, B.A., Eds.; Routledge: London, UK, 2012. [Google Scholar]
- United States Geological Survey. Formerly U.S. Bureau of Mines: Minerals Yearbook (1932–1993). Available online: http://minerals.usgs.gov/minerals/pubs/usbmmyb.html (accessed on 3 March 2014).
- Bradshaw, A.M.; Hamacher, T. Nuclear fusion and the helium supply problem. Fusion Eng. Des. 2013, 88, 2694–2697. [Google Scholar] [CrossRef]
- Clarke, R.H.; Cai, Z. Helium and Fusion Energy. In The Future of Helium as a Natural Resource; Nuttall, W.J., Clarke, R.H., Glowacki, B.A., Eds.; Routledge: London, UK, 2012. [Google Scholar]
- United States Geological Survey. Mineral Commodity Summaries. Available online: http://minerals.usgs.gov/minerals/pubs/mcs/ (accessed on 15 September 2013).
- McGuire, P. Federal Agency Begins Implementing Helium Stewardship Act; Offers Crude Helium at Revised Price of $95 per Mcf. Available online: http://www.blm.gov/nm/st/en/info/news_re-leases0/2013/december/federal agency begins.html (accessed on 3 March 2014).
- Scurlock, R.; Francis, A. Is There a Helium Problem? Ways Forward. In The Future of Helium as a Natural Resource; Nuttall, W.J., Clarke, R.H., Glowacki, B.A., Eds.; Routledge: London, UK, 2012. [Google Scholar]
- Cai, Z.; Clarke, R.H.; Glowacki, B.A.; Nuttall, W.J.; Ward, N. Ongoing ascent ot the helium production plateau—Insights from system dynamics. Resour. Policy 2010, 35, 77–89. [Google Scholar] [CrossRef]
- Glowacki, B.A.; Nuttall, W.J.; Clarke, R.H. Beyond the helium conundrum. IEEE Trans. Appl. Supercond. 2013, 23. [Google Scholar] [CrossRef]
- Nuttall, W.J.; Clarke, R.H.; Glowacki, B.A. Stop squandering helium. Nature 2012, 485, 573–575. [Google Scholar] [CrossRef]
- Clarke, R.H.; Clare, R. Helium from the Air: The Backstop. In The Future of Helium as a Natural Resource; Nuttall, W.J., Clarke, R.H., Glowacki, B.A., Eds.; Routledge: London, UK, 2012. [Google Scholar]
- Mohr, S. Projection of World Fossil Fuel Production with Supply and Demand Interactions. Ph.D. Thesis, University of Newcastle, Newcastle, Australia, 2010. [Google Scholar]
- Campbell, C.J.; Heaps, S. An Atlas of Oil and Gas Depletion, 2nd ed.; Jeremy Mills Publishing Limited: Yorkshire, UK, 2009. [Google Scholar]
- Zittel, W.; Schindler, J. Crude Oil: The Supply Outlook; Technical Report EWG-Series No 3/2007; Energy Watch Group: Berlin, Germany, 2007. [Google Scholar]
- Kelly, T.D.; Matos, G.R. Historical Statistics for Mineral and Material Commodities in the United States; Supersedes Open-File Report 01-006; Kelly, T.D., Matos, G.R., Eds.; United States Geological Survey: Reston, VI, USA, 2011. [Google Scholar]
- Department of Resources, Energy and Tourism, Australian Government. Timor Sea Joint Petroleum Development Area. Available online: http://www.petroleum-acreage.gov.au/2008/site/page32.htm (accessed on 3 March 2014).
- Heiser, A. East timor and the joint petroleum development area. Marit. Law Assoc. Aust. N. Z. J. 2003, 17, 54–79. [Google Scholar]
- Linde Kryotechnik AG. Inauguration of First Helium Purification & Liquefaction Plant of the Southern Hemisphere at Darwin, Australia. Available online: http://www.linde-kryotechnik.ch/1259/1260/1275/1276/1506.asp (accessed on 3 March 2014).
- Czapigo-Czapla, M. Helium. Available online: http://geoportal.pgi.gov.pl/surowce/energetyczne/hel/2012 (accessed on 3 March 2014).
- Rauzi, S.L. Review of Helium Production and Potential in Arizona; Technical Report Open-File Report OFR 03-05; Arizona Geological Survey: Tucson, AZ, USA, 2003. [Google Scholar]
- Colorado Oil and Gas Conservation Commission. Monthly Gas Plant Reports for Ladder Creek and Archer Helium Plants (1998–2012). Available online: http://cogcc.state.co.us/ (accessed on 3 March 2014).
- United States Geological Survey. State Minerals Statistics and Information. Available online: http://minerals.usgs.gov/minerals/pubs/state/ (accessed on 3 March 2014).
- Broadhead, R.F.; Gillard, L. Helium in New Mexico Geologic Distribution and Exploration Possibilities; Technical Report Open File Report No. 483; New Mexico Bureau of Geology and Mineral Resources: Socorro, NM, USA, 2004. [Google Scholar]
- New Mexico Tech. GOTECH; Online Database. 2013. Available online: http://gotech.nmt.edu/gotech/Petroleum Data/General.aspx (accessed on 3 March 2014).
- Oklahoma Corporation Commission, Oil and Gas Division. Oil and Gas Data Files: Historical.zip. Available online: http://www.occeweb.com/og/ogdatafiles2.htm (accessed on 3 March 2014).
- Utah Oil and Gas Web Page. Gas Plant Summary Data. Available online: http://oilgas.ogm.utah.gov/Data_Center/DataCenter.cfm (accessed on 3 March 2014).
- Wyoming Oil and Gas Commission. Gas Plant Form 9 for Labarge-Shute Creek; Online Repository, 1987–2012. Available online: http://wogcc.state.wy.us/ (accessed on 3 March 2014).
- Mohr, S.; Evans, G.M. Long term forecasting of natural gas production. Energy Policy 2011, 39, 5550–5560. [Google Scholar] [CrossRef]
- Mohr, S. Geologic Resource Supply-Demand Model (GeRS-DeMo). Available online: http://cfsites1.uts.edu.au/find/isf/publications/Betaversion.zip (accessed on 3 March 2014).
- Pacheco, N.; Ali, S.F. Helium Resources of the United States—2007; Technical Note 429; Bureau of Land Management, U.S. Department of the Interior: Washington, DC, USA, 2008. [Google Scholar]
- ConocoPhillips; Darwin LNG. Bayu-Undan, Pipline and Darwin LNG Projects. Available online: http://www.tokyo-gas.com.au/Bayu-Undan&Darwin-LNG.pdf (accessed on 3 March 2014).
© 2014 by the authors; licensee MDPI, Basel, Switzerland. This article is an open access article distributed under the terms and conditions of the Creative Commons Attribution license (http://creativecommons.org/licenses/by/3.0/).
Share and Cite
Mohr, S.; Ward, J. Helium Production and Possible Projection. Minerals 2014, 4, 130-144. https://doi.org/10.3390/min4010130
Mohr S, Ward J. Helium Production and Possible Projection. Minerals. 2014; 4(1):130-144. https://doi.org/10.3390/min4010130
Chicago/Turabian StyleMohr, Steve, and James Ward. 2014. "Helium Production and Possible Projection" Minerals 4, no. 1: 130-144. https://doi.org/10.3390/min4010130
APA StyleMohr, S., & Ward, J. (2014). Helium Production and Possible Projection. Minerals, 4(1), 130-144. https://doi.org/10.3390/min4010130