Three Compositional Varieties of Rare-Earth Element Ore: Eudialyte-Group Minerals from the Norra Kärr Alkaline Complex, Southern Sweden

Abstract
:1. Introduction
1.1. Agpaitic Rocks and Their Mineralogy

| Mineral | Formula |
|---|---|
| Arfvedsonite | [Na][Na2][Fe2+4Fe3+]Si8O22(OH)2 |
| Catapleiite | Na2ZrSi3O9·H2O |
| Eckermannite 1 | [Na][Na2][(Mg,Fe2+)4Al](Si8O22)(OH)2 |
| Lorenzenite | Na2Ti2(Si2O6)O3 |
| Mosandrite 2 | Ti(☐,Ca,Na)3(Ca,REE)4(Si2O7)2(H2O,OH,F)4·~1H2O |
| Pectolite | NaCa2(HSi3O9) |
| Rosenbuschite | (Ca,Na)3(Zr,Ti)Si2O7FO |
| Willemite | Zn2SiO4 |
| Wöhlerite | NaCa2(Zr,Nb)(Si2O7)(O,OH,F)2 |
1.2. Eudialyte-Group Minerals
| Mineral | Formula |
|---|---|
| Eudialyte | Na15Ca6(Fe,Mn)3Zr3Si(Si25O73)(O,OH,H2O)3(OH,Cl)2 |
| Ferrokentbrooksite | Na15Ca6Fe3Zr3Nb(Si25O73)(O,OH,H2O)3(F,Cl)2 |
| Kentbrooksite | Na15Ca6Mn3Zr3Nb(Si25O73)(O,OH,H2O)3(F,Cl)2 |
| Oneillite | Na15Ca3Mn3Fe3Zr3Nb(Si25O73)(O,OH,H2O)3(OH,Cl)2 |
| Zirsilite-(Ce) | (Na,☐)12(REE,Na)3Ca6Mn3Zr3Nb(Si25O73)(OH)3(CO3)·H2O |
| Mineral | M(1,1b) | M(1a) | M(2) | M(3) | M(4) | N(1,2,3,5) | N(4) | X |
|---|---|---|---|---|---|---|---|---|
| Eudialyte | Ca | Fe | Si | Si | Na | Na | Cl | |
| Ferrokentbrooksite | Ca | Fe2+ | Nb | Si | Na | Na | Cl | |
| Kentbrooksite | Ca | Mn | Nb | Si | Na | Na | F | |
| Oneillite | Ca | Mn | Fe | Nb | Si | Na | Na | OH |
| Zirsilite-(Ce) | Ca | Mn | Nb | Si | Na | REE | CO2, OH |

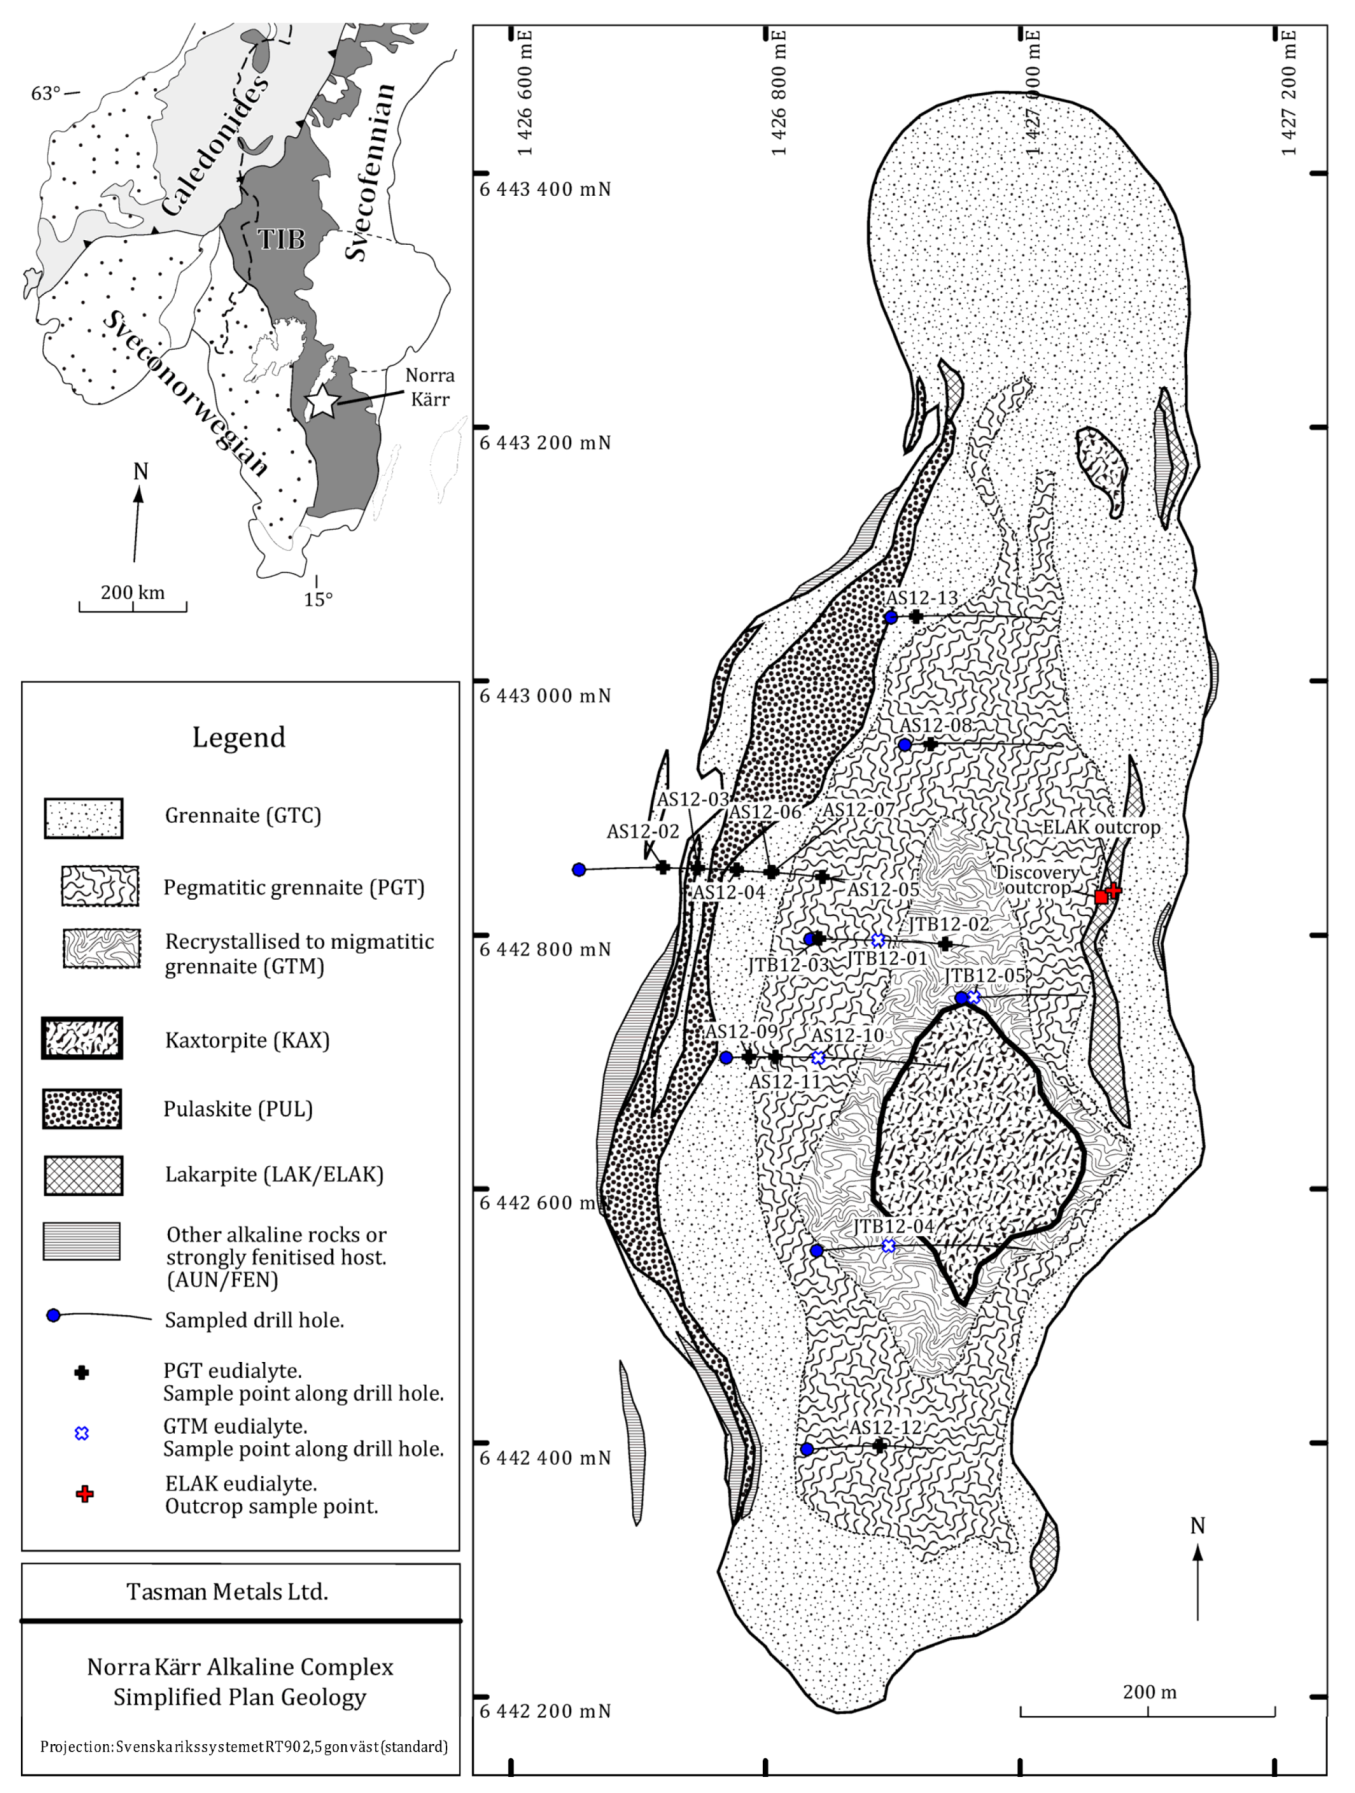
1.3. The Norra Kärr Alkaline Complex

1.3.1. Grennaite
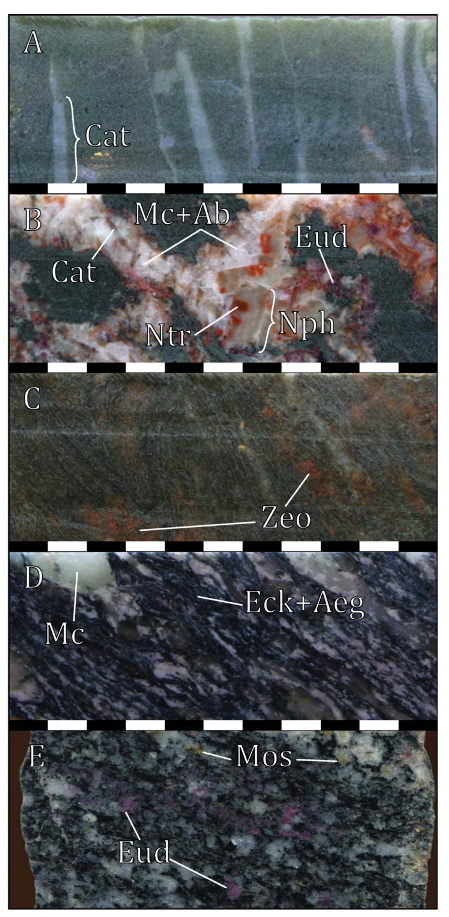

1.3.2. Kaxtorpite
1.3.3. Lakarpite
1.3.4. Pulaskite
1.4. Exploration History
2. Methods
| Sample | Core | Depth (m) | Tasman Unit |
|---|---|---|---|
| AS12-01 | Field Sample 1 | 0 | ELAK |
| AS12-02 | NKA12062 | 106.5 | PGT |
| AS12-03 | NKA12062 | 146.5 | PGT |
| AS12-04 | NKA12062 | 198.5 | PGT |
| AS12-05 | NKA12062 | 299.9 | PGT |
| AS12-06 | NKA12062 | 251.5 | PGT |
| AS12-07 | NKA12062 | 252.5 | PGT |
| AS12-08 | NKA12067 | 30.8 | PGT |
| AS12-09 | NKA11039 | 27.0 | PGT |
| AS12-10 | NKA11039 | 113.0 | GTM |
| AS12-11 | NKA11039 | 62.0 | PGT |
| AS12-12 | NKA10011 | 89.3 | PGT |
| AS12-13 | NKA12069 | 28.8 | PGT |
| JTB12-01 | NQ12004 | 71.5 | GTM |
| JTB12-02 | NQ12004 | 158.4 | PGT |
| JTB12-03 | NQ12004 | 12.5 | PGT |
| JTB12-04 | NKA12075 | 90.4 | GTM |
| JTB12-05 | NKA12071 | 16.3 | GTM |
2.1. Whole-Rock Composition
2.2. Electron Microprobe Analysis by Wavelength Dispersive X-Ray Spectrometry (WDS-EMP)
2.3. Scanning Electron Microscopy by Energy Dispersive Spectrometry (SEM-EDS)
3. Results
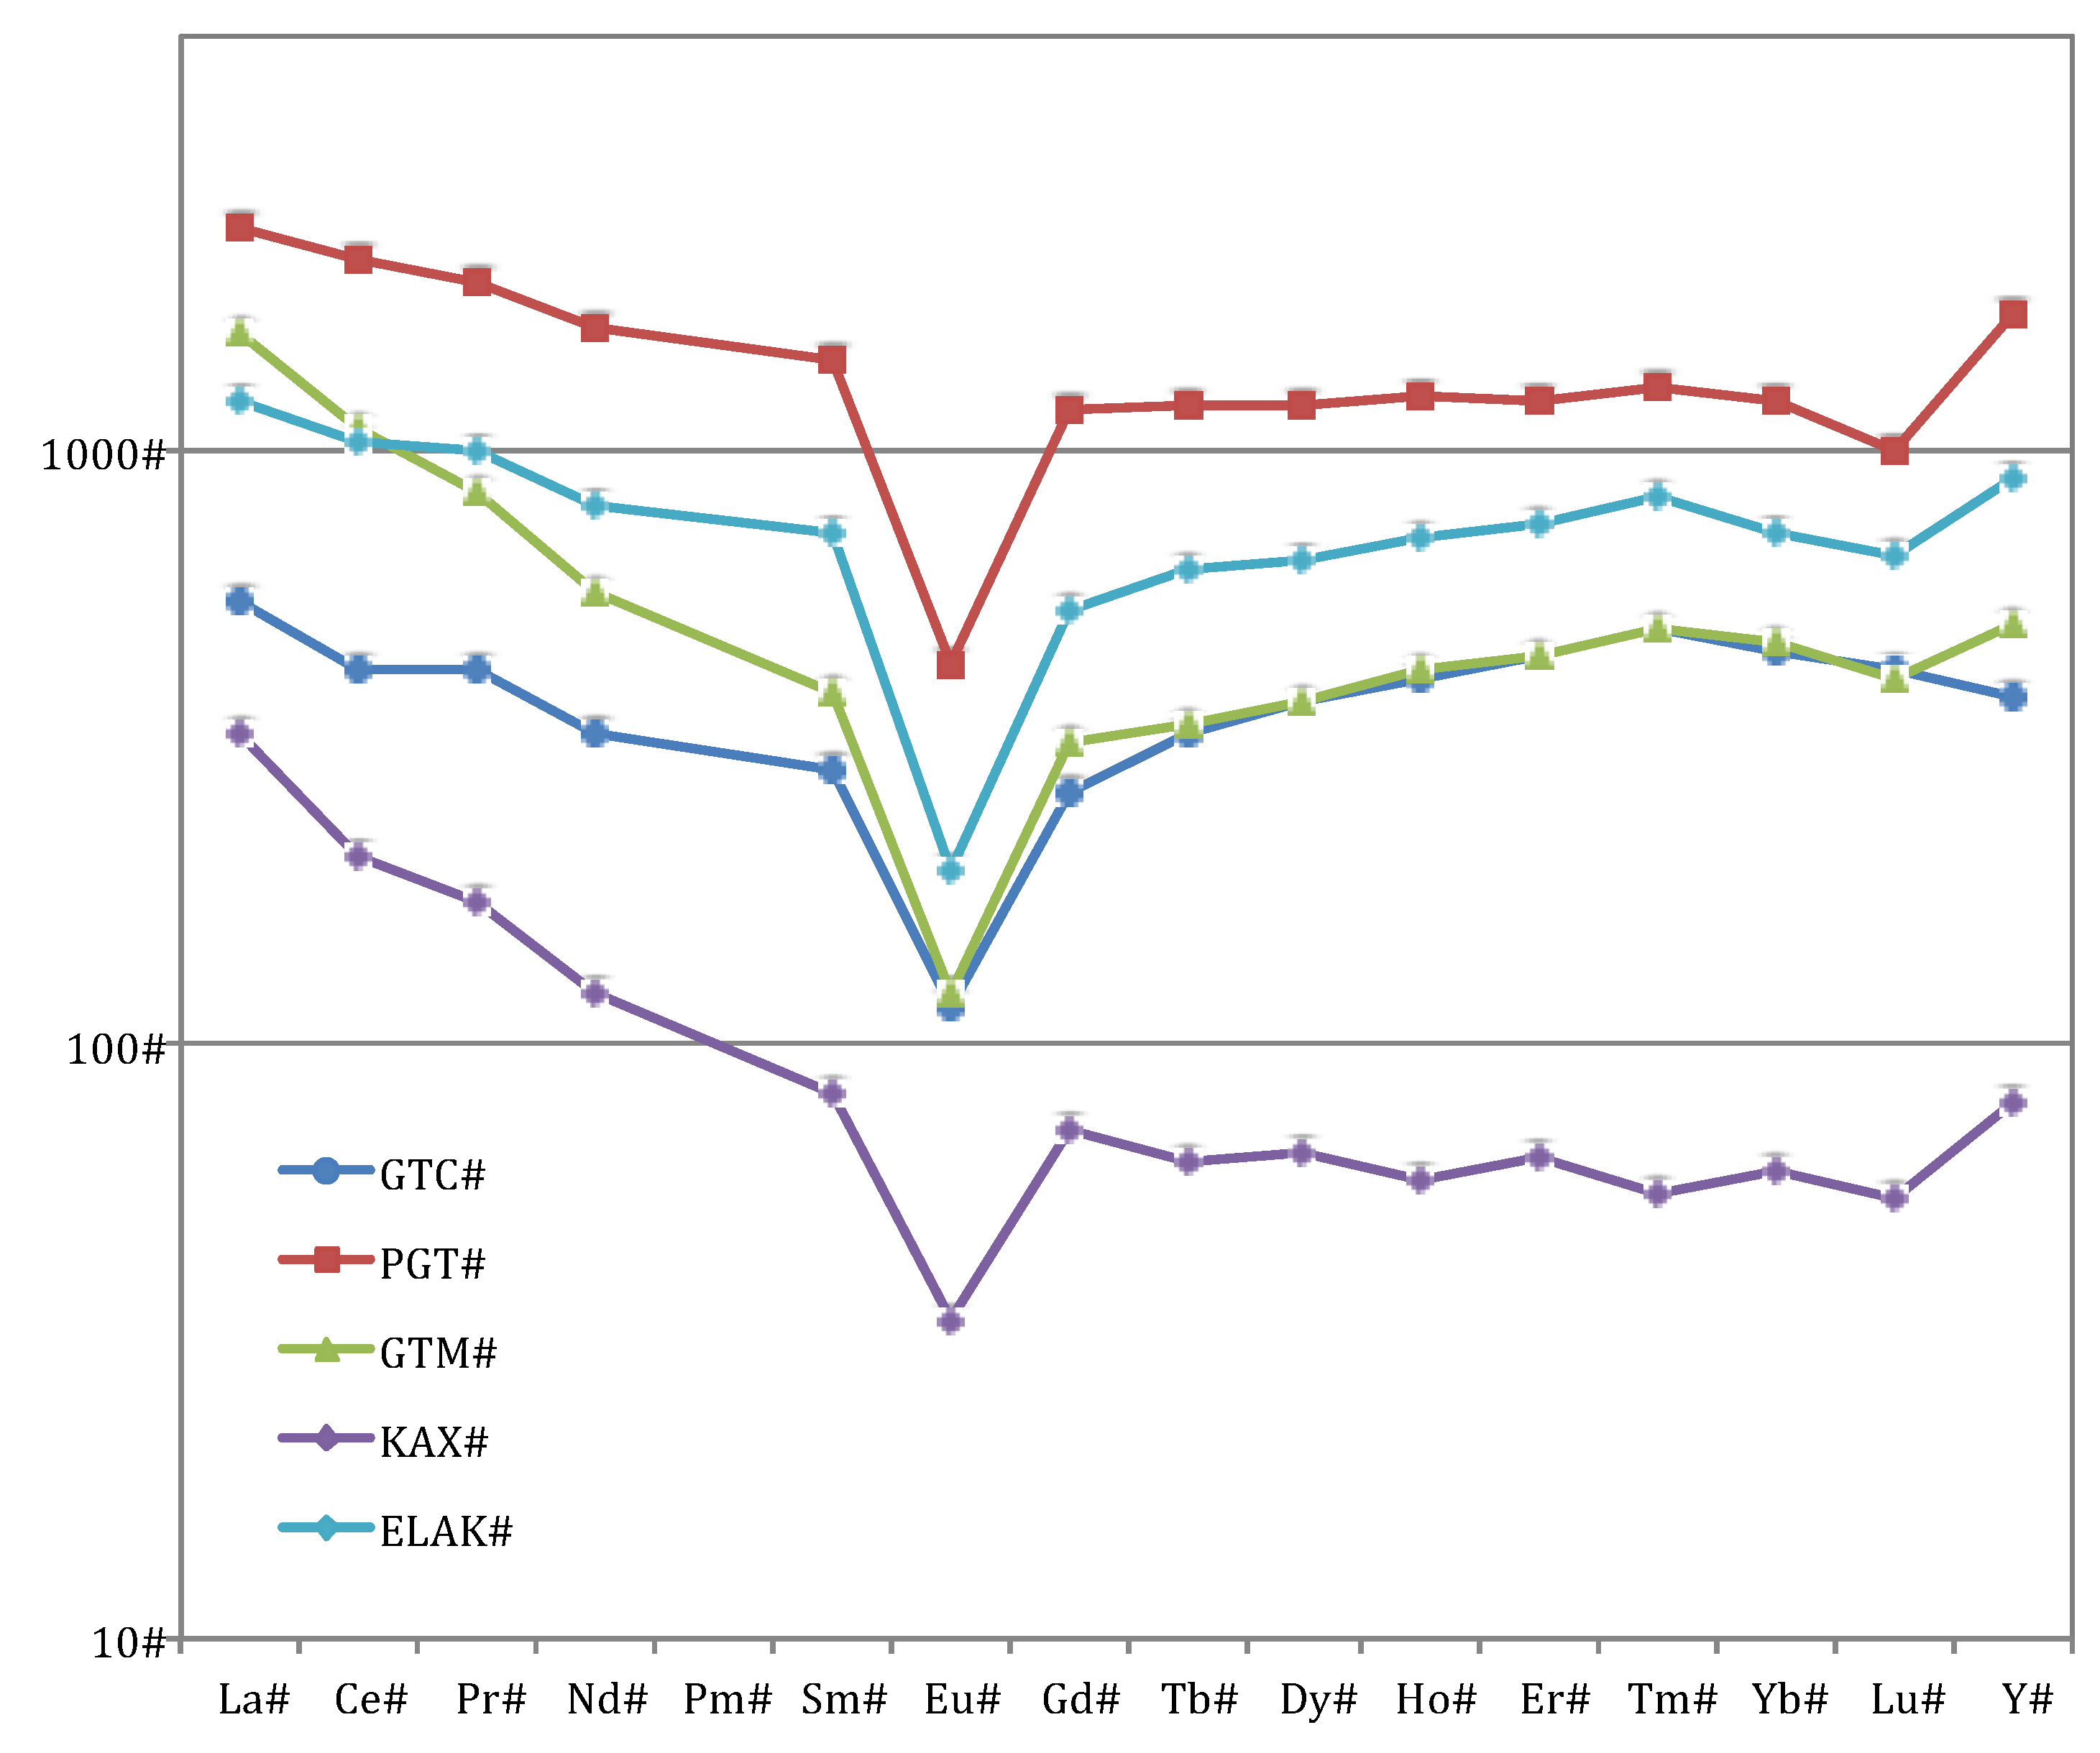
3.1. Whole-Rock Composition
| Sample | Grennaite | Kaxtorpite | Lakarpite | ||
|---|---|---|---|---|---|
| GTC 400269 wt % | PGT 407497 wt % | GTM 407575 wt % | KAX 401205 wt % | ELAK 407810 wt % | |
| SiO2 | 57.13 | 55.10 | 55.30 | 57.67 | 59.80 |
| TiO2 | 0.01 | 0.08 | 0.08 | 0.56 | 0.06 |
| ZrO2 | 1.58 | 2.23 | 1.35 | 0.098 | 1.61 |
| Al2O3 | 19.46 | 16.65 | 17.50 | 15.46 | 14.30 |
| Fe2O3 | 4.41 | 6.51 | 4.88 | 4.59 | 6.49 |
| MnO | 0.12 | 0.40 | 0.38 | 0.86 | 0.31 |
| MgO | 0.01 | 0.11 | 0.09 | 1.70 | 0.24 |
| CaO | 0.55 | 1.73 | 1.57 | 4.37 | 1.66 |
| Na2O | 11.59 | 12.45 | 9.81 | 8.53 | 10.15 |
| K2O | 3.63 | 2.47 | 3.59 | 3.28 | 3.85 |
| P2O5 | 0.008 | 0.02 | 0.01 | 0.008 | b.d.l. |
| L.O.I. | 1.38 | 3.03 | 3.95 | 2.29 | 1.58 |
| Total | 98.31 | 98.58 | 97.19 | 99.45 | 98.46 |
| A.I. | 1.18 | 1.39 | 1.14 | 1.14 | 1.46 |
| ppm | ppm | ppm | ppm | ppm | |
| V | b.d.l. | 9 | b.d.l. | 58 | 19 |
| Cr | b.d.l. | 50 | 40 | 60 | 30 |
| Co | b.d.l. | b.d.l. | 1.8 | 9.1 | 0.9 |
| Ni | b.d.l. | b.d.l. | b.d.l. | 5 | b.d.l. |
| Cu | b.d.l. | b.d.l. | b.d.l. | 15 | b.d.l. |
| Zn | 124 | 98 | 173 | 1695 | 172 |
| Ga | 86.9 | 91.1 | 110.5 | 62.8 | 56.4 |
| Rb | 272 | 203 | 514 | 237 | 290 |
| Sr | 25.7 | 182.5 | 162 | 350 | 105.5 |
| Y | 816 | 3590 | 1080 | 168.5 | 1895 |
| Nb | 203 | 909 | 213 | 64.4 | 447 |
| Mo | b.d.l. | b.d.l. | b.d.l. | b.d.l. | b.d.l. |
| Ag | b.d.l. | b.d.l. | b.d.l. | b.d.l. | 1 |
| Sn | 52 | 144 | 112 | 21 | 77 |
| Cs | 4.05 | 4.21 | 18 | 13.35 | 1.73 |
| Ba | n.a. | 43.6 | 81.5 | n.a. | 134.5 |
| La | 206 | 873 | 585 | 123.5 | 448 |
| Ce | 411 | 2020 | 1045 | 200 | 995 |
| Pr | 59 | 263 | 118 | 24 | 137 |
| Nd | 237 | 1140 | 409 | 87.1 | 574 |
| Sm | 67 | 328 | 90.4 | 19 | 167.5 |
| Eu | 10 | 38.2 | 10.55 | 3 | 17.05 |
| Gd | 82 | 359 | 98.8 | 22 | 165 |
| Tb | 19.35 | 69.2 | 20.2 | 3.67 | 36.6 |
| Dy | 144 | 453 | 144.5 | 25 | 249 |
| Ho | 35 | 105 | 36.3 | 5 | 61.4 |
| Er | 112 | 305 | 112.5 | 16 | 189.5 |
| Tm | 18 | 45.7 | 17.8 | 2 | 30 |
| Yb | 113.5 | 301 | 118 | 15.25 | 179.5 |
| Lu | 16.3 | 37.9 | 15.65 | 2.09 | 25.2 |
| Hf | 302 | 349 | 240 | 15.6 | 301 |
| Ta | 21.9 | 45.9 | 18.7 | 1.9 | 36.8 |
| W | 3 | 6 | 1 | b.d.l. | 4 |
| Tl | 1.1 | 1.3 | 1.3 | 1 | 0.5 |
| Pb | 168 | 182 | 245 | 249 | 44 |
| Th | 6.11 | 4.95 | 9.22 | 20 | 9.02 |
| U | 5.31 | 7.36 | 22.7 | 9.54 | 4.99 |
| TREO + Y2O3 1 | 0.281 | 1.193 | 0.466 | 0.085 | 0.621 |
| HREO + Y2O3 2 | 59.2% | 54.7% | 43.6% | 37.7% | 56.3% |
3.2. Electron Microprobe Analysis by Wavelength Dispersive X-Ray Spectrometry (WDS-EMP)
| Sample | #69 | #9 | #16 | #20 | #87 | Typical errors |
|---|---|---|---|---|---|---|
| AS12-01 wt % | AS12-02 wt % | AS12-03 wt % | AS12-04 wt % | AS12-05 wt % | 2σ wt % | |
| SiO2 | 49.83 | 47.76 | 47.46 | 47.98 | 47.94 | 0.43 |
| Al2O3 | 0.13 | 0.32 | 0.26 | 0.27 | 0.23 | 0.02 |
| Nb2O5 | b.d.l. | 0.60 | 0.92 | 0.56 | 0.94 | 0.17 |
| ZrO2 | 11.91 | 11.91 | 11.94 | 11.71 | 11.61 | 0.23 |
| HfO2 | 0.22 | 0.37 | 0.36 | 0.23 | 0.35 | 0.04 |
| TiO2 | 0.18 | 0.14 | 0.10 | 0.13 | 0.08 | 0.03 |
| La2O3 | 0.12 | 0.42 | 0.61 | 0.60 | 0.63 | 0.09 |
| Ce2O3 | 0.16 | 1.15 | 1.36 | 1.77 | 1.27 | 0.15 |
| Nd2O3 | b.d.l. | 0.81 | 0.70 | 1.00 | 0.65 | 0.15 |
| Y2O3 | 0.50 | 3.14 | 3.01 | 3.04 | 3.18 | 0.09 |
| FeO | 5.47 | 3.07 | 3.07 | 3.03 | 2.51 | 0.09 |
| MnO | 1.45 | 1.95 | 2.20 | 2.24 | 2.49 | 0.08 |
| CaO | 10.40 | 7.79 | 7.16 | 6.79 | 7.95 | 0.24 |
| Na2O | 13.04 | 14.06 | 13.74 | 13.98 | 12.19 | 0.42 |
| K2O | 0.39 | 0.57 | 0.45 | 0.35 | 0.41 | 0.04 |
| Cl | 0.46 | 0.41 | 0.50 | 0.41 | 0.48 | 0.04 |
| Total | 94.15 | 94.29 | 93.62 | 93.92 | 92.72 | - |
| Sample | #148 | #113 | #147 | #91 | #104 | Detection limits |
| JTB12-05 | JTB12-04 | JTB12-05 | AS12-06 | AS12-10 | ||
| wt % | wt % | wt % | wt % | wt % | wt % | |
| SiO2 | 48.16 | 48.18 | 48.48 | 47.73 | 48.42 | 0.08 |
| Al2O3 | 0.25 | 0.12 | 0.09 | 0.30 | 0.19 | 0.03 |
| Nb2O5 | 0.48 | 0.44 | 1.01 | 0.79 | 0.48 | 0.3 |
| ZrO2 | 11.70 | 11.22 | 11.50 | 12.44 | 11.50 | 0.10 |
| HfO2 | 0.19 | 0.32 | 0.35 | 0.33 | 0.28 | 0.09 |
| TiO2 | 0.05 | 0.20 | 0.18 | 0.12 | 0.18 | 0.03 |
| La2O3 | 0.90 | 0.88 | 1.72 | 0.65 | 1.28 | 0.2 |
| Ce2O3 | 2.18 | 2.14 | 2.68 | 1.47 | 2.79 | 0.2 |
| Nd2O3 | 1.38 | 1.07 | 0.93 | 0.71 | 1.31 | 0.2 |
| Y2O3 | 2.25 | 3.42 | 1.64 | 2.76 | 2.27 | 0.06 |
| FeO | 3.10 | 0.83 | 1.24 | 2.78 | 0.91 | 0.08 |
| MnO | 2.72 | 3.10 | 4.35 | 2.17 | 5.36 | 0.08 |
| CaO | 6.72 | 6.79 | 7.24 | 7.33 | 5.19 | 0.08 |
| Na2O | 12.47 | 8.53 | 8.98 | 12.37 | 11.13 | 0.08 |
| K2O | 0.67 | 1.06 | 0.91 | 0.52 | 0.59 | 0.03 |
| Cl | 0.24 | 0.29 | 0.20 | 0.40 | 0.41 | 0.02 |
| Total | 93.24 | 88.44 | 91.31 | 92.67 | 92.09 | - |
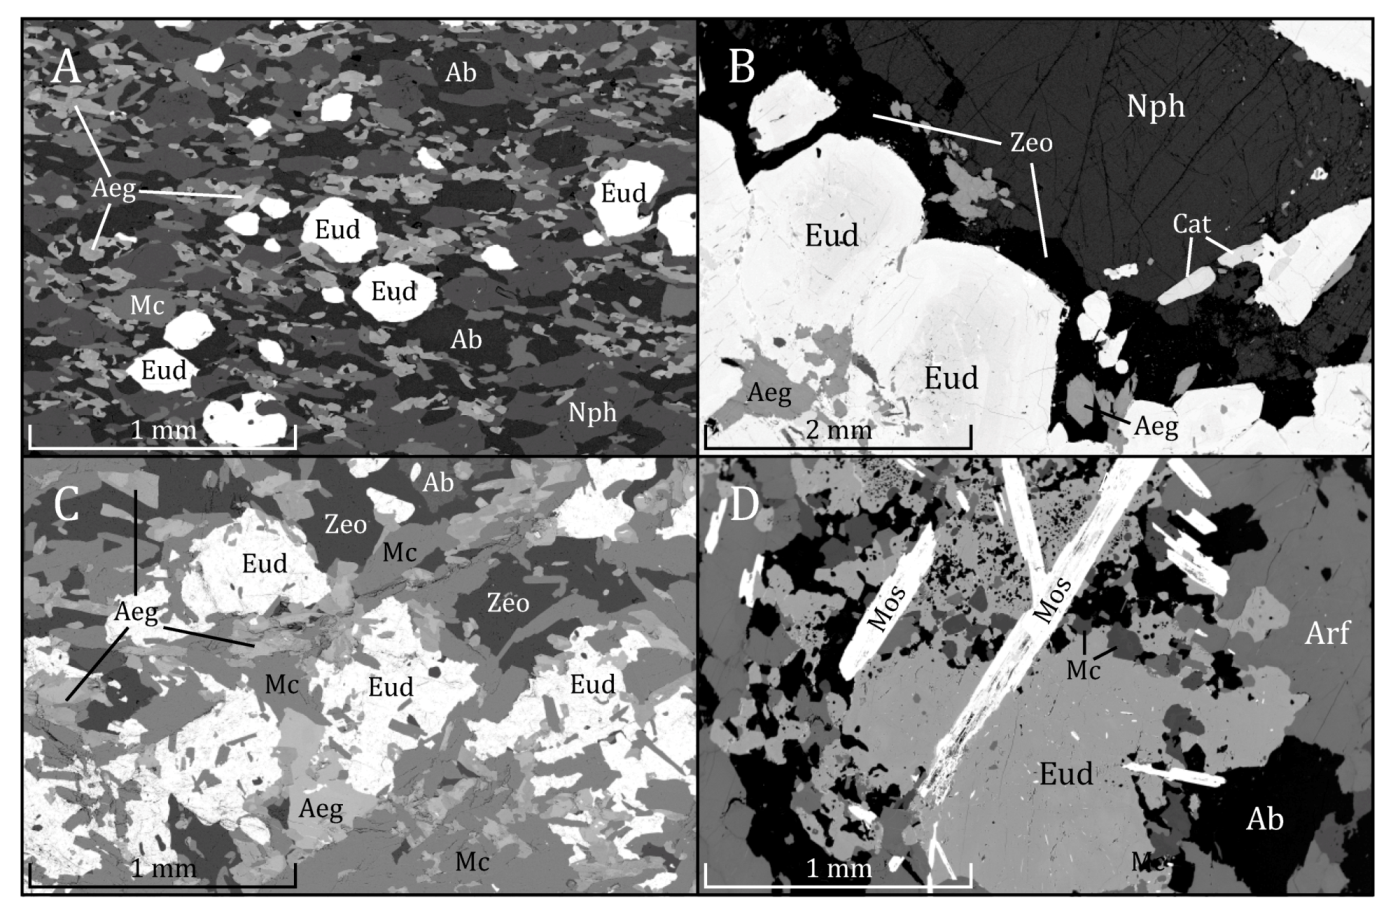
3.3. Scanning Electron Microscopy by Energy Dispersive Spectrometry (SEM-EDS)
| Sample | #69 | #9 | #16 | #20 | #87 | #148 | Typical errors |
|---|---|---|---|---|---|---|---|
| AS12-01 wt % | AS12-02 wt % | AS12-03 wt % | AS12-04 wt % | AS12-05 wt % | JTB12-05 wt % | 2σ wt % | |
| SiO2 | 49.88 | 47.41 | 47.41 | 48.39 | 48.16 | 48.08 | 0.17 |
| Al2O3 | n.a. | n.a. | n.a. | n.a. | n.a. | n.a. | - |
| Nb2O5 | 0.56 | 1.22 | 1.12 | 1.00 | 1.33 | 0.94 | 0.14 |
| ZrO2 | 11.94 | 11.99 | 11.89 | 12.25 | 12.06 | 11.99 | 0.22 |
| HfO2 | 0.30 | 0.23 | 0.23 | 0.47 | 0.32 | b.d.l. | 0.14 |
| TiO2 | 0.17 | 0.13 | 0.09 | 0.28 | 0.06 | 0.07 | 0.03 |
| La2O3 | b.d.l. | 0.53 | 0.57 | 0.56 | 0.48 | 0.64 | 0.09 |
| Ce2O3 | b.d.l. | 1.09 | 1.23 | 1.37 | 1.11 | 1.98 | 0.09 |
| Pr2O3 | b.d.l. | b.d.l. | 0.17 | 0.25 | 0.21 | 0.25 | 0.09 |
| Nd2O3 | b.d.l. | 0.67 | 0.65 | 1.22 | 0.67 | 1.19 | 0.09 |
| Sm2O3 | b.d.l. | 0.20 | 0.23 | 0.40 | 0.20 | 0.25 | 0.09 |
| Eu2O3 | b.d.l. | b.d.l. | b.d.l. | b.d.l. | b.d.l. | b.d.l. | 0.16 |
| Gd2O3 | b.d.l. | 0.28 | 0.26 | b.d.l. | 0.39 | b.d.l. | 0.16 |
| Tb2O3 | b.d.l. | b.d.l. | b.d.l. | b.d.l. | b.d.l. | b.d.l. | 0.16 |
| Dy2O3 | b.d.l. | 0.46 | 0.48 | b.d.l. | 0.62 | 0.31 | 0.16 |
| Ho2O3 | b.d.l. | b.d.l. | b.d.l. | b.d.l. | b.d.l. | b.d.l. | 0.11 |
| Er2O3 | b.d.l. | 0.33 | 0.37 | b.d.l. | 0.30 | b.d.l. | 0.14 |
| Tm2O3 | b.d.l. | b.d.l. | b.d.l. | b.d.l. | b.d.l. | b.d.l. | 0.11 |
| Yb2O3 | b.d.l. | 0.34 | b.d.l. | b.d.l. | 0.21 | b.d.l. | 0.11 |
| Lu2O3 | b.d.l. | b.d.l. | b.d.l. | b.d.l. | b.d.l. | b.d.l. | 0.11 |
| Y2O3 | b.d.l. | 3.02 | 3.00 | 3.97 | 2.89 | 2.38 | 0.69 |
| FeO | 5.54 | 3.05 | 3.16 | 3.00 | 2.54 | 3.21 | 0.08 |
| MnO | 1.42 | 2.00 | 1.98 | 2.22 | 2.41 | 2.60 | 0.08 |
| CaO | 10.76 | 7.87 | 7.43 | 6.92 | 7.98 | 6.67 | 0.06 |
| Na2O | 11.83 | 13.21 | 13.36 | 14.00 | 11.67 | 12.09 | 0.32 |
| K2O | 0.43 | 0.51 | 0.44 | 0.29 | 0.35 | 0.64 | 0.02 |
| Cl | 0.44 | 0.39 | 0.50 | 0.37 | 0.46 | 0.22 | 0.02 |
| Total | 93.76 | 93.24 | 92.99 | 96.24 | 92.40 | 92.84 | - |
| Sample | #113a | #113b | #147a | #147b | #91 | #104 | Detection limits |
| JTB12-04 wt % | JTB12-04 wt % | JTB12-05 wt % | JTB12-05 wt % | AS12-06 wt % | AS12-10 wt % | wt % | |
| SiO2 | 49.24 | 48.55 | 47.98 | 47.51 | 47.92 | 48.14 | 0.26 |
| Al2O3 | n.a. | n.a. | n.a. | n.a. | n.a. | n.a. | - |
| Nb2O5 | 0.63 | 0.60 | 1.74 | 1.82 | 0.93 | 0.85 | 0.21 |
| ZrO2 | 11.87 | 11.93 | 11.40 | 11.32 | 12.27 | 11.92 | 0.33 |
| HfO2 | 0.34 | 0.24 | 0.21 | 0.23 | 0.23 | 0.24 | 0.21 |
| TiO2 | 0.21 | 0.17 | 0.18 | 0.17 | 0.17 | 0.17 | 0.05 |
| La2O3 | 0.76 | 0.72 | 1.67 | 1.90 | 0.61 | 1.00 | 0.14 |
| Ce2O3 | 1.97 | 2.07 | 2.58 | 2.66 | 1.41 | 2.59 | 0.14 |
| Pr2O3 | 0.16 | 0.30 | 0.28 | 0.17 | 0.15 | 0.31 | 0.14 |
| Nd2O3 | 1.01 | 1.10 | 0.82 | 0.78 | 0.77 | 1.18 | 0.14 |
| Sm2O3 | 0.32 | 0.21 | 0.25 | b.d.l. | 0.22 | 0.23 | 0.14 |
| Eu2O3 | b.d.l. | b.d.l. | b.d.l. | b.d.l. | b.d.l. | b.d.l. | 0.24 |
| Gd2O3 | 0.36 | b.d.l. | 0.36 | b.d.l. | b.d.l. | 0.33 | 0.24 |
| Tb2O3 | b.d.l. | b.d.l. | b.d.l. | b.d.l. | b.d.l. | b.d.l. | 0.24 |
| Dy2O3 | 0.44 | 0.43 | b.d.l. | 0.24 | 0.30 | 0.31 | 0.24 |
| Ho2O3 | b.d.l. | b.d.l. | b.d.l. | b.d.l. | b.d.l. | b.d.l. | 0.17 |
| Er2O3 | 0.31 | b.d.l. | b.d.l. | b.d.l. | 0.29 | 0.20 | 0.21 |
| Tm2O3 | b.d.l. | b.d.l. | b.d.l. | b.d.l. | b.d.l. | b.d.l. | 0.17 |
| Yb2O3 | 0.27 | b.d.l. | b.d.l. | b.d.l. | 0.24 | 0.19 | 0.17 |
| Lu2O3 | b.d.l. | b.d.l. | b.d.l. | b.d.l. | b.d.l. | b.d.l. | 0.17 |
| Y2O3 | 2.56 | 3.26 | 1.82 | 1.35 | 2.81 | 1.96 | 1.04 |
| FeO | 1.09 | 1.04 | 1.31 | 1.19 | 2.92 | 1.00 | 0.12 |
| MnO | 3.11 | 3.08 | 4.57 | 4.60 | 2.11 | 5.06 | 0.12 |
| CaO | 6.58 | 6.45 | 7.34 | 7.40 | 7.49 | 5.14 | 0.09 |
| Na2O | 7.90 | 8.07 | 9.05 | 8.19 | 12.12 | 10.84 | 0.48 |
| K2O | 0.99 | 0.99 | 0.81 | 0.83 | 0.53 | 0.58 | 0.03 |
| Cl | 0.22 | 0.17 | 0.17 | 0.16 | 0.39 | 0.35 | 0.03 |
| Total | 88.44 | 88.40 | 91.54 | 89.99 | 92.62 | 90.96 | - |
4. Discussion
4.1. Processing of SEM-EDS Spectra
4.2. Comparing SEM-EDS and WDS-EMP
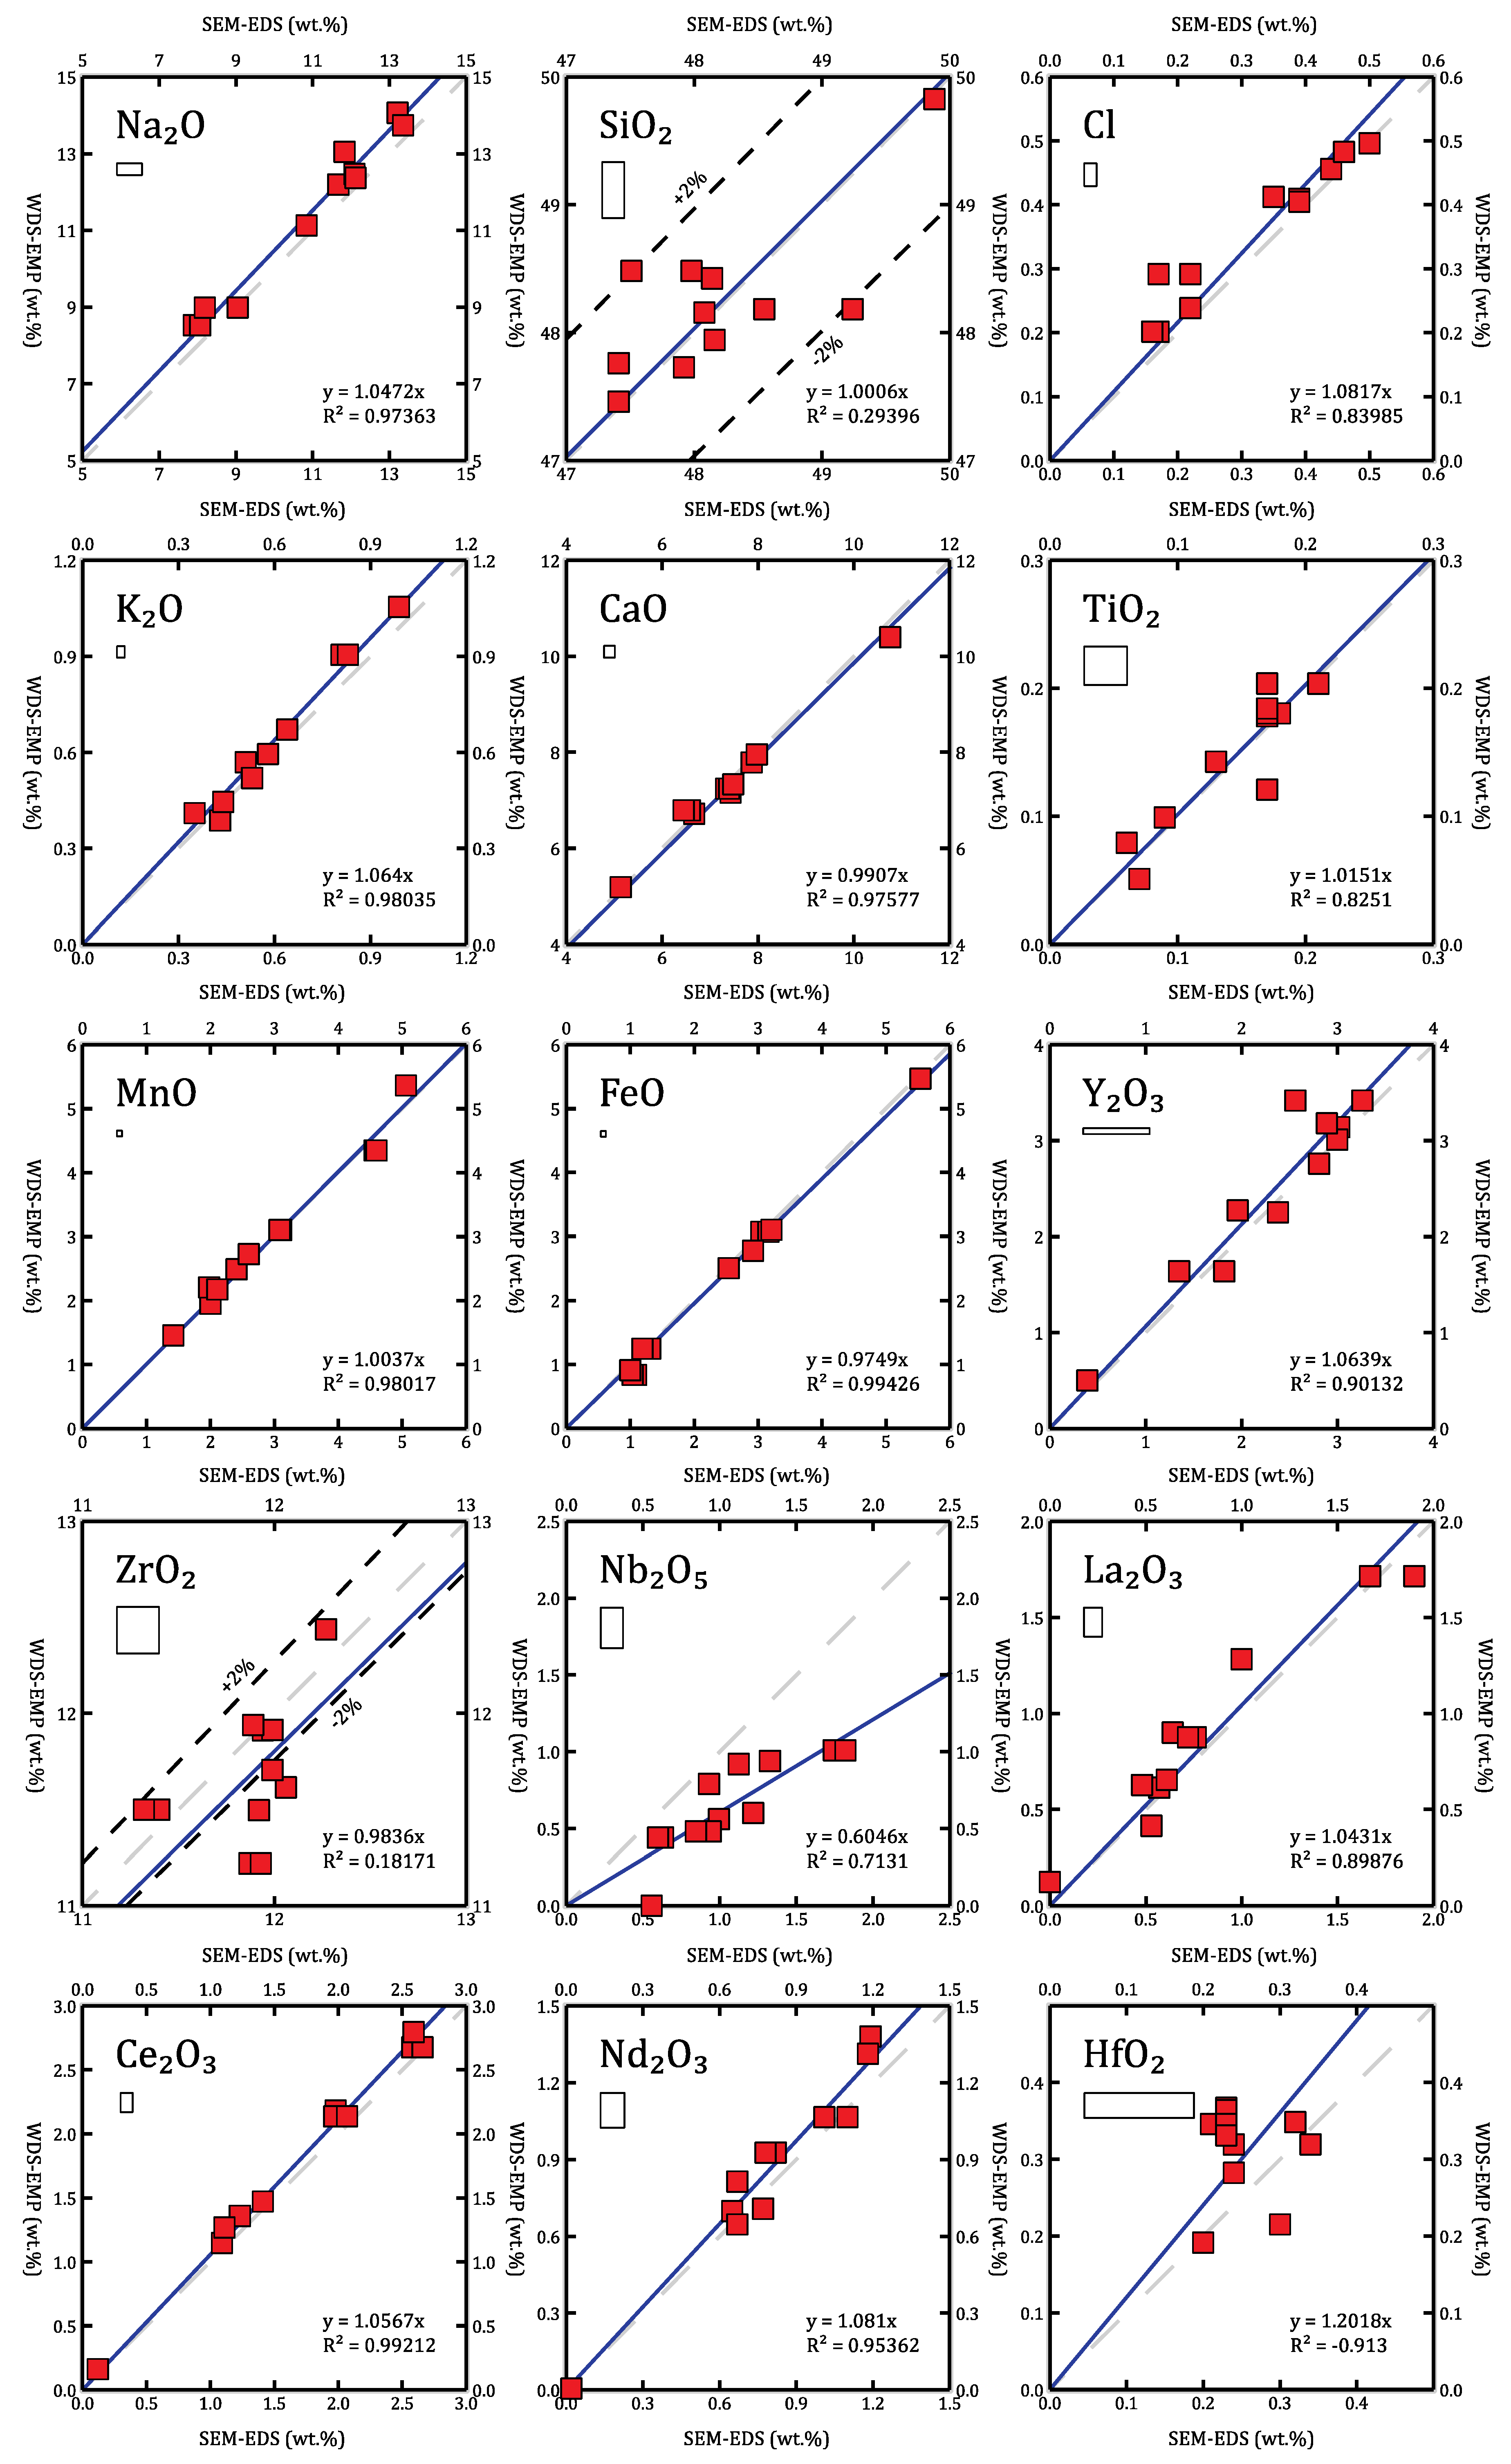
4.3. Niobium on WDS-EMP
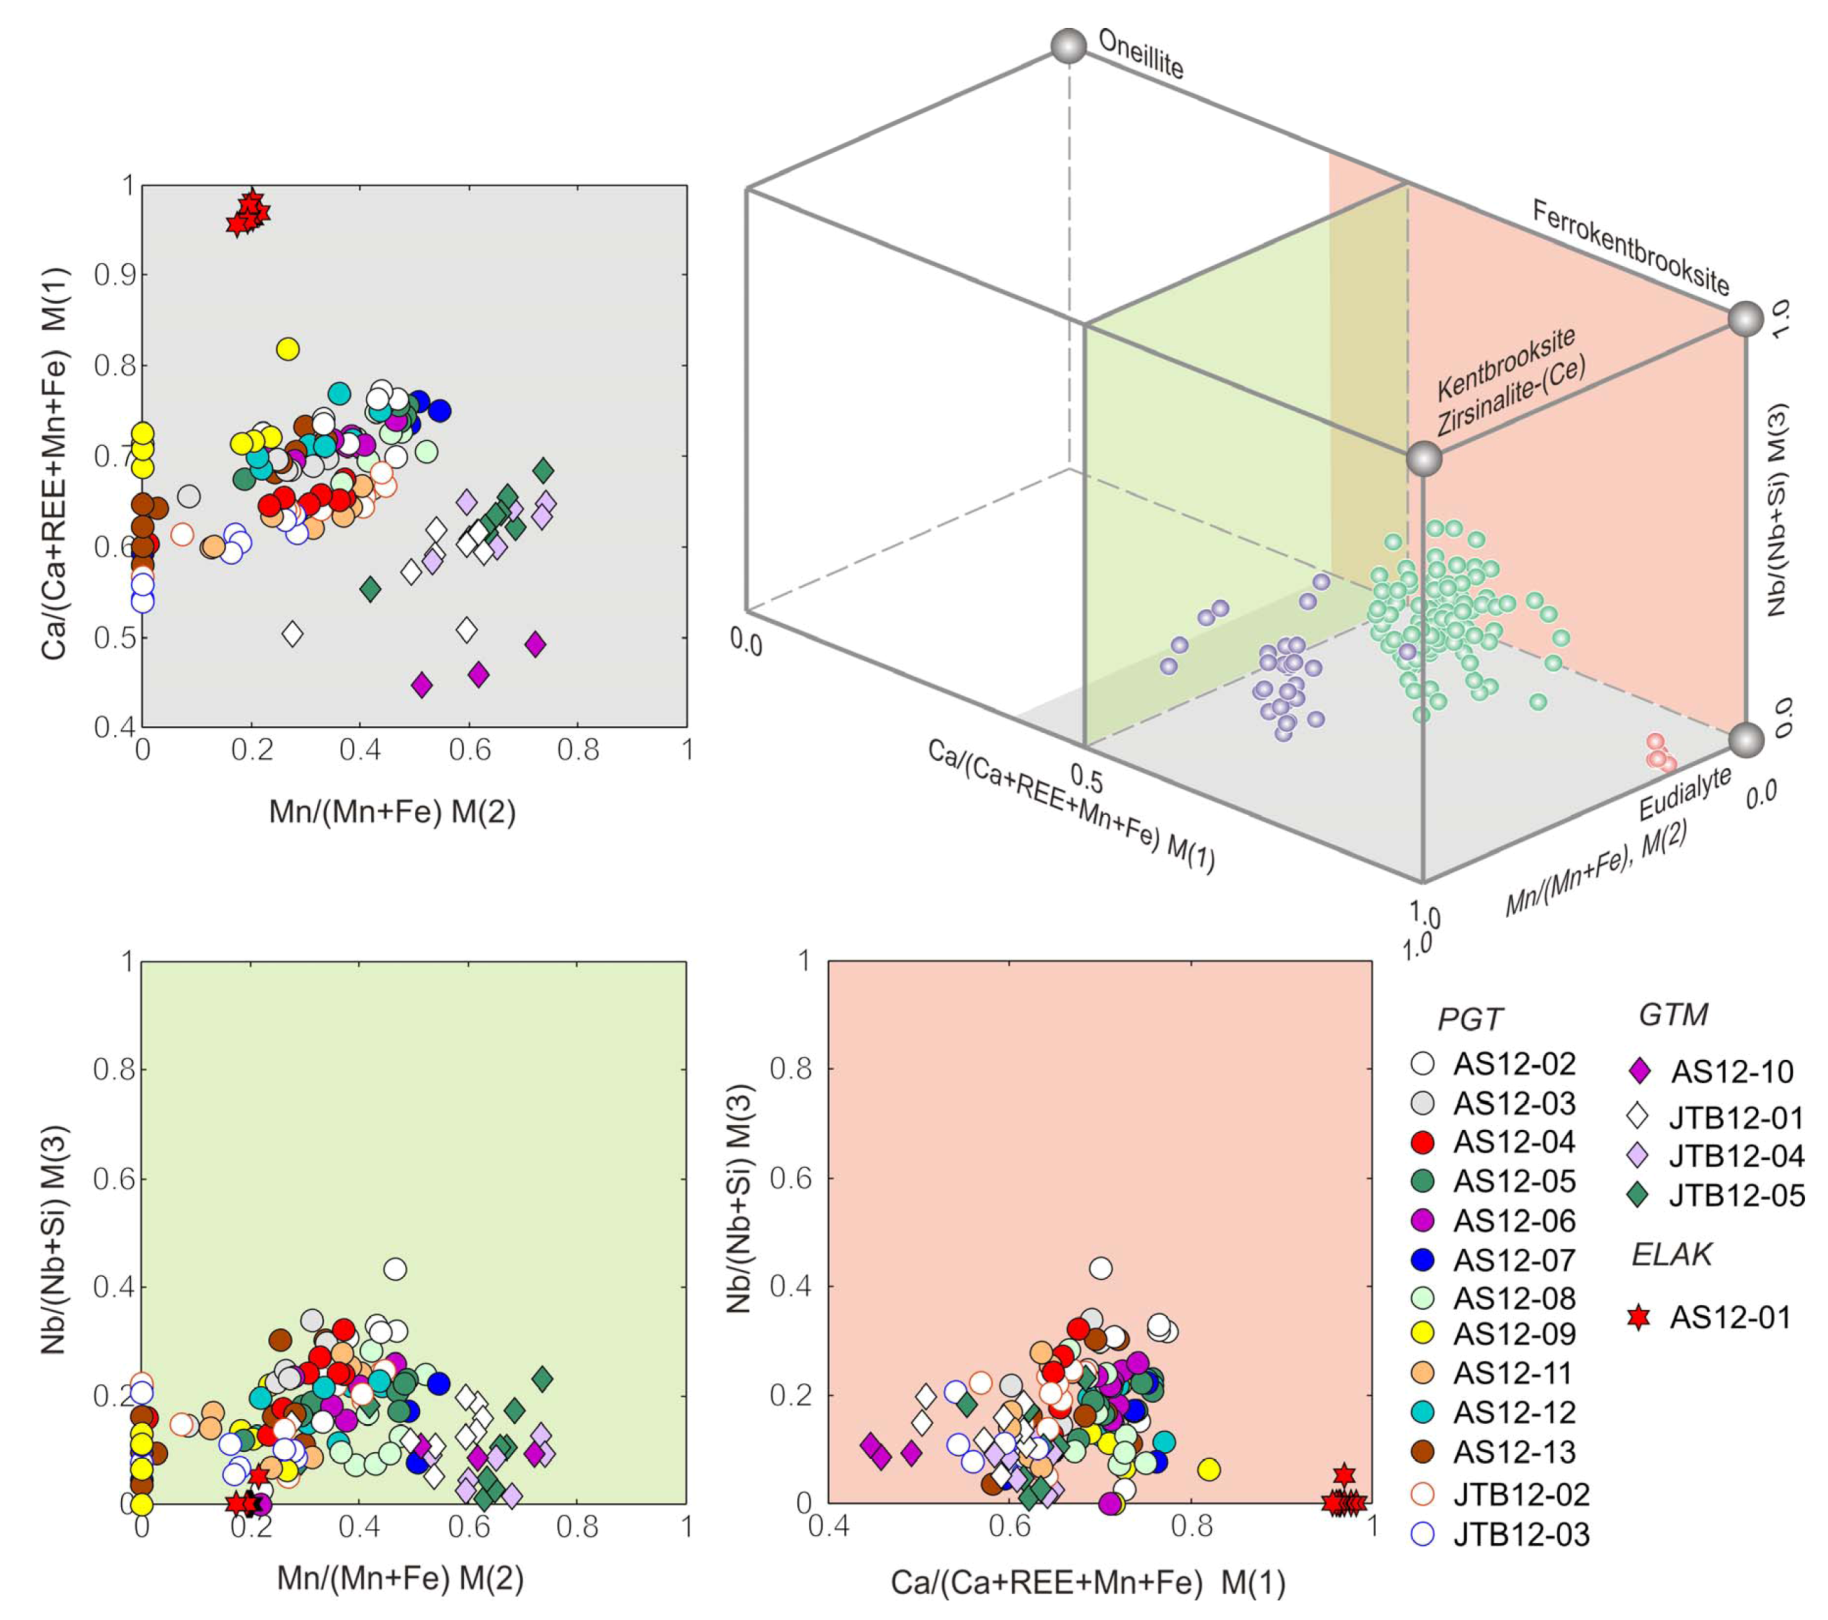
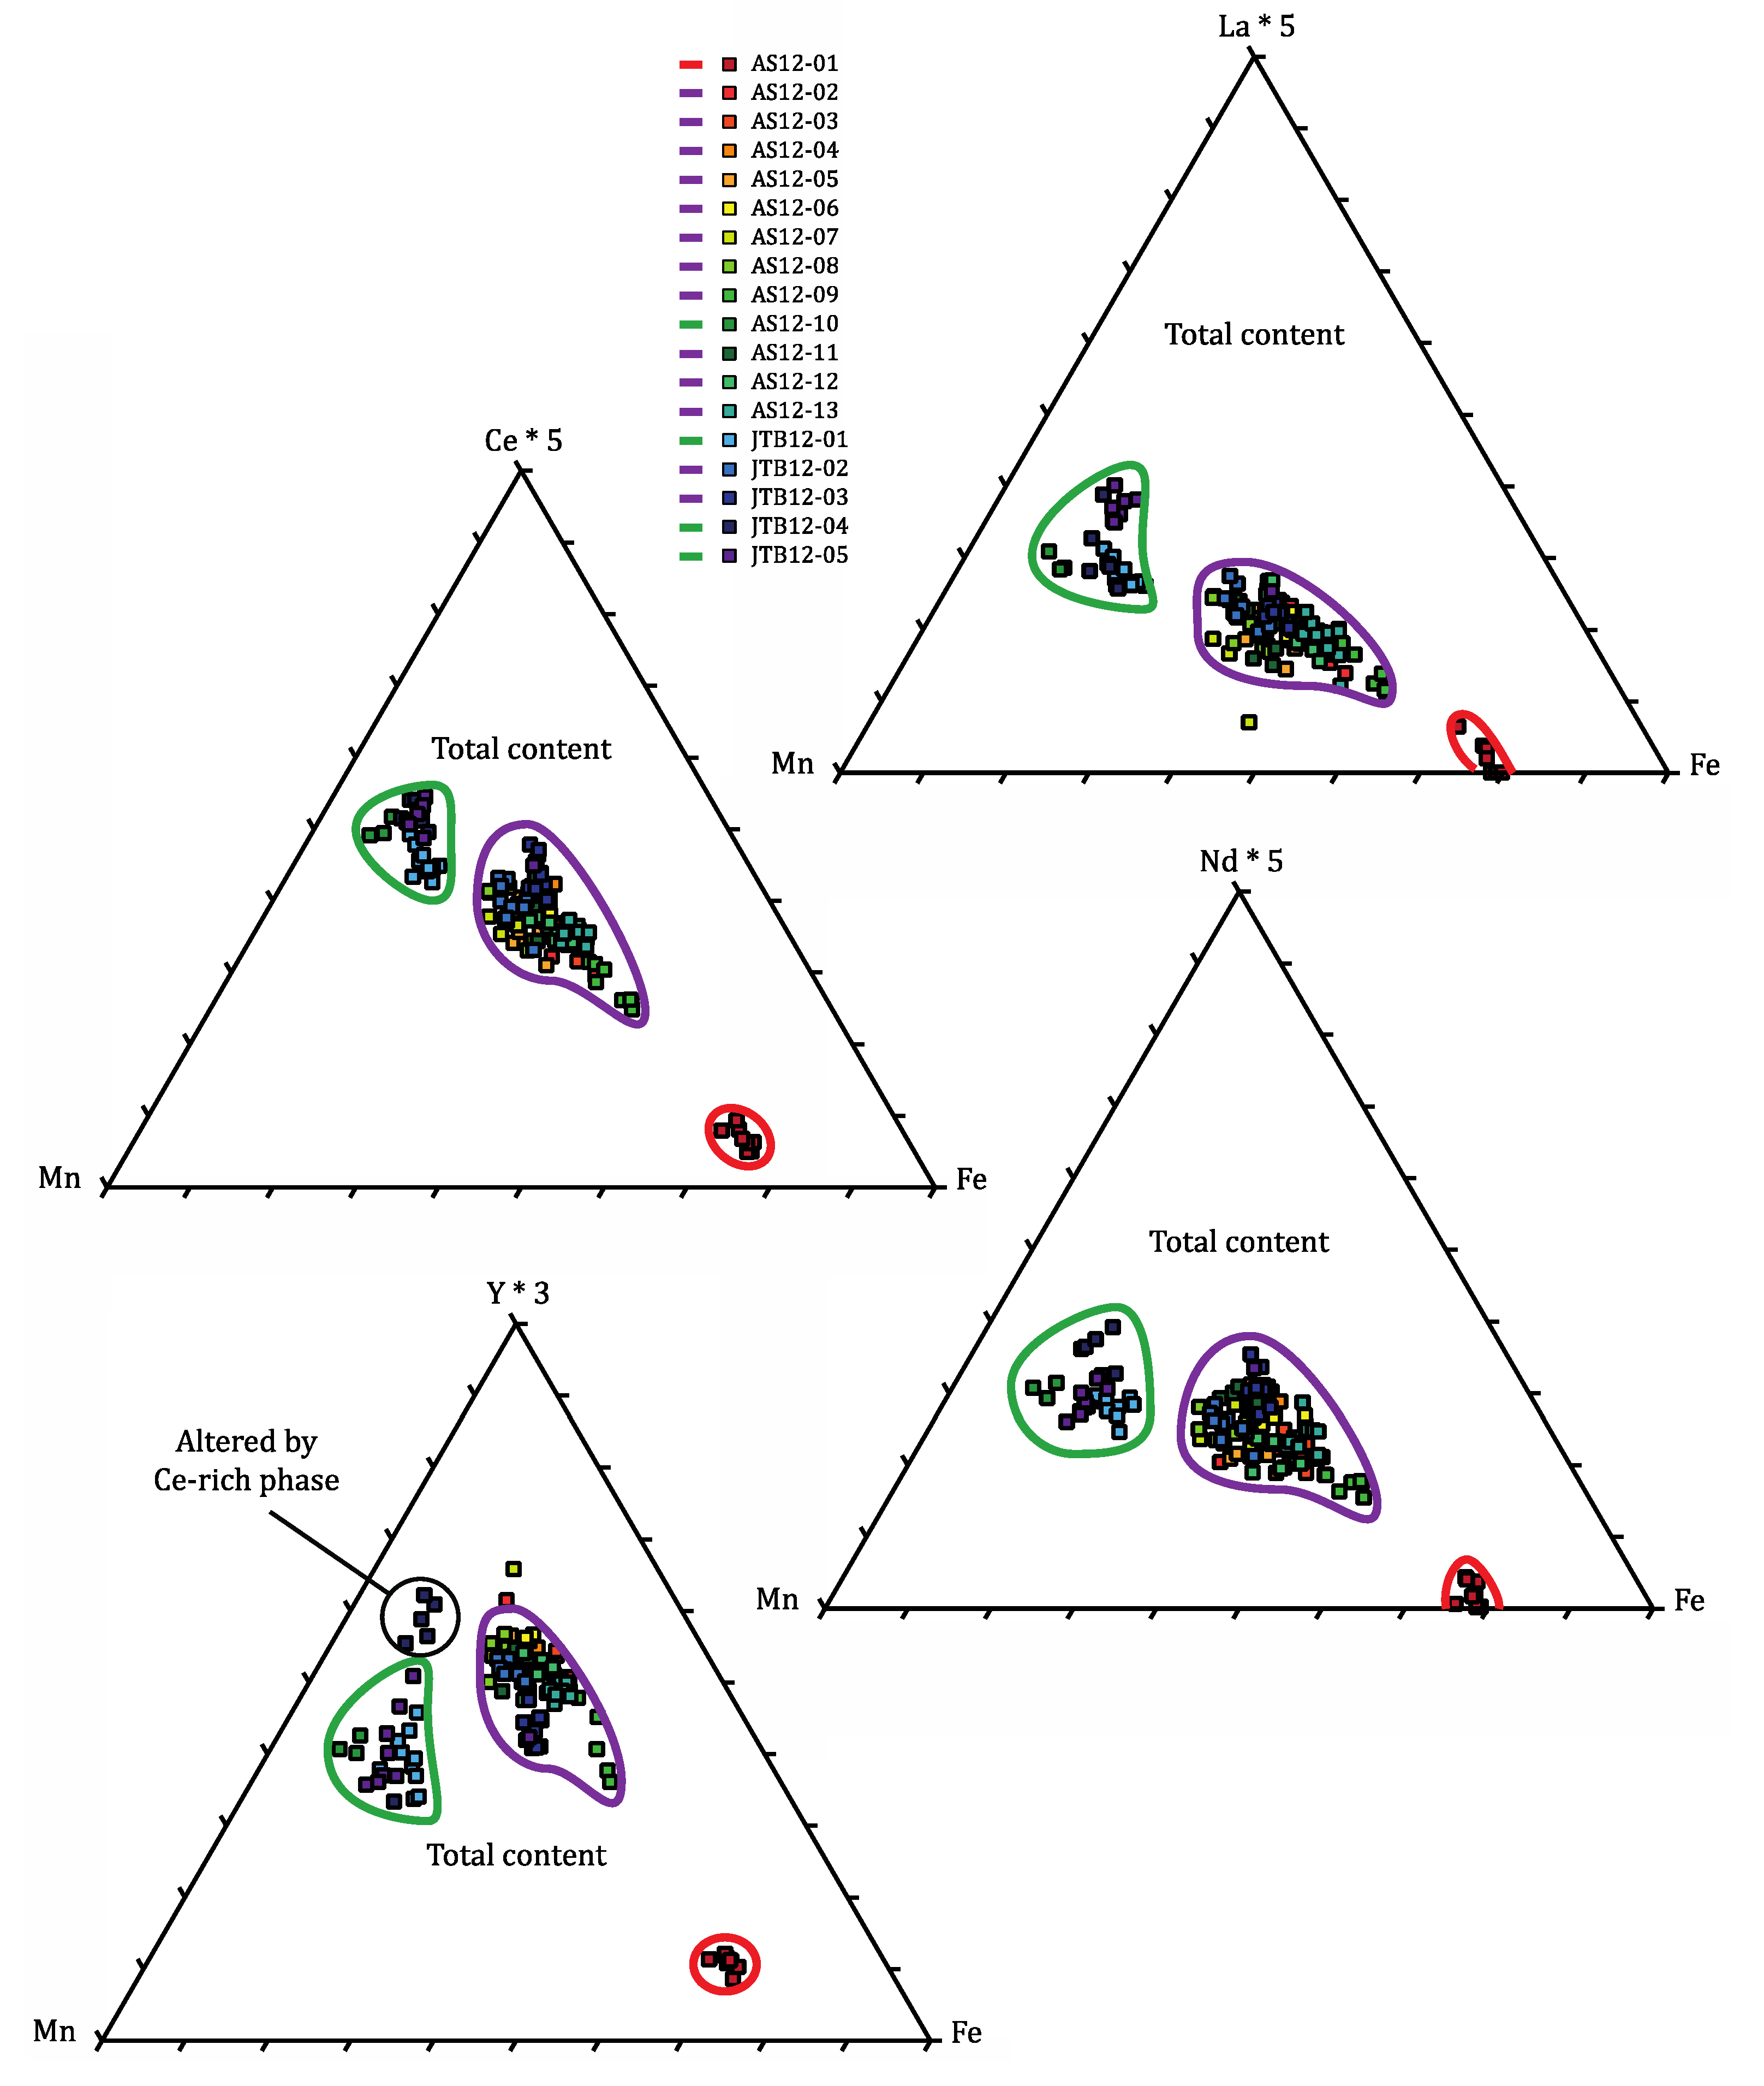
4.4. Crystal Chemistry of the Eudialyte-Group Minerals

5. Conclusions
- Fe-rich, REE-poor, classical pink eudialyte from lakarpite;
- Fe-Mn-bisected, HREE-rich eudialyte from “pegmatitic” grennaite;
- Mn-rich, LREE-rich eudialyte from “migmatitic” grennaite.
Acknowledgments
References
- Sørensen, H. The agpaitic rocks—An overview. Mineral. Mag. 1997, 61, 485–498. [Google Scholar]
- Mindat.org, the Mineral and Locality Database Home Page. Available online: http://www.mindat.org/ (accessed on 31 May 2012).
- Bellezza, M.; Merlino, S.; Perchiazzi, N. Mosandrite: Structureal and crystal-chemical relationships with rinkite. Can. Miner. 2009, 47, 897–908. [Google Scholar] [CrossRef]
- Ussing, N.V. Geology of the Country around Julianehaab, Greenland. Meddr. Grønl. 1912, 38, 1–426. [Google Scholar]
- Sørensen, H. On the Agpaitic Rocks. In Report of the International Geological Congress 21st Session Norden, Copenhagen, Denmark, 15–25 August 1960; Volume 13, pp. 319–327.
- Le Maitre, R.W. Igneous Rocks: A Classification and Glossary of Terms, 2nd ed; Cambridge University Press: Cambridge, UK, 2002. [Google Scholar]
- Sørensen, H. (Ed.) The Alkaline Rocks, 1st; John Wiley: London, UK, 1974.
- Marks, M.A.W.; Hettmann, K.; Schilling, J.; Frost, B.R.; Markl, G. The mineralogical diversity of alkaline igneous rocks: Critical factors for the transition from miaskitic to agpaitic phase assemblages. J. Petrol. 2011, 52, 439–455. [Google Scholar] [CrossRef]
- Ferguson, J. Geology of the Ilímaussaq alkaline intrusion, South Greenland: Description of map and structure. Bull. Grønl. Geol. Undersøgelse 1964, 39, 1–82. [Google Scholar]
- Sørensen, H. The Ilímaussaq alkaline complex, South Greenland—An overview of 200 years of research and an outlook. Meddr. Grønl. 2006, 45, 1–70. [Google Scholar]
- Gerasimovsky, V.I.; Volkov, V.P.; Kogarko, L.N.; Polyakov, A.I. Kola Peninsula. In The Alkaline Rocks, 1st; Sørensen, H., Ed.; John Wiley: London, UK, 1974; pp. 206–221. [Google Scholar]
- Philpotts, A.R. The Monterregian Province. In The Alkaline Rocks; Sørensen, H., Ed.; John Wiley: London, UK, 1974; pp. 293–310. [Google Scholar]
- Schilling, J.; Marks, M.A.W.; Wenzel, T.; Vennemann, T.; Horváth, L.; Tarassoff, P.; Jacob, D.E.; Markl, G. The magmatic to hydrothermal evolution of the intrusive mont saint-hilaire complex: Insights into the late-stage evolution of peralkaline rocks. J. Petrol. 2011, 52, 2147–2185. [Google Scholar] [CrossRef]
- Salvi, S.; Fontan, F.; Monchoux, P. Hydrothermal mobilization of high field strength elements in alkaline igneous systems: Evidence from the Tamazeght Complex (Morocco). Econ. Geol. 2000, 95, 559–576. [Google Scholar]
- Verwoerd, W.J. The Pilanesberg Alkaline Province. In The Geology of South Africa; Johnson, M.R., Anhaeusser, C.R., Thomas, R.J., Eds.; Geological Society of S.A., Johannesburg and Council for Geoscience: Pretoria, South Africa, 2006; pp. 381–393. [Google Scholar]
- Brøgger, W.C. Die Mineralien der Syenitpegmatitgänge der südnorwegischen Augit- und Nephelinsyenite [in German]. Z. Krystallographie 1890, 1–235, 1–663. [Google Scholar]
- Larsen, A.O. The Langesundsfjord. History, Geology, Pegmatites, Minerals; Bode: Salzhemmerdorf, Germany, 2010. [Google Scholar]
- Stromeyer, F. Summary of meeting 16 December 1819 (Analyse einiger grönlandischen, von Prof Giesecke erhaltenen Fossilien). Göttingische Gelehrt. Anz. 1819, 3, 1993–2000. [Google Scholar]
- Johnsen, O.; Ferrarris, G.; Gault, R.A.; Grice, J.D.; Kampf, A.R.; Pekov, I.V. The nomenclature of eudialyte-group minerals. Can. Miner. 2003, 41, 785–794. [Google Scholar] [CrossRef]
- Mindat.org the Mineral and Locality Database Web Page. Available online: http://www.mindat.org/min-11021.html (accessed on 31 May 2012).
- Schilling, J.; Wu, F.-Y.; McCammon, C.; Wenzel, T.; Marks, M.A.W.; Pfaff, K.; Jacob, D.E.; Markl, G. The compositional variability of eudialyte-group minerals. Miner. Mag. 2011, 75, 87–115. [Google Scholar] [CrossRef]
- Rastsvetaeva, R.K. Structural mineralogy of the eudialyte group: A review. Crystallogr. Rep. 2007, 52, 47–64. [Google Scholar] [CrossRef]
- Johnsen, O.; Grice, J.D. The crystal chemistry of the eudialyte group. Can. Miner. 1999, 37, 865–891. [Google Scholar]
- Johnsen, O.; Gault, R.A. Chemical variation in eudialyte. Neues Jahrb. Miner. 1997, 171, 215–237. [Google Scholar]
- Pfaff, K.; Krumrei, T.; Marks, M.; Wenzel, T.; Rudolf, T.; Markl, G. Chemical and physical evolution of the lower layered sequence from the syenitic Ilímaussaq intrusion, South Greenland: Implications for the origin of magmatic layering in peralkaline felsic liquids. Lithos 2008, 106, 280–296. [Google Scholar] [CrossRef]
- Schilling, J.; Marks, M.; Wenzel, T.; Markl, G. Reconstruction of magmatic to subsolidus processes in an agpaitic system using eudialyte textures and composition: A case study from Tamazeght, Morocco. Can. Miner. 2009, 47, 351–365. [Google Scholar] [CrossRef]
- Törnebohm, A.E. Katapleiit-syenit, en nyupptäckt varietet af nefelinsyenit i Sverige [in Swedish]. SGU Ser. C 1906, 199, 1–54. [Google Scholar]
- Google Images. Available online: http://images.google.com/ (accessed 16 August 2012).
- Fryer, B.J.; Edgar, A.D. Significance of rare earth distributions in coexisting minerals of peralkaline undersaturated rocks. Contrib. Miner. Petrol. 1977, 61, 35–48. [Google Scholar] [CrossRef]
- Christensson, U. Characterising the Alteration of the Contact to the Norra Kärr Alkaline Complex, Southern Sweden. Bachelor’s Thesis, University of Gothenburg, Gothenburg, Sweden, 2013. [Google Scholar]
- Blaxland, A.B. Agpaitic magmatism at Norra Kärr? Rb-Sr isotopic evidence. Lithos 1977, 10, 1–8. [Google Scholar] [CrossRef]
- Welin, E. Tabulation of recalculated radiometric ages published 1960–1979 for rocks and minerals in Sweden. GFF 1980, 101, 309–320. [Google Scholar] [CrossRef]
- Ranjer, S. Describing and Characterising the Mylonites in the Area of the Norra Kärr Alkaline Complex, Southern Sweden. Bachelor’s Thesis, University of Gothenburg, Gothenburg, Sweden, 2013. [Google Scholar]
- Högdahl, K.; Andersson, U.B.; Eklund, O. The Transscandinavian Igneous Belt (TIB) in Sweden: A Review of Its Character and Evolution; Geological Survey of Finland Special Paper 37; Geological Survey of Finland: Espoo, Finland, 2004. [Google Scholar]
- Adamson, O.J. The petrology of the Norra Kärr district: An occurrence of alkaline rocks in southern Sweden. GFF 1944, 437, 113–255. [Google Scholar]
- Von Eckermann, H. The Alkaline rocks of Norra Kärr. In Alkaline Rocks and Minerals Deposits of Southern, Central, and Northern Sweden: Guide to Excursion No C 27, Proceedings of International Geological Congress XXI Session Norden, Copenhagen, Denmark, 15–25 August 1960; Geological Survey of Sweden: Uppsala, Sweden, 1960; pp. 3–6. [Google Scholar]
- Von Eckermann, H. New contributions to the interpretation of the genesis of the norra kärr alkaline body in southern Sweden. Lithos 1968, 1, 76–88. [Google Scholar] [CrossRef]
- Koark, H.J. Zum gefügeverhalten des nephelins in zwei vorkommen alkaliner kristaliner schiefer [in German]. Bull. Geol. Inst. Upps. 1960, 39, 1–31. [Google Scholar]
- Koark, H.J. Zu hülle, inhalt, gefüge und alter des alkaligesteinsvorkommen von Norra Kärr im südlichen mittelschweden [in German]. GFF 1968, 91, 159–184. [Google Scholar]
- Kramm, U.; Koark, H.J. Isotopic composition of galena lead from the Norra Kärr peralkaline complex, Sweden. GFF 1988, 110, 311–316. [Google Scholar] [CrossRef]
- Sood, M.K.; Edgar, A.D. Melting relations of undersaturated Alkaline rocks from the Ilímaussaq Intrusion and Grønnedal-Íka complex, South Greenland: Under water vapour and controlled partial oxygen pressure. Meddr. Grønl. 1970, 181, 1–41. [Google Scholar]
- Piotrowski, J.M.; Edgar, A.D. Melting relations of undersaturated Alkaline rocks from South Greenland compared to those of Africa and Canada. Meddr. Grønl. 1970, 181, 1–62. [Google Scholar]
- Whitney, D.L.; Evans, B.W. Abbreviations for names of rock-forming minerals. Am. Miner. 2010, 95, 185–187. [Google Scholar] [CrossRef]
- Thulin, H. Norra Kärr: Avsnitt 1 [in Swedish]. Litofilen 1996, 1, 17–27. [Google Scholar]
- Tasman Metals Ltd. Web Page. Norra Kärr Rare Element Project. Available online: http://www.tasmanmetals.com/s/Norra-Karr.asp (accessed on 25 June 2012).
- ALS Limited. Minerals: Method description ME-MS81. Available online: http://www.alsglobal.com/upload/minerals/downloads/method-descriptions/Method%20Descriptions-ME-MS81.pdf (accessed on 16 July 2012).
- ALS Limited. Minerals: Method description ME-ICP06. Available online: http://www.alsglobal.com/upload/minerals/downloads/method-descriptions/Method-Descriptions-ME-ICP06.pdf (accessed on 2 October 2012).
- Jarosewich, E.; Boatner, L.A. Rare-earth element reference samples for electron microprobe analysis. Geost. Newsl. 1991, 15, 397–399. [Google Scholar]
- Pouchou, J.L.; Pichoir, F. A new model for quantitative X-ray microanalysis. I. Application to the analysis of homogeneous samples. Rech. Aerosp. 1984, 3, 13–38. [Google Scholar]
- Microanalysis Consultants Home Page. Available online: http://www.macstandards.co.uk (accessed on 14 March 2013).
- SPI Supplies Web Page. SPI off—The Shelf Microanalysis Standards. Available online: http://www.2spi.com/catalog/standards/spiweb/micro.html (accessed on 14 March 2013).
- Pfaff, K.; Wenzel, T.; Schilling, J.; Marks, M.A.W.; Markl, G. A fast and easy-to-use approach to cation site assignment for eudialyte-group minerals. N. Jahrbuch Miner. Abh. 2010, 187, 69–81. [Google Scholar] [CrossRef]
- Andersen, T.; Erambert, M.; Larsen, O.A.; Selbekk, R.S. Petrology of nepheline syenite pegmatites in the Oslo Rift, Norway: Zirconium silicate mineral assemblages as indicators of alkalinity and volatile fugacity in mildly agpaitic magma. J. Petrol. 2010, 51, 2303–2325. [Google Scholar] [CrossRef]
- Andersen, T.; Erambert, M.; Larsen, O.A.; Selbekk, R.S. Petrology of nepheline syenite pegmatites in the Oslo Rift, Norway: Zr and Ti mineral assemblages in miaskitic and agpaitic pegmatites in the Larvik Plutonic Complex. Mineral. Pol. 2012. [Google Scholar] [CrossRef]
- Taylor, S.R.; McLennan, S.M. The Continental Crust: Its Composition and Evolution; Blackwell: Oxford, UK, 1985. [Google Scholar]
- Schilling, J. Geological Survey of Norway, Trondheim, Norway. 2 March 2012; Personal communication. [Google Scholar]
© 2013 by the authors; licensee MDPI, Basel, Switzerland. This article is an open access article distributed under the terms and conditions of the Creative Commons Attribution license (http://creativecommons.org/licenses/by/3.0/).
Share and Cite
Sjöqvist, A.S.L.; Cornell, D.H.; Andersen, T.; Erambert, M.; Ek, M.; Leijd, M. Three Compositional Varieties of Rare-Earth Element Ore: Eudialyte-Group Minerals from the Norra Kärr Alkaline Complex, Southern Sweden. Minerals 2013, 3, 94-120. https://doi.org/10.3390/min3010094
Sjöqvist ASL, Cornell DH, Andersen T, Erambert M, Ek M, Leijd M. Three Compositional Varieties of Rare-Earth Element Ore: Eudialyte-Group Minerals from the Norra Kärr Alkaline Complex, Southern Sweden. Minerals. 2013; 3(1):94-120. https://doi.org/10.3390/min3010094
Chicago/Turabian StyleSjöqvist, Axel S.L., David H. Cornell, Tom Andersen, Muriel Erambert, Mattias Ek, and Magnus Leijd. 2013. "Three Compositional Varieties of Rare-Earth Element Ore: Eudialyte-Group Minerals from the Norra Kärr Alkaline Complex, Southern Sweden" Minerals 3, no. 1: 94-120. https://doi.org/10.3390/min3010094
APA StyleSjöqvist, A. S. L., Cornell, D. H., Andersen, T., Erambert, M., Ek, M., & Leijd, M. (2013). Three Compositional Varieties of Rare-Earth Element Ore: Eudialyte-Group Minerals from the Norra Kärr Alkaline Complex, Southern Sweden. Minerals, 3(1), 94-120. https://doi.org/10.3390/min3010094