Article

Evaluation of Hydrocarbon Entrapment Linked to Hydrothermal Fluids and Mapping the Spatial Distribution of Petroleum Systems in the Cretaceous Formation: Implications for the Advanced Exploration and Development of Petroleum Systems in the Kurdistan Region, Iraq

1
Department of Petroleum Geoscience, Science Faculty, Soran University, Soran-Erbil 44008, Kurdistan Region, Iraq
2
Department of Petroleum and Mining Engineering, Engineering Faculty, Soran University, Soran-Erbil 44008, Kurdistan Region, Iraq
3
Research Group, Biogeochemistry & Modelling of the Earth System, Université Libre de Bruxelles, B-1050 Brussels, Belgium
*
Author to whom correspondence should be addressed.
Minerals 2025, 15(9), 908; https://doi.org/10.3390/min15090908
Submission received: 5 June 2025 / Revised: 21 July 2025 / Accepted: 23 July 2025 / Published: 27 August 2025
(This article belongs to the Section Mineral Exploration Methods and Applications)

Abstract

This study utilizes high-resolution X-ray computed tomography (CT) to evaluate the reservoir characterization in heterogenous carbonate rocks. These rocks show a diagenetic alteration that influences the reservoir quality in the Cretaceous Qamchuqa–Bekhme formations in outcrop and subsurface sections (Gali-Bekhal, Bekhme, and Taq Taq oilfields, NE Iraq). The scanning of fifty-one directional line analyses was conducted on three facies: marine, early diagenetic (non-hydrothermal), and late diagenetic (hydrothermal dolomitization, or HTD). The facies were analyzed from thousands of micro-spot analyses (up to 5250) and computed tomographic numbers (CTNs) across vertical, horizontal, and inclined directions. The surface (outcrop) marine facies exhibited CTNs ranging from 2578 to 2982 Hounsfield Units (HUs) (Av. 2740 HU), with very low average porosity (1.20%) and permeability (0.14 mD) values, while subsurface marine facies showed lower CTNs (1446–2556 HU, Av. 2360 HU) and higher porosity (Av. 8.40%) and permeability (Av. 1.02 mD) compared to the surface samples. Subsurface marine facies revealed higher porosity, lower density, and considerably enhanced conditions for hydrocarbon storage. The CT measurements and petrophysical properties in early diagenesis highlight a considerable porous system in the surface compared to the one in subsurface settings, significantly controlling the quality of the reservoir storage. The late diagenetic scanning values coincide with a saddle dolomite formation formed under high temperature conditions and intensive rock–fluid interactions. These dolomites are related to a hot fluid and are associated with intensive fracturing, vuggy porosities, and zebra-like textures. These textures are more pronounced in the surface than the subsurface settings. A surface evaluation showed a wide CTN range, accompanied by an average porosity of up to 15.47% and permeability of 301.27 mD, while subsurface facies exhibited a significant depletion in the CTN (<500 HU), with an average porosity of about 14.05% and permeability of 91.56 mD. The petrophysical characteristics of the reservoir associated with late-HT dolomitization (subsurface setting) show two populations. The first one exhibited CTN values between 1931 and 2586 HU (Av. 2341 HU), with porosity ranging from 3.10 to 18.43% (Av. 8.84%) and permeability from 0.08 to 2.39 mD (Av. 0.31 mD). The second one recorded a considerable range of CTNs from 457 to 2446 HU (Av. 1823 HU), with porosity from 6.38 to 52.92% (Av. 20.97%) and permeability from 0.16 to 5462.62 mD (Av. 223.11 mD). High temperatures significantly altered the carbonate rock’s properties, with partial/complete occlusion of the porous vuggy and fractured networks, enhancing or reducing the reservoir quality and its storage. In summary, the variations in the CTN across both surface and subsurface facies provide new insight into reservoir heterogeneity and characterization, which is a fundamental factor for understanding the potential of hydrocarbon storage within various geological settings.

1. Introduction

X-ray computed tomography (CT) plays a significant role in developing a deeper understanding of the quality, potential, and characterization of reservoirs. CT scans provide a various range of measurements that help to understand the heterogeneity of carbonate rocks. One of the top principal engineers and developers of X-ray computed tomography is Sir Godfrey Newbold Hounsfield, who developed the Hounsfield Unit (HU) [1]. He provided images containing high-density measurements, allowing qualitative measurements, such as internal structure descriptions, and also quantitative information analysis, such as real density, chemical composition, and porosity [2,3,4,5]. The variation in the CTN is predominantly influenced by factors such as porosity, permeability, and the degree of diagenesis of the reservoir rocks, thus controlling the ability to store and transmit hydrocarbons within the reservoir rocks. By analyzing CT number differences between image datasets or using average bulk density values, CT scanning enables the calculation of porosity [6,7]. Although the CT scan has been regularly applied to core analyses in petroleum geology, improving methods to document the percentages and distribution of the porosity in the entire pore scale spectrum, from the tens of nanometers to the µm scale, is still needed. Porosity imaging is particularly crucial for complex and heterogeneous rocks such as hydrothermally altered and fractured carbonates [8]. CT scanners offer researchers the capability of the rapid, nondestructive visualization and analysis of the internal structure of core materials and experiments involving core materials [9]. A CT scan is used to provide images of covered and preserved cores and to identify and characterize fractures, the homogeneities of rocks, and the zones of mud invasion. Thereby, CT scans helping for characterizing the pore spaces in volcanic reservoirs [10,11,12]. In the Lower Cretaceous Denglouku Formation, a micro-CT scan was used to quantify the porous media and simulate fluid flow in a tight sandstone reservoir [13]. The authors added that the CT scan provided comprehensive information about the permeability and preservation influenced by pore-lining clay minerals.
The occurrence of hydrothermal dolomitization within the Bekhme–Qamchuqa formation is supported by geochemical evidence, such as extra-negative values of oxygen isotopes and a wide and considerable range of C-O values [14]. The authors classified the C-O values derived from the outcrop section into three distinct groups and found that the wide range of δ13C values were consistent with changes in sedimentary rock types, which were influenced by fluctuations in the sea level. The author has connected this observation to the presence of another fluid during and after the deposition periods. The diagenetic fluids exhibited a unique combination of oxygen and carbon isotopes. Although most of the data obtained from oxygen isotopes overlap, there is evidence of exceptionally low oxygen isotopic compositions associated with hydrothermal fluids and burial conditions [15].
Our study utilized computed tomography scan (CT) during the interval of Cretaceous succession, including Qamchuqa and Bekhme formations. The study focuses on marine, early, and late hydrothermal dolomitization. Both surface and subsurface settings demonstrate enhanced storage capacity related to fluid mobility, considerably affecting the storage quality within the petroleum reservoirs. Furthermore, the study develops a model based on the reservoir characteristics of these reservoirs to draw and construct the impact of hydrothermal conditions under shallow and deep settings.

2. Geological and Geo-Tectonic Setting

The Early Cretaceous Arabian platform comprises a substantial series of dolomites and limestones. These cover the majority of northern Iraq, a portion of southwestern Iran, the Arabian Gulf, and Saudi Arabia. In the Albian period, the Qamchuqa Formation was formed in shallow water, low-energy lagoonal environments, and covering the cities of Dohuk, Mosul, Erbil, and Kirkuk [16,17], with several sub-environments such as tidal flat, reef (barrier reef), lagoon, shoal, patch reef, and fore slopes to ramp environments [18,19]. The Qamchuqa Formation is one of the main reservoir rocks in the area, which is situated within the Zagros Fold–Thrust Belt in the Kurdistan Regio, northeast Iraq. The formation crops out at the SW limbs of the Harir and Safin anticlines. Hydrothermal carbonates are common in the Bekhme Formation along the Harir–Safin anticlines and typically crop out close to major strike faults. Bekhme limestone includes reef limestones, fore-reef shoal limestones, and associated facies of the Upper Campanian to Lower Maastrichtian interval [17]. The paleo-environment of this formation is reported as a shallow marine in a carbonate shelf system [17]. The study of the Bekhme Formation in the Bekhme Gorge along the High Zagros Fold–Thrust, shows that the formation of saddle dolomite it contains is attributed to the flux of hot undersaturated basinal/hydrothermal fluids into Cretaceous limestones of the Bekhme Formation along deeply rooted faults [20,21].
Our studied area, e.g., Taq Taq oilfield, lies within the Zagros Sedimentary Basin along the Zagros Thrust Belt, which is a world-class hydrocarbon province located on the NE margin of the Arabian Platform (Figure 1). The structural characteristics in this field consists of an asymmetric double plunging anticline. The structure trends NW-SE, parallel the main axis of the Zagros Fold Belt and the structures at the Khabbaz, Chemchemal, Kirkuk, and Bai Hassan fields [22]. To the NE, a narrow syncline separates the Haibat Sultan ridge of the Khalakan anticline from the Taq Taq structure, with outcrops of Miocene, Eocene, Paleocene, and Late Cretaceous units. The basin is a foreland compressional basin created by the collision of the Afro-Arabian and Euro-Asian plates during the Late Cretaceous and Cenozoic times. The Qamchuqa Formation is the main reservoir at the Taq Taq oilfield and presents different thicknesses varying between 213 m and 219 m. It overlies the Cenomanian Dokan Formation [23].
The Qamchuqa Formation at the Gali Ali Bag Gorge is in the High Folded Zone within NW segment of the Zagros Fold Thrust Belt [24,25,26]. The Lower Cretaceous Qamchuqa Formation (Barremian to Early Cenomanian) is a significant rock unit in terms of outcrop, thickness, and regional distribution in the NE Iraq-Kurdistan Region [27]. In Gali Ali Bag gorge, the exposure carbonates consist of several hundred meters of neritic, thickly bedded shallow water platform facies of the Qamchuqa Formation (Figure 1). The formation is considered a giant Cretaceous reservoir in Taq Taq and Kirkuk Oilfields.

3. Method

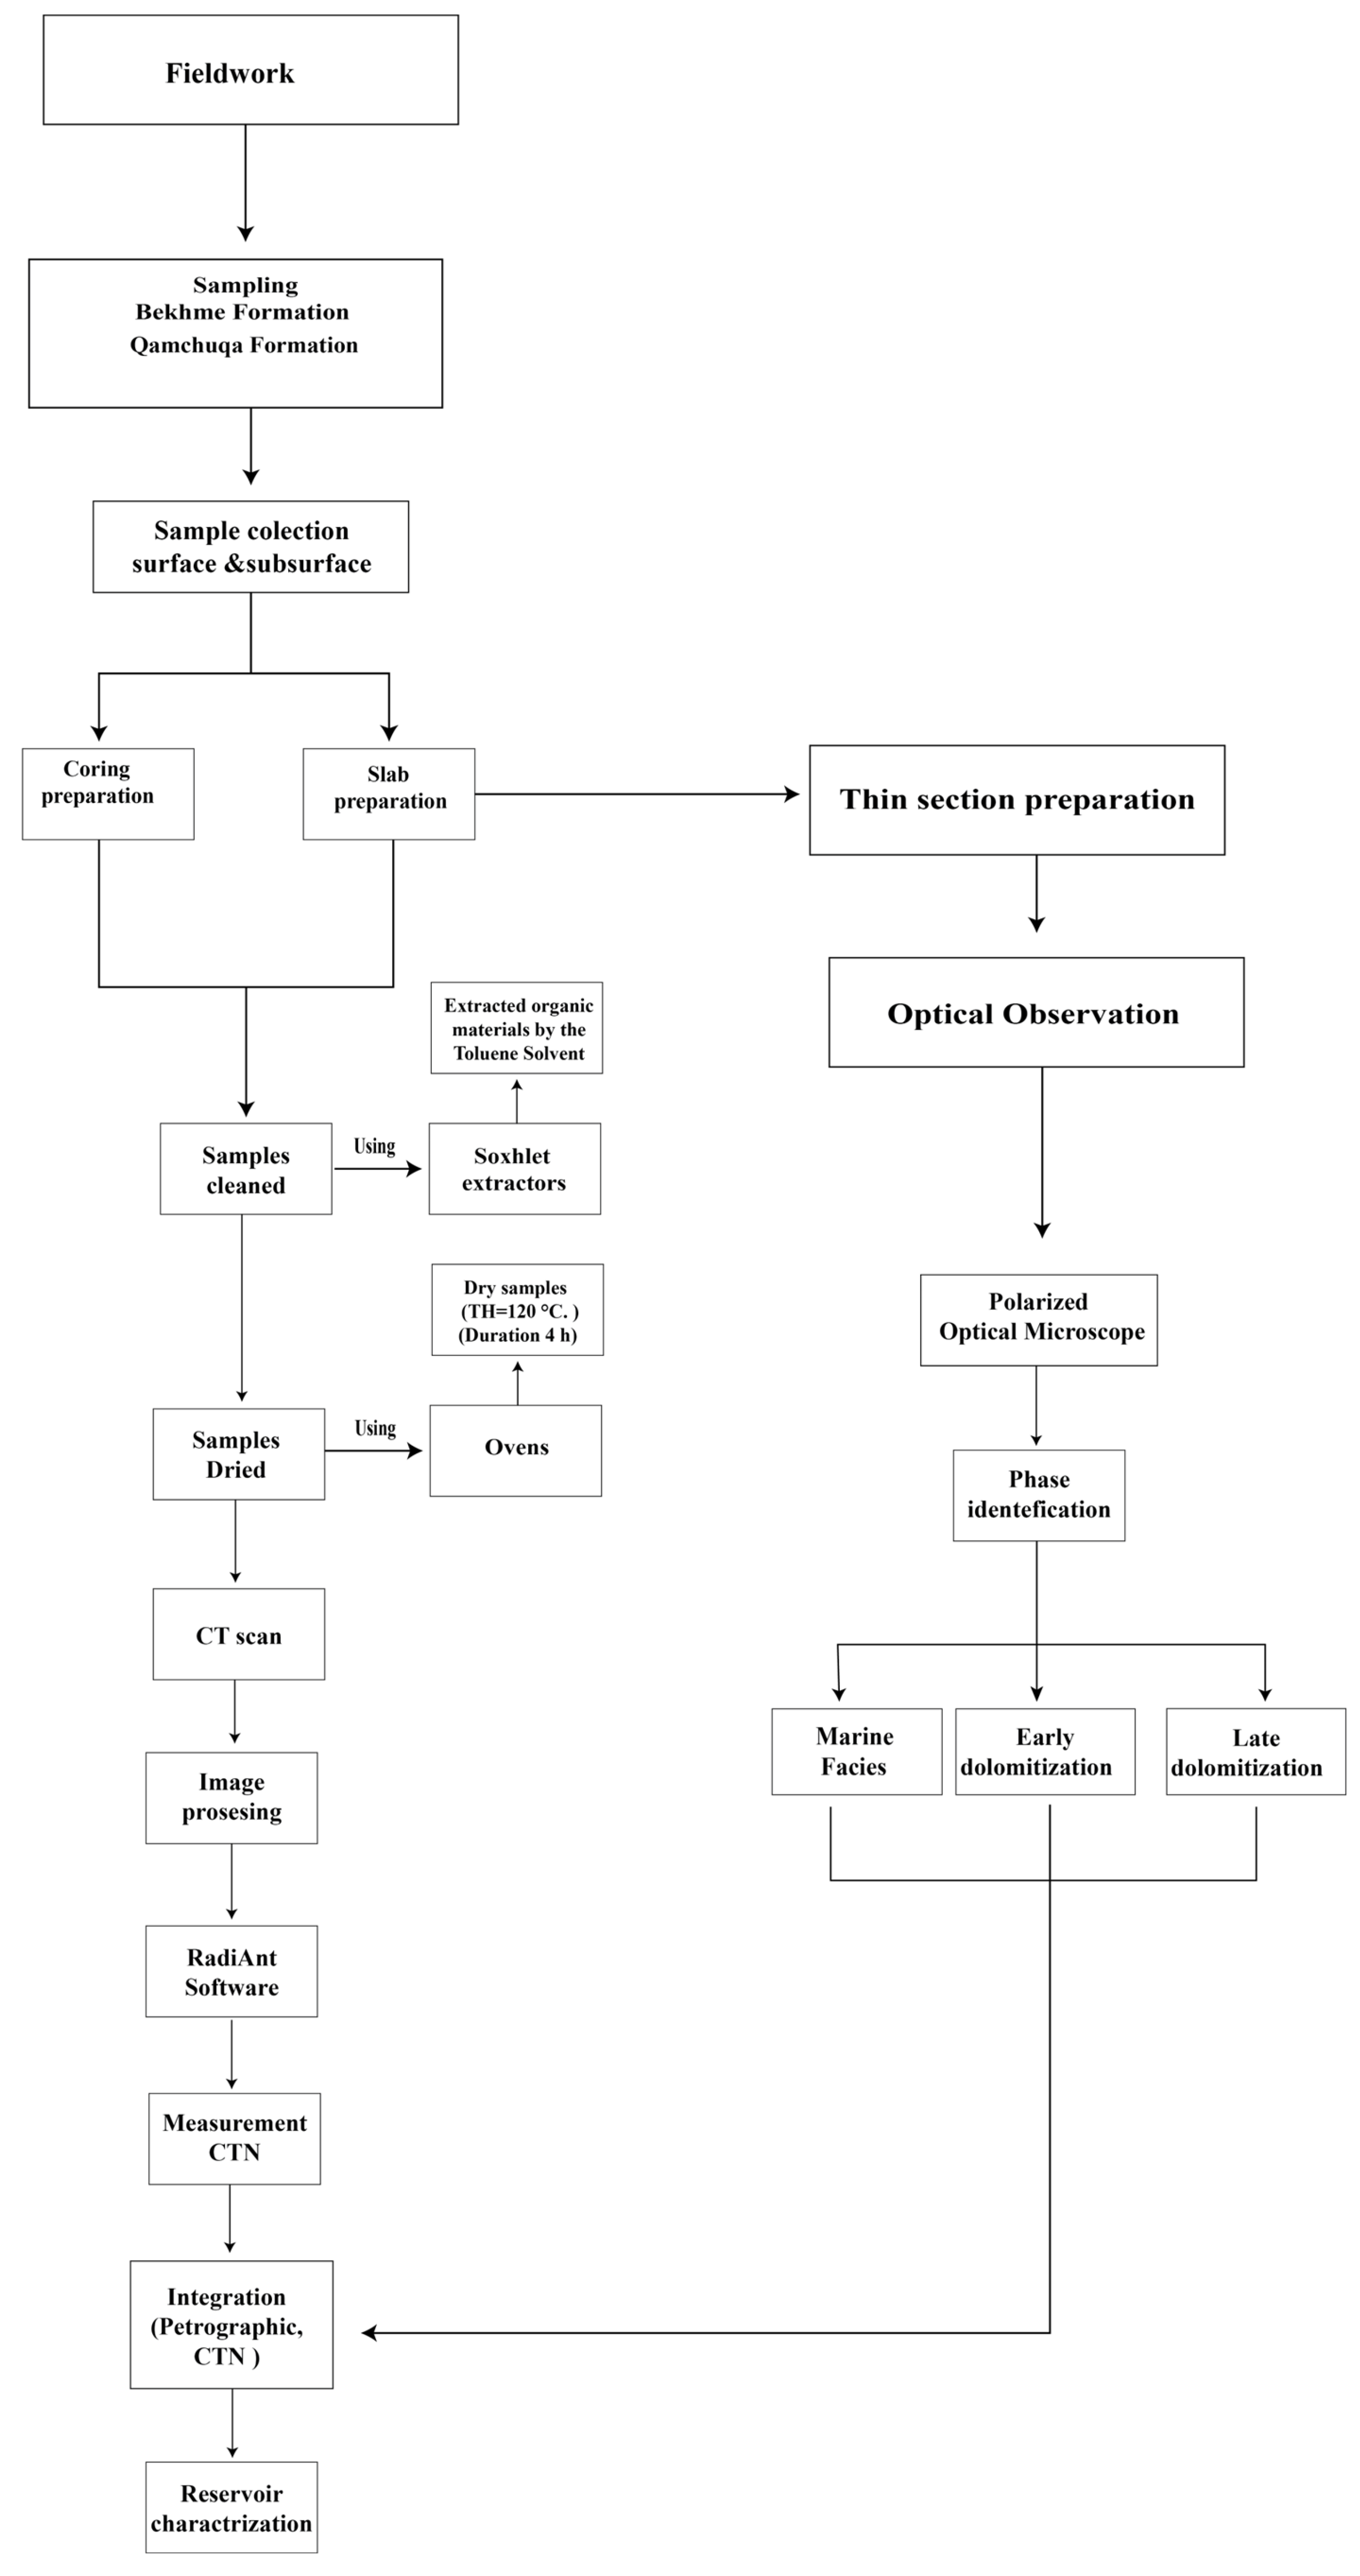
Extensive fieldwork was carried out at the studied outcrops in the Gali-Bekhal, Bekhme and subsurface well at the Taq Taq oilfield (Figure 2). Seventeen samples from the Cretaceous reservoir formations were collected (limestones, dolomites, and zebra dolomites) to infer the direction of the hydrothermal fluid that caused the dissolution, hydrofracturing, and cementation, which influenced the reservoir quality. The paragenetic sequences were studied using an optical microscope to identify the marine, early, and late diagenetic stages. The prepared core plugs and slabs were cleaned and extracted of any organic materials using Soxhlet extractors with toluene. The duration of the cleaning process took 4 h, finally the samples were dried in an oven at a temperature of 120 °C.
The petrophysical analyses of the cleaned seventeen samples were conducted using an advanced generation of X-ray computed tomography (CT). The CT scanning procedure was performed on the Philips Sensation 64-slice CT scanner, which provided an isotropic resolution range of 0.24 mm to 0.33 mm. This technological approach is characterized by its rapid execution, dependability, and best imaging quality.
The analyses focused on the distribution of fractures, vugs, matrix, marine limestone, and dolomite cementation within each sample. The main principle of CT is represented by the transmitted and incident intensities I and I0, respectively. The linear attenuation coefficient is denoted as µ(s), and the latter is consistent with densities of the material that X-ray passes thorough at different angles and cross-sections (see Equation (1); Beer’s Law).
I = I 0 e ( μ t )
The attenuation rate is responsible for distinguishing and identifying the mineralogical composition. The quantification of X-ray attenuation within the material being transmitted is assessed through the CT number. For materials with higher densities, X-rays experience significant attenuation, resulting in a larger CT number. The formula for defining the CT number is as follows (Equation (2)):
CTN = (µMatrix − µWater)/µWater × 1000

4. Results

4.1. Field and Petrographic Observation

The Qamchuqa Formation considered a significant reservoir for undiscovered oil and gas resources in the high folded zone region of the NE-Iraq. The Qamchuqa Formation is characterized by diverse geological facies and textures, influenced by extensive diagenetic alteration. The formation has experienced significant alteration, and produced a complex diagenetic history, likely due to hydro-fracturing and hydrothermal fluids. Field and petrographic observations show intermittent occurrence of zebra-like texture, hydro-brecciation texture, and voids/fractures-filling saddle dolomites. The sampling focuses on six sites, and the investigation targeted the hydrothermal fluid distribution and hydrothermal dolomitization features [28]. The Qamchuqa Formation at the Taq Taq oilfield lacks the distinctive textural features of HT signatures under subsurface deep setting compare to the outcrop sample [28].
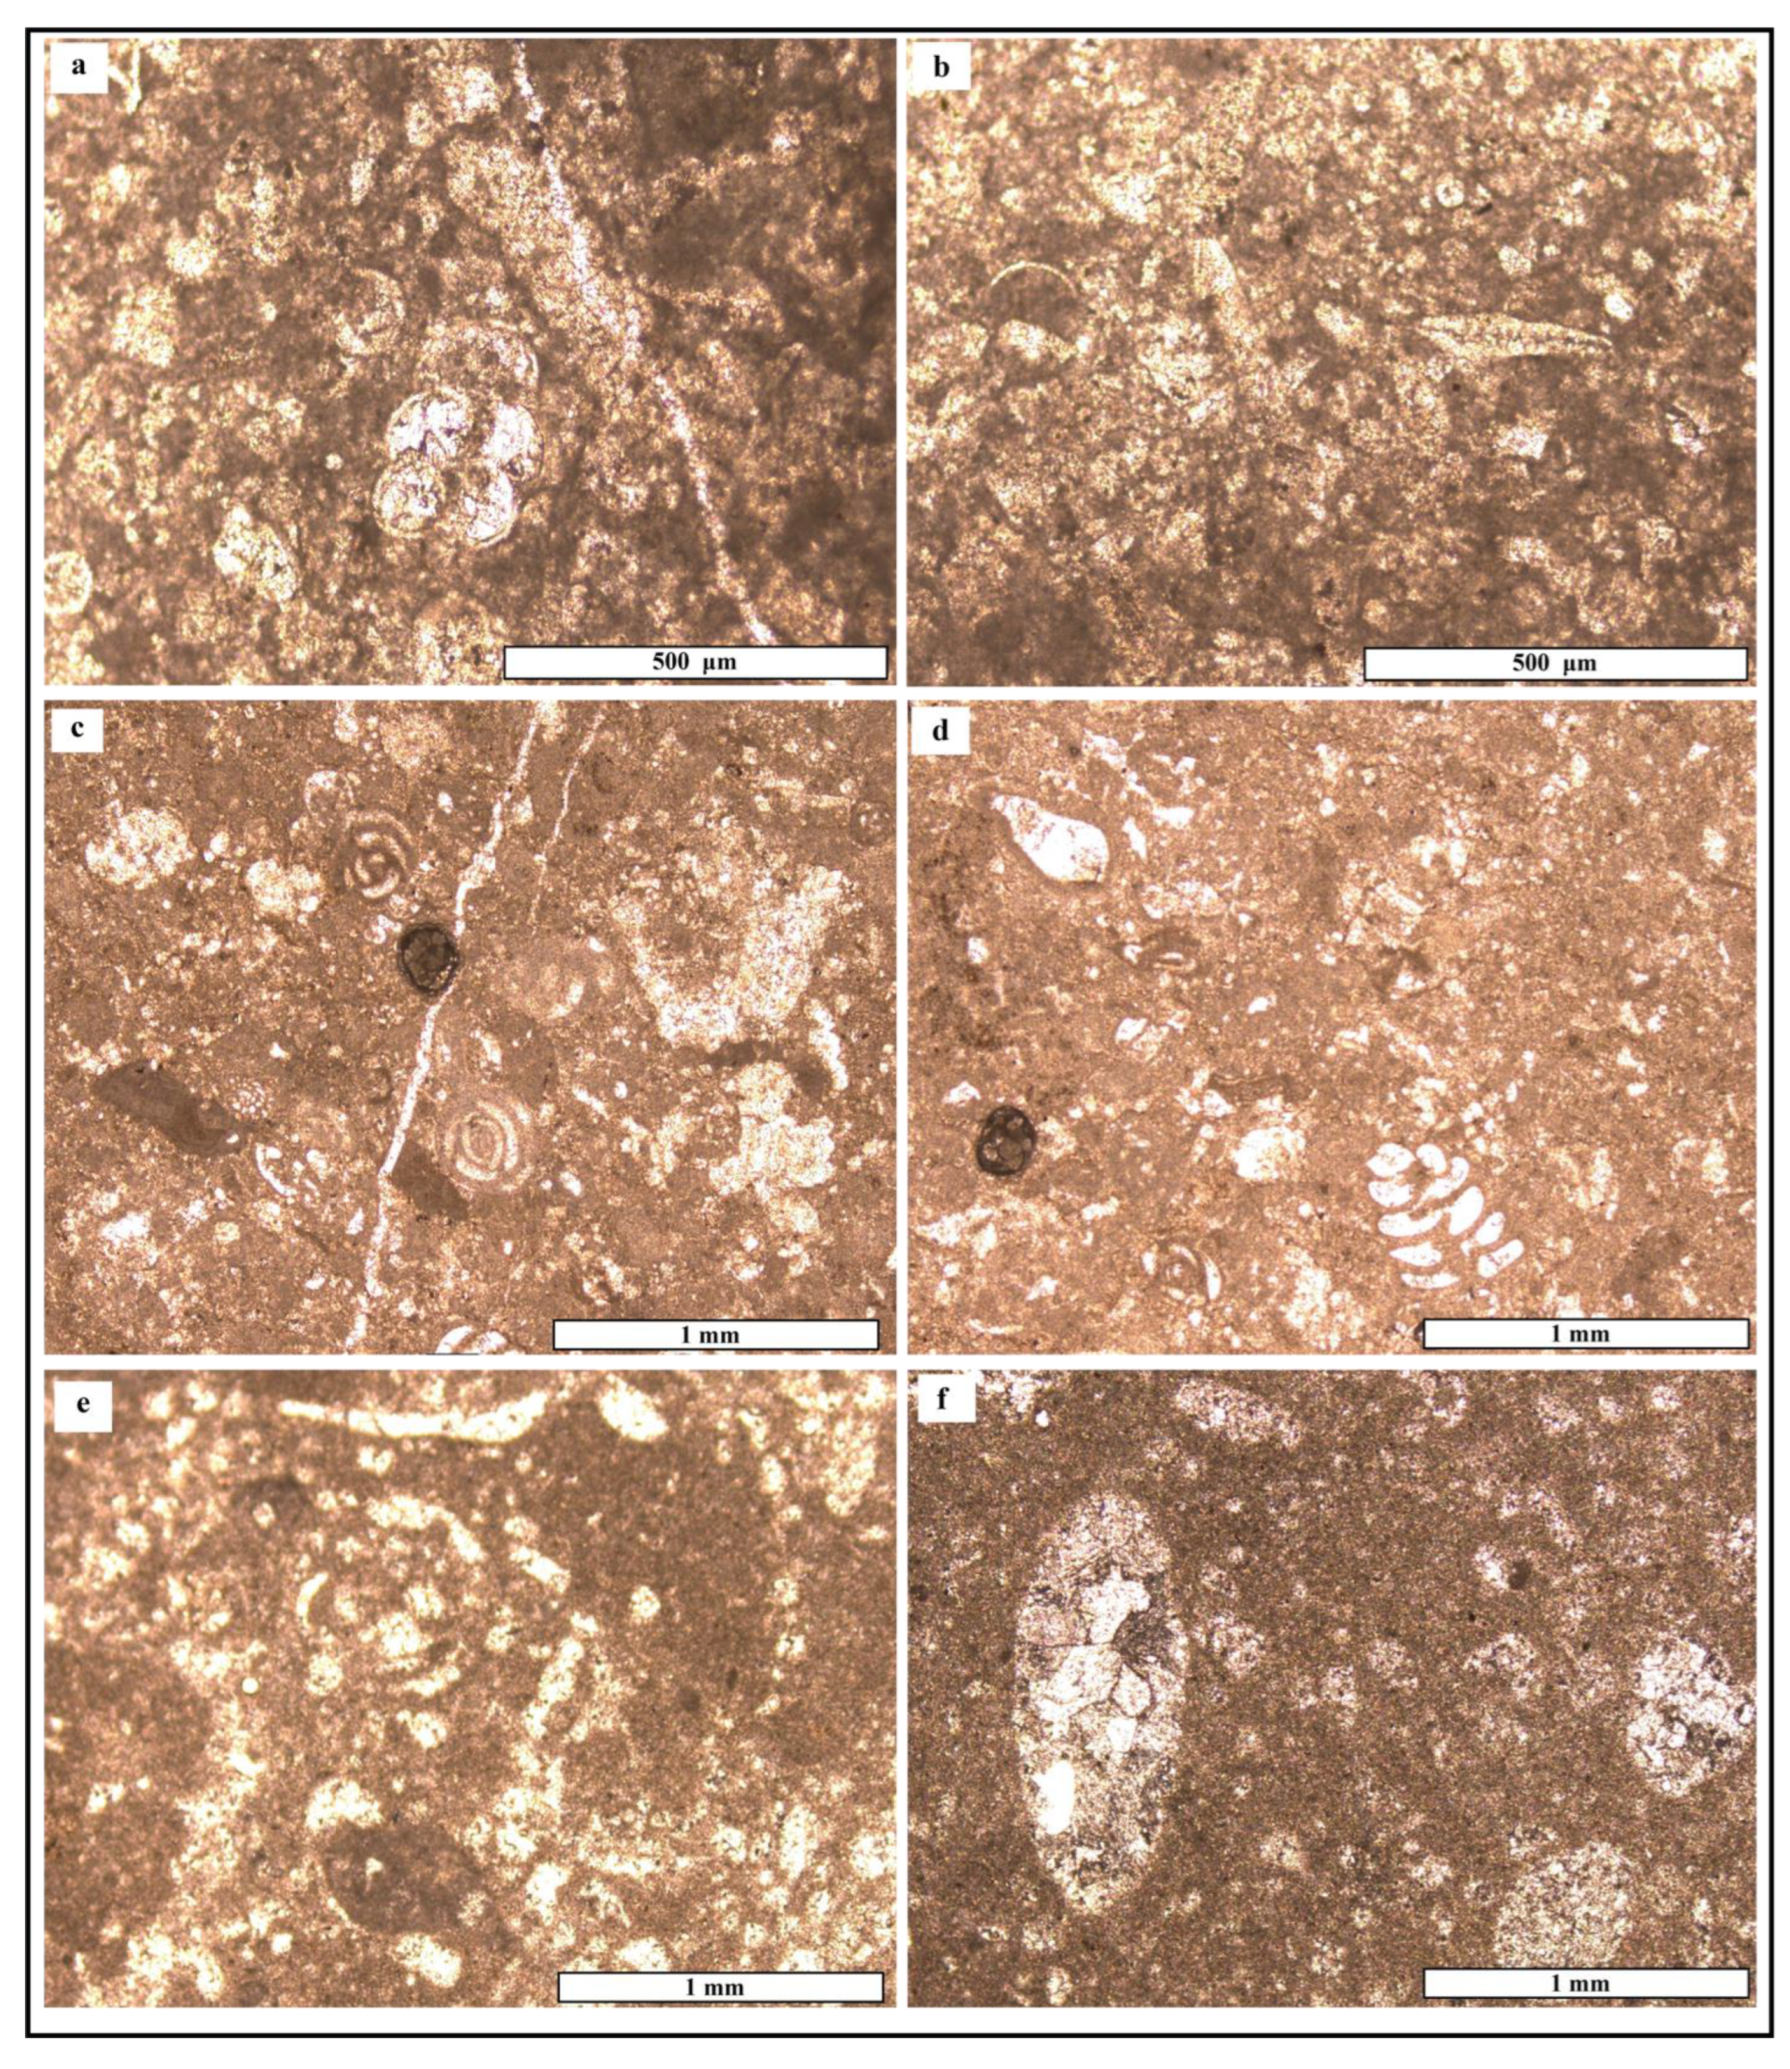
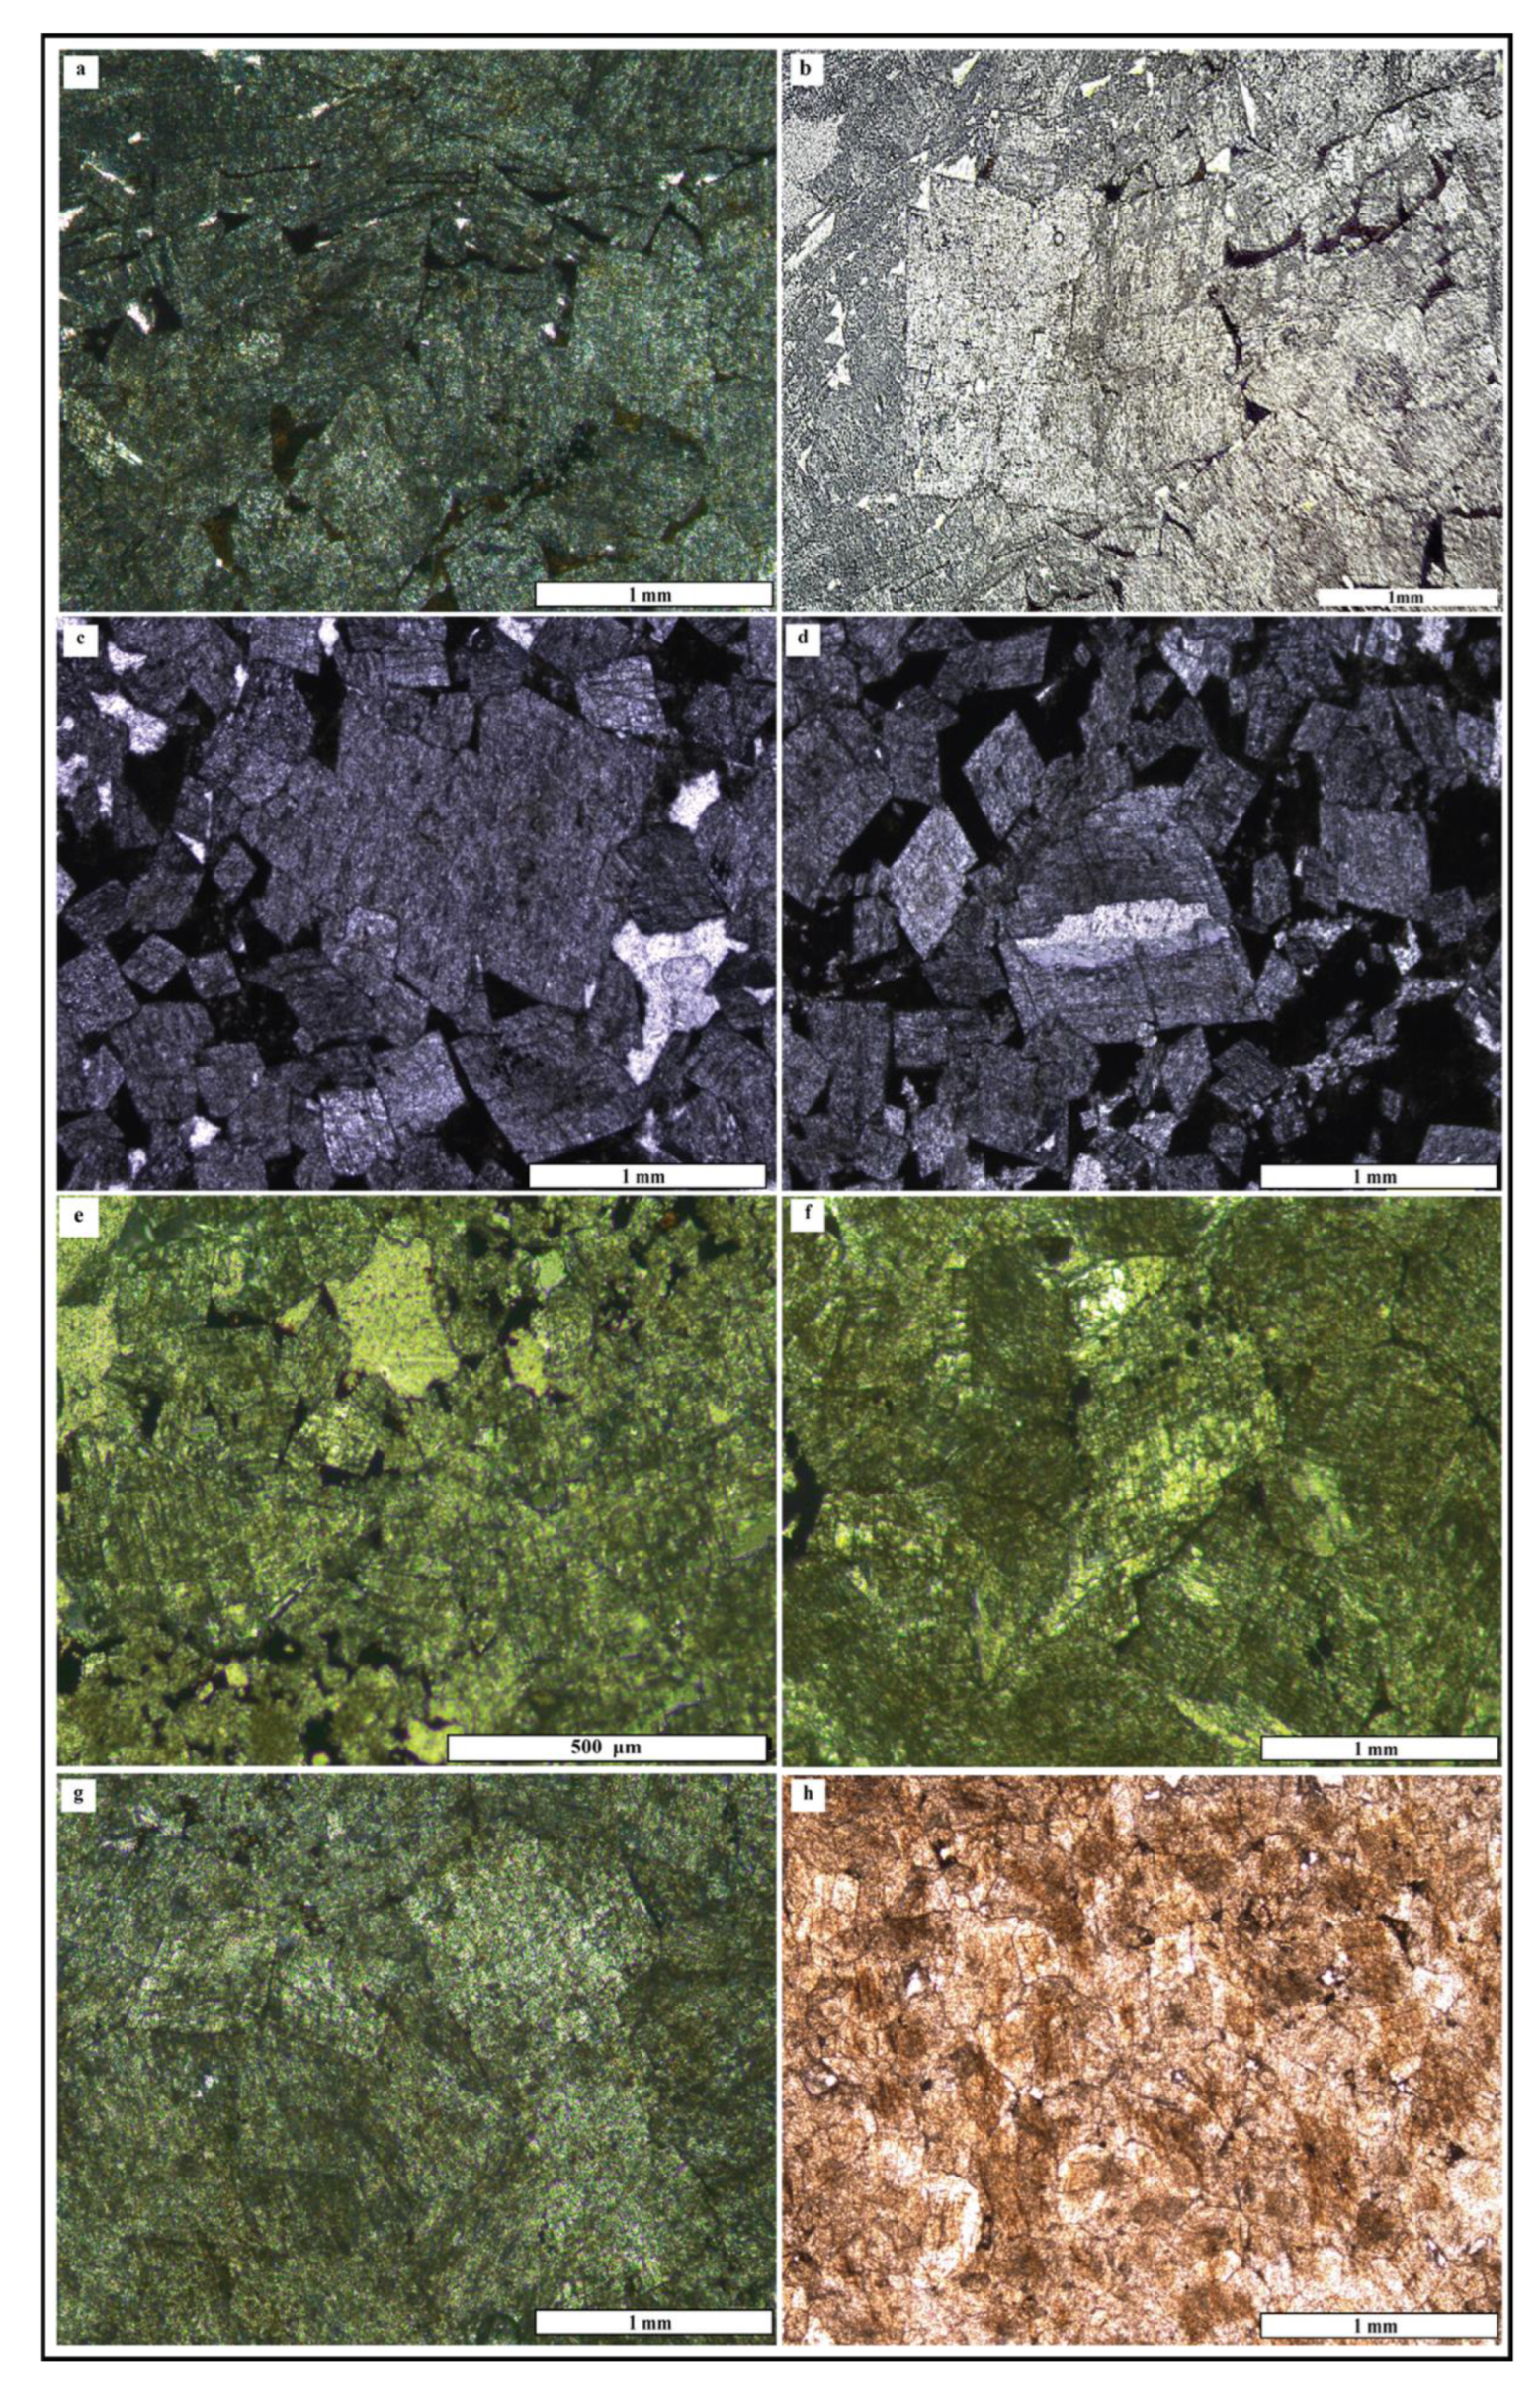
The petrographic observation of the studied sections focused on 20 thin sections encompassing marine, early dolomitization, and late-HT dolomitization facies. For the marine facies, the mudstone microfacies is predominant in the formation, mainly consisting of micrite and partly dolomitized grains. These microfacies are found in both outcrop and subsurface settings, comprising skeletal grains, miliolids, globigerinids, and other unidentified foraminifers (Figure 3a–f). Wackestone is characterized by sand-sized bioclasts floating in a micritic groundmass, along with packstone, which is the major microfacies with abundant foraminifers. The grains have broken and are likely exposed to physical compaction and cement formation. The last microfacies consists of a boundstone with abundant bryozoan and rudist clasts (Figure 3a–f).
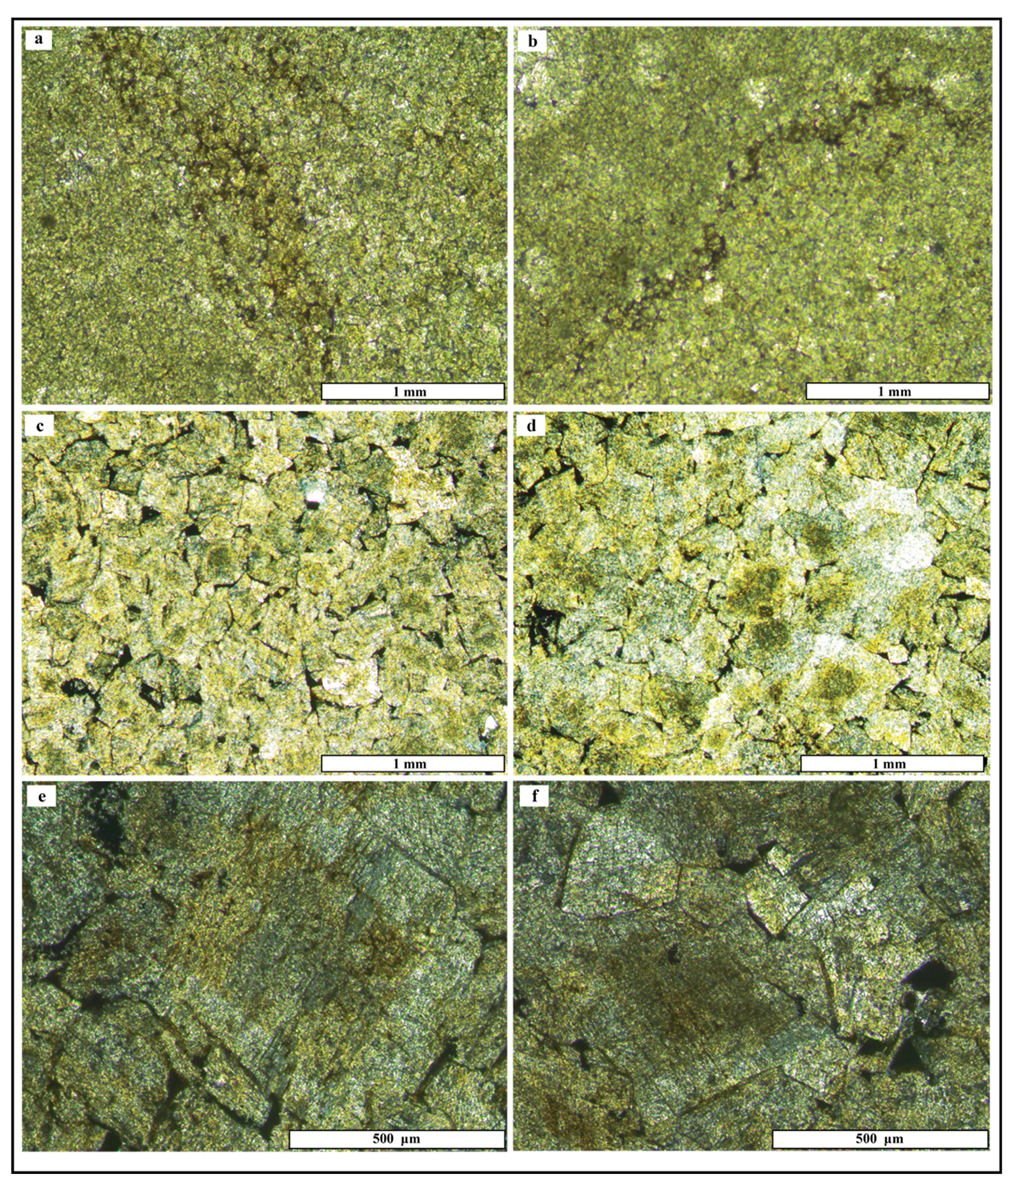
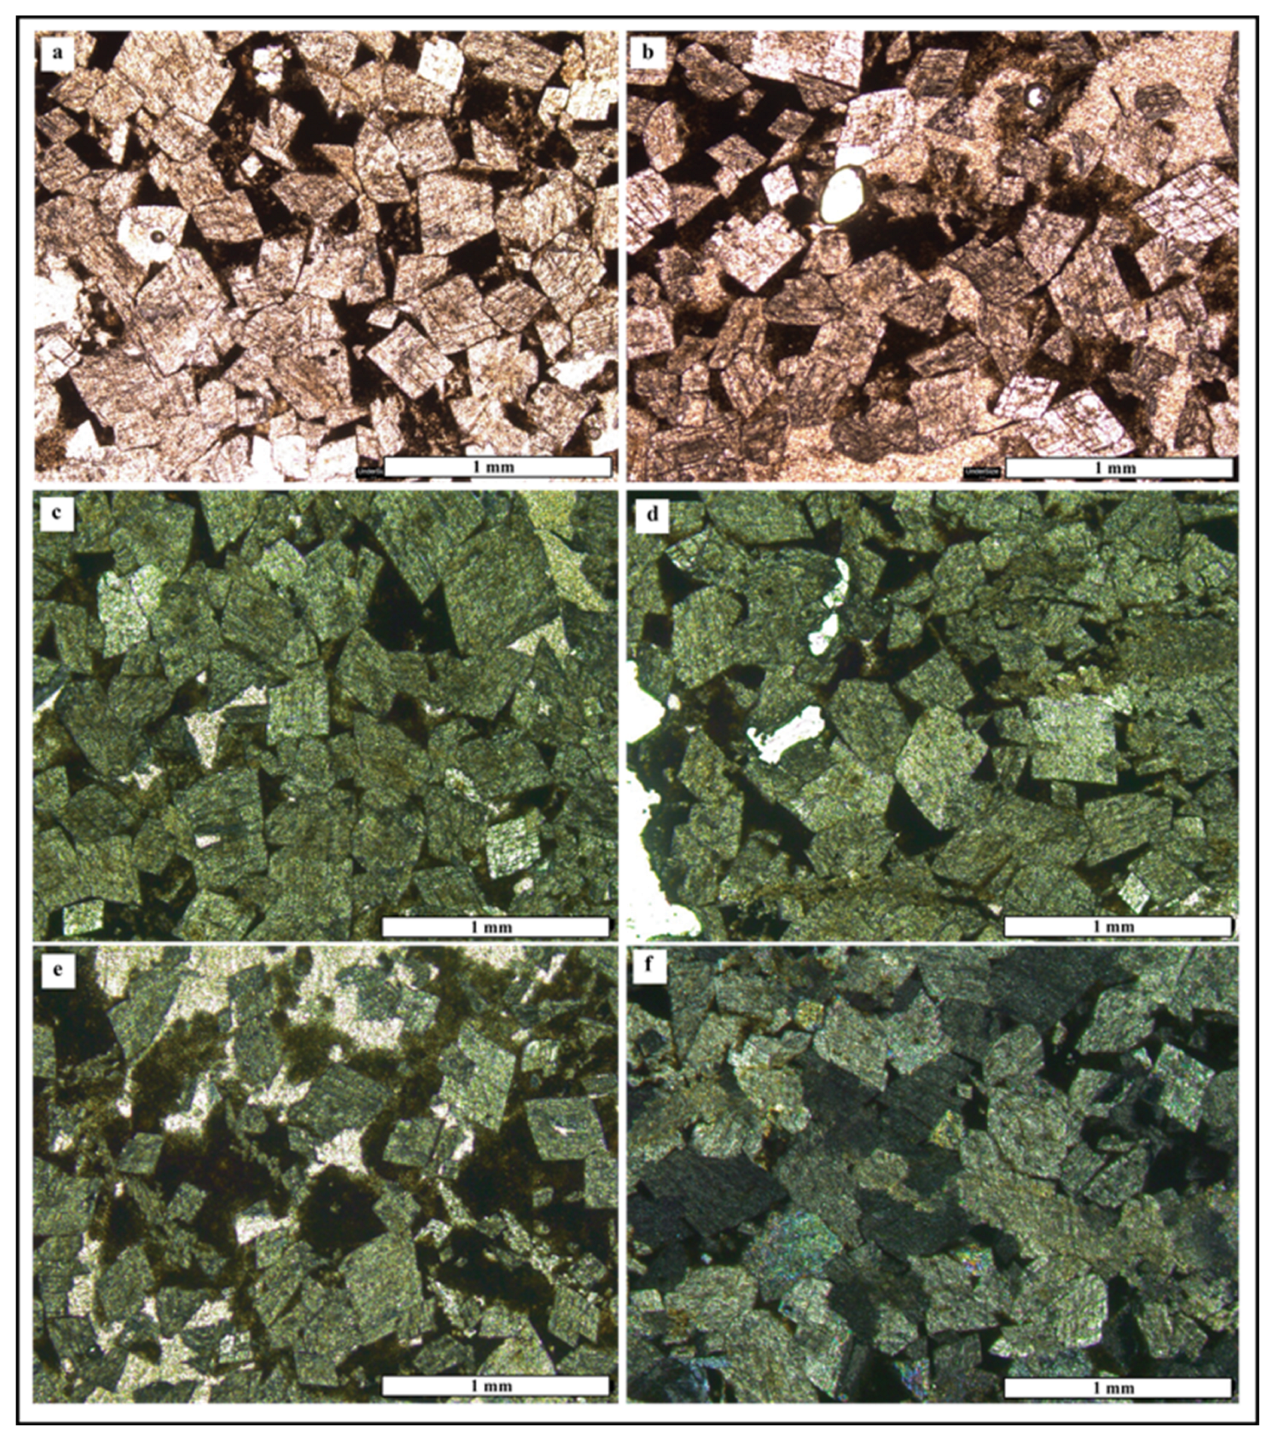
The early dolomitization shows multiple phases: anhedral replacive dolomitization, subhedral growing dolomitization, and euhedral dolomitization from both surface and subsurface settings [28]. Early dolomitization is characterized by fine, anhedral, and non-planar dolomite crystals (Figure 4a–f and Figure 5a,b). Replacive dolomite is the earlier phase, and consists of very fine or tiny crystals (dolomicrospar), partially replacing the muddy matrix of the marine facies. Remnants of precursor micrite or bioclasts suggest that early dolomitization was not completely fabric-destructive (Figure 4c–f). Intercrystallite porosity is frequently observed in the subsurface setting and contains hydrocarbons.
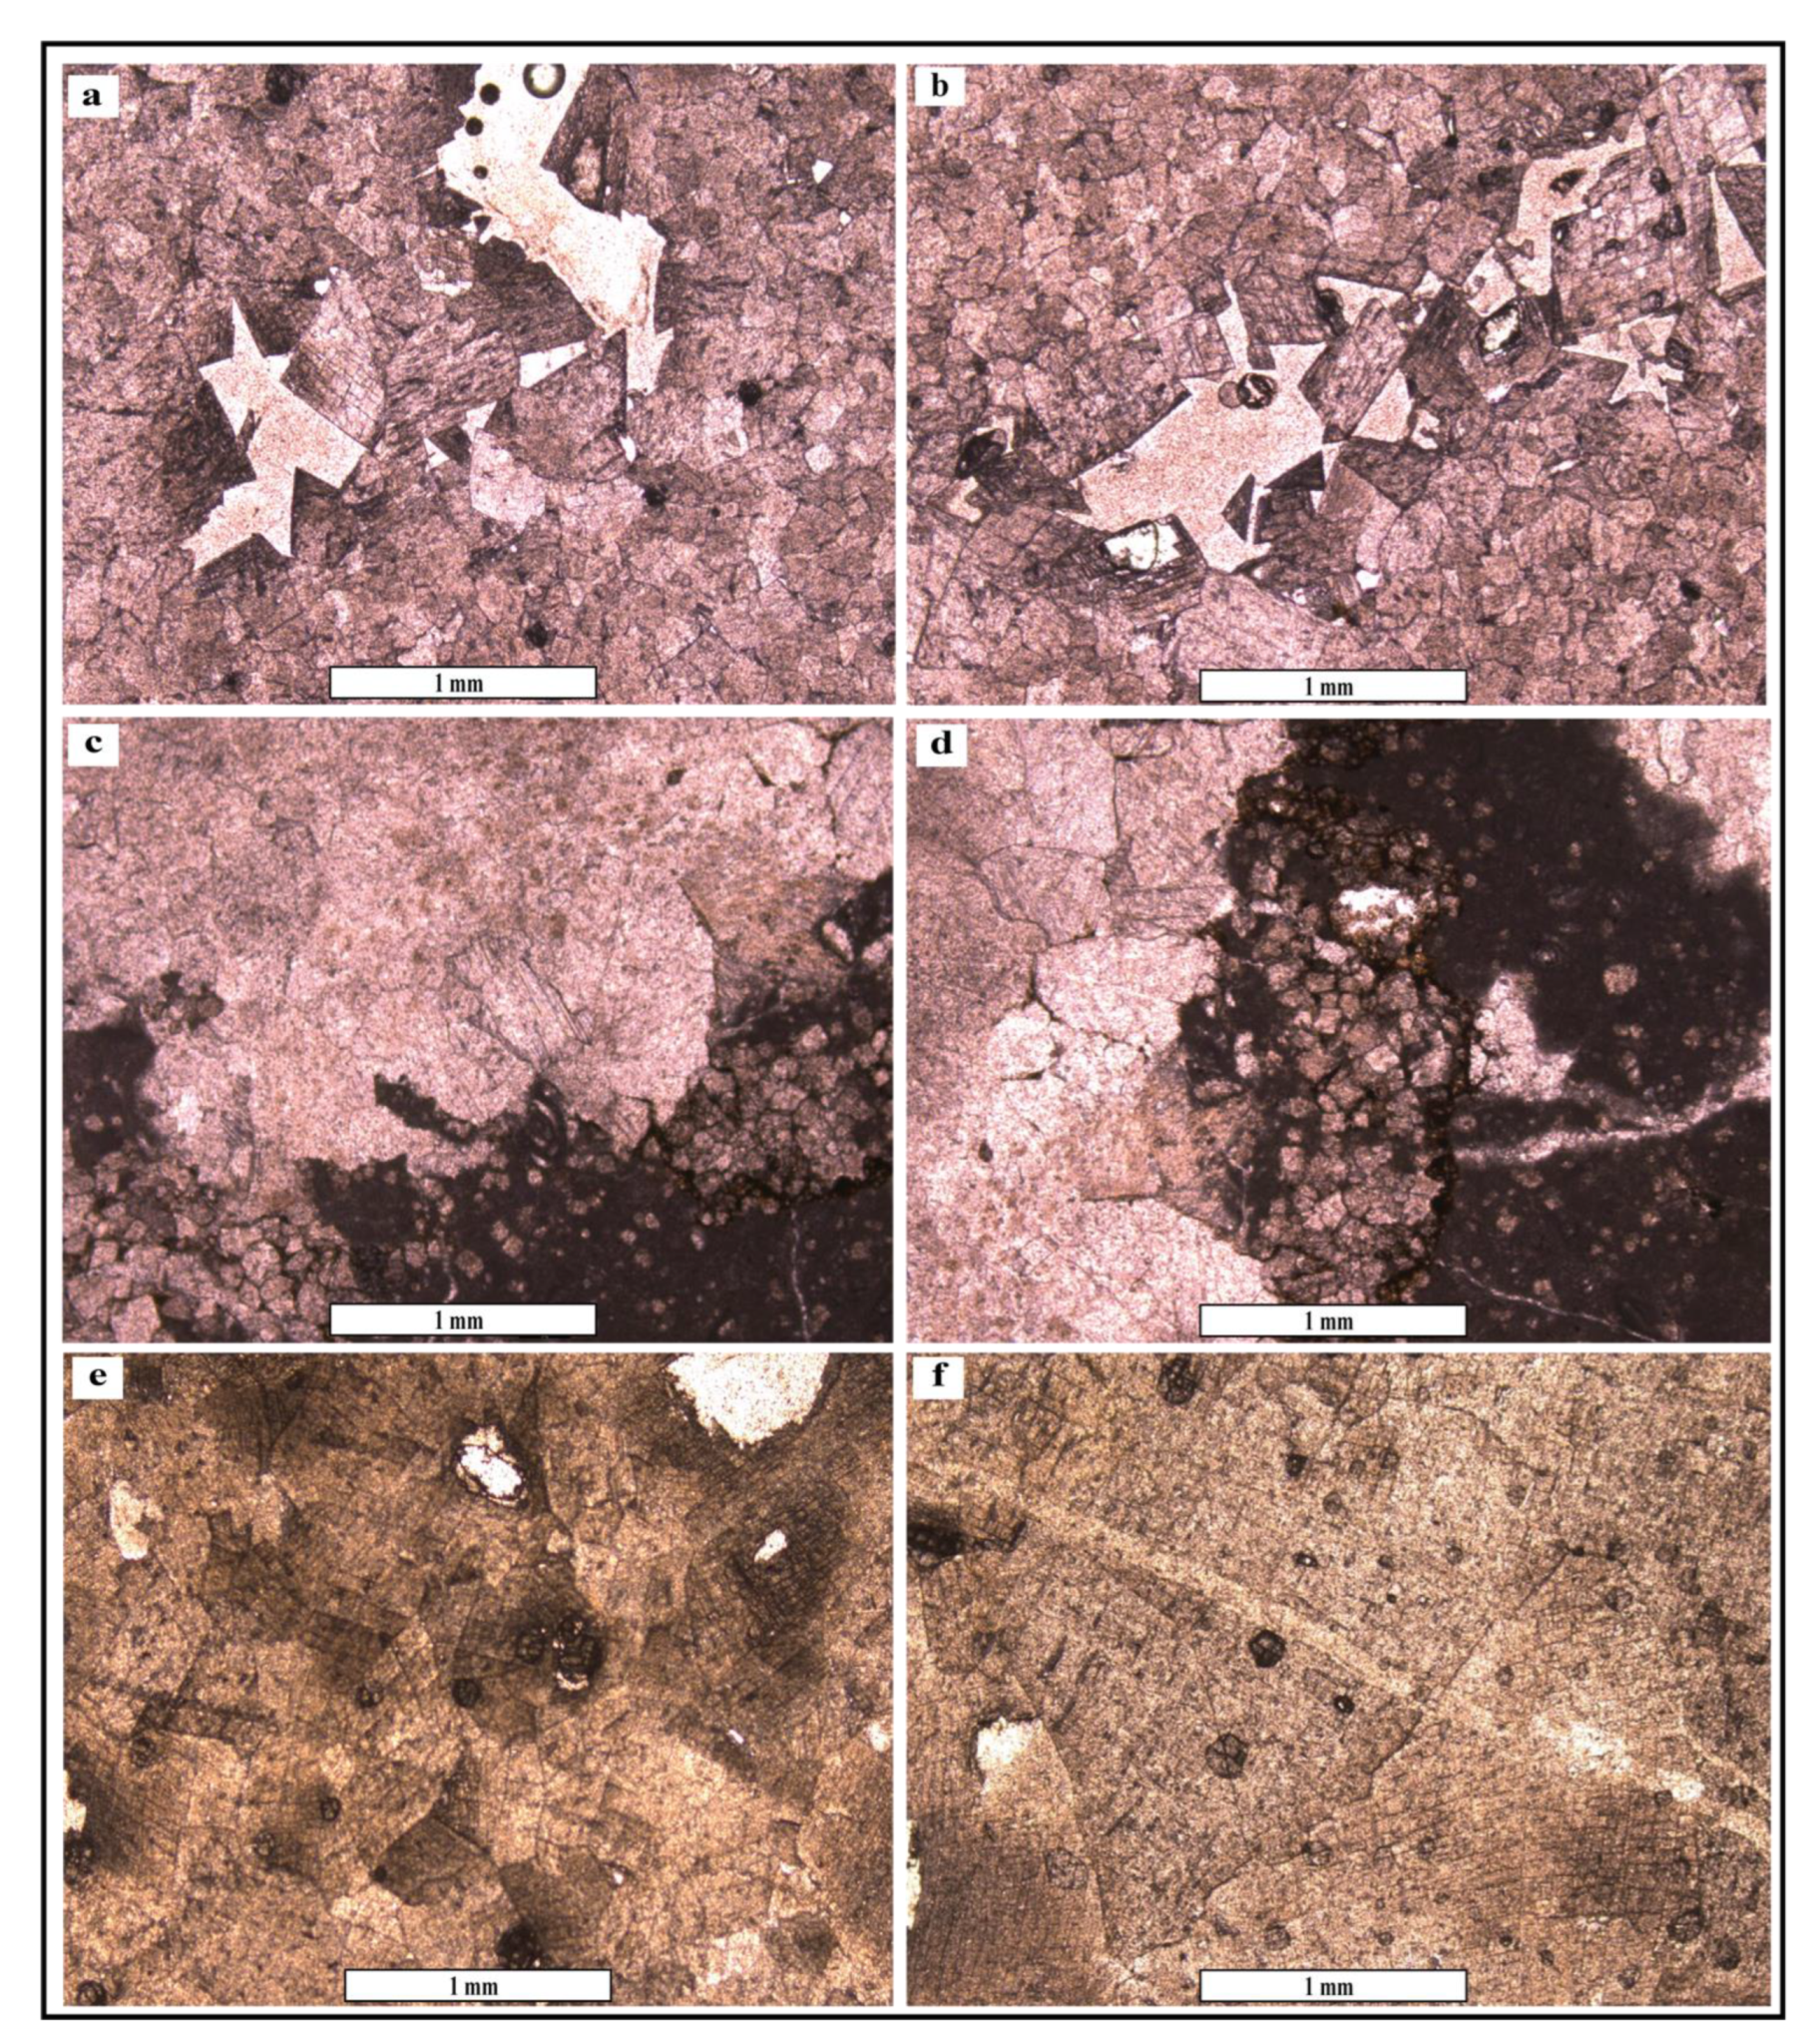
Subhedral dolomitization, replacing the microspar through aggrading growth precipitation in non-hydrothermal dolomitization condition. These crystalline/dolomicrospar phases were initiated in a shallow environment as an early diagenetic phase (Figure 5a,b). This dolomitization event was followed by seepage of hydrothermal fluids, which partly filled the vuggy porosity (Figure 5a–f). Finally, under deeper burial conditions part of the intracrystalline porosity was filled by hydrocarbon, and associated with recrystallization of coarse dolomite textures (Figure 4c–f). This transformation is likely driven by increased temperature, pressure, and fluid–rock interaction that allow crystals to grow from fine-grained to coarse-grained dolomite crystals [28]. The subhedral dolomitization in the deep subsurface setting shows complete replacement of dolomite, which is collectively represented by tight and compact zoned crystals. (Figure 4c,f).
The late dolomitization shows multiple types of saddle dolomite phases (SD) in the surface section (Figure 5a–f), while in the Taq Taq oilfield (subsurface section) at least one phase of the saddle dolomites (SDs) was observed (Figure 6 and Figure 7). Coarse saddle dolomites typically precipitated in open cavities and fractures, suggesting the origin of SD formation from hydrothermal fluids [28]. The SDs composed of non-planar coarse euhedral to subhedral crystals were formed under high-temperature conditions. The SDs in the subsurface setting of Qamchuqa Formation at depths >2 km shows a typical warped lattice. This lattice produced a distortion texture, which is more affected by corrosion, solubility, and compaction due to the burial weight. This distortion is a direct indicator of increasing burial weight, and subsidence rate [28]. With increasing vertical stress due to burial depth, subsequent brecciation and fracturing within saddle dolomitization occur with a significant increase in porosity and permeability. Under conditions of high temperature and pressure and an increase in vertical stress, SDs undergoes a clear change progressing from a plastic phase to a brittle phase (Figure 6a–f); in places these SDs experienced distortion and twisting features, later leading to brecciation one (Figure 6a–f).

4.2. X-Ray Computed Tomography

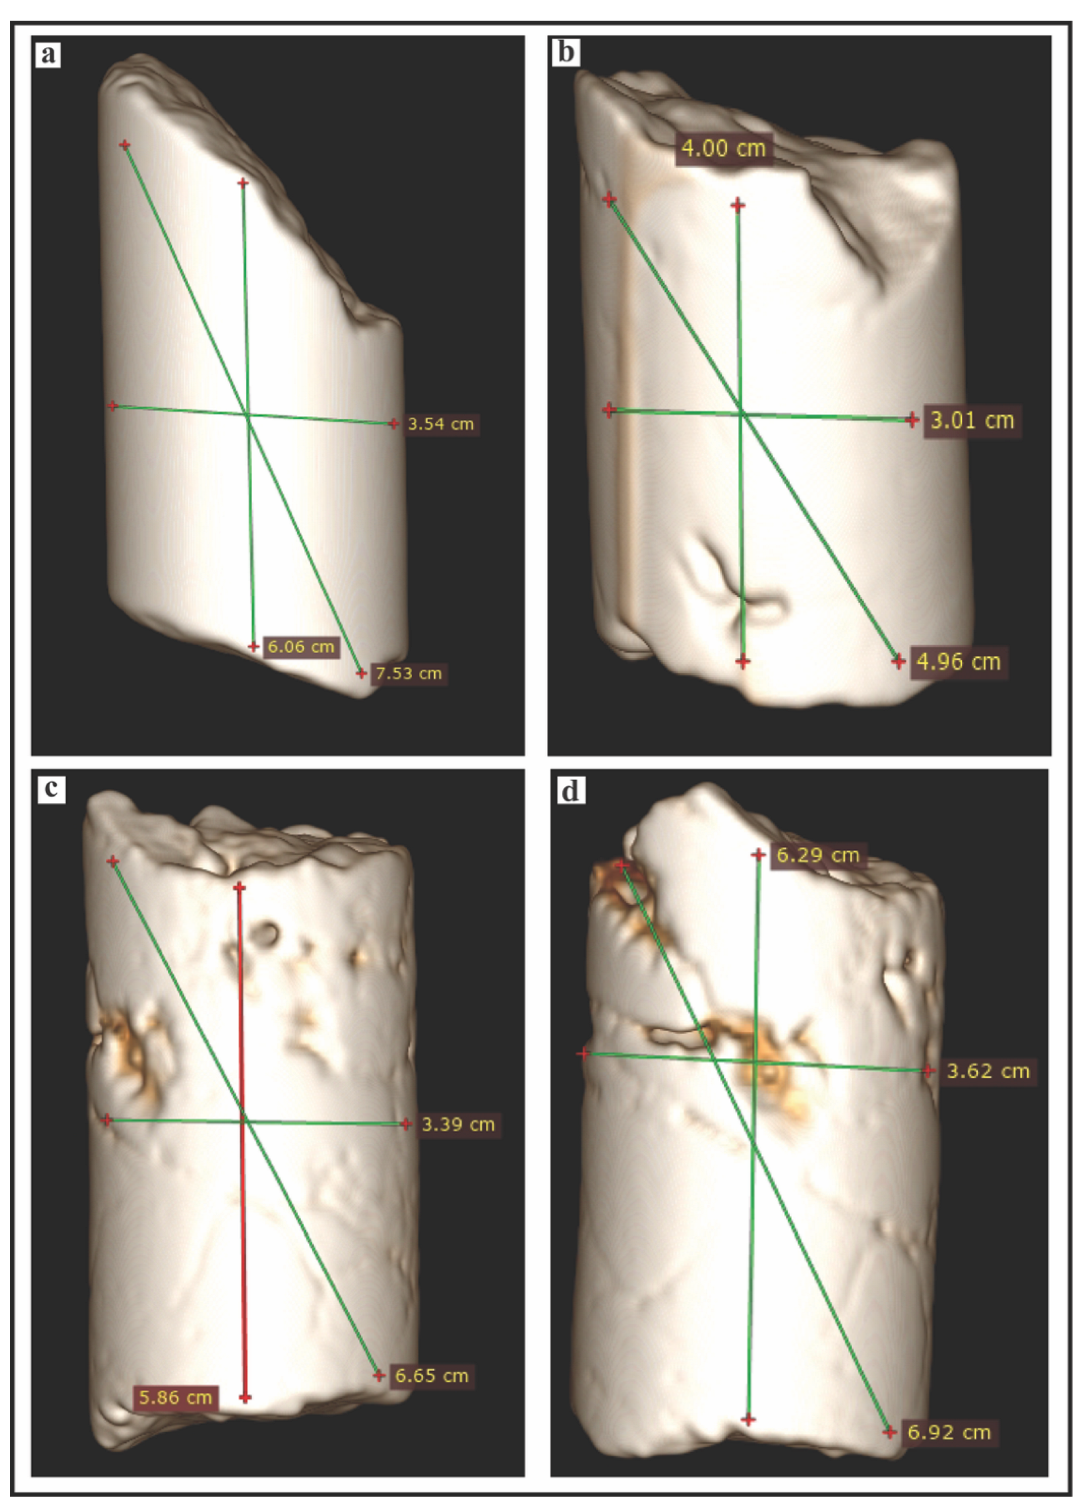
The CT imaging scan was carried out on 17 samples, each sample have been measured from three lines (vertical (V), horizontal (H), and inclined direction; see Figure 8). The total lines include 51 lines and 5250 micro-spot analyses. These measurements were considered three facies: (i) marine, (ii) early diagenetic, and (iii) late diagenetic facies. To cover the whole sample, different directions along vertical (V), horizontal (H), and inclined (I) lines were considered. The analyzed samples cover the surface Gali-Bekhal, Bekhme, and subsurface Taq Taq oilfield samples in northern Iraq. The analysis of CT-imaging scan is based on the linear attenuation coefficient and standardized against a reference material (such as water or air), allowing each substance to be assigned to a consistent value. This value allows the calculation of attenuation for other materials and is referred to as the Hounsfield Units (HU) or CT number (CTN), which is associated with the specific material (See Equation (2); Figure 8).
Utilizing CTN measurements, the porosity and permeability were measured based on the following equations [29]:
= 0.0234 × C T N + 63 .
            K   m a t r i x = 0.0433 e 0.2153                        
                K   v u g = 0.0384 e 0.2242                                      

X-Ray Computed Tomography Variation Across Cretaceous Reservoir Rocks

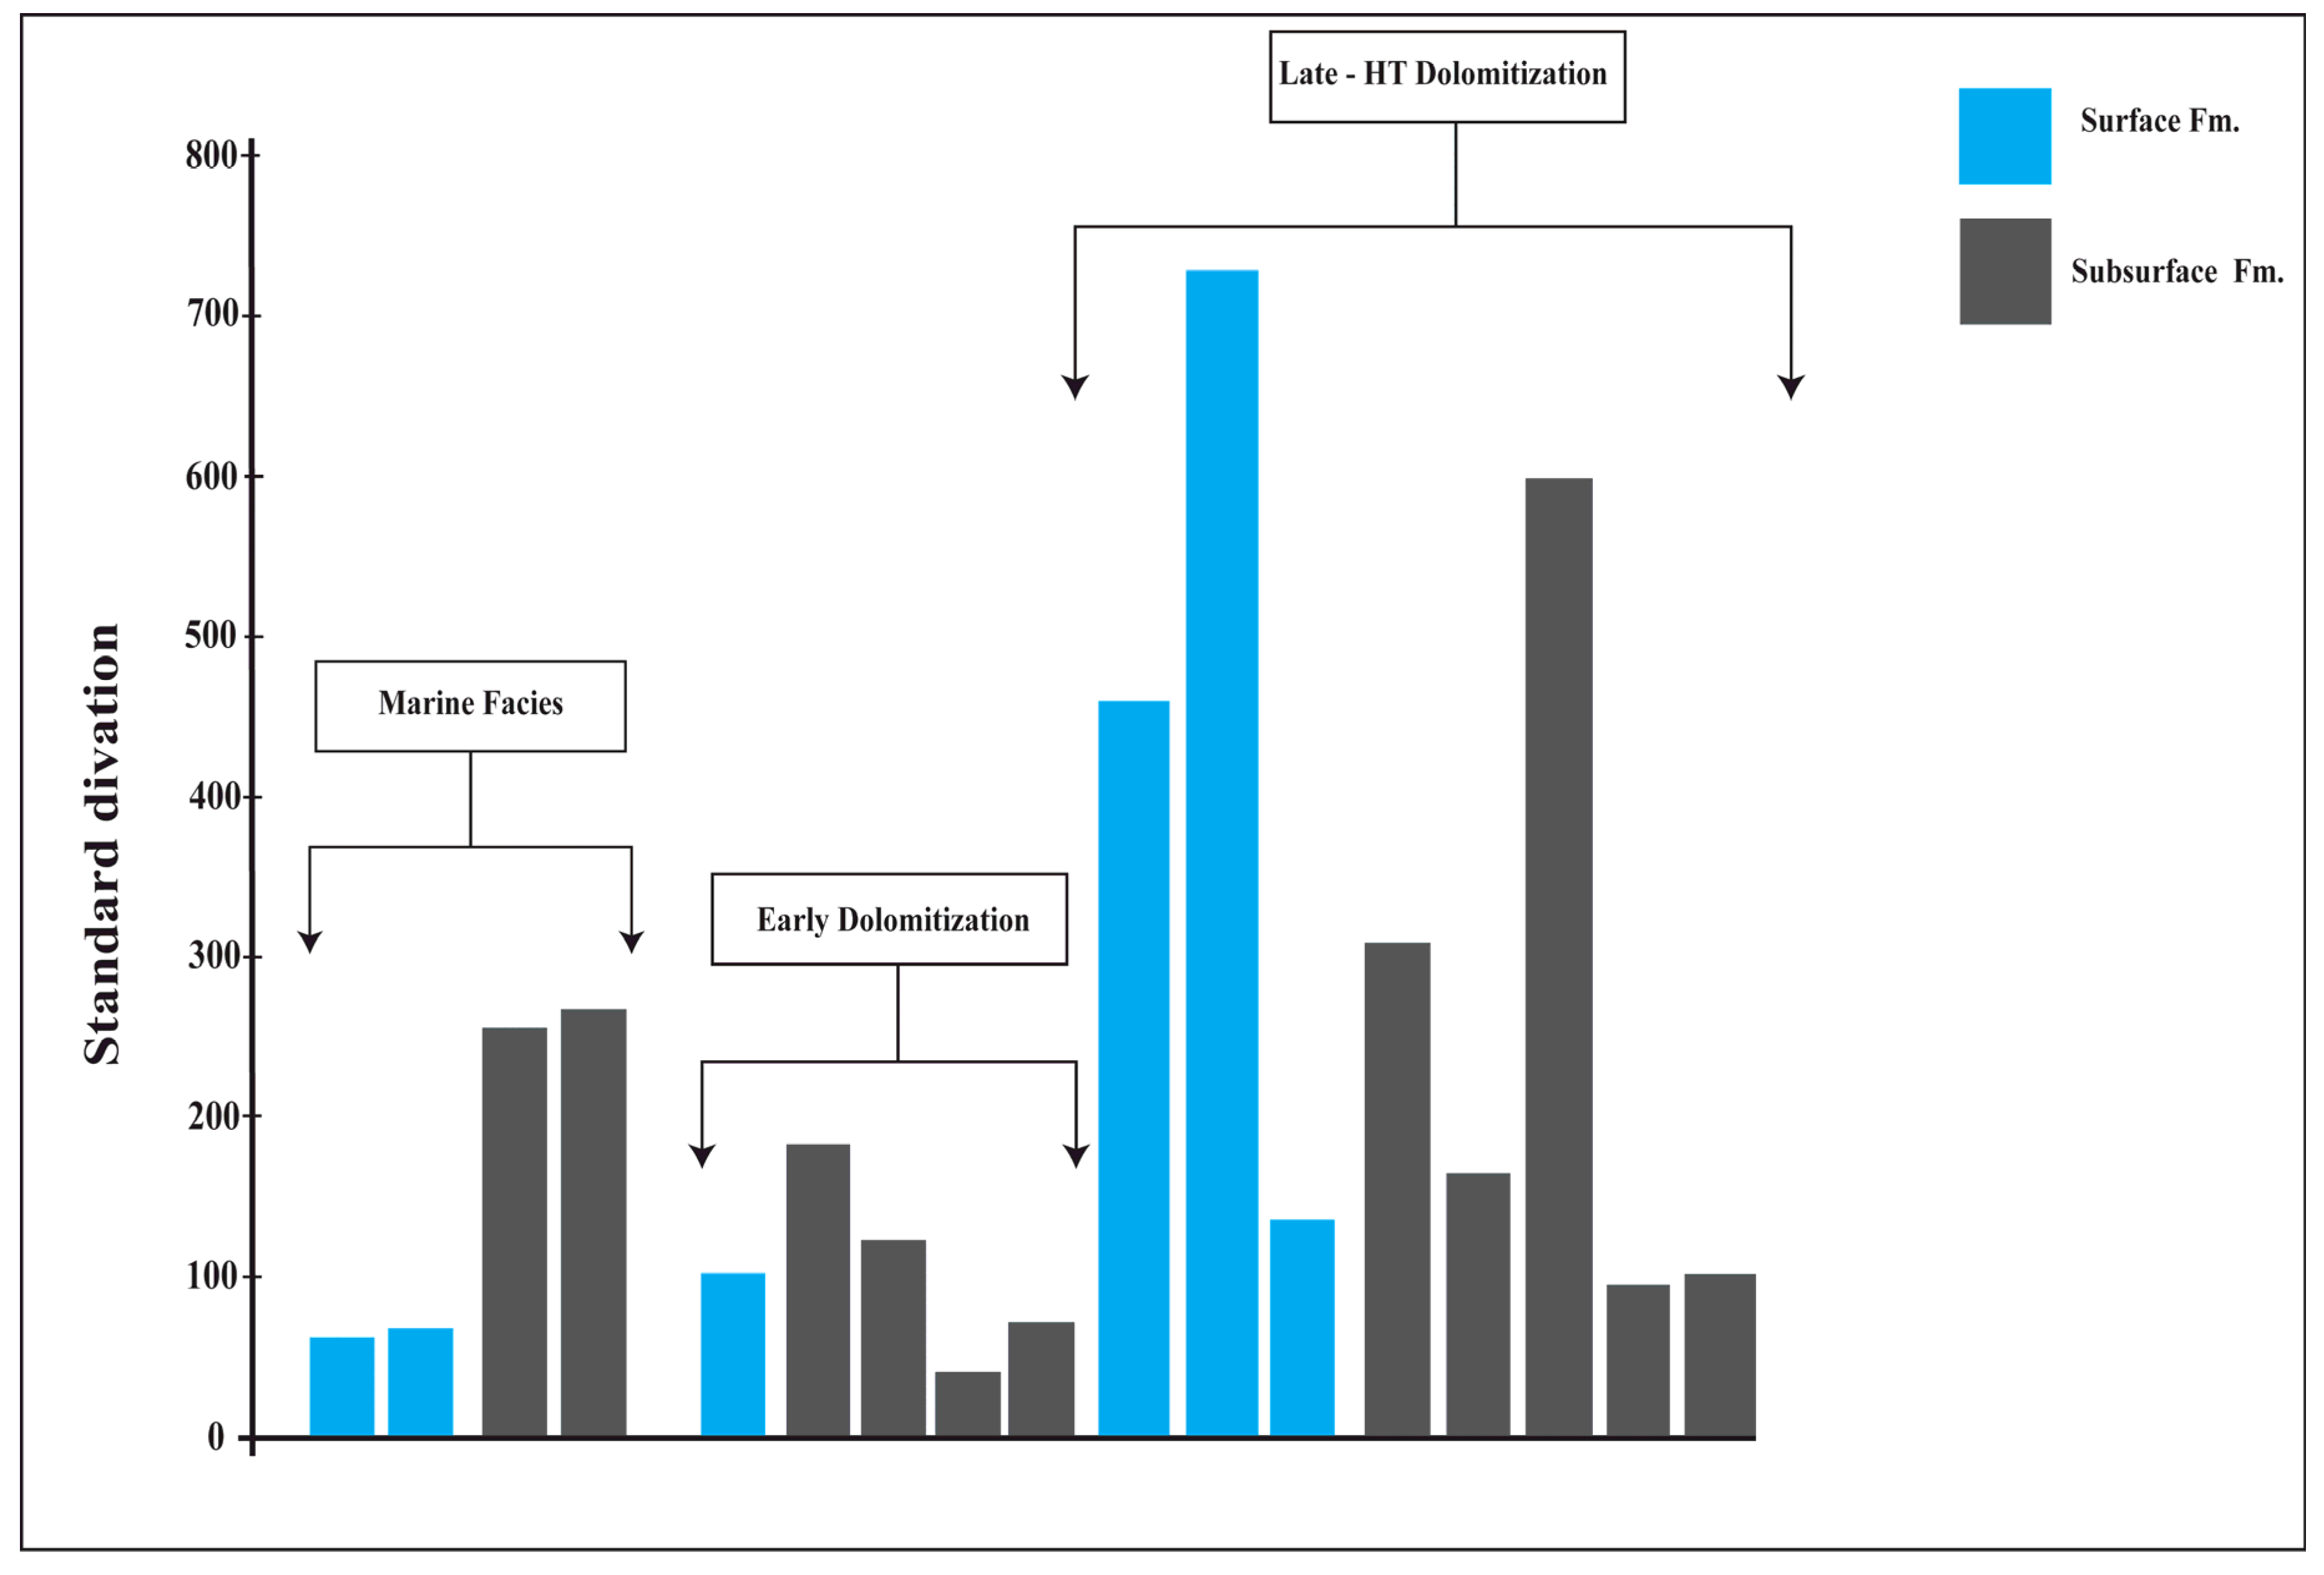
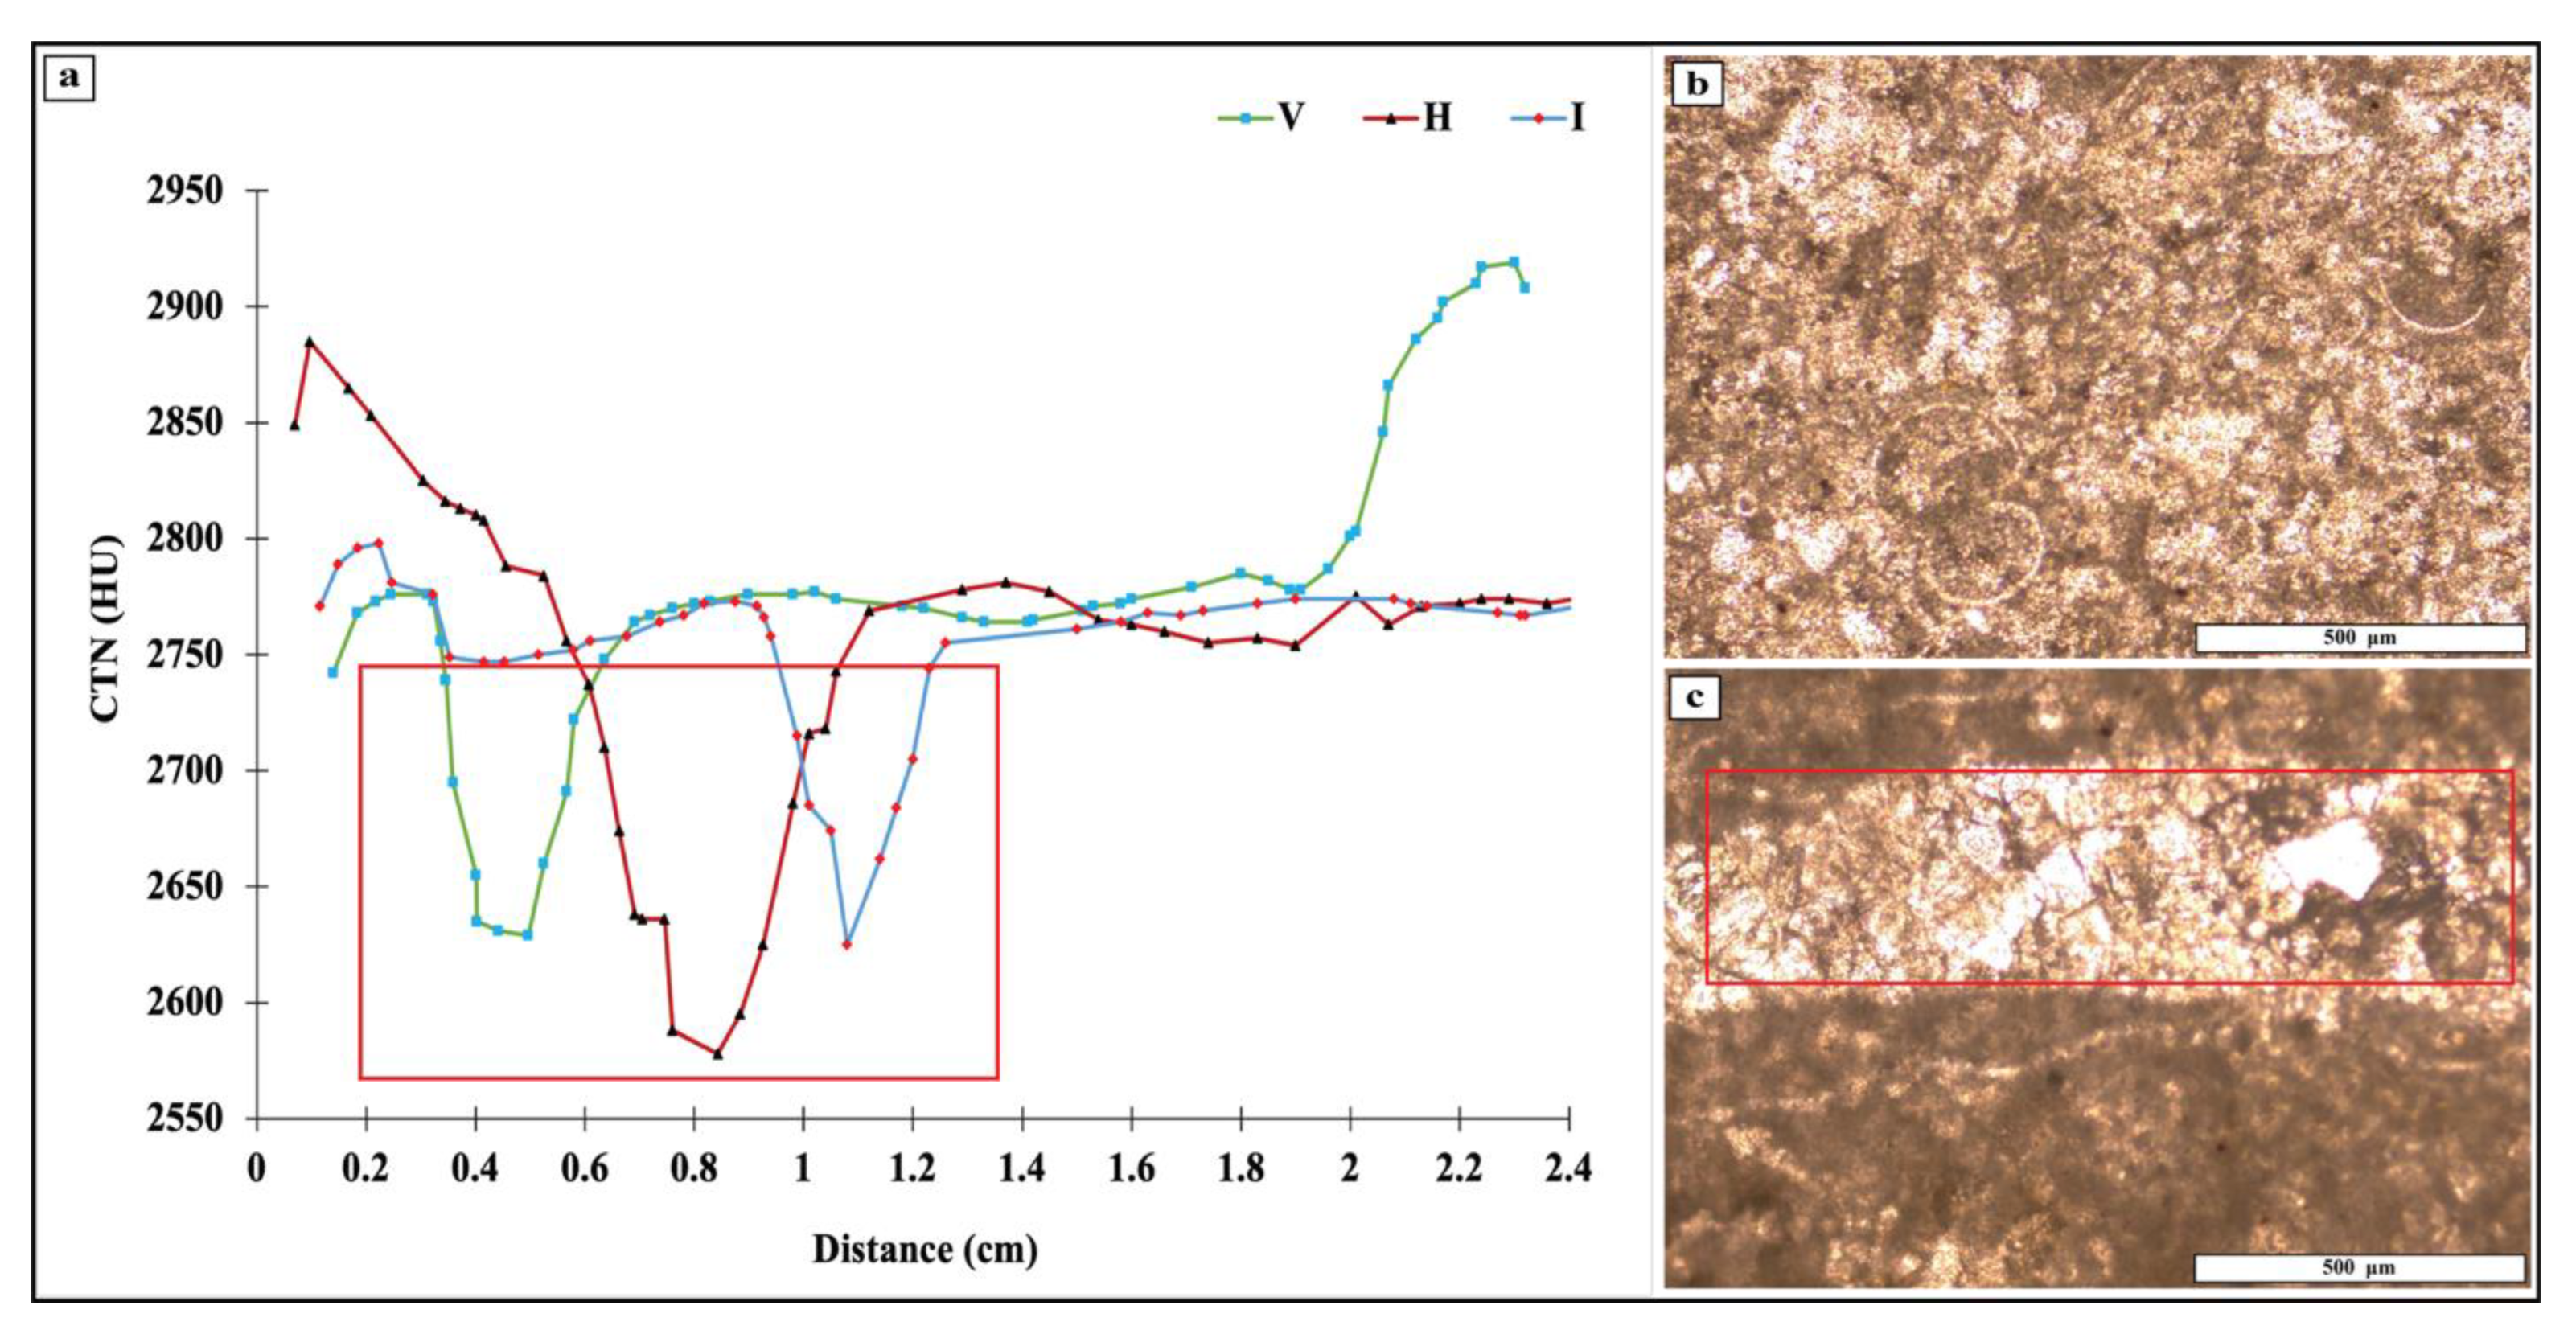
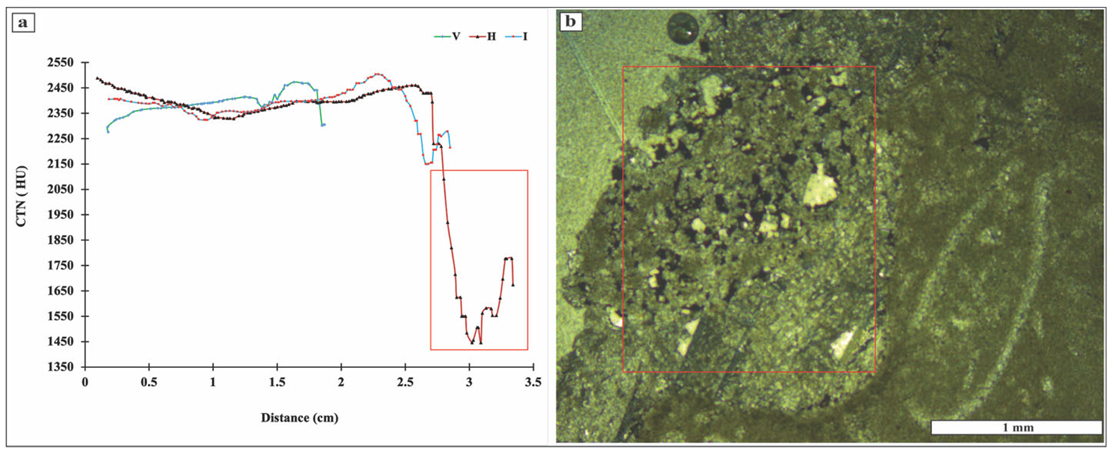
The total spot analyses (SAs) from marine facies were conducted on 810 spots in two samples. A 389 spot analyses were conducted on the Z1 sample from surface section across three directional lines (V, H, I; Figure 8). Overall, the spot analyses across the whole lines show a CTN ranging from 2578 to 2982 HU (Av. 2740 HU). The porosity ranges from 0.02 to 3.29% (Av. 1.20%), while the permeability ranges from 0.04 to 0.88 mD (Av. 0.14 mD). The standard deviation is 63.23 at the formation contact, and 67.56 in the upper part of the Qamchuqa Formation. While under subsurface well, a total of 414 SAs were conducted on two subsurface samples (Q1 and Q2). Overall, the subsurface spot analyses indicated CTN ranging from 1446 to 2556 HU (Av. 2360 HU), and the porosity ranges from 3.81 to 29.78% (Av. 8.40%), while the permeability ranges from 0.098 to 26.37 mD (Av. 1.02 mD). The standard deviation values for Q1 and Q2 are 268 and 256, respectively (Table 1).
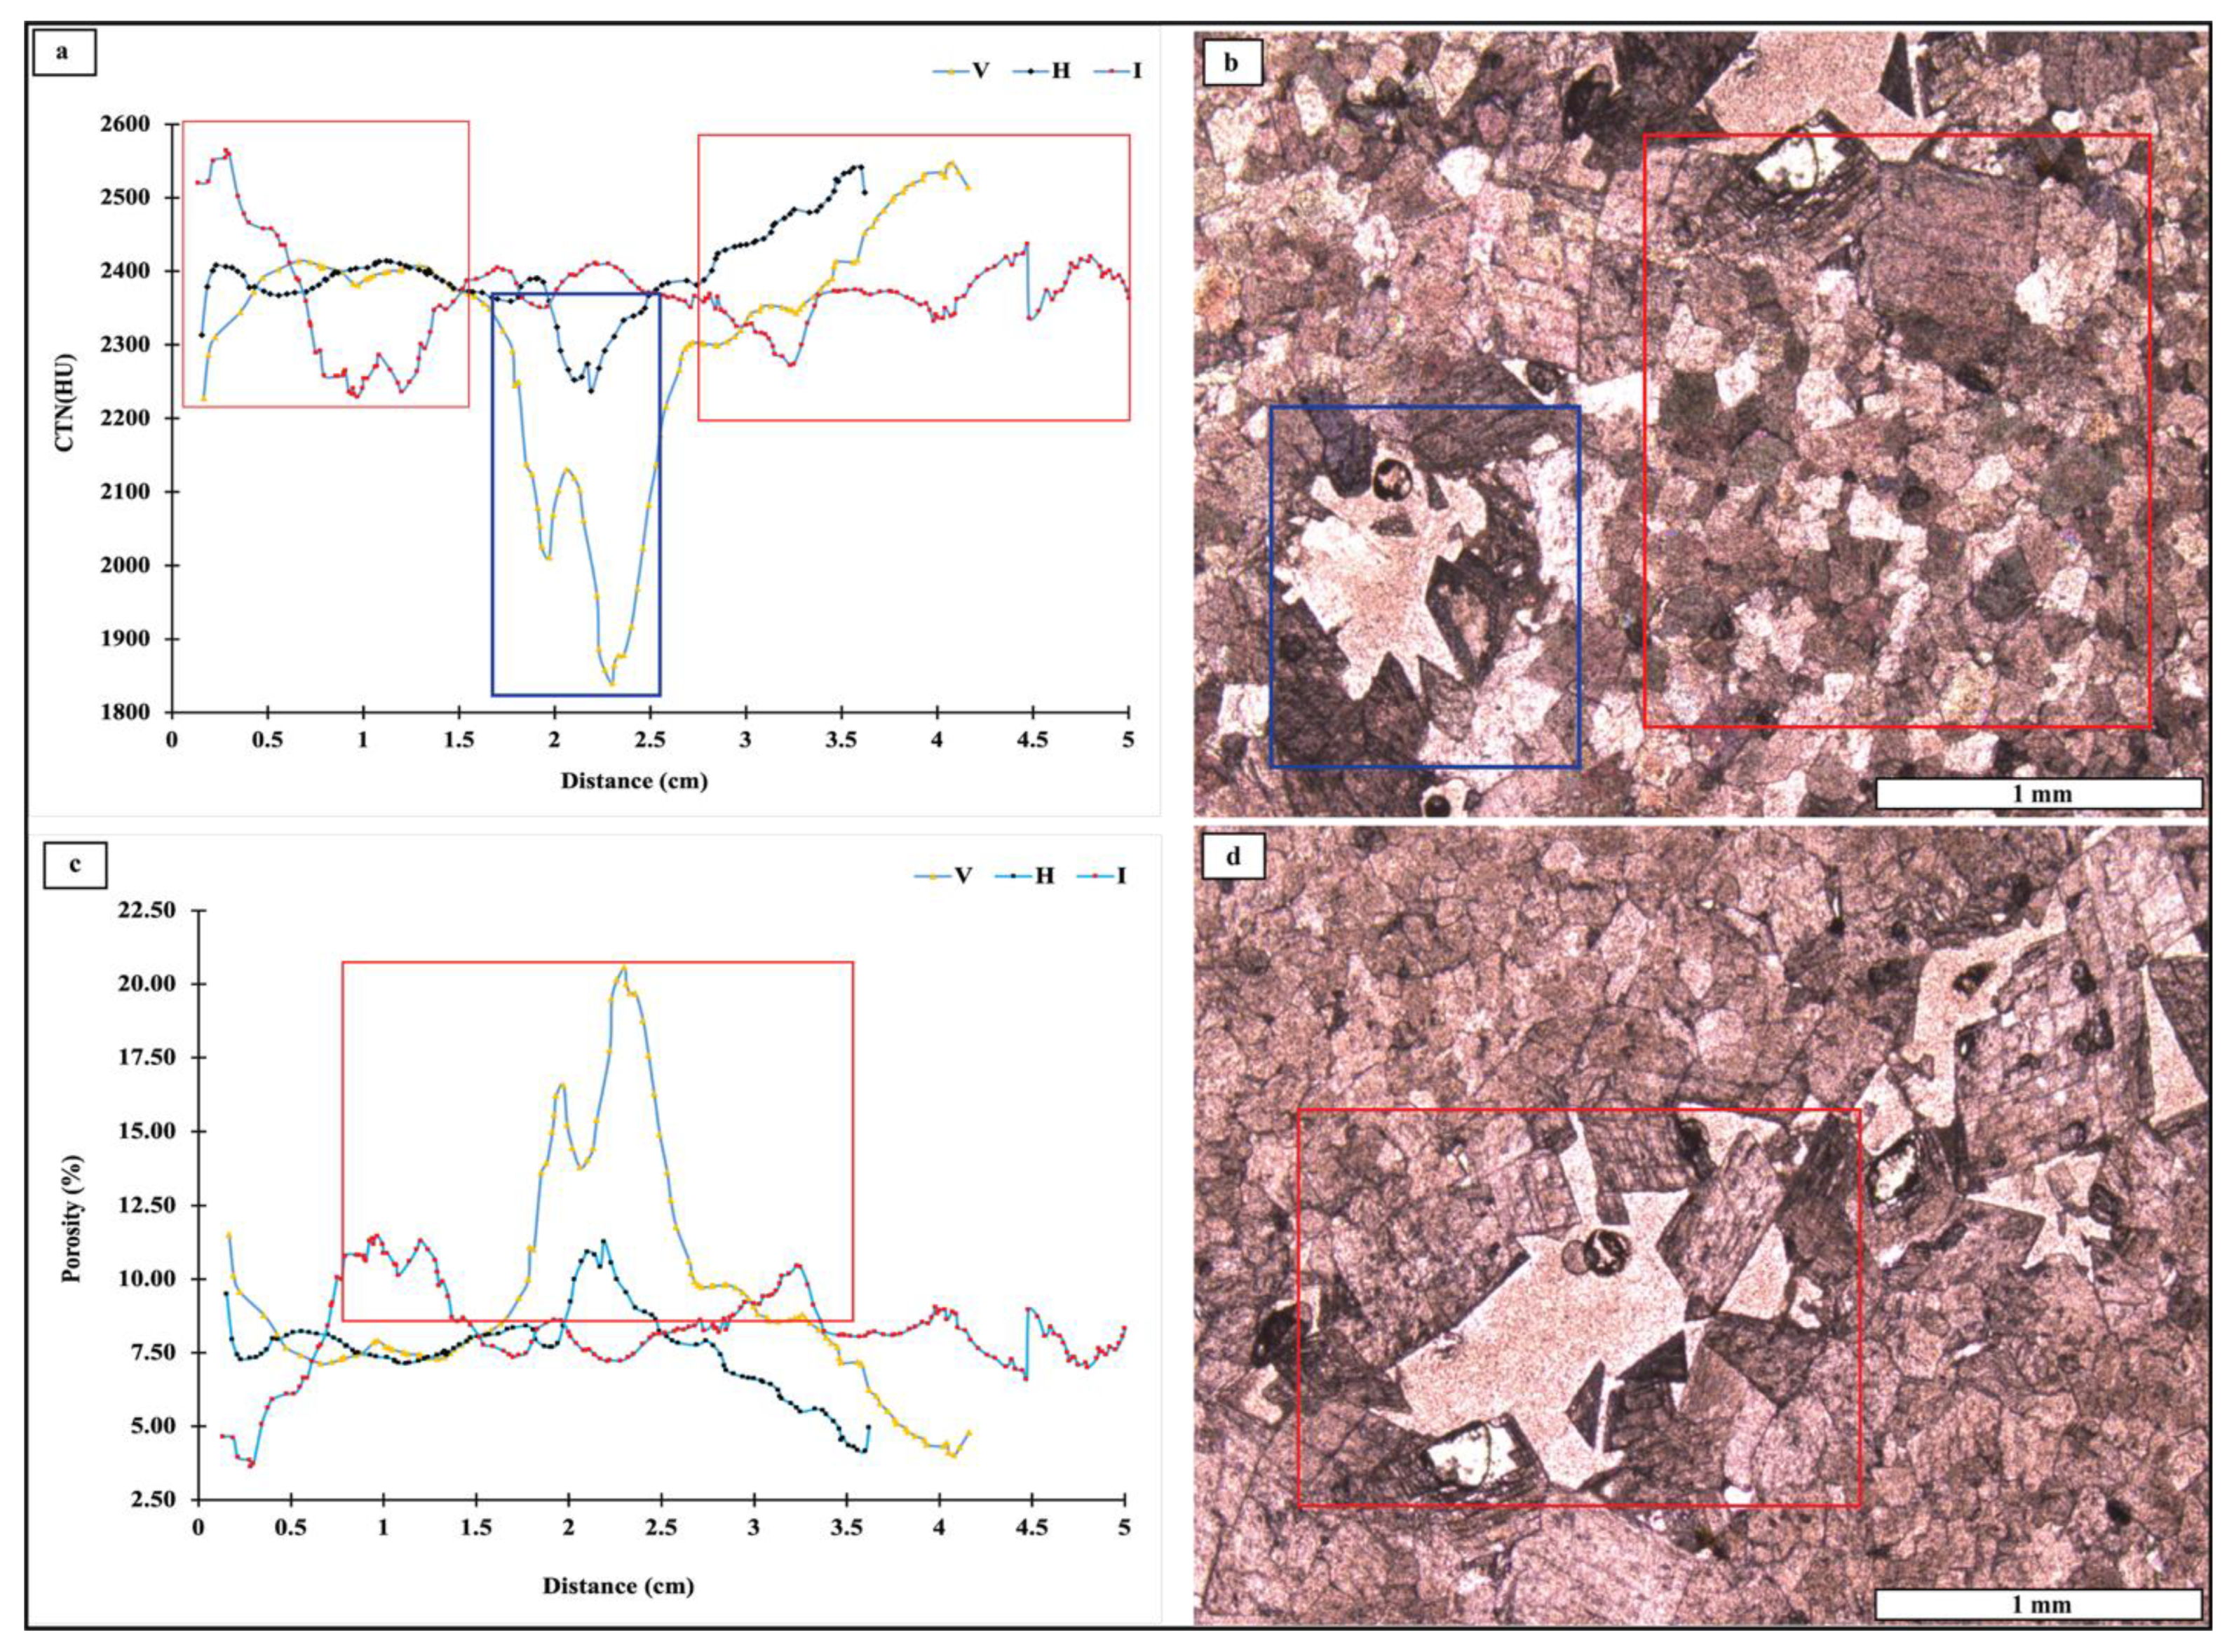
In the early diagenetic stage within the surface section, a total of 393 SAs were conducted on a single sample (Z12) across three different directions. These analyses primarily intersected tight anhedral dolomite crystals, followed by subhedral and minor euhedral dolomite. Therefore, various sizes of dolomite were involved in early dolomitizing fluid (Figure 4 and Figure 5a,b). The combined results across all three directions show a considerable range of CTN varying between 1840 HU and 2564 HU (Av. 2355HU), with porosity from ranging 3.62 to 20.58% (Av. 8.51%), and permeability ranging from 0.09 to 3.62 mD (Av. 0.35 mD). The heterogeneity distribution of the sample based on the standard deviation of the CTN is 101.96. In the subsurface section, a total of 1139 SA and 12 lines were conducted on four early dolomite samples (Q3, Q4, Q5, and Q6) in three directions. Overall, considering the three directional lines across the four samples, the CTN show a wide range values, varying between 2142 and 2619 HU (Av. 2441 HU), with porosity ranging from 2.33 to 13.49% (Av. 6.49%), and permeability ranging from 0.07 to 0.79 (Av. 0.19 mD). The heterogeneity of these samples based on the Standard deviation of CTN (Q3, Q4, Q5, and Q6) are 184, 122, 40, and 72, respectively.
The late diagenetic staging of the Cretaceous reservoir formations from the surface and subsurface (nine samples) was conducted across (26 lines) in three directions, and these analyses covered a total of 2914 SA. The obtained data in this stage considered the hydrothermal dolomitization, particularly in the context of zebra-like textures, twisted and distortion and in situ brecciation of saddle dolomites, and fracture/vug-filling saddle dolomites, in addition to void-spaces and other dissolution associated with hydrothermal fluids. The samples from surface rocks (Z16, Z22 and Z35) were analyzed in relation to the occurrence of saddle dolomite that later filled vugs and fractures. These dolomites are associated with the late diagenetic phase. Due to intensive diagenesis (See core sample: Z35) by HT dolomitization fluids. The obtained CTN varied from −881 to 2446 HU (Av. 1807 HU), and the porosity ranges from 6.38 to 84.23% (Av. 33.12%) and permeability (Av. 1514.13 mD). Overall, the late-stage diagenesis in the surface section was influenced by hydrothermal dolomitization. Therefore, the late diagenetic dolomites exhibited CTN values ranging from −881 HU to 2697 HU (Av. 2058 HU). The heterogeneity of the HTD is based on the standard deviation of the CTN. The standard deviation of fracture and vuggy sample (Z35) is 725, Z16 is 460, and for zebra like texture sample (Z22) is 137. In the subsurface settings, a total of 1713 SA were conducted across 14 lines from six samples in various depth (Q1, Q7, Q8, Q9, Q10 and Q11). The CT scan covers three directions (V, H, and I) to understand the diagenetic evolution and density variations in dolomite during late HT diagenesis (Figure 8).
In the late distortion saddle dolomite, samples (Q8, Q10 and Q11) show distortion and large wavy extensions of the crystals with a highly compacted grain packing. For sample Q10, a value of 403 SA was performed across three directions. Overall, the CTN for distortion SD varied from 1931 to 2586 HU (Av. 2341 HU). While the values for the in situ brecciation of SD, samples (Q7 and Q9), varied from 457 to 2446 HU (Av. 1823 H U). Considering all analyzed lines with fracture and vugs, the CTN values range from 457 to 2586 HU (Av. 2118 HU), and average porosity is 14.05% and permeability of 91.60 mD. The heterogeneity of the late diagenesis in the subsurface based on the standard deviation of CTN for the samples (Q7, Q8, Q9, Q10, and Q11) are 309, 167, 598, 96, and 102, respectively (Table 1).

5. Discussion

5.1. High-Resolution X-Ray Computed Tomography

The X-ray computed tomography (CT) imaging provides profound understanding of the reservoir characterization and storage capacity in those associated with heterogenous reservoir carbonate rocks [30]. To conduct a high-resolution analysis on rock samples, the computed tomography numbers (CTN) were considered on micro-scale characteristics of heterogeneous carbonate rock. Through a non-destructive images and high-resolution data, hundreds of images and thousands of CTN were utilized (Table 2 and Table 3). Therefore, the CTN, density, and variation in porosity-permeability for each facies, both in surface and under subsurface sections, were considered separately. Our data were obtained from more than 5000 micro-SA to have an equivalent CTN values. These values were classified according to optical observation, reservoir rock paragenesis, and lithological changes. The optical observation shows various degrees of compaction, dissolution, cementation, fracturing, and evolution of porous media within Cretaceous reservoirs.
The CTN values of the different minerals within Cretaceous carbonates indicate a strong linear relationship between the Hounsfield Unit (HU) and their densities. To develop a reservoir modeling for fluid entrapments and their storage using a non-destructive, X-ray computed tomography (CT) techniques, the acquired CTN, standard deviation (Sd), reservoir petrophysical properties (porosity-permeability relationship) were obtained. CT scan and imaging can provide precise and accurate results, particularly when displacement tests are possible under CT measurement conditions [5,31]. Standard derivation measures the degree of differences in the CT number from each slice of the averaged CTN, which can reflect the heterogeneity of the pore distribution within the entire core sample. The standard deviation analysis provides significant insight into the heterogeneity of diagenetic processes in both surface and subsurface condition (Table 1).

5.2. Impact of Multi-Entrapment Fluids and High/Low Temperature Settings on the Variations in Rock Density

The Cretaceous reservoir rocks in the surface and subsurface samples show a considerable range of CTN values, varying from 1446 to 2982 HU (Table 2 and Table 3). This range indicates a high-density carbonate matrix. The large number of CT coincide with the petrographic observations of the host limestone, early dolomitization from low-temperature fluids, and different phases of saddle dolomites from hot fluids (Figure 9). The lithological observation shows a wide range of HU differences from one mineral to another, which is a characteristic of dominant occurrences of low temperature, highly compacted texture of marine carbonate rocks (i.e., mudstone and wackestone microfacies). In addition to few equant cements filling the chambers of these bioclasts, such as miliolid shell (Figure 3). Early and late dolomitization indicate different temperature and environmental settings, as confirmed by more than one phase of dolomite formation with different optical properties (Figure 6 and Figure 7).
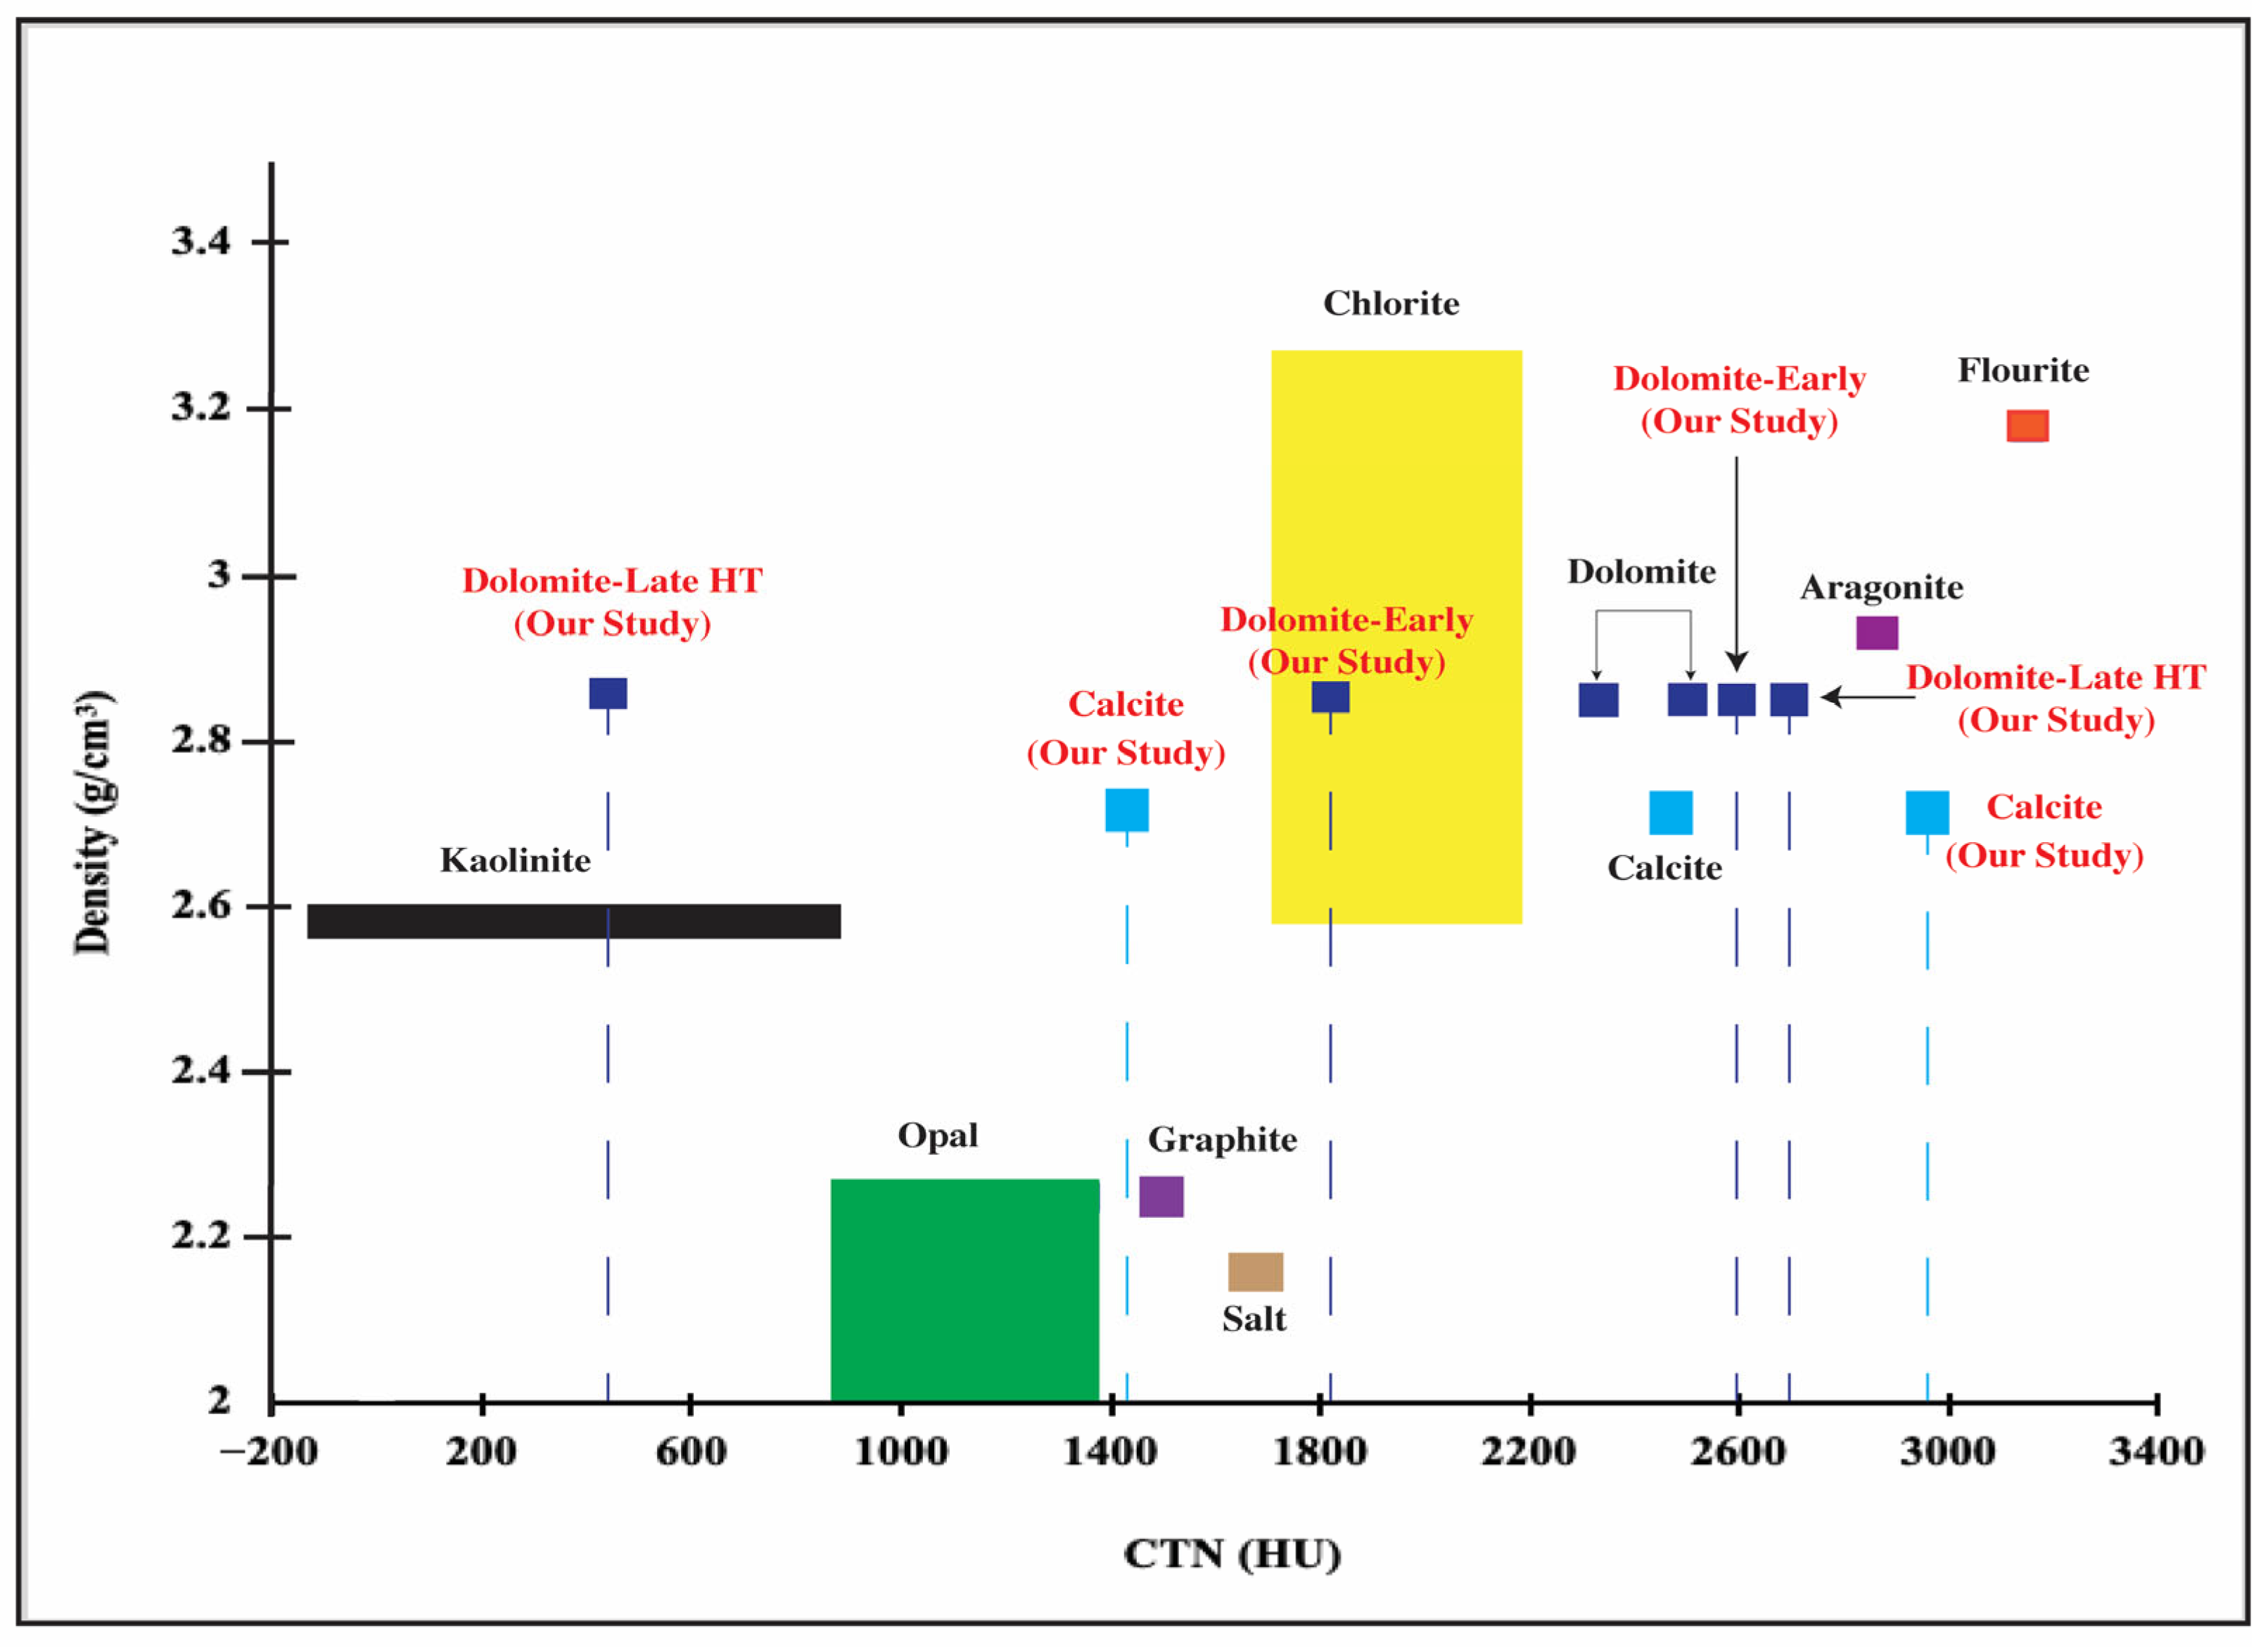
The CTN variation is proportional to density of the mineralogical composition, which is well highlighted by [32]. The authors limited the CT numbers for a single mineral. The calcite and dolomite CTN are not larger than 2500 HU (Figure 9), while our measurement from dolomite as a mineral or dolostone records higher HU value than the reported standard HU (up to 2697 HU) in translucent saddle dolomite within the zebra-like texture, in places less than 2500 HU (Figure 9). This variation suggests that the chemical substitutions could alter density, and diagenesis may further cause the density variations. For example, during the dolomitization process, as magnesium-rich fluids interact with calcite sediments, the dolomite replaces calcite in a manner that contributes to increased rock density within new rock composition [33,34]. This replacement explains the complex rock–fluid interactions and alterations of both the mineral composition and the physical density of the rock. Therefore, other processes of diagenesis may directly or indirectly influence the crystal lattice, hence different densities could be obtained from one mineral. Radiation-induced studies have also indicated that the crystallographic order of calcite and dolomite can undergo changes with alterations in physical conditions [35]. Furthermore, the wide considerable variation in limestone rocks, 1446 up to 2919 HU, likely favors specific environmental condition, such as changing temperatures and geochemical composition of the fluids. These conditions reflect on the degree of the crystal growth of dolomite and calcite, producing differences in their densities during mineral formation [36]. Therefore, the significant phenomena in this study are the formation of dolomite phases in various diagenetic settings and environmental conditions. For example, for early dolomite and late saddle dolomites that are formed under different conditions and sources, their crystal lattice arrangement and impurity incorporation in their lattice directly influence the density of rocks. Furthermore, the dynamic nature of these minerals is directly impacted by geochemical environments, geochemical substitution, and diagenetic processes. These changes confirm the multi-origin and multi-fluid entrapment even within a single mineral, such as dolomites. Consequently, the alteration that originated from multi-fluids entrapment will directly influence the eventual storage of reservoir carbonate formation in the study area.

5.3. Spatial Distribution of CTN and Their Relationship to Reservoir Heterogeneity “Standard Deviation”

The spatial distribution of computed tomography numbers (CTN) and their correlation with various samples from heterogeneous carbonate reservoirs are significant factors in characterizing the carbonate reservoirs. The variations in density and porosity reflect substantial variation in standard deviation. The standard deviation is directly linked to the CTN range and serve as critical metric for quantifying the carbonate reservoirs and displaying the rock density–porosity relationship.
The relationship between high-density rock with low-porosity media (high CTN) from surface marine facies versus low-density rock and high-porosity media (low CTN) from subsurface marine facies suggests the influence of burial diagenesis on the reservoir characterization (Figure 10). Surface marine carbonates often exhibit compacted and cemented structures that minimize reservoir potential and characteristics. The spatial distribution of petrophysical properties of reservoir rocks is associated with degree of rock density and porosity value. In contrast, subsurface areas show increased porosity and less dense rocks, suggesting that the diagenesis enhanced the reservoir capacity, which is induced by dissolution, fracturing with increasing rock heterogeneities (e.g., [8]).
The standard deviation (Sdv) analyses explain the degree of heterogeneity distribution across different facies and provide insights into the rock fabrics through uniform or variable fabrics. Sample Z1 has a standard deviation of 63, and sample Z17 has a standard deviation of 68. The relatively low values of Sdv indicate a more homogenous rock fabric, which aligns with the petrographic observations of tightly compacted mudstone and wackestone microfacies. Skeletal grains and equant cement filling void spaces further contribute to the uniformity of density and porosity distribution, minimizing variation in CTN. In the subsurface, a prominent shift occurs with high standard deviation values indicating more heterogeneous rock, suggesting a non-uniform diagenetic fabric [37]. A wide range of CTN values favor the vuggy and fractured structures, illustrating how diagenetic alterations significantly impacted reservoir density and porosity distribution [38]. These results support the previous scholars highlighting the heterogeneous conditions within reservoirs have influenced fluid storage and characteristics [38]. These high values of standard deviation (see Table 1; Q1 = 268 and Q2 = 256) reflect greater heterogeneity due to diagenetic alterations such as dissolution, cementation, and fracturing. The range of CTN values in the subsurface marine facies, varying from 1446 to 2556 HU (Av. 2360 HU), corresponds with the presence of vuggy porosities, and fractures. These observations support literature data indicating that trends in reservoir quality derived from variations in petrophysical properties across similar geological settings [37].
The heterogeneity evaluation in early diagenetic settings reveals an overall standard deviation of 102 from surface samples, indicates a moderate level of variability in the distribution of rock density and porosity. The subsurface samples have considerable range of standard deviation values (184, 122, 40, and 72). These differences in standard deviation highlight the range of heterogeneity and diagenetic influences under various diagenetic conditions. The highest degree of variability, with a standard deviation of 184, is likely attributed to the effects of fractures and dissolution processes. Conversely, the lowest standard deviation of 40, due to the contribution of highly compacted and tight fabrics, reveal the limited influence from diagenetic fluid involvement.
Tight and highly compacted fabrics according to petrographic observations displayed a standard deviation of 122. This moderate heterogeneity suggests that even in a predominantly compacted structure during early-stage diagenetic processes, like minor dissolution and cementation, it results some variability in reservoir characteristics. For example, a very dense anhedral to subhedral dolomite with minimum euhedral dolomite crystals show a lower standard deviation of 72. This reduction in Sdv suggests a more homogeneous rock composition, and the diagenetic modifications produced a consistent tight dolomite fabric. The dominance of anhedral dolomite combined with subhedral crystals contributes to a uniform density distribution and limits variations in porosity.
The influence of late diagenesis on reservoir heterogeneity has gained considerable attention in reservoir characteristics, as it determines petrophysical properties such as porosity and permeability in subsurface reservoirs. Unlike early diagenetic processes, which is consistent with cementation and initial compaction, late diagenesis provides a broader range of heterogeneity due to significant multiphase cementation, dissolution, and precipitation of authigenic minerals, which modifying reservoir quality by introducing complex variability in the rock fabric [39]. Our analyses obtained from surface late diagenetic rock samples reveal a distinctive and considerable ranges of Sdv (up to 725) within fracture and vuggy zones. This stage of diagenesis is associated with hydrothermal dolomitizing fluid, in places more uniformly distributed, as evidenced in fractures with lower Sdv of 460. Vuggy samples typically exhibit greater Sdv (725 and 460) than matrix or fractured samples, emphasizing the control of diagenetic settings on reservoir heterogeneity [29]. Furthermore, zebra-like texture associated with low Sdv of 137, suggests a high degree of density and fabric uniformity with minimum porosity variation.
The reservoir characterization from subsurface samples associated with late-HT dolomitization is grouped into two populations. The first population exhibits CTN values between 1931 and 2586 HU (Av. 2341 HU) with porosity ranging from 3.10 to 18.43% (Av. 8.84%), and permeability from 0.08 to 2.39 mD (Av. 0.31 mD). The second population recorded a considerable range of CTN 457 to 2446 HU (Av. 1823 HU) with porosity ranging from 6.38 to 52.92% (Av. 20.97%), and permeability from 0.16 to 5462.62 mD; (Av. 223.11 mD). Furthermore, in subsurface contexts, Sdv obtained from late-HT dolomitization similarly reflect diagenetic heterogeneity, and the Sdv values coincide in their spatial distribution with the CTN measurements. A lower Sdv(167) is consistent with saddle dolomite distortion, less porous media, and high CTN (Av. 2341 HU). This is directly associated with the first population group of CTN values. Conversely, the second population is consistent with highest Sdv (309 and 598), more porous, and less CTN (Av. 1823 HU). The second population is associated with in situ brecciation of saddle dolomite and hydrocarbon accumulation, likely influenced by more pervasive fracturing/differential dissolution and continuous vertical stress. These data are consistent with findings that the forces on rocks could cause a compacted fabrics and uniform structural features [40]. Finally, the lowest variabilities of Sdv 96 and 102 reflect compact, dense, and uniform rock fabrics, which maintain integrity under specific subsurface conditions [41]. Consequently, the entrapment of hydrothermal fluids is likely co-eval with hydrocarbon migration/accumulation and performance of reservoir characterization (Figure 7 and Figure 10). Therefore, the relatively consistent properties of these samples favor the need for careful assessment in reservoir modeling, as minor variation can critically impact fluid flow, storage capacity, and reservoir characteristics [42,43].

5.4. Non-HT-Induced Porosity-Permeability in Cretaceous Reservoir Formation

The porosity–permeability relationships are fundamental aspect for understanding the storage capacity and fluid flow in carbonate reservoirs. Recent advances in computed tomography (CT) tool have developed the ability to visualize and quantify rock properties and the porosity–permeability relationships in three-dimensional space, allowing for more detailed evaluations in carbonate rock textures, lithological composition, and porous media. For this purpose, our study separately measured the porosity and permeability for each phase of diagenesis, focusing on the impact of HT-dolomitization on reservoir characterization in both the surface and subsurface formations.
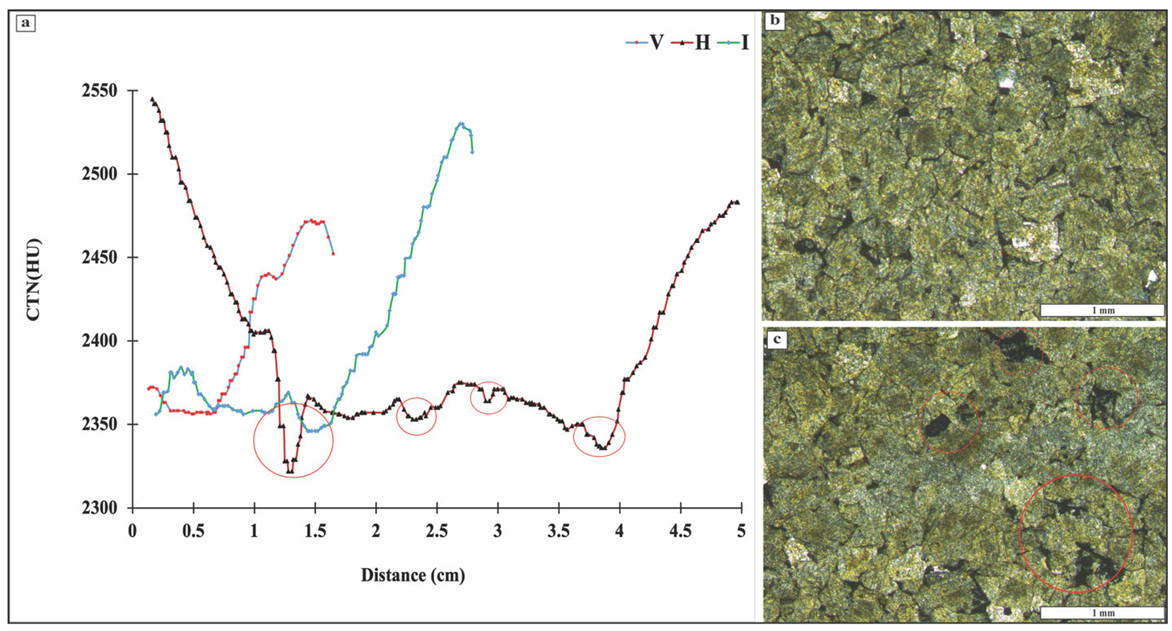
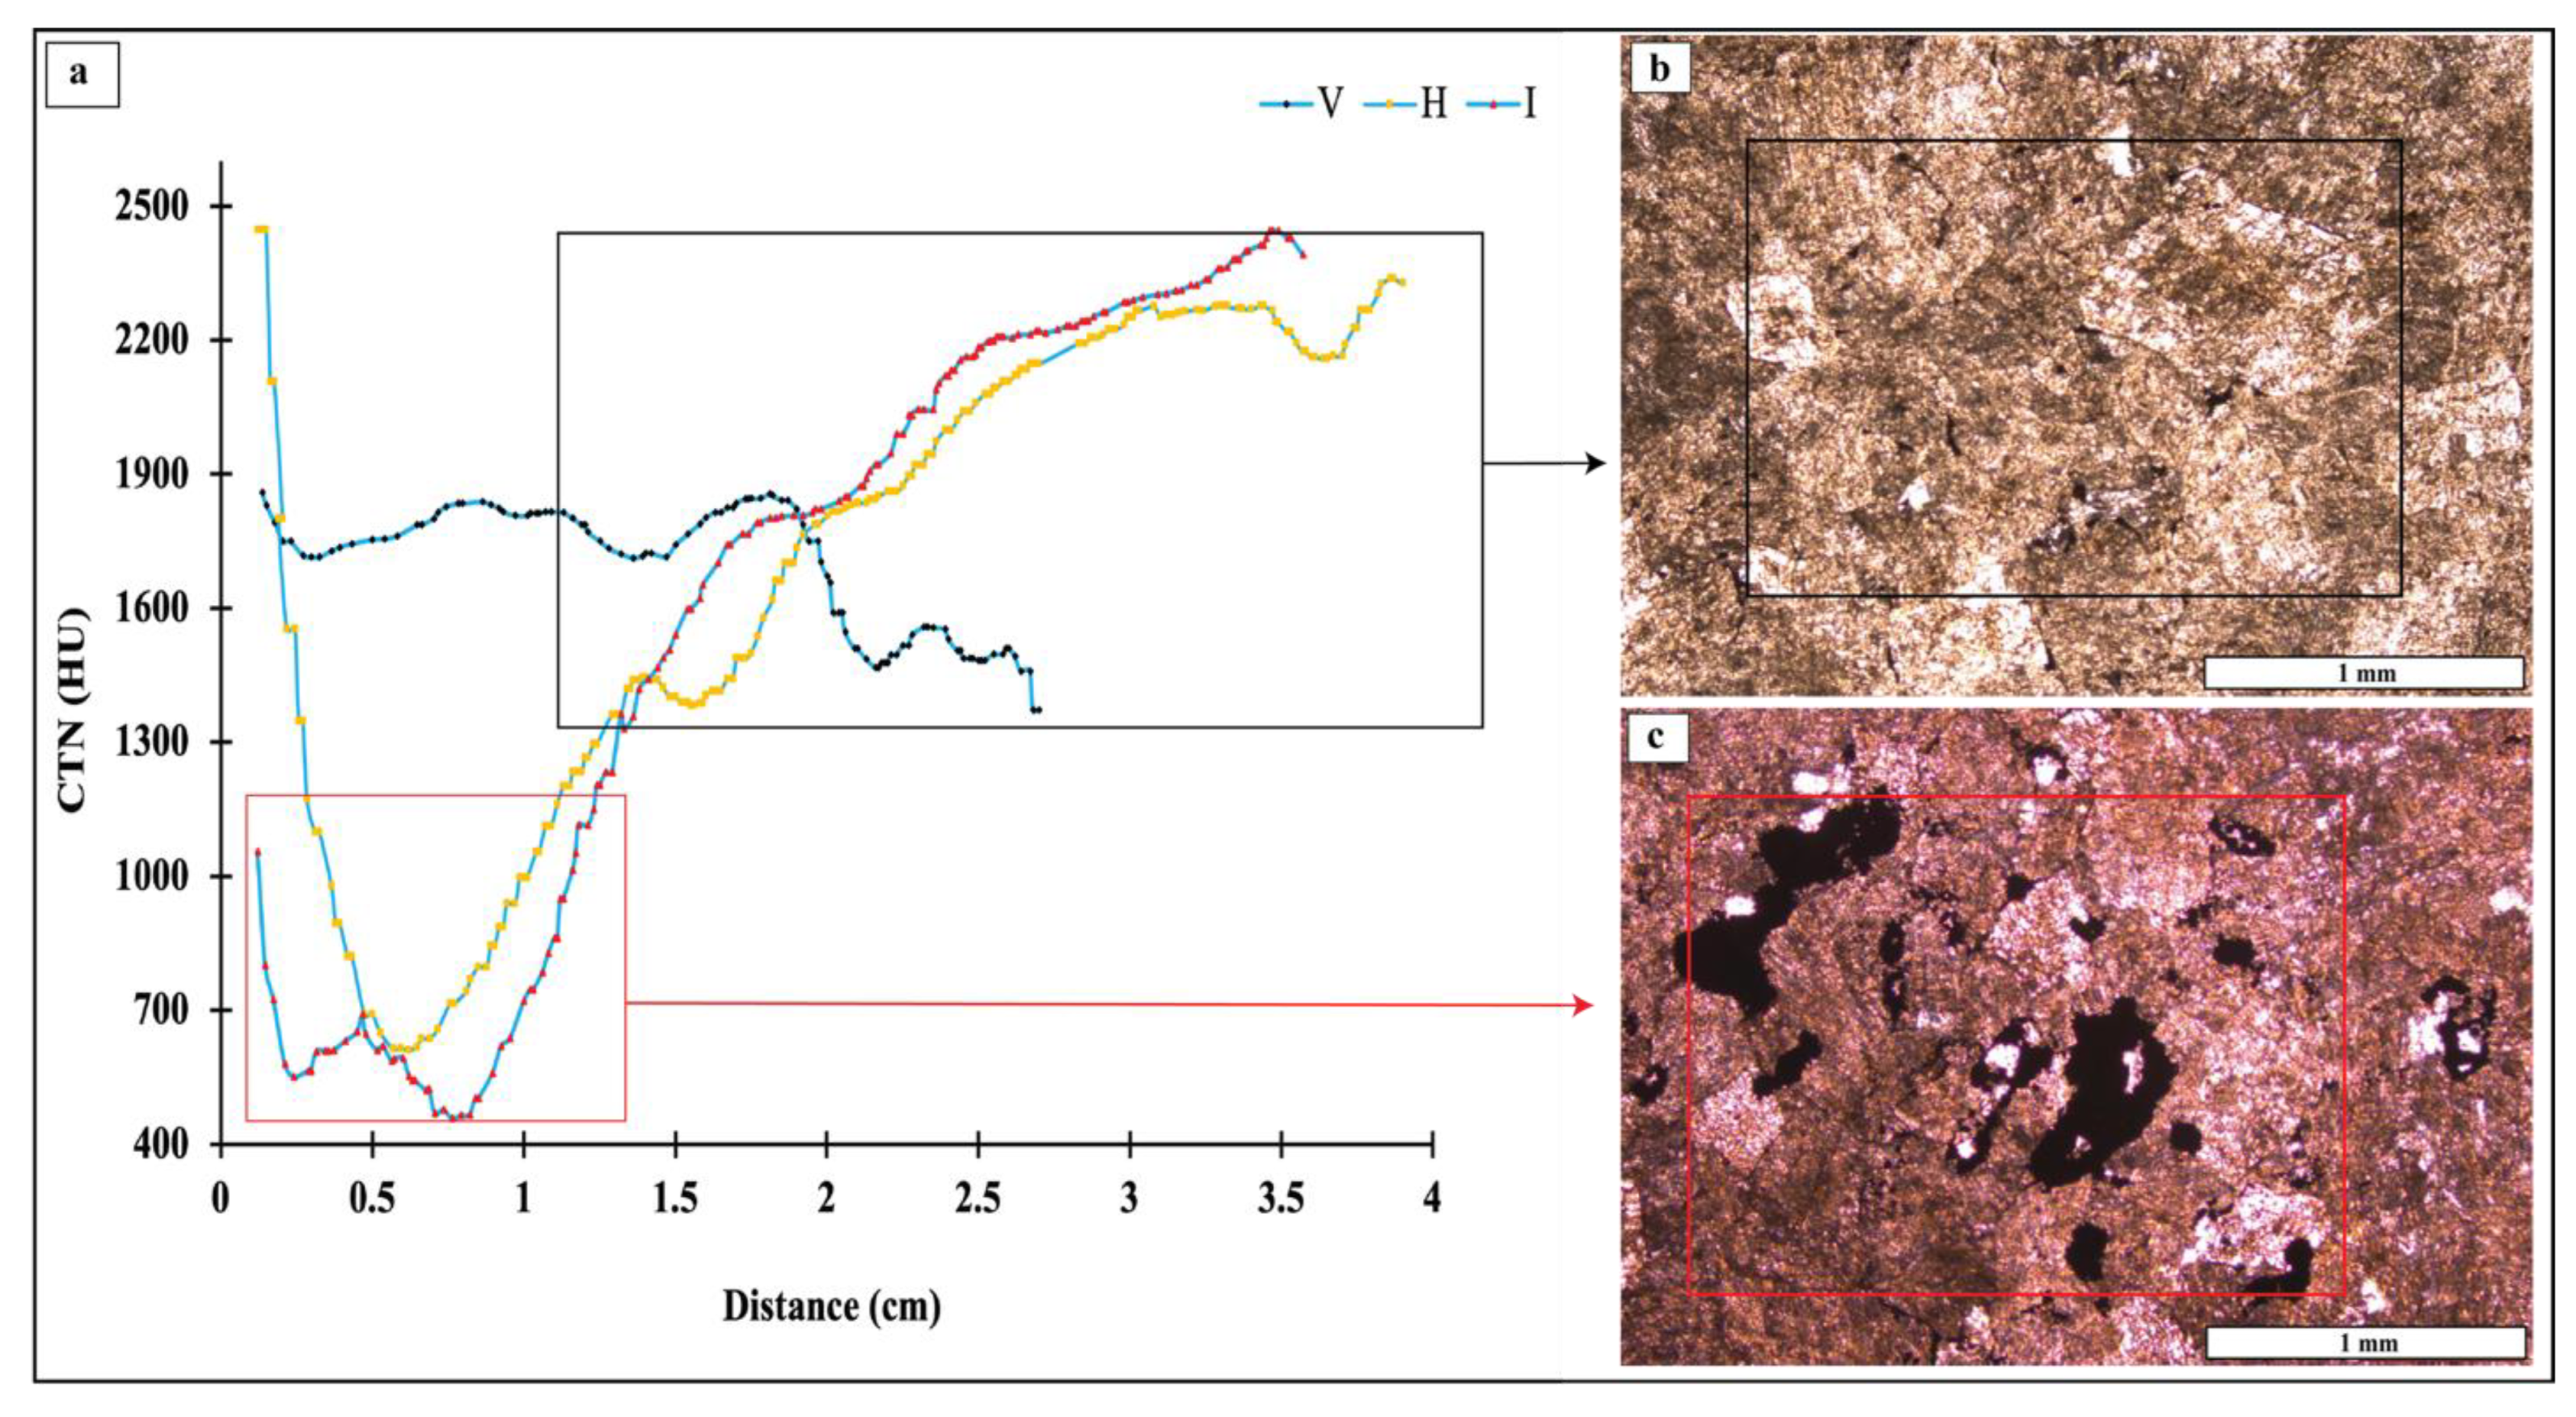
The high CTN (2578 to 2982 HU), and dense facies fabric coincide with marine and compacted facies in the surface section. The boundstone microfacies represented by bryozoan and rudist clasts, in places with silica or dolomite cement (filling these bio-features) and stylolitic joints, are characterized by a significant post-depositional alteration blocking the porous media and permeability distribution (Figure 3). Therefore, having an increase in CTN, the calculated porosity and permeability decreased inversely with CTN values, which is affected by recrystallization processes (Figure 3 and Figure 11a–c).
The marine facies in the subsurface setting shows a considerable range of CTN (1446–2556 HU), suggesting low rock density and high porous media compared to the surface marine facies. These values are in line with the early diagenetic phase in producing a replacive dolomite in the fossiliferous wackestone. Thus, diagenetic processes play a major role in increasing the reservoir storage, as evidenced by fluid entrapment within the vuggy fabric and fractures in the subsurface section (Figure 3e,f).
Low values in CTN from the horizontal line of sample Q2 (1446–2489 HU with Av. 2259 HU) and porosity of 10.76% suggest variable texture in porous media, or less cemented rocks compared to the vertical and inclined lines of the same sample. The porosity values further emphasize the differences between the surface and subsurface marine facies. Therefore, the surface samples have an average porosity of only 1.20%, which is associated with their high CTN values and rock density. Therefore, the surface samples with an average porosity of only 1.20% associated with its high CTN values and high rock density. Consequently, these observations confirm the high compacted and tight reservoirs at the surface than those in the subsurface section (Figure 12). The subsurface section shows significantly higher average porosity of 8.40%, reflecting the involvement of dissolution and seepage of late-HT fluids, which enhance the porous media and produced low density rocks compared to those of the surface with less porous media (Av. 1.20%; Figure 11).
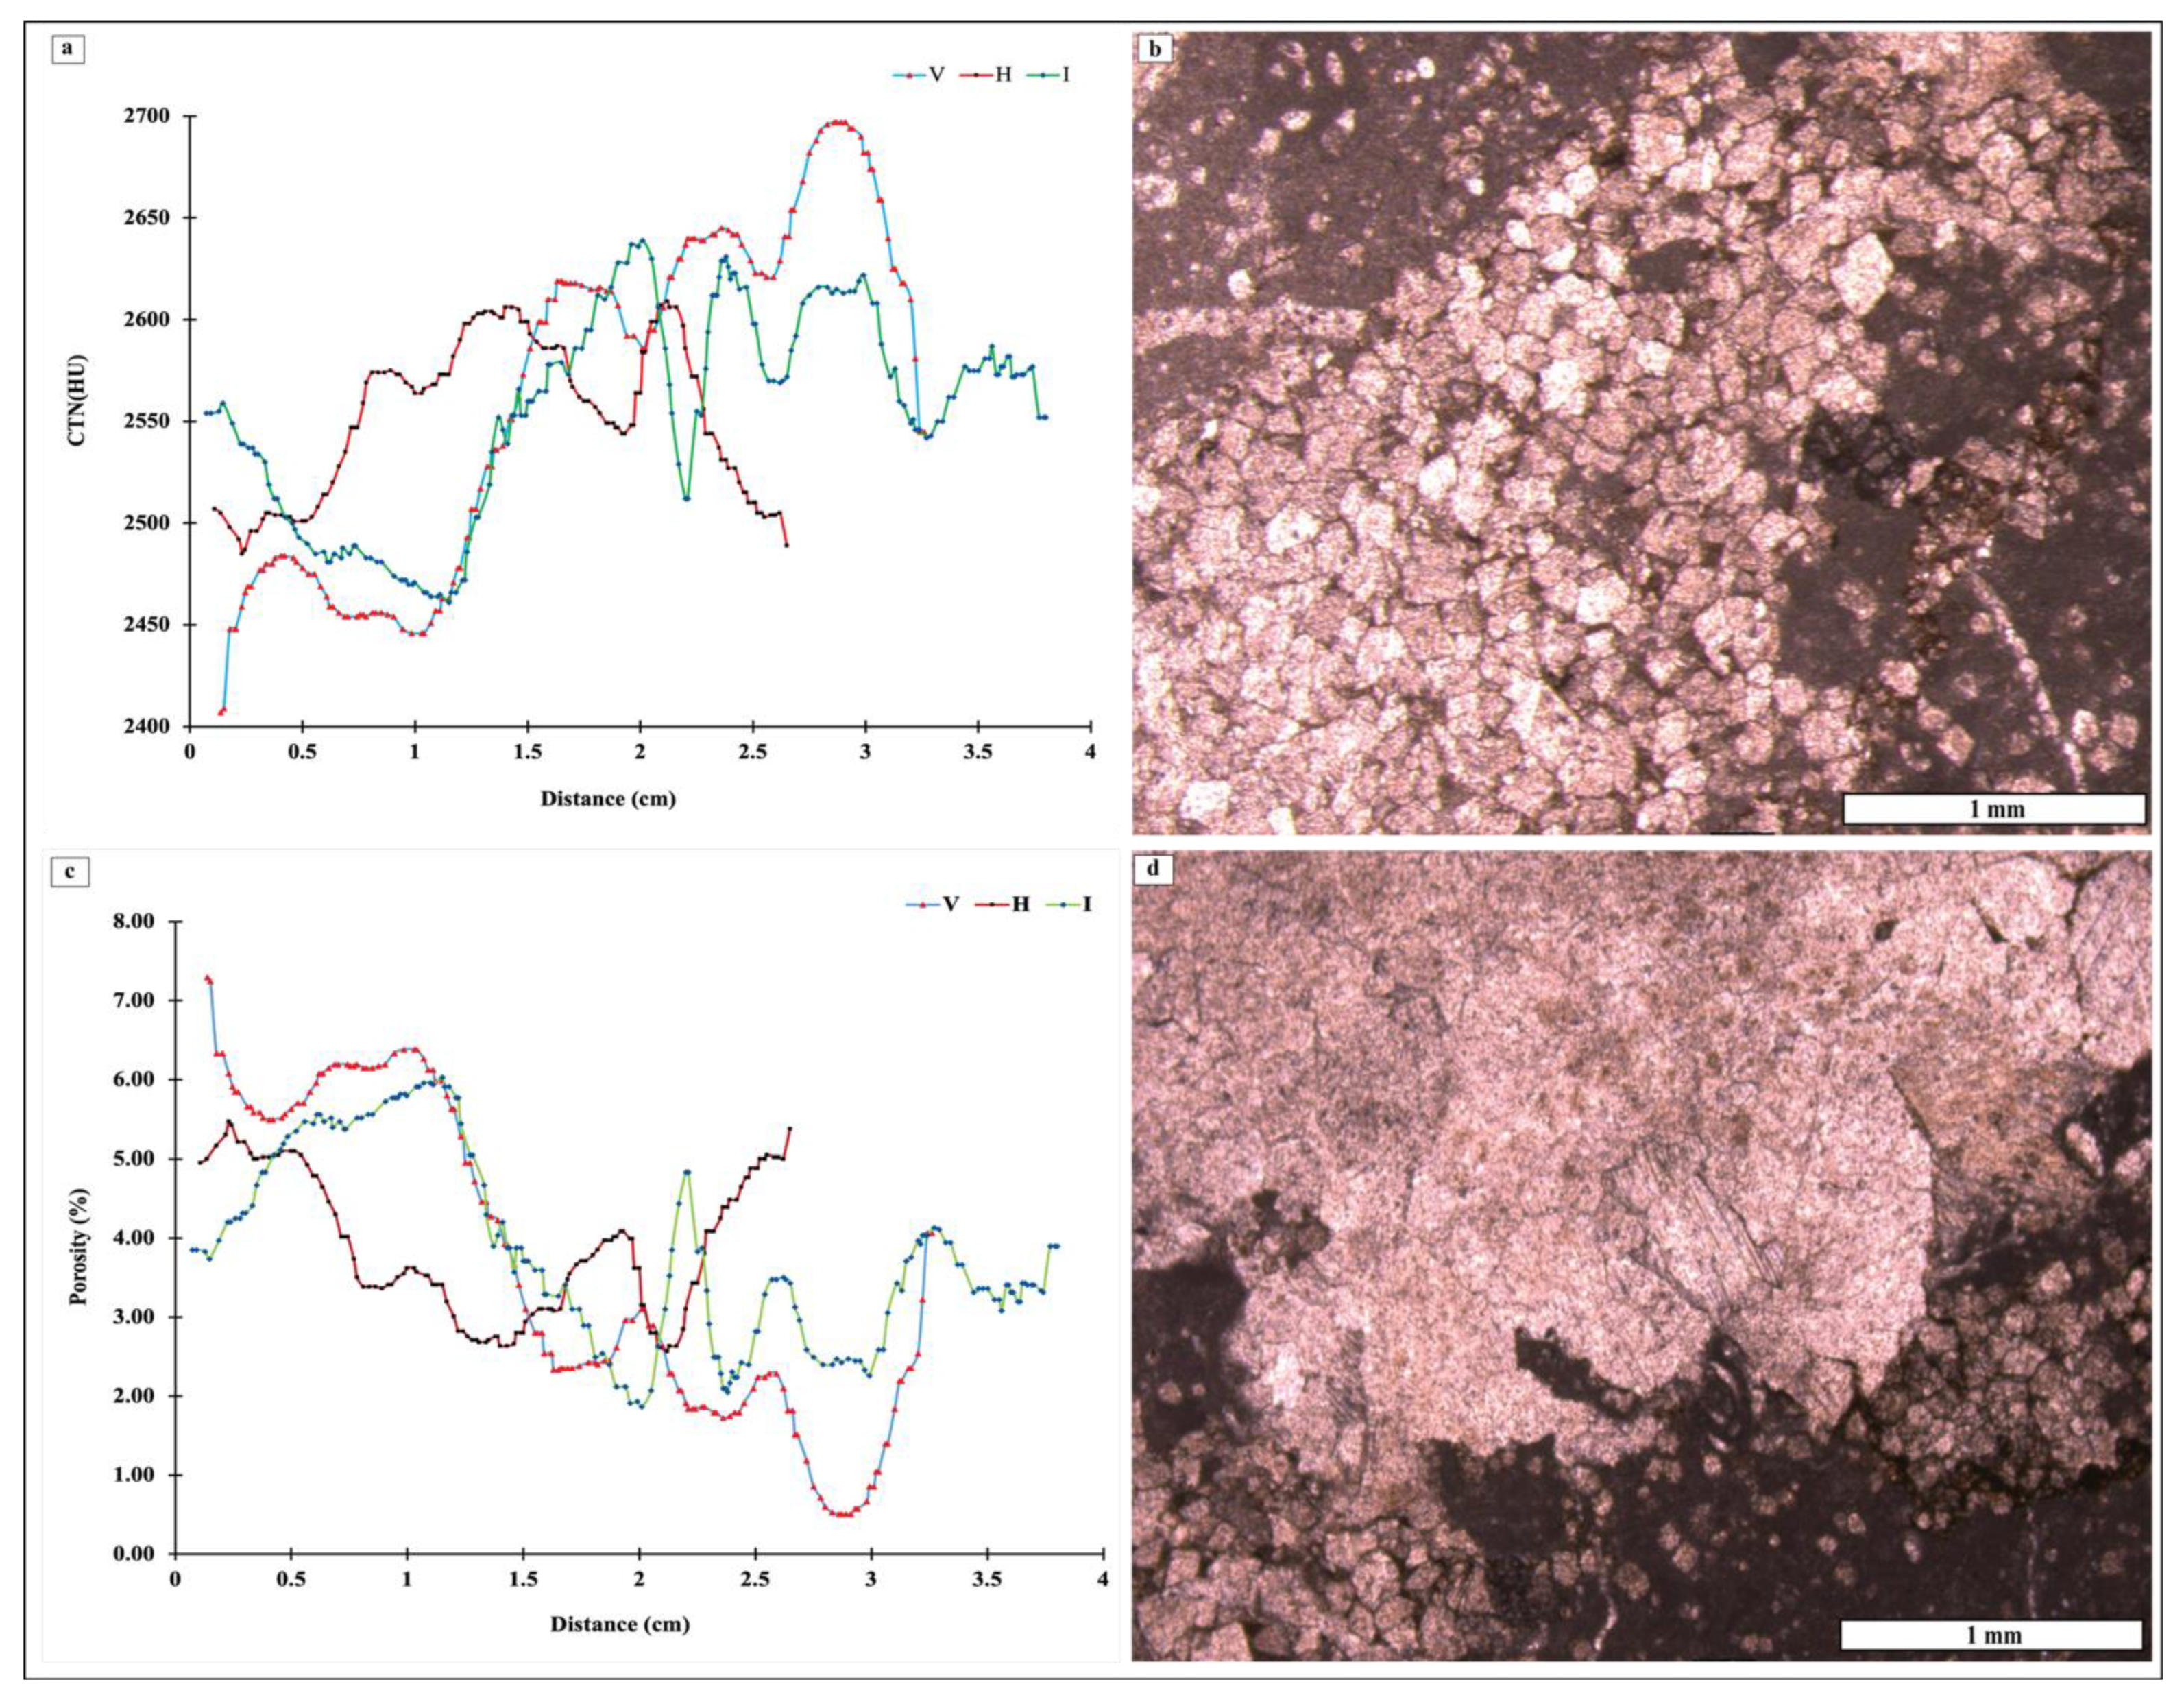
Paragenetically, the early diagenesis postdated the pristine facies, and the spot analyses show that CTN values range from 1840 to 2564 HU (Av. 2355 HU), indicating a moderate-to-high density fabric and low porous media. However, petrographic observation shows that early dolomitization from surface section is influenced by entrapment of hot fluid with saddle dolomite formation along the fluid pathway. Thus, enhancing dissolution process and porous media (Figure 5a,b). The intercrystallite porosity within the matrix dolomite is influenced by HT micro-seepage, suggesting that HT dolomitization was not destructive for the reservoir quality. This indicated by decreasing CTN in places and associated with micro-seepage, allowing some pore spaces to remain open (Figure 5a,b). Low CTN (1840 HU) is consistent with saddle dolomite and high porosity (20.76%), suggest significant influence of hydrothermal fluids on rock density and porosity. In contrast, the CT scanned area associated with pure early dolomitization is characterized by high density and low porosity, which is consistent with occurrence of fine-grained, tightly compacted texture (Figure 13). Increased dolomitization and crystallinity are noted near the source of hydrothermal fluids, creating an average porosity of 8.10%. Samples from the Gali-Bekhal and Bekhme sections, imprinted by hydrothermal dolomitization, exhibit low CT numbers, despite the effects of recrystallization, porosity remains relatively high due to incomplete cementation of pore spaces (Figure 5a,b).
In the subsurface section, a consistent CTN range across all dolomite phases shows high density (high CTN) compared to the surface (Figure 13 and Figure 14). The CTN values ranging from 2142 HU to 2619 HU, (Av. 2441 HU), reflect high density and more compact rock packing. Unlike the surface, where hydrothermal dolomitization influenced the matrix, in subsurface setting the dolomite grains are packed by burial diagenesis, forming a further compacted fine-grained early dolomitization (Figure 4a–f). The average porosity in the subsurface section is 6.49%, which is lower than those of surface section. The vertical stress in the subsurface facies indicates that burial diagenesis have a significant role in reducing porous media compared to the surface, which is infused by HT micro-seepage.

5.5. Impact of HT Fluids Entrapment on Petrophysical Properties of Cretaceous Reservoir Formations: Porosity–Permeability Relationships

High-temperature fluid entrapment within Cretaceous reservoirs preserved an extensive diagenetic signature that significantly alters carbonate reservoir properties. Several models and mechanisms of dolomitization and their origin have been documented by scholars [20,21,26,44]. These studies have predominantly focused on temperature, salinities of dolomitization processes, leaving significant gaps regarding the impact of high-temperature fluid entrapments on petrophysical properties in carbonate reservoirs. Therefore, the deep analyses of these fluid entrapments, in both surface and subsurface sections, are presented via more than 2500 SA measurements and hundreds of non-destructive images for supporting the future decision-making in drilling operation in areas exposed to HT fluid entrapment.
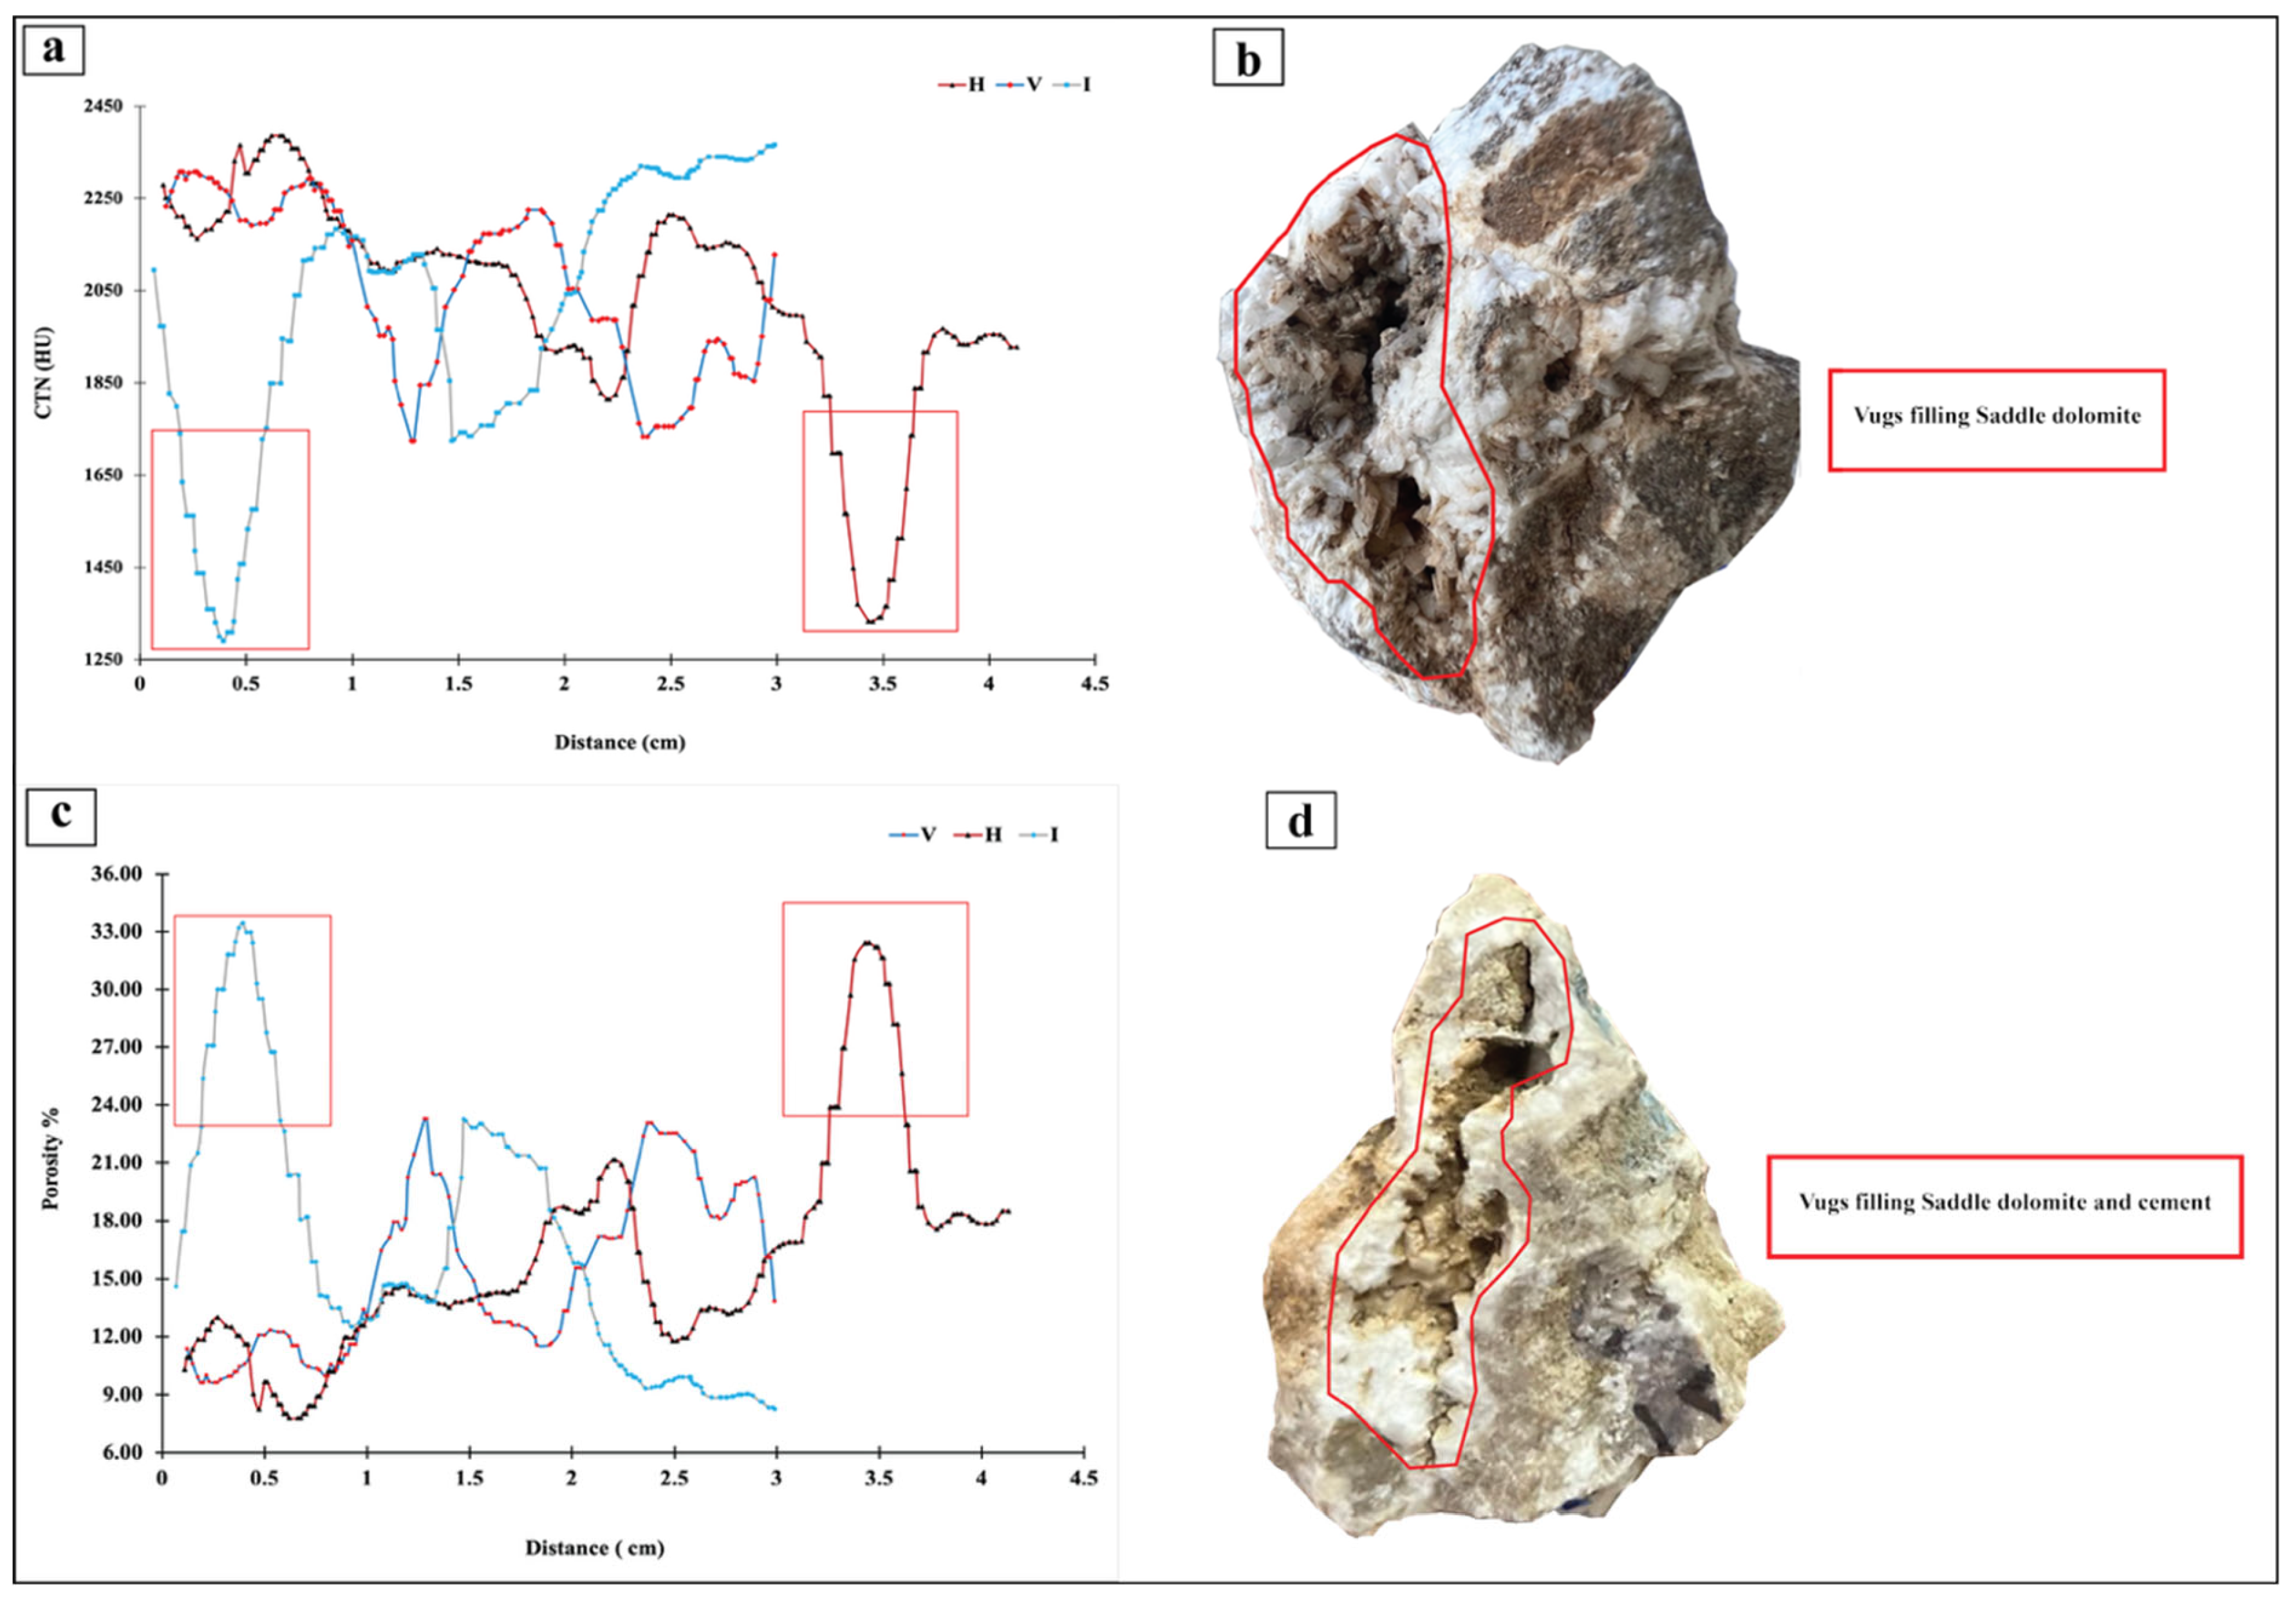
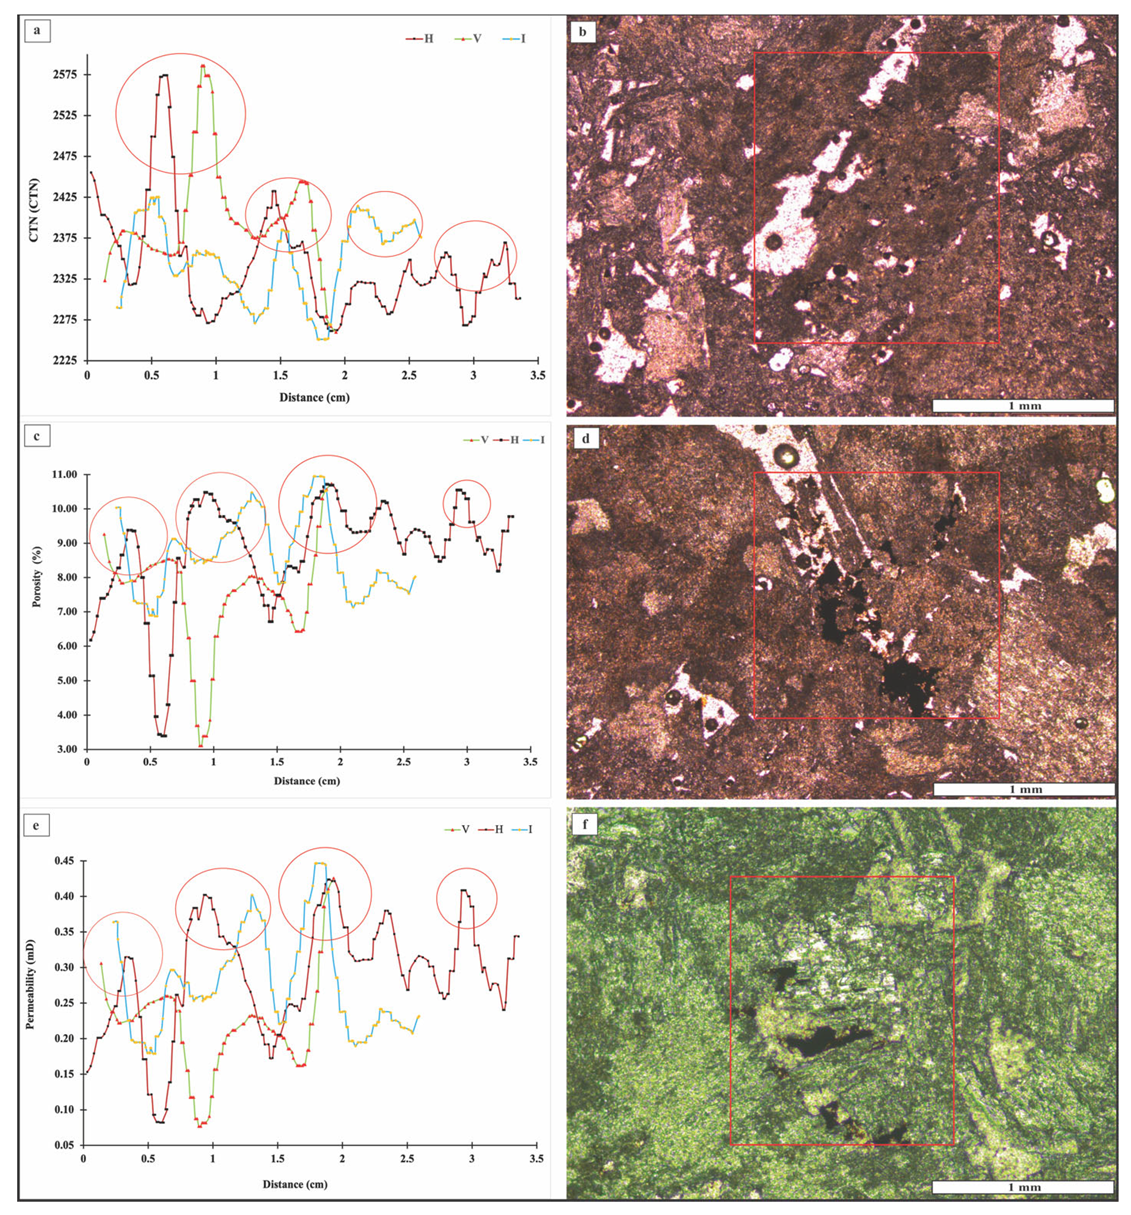
Utilizing X-ray computed tomography (CT) for late-stage diagenesis in hydrothermal dolomitization (HTD) reveals significant variations in CTN, density, and porosity in different kinds of texture induced by HT fluids. The direct evidence for late diagenetic features is represented by zebra-like textures, dolomite brecciation, fracture/vuggy fabrics filled with saddle dolomite. The CT scan analyses show a complex interaction of late diagenetic HT fluids with the host and early dolomitization rocks, prominently affecting the petrophysical properties of the surrounding carbonate rocks. Particularly, the transformation of pre-existing calcite or dolomite (early diagenesis) to coarser saddle dolomite (late diagenesis), which reflects significant modifications in rock porosity and density as evidenced by CTN variations, Sd, and their porosities. Extensive spot analysis from surface samples were conducted, encompassing 1201 spot evaluations across different lines of hydrothermally dolomitized samples. Variations in CTN from as low as −881 HU indicates low-dense and high porous rock, while CTN up to 2697 HU reflects high dense and low porous rock. This substantial variability provides a pronounced impact of hydrothermal fluid entrapments on reservoir capacity and characteristics. The vuggy zones exhibit greater heterogeneity compared to fractured ones, largely due to cementation/dissolution processes that possible addressing various conditions for intensive fluid–rock interaction. Fluid movements within these formations have facilitated the formation of voids and fractures, resulting in increasing porosity and permeability, in places exceeding 50% in vuggy sections (Figure 15), suggesting that hydrocarbon migration follows the HT-fluid movement [21,43]
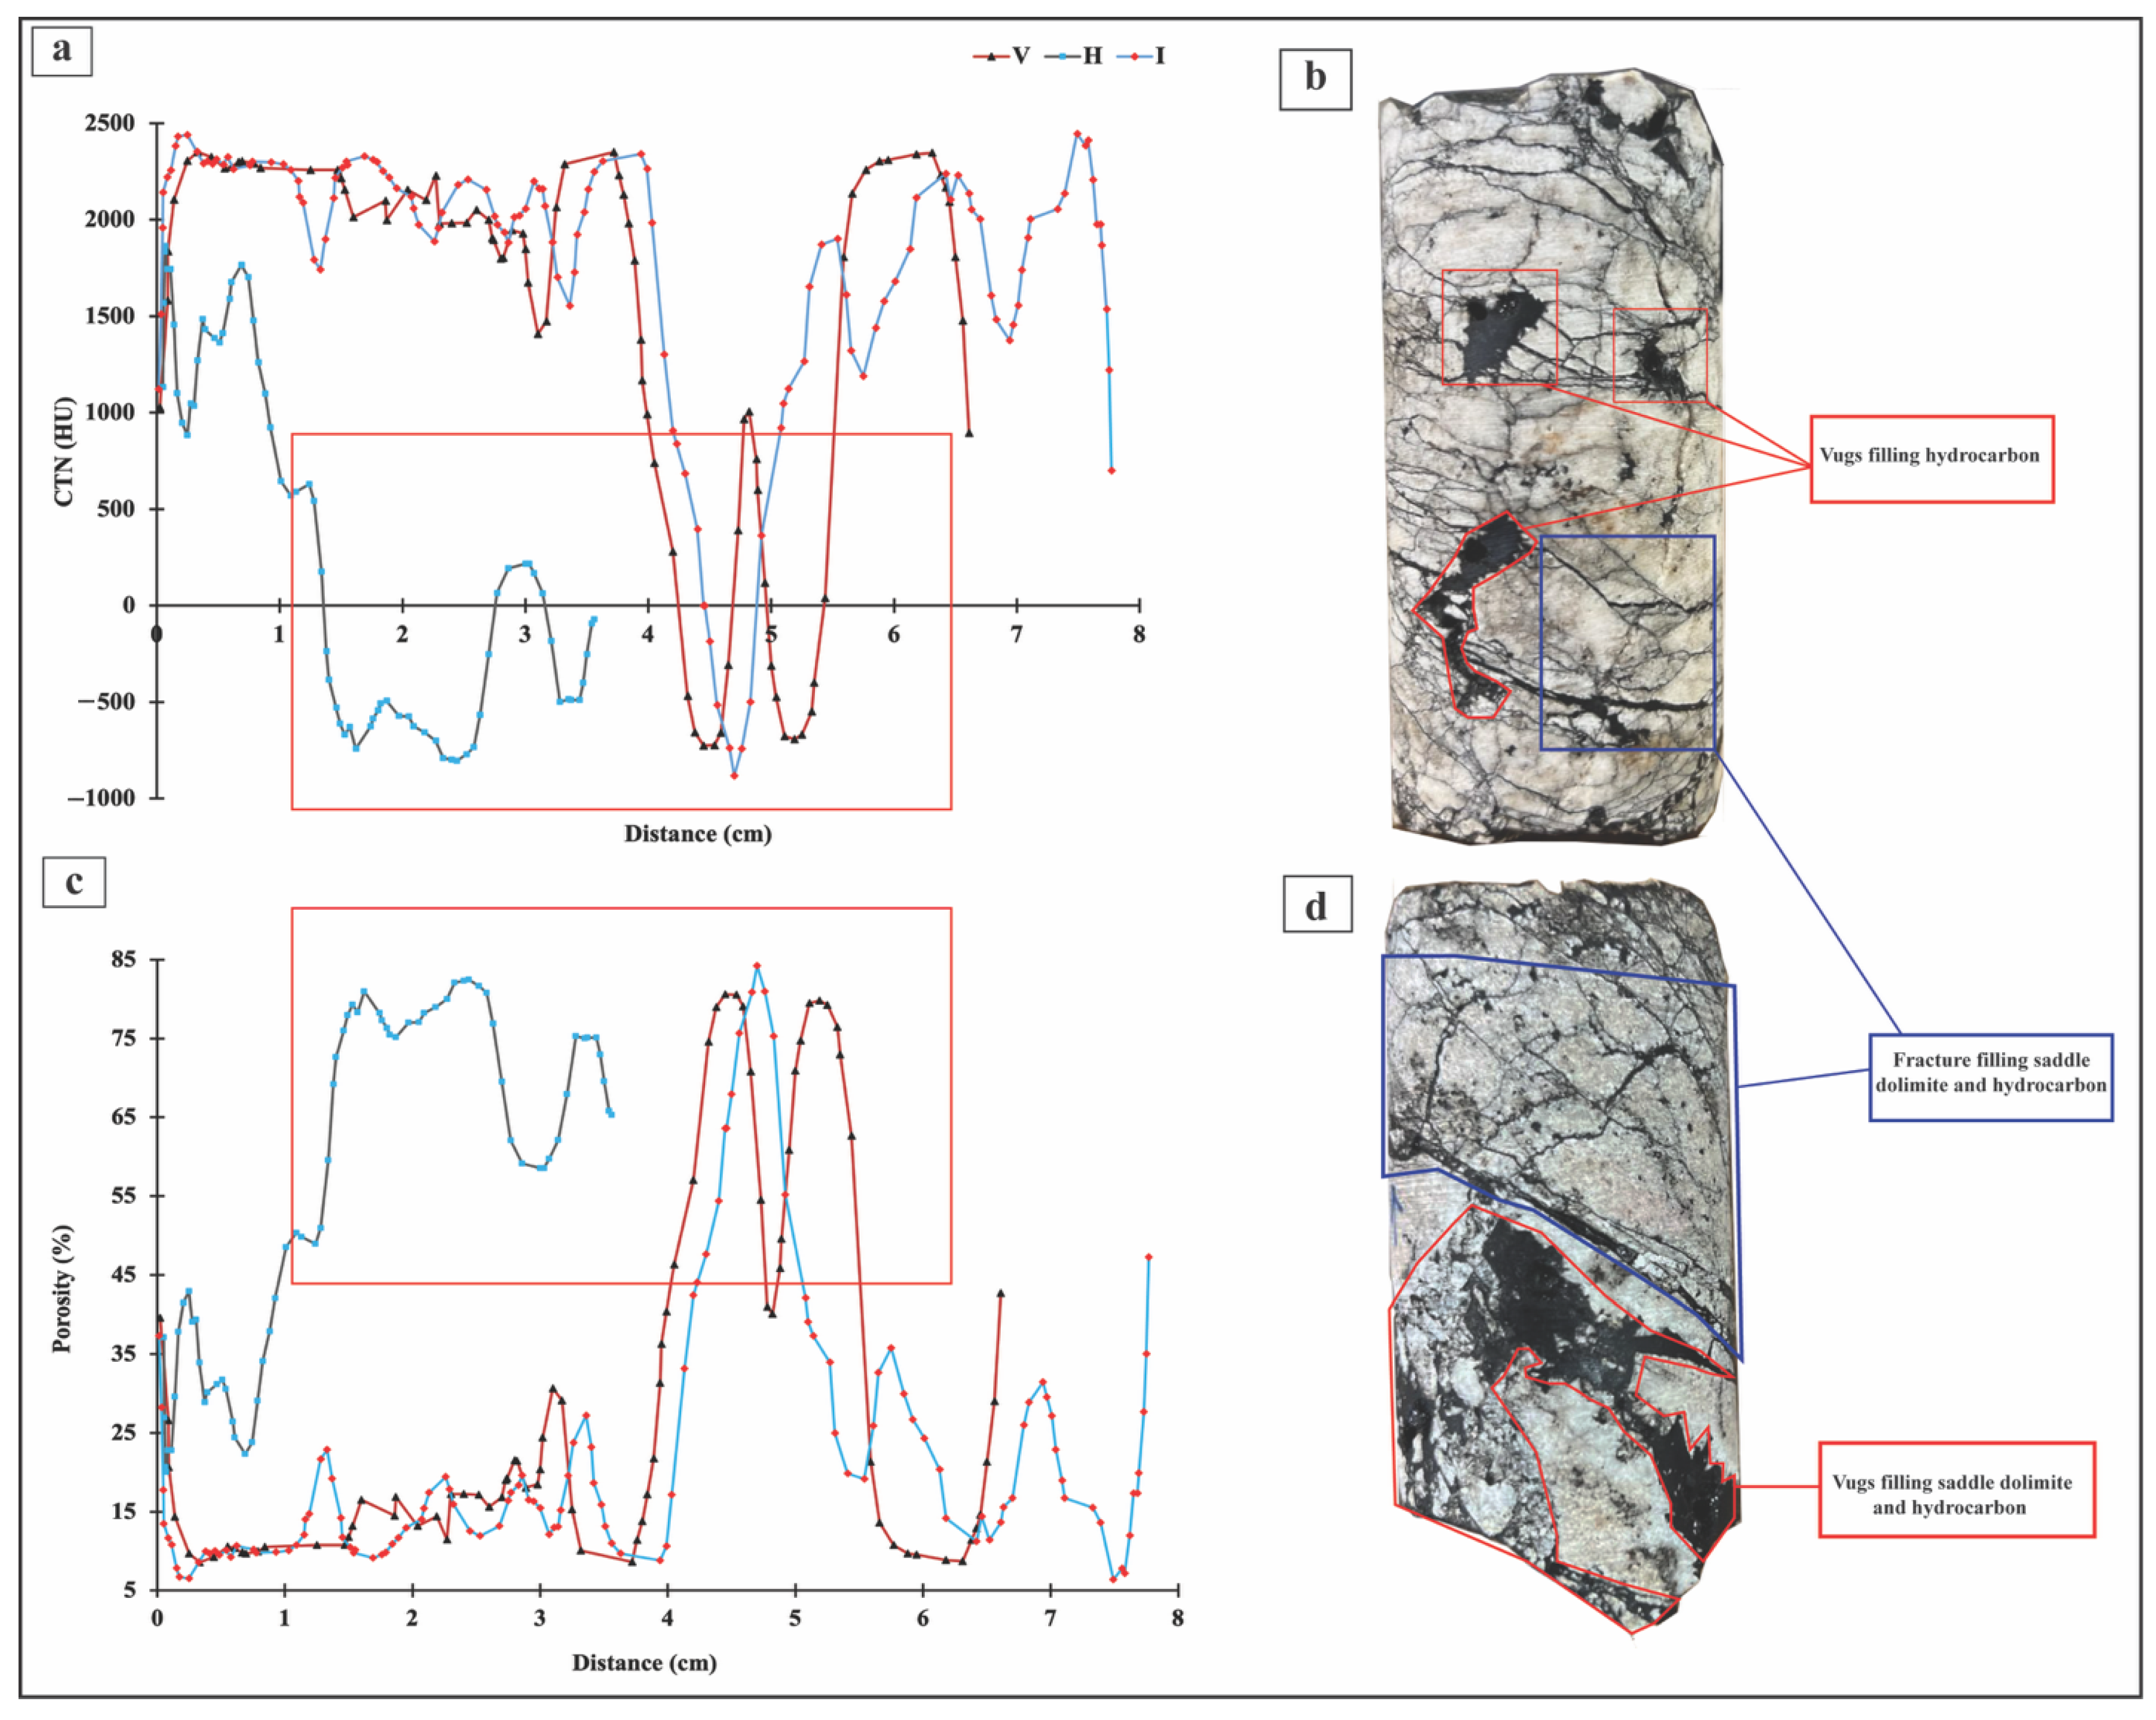
Interestingly, the CTN values indicate that the highest porosity and lowest density are compatible with vuggy zones, particularly along horizontal line, which display a considerable range of CTN (−741 to 1845 HU). Porosity in the vuggy zone reaches higher than 50.00%, where the reservoir was driven by HT-dissolution processes along with hydrocarbon migration (Figure 16). This pattern demonstrates the significant role of hydrothermal activity in enhancing reservoir capacity. In contract, the zebra-like texture shows a progressive reduction in porosity and permeability values (Figure 17), with high CTN values (ranging from 2407 to 2697 HU). Zebra texture is represented by fractures in the form of banded features with an alternative occurrence of white and gray bands, named a zebra-like texture (Figure 5c,d). Therefore, these differences in petrophysical properties of reservoir rocks associated with HT-dolomitization fluids suggest an intense to low fluid–rock interactions within various phases of HT fluid entrapment.
The subsurface sample with a detailed data (1713 SA) obtained from different depths reveal a considerable CTN range from 457 to 2586 HU (Av. 2118 HU). This range highlights a distinctive compaction and burial effects on rock density and reservoir characteristics. Such findings align with the understanding that mechanical processes like deep burial diagenesis with the presence of dense/distorted saddle dolomite (Figure 6 and Figure 7). These features significantly contribute to increased rock density while concurrently reducing porosity through mechanical compaction (Figure 6). Furthermore, the twisting and distortion of saddle dolomite (2296 m) exhibit CTN values between 1931 and 2586 HU (Av. 2341 HU) with porosity between 3.10 and 18.43%, (Av. 8.84%), and permeability from 0.08 and 2.39 mD (Av. 0.31 mD). These data agreed with the finding that the burial depth would destroy the reservoir characterization [21]. However, with increasing burial depth (2293 m) and vertical/tectonic stress produced the in situ brecciation of saddle dolomite (Figure 7 and Figure 18). The CTN shifted to lower values compared to those associated with twisted saddle dolomitization (Figure 6 and Figure 19). The scanned data from in situ brecciated saddle dolomite display a significant variable measurement (457 to 2446 HU; Av. 1823 H) with porosity ranging from 6.38 to 52.92% (Av. 20.97%) and permeability from 0.16 to 5462.62 mD (Av. 223.11 mD). This shift in values reflects the impact of further mechanical breakdown of twisted saddle dolomite crystals under considerable depth along their 2-set cleavages. This mechanical force causes a brittle deformation on dolomite grains causes the in situ brecciated texture (Figure 7). This texture creates an open space for hydrocarbon migration within increasing burial stress. The moderate average of CTN (Av. 1823 HU) with porosity (Av. 20.97%) and permeability (Av. 223.11 mD) in brecciated saddle dolomite is in agreement with petrographic observations and consequently enhanced the reservoir characteristics. The hydrocarbon within the pore network of brecciated dolomite probably migrated during or shortly after the influx of HT-dolomitizing fluids.
Thus, the CT scan results assert the complexity of the subsurface rocks and provide a structural change on permeable pathways as loading conditions varied, which is essential for understanding fluid dynamics and their primary and secondary entrapments within subsurface reservoirs [45]. The correlation between CTN and microscopic physical properties of the rocks emphasizes the X-ray CT scan implications for hydrocarbon exploration and reservoir capacity, as advanced imaging techniques like X-ray tomography explains the nature of complex pore structures in carbonate formations [21,46]. The understanding of HT influence on porosity–permeability relationships through CT scans integrated with optical observations can significantly contribute to effective reservoir characterization and optimization of hydrocarbon production strategies.

5.6. Diagenetic Timing and Fluid Entrapment in Vuggy and Fracture Systems

The relationship between porosity enhancement and storage capacity in HT-dolomitized reservoirs represents a significant deviation from previous documented works in conventional carbonate systems. The dolomitization typically causes a moderate porosity improvement relative to precursor limestones [47]. However, our data demonstrate a shifting increase in porosity and permeability by approximately 50.00% and up to 5000.00 mD, respectively. This distinctive enhancement in storage capacity and reservoir characteristics are directly linked to hydrothermal dissolution in Cretaceous formations. The evidence for hydrothermal activity in the region is supported by fluid inclusion data and isotopic signatures, and have been supported by the wide range of homogenization temperatures (Th) and salinity [14,21]. The wide range of Th and salinity demonstrate the effect of hydrothermal alteration on the early and saddle dolomite formation filled the fractures [14,21]. The saddle dolomites exhibit elevated Sr isotope ratios along with elevated Th levels and salinity, suggesting an origin related to hydrothermal processes [48]. Hence, the negative δ18O values suggest the occurrence of many phases of hydrothermal fluids [43]. The “dolostones and dolomite cements” in the host rock are primarily formed within a similar range of temperatures. These geochemical features indicate the alteration due to hydrothermal fluids contributed to porosity development.
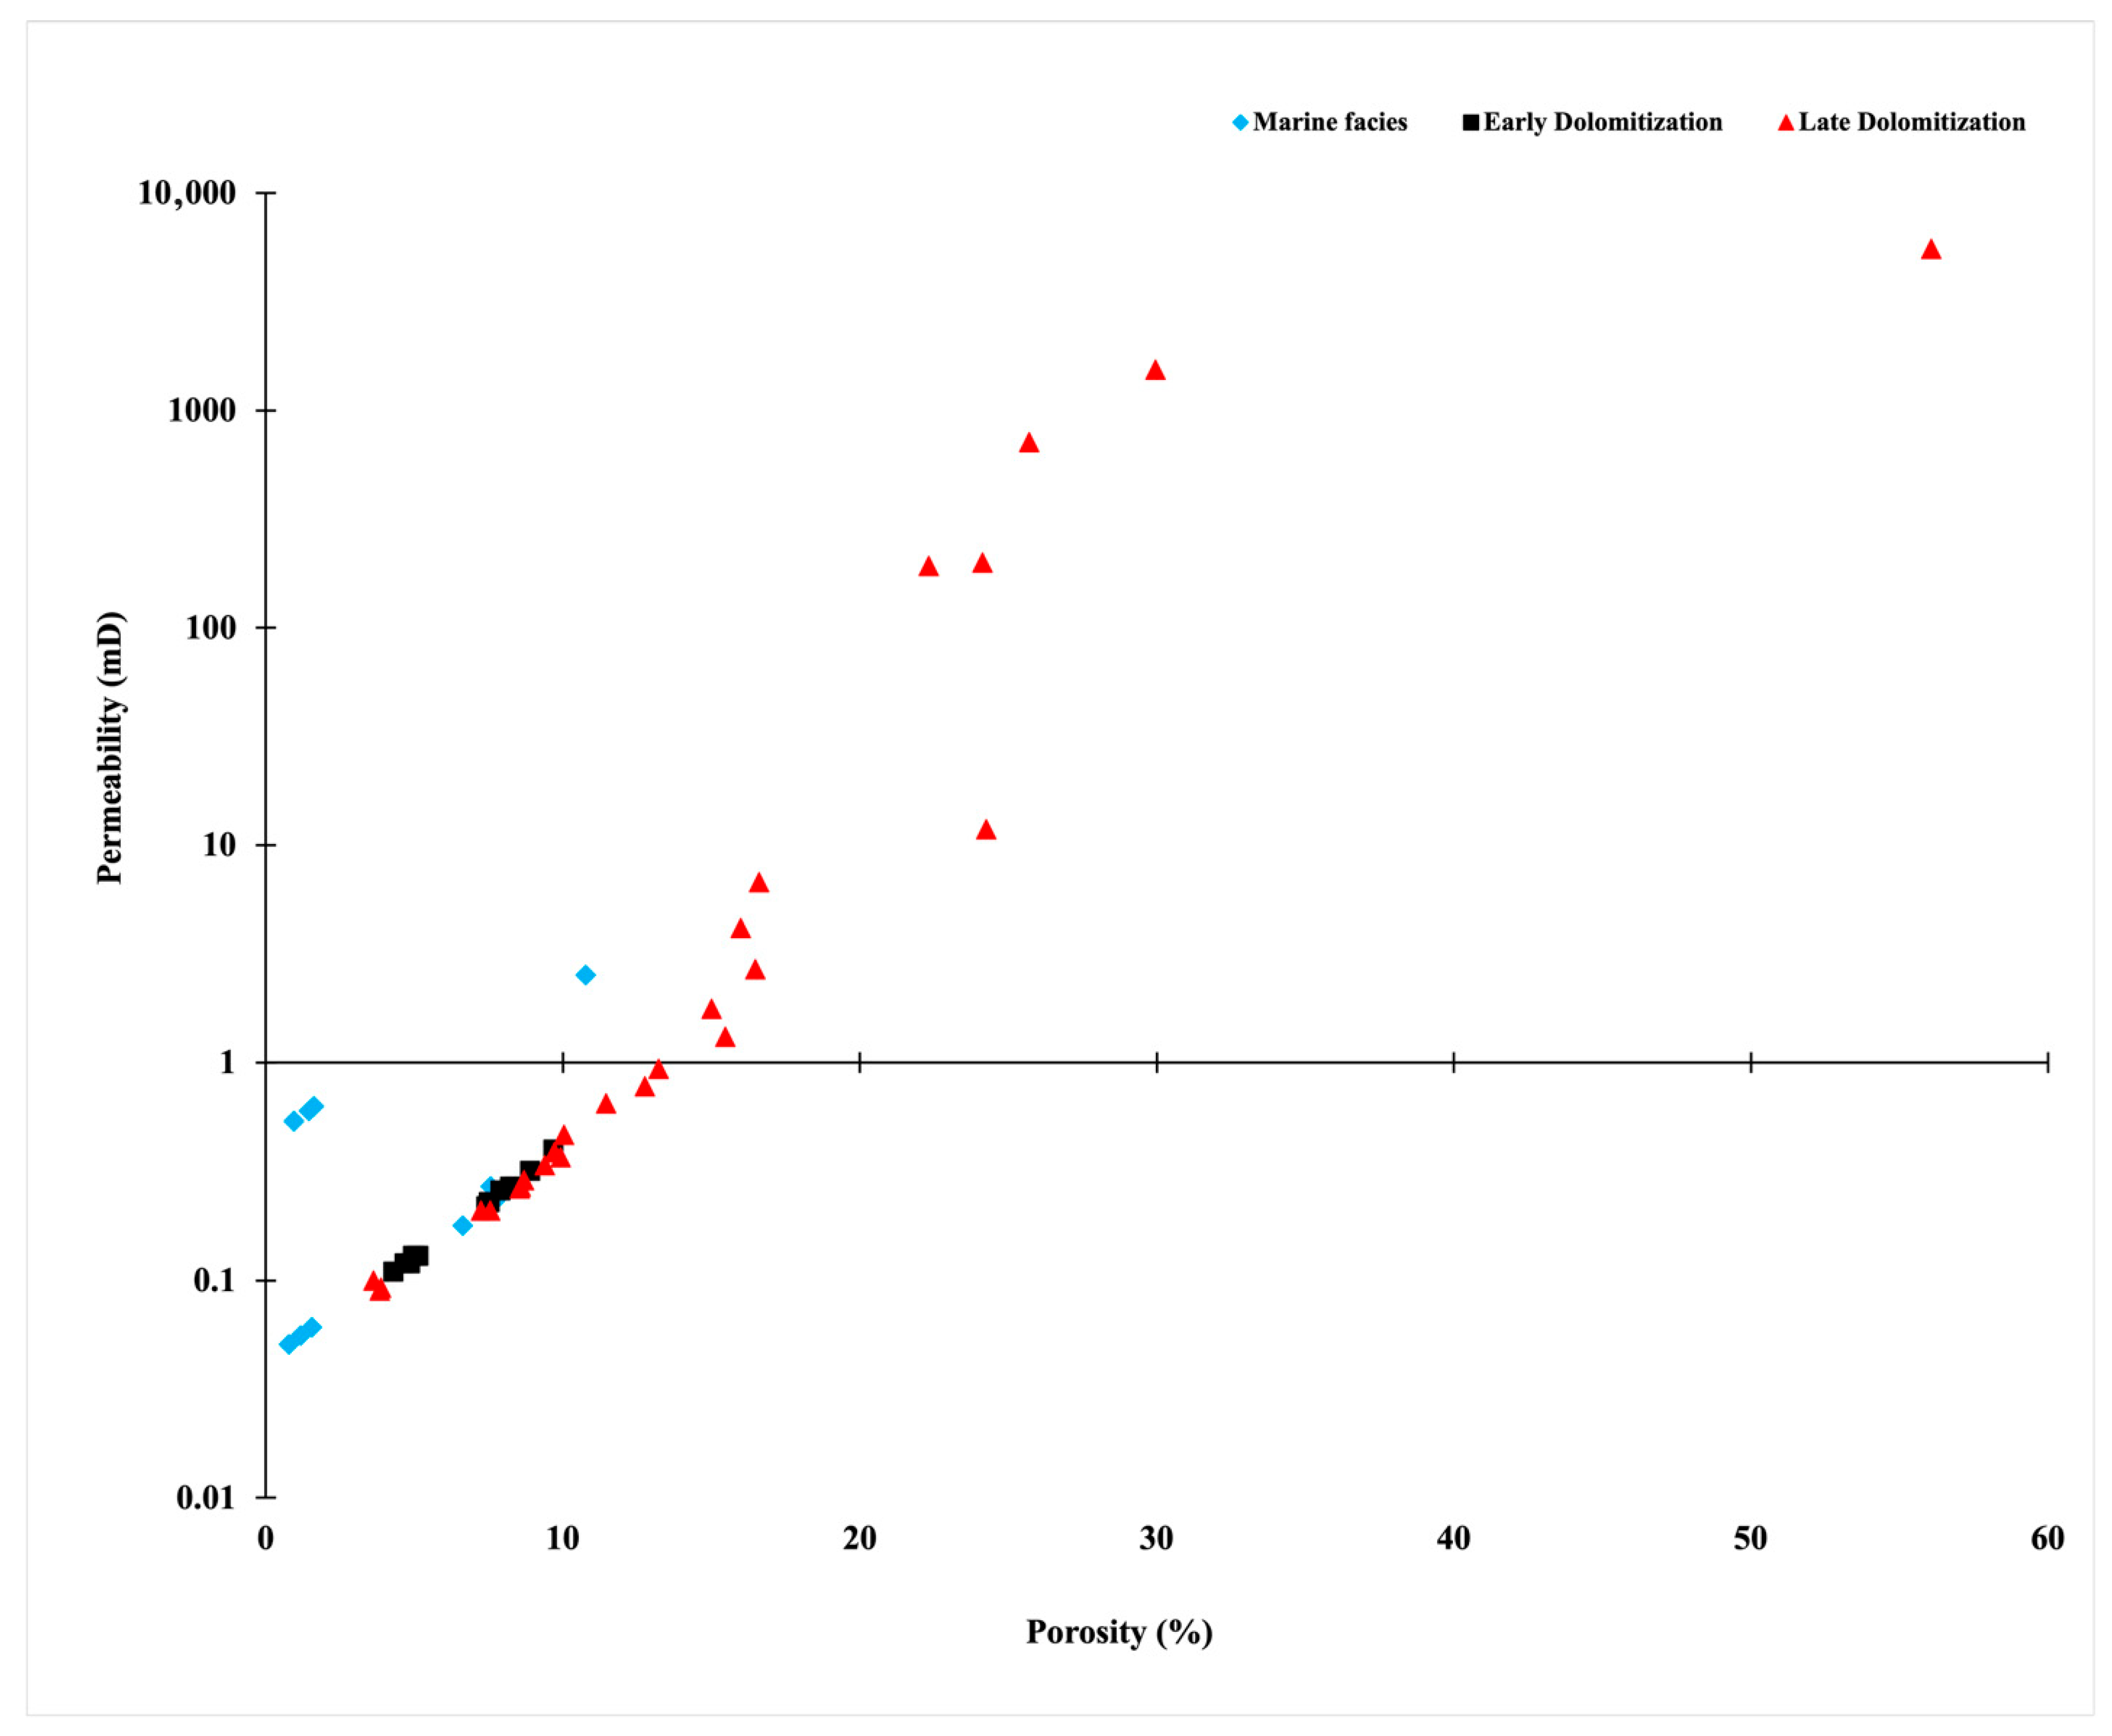
The high-temperature dolomitization actively contributes to the formation of new pore spaces through a complex dissolution–precipitation reactions. Our findings are not in line with those utilized conventional tools that evolution of pore development in dolomite systems favor the preservation of primary pores and the introduction of new porosity for reservoir improvement [49]. The hundreds of CTN and calculated porosity and permeability obtained from late diagenetic samples (Figure 20) display a distinctive relationship between porosity and permeability that differ obviously from both marine and early dolomitizing rocks (Figure 20). The porosity–permeability relationship becomes pronounced at porosity values exceeding 10.00%, while the permeability increases from approximately 0.40 to 0.94 mD. By integrating the CTN measurements with the porosity–permeability relationship (Figure 15, Figure 16, Figure 17, Figure 18, Figure 19 and Figure 20), our study establishes a deep understanding of how the HT-dolomitization deforms the reservoir petrophysical properties, either in negative or positive way. For example, low CTN values are consistent with high porosity zones, while the permeability enhancement in late diagenetic samples is attributed to the development of connected vuggy pore systems identified through CT analysis. These integrated approaches reveal that the fluid entrapment in carbonate reservoirs is not a function of total porosity but depends on the specific pore/texture types formed during high-temperature dolomitizing fluids and/or under the influence of burial weight (Figure 16, Figure 19 and Figure 20). The most effective fluid entrapments that developed the reservoir characteristics are caused the: (i) Moderate-to-high porosity (>10.00%) during late diagenetic processes, (ii) Enhanced permeability (>0.94 mD) resulting from connected vuggy porosity, (iii) Sharp contrasts in CTN values indicating boundaries between different diagenetic fabrics. These conditions are associated with HT-dolomitization and distinguish the recent studied reservoirs from conventional mechanisms-driven the dolomitized reservoirs formation.
The analyses of both surface and subsurface samples from the Cretaceous reservoir formations reveal significant differences in the nature and distribution of HT-induced porosity–permeability relationship. Subsurface samples generally exhibit more pronounced permeability enhancement at equivalent porosity values, which can be attributed to the preservation of delicate pore structures from surface samples. Furthermore, the CTN profiles of surface and subsurface samples show extra-negative excursions. The subsurface samples show an effective hydrocarbon entrapment compared to their surface ones. Hydrocarbon-filled vugs are clearly identified by extra-negative CTN values (Figure 7, Figure 18 and Figure 20), suggesting the consistent continuing burial depth with in situ brecciation of SD. These features demonstrate that HT-dolomitization formed distinctive pore evolution that effectively trap and store hydrocarbons, unlike conventional porosity approaches, where fluid distribution tends to be relatively uniform. Therefore, HT-dolomitized reservoirs exhibit profound fluid–rock interaction with hydrocarbons being preferentially accumulated in vuggy pore systems.
The fluid inclusions and stable isotopes further supported the contemporaneous of hydrothermal and hydrocarbon occurrences [14]. These scholars are suggested that extra-light of δ18OVPDB and constant heavy δ13CVPDB originated form a hydrothermal fluid under deep burial settings, with homogenization temperature higher than surrounding environment. These pore spaces influenced by HT-leaching were hydrocarbon migrations associated with hot fluids under deep sitting conditions [14]. Hence, the examination of fluid inclusions in saddle dolomites indicates the occurrence of two phase of entrapment, suggesting the presence of multiple phases of high-temperature fluid that flowed through the Upper Cretaceous Bekhme formation [14]. The data acquired from both primary and secondary inclusions suggest that the entrapment temperatures of the fluid inclusions can be divided into two separate populations of Th values: a primary population ranging from 83 °C to 120 °C, and a secondary population extending from 130 °C to 160 °C. At elevated temperatures, a significant interaction between the fluid and rock is estimated. This powerful interaction has been previously documented [21].
The abrupt transitions between those categorized measured lines, two population of the CTN values, and their pattern in those lines with hydrocarbon-filled vugs with the surrounding matrix suggest that fluid entrapment occurs through a combination of capillary and structural mechanisms (Figure 18a–c). This combination caused a complex pore network originated through HT-dolomitization that assist the development of capillary seals at the interfaces between different pore types, while the overall heterogeneity of the system produced a structural trap that further enhanced the hydrocarbon entrapment. Thus, the porosity and permeability values (up to >12%, and 0.94 mD) in subsurface and porosity higher than 50.00%, and permeability (5000.00 mD) in surface section cannot be explained by simple increases in pore volume alone. Rather, they reflect fundamental changes in pore geometry and pore connectivity evolution were induced by HT-dolomitization processes due to intensive fluid–rock interaction. The absence of such extreme permeability enhancement in the marine and early diagenetic facies confirms that HT-dolomitization represents a distinctive diagenetic process with unique implications for reservoir enhancement.

6. Conclusions

The results from this study show a clear contrast in density, porosity, permeability, and rock heterogeneity between surface and subsurface carbonate reservoir rocks, and present the evaluation of diagenetic processes on reservoir capacity and characterization. Surface marine facies have high CTN (2578–2982 HU) and very low porosity (1.20%), which are related to high compaction and cementation that give high density rocks and homogeneous packing. The early diagenesis shows moderate CTN ranges (1840–2564 HU at the surface section; 2142–2619 HU subsurface section), and porosity (8.51% in surface section and 6.49% in subsurface section). The subsurface dolomite rocks, particularly anhedral to subhedral dolomite show low porous media compared to the surface dolomite, with dense grain packing. These data from early diagenesis facies suggest the fluid-rock interaction was higher in the surface rocks by dissolving minerals, while the subsurface rocks are predominantly influenced by burial conditions, resulting in fine-grained dolomite with reduced porosity due to com-paction/cementation in a semi-open system, and less fluid-rock interaction.
The late HTD diagenesis shows a considerable range of the CTN (−881 to 2697 HU in the surface section; 457 to 2586 HU in the subsurface) and significant porosity-permeability enhancements (Av. up to 15.47%, 301.27mD in the surface and 14.05%, 91.56 mD in subsurface), confirm the impact of hydrothermal fluid interactions with surrounding rocks. Late diagenesis (HTD) plays a significant role in modifying rock density and porous media, particularly in coarse translucent and brecciated saddle dolomites, where extensive dissolution and hydro-fracturing significantly enhance reservoir storage capacity. Interestingly, the late-HT dolomitization samples in subsurface section illustrate two stages of alteration induced-HT fluid. Consequently, two textures controlled the reservoir characterization, they are coeval with distortion and in situ brecciation of saddle dolomites.
The CTN spot analysis emphasizes that hydrothermal fluid entrapment leads to complex variations in rock density, and exchanging high- and low-porous media, which directly impact reservoir quality. The highest porosity values are observed in hydrothermal vuggy dolomites, where dissolution processes have predominated the fluid flow and storage capacity. The elevated porosity confirms the influence of dissolution process, formation of vuggy zones, and intensive fluid-rock interaction, which is promoted by the presence of hot dissolution fluids. The entrapment of hydrothermal fluids is likely contemporaneous with the migration and accumulation of hydrocarbons, as well as the enhancement of reservoir characterization. Therefore, this study confirms that X-ray CT is a valuable tool for evaluation the carbonate reservoir properties, providing high-resolution insights into rock heterogeneity, porosity distribution, and the effects of diagenesis on surface and subsurface sections under hydrothermal and non-hydrothermal dolomitizating conditions. By integrating CTN with petrographic observations, this study offered a deep understanding of carbonate diagenesis, the importance of hydrothermal and burial diagenesis on reservoir quality and provide a significant information for future hydrocarbon exploration and evaluation of reservoir storage in shallow and deep burial carbonate reservoirs.

Author Contributions

Methodology, N.S.; Software, N.S.; Formal analysis, N.S. and Z.M.; Resources, N.S., Z.M. and A.P.; Data curation, N.S., Z.M. and A.P.; Writing—original draft, N.S. and Z.M.; Writing—review and editing, N.S. and A.P.; Visualization, N.S. and A.P.; Supervision, N.S. and A.P. All authors have read and agreed to the published version of the manuscript.

Funding

The study benefited from research funds of the Université Libre de Bruxelles (ULB)-Belgium.

Data Availability Statement

The original contributions presented in this study are included in the article. Further inquiries can be directed to the corresponding author.

Conflicts of Interest

The authors declare no conflicts of interest.

References

  1. Cuong, N.; Minh, N.; Cuong, H.; Quoc, P.; Anh, N.; Hieu, N. Porosity Estimation from High Resolution CT SAN Images of Rock Samples by Using Housfield Unit. Open J. Geol. 2018, 8, 1019–1026. [Google Scholar] [CrossRef]
  2. Wellington, S.L.; Vinegar, H.J. X-Ray Computerized Tomography. J. Pet. Technol. 1987, 39, 885–898. [Google Scholar] [CrossRef]
  3. Alves, H.; Lima, I.; Lopes, R.T. Methodology for attainment of density and effective atomic number through dual energy technique using microtomographic images. Appl. Radiat. Isot. 2014, 89, 6–12. [Google Scholar] [CrossRef]
  4. Jussiani, E.; Appoloni, C. Effective atomic number and density determination of rocks by X-ray microtomography. Micron 2014, 70C, 1–6. [Google Scholar] [CrossRef] [PubMed]
  5. Faisal, R.; Salih, N.; Kamal, I.; Préat, A. X-ray Computed Tomography (CT) to Scan the Structure and Characterize the Mud Cake Incorporated with Various Magnetic NPs Concentration: An Application to Evaluate the Wellbore Stability and Formation Damage. Nanomaterials 2023, 13, 1843. [Google Scholar] [CrossRef]
  6. Andrianov, A.; Farajzadeh, R.; Mahmoodi Nick, M.; Talanana, M.; Zitha, P.L.J. Immiscible Foam for Enhancing Oil Recovery: Bulk and Porous Media Experiments. Ind. Eng. Chem. Res. 2012, 51, 2214–2226. [Google Scholar] [CrossRef]
  7. Farajzadeh, R.; Andrianov, A.; Zitha, P.L.J. Investigation of Immiscible and Miscible Foam for Enhancing Oil Recovery. Ind. Eng. Chem. Res. 2010, 49, 1910–1919. [Google Scholar] [CrossRef]
  8. Larmagnat, S.; Des Roches, M.; Daigle, L.-F.; Francus, P.; Lavoie, D.; Raymond, J.; Malo, M.; Aubiès-Trouilh, A. Continuous porosity characterization: Metric-scale intervals in heterogeneous sedimentary rocks using medical CT-scanner. Mar. Pet. Geol. 2019, 109, 361–380. [Google Scholar] [CrossRef]
  9. Nielsen, B.D. Non-Destructive Soil Testing Using X-Ray Computed Tomography. Master’s Thesis, Montana State University-College of Engineering Bozeman, Bozeman, MT, USA, 2004. [Google Scholar]
  10. Haagsma, A.; Scharenberg, M.; Keister, L.; Schuetter, J.; Gupta, N. Secondary porosity prediction in complex carbonate reefs using 3D CT scan image analysis and machine learning. J. Pet. Sci. Eng. 2021, 207, 109087. [Google Scholar] [CrossRef]
  11. Sun, X.; Cao, S.; Niu, Z. Thin section and X-ray computed tomography for characterizing volcanic reservoirs in Chagan Sag, Yin-E. Basin, China. Interpretation 2020, 8, T777–T791. [Google Scholar] [CrossRef]
  12. Zhu, J.; Liu, Y.; Hu, Z. Multi-scale CT imaging technique characterization of volcanic rock reservoirs: A study case from the Changling fault depression of the southern Songliao Basin. Front. Earth Sci. 2025, 13, 1456257. [Google Scholar] [CrossRef]
  13. Zhang, P.; Lee, Y.I.; Zhang, J. A review of high-resolution X-ray computed tomography applied to petroleum geology and a case study. Micron 2019, 124, 102702. [Google Scholar] [CrossRef] [PubMed]
  14. Salih, N.; Mansurbeg, H.; Muchez, P.; Gerdes, A.; Préat, A. Hydrothermal Fluids and Cold Meteoric Waters along Tectonic-Controlled Open Spaces in Upper Cretaceous Carbonate Rocks, NE-Iraq: Scanning Data from In Situ U-Pb Geochronology and Microthermometry. Water 2021, 13, 3559. [Google Scholar] [CrossRef]
  15. Salih, N. Scanning the Lower Cretaceous carbonate rocks utilizing stable isotopes and petrographic records. J. Earth Sci. Environ. Stud. 2022, 6, 148–163. [Google Scholar]
  16. Buday, T.; Tyráček, J.; Kassab, I.I.M.; Jassim, S.Z. State Organization for Minerals, Directorate General for Geological Survey and Mineral Investigations. In The Regional Geology of Iraq: Stratigraphy and Paleogeography; Geological Survey of Iraq: Baghdad, Iraq, 1980; Volume 1, p. 445. [Google Scholar]
  17. English, J.; Lunn, G.; Ferreira, L.; Yacu, G. Geologic Evolution of the Iraqi Zagros, and its Influence on the Distribution of Hydrocarbons in the Kurdistan Region. AAPG Bull. 2015, 99, 231–272. [Google Scholar] [CrossRef]
  18. Al-Juboury, A.; Al-Zoobay, B.; Al-Juwainy, Q. Facies analysis of the Albian-Cenomanian carbonates, northeastern Iraq. Earth Life 2006, 1, 1–14. [Google Scholar]
  19. Al-Qayim, B.; Qadir, F.M.; Albeyati, F. Dolomitization and porosity evaluation of the Cretaceous Upper Qamchuqa (Mauddud) Formation, Khabbaz oil field, Kirkuk area, northern Iraq. GeoArabia 2010, 15, 49–76. [Google Scholar] [CrossRef]
  20. Salih, N.; Mansurbeg, H.; Kolo, K.; Gerdes, A.; Préat, A. In situ U-Pb dating of hydrothermal diagenesis in tectonically controlled fracturing in the Upper Cretaceous Bekhme Formation, Kurdistan Region-Iraq. Int. Geol. Rev. 2019, 62, 2261–2279. [Google Scholar] [CrossRef]
  21. Salih, N.; Mansurbeg, H.; Kolo, K.; Préat, A. Hydrothermal carbonate mineralization, calcretization, and microbial diagenesis associated with multiple sedimentary phases in the Upper Cretaceous Bekhme Formation, Kurdistan Region-Iraq. Geosciences 2019, 9, 459. [Google Scholar] [CrossRef]
  22. Aqrawi, A.A.; Goff, J.C.; Horbury, A.D.; Sadooni, F.N. The Petroleum Geology of Iraq; Scientific Press: Beaconsfield, Bucks, UK, 2010. [Google Scholar]
  23. Al-Qayim, B.; Rashid, F. Reservoir characteristics of the albian upper qamchuqa formation carbonates, Taq Taq oilfield, Kurdistan, Iraq. J. Pet. Geol. 2012, 35, 317–341. [Google Scholar] [CrossRef]
  24. Al-Kadhimi, J.; Sissakian, V.; Fattah, A.; Deikran, D. Tectonic Map of Iraq, Scale 1: 1000 000, 2nd ed.; GEOSURV: Baghdad, Iraq, 1996; pp. 1–38. [Google Scholar]
  25. Jassim, S.; Goff, J. Dolin, Prague and Moravian Museum; Geology of Iraq: Brno, Czech Republic, 2006; p. 341. [Google Scholar]
  26. Machel, H.G. Concepts and Models of Dolomitization: A Critical Reappraisal. In The Geometry and Petrogenesis of Dolomite Hydrocarbon Reservoirs; Braithwaite, C.J.R., Rizzi, G., Darke, G., Eds.; Geological Society Special Publication: London, UK, 2004; Volume 235, pp. 77–93. [Google Scholar]
  27. Sissakian, V.; Bar, M.; Al-Ansari, N.; Knutsson, S. Development of Gulley Ali Beg Gorge in Rawandooz Area, Northern Iraq. Engineering 2015, 7, 16–30. [Google Scholar] [CrossRef]
  28. Muhammad, Z.; Salih, N.; Preat, A. Mechanism of Hydrothermal Dolomitization in Shallow and Deep Burial diagenesis: Implication for Hydrocarbon Mi-gration in the Cretaceous formation, NE-Iraq. Iraqi Natl. J. Earth Sci. (INJES) 2026, 26. under press. [Google Scholar]
  29. Saadat, K.; Rahimpour-Bonab, H.; Esfahani, M.; Vali, J. Empirical correlation for porosity deduction from X-ray computed tomography (CT). Geopersia 2011, 1, 47–54. [Google Scholar]
  30. Wang, F.; Li, Y.; Tang, X.; Chen, J.; Gao, W. Petrophysical properties analysis of a carbonate reservoir with natural fractures and vugs using X-ray computed tomography. J. Nat. Gas Sci. Eng. 2016, 28, 215–225. [Google Scholar] [CrossRef]
  31. Remeysen, K.; Swennen, R. Application of microfocus computed tomography in carbonate reservoir characterization: Possibilities and limitations. Mar. Pet. Geol. 2008, 25, 486–499. [Google Scholar] [CrossRef]
  32. Cnudde, V.; Boone, M.N. High-resolution X-ray computed tomography in geosciences: A review of the current technology and applications. Earth-Sci. Rev. 2013, 123, 1–17. [Google Scholar] [CrossRef]
  33. Veres, G.P.; Földes, T.; Szunyog, I. Assessment of core samples through the analysis of CT measurements and its implications for CO2 sequestration potential in a Hungarian depleted oil field. Results Eng. 2024, 24, 103241. [Google Scholar] [CrossRef]
  34. Merino, E.; Canals i Sabaté, À. Self-accelerating dolomite-for-calcite replacement: Self-organized dynamics of burial dolomitization and associated mineralization. Am. J. Sci. 2011, 311, 573–607. [Google Scholar] [CrossRef]
  35. Mehmood, M.; Yaseen, M.; Khan, E.U.; Khan, M.J. Dolomite and dolomitization model-a short review. Int. J. Hydrol. 2018, 2, 549–553. [Google Scholar] [CrossRef]
  36. Silva, C.M.; Rosseel, T.M.; Holliday, K.S. Radiation-induced changes in single crystal calcite and dolomite: Mineral analogues of light water reactor, nuclear power plant concrete aggregates. J. Phys. Chem. C 2022, 126, 634–646. [Google Scholar] [CrossRef]
  37. Yang, Y.-Q.; Qiu, L.-W.; Gregg, J.; Shi, Z.; Yu, K.-H. Formation of fine crystalline dolomites in lacustrine carbonates of the Eocene Sikou Depression, Bohai Bay Basin, East China. Pet. Sci. 2016, 13, 642–656. [Google Scholar] [CrossRef]
  38. Salih, N.M.; Al-Majmaie, S.M.; Muhammad, Z.A. The Porous–Permeable Zones in Heterogeneous Carbonate Reservoirs: A Case Study from Amara Oilfield, Iraq. Proceedings 2023, 87, 35. [Google Scholar] [CrossRef]
  39. Gao, X.; Yang, S.; Shen, B.; Tian, L.; Li, S.; Zhang, X.; Wang, J. Influence of reservoir spatial heterogeneity on a multicoupling process of CO2 geological storage. Energy Fuels 2023, 37, 14991–15005. [Google Scholar] [CrossRef]
  40. Qin, X.; Li, R.; Chen, L.; Jiao, K.; Cheng, J.; Khaled, A.; Yao, L.; Chen, J. Diagenetic Facies and Their Controls on the Quality of Tight Sandstone Reservoirs: A Case Study from the Upper Paleozoic Gas Reservoir in the Eastern Ordos Basin, North China. Geofluids 2023, 2023, 4445749. [Google Scholar] [CrossRef]
  41. Han, X.; Tan, X.; Li, X.; Pang, Y.; Zhang, L. Water invasion performance of complex fracture-vuggy gas reservoirs based on classification modeling. Adv. Geo-Energy Res. 2021, 5, 222–232. [Google Scholar] [CrossRef]
  42. Yang, M.; Lanzinha, J.C.G.; Bao, X. (Eds.) Hydraulic and Civil Engineering Technology VI: Proceedings of the 6th International Technical Conference on Frontiers of HCET 2021; IOS Press: Amsterdam, The Netherlands, 2021. [Google Scholar]
  43. Tavakkoli, M.; Kharrat, R.; Inaloo, S. SGS Versus Collocated Cokriging Petrophysical Modeling: A Comparative Study in a Heterogeneous Gas Condensate Carbonate Reservoir. In Proceedings of the SPE Oil and Gas India Conference and Exhibition, Mumbai, India, 20–22 January 2010. [Google Scholar]
  44. Salih, N.M. The Impact of Hydrothermal Fluids on Porosity Enhancement and Hydrocarbon Migration in Qamchuqa Formation, Lower Cretaceous, Kirkuk Oil Company. Minerals 2023, 13, 377. [Google Scholar] [CrossRef]
  45. Davies, G.R.; Smith, L.B., Jr. Structurally controlled hydrothermal dolomite reservoir facies: An overview. AAPG Bull. 2006, 90, 1641–1690. [Google Scholar] [CrossRef]
  46. Prakoso, S.; Burhannudinnur, M. Effects of pore complexity on saturated P-Wave velocity and its impact in estimating critical porosity. Arab. J. Basic Appl. Sci. 2020, 27, 335–343. [Google Scholar] [CrossRef]
  47. Garaguly, I.; Varga, A.; Raucsik, B.; Schubert, F.; Czuppon, G.; Frei, R. Pervasive early diagenetic dolomitization, subsequent hydrothermal alteration, and late stage hydrocarbon accumulation in a Middle Triassic carbonate sequence (Szeged Basin, SE Hungary). Mar. Pet. Geol. 2018, 98, 270–290. [Google Scholar] [CrossRef]
  48. Lucia, F.J. Petrophysical rock properties. In Carbonate Reservoir Characterization: An Integrated Approach; Springer: Berlin/Heidelberg, Germany, 2007; pp. 1–27. [Google Scholar]
  49. Wang, W.; Pang, X.; Chen, Z.; Chen, D.; Wang, Y.; Yang, X.; Luo, B.; Zhang, W.; Zhang, X.; Li, C.; et al. Quantitative evaluation of transport efficiency of fault-reservoir composite migration pathway systems in carbonate petroliferous basins. Energy 2021, 222, 119983. [Google Scholar] [CrossRef]
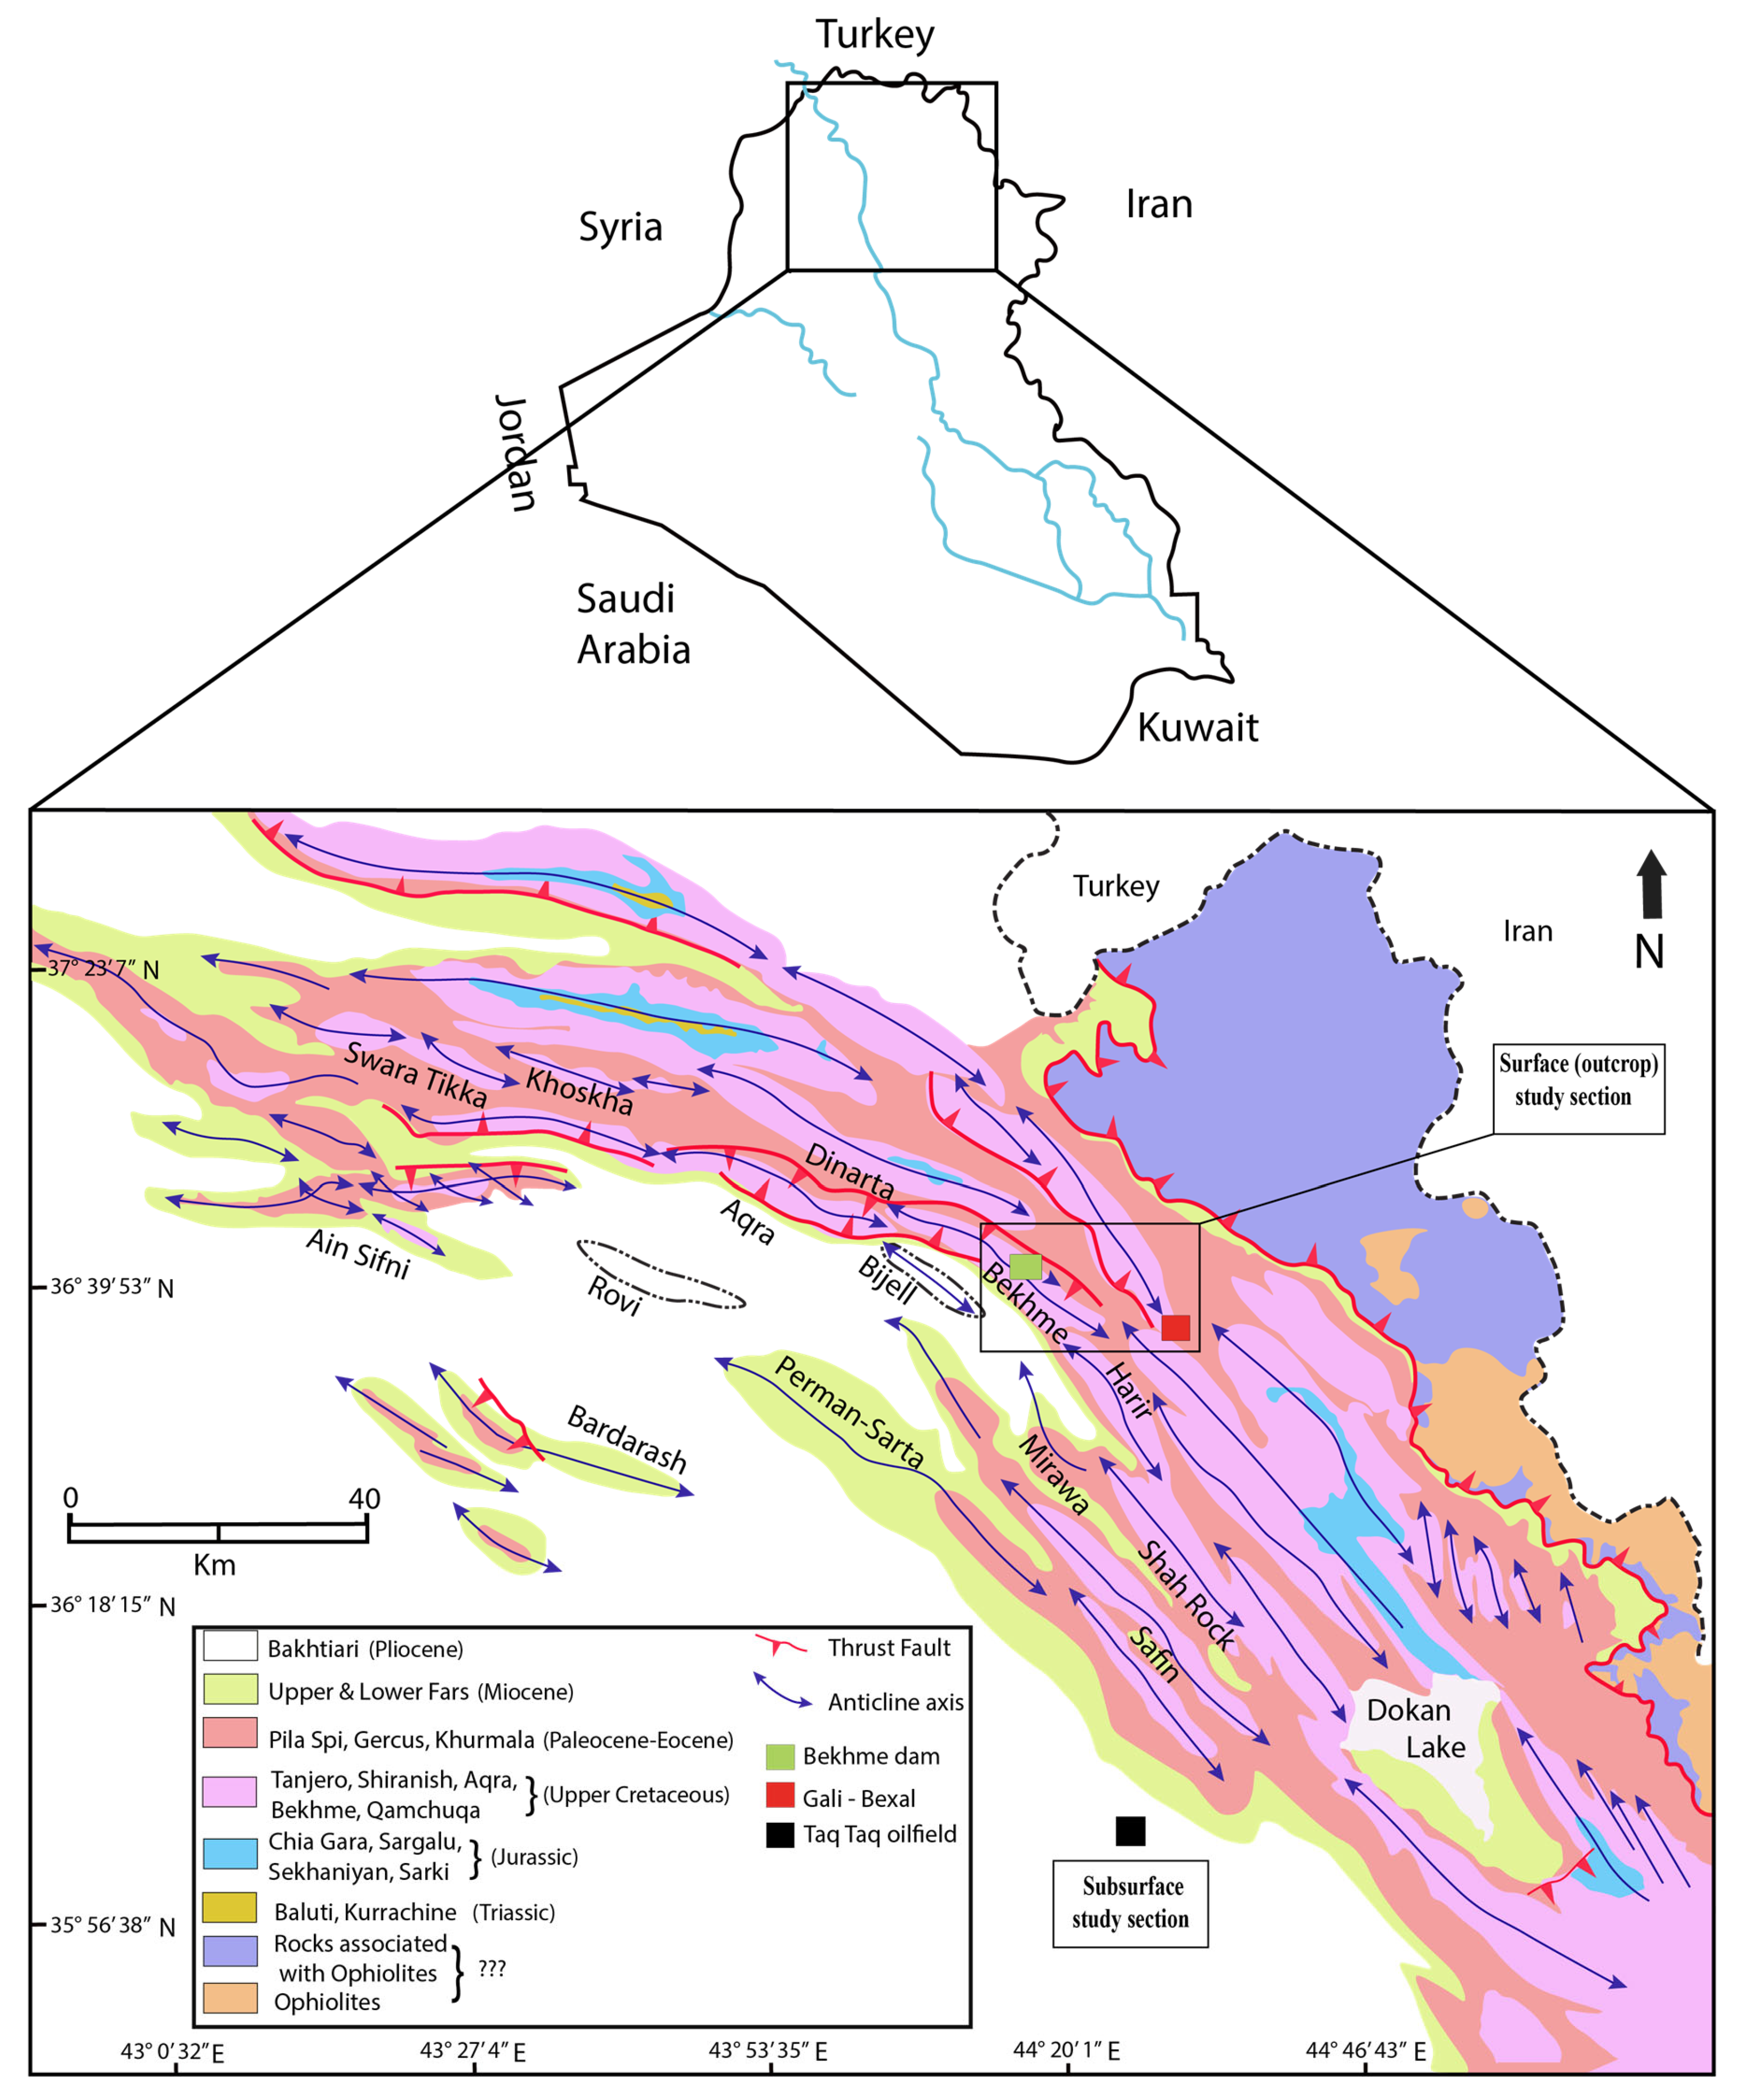
Figure 1. Geological and tectonic map illustrates the location of the studied sections, depicted as a (green, red, and black cube) [20].
Minerals 15 00908 g001
Figure 2. Workflow chart illustrating the successive steps involved in the present work and CT-scanning technique.
Minerals 15 00908 g002
Figure 3. Photomicrographs of pristine facies. (ad) showing the surface marine microfacies, samples: Z1 and Z16. XPL, location: Gali-Bekhal section. (e,f) Subsurface marine microfacies, sample: Q1; depth 2033 m, XPL, location: Taq Taq oilfield. XPL = cross polarized light.
Minerals 15 00908 g003
Figure 4. Photomicrographs of early dolomitization. (a,b) Fine crystalline early dolomitization formed within matrix dolomites, sample: W16.TT; depth: 2040 m. XPL. (cf) Coarse–very coarse crystalline early dolomitization affected by recrystallization that causes the dissolution of the crystal boundary, sample: W16.TT, depth: 2295 m. XPL.
Minerals 15 00908 g004
Figure 5. Photomicrographs from surface formation. (a,b) The early dolomitization affected by HT fluid and formed the saddle dolomite (SD) with formation of vugs/pore-paces along the fluid migration. (cf) The cementation of hydrothermal dolomitization (HTD) within the parallel fractures of zebra-like texture.
Minerals 15 00908 g005
Figure 6. Photomicrographs (ah) showing subsurface saddle dolomites (SDs) affected by vertical stress that caused the distortion and twisting curve (a,b) at 2394 m, (c,d) at 2293 m, (eg) at 2296 m, and (h) at 2302 m. All photomicrographs were obtained under XPL, sample: W16.TT.
Minerals 15 00908 g006
Figure 7. (af) Photomicrographs showing the in situ brecciation of saddle dolomite via 2-set cleavages of saddle dolomite (SDs) during the late-hydrothermal dolomitization (HTD) phase within the deep subsurface setting of the Qamchuqa Formation.
Minerals 15 00908 g007
Figure 8. The CTN measurement across three directions in various carbonate facies. (a) Marine facies (b); early diagenesis; (c,d) late HT dolomitization facies using RadiAnt software (version: 2025.1).
Minerals 15 00908 g008
Figure 9. Hounsfield Unit data compared to density of different minerals and compared to our values, which show the higher CTN in dolomite and lower CTN in calcite compared to the previous workers. Modified after [32].
Minerals 15 00908 g009
Figure 10. The distribution of the CTN standard deviation for all samples in the surface—subsurface settings.
Minerals 15 00908 g010
Figure 11. Photomicrographs and their CTN values vs. distance from the marine sample: (a) CTN profile across three directions shows values ranging from 2578 to 2919 HU. The red zone represents a fracture and vein that cut across the pristine facies, resulting drop in CTN due to reduced density. These features correspond to structurally influenced zones of fluid migration and diagenetic alteration. (b) Packstone microfacies affected by compaction and early cementation, contribute to high CTN values in dense rock. (c) The fracture-filling cement shows lower CTN compared to the pristine facies along with a reduction in porosity and permeability. Surface section.
Minerals 15 00908 g011
Figure 12. Photomicrographs with their CTN plots vs. distance from marine facies. (a) CTN profile across three directions with values ranging from 1446 to 2489 HU. (b) Bioclast chambers affected by early cementation contribute to high CTN values in the dense fabric zones. Close-up the red rectangle zone in (a,b), this red zone represents the values of CTN (a) in targeted facies (b). Subsurface section.
Minerals 15 00908 g012
Figure 13. Photomicrographs, and their CTN/porosity plots from early dolomitization facies. (a) CTN profile across three directions, showing a CTN ranging from 1840 to 2564 HU. A significant drop in CTN (1840 HU) corresponds to the presence of saddle dolomite along hydrothermal fluid pathways. (bd) Fine-grained, tightly compacted matrix dolomite with areas of preserved vuggy porosity associated with saddle dolomite and hydrothermal dissolution (blue and red rectangles). (c) Porosity profile along the same lines, values ranging from 6.00 up to 20.76%, with highest porosity value corresponding to lower CTN zones, indicates an infiltration of hydrothermal fluid during early dolomitization, thus enhancing dissolution and reservoir storage. Surface section.
Minerals 15 00908 g013
Figure 14. Photomicrographs and their CTN plots from early dolomitization. (a) CTN profiles across three directions with values ranging from 2322 to 2542 HU. The high CTN values indicate dense, compact rock formed under burial diagenesis. Red-circled zones mark local CTN drops, correlating with a reduction in density and heterogeneity of carbonate sample. (b) Tightly packed, recrystallized fine grain early dolomite crystals. (c) The red circles reveal residual intercrystallite porosity and isolated dissolution pores, consistent with the minor CTN reductions and hydrocarbon accumulation in (a). The overall low porosity (average 6.49%) and high density reflect the compaction effects and typical early dolomitization under burial condition. Subsurface section.
Minerals 15 00908 g014
Figure 15. Photos and their CTN/porosity plots from late-HT dolomitization in surface setting (a) CTN profile across three directions illustrates a striking drop in CTN from 2386 to as low as 1290 HU. (b) Vuggy texture lined with saddle dolomite formation. (c) Porosity profile along the same directions, showing a progressive and inverse relationship to CTN, where higher CTN corresponds to lower porosity (7.78%), confirming the involvement of [43] fluids. (d) Porosity vs. distance, the highest porosity (33.43 and 32.34%) consistent with the positive peaks (red rectangles); these data correspond to the vuggy samples in (d).
Minerals 15 00908 g015
Figure 16. Core samples with their CTN/porosity plots from late-HT dolomitization. (a) CTN profile across three directions shows a wide range of CTN (−881 to 2446 HU), indicating high heterogeneity and density variation in HTD. This variation reflects vuggy zones and fractures formed by profound fluid–rock interaction. (b) The core image of the sample shows the vuggy textures filled with hydrocarbon product and coeval with saddle dolomite formation. (c) Porosity profile shows the porosity values that ranging from 6.38 to 84.23%, the high porosity emphasizing the effect of dissolution and hydrocarbon migration in vuggy zones. (d) The core image, see their comparison from low porous media (upper part, blue line) to high porosity–permeability values (lower part, red line), the vuggy zone is filled with hydrocarbons. Surface section.
Minerals 15 00908 g016
Figure 17. Photomicrographs and their CTN/porosity values vs. distance from late-hydrothermal samples. (a) The CTN variations (2407 and 2697 HU) in zebra-like texture. (b) Fine crystalline dolomite with uniform texture, a typical of compacted texture. (c) Porosity profile shows a progressive and inverse relationship to CTN, where higher CTN corresponds to lower porosity. (d) Coarse and tight saddle dolomite in zebra-like texture characterized by alternating light and dark bands and fracture-controlled dolomite veins. These banded features reflect high-intensity, with high cementation reducing porosity and enhancing density. This zebra-like texture reveals the heterogeneity in hydrothermal dolomitization intensity and indicates variations in fluid pathways, porosity distribution, and reservoir quality within the dolomitized intervals. Surface section.
Minerals 15 00908 g017
Figure 18. Photomicrographs and their CTN plots from late-hydrothermal dolomitization. (a) CTN profile across three directions from twisted saddle dolomite (b), and in situ brecciated saddle dolomite (c). The high variability of CTN reveals two population groups within the same phase of saddle dolomitization (close up the red and black lines). Subsurface section.
Minerals 15 00908 g018
Figure 19. The figures showing variations in CT number, porosity, and permeability corresponding to petrographic observation. (a) CTN profile, ranging from 2225 to 2575 HU, provides the areas of density variation linked to twisting and distortion of HT-dolomitization. (b,d,f) Thin section photomicrographs corresponding to regions of varying CTN, porosity, and permeability in saddle dolomite and dissolution vugs. (c,e) Porosity profile, showing maximum porosity and permeability values (red circles). Subsurface section.
Minerals 15 00908 g019
Figure 20. The average porosity and permeability relationship (Marine facies, Early Diagenesis, and Late HTD diagenesis) from surface to subsurface section.
Minerals 15 00908 g020
Table 1. This table show the standard deviation for samples obtained from various carbonate phases in both surface to subsurface sections.
Sample No.SdvAreaParagenetic
Surface Reservoir Samples
Z1635.16 cm2Marine Facies
Z176810.89 cm2Marine Facies
Z121029.71 cm2Early Diagenesis
Z164607.20 cm2Late HT-diagenesis
Z221377.29 cm2Late HT-diagenesis
Z3572521.12 cm2Late HT-diagenesis
Subsurface Reservoir Samples
Q12683.12 cm2Marine Facies
Q22523.26 cm2Marine Facies
Q31842.30 cm2Early Diagenesis
Q41223.01 cm2Early Diagenesis
Q5404.12 cm2Early Diagenesis
Q6723.93 cm2Early Diagenesis
Q73093.33 cm2Late HT-diagenesis
Q81671.21 cm2Late HT-diagenesis
Q95989.05 cm2Late HT-diagenesis
Q10962.19 cm2Late HT-diagenesis
Q111021.83 cm2Late HT-diagenesis
Table 2. Comparison of range and average data for different carbonate phases obtained from the surface formation, Gali-Bekhal and Bekhme sections.
Paragenetic SampleNO. Spot AnalysisMin CTN (HU)Maxi CTN (HU)CTN (Av)Porosity (%)Permeability (mD)
Marine Rock3892578298227401.200.14
Early Dolomite rock3941840256423558.510.35
Late HTD rock1201−8812697205815.47301.27
Table 3. Comparison of range and average data for different carbonate phases obtained from the subsurface reservoir formation, Taq Taq oilfield.
Paragenetic SampleNO. Spot AnalysisMin CTN (HU)Maxi CTN (HU)CTN (Av)Porosity (%)Permeability (mD)
Marine Rock4141446255623608.401.02
Early Dolomite rock11392142261924416.490.19
Late HTD rock17134572586211814.0591.56
Disclaimer/Publisher’s Note: The statements, opinions and data contained in all publications are solely those of the individual author(s) and contributor(s) and not of MDPI and/or the editor(s). MDPI and/or the editor(s) disclaim responsibility for any injury to people or property resulting from any ideas, methods, instructions or products referred to in the content.