Abstract
The Gabal Um Samra (GUS) compound intrusion in the Eastern Desert of Egypt consists of a co-magmatic series of syenogranite and alkali feldspar granite. Accessory minerals (e.g., zircon, monazite, allanite) are abundant. Geochemically, the GUS intrusion is a classic A-type granite. It is extensively fractionated, enriched in large ion lithophile elements and high field strength elements, and depleted in Ba, Sr, K, and Ti. Normalized rare earth element patterns are nearly flat, without any lanthanide tetrad anomalies, but with distinct negative Eu anomalies (Eu/Eu* = 0.14–0.22) due to feldspar fractionation. Paired Zr-Hf and Y-Ho element systematics indicate igneous rather than hydrothermal processes. The petrogenesis of the comparatively unaltered GUS intrusion offers an opportunity to refine the standard model for post-collisional felsic magmatism in the Neoproterozoic Arabian–Nubian Shield. It is explained by the partial melting of juvenile crust induced by lithospheric delamination, followed by extensive fractional crystallization. A quantitative mass-balance model shows that the granite varieties of the GUS intrusion plausibly represent liquids along a single liquid line of descent; but, if so, the more evolved, later pulses display anomalous enrichment in Rb, Nb, Ta, U, and REE. The most plausible source for this enrichment is the extraction of small-degree residual melts from earlier pulses and the mixing of the melts into the later pulses, an energetically favorable process we call “auto-assimilation”. A quantitative model shows that the residual liquid after 97.5% crystallization of the syenogranite can fit the major oxide and trace element data in the alkali feldspar granite if 0.07% by mass of this melt is added to the evolving system for each 1% crystal fractionation by mass. The GUS intrusion represents an example of moderate rare metal enrichment and concentration to sub-economic grade by auto-assimilation. Similar processes may affect intrusions that feature higher grade mineralization, but the evidence is often obscured by the extensive alteration of those deposits.
1. Introduction
The Neoproterozoic basement complex of Egypt constitutes the northwestern exposure of the Arabian–Nubian Shield (ANS), which formed during the Pan-African orogeny by the collision between East and West Gondwana [1]. The ANS is a large tract of juvenile continental crust [2] assembled from a collage of Neoproterozoic ophiolites, island arc associations, volcano–sedimentary sequences, and voluminous granitoid intrusions that developed in arc, collisional, and post-collisional settings (e.g., [1,3,4,5,6,7]). Felsic intrusions represent about 50% of the outcrop area of the Neoproterozoic basement rocks of Egypt. In the Eastern Desert of Egypt, the diversity of granitoid rocks reflects differences in age, tectonic setting, geochemical character, and depth of emplacement [8,9,10,11]. Generally, the Egyptian granitoids are distinguished into an older suite dominated by granodiorite and a younger suite dominated by granite; these groups have contrasting geochronological, petrographic, geochemical, and geodynamic characteristics. The older suite is mostly “grey granitoids” and consists of syn-tectonic I-type intrusions of calc-alkaline affinity, whereas the younger suite of “pink granites” consists of late- to post-tectonic, I- and A-type granites of calc-alkaline, alkaline, and occasionally peralkaline affinity [12,13]. This classic two-fold division can be refined with a three-fold classification into (1) synorogenic calc-alkaline granitoids, (2) late- to post-collisional calc-alkaline granitoids to granites, and (3) post-collisional alkaline granites [14]. The post-collisional alkaline granites in the Eastern Desert occur as small domal intrusions (e.g., Nuweibi and Mueilha), sheet-like bodies (e.g., Abu Dabbab), or ellipsoidal masses (e.g., Um Naggat). They are often associated with pegmatite and aplite dikes too small to plot on most geologic maps.
The post-collisional alkaline granites in the Eastern Desert of Egypt preserve information on the last magmatic phase in the assembly of the upper continental crust of the ANS. Moreover, the post-collisional granites of the Eastern Desert have gained increasing attention due to elevated concentrations of rare metals (e.g., Nb, Ta, Hf, Th, U), rare earth elements (REEs), and some other trace elements (e.g., Li, Be, B, Y, Zr, F) of strategic value for modern technological applications [9,11,15,16,17,18,19,20,21,22,23]. The distribution of the most important rare-metal-bearing younger granite intrusions in the Eastern Desert of Egypt is shown in Figure 1a. As these intrusions are significant targets for mineral exploration, it is important to understand the series of mechanisms that were responsible for concentration of critical metals, ultimately reaching economic grade in several instances. Typically, the formation of an ore deposit requires several stages of enrichment, with the later stages most often involving hypogene or supergene fluid-driven alteration [24]. Such final-stage alteration processes typically obscure the record of earlier magmatic processes, which are responsible for the pre-enrichment to sub-economic grades and so are prerequisite to the ultimate formation of an ore deposit. By focusing on a relatively unaltered locality, this study seeks to distinguish among magmatic processes for pre-enrichment. Such processes can be sorted into the end-member processes of fractional crystallization and bulk assimilation, as well as the hybrid of these two, assimilation–fractional crystallization (AFC) [25].
The present work Investigates the Gabal Um Samra (GUS) composite pluton, which is a prominent example of Neoproterozoic post-collisional magmatism in the ANS and hence a plausible target for the exploration of rare metals in the central Eastern Desert (Figure 1a,b). Only limited studies of the geology of the GUS area have been published [26,27,28,29]. Accordingly, there is a lack of comprehensive field and laboratory information about petrogenesis, geodynamic evolution, and economic importance of the GUS granite pluton. Therefore, the current work presents combined field observations, petrographical data, and geochemical data in order to characterize the GUS pluton both petrologically and geotectonically with the aim of constraining a suitable geotectonic history and evaluating the controlling igneous processes that were responsible for enrichment in rare metals. Because the GUS is relatively unaltered, it lacks economic grade ore mineralization, but it allows for a comparatively clear study of magmatic pre-enrichment mechanisms; we find evidence for a variety of AFC we label “auto-assimilation”, in which low-degree residual melts of early phases of the intrusion were assimilated by later phases as they fractionated [30,31,32].
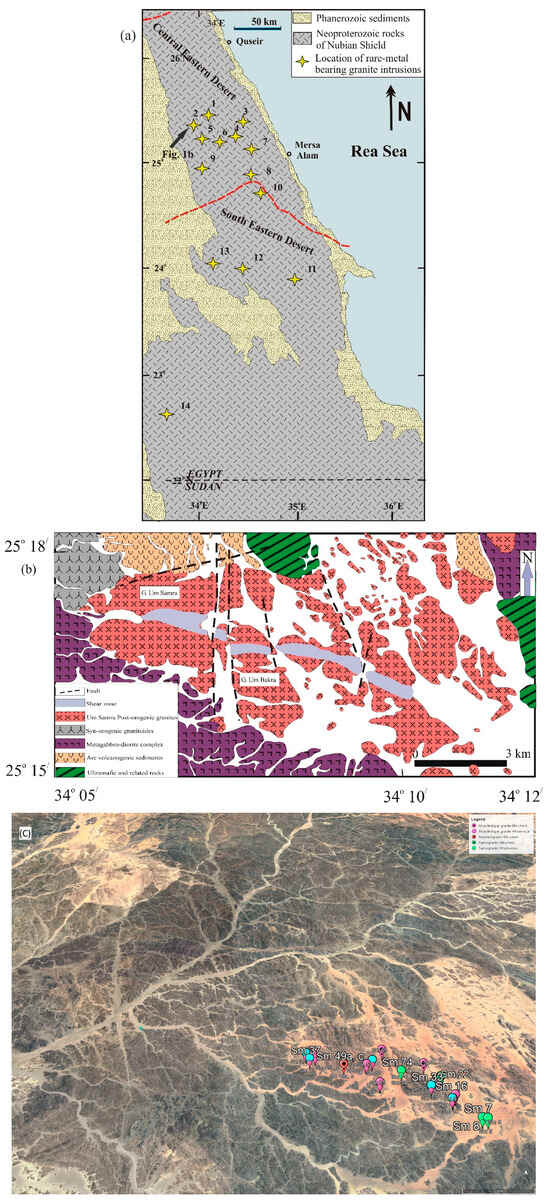
Figure 1.
(a) Distribution of the most important rare metal younger granite intrusions in the Eastern Desert of Egypt: (1) Um Naggat, (2) Um Samra, (3) Abu Dabbab, (4) Nuweibi, (5) Ineigi, (6) Homrit Waggat, (7) Igla, (8) Zabara, (9) Muweilha, (10) Hangaliya, (11) El-Gharabiya, (12) Nikeiba, (13) Homrit Akarem, and (14) Um Ara. The dividing line between central and southern portions of the Eastern Desert Shield is after [32]. (b) Geological map of the Um Samra pluton, Eastern Desert, Egypt modified after [28]. (c) Satellite image of the study area with sampling coordinates.
2. Geologic Setting and Field Observations
The Gabal Um Samra (GUS) intrusion, the target of the present work, is located in the central Eastern Desert of Egypt, to the north of the paved Idfu–Mersa Alam road. The GUS area is bounded by longitudes 34°5′ to 34°12′ E and latitudes 25°15′ to 25°18′ N (Figure 1b). It exposes mainly Neoproterozoic rocks, including (from oldest to youngest) ophiolitic rocks, an island arc association, syn-tectonic calc-alkaline granitoids, Hammamat molasse-type sediments, and a post-collisional granite intrusion. A number of dikes, both mafic and felsic, traverse the different rock units in the study area, though they are notably less abundant within the GUS intrusion itself. There are several map-scale faults and one major shear zone in the area. Alluvial deposits cover a significant fraction of the intrusion and its boundary, concealing some of the contact relationships.
According to [27], the ophiolitic rocks represent the oldest unit in the study area. They are exposed in two outcrop areas at the northern and eastern boundaries of the study area, in the form of elongated sheets. Where the original contacts are preserved, the ophiolite sheets are thrust over the island arc association. The ophiolitic rocks are dominated by serpentinite, altered along fault planes into talc-carbonate. The island arc association includes schistose metavolcanic and metasedimentary units and an undifferentiated metagabbro–diorite complex. The metagabbro–diorite is mostly massive, except where affected by the shear zone.
The syn-orogenic calc-alkaline granitoids include granodiorite and monzogranite. Granodiorite occurs as small outcrops exposed at the extreme western part of the mapped area. It is grey in color and medium- to coarse-grained. It intrudes the island-arc association and contains xenoliths of the older rocks. Monzogranite is exposed only in the northwestern corner of the mapped area. It is medium- to coarse-grained, pale pink in color, and hosts abundant xenoliths of older rocks. The Hammamat sediments are well exposed in the northwestern part of the mapped area and have a general molasse character. The youngest basement unit in the area, the GUS intrusion, occurs as a large pluton of irregular shape, elongated in a NW-SE direction.
Field observations of the present research reveal that the GUS granitic intrusion consists of two granitic rock varieties: syenogranite and alkali feldspar granite (Figure 1c). The varieties can be distinguished in outcrop by differences in color and texture. Contacts between the granite varieties may be either sharp or gradational; in map view, there is no clear pattern to the distribution of the lithologic varieties within the GUS intrusion. The frequency of dikes in the country rocks around the GUS intrusion is noticeably higher than in the intrusion itself. In a few instances, chilled margins are identified at the periphery of the GUS intrusion. Several apophyses of the GUS granites protrude into the country rocks. Also, some pegmatite dikes are observed cutting the eastern outer rim of the GUS intrusion (Figure 2a). Some roof pendants of the ophiolitic rocks are found in the upper levels of the GUS intrusion, especially in its extreme northern portion. Some quartz veins and disseminated silicification are observed along faults and the major shear zone.
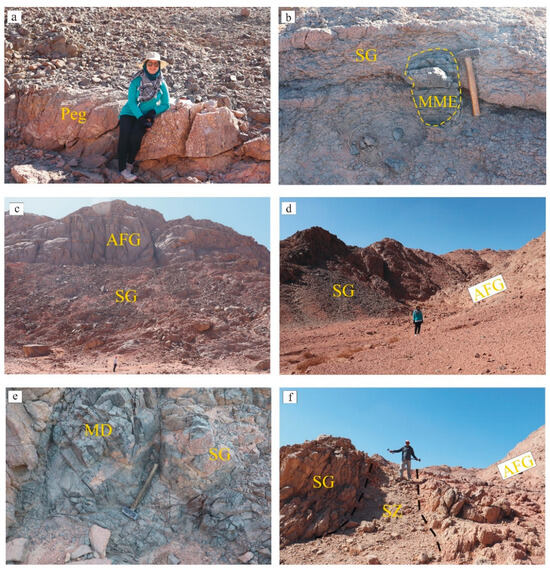
Figure 2.
Field photos of the GUS intrusion: (a) pegmatite (Peg) dikes cutting the eastern outer rim of the GUS intrusion, (b) syenogranite (SG) with microgranular mafic enclaves (MME), (c) sharp and irregular contact between syenogranite (SG) and alkali feldspar granite (AFG) of the GUS, (d) syenogranite intruded by alkali feldspar granite, (e) mafic dikes (MD) cutting syenogranite, and (f) shear zone (SZ) separating the alkali feldspar granite and alkali amphibole granite of the GUS.
In the field, it is apparent that the syenogranite represents the first pulse of the GUS intrusion. Syenogranite contains occasional microgranular mafic enclaves (MMEs) (Figure 2b) up to 30 cm in diameter, as well as xenoliths with a gneissic texture (5 to 15 cm in diameter). Both enclaves and xenoliths have ovoid shapes and rounded outlines. The boundaries of the xenoliths and MMEs are almost sharp, but slightly diffuse contacts are observed. Contacts of the syenogranite with the alkali feldspar granite are mostly sharp, though also sometimes gradational, and irregular (Figure 2c). The alkali feldspar granite intrudes into the syenogranite (Figure 2d). By volume, the alkali feldspar granite is the most abundant variety. It forms moderate- to high-relief hills. The alkali amphibole granite is medium- to coarse-grained with pinkish-red to brick-red color. In a few outcrops, it displays a porphyritic texture. A few dikes, mostly mafic in composition, traverse the GUS intrusion, particularly in the syenogranite variety. The contacts of these dikes with the host syenogranite are not sharp and show evidence of reaction or hybridization (Figure 2e).
In the GUS area, the major shear zone extends for about 9–10 km. It strikes N70°W, dips 45° SSW, and traverses mostly the alkali feldspar granite and syenogranite units (Figure 2f). The zone contains numerous en echelon strike–slip faults with N-S and NNE orientations and both dextral and sinistral sense of movement. The shear zone is finer-grained than the surrounding rocks and is marked by reddish to pinkish color. Visible alteration styles affecting the shear zone include silicification, kaolinitization, hematitization, and fluoritization. Silicification is indicated by the presence of cataclastic quartz bodies and veins.
3. Materials and Methods
Thin-sections, polished thin-sections, and polished mounts were prepared in the Geology Department at Cairo University, Egypt. They were studied using a petrographic polarizing microscope at the National Research Centre, Egypt. Based on the petrographic studies, twenty-two representative samples of the GUS granites were selected for bulk chemistry analysis (major, trace, and rare earth elements) at Activation Laboratories Ltd. (Actlabs), Ancaster, ON, Canada. Samples were crushed and quartered several times to obtain representative samples and then pulverized to ~40 mesh using an agate mortar. Lithium metaborate/tetraborate fusion glass pellets were digested in a weak nitric acid solution. Major oxide composition and concentrations of Ba, Sr, Y, Nb, Zr, Co, Cu, Ni, and Zn were determined by inductively coupled plasma–atomic emission spectrometry (ICP-AES). The remaining trace elements and the rare earth elements (REEs) were determined by inductively coupled plasma–mass spectrometry (ICP-MS). Analytical precision, as calculated from replicate analyses, is 1% for major elements, 2%–10% for trace elements, and 0.5%–3% for the REEs. However, the error may reach 10% for MnO and P2O5 due to their low concentration. Loss on ignition (L.O.I.) was determined by heating powdered samples for 50 min at 1000 °C.
Mineral chemical analyses and electron backscatter images were obtained from polished, carbon-coated thin-sections using a JEOL JXA-iHP200F field-emission electron microprobe (JEOL USA, Peabody, MA, USA) at the Division of Geological and Planetary Sciences (GPS), California Institute of Technology, Pasadena, CA, USA. This instrument is equipped with five wavelength-dispersive X-ray spectrometers (WDS; JEOL USA, Peabody, MA, USA) and one energy-dispersive X-ray spectrometer (EDS; Oxford Instruments, High Wycombe, UK); the EDS is used to identify minerals with essential elements not included in the twelve-element WDS analytical protocol. Operating conditions were 15 kV, 20 nA, a 5 μm defocused beam, 20 s on-peak counting times, and the CITZAF matrix correction routine. Backgrounds were subtracted using the mean atomic number working curve method in place of off-peak counting. The analytical standards used for analyses were synthetic forsterite (Mg), fayalite (Fe), Mn-olivine (Mn), anorthite (Ca, Al, and Si), TiO2 (Ti), NiO (Ni), and Cr2O3 (Cr); Amelia albite (Na), Asbestos microcline (K), and Durango apatite (P). Mixed-phase analyses and points on anhydrous minerals with analytical totals <97 wt% were rejected.
4. Petrography
This section is devoted to the petrographic description of the rock granite varieties of the GUS intrusion: syenogranite and alkali feldspar granite. The deformed counterparts are identified as sheared granites. Petrographic descriptions of the pegmatite dikes and cataclastic quartz are also given.
4.1. Syenogranite
Syenogranite is composed essentially of alkali feldspar, plagioclase, and quartz with subordinate amphibole and opaque minerals (Figure 3a). Accessory minerals include biotite, muscovite, zircon, and monazite. Alkali feldspar is mainly medium- to coarse-grained orthoclase perthite in addition to minor microcline. Plagioclase occurs as medium-sized crystals. Amphibole is strongly pleochroic and occurs as anhedral interstitial medium-sized crystals. Prismatic or cross-sectional cuts of amphibole can be observed (Figure 3b) with inclusions of opaque minerals. Fine- to medium-sized biotite flakes are often associated with amphibole.
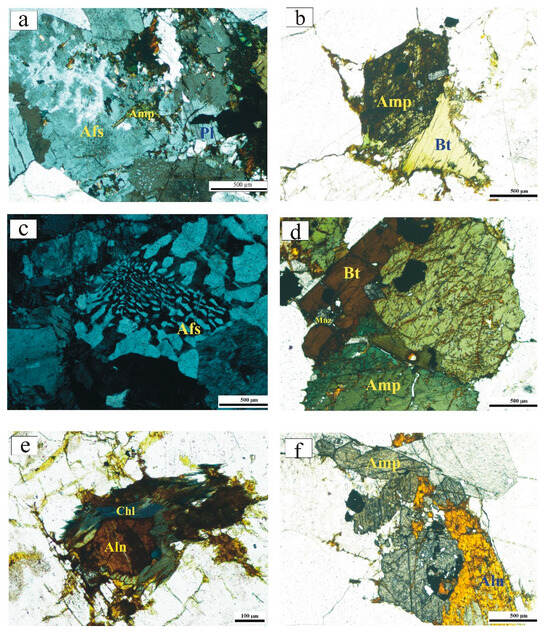
Figure 3.
Photomicrographs of the GUS granites. All panels are taken in plane-polarized transmitted light, except panels (a,c), which are taken in cross-polarized transmitted light: (a) Interstitial amphibole crystals in association with perthite, plagioclase, and opaque minerals in syenogranite; (b) prismatic amphibole crystals with inclusions of opaque minerals and monazite in syenogranite; (c) granophyric texture in the alkali feldspar granite; (d) association of biotite and amphibole with inclusions of opaque minerals and monazite in alkali feldspar granite; (e) amphibole corrodes allanite in alkali feldspar granite; and (f) allanite associated with amphibole, with inclusions of monazite and opaque minerals in alkali feldspar granite. (f) The mineral abbreviations in this figure and the next are as follows: amphibole Amp, alkali feldspar Afs, plagioclase Pl, biotite Bt, monazite Mnz, chlorite Chl, allanite Aln, Magnetite Mag, ilmenite Ilm, quartz Qz, sphalerite Sp, pyrite Py.
4.2. Alkali Feldspar Granite
The alkali feldspar granite is composed mainly of alkali feldspar (<60 vol%) and quartz with less plagioclase (˂10 vol%) and subordinate amphibole and biotite. Allanite, fluorite, zircon, monazite, thorite, rutile, muscovite, and opaques are accessory minerals. Alkali feldspar occurs mostly in the form of medium- to coarse-grained orthoclase perthite, and to a lesser extent microcline perthite. In some cases, perthite is corroded by plagioclase and quartz. Quartz grains are smaller than the perthite crystals, and some quartz is intergrown with alkali feldspar, forming a granophyric texture (Figure 3c). Small twinned amphibole crystals with tiny inclusions of opaque minerals and monazite are present (Figure 3d). Sometimes, amphibole altered to chlorite, which corrodes quartz and allanite (Figure 3e). Allanite occurs as reddish- to yellowish-brown crystals, often associated with amphibole, containing inclusions of opaque minerals and monazite (Figure 3f). Minute flakes of muscovite are seen as streaks in some perthite crystals. Zoned monazite crystals are disseminated unevenly through the rock, in addition to its presence as inclusions in amphibole and allanite.
Opaque minerals in the alkali feldspar granite occur either as medium-sized disseminated crystals or in the form of veinlets. They are commonly confined to the vicinity of the ferromagnesian minerals. Mostly, these opaques are either homogeneous or inhomogeneous magnetite with subordinate ilmenite. Homogeneous magnetite occurs as subhedral to anhedral equant crystals, which show slight to moderate martitization (Figure 4a). Some magnetite is rimmed by a narrow continuous or discontinuous titanite reaction rim (Figure 4b). Inhomogeneous magnetite forms composite magnetite–ilmenite intergrowth textures (Figure 4c). Also, in a few cases, ilmenite occurs as inclusions in magnetite forming internal granule exsolution texture. Some homogeneous ilmenite crystals are slightly altered to hematite, forming micrographic texture. Scarce minute pyrite crystals are also disseminated through the rock.
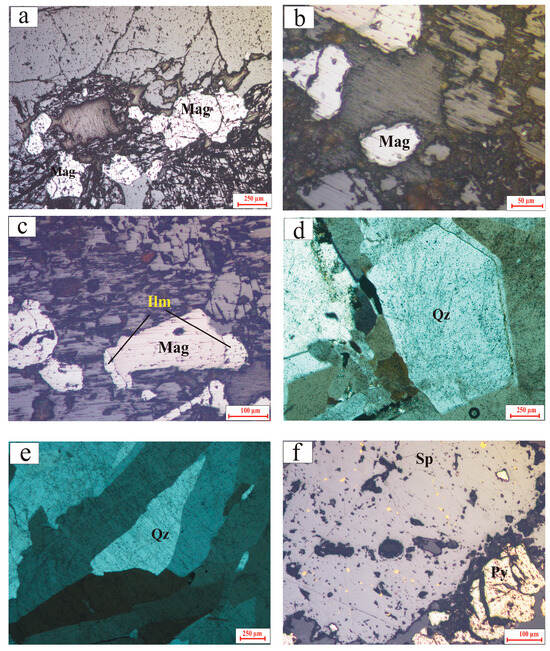
Figure 4.
Photomicrographs of the GUS granites. All panels are taken in reflected light, except panels (d,e), which are taken in cross-polarized transmitted light: (a) homogeneous magnetite crystals in alkali feldspar granite; (b) homogeneous magnetite rimmed by titanite in alkali feldspar granite; (c) composite magnetite–ilmenite texture in alkali feldspar granite; (d) idiomorphic quartz crystals with growth zoning in cataclastic quartz; (e) ribbon-shaped quartz in cataclastic quartz; and (f) association of homogeneous pyrite crystals with chalcopyrite–sphalerite disease texture in cataclastic quartz.
4.3. Sheared Granite
Some alkali feldspar granite samples suffered deformation and alteration due to shearing. Sheared granites are highly stained with iron oxides/hydroxides. Perthite in these altered rock varieties occurs as medium- to coarse-sized, highly sericitized crystals. Quartz occurs as medium to coarse crystals that exhibit a diagnostic wavy extinction due to deformation. Also, there is a newly formed generation of fine quartz crystals. Plagioclase is turbid, and twin lamellae have been obliterated by the shear deformation. The accessory minerals include hornblende, allanite, monazite, opaque minerals, muscovite, and fluorite. Allanite sometimes has inclusions of opaque minerals and monazite.
4.4. Pegmatite and Quartz Vein
Very coarse-grained pegmatite is found in the GUS intrusion. Apart from texture, pegmatite differs from the host granite in hosting a notably higher modal abundance (about 80 vol%) of quartz. There are two generations of quartz: an early set of coarse-sized crystals and a later-formed generation of fine crystals in veinlets cross-cutting the early-formed generation. Plagioclase occurs as medium to fine crystals enclosed in coarse quartz. Plagioclase exhibits typical Carlsbad and albite twining. Also, alkali feldspar is enclosed in coarse quartz crystals and sometimes has inclusions of muscovite. Minor zircon crystals occur as inclusions in the coarse quartz grains.
Cataclastic quartz is a fine-grained rock, light pink to pinkish-white in color, strongly affected by the shear zone. The major component is quartz with subordinate microcrystalline silica, opaque minerals, and accessory minerals. Quartz occurs as idiomorphic medium to coarse crystals that exhibit growth zoning (Figure 4d), as ribbon-shaped crystals (Figure 4e), and occasionally in atoll structures. A second generation of fine quartz crystals is also present in veinlets traversing the coarse quartz crystals. Accessory minerals are zoned allanite, muscovite, zircon, and fluorite. Muscovite occurs as fine aggregates. Sericite occurs as fine streaks. Opaque minerals are represented mainly by pyrite, sphalerite, and chalcopyrite. Pyrite occurs as medium to fine subhedral to anhedral crystals (Figure 4f). It is highly pitted, possibly due to the pressure solution deformation mechanisms that affect pyrite in low-grade metamorphic environments [33]. Chalcopyrite is arranged along the cleavage planes of sphalerite, forming a typical chalcopyrite disease texture [34] (Figure 4f).
5. Whole Rock Geochemistry
5.1. Geochemical Characteristics of the GUS
Twenty-two samples of the different varieties of the GUS granite intrusion were analyzed for major oxides, as well as trace and rare earth elements. The major oxide contents and corresponding CIPW norms are listed in Table 1. The samples span a considerable range in silica content (71.4–77.2 wt%); syenogranite samples exhibit the lowest silica content (71.4–74.0 wt%). The syenogranite has higher Fe2O3 (1.13–2.42 wt%) and CaO (0.77–1.16 wt%) contents than alkali feldspar granite (0.35–1.01 wt% and 0.09–0.58 wt%, respectively). Geochemical classification diagrams concur with the field and petrographic classification of the GUS granite varieties: on the classification diagram of [34], samples plot mainly in alkali granite and granite fields (Figure 5a). Also, they are classified into alkali feldspar granite and syenogranite according to the Q’ vs. ANOR diagram [Q′ = 100 × Q/(Q + Or + Ab + An); ANOR = 100 × An/(Or + An)] (Figure 5b).

Table 1.
Major oxide compositions (wt. %) and CIPW norms in the Gabal Um Samra granite intrusion.
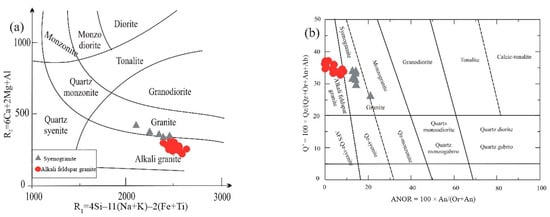
Figure 5.
Geochemical classification diagrams of the GUS granite samples: (a) R1-R2 classification diagram of [35], (b) Q′-ANOR diagram for normative classification of granitic rocks.
Harker variation diagrams of some major oxides and trace elements against SiO2 show significant correlations (Figure 6 and Figure 7, respectively). The granite varieties form essentially coherent, continuous, and collinear trends in both major and trace element variation diagrams. Almost all major oxides are negatively correlated with SiO2; the exception is K2O, which exhibits a positive correlation with SiO2. Most trace element concentrations increase with increasing SiO2 content (e.g., Rb, Y, Nb, Zr, Ta, Hf, and La) while Sr and Ba show strong negative correlations with SiO2 content. Zr, Zn, Li, and Cs (not plotted) are not well correlated with SiO2. The trace element trends observed in the GUS samples resemble those described in a number of other rare-metal bearing granites in the ANS [6,19,20,21].
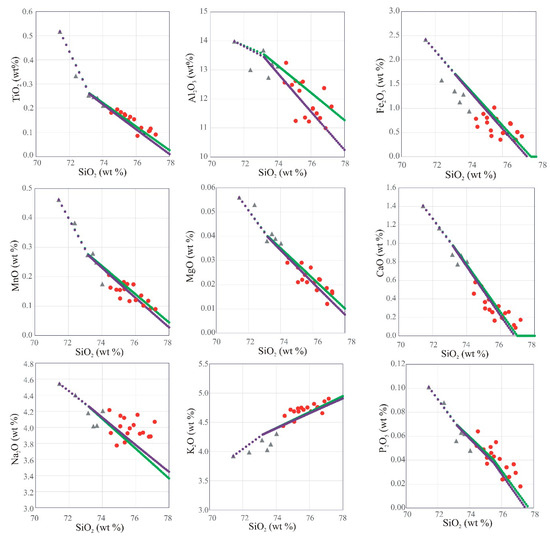
Figure 6.
Harker variation diagrams of major oxides vs. SiO2 in the GUS granite samples; data symbols are as in Figure 5. The green dots show a fractional crystallization model with fractionating phase proportions adjusted to match the major-element trend of the data (see text, Section 7.4). Each dot represents removal of 1% of the remaining liquid by mass. The purple dots show the auto-assimilation model (see text, Section 7.4) with 0.07% of the residual liquid after 97.5% fractionation of syenogranite added for each 1% mass fractionation. Note negligible difference between the models for most major oxides and slight improvement of the fit to the Al2O3 trend.
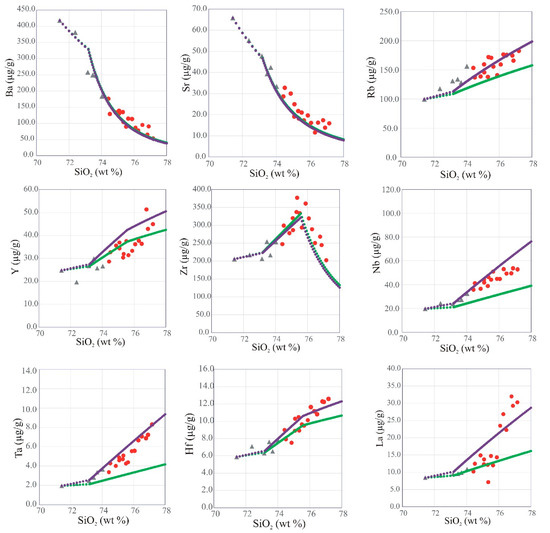
Figure 7.
Harker variation diagrams of some trace elements vs. SiO2 in the GUS granite samples; data symbols are as in Figure 5. The green dots show a fractional crystallization model with fractionating phase proportions adjusted to match the major-element trend of the data (see text, Section 7.4). Each dot represents removal of 1% of the remaining liquid by mass. Note the misfits for Rb, Y, Nb, Ta, Hf, and La. The purple dots show the auto-assimilation model (see text, Section 7.4) with 0.07% of the residual liquid after 97.5% fractionation of syenogranite added for each 1% mass fractionation. Note improved fits to trace element enrichment trends.
5.2. Spider Diagrams and REEs
Trace element concentrations in the GUS granites are given in Table 2. On a primitive mantle normalized trace element diagram (Figure 8a; using normalization values of [36]), the GUS granites exhibit enrichment in large-ion lithophile elements (LILE: Cs, Rb, Th, U) and high field strength elements (HFSE: Nb, Ta, Hf, Zr). Clear negative anomalies are present at Ba, Sr, P, and Ti, which presumably reflect the extensive fractional crystallization of feldspars, apatite, and Fe-Ti oxides. Depletion in these elements with enrichment in LILEs and HFSEs is consistent with the geochemical fingerprints of A-type granites worldwide and in the ANS [6,9,19,20,21].

Table 2.
Trace element concentrations (µg/g) in the Gabal Um Samra granite intrusion.
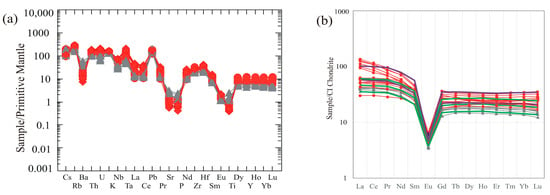
Figure 8.
(a) Primitive mantle-normalized trace element and (b) chondrite-normalized REE patterns of GUS granites. Data symbols as in Figure 5. Thick green and purple lines in (b) show the fractionation and auto-assimilation models as in Figure 6 and Figure 7, plotted at initial syenogranite composition, after 26% mass fractionation (when major elements match alkali feldspar granite; note the fit to alkali feldspar granite REE patterns), and after 45% mass fractionation (when major elements match alkali amphibole granite; note that the fractionation model (green) is insufficiently enriched, especially in LREE, to fit alkali feldspar granite REEs, whereas the auto-assimilation model (purple) fits alkali feldspar granite).
Rare earth element concentrations in the GUS granites are listed in Table 3. The analyzed samples all display closely related chondrite normalized rare earth element patterns (Figure 8b). Only one sample of the alkali feldspar granite (SM 24) shows anomalously low LREE (La, Ce, Pr) compared with the other alkali feldspar granite samples. In the field, this sample appears transitional between syenogranite and alkali feldspar granite. The GUS samples are characterized by a weak enrichment in light rare earth elements (LREEs) relative to heavy rare earth elements (HREEs) [(La/Lu)n = 1.52–4.26]. The extent of LREE enrichment increases systematically from syenogranite to alkali feldspar granite. The alkali feldspar granite samples have the highest total REEs (ΣREE = 115–183 µg/g) except sample (SM 24), whereas syenogranite samples are lowest (ΣREE = 63–80 µg/g).

Table 3.
Rare earth element concentrations (µg/g) in the Gabal Um Samra granite intrusion.
The chondrite normalized REE patterns of the GUS granites show strongly negative Eu anomalies [(Eu/Eu*) = 0.14–0.22], which is a function of extensive fractionation of feldspars by magmatic differentiation [37,38,39] under conditions that are reducing enough to stabilize some of the Eu as Eu2+ [40].
6. Mineral Chemistry
Essential (feldspars, amphibole, and biotite) and accessory (Fe-Ti oxides, zircon, monazite, apatite, fluorite, and chlorite) minerals in representative samples of the GUS granites were analyzed by electron microprobe. The data are presented in Supplementary Tables and discussed here.
6.1. Feldspars
The chemical analyses and structural formulae of the analyzed feldspars are given in Supplementary Tables S1 (K-feldspar) and S2 (albite). All the K-feldspar crystals are homogeneous with near-endmember KAlSi3O8 composition. They have low Na2O contents (0.21–0.92 wt%) and high K2O contents (15.5–16.6 wt%); with a median orthoclase content across all granite varieties of 97.1 mol%, they plot close to the orthoclase vertex of the ternary diagram of [41] (Figure 9a). The only plagioclase mineral in the analyzed samples is albite. It is nearly pure NaAlSi3O8, with a maximum anorthite content of 5.7 mol% and a median albite content of 96.8 mol%. All points plot close to the albite vertex of the feldspar ternary (Figure 9a). Although perthite textures are observed in the petrographic study, all varieties of the GUS have distinct K-feldspar and albite crystals, indicating crystallization under subsolvus conditions, followed by minor exsolution.
6.2. Amphibole Minerals
Microprobe analyses of amphibole minerals from alkali feldspar granite and syenogranite samples are given in Supplementary Table S3, along with structural formulae computed using the spreadsheet of [42] and the amphibole species nomenclature according to [40]. These amphibole analyses are all calcic, with high (Ca + Na)B (~1.9). Analyses in alkali feldspar granite have low NaB (<0.223), significant Fe3+, and most are classified as ferro-edenite or hastingsite, with a couple of ferro-actinolite points. Amphibole in syenogranite is more Na-rich (NaB ~ 0.46) and has Al3+ in place of Fe3+, making most points ferro-hornblende or ferro-pargasite. According to the discrimination diagram of [43], amphibole in both alkali feldspar granite and syenogranite has a primary origin (Figure 9b).
6.3. Micas
Biotite is the essential mica mineral present in the alkali feldspar granite rock variety, whereas zinnwaldite (i.e., a solid solution between polylithionite–trilithionite–siderophyllite) was found in the sheared granite samples. The microprobe analyses and structural formulae of biotite are given in Supplementary Table S4. The analyzed biotite crystals are rich in iron, with high FeO/MgO ratios (6.34 to 10.26). They have high TiO2 (3.07–3.69 wt%) and Al2O3 (10.4–12.1 wt%) contents. The ternary plot of 10 × TiO2-(FeO + MnO)-MgO after [44] suggests a primary origin for the biotite (Figure 9c). The microprobe analyses and structural formulae of zinnwaldite are given in Table S5. Because the microprobe cannot detect Li, we have inferred the Li content necessary to make these micas fully trioctahedral. The inferred compositions have 2.5–2.8 apfu (atoms per formula unit) Li, 0.4–0.8 apfu Fe2+, and 2.1–2.8 apfu Al(vi) (on a 22 O basis), and are most accurately classified as trilithionite.
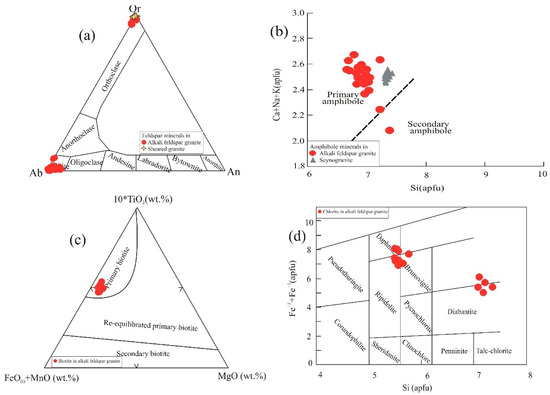
Figure 9.
Mineral chemistry diagrams of the GUS granite: (a) Ab-Or-An ternary classification diagram of feldspar minerals [41], (b) discrimination diagram for primary and secondary amphibole minerals after [45], (c) 10 × TiO2-(FeO + MnO)-MgO ternary classification diagram for biotite [44], (d) classification diagram for chlorite minerals of [46].
6.4. Fe-Ti Oxides
The main opaque minerals in all varieties of the GUS granite samples are Fe-Ti oxides, along with minor goethite. Microprobe analyses and structural formulae of magnetite and ilmenite are given in Supplementary Tables S6 and S7, respectively. Most magnetite points display low Ti contents (<0.02 apfu Ti), but in reaction rims (observed in polished section) the Ti content ranges up to 0.21 apfu. Ilmenite analyses are close to stoichiometric FeTiO3, with up to 8.3 mol% pyrophanite (MnTiO3) component and up to 13.6 mol% hematite (Fe2O3) component. Giekielite (MgTiO3) component is negligible. Goethite was observed only in the alkali feldspar and sheared granite varieties. Its microprobe analyses and apparent structural formulae based on 4(O) are given in Table S8. As is typical for this phase, at the microprobe scale it is a fine-grained aggregate of Fe3+OOH with SiO2 and other minor phases, yielding apparent FeO* contents from 69.2 to 87.45 wt% and anhydrous analytical totals from 76.7 to 90.0 wt%.
6.5. Other Accessory Minerals
In the petrographic study, numerous accessory minerals were recognized, including monazite, zircon, allanite, apatite, fluorite, chlorite, and carbonate minerals. Most of these accessory minerals were confirmed and characterized by microprobe, but zircon and fluorite were excluded because Zr and F were not measured with the selected microprobe protocol. Moreover, the microprobe analyses revealed the presence of rutile, which was not noted in the thin-section. Chlorite is the most abundant accessory mineral in all varieties of GUS granite. The microprobe analyses and structural formulae of chlorite are shown in Table S9. According to the classification diagram of [46], the chlorite in alkali feldspar granite is dominantly daphnite and ripidolite, with subordinate diabantite and minor brunsvigite (Figure 9d). Minor apatite was noted only in the alkali feldspar granite; without measurements of F and Cl, it is not possible to assign the apatite to a particular mineral species (Table S10). Rutile, also seen only in alkali feldspar granite, ranges from nearly pure TiO2 to compositions with up to 8.98 wt% FeO* (Table S11). Carbonate minerals include minor calcite in alkali feldspar granite and siderite in sheared granite (Table S12).
7. Discussion
From the tectonostratigraphic point of view, Neoproterozoic basement rocks in Egypt can be categorized into four main units [47]: Pre-Pan-African rocks, Pan-African ophiolite and island-arc assemblages, Pan-African cordillera stage, and post-orogenic to anorogenic A-type rocks. The abundance and volume of rocks representing the last of these stages, emplaced from ~680 to 570 Ma, is one of the most striking features of the Egyptian basement complex. Although the post-collisional period is characterized by a variety of rocks with a range of source signatures and modes of emplacement, the relatively dry and alkaline A-type granitoids are particularly distinctive [48]. These granites are rarely deformed, implying an anorogenic setting as well as the onset of tectonic quiescence after this time [49]. Although the Gabal Um Samra granite pluton belongs to this category (despite being transected by a prominent shear zone), previous studies have not provided sufficiently detailed information to assess its origin, magma type, tectonic setting, and economic potential (for rare metals, gold, or radioactive materials), or to place it in the overall context of post-collisional magmatism in the ANS and worldwide. In the light of our new data, we discuss each of these issues below.
7.1. Magma Type and Tectonic Setting of the GUS
The alumina saturation index [ASI, defined as the molar ratio Al2O3/(CaO + Na2O + K2O)] values range from 0.95 to 1.05 in syenogranite and from 0.91 to 1.06 in alkali feldspar granite, indicating metaluminous to weakly peraluminous character. The peraluminous character is confirmed by the presence of corundum in their norms (0.2 to 0.8% in syenogranite and 0.12 to 0.89% in alkali feldspar granite, Table 1) and muscovite in their modes. The agpaitic index [AI, defined as molar (Na + K)/Al] ranges from 0.83 to 0.89 in syenogranite and 0.87 to 1.06 in alkali feldspar granite. The high values of AI in the alkali feldspar granite indicate alkaline character [50,51]. The alkaline character is indicated by the presence of acmite and Na-metasilicate in the norms (0.46 to 0.82 in syenogranite and 0.09 to 0.71% in alkali feldspar granite). On the A/CNK vs. A/NK discrimination diagram, the samples range from weakly peraluminous to peralkaline; some syenogranite samples plot in the metaluminous field (Figure 10a). The normative corundum (nil in many samples, at most 0.89 wt%) values are in harmony with the peralkaline to weakly peraluminous character. Together with the geochemical characteristics, the mineral chemistry of mafic minerals such as biotite can be a useful monitor of the magmatic type of a granite suite. Plotted on the Mg vs. Al diagram of [52], all the analyzed biotite lies in the alkaline/peralkaline field (Figure 10b). Likewise, biotite compositions suggest alkaline magma on the Al2O3 vs. FeO(t) diagram of [53] (Figure 10c). On the SiO2 vs. K2O discrimination diagram of [54], the GUS granites belong to the high-K category (Figure 10d). The discrimination diagram of [55] places the GUS granites in the highly fractionated granite (Figure 10e) field, an area that can also be populated by highly fractionated alkaline granites. The GUS granites have many characteristics associated with A-type granite, such as elevated Ga/Al and FeO(t)/MgO ratios (Figure 10f, after [56]), together with high total alkali contents (Na2O + K2O = 8.15–8.96). The GUS granites plot in the alkali-calcic A-type field on the discrimination diagram of [49], but they are also within the ambiguous area of overlap in this diagram between highly fractionated I-type and A-type magmas (Figure 11a).
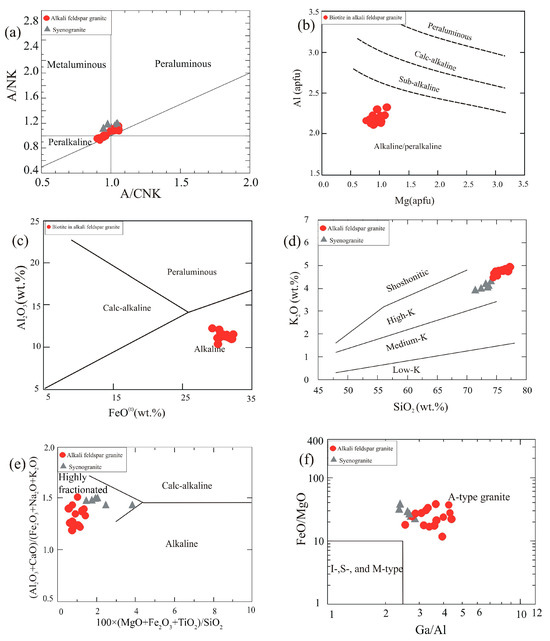
Figure 10.
Classification diagrams based on whole-rock geochemistry and mineral chemistry of biotite: (a) Shand’s plot, i.e., molar Al2O3/(Na2O + K2O) vs. Al2O3/(CaO + Na2O + K2O) [57]; (b) Al vs. Mg (a.p.f.u.) in biotite [52]; (c) FeO(t) vs. Al2O3 in biotite (after [48]); (d) SiO2 vs. K2O discrimination diagram of [54]; (e) discrimination diagram of [55] for rocks with >68 wt% SiO2; (f) Ga/Al vs. FeO(t)/MgO diagram of [56].
Turning to trace element-based tectonic discrimination schemes, the combination of enrichment in HFSEs and REEs alongside marked depletion of Ba, Sr, and Eu is typical of granites from within-plate tectonic settings [56,57]. The Nb vs. Y diagram of [58] places most GUS samples in the within-plate granite field (WPG), although the assignment of the syenogranite samples is less clear (Figure 11b). The Rb/30-Hf-3 × Ta ternary diagram of [59] places nearly all samples in the within-plate field, though again a few syenogranite samples straddle the boundary between within-plate and late- to post-collisional fields (Figure 11c). On the Rb vs. Y + Nb binary diagram, the samples cluster in the post-collisional granite field (Figure 11d). Also, they plot in field III on the ternary K2O-Na2O-CaO diagram of [60], which is associated with late- to post-collisional granites (Figure 11e). On the multicationic R1-R2 tectonic discrimination diagram of [61], the alkali feldspar granite samples plot in the post-orogenic field, while syenogranite samples range between the syn-collisional and post-orogenic fields (Figure 11f). Using the Al2O3 vs. SiO2 diagram of [57], almost all samples are confined to the field of post-orogenic granites (POG), but the more evolved end of the trend crosses into the field of rift-related (RRG) or continental epeirogenic uplift granites (CEUG) (Figure 12a). These samples are mostly sheared varieties and are characterized by possibly secondary loss of alumina. The within-plate and post-orogenic setting of most of the GUS samples, together with the undeformed character of most of the pluton, indicates that they were intruded after the bulk of orogenic deformation. They may therefore represent a transitional phase as the local continental crust underwent stabilization following the orogeny [62,63]. According to [51], the GUS represents an Ediacaran transition from late-orogenic calc-alkaline magmatism to post-orogenic alkaline magmatism in the ANS, associated with terminal collision and lateral extrusion.
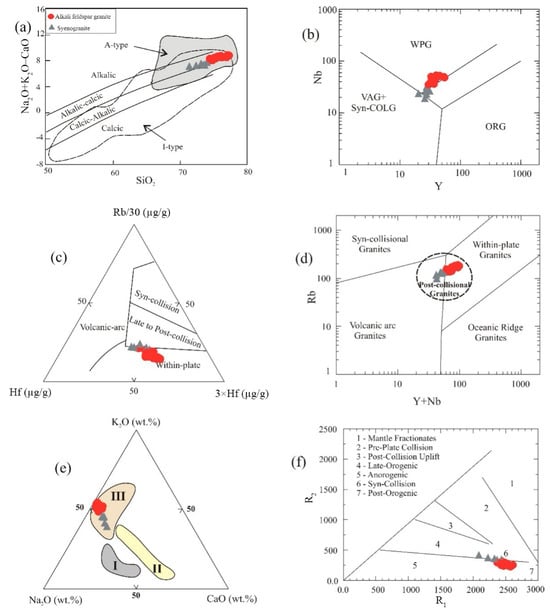
Figure 11.
Tectonic discrimination diagrams based on whole-rock geochemistry: (a) SiO2 vs. Na2O + K2O − CaO diagram of [49]; (b) Nb vs. Y diagram of [57]; (c) Rb/30-Hf-3 × Ta ternary diagram after [59]; (d) Rb vs. Y + Nb binary diagram [58]; (e) Na2O-K2O-CaO ternary diagram showing fields of the Egyptian granitoids [60,64], where I = old trondhjemite phase, II = older calc-alkaline phase, and III = younger granites; (f) R1-R2 multicationic diagram [61], where R1 = 4 × Si–11 × (Na + K)–2 × (Fe + Ti), R2 = 6 × Ca +2 × Mg + Al. Symbols are as in Figure 5.
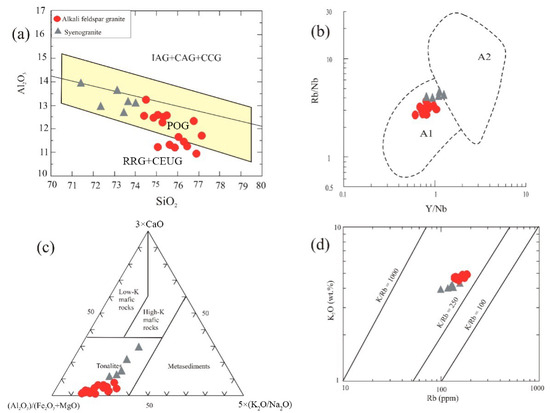
Figure 12.
Additional discrimination diagrams based on whole-rock geochemistry: (a) SiO2 vs. Al2O3 discrimination diagram of [57], (b) Rb/Nb vs. Y/Nb plot of [65], (c) Al2O3/(FeO(t) + MgO)-3×CaO-5× (K2O/Na2O) petrogenetic ternary diagram for magma source identification [66], and (d) Rb vs. K2O diagram of [67]. Symbols are as in Figure 5.
7.2. Source Rocks (Origin of the Parental Magma)
As noted above, an affinity with highly fractionated A-type granites is indicated by geochemical features of the GUS, such as high contents of alkalis, HFSEs, and REEs (except for Eu), Ga/Al ratios, and major depletion in Ba, Sr, P, and Ti (Table 1 and Table 2). However, the post-collisional granites of the ANS are a diverse group with a range of geochemical characteristics that suggest a range of sources and formation processes. Several petrogenetic models for A-type granite generation, in the ANS and elsewhere, have been proposed: (1) partial melting of granulitic residues in the lower crust after extraction of earlier granitic rocks (e.g., [56,68]), (2) fractional crystallization of mantle-derived basaltic magma (e.g., [69]), (3) melting of metasedimentary rocks [68], (4) mixing of mantle-derived magma with continental crust components [49,70], and (5) dehydration melting of tonalitic to granodioritic source rocks [71,72]. A subdivision of the A-type magmas into two groups [65,73,74], A1 and A2, is based on systematic differences in the sources of these groups. The majority of the GUS granites plot in the A1 field on the Y/Nb vs. Rb/Nb diagram of [65] (Figure 12b), although, once again, a few syenogranite samples straddle the boundary between the A1 and A2 fields. The A1 subgroup is assigned to ocean-island basalt affinity [65], derived by differentiation from enriched mantle-derived basalts, and the A2 subgroup to the partial melting of orogenically processed continental crust. The range in positions of the GUS suite suggests that the Y/Nb and Rb/Nb ratios are not conserved during differentiation (see Section 7.4 below), so it is plausible that the whole suite is descended from a crust-derived A2-type primitive melt. If that is the case, the discrimination diagram of [66], which assumes an anatectic origin and seeks to distinguish the character of the source rocks by direct comparison to partial melting experiments, indicates tonalitic source rock (Figure 12c). However, magmatic differentiation also causes displacement on this diagram, away from the CaO vertex, and so a high-K mafic source for the primary magma cannot be excluded. On the Rb vs. K2O discrimination diagram of [67], the GUS samples cluster close to the crustal line (K/Rb = 250) and well beneath the mantle line (K/Rb = 1000) (Figure 12d). On the whole, therefore, evolution of the suite from a primary melt somewhat more primitive than the least evolved syenogranite sample collected, which was derived by the partial melting of a tonalitic lower-crustal source, seems the most likely interpretation.
7.3. Geodynamic Evolution (Lithospheric Delamination)
The lithosphere is typically composed of the crust and a portion of the uppermost mantle. The mantle lithosphere may be either positively or negatively buoyant relative to the underlying asthenosphere, depending on its thermal state and depletion history. When the mantle lithosphere is sufficiently dense, it may undergo delamination or foundering. Such a delamination event has commonly been invoked to explain the post-collisional magmatism (620–590) in the ANS [75,76]. Geodynamic models of post-collisional delamination predict a definite sequence of events, culminating in a period of uplift-driven extension accompanied by the emplacement of dike swarms and motion on shear zones and strike–slip faults [75]. A proposed tectono-magmatic model for the formation and emplacement of the GUS intrusion following a post-collisional delamination event is shown in Figure 13. The foregoing subduction and collisional phases led to the emplacement of a major tonalitic batholith in the middle and lower crust and an over-thickening of the lithosphere. After the end of compression, the negative buoyancy of the young and weak sub-orogenic lithosphere, possibly aided by downward flow above a broken-off slab, led to delamination. The removed lithosphere was replaced by a comparatively hot and buoyant asthenosphere, causing an extensional doming of the overlying crust. Moreover, the upwelling flow of the incoming asthenospheric mantle led to partial melting and the generation of mafic magma, which rose and underplated the crust. Together, the decompression of the crust by erosional unroofing and the elevation of the crustal geotherm driven by heat flow from the underplated mafic magma led to partial melting in the deep crust. Storage, ascent, and fractionation of these crustal melts allowed the evolution of an A-type granite suite with characteristics marking a tonalitic source that eventually evolved into A1-type evolved members despite an A2-type parental magma.
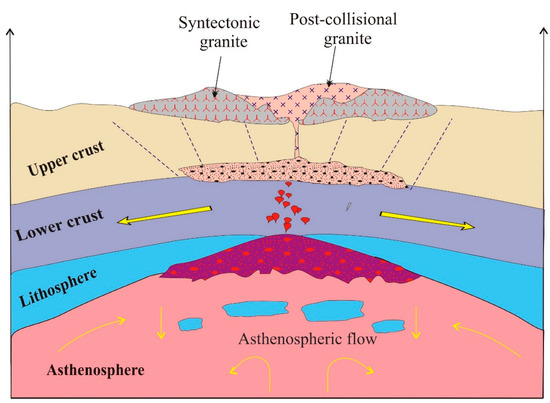
Figure 13.
Simplified model for the geodynamic environment for emplacement of the post-collisional GUS intrusion.
7.4. Fractional Crystallization and Crustal Contamination
The geochemical characteristics of the GUS intrusion indicate a single co-magmatic source for its evolution. A co-genetic origin, meaning the rocks are derived from a common parental magma, for the whole pluton is indicated by continuous single trends of compatible and incompatible element concentrations and ratios (Figure 14) and coherent correlations of the major oxides and trace elements with SiO2 (variation diagrams, Figure 6 and Figure 7). The regular and closely related REE patterns of all studied samples without any lanthanide tetrad effects reflect a common magmatic source and minimal influence of hydrothermal solutions on the rock chemistry [77]. The lanthanide tetrad effect describes a tendency in some chemical processes for the “inner” pair (e.g., Ce and Pr) of each group of four REEs to fractionate from the “outer” pair (e.g., La and Nd) of the group, due to the special stability of one-quarter, half, or three-quarters-filled f electron shells. Applying the equations of [78] to quantify the intensity of the tetrad effect in the studied samples, the magnitude of the first tetrad anomaly is given by t1 = ([Ce]n × [Pr]n/([La]n × [Nd]n), the third tetrad anomaly is t3 = ([Tb]n × [Dy]n/([Gd]n × [Ho]n), and the total tetrad effect is the geometric average of these two (TE1,3 = (t1 × t3)0.5). M-type describes tetrad effects where these indices exceed unity, while W-type tetrad are revealed by indices less than unity; the typical threshold for tetrad anomalies to be visible in REE patterns is TE1,3 < 0.90 or TE1,3 > 1.10 [78]. The calculated tetrad effect values of all the studied samples of the GUS are closer to unity than this visibility threshold (TE1,3 = 1.0–1.06), which is consistent with the absence of visible tetrad anomalies in the normalized REE patterns (Figure 8b). Twin element pairs with equal charge and nearly identical ionic radius, such as Zr-Hf and Y-Ho, tend to display coherent behavior and retain near-chondritic ratios if their behavior is controlled by charge and ionic radius (CHARAC, [77]), which is typical of magmatic equilibria but not of an exchange with hydrothermal fluids. This distinction makes CHARAC behavior a useful geochemical tool to evaluate the behavior of REEs and trace elements during magmatic and hydrothermal processes. If the geochemical system is charge- and radius-controlled, the Y-Ho and Zr/Hf will display coherent behavior. According to the diagram (Figure 14d) proposed by [77], the majority of samples plot in the CHARAC field; the exceptions are three samples of very evolved alkali feldspar granite, which may indicate a possible increase in hydrothermal influence at the latest stages of evolution, which would also be consistent with the presence of occasional pegmatites in the GUS. However, another means of separating Zr from Hf is by zircon fractionation, which may induce the enrichment of Hf relative to Zr in the residual melt [79]. Petrographic study does indicate an abundance of zircon (up to ~5 vol% in some slides); although this does not establish that zircon was fractionated, its presence is consistent with the low Zr/Hf ratios in some alkali feldspar granite samples. In fact, the variation diagram for Zr vs. SiO2 (Figure 7) reveals very plainly the reversal in Zr enrichment that occurs at Zr saturation. The Y/Ho ratio of all the studied samples, however, remains very close to the chondritic ratio of 28. This strongly supports the idea of dominant magmatic control of the chemistry, minimal influence of aqueous fluid, and a zircon-driven origin for the low Zr/Hf ratios.
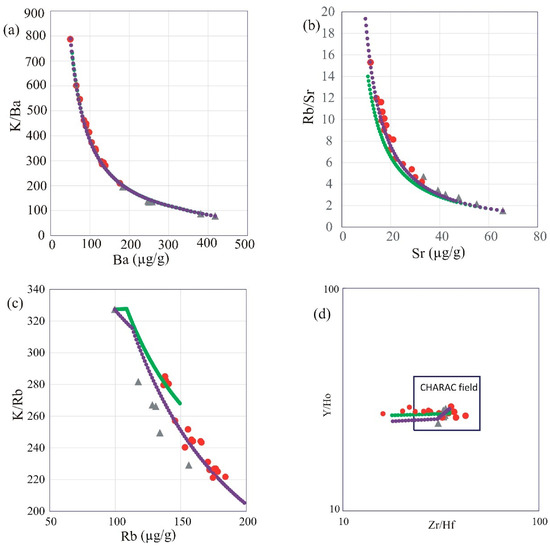
Figure 14.
Plots for recognizing the effects of fractional crystallization and possible fluid influence: (a) Ba vs. K/Ba, (b) Sr vs. Rb/Sr, (c) Rb vs. K/Rb variation diagram, (d) Zr/Hf vs. Y/Ho diagram of [77]. Data symbols and model trends are as shown in Figure 6.
The negative correlation of CaO, Fe2O3, P2O5, TiO2, Ba, and Sr with SiO2 is consistent, in general terms, with fractional crystallization of feldspars, apatite, and Fe-Ti oxides. The K/Rb ratio is used as a useful monitor for the crystallization history of the granitic rocks. It is normally around 230 in magmatic rocks, with an acceptable range of 150 to 300 [80]. On the discrimination diagram of [25], the GUS samples follow a trend that has been associated with assimilation–fractional crystallization (Figure 14c). Some ratios of compatible and incompatible elements can reflect the presence of crustal contamination; wide variations in K/Rb, Zr/Rb, and Ba/Nb ratios may reflect the addition of a highly enriched crustal component during fractional crystallization [81]. In the present case, the GUS granites exhibit narrow ranges in these ratios (Table 2), suggesting minimal crustal contamination during the fractional crystallization process.
We attempt to construct a quantitative fractionation model, in order to assess whether the co-genetic suite of GUS samples can plausibly be interpreted as a liquid line of descent. Although this is a common paradigm in petrology, it is by no means obvious that granitoid plutonic rocks should be liquid compositions. In some granitoid plutons, it is evident that the rock compositions instead represent crystal–liquid mixtures with various degrees of crystal accumulation [82]. The main diagnostic able to distinguish between crystal accumulation and fractional crystallization is whether the degree of enrichment of the most incompatible trace elements is consistent with the decrease in residual liquid mass required by the evolution of the major elements. For the GUS case, we found that the major element evolution can be modeled using a three-segment fractionation path (Figure 6, Figure 7, Figure 8b and Figure 14). The parameters of the model (fractionating assemblages and partition coefficients) are given in Supplementary Table S13. From the most primitive syenogranite (sample SM8 with 71.43 wt% SiO2) up to the kink visible in several major element variation trends at 73.3 wt% SiO2, a fractionating assemblage of 80 wt% An25Ab75 plagioclase, 6 wt% Mn-rich ilmenite, 8 wt% magnetite, 5 wt% amphibole (matching the average calcic amphibole analysis in the GUS rocks, Table S3), 1 wt% apatite, and 1.5% fluorite provides a best fit. It requires only 9% fractionation by mass to traverse this interval, so fractional crystallization can only explain 9% enrichment in the most incompatible elements across this interval.
From 73.3 wt% SiO2 to the kink in the Zr variation diagram at 76 wt% SiO2, a fractionating assemblage of 43.8 wt% An25Ab75 plagioclase, 30% Or70Ab30 alkali feldspar, 20% quartz, 3% magnetite, 2% amphibole, 0.9% Mn-rich ilmenite, and 0.3% apatite provides a best fit. This assemblage has 67.8 wt% SiO2 in the bulk fractionating solid, not very different from the SiO2 content of the evolving liquid. This short lever-arm allows a fairly large mass fraction of solid removal while traversing this interval. By 76 wt% SiO2, 61 wt% of the original liquid mass remains, allowing for a factor of 1.63 enrichment in the most incompatible elements up to this point. This is consistent with the observed enrichment in all elements except Nb, Ta, and U in the syenogranite and alkali feldspar granite samples.
Finally, beyond 76 wt% SiO2, it is necessary to add 0.03 wt% zircon and 0.04 wt% xenotime to the fractionating assemblage to explain the kink in the Zr variation diagram and to prevent the over-enrichment of the heavy REE and Y. Beyond this point, the model still explains the trends in all major elements in the alkali feldspar granites, as well as Ba, Sr, Rb, Y, Hf, and the ratios of these (Figure 7 and Figure 14). The over-enrichment in Nb and Ta compared to this model continues in the alkali amphibole granite data, and is strikingly joined by a steep enrichment in REE, especially LREE. By the time the model reaches 77.7 wt% SiO2, the fraction of original syenogranite liquid remaining as residual alkali feldspar granite liquid is 50%, allowing for at most a factor of two enrichment in incompatible trace elements. However, La concentration in the most evolved alkali feldspar granite is a factor of 3.8 higher than in the least evolved syenogranite. Likewise, the enrichment factor for Nb is 2.3, for Ta 2.8, and for U 2.4.
The conclusion of this exercise is that it is possible to construct a simple liquid-line-of-descent model that explains the major element variations among all the GUS granite samples as well as a large number of trace elements. However, Rb, Nb, Ta, U, and the LREE are too high in the alkali amphibole granite samples to be explained by simple passive enrichment during fractional crystallization from the syenogranite liquids. The over-enrichment in Rb, Nb, Ta, and U is evident already in the alkali feldspar granite, whereas the over-enrichment in LREE is apparent in some alkali feldspar granite. This suggests that fractionation was accompanied by assimilation of a component rich in these elements. There are few bulk rocks in the ANS that are sufficiently enriched in these elements to cause further enrichment in a rare-metal granite by bulk assimilation. Moreover, Nb and Ta are thought to be immobile in fluids, so the assimilant is unlikely to be an aqueous fluid. The most likely candidate, then, is a small-degree anatectic or residual melt. The most likely source for such a melt in the later pulses of the GUS intrusion is the earlier pulses of the GUS itself. We suggest that the alkali feldspar granite, crystallizing in contact with almost fully solidified syenogranite, experienced an assimilation of the small-degree residual melt of the syenogranite. Such a late residual melt would be water-rich, low viscosity, and highly mobile, akin to a pegmatite-forming liquid (and indeed, as noted, there are occasional pegmatites in the GUS). This component transported Rb, Nb, Ta, and U into the alkali feldspar granite. In the process, it moved the alkali feldspar granite magma from the A1 type to the A2 type (and may have pushed the syenogranite, losing these elements further into the A1 field). This melt transfer may have transported other elements, but not in sufficient concentrations to be visible in the variation diagrams. This component transported Rb, Nb, Ta, U, and LREE into the alkali feldspar granite. This model implies that the early pulses did not saturate with Nb-, Ta-, or U-rich accessory phases, and indeed these are not noted in the rocks. Auto-assimilation is an energetically favorable process, because the assimilant—a late residual melt of the earlier magma pulse—is already molten and does not require extracting enthalpy from the magma chamber to mobilize it. We obtained a reasonable fit to all the trace element concentrations and ratios by adopting as an assimilant the residual liquid left after 97.5 wt% crystal fractionation from the syenogranite starting liquid (using the phase proportions described above). Note that 97.5% is the bulk extent of crystallization of the syenogranite liquid, but ongoing crystal-melt segregation processes during syenogranite crystallization would easily concentrate the last 2.5% melt into high-porosity regions that maintain its mobility and its ability to escape. We add 0.07 wt% of this melt to the evolving system for every 1 wt% crystal fractionation experienced by the later melt pulses (this model is shown in purple in Figure 6, Figure 7, Figure 8b and Figure 14, and all the partition coefficients and other parameters are in Supplementary Table S13). The last 2.5 wt% of the original syenogranite parental magma can provide enough such residual melt to add a total of 50 increments of 0.07 wt% each to the alkali feldspar granite, so long as the starting mass of alkali feldspar granite parental magma is ≤40% of the total GUS intrusion. While bulk granite is immobile after 97.5% crystallization, the residual melt may be concentrated into higher melt-fraction regions during crystal fractionation and mobilized either due to its high water content and corresponding low viscosity, or due to remobilization by heat transfer from the later magma pulse.
The concept that over-enrichment in some incompatible elements in the later pulses of the GUS reflects internal dynamics within the GUS pluton itself is testable, for example, with isotopic data, which is unfortunately beyond the scope of the present study. Pending the acquisition of such data, we can state a clear prediction: while present-day 143Nd/144Nd should differ among the GUS samples due to radiogenic in-growth, back-correction to the age of intrusion (circa 570 Ma) should yield an equal initial εNd in all pulses if the LREE enrichment in the alkali feldspar granite was derived from the less evolved members of the same intrusion. By contrast, assimilation of an older component would yield a lower initial εNd in the alkali feldspar granite compared to the syenogranite. The model also predicts that high-resolution geochronologic information, if it could be obtained, would confirm the sequence of intrusion recognized by the contact relations (syenogranite, then alkali feldspar granite), but would likely be unable to resolve major age differences between the pulses, since each pulse should still contain some residual melt when the next pulse intrudes.
7.5. Relation of the GUS Granites with Other Neoproterozoic Post-Collisional Granites in the ANS
The GUS intrusion is exposed in the central Eastern Desert of Egypt and resembles the other post-collisional granites of the ANS in their mode of occurrence [6,20,21]. It occurs as a large pluton of irregular shape elongated in a NW-SE direction. The GUS intrusion is similar to the Abu Dabbab intrusion, but the latter is highly mineralized and has higher concentrations of Nb, Ta, Th, U, and REEs. The GUS intrusion is also similar to the Homrit Akarem intrusion, located in the south Eastern Desert, in its mode of occurrence. The GUS intrusion has somewhat similar content of Nb, Ta, and REEs to those present in the Homrit Akarem intrusion [21]. At this time, no systematic theory has emerged to explain why some of the post-collisional granites in the Eastern Desert are extremely enriched in rare metals and have major economic potential, while others are only moderately enriched and are unlikely to be exploitable sources of rare metals. There is a clear need for such a theory as a guide for further exploration. The GUS, while not itself likely to be of economic value, nevertheless offers an additional data point (or counterexample) in efforts to develop such a theory. We recognize in the GUS a subtle but significant mechanism for pre-enriching the concentrations of rare metals by scavenging small-degree residual melts from early phases of the intrusion and assimilating them into later phases. In the case of the GUS, there was no significant hydrothermal activity to further concentrate these pre-enriched elements into ore deposits, such that this early stage can still be recognized clearly. However, we suggest that such an auto-assimilation process may have operated in what later became highly mineralized intrusions as well, setting the stage for the development of the ore deposits by concentrating rare metals from large volumes of early melt pulses into comparatively small volumes of late, water-rich melt pulses likely to form pegmatites and greisen.
8. Conclusions
In the Gabal Um Samra (GUS) intrusion, an early phase of syenogranite is intruded in turn by the predominant alkali feldspar granite. Some pegmatite dikes traverse the eastern outer rim of the GUS pluton. Contact relationships in the field, as well as the continuously varying whole-rock geochemistry, indicate that all three types constitute a single co-magmatic intrusion.
The GUS granite varieties are highly fractionated alkaline A2-types, emplaced in a post-collisional within-plate setting.
The GUS intrusion is moderately enriched in LILEs (Cs, Rb, Th, and U) and HFSE (Nb, Ta, Zr, Hf), but not as enriched as some other granites with higher economic potential in the Eastern Desert of Egypt.
Indication of fluid interactions is limited. Trace elements display magmatic charge-radius control (CHARAC), which is evident in the coherent behavior of the twin element pairs Zr-Hf and Y-Ho.
It is possible to construct a fractionation model that is consistent with all the sampled compositions representing liquids along a liquid line of descent. A closed-system model of this type can explain most of the elemental variation, but an assimilant is required to account for the rate of enrichment of Rb, Nb, Ta, U, and (in some alkali feldspar granite samples) LREEs. The most likely source of these elements in the environment into which the later pulses of the GUS were intruded is residual melt from the earlier pulses of the GUS itself, i.e., an auto-assimilation mechanism. We quantify this model and find that 0.07% assimilation per 1% crystallization of the residual melt after 97.5% crystallization of the syenogranite can fit the trace element enrichment trends. A similar mechanism may have served to prime other more mineralized intrusions for concentration to economic grades.
The geodynamic model of the GUS intrusion is consistent with the general model of post-collisional magmatism of the ANS, whereby the partial melting of juvenile crust induced by lithospheric delamination was followed by extensive fractional crystallization. In this relatively dry intrusion, there were minimal late-magmatic or post-magmatic hydrothermal solution effects.
Supplementary Materials
The following supporting information can be downloaded at https://www.mdpi.com/article/10.3390/min15090898/s1: Table S1. Microprobe analyses of alkali feldspar in the GUS granite samples; Table S2. Microprobe analyses of plagioclase in the GUS granite samples; Table S3. Microprobe analyses of amphibole minerals in the GUS granite samples; Table S4. Microprobe analyses of biotite in the GUS granite samples; Table S5. Microprobe analyses of zinnwaldite in the GUS granite samples; Table S6. Microprobe analyses and structrue of magnetite in the GUS granite samples; Table S7. Microprobe analyses of ilmenite in the GUS granite samples; Table S8. Microprobe analyses and srtucture formula of goethite in the GUS granite samples; Table S9. Microprobe analyses of chlorite minerals in the GUS granite samples; Table S10. Microprobe analyses and structure formula of apatite in the GUS granite samples; Table S11. Microprobe analyses of ruilte in the GUS granite samples; Table S12. Microprobe analyses of carbonate minerals in the GUS granite samples. Table S13: Parameters of the Fractional Crystallization and Assimilation-Fractional Crystallization Models
Author Contributions
Conceptualization, H.S.M. and M.K.A.; methodology, H.S.M.; software, H.S.M.; validation, H.S.M., M.K.A. and A.A.S.; formal analysis, H.S.M. and P.D.A.; investigation, H.S.M., M.K.A., A.A.S., H.E.M. and P.D.A.; resources, H.S.M.; data curation, H.S.M. and M.K.A.; writing—original draft preparation, H.S.M.; writing—review and editing, H.S.M., M.K.A., A.A.S., P.D.A., H.E.M. and M.K.; visualization, H.S.M. and M.K.A.; supervision, M.K.A., A.A.S., H.E.M. and M.K.; project administration, M.K.A. and A.A.S.; funding acquisition, M.K.A. All authors have read and agreed to the published version of the manuscript.
Funding
This research was funded by Egyptian STDF through Project Number (47106).
Data Availability Statement
Data from our research are available upon request. Samples have been registered with SESAR numbers and data have been uploaded to the EarthChem library.
Acknowledgments
The present manuscript is a part of PhD thesis of the first author (Heba S. Mubarak) who is a member of the STDF project (47106). We acknowledge the Science and Technology Development Fund (STDF) of Egypt for supporting this work through the Applied Sciences Research Grant (Project No. 47106). The title of the STDF project is “Assessment of Egyptian granitoid rocks as a source for building, ornamental and construction materials”.
Conflicts of Interest
The authors declare no conflicts of interest.
Abbreviations
The following abbreviations are used in this manuscript:
| ANS | Arabian–Nubian Shield |
| AFC | Assimilation-fractional crystallization |
| REEs | Rare earth elements |
| GUS | Gabal Um Samra |
| MMEs | Microgranular mafic enclaves |
| ICP-MS | Inductively coupled plasma-mass spectrometry |
| WDS | Wavelength-dispersive X-ray spectrometers |
| EDS | Energy-dispersive X-ray spectrometer |
| LILEs | Large ion lithosphile elements |
| HFSEs | High field strength elements |
| LREEs | Light rare earth elements |
| HREEs | Heavy rare earth elements |
| Apfu | Atoms per formula unit |
| WPG | Within-plate granite |
| POG | Post-orogenic granites |
| RRG | Rift-related granite |
| CEUG | Continental epeirogenic uplift granites |
| CHARAC | Charge and ionic radius |
References
- Stern, R.J. Arc assembly and continental collision in the Neoproterozoic African Orogen: Implications for the consolidation of Gondwanaland. Annu. Rev. Earth Planet. Sci. 1994, 22, 319–351. [Google Scholar] [CrossRef]
- Patchett, P.J.; Chase, C.G. Role of transform continental margins in major crustal growth episodes. Geology 2002, 30, 39–42. [Google Scholar] [CrossRef]
- Azer, M.K.; El-Ela, F.A.; Ren, M. The petrogenesis of late Neoproterozoic mafic dyke-like intrusion in south Sinai, Egypt. J. Asian Earth Sci. 2012, 54, 91–109. [Google Scholar] [CrossRef]
- Kusky, T.M.; Abdel Salam, M.G.; Stern, R.J.; Tucker, R.D. Evolution of the East African and related orogens, and the assembly of Gondwana. Precamb. Res. 2003, 123, 81–85. [Google Scholar] [CrossRef]
- Johnson, P.R.; Woldehaimanot, B. Development of the Arabian-Nubian Shield: Perspectives on accretion and deformation in the northern East African Orogen and the assembly of Gondwana. J. Geol. Soc. Lond. 2003, 206, 289–325. [Google Scholar] [CrossRef]
- Azer, M.K.; Abdelfadil, K.M.; Ramadan, A.A. Geochemistry and petrogenesis of Late Ediacaran rare-metal albite granite of the Nubian Shield: Case study of Nuweibi Intrusion, Eastern Desert, Egypt. J. Geol. 2019, 127, 665–689. [Google Scholar] [CrossRef]
- Abdel-Karim, A.-A.; Azer, M.; Sami, M. Petrogenesis and tectonic implications of the Maladob ring complex in the South Eastern Desert, Egypt: New insights from mineral chemistry and whole-rock geochemistry. Int. J. Earth Sci. 2021, 110, 53–80. [Google Scholar] [CrossRef]
- Azer, M.K. Late Ediacaran (605–580 Ma) post-collisional alkaline magmatism in the Arabian–Nubian Shield: A case study of Serbal ring-shaped intrusion, southern Sinai, Egypt. J. Asian Earth Sci. 2013, 77, 203–223. [Google Scholar] [CrossRef]
- Abuamarah, B.A.; Azer, M.K.; Asimow, P.D.; Ghrefat, H.; Mubarak, H.S. Geochemistry and petrogenesis of late Ediacaran rare-metal albite granites of the Arabian-Nubian Shield. Acta Geol. Sin.-Engl. Ed. 2021, 95, 459–480. [Google Scholar] [CrossRef]
- Moussa, H.E.; Asimow, P.D.; Azer, M.K.; Abou El Maaty, M.A.; Akarish, A.I.; Yanni, N.N.; Mubarak, H.S.; Wilner, O.; Elsagheer, M.A. Magmatic and hydrothermal evolution of highly-fractionated rare-metal granites at Gabal Nuweibi, Eastern Desert, Egypt. Lithos 2021, 400, 106405. [Google Scholar] [CrossRef]
- Surour, A.A.; El-Tohamy, A.M.; Saleh, G.M. Chemistry of Hydrothermally Destabilized Rare-Metal and Radioactive Minerals in Deformed A-Type Granite in the Vicinity of Nugrus Shear Zone, South Eastern Desert, Egypt. Resources 2024, 14, 4. [Google Scholar] [CrossRef]
- Hussein, A.A.A.; Ali, M.M.; El Ramly, M. A proposed new classification of the granites of Egypt. J. Volcanol. Geoth. Res. 1982, 14, 187–198. [Google Scholar] [CrossRef]
- El-Gaby, S.; List, F.; Tehrani, R. Geology, evolution and metallogenesis of the Pan-African belt in Egypt. In Proceedings of the Pan-African belt of Northeast Africa and adjacent areas: Tectonic evolution and economic aspects of a late Proterozoic orogen. Geol. Mag. 1988, 126, 17–68. [Google Scholar]
- Azer, M.K.; Asimow, P.D. Petrogenetic evolution of the Neoproterozoic igneous rocks of Egypt. In The Geology of the Egyptian Nubian Shield; Springer: Berlin/Heidelberg, Germany, 2020; pp. 343–382. [Google Scholar]
- Helba, H.; Trumbull, R.; Morteani, G.; Khalil, S.; Arslan, A. Geochemical and petrographic studies of Ta mineralization in the Nuweibi albite granite complex, Eastern Desert, Egypt. Miner. Depos. 1997, 32, 164–179. [Google Scholar] [CrossRef]
- El Hadek, H.H.; Mohamed, M.A.; El Habaak, G.H.; Bishara, W.W.; Ali, K.A. Geochemical constraints on petrogenesis of Homrit Waggat rare metal granite, Egypt. Int. J. Geophys. Geochem. 2016, 3, 33–48. [Google Scholar]
- Azer, M.K.; Abdelfadil, K.M.; Asimow, P.D.; Khalil, A.E. Tracking the transition from subduction-related to post-collisional magmatism in the north Arabian–Nubian Shield: A case study from the Homrit Waggat area of the Eastern Desert of Egypt. Geol. J. 2020, 55, 4426–4452. [Google Scholar] [CrossRef]
- El-Rus, M.A.A.; Mohamed, M.A.; Lindh, A. Mueilha rare metals granite, Eastern Desert of Egypt: An example of a magmatic-hydrothermal system in the Arabian-Nubian Shield. Lithos 2017, 294, 362–382. [Google Scholar] [CrossRef]
- Heikal, M.T.S.; Khedr, M.Z.; Abd El Monsef, M.; Gomaa, S.R. Petrogenesis and geodynamic evolution of neoproterozoic Abu Dabbab albite granite, central Eastern Desert of Egypt: Petrological and geochemical constraints. J. Afr. Earth Sci. 2019, 158, 103518. [Google Scholar] [CrossRef]
- Seddik, A.M.; Darwish, M.H.; Azer, M.K.; Asimow, P.D. Assessment of magmatic versus post-magmatic processes in the Mueilha rare-metal granite, Eastern Desert of Egypt, Arabian-Nubian Shield. Lithos 2020, 366, 105542. [Google Scholar] [CrossRef]
- Abuamarah, B.A.; Azer, M.K.; Seddik, A.M.; Asimow, P.D.; Guzman, P.; Fultz, B.T.; Wilner, O.; Dalleska, N.; Darwish, M.H. Magmatic and post-magmatic evolution of post-collisional rare-metal bearing granite: The Neoproterozoic Homrit Akarem Granitic Intrusion, south Eastern Desert of Egypt, Arabian-Nubian Shield. Geochemistry 2022, 82, 125840. [Google Scholar] [CrossRef]
- Surour, A.A. Sn-W-Ta-Mo-U-REE mineralizations associated with alkali granite magmatism in Egyptian Nubian Shield. In The Geology of the Egyptian Nubian Shield; Springer: Berlin/Heidelberg, Germany, 2021; pp. 593–604. [Google Scholar]
- Surour, A.A.; Madani, A.A.; El-Sobky, M.A. Mafic and felsic magmatism in the Wadi Kalalat area, South Eastern Desert, Egypt: Mineralogy, geochemistry and geodynamic evolution during the Neoproterozoic in the Nubian Shield. Acta Geochim. 2024, 43, 150–173. [Google Scholar] [CrossRef]
- Černý, P.; Blevin, P.L.; Cuney, M.; London, D. Granite-Related Ore Deposits. Econ. Geol. 2005, 100, 337–370. [Google Scholar]
- Akinin, V.V.; Miller, E.L.; Wooden, J.L. Petrology and geochronology of crustal xenoliths from the Bering Strait region: Linking deep and shallow processes in extending continental crust. In Crustal Cross Sections from the Western North American Cordillera and Elsewhere: Implications for Tectonic and Petrologic Processes: Geological Society of America Special Paper; Geological Society of America: Boulder, CO, USA, 2009; Volume 456, pp. 39–68. [Google Scholar]
- Kabesh, M.; Salem, A.; Heikal, M.; Salem, M. Petrochemistry and petrogenesis of the granitic rocks of Um Samra pluton, Eastern Desert, Egypt. J. Geol. 1982, 26, 171–184. [Google Scholar]
- Abdel Monem, A.; Shazly, A.; Salem, I.; Ashmawy, M.; El Shibiny, N. Petrographical and geochemical characteristics of some granitoids associated with rare-metal mineralizations, Central Eastern Desert, Egypt. In Proceedings of the 4th International Conference on Geochemistry, Alexandria, Egypt, 6–7 September 1999; pp. 15–16. [Google Scholar]
- Ibrahim, M.E.; El-Kalioby, B.A.; El Sawey, E.H.; Kamar, M.S.; Abu Zeid, E.K.; Ismail, A.M. Um Samra-Um Bakra shear zone, central Eastern Desert, Egypt: An example of vein type base metal mineralization. Int. J. Min. Sci. 2017, 3, 1–17. [Google Scholar] [CrossRef]
- Kamar, M.; Hassanin, M.; Ismail, A. Recovery of uranium from the Um Samra-Um Bakra shear zone, central Eastern Desert, Egypt. Euro-Mediterr. J. Environ. Integr. 2019, 4, 38. [Google Scholar] [CrossRef]
- DePaolo, D.J. Trace element and isotopic effects of combined wallrock assimilation and fractional crystallization. Earth Planet. Sci. 1981, 53, 189–202. [Google Scholar] [CrossRef]
- Beard, J.S.; Ragland, P.C.; Crawford, M.L. Reactive bulk assimilation: A model for crust-mantle mixing in silicic magmas. Geology 2005, 33, 681–684. [Google Scholar] [CrossRef]
- Stern, R.J.; Hedge, C.E. Geochronologic and isotopic constraints on late Precambrian crustal evolution in the Eastern Desert of Egypt. Am. J. Sci. 1985, 285, 97–127. [Google Scholar] [CrossRef]
- McClay, K.; Ellis, P. Deformation of pyrite. Econ. Geol. 1984, 79, 400–403. [Google Scholar]
- Vaughan, D.; Craig, J. Ore Microscopy and Ore Petrography, 2nd ed.; John Wiley & Sons Ltd, Wily: Hoboken, NJ, USA, 1994. [Google Scholar]
- De la Roche, H.D.; Leterrier, J.T.; Grandclaude, P.; Marchal, M. A classification of volcanic and plutonic rocks using R1R2-diagram and major-element analyses—Its relationships with current nomenclature. Chem. Geol. 1980, 29, 183–210. [Google Scholar] [CrossRef]
- Sun, S.-S.; McDonough, W.F. Chemical and isotopic systematics of oceanic basalts: Implications for mantle composition and processes. Geol. Soc. Lond. 1989, 42, 313–345. [Google Scholar] [CrossRef]
- Hanson, G.N. Rare earth elements in petrogenetic studies of igneous systems. Annu. Rev. Earth Planet. Sci. 1980, 8, 371. [Google Scholar] [CrossRef]
- Möller, P.; Muecke, G. Significance of Europium anomalies in silicate melts and crystal-melt equilibria: A re-evaluation. Contrib. Miner. Petrol. 1984, 87, 242–250. [Google Scholar] [CrossRef]
- Lee, S.-G.; Asahara, Y.; Tanaka, T.; Lee, S.R.; Lee, T. Geochemical significance of the Rb–Sr, La–Ce and Sm–Nd isotope systems in A-type rocks with REE tetrad patterns and negative Eu and Ce anomalies: The Cretaceous Muamsa and Weolaksan granites, South Korea. Geochemistry 2013, 73, 75–88. [Google Scholar] [CrossRef]
- Hanson, G.N. The application of trace elements to the petrogenesis of igneous rocks of granitic composition. Earth Planet. Sci. Lett. 1978, 38, 26–43. [Google Scholar] [CrossRef]
- Deer, W.; Howie, R.; Zussman, J. An Introduction to the Rock-Forming Minerals, 2nd ed.; Longman Scientific and Technical: Essex, UK, 1992. [Google Scholar]
- Locock, A.J. An Excel spreadsheet to classify chemical analyses of amphiboles following the IMA 2012 recommendations. Comput. Geosci. 2014, 62, 1–11. [Google Scholar] [CrossRef]
- Hawthorne, F.C.; Oberti, R.; Harlow, G.E.; Maresch, W.V.; Martin, R.F.; Schumacher, J.C.; Welch, M.D. Nomenclature of the amphibole supergroup. Am. Miner. 2012, 97, 2031–2048. [Google Scholar] [CrossRef]
- Nachit, H.; Ibhi, A.; Ohoud, M.B. Discrimination between primary magmatic biotites, reequilibrated biotites and neoformed biotites. C. R. Géosci. 2005, 337, 1415–1420. [Google Scholar] [CrossRef]
- Keeditse, M.; Rajesh, H.; Belyanin, G.; Fukuyama, M.; Tsunogae, T. Primary magmatic amphibole in Archaean meta-pyroxenite from the central zone of the Limpopo Complex, South Africa. S. Afr. J. Geol. 2016, 119, 607–622. [Google Scholar] [CrossRef]
- Hey, M.H. A new review of the chlorites. Mineral. Mag. J. Mineral. Soc. 1954, 30, 277–292. [Google Scholar] [CrossRef]
- El-Gaby, S. Integrated classification and evolution of the Neoproterozoic Pan-African Belt in Egypt. In Proceedings of the Fifth International Conference on the Geology of Africa, Assuit, Egypt, October 2007; pp. 143–154. [Google Scholar]
- Loiselle, M.C.; Wones, D.R. Characteristics and origin of anorogenic granites. Geol. Soc. Am. Abstr. Programs 1979, 11, 468. [Google Scholar]
- Frost, B.R.; Barnes, C.G.; Collins, W.J.; Arculus, R.J.; Ellis, D.J.; Frost, C.D. A geochemical classification for granitic rocks. J. Petrol. 2001, 42, 2033–2048. [Google Scholar] [CrossRef]
- Liégeois, J.P.; Black, R. Alkaline magmatism subsequent to collision in the Pan-African belt of the Adrar des Iforas. In: Fitton, J.G., Upton, B.G.J., Eds., Alkaline Igneous Rocks. Geol. Soc. 1987, 30, 381–401. [Google Scholar] [CrossRef]
- Liégeois, J.-P.; Navez, J.; Hertogen, J.; Black, R. Contrasting origin of post-collisional high-K calc-alkaline and shoshonitic versus alkaline and peralkaline granitoids. The use of sliding normalization. Lithos 1998, 45, 1–28. [Google Scholar] [CrossRef]
- Nachit, H. Composition chemique des biotites et typologie magmatique des granitoids. C. R. Hebd. L’academie Sci. 1985, 301, 813–818. [Google Scholar]
- Abdel-Rahman, A.-F.M. Nature of biotites from alkaline, calc-alkaline, and peraluminous magmas. J. Petrol. 1994, 35, 525–541. [Google Scholar] [CrossRef]
- Peccerillo, A.; Taylor, S. Geochemistry of Eocene calc-alkaline volcanic rocks from the Kastamonu area, northern Turkey. Contrib. Miner. Petr. 1976, 58, 63–81. [Google Scholar] [CrossRef]
- Sylvester, P.J. Post-collisional alkaline granites. J. Geol. 1989, 97, 261–280. [Google Scholar] [CrossRef]
- Whalen, J.B.; Currie, K.L.; Chappell, B.W. A-type granites: Geochemical characteristics, discrimination and petrogenesis. Contrib. Miner. Petr. 1987, 95, 407–419. [Google Scholar] [CrossRef]
- Maniar, P.D.; Piccoli, P.M. Tectonic discrimination of granitoids. Geol. Soc. Am. Bull. 1989, 101, 635–643. [Google Scholar] [CrossRef]
- Pearce, J.A.; Harris, N.B.; Tindle, A.G. Trace element discrimination diagrams for the tectonic interpretation of granitic rocks. J. Petrol. 1984, 25, 956–983. [Google Scholar] [CrossRef]
- Harris, N.B.; Pearce, J.A.; Tindle, A.G. Geochemical characteristics of collision-zone magmatism. Geol. Soc. Lond. 1986, 19, 67–81. [Google Scholar] [CrossRef]
- Hassan, M.A.; Hashad, A.H. Precambrian of Egypt. In The Geology of Egypt; Said, R., Ed.; Balkema Rotterdam: Rotterdam, The Netherlands, 1990; pp. 201–245. [Google Scholar]
- Batchelor, R.A.; Bowden, P. Petrogenetic interpretation of granitoid rock series using multicationic parameters. Chem. Geol. 1985, 48, 43–55. [Google Scholar] [CrossRef]
- Rogers, J.J.; Greenberg, J.K. Trace elements in continental-margin magmatism: Part III. Alkali granites and their relationship to cratonization: Summary. Geol. Soc. Am. Bull. 1981, 92, 6–9. [Google Scholar] [CrossRef]
- Rogers, J.J.; Greenberg, J.K. Trace elements in continental-margin magmatism: Part III. Alkali granites and their relationship to cratonization. Geol. Soc. Am. Bull. 1981, 92, 57–93. [Google Scholar] [CrossRef]
- Azer, M.K.; Obeid, M.A.; Ren, M. Geochemistry and petrogenesis of late Ediacaran (605–580 Ma) post-collisional alkaline rocks from the Katherina ring complex, south Sinai, Egypt. J. Asian Earth Sci. 2014, 93, 229–252. [Google Scholar] [CrossRef]
- Eby, G.N. Chemical subdivision of the A-type granitoids: Petrogenetic and tectonic implications. Geology 1992, 20, 641–644. [Google Scholar] [CrossRef]
- Laurent, O.; Martin, H.; Moyen, J.-F.; Doucelance, R. The diversity and evolution of late-Archean granitoids: Evidence for the onset of “modern-style” plate tectonics between 3.0 and 2.5 Ga. Lithos 2014, 205, 208–235. [Google Scholar] [CrossRef]
- Shaw, D. A review of K-Rb fractionation trends by covariance analysis. Geochim. Cosmochim. Acta 1968, 32, 573–601. [Google Scholar] [CrossRef]
- Collins, W.J.; Beams, S.D.; White, A.; Chappell, B. Nature and origin of A-type granites with particular reference to southeastern Australia. Contrib. Miner. Petr. 1982, 80, 189–200. [Google Scholar] [CrossRef]
- Wu, F.-Y.; Sun, D.-Y.; Li, H.; Jahn, B.-M.; Wilde, S. A-type granites in northeastern China: Age and geochemical constraints on their petrogenesis. Chem. Geol. 2002, 187, 143–173. [Google Scholar] [CrossRef]
- Moreno, J.A.; Molina, J.F.; Montero, P.; Anbar, M.A.; Scarrow, J.H.; Cambeses, A.; Bea, F. Unraveling sources of A-type magmas in juvenile continental crust: Constraints from compositionally diverse Ediacaran post-collisional granitoids in the Katerina Ring Complex, southern Sinai, Egypt. Lithos 2014, 192, 56–85. [Google Scholar] [CrossRef]
- Creaser, R.A.; Price, R.C.; Wormald, R.J. A-type granites revisited: Assessment of a residual-source model. Geology 1991, 19, 163–166. [Google Scholar] [CrossRef]
- King, P.L.; White, A.; Chappell, B.; Allen, C. Characterization and origin of aluminous A-type granites from the Lachlan Fold Belt, southeastern Australia. J. Petrol. 1997, 38, 371–391. [Google Scholar] [CrossRef]
- Bonin, B. From orogenic to anorogenic settings: Evolution of granitoid suites after a major orogenesis. Geol. J. 1990, 25, 261–270. [Google Scholar] [CrossRef]
- Eby, G.N. The A-type granitoids: A review of their occurrence and chemical characteristics and speculations on their petrogenesis. Lithos 1990, 26, 115–134. [Google Scholar] [CrossRef]
- Avigad, D.; Gvirtzman, Z. Late Neoproterozoic rise and fall of the northern Arabian–Nubian Shield: The role of lithospheric mantle delamination and subsequent thermal subsidence. Tectonophysics 2009, 477, 217–228. [Google Scholar] [CrossRef]
- Be’eri-Shlevin, Y.; Samuel, M.; Azer, M.; Rämö, O.T.; Whitehouse, M.; Moussa, H. The Ediacaran Ferani and Rutig volcano-sedimentary successions of the northernmost Arabian-Nubian Shield (ANS): New insights from zircon U–Pb geochronology, geochemistry and O–Nd isotope ratios. Precamb. Res. 2011, 188, 21–44. [Google Scholar] [CrossRef]
- Bau, M. Controls on the fractionation of isovalent trace elements in magmatic and aqueous systems: Evidence from Y/Ho, Zr/Hf, and lanthanide tetrad effect. Contrib. Miner. Petr. 1996, 123, 323–333. [Google Scholar] [CrossRef]
- Irber, W. The lanthanide tetrad effect and its correlation with K/Rb, Eu/Eu∗, Sr/Eu, Y/Ho, and Zr/Hf of evolving peraluminous granite suites. Geochim. Cosm. Acta 1999, 63, 489–508. [Google Scholar] [CrossRef]
- Anders, E.; Grevesse, N. Abundances of the elements: Meteoritic and solar. Geochim. Cosm. Acta 1989, 53, 197–214. [Google Scholar] [CrossRef]
- Taylor, S. The application of trace element data to problems in petrology. Phys. Chem. Earth 1965, 6, 133–213. [Google Scholar] [CrossRef]
- Davidson, J.P.; Dungan, M.A.; Ferguson, K.M.; Colucci, M.T. Crust-magma interactions and the evolution of arc magmas: The San Pedro–Pellado volcanic complex, southern Chilean Andes. Geology 1987, 15, 443–446. [Google Scholar] [CrossRef]
- Abuamarah, B.A.; Alzahrani, H.; Matta, M.J.; Azer, M.K.; Asimow, P.D.; Darwish, M.H. Petrological, geochemical and geodynamic evolution of the Wadi Al-Baroud granitoids, north Arabian-Nubian shield, Egypt. J. Afr. Earth Sci. 2023, 207, 105044. [Google Scholar] [CrossRef]
Disclaimer/Publisher’s Note: The statements, opinions and data contained in all publications are solely those of the individual author(s) and contributor(s) and not of MDPI and/or the editor(s). MDPI and/or the editor(s) disclaim responsibility for any injury to people or property resulting from any ideas, methods, instructions or products referred to in the content. |
© 2025 by the authors. Licensee MDPI, Basel, Switzerland. This article is an open access article distributed under the terms and conditions of the Creative Commons Attribution (CC BY) license (https://creativecommons.org/licenses/by/4.0/).