Article

Tectonic Uplift and Hydrocarbon Generation Constraints from Low-Temperature Thermochronology in the Yindongzi Area, Ordos Basin

1
Department of Geology, Northwest University, Xi’an 710069, China
2
State Key Laboratory of Continental Evolution and Early Life, Northwest University, Xi’an 710069, China
3
Exploration and Development Research Institute of PetroChina Changqing Oilfield Company, Xi’an 710018, China
*
Author to whom correspondence should be addressed.
Minerals 2025, 15(9), 893; https://doi.org/10.3390/min15090893
Submission received: 26 July 2025 / Revised: 20 August 2025 / Accepted: 21 August 2025 / Published: 22 August 2025
(This article belongs to the Section Mineral Geochemistry and Geochronology)

Abstract

This study investigates the uplift and exhumation history of the southern segment of the western margin of the Ordos Basin using low-temperature thermochronology, including zircon (U-Th)/He (ZHe), apatite fission-track (AFT), and apatite (U-Th)/He (AHe) data, combined with thermal history modeling. The study area exhibits a complex structural framework shaped by multiple deformation events, leading to the formation of extensively developed fault systems. Such faulting can adversely affect hydrocarbon preservation. To better constrain the timing of fault reactivation in this area, we carried out an integrated study involving low-temperature thermochronology and burial history modeling. The results reveal a complex, multi-phase thermal-tectonic evolution since the Late Paleozoic. The ZHe ages (291–410 Ma) indicate deep burial and heating related to Late Devonian–Early Permian tectonism and basin sedimentation, reflecting early orogenic activity along the western North China Craton. During the Late Jurassic to Early Cretaceous (165–120 Ma), the study area experienced widespread and differential uplift and cooling, controlled by the Yanshanian Orogeny. Samples on the western side of the fault show earlier and more rapid cooling than those on the eastern side, suggesting a fault-controlled, basinward-propagating exhumation pattern. The cooling period indicated by AHe data and thermal models reflects the Cenozoic uplift, likely induced by far-field compression from the rising northeastern Tibetan Plateau. These findings emphasize the critical role of inherited faults not only as thermal-tectonic boundaries during the Mesozoic but also as a pathway for hydrocarbon migration. Meanwhile, thermal history models based on borehole data further reveal that the study area underwent prolonged burial and heating during the Mesozoic, reaching peak temperatures for hydrocarbon generation in the Late Jurassic. The timing of major cooling events corresponds to the main stages of hydrocarbon expulsion and migration. In particular, the differential uplift since the Mesozoic created structural traps and migration pathways that likely facilitated hydrocarbon accumulation along the western fault zones. The spatial and temporal differences among the samples underscore the structural segmentation and dynamic response of the continental interior to both regional and far-field tectonic forces, while also providing crucial constraints on the petroleum system evolution in this tectonically complex region.

1. Introduction

The Ordos Basin is one of the most important petroliferous basins in China. Since the 1960s, several Mesozoic structural oilfields have been discovered in the western margin of the basin, particularly in the Majiatan area [1,2,3], along with commercial Paleozoic gas flows represented by the Liuqing-1 well. With advances in geological understanding and technical capabilities, the discovery of shale gas from the Ordovician Wulalike Formation, represented by the Zhongping-1 well, marked the beginning of Paleozoic oil and gas exploration in the western margin of the Ordos Basin [1].
In recent years, exploration of Paleozoic natural gas in the central western margin, particularly in the Majiatan area, has achieved significant breakthroughs and demonstrated promising potential. However, exploration results in the southern segment of the western margin remain unsatisfactory. This is partly due to the complex tectonic setting in the region, which has undergone multiple phases of deformation and is characterized by well-developed fault systems. The lack of understanding regarding these fault structures and associated geological complexities poses significant challenges. Additionally, faulting may compromise hydrocarbon preservation conditions. Although previous studies have made substantial progress in elucidating the structural styles and geological framework of the study area and adjacent regions [4,5,6], geochronological constraints on fault zones in the western margin remain scarce. This limits our understanding of hydrocarbon accumulation mechanisms and their controlling factors, directly hindering further exploration efforts in the western margin of the Ordos Basin and surrounding areas.
This study applies low-temperature thermochronological techniques, combined with thermal history modeling and field observations, to precisely constrain the cooling history of the Yindongzi area in the southern segment of the basin’s western margin. The findings provide new insights into the structural evolution and tectonic processes in this region since the Mesozoic. Moreover, the EasyRo% model was applied to perform thermal history modeling for the target well [4,7]. Thermal modeling results based on borehole (YT2 well) data reveal that the region experienced prolonged burial and heating during the Mesozoic, reaching peak temperatures for hydrocarbon generation in the Late Jurassic. The subsequent multi-phase uplift and fault activity not only created structural traps but also may have acted as pathways for hydrocarbon migration. These results provide valuable constraints on the hydrocarbon generation and accumulation history in this structurally complex margin.

2. Geological Setting

The thrust belt along the western margin of the Ordos Basin lies between several geologically distinct blocks, with contrasting geological characteristics, including the North China Craton, the Alxa Block, the Qinling Orogenic Belt, and the northeastern margin of the Tibetan Plateau (Figure 1). It is one of the most intensely deformed regions within the Chinese continental interior since the Mesozoic, recording numerous intracontinental deformation and orogenic events throughout the Phanerozoic. In addition, the western margin of the Ordos Basin is situated in the northern segment of the China Central Tectonic Belt, acting as a key junction that links the distinct tectonic domains of northern China’s western and eastern regions [5,6,8,9]. The study area is located in the southern segment of the basin’s western margin, where four west-dipping thrust faults are developed sequentially from west to east: the Weizhou Fault Zone, Qinglongshan Fault Zone, Shigouyi Fault Zone, and Yandunshan Fault Zone.
As a major structural component of the North China Craton, the Ordos Basin has undergone complex evolution under different tectonic regimes [6,8,9,10,11]. Since the Early Paleozoic, its geological history can be divided into several distinct stages: (1) stable continental margin sedimentation during the Early Paleozoic; (2) evolution into an intracratonic basin from the Late Paleozoic to Middle Triassic; (3) intracontinental depression basin development during the Late Triassic–Jurassic; (4) westward contraction of the depression basin in the Early Cretaceous; (5) regional exhumation from the Late Cretaceous to the Cenozoic; and (6) formation of fault-controlled Cenozoic depression basins in the surrounding areas [4,9,11].
The western margin of the Ordos Basin is characterized by well-developed Paleozoic strata. The Lower Paleozoic strata consist of a thick succession of marine carbonate deposits. The Cambrian system includes the Suyukou, Taosigou, Hulusitai, Zhangxia, and Abuchehai formations. The Lower to Middle Ordovician strata include the Sandaokan, Zhuozishan, Kelimoli, Wulalike, Lashizhong, and Gongwusu formations. The Upper Paleozoic sequence comprises the Upper Carboniferous Yanghugou formations (Figure 1c).

3. Sampling Strategy and Methodology

3.1. Sampling

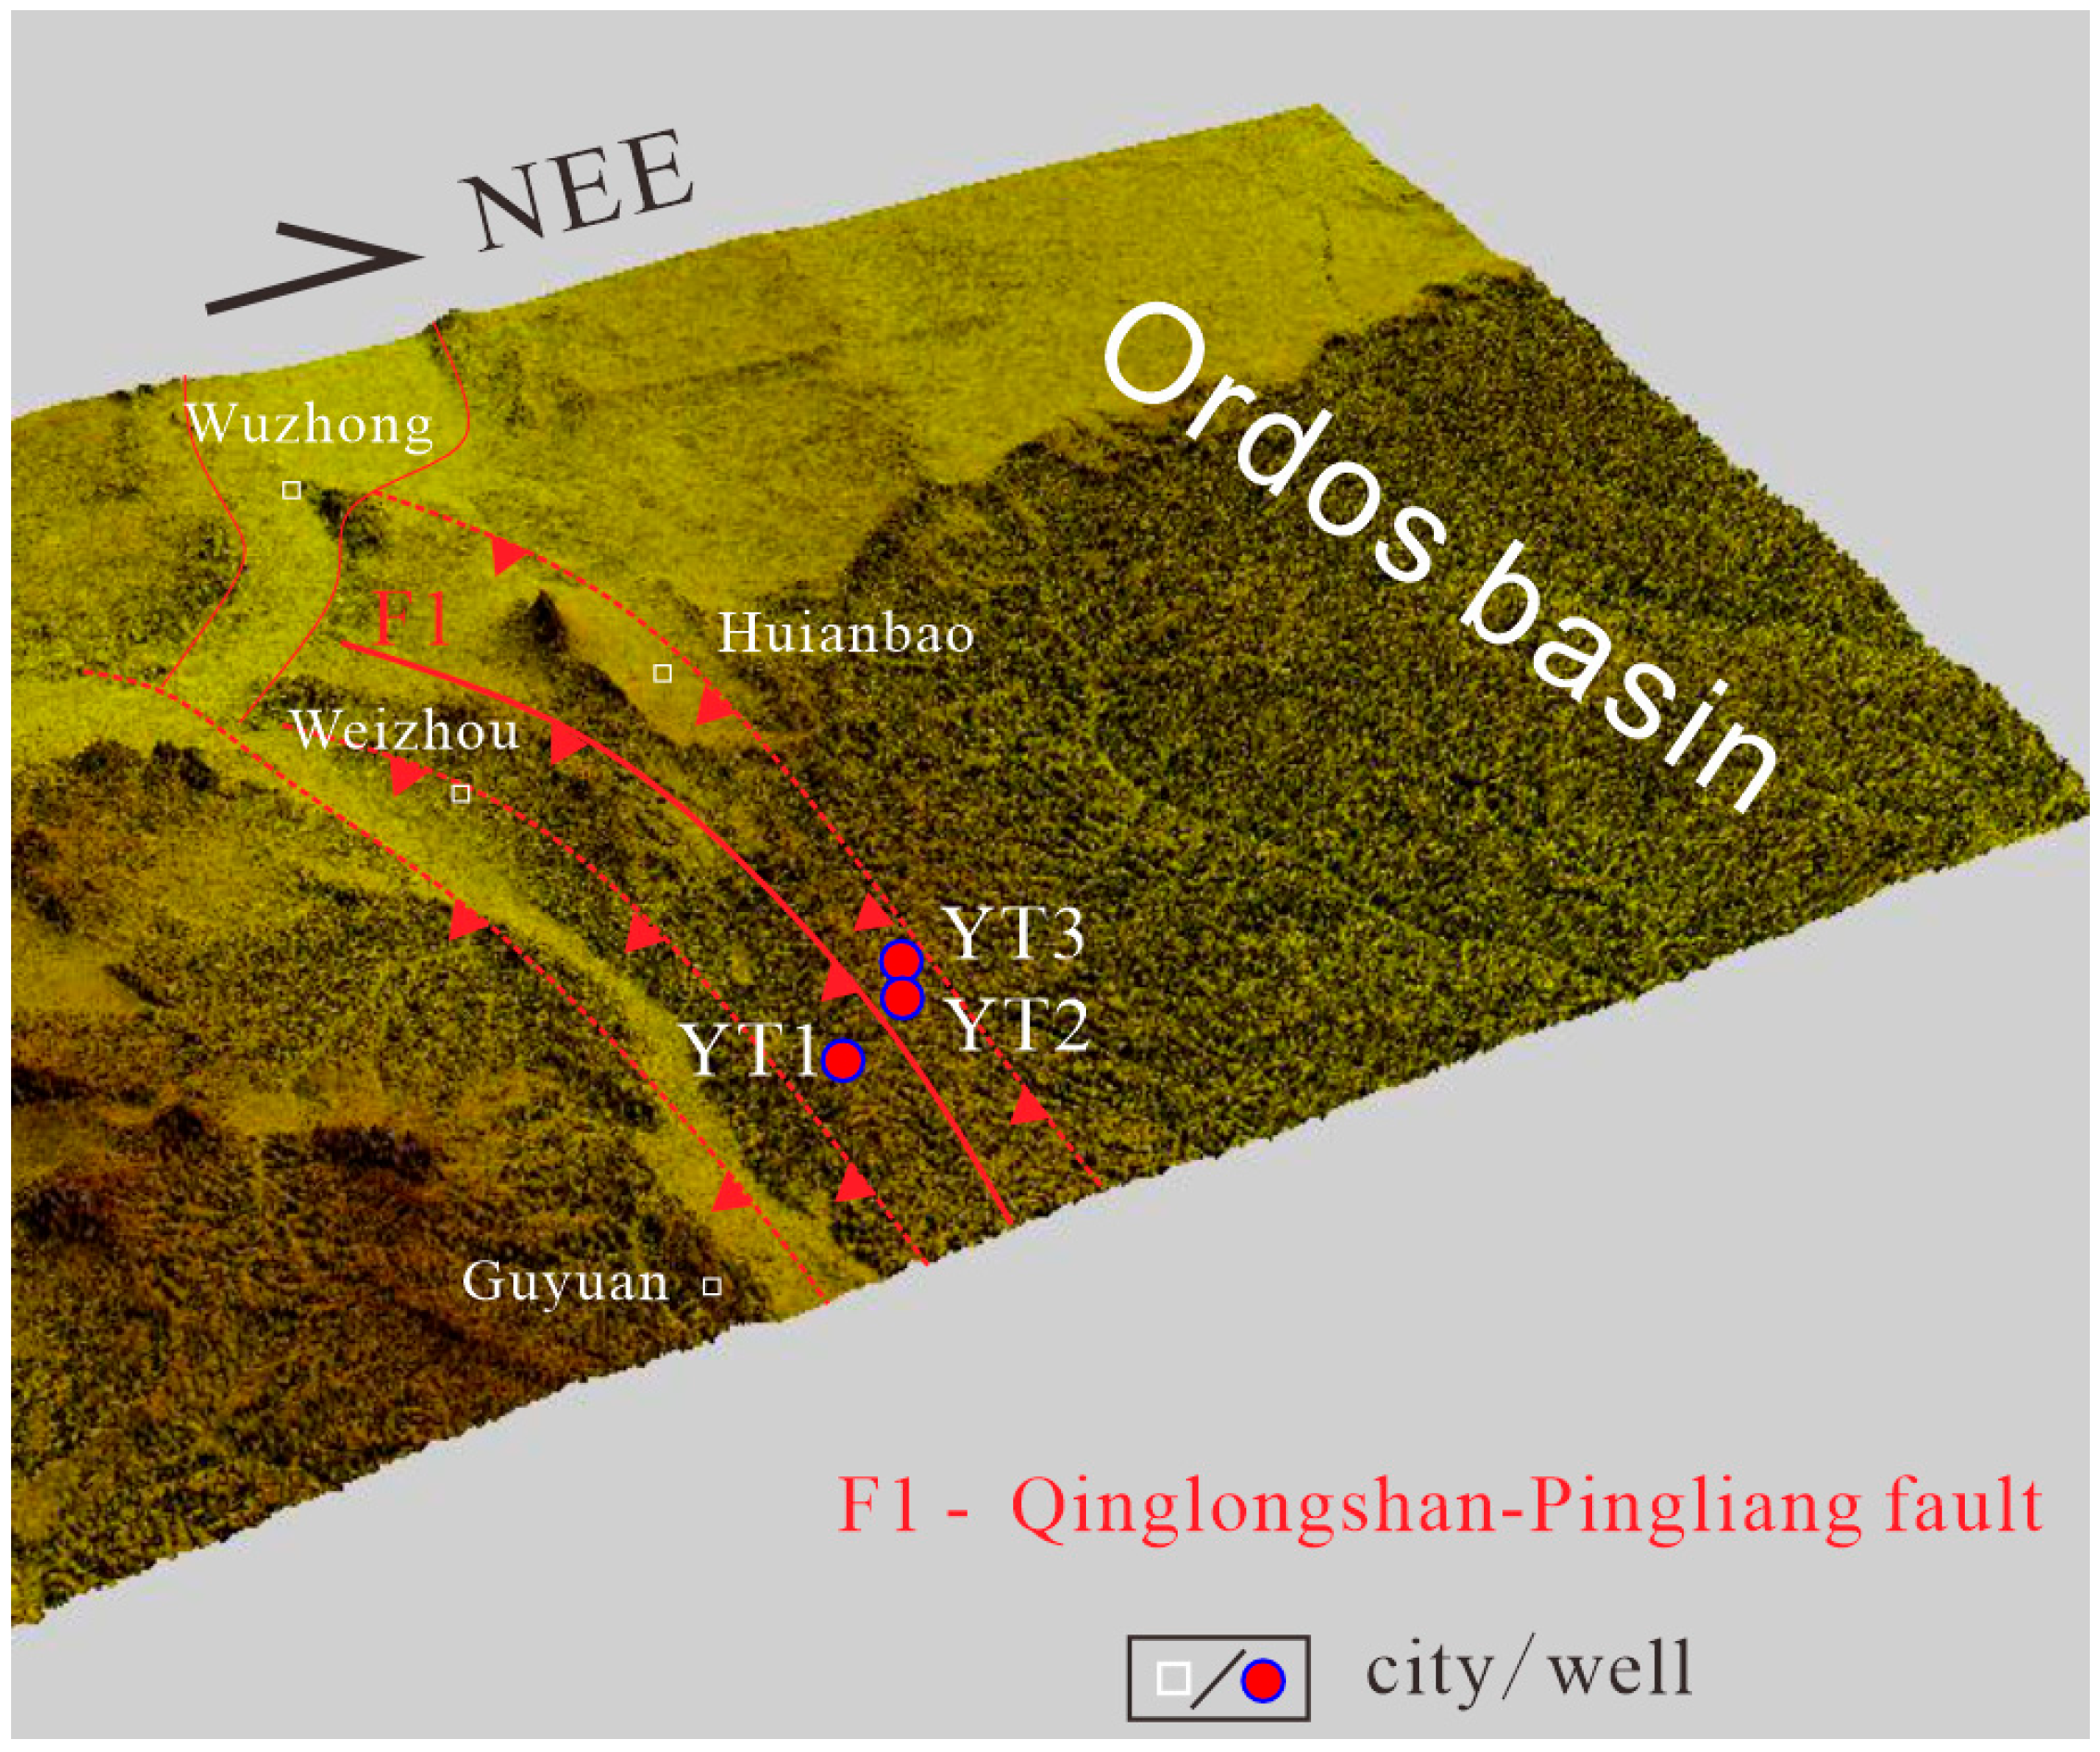
In order to explore the Mesozoic tectonothermal evolution of the southern segment of the western margin of the Ordos Basin and the influence of different fault blocks on thermochronological records, we selected three representative samples: W22YT1-36, W22YT2-23, and W22YT3-18 from the Yindongzi area, located on both sides of the Qinglongshan–Pingliang Fault. Samples W22YT1-36 and W22YT3-18 were collected from Late Ordovician sandstones, while W22YT2-23 was obtained from the Yanghugou Formation of the Late Carboniferous. The samples were processed using conventional heavy liquid and magnetic separation methods to extract apatite and zircon grains for thermochronological analysis (Figure 2 and Figure 3 and Table 1).

3.2. AFT Analysis

The samples in this study were analyzed using the LA-ICP method for AFT at the Petroleum Thermal Chronology Laboratory of the Department of Geology, Northwest University [12]. AFT dating is based on the principle that the spontaneous fission of 238U in minerals causes certain radiation damage to the host mineral. This isotopic dating method was developed by analyzing the surface density of spontaneous tracks in the mineral and the 238U content. The tracks in the mineral decrease in density and shorten in length with increasing temperature until they disappear completely. Subsequent exhumation and cooling can form new tracks below the mineral’s closure temperature [12]. The partial annealing zone of apatite fission tracks is between 60 °C and 120 °C [13,14,15]. With a moderate U content, consistent etching conditions, and well-developed annealing theory, this method is one of the most widely used and effective thermochronology techniques [15].
First, the apatite grains are embedded and fixed in epoxy resin, and then the mineral grains are ground and polished with sandpaper and a polisher to expose the maximum internal surface of most apatite grains. Next, the samples are etched with 5.5 mol/L HNO3 for 20 s at a constant room temperature of 20 °C to reveal spontaneous tracks. Required apatite grains are selected, and their spontaneous tracks are counted before measuring U content with a laser. The calculation of AFT ages follows Hasebe et al. (2004) [13], with ages analyzed using RadialPlotter software (version 3.0.14) and TrackKey software (version 4.2). Cooling histories are simulated using HeFTy software (version 2.1.7) [13,14,15,16].
According to the test data, the exhumation rate of the study area can be estimated using the following formula [17].

3.3. (U-Th)/He Analysis

Following three criteria: crystalline integrity of the automorphic particles, the purity of the particles, and ensuring that the crystal dimensions perpendicular to the c-axis exceed 60–70 μm, apatite and zircon grains were chosen under a high magnification (160×) binocular microscope for (U-Th)/He dating. The dating was conducted at the Ar-Ar and (U-Th)/He Geochronology Laboratory of the Institute of Geology and Geophysics, Chinese Academy of Sciences [18,19,20].
In addition, Helium diffusion profiles provide valuable constraints on the thermal history of mineral grains. By analyzing the spatial distribution of helium within individual apatite or zircon crystals, it is possible to infer the timing and rate of cooling and exhumation. Smooth, gradual profiles typically indicate prolonged high-temperature residence and slow cooling, while steep profiles suggest rapid exhumation and cooling. These profiles also help identify complex thermal events or partial helium loss that may not be captured by bulk (U-Th)/He ages alone. Therefore, helium diffusion profiles serve as an important supplement to traditional thermochronological data, improving the reliability of thermal modeling results [18,19,20].

3.4. Thermal History Modeling

Due to the complexity of annealing processes, the measured apparent ages lack any practical geological significance [21,22,23,24,25,26,27,28,29,30]. By utilizing the measured ages, track lengths, angle with the C-axis of mineral particles, and Dpar values, this thermal history can be inversely modeled [21]. In this study, HeFTy version 2.1.7 software was used for inverse modeling [21], and the Ketcham (2005) [12] multi-dynamic annealing model was selected for the inversion simulation, along with the c-axis corrected confined track lengths. The original confined track length was set at 16.3 μm, and the present-day temperature is set as the formation temperature corresponding to the depth at which the sample was collected. The goodness-of-fit parameter (GOF) was used to indicate how well the simulation results matched the actual measurements; a higher value signifies a better fit. When the GOF value obtained from the simulation exceeds 0.05, it indicates that the simulation results are acceptable, while a GOF value greater than 0.5 indicates a very good match. The simulated ages and lengths both had GOF values greater than 0.5 and close to 1, suggesting that the simulation results closely aligned with the measured values.

3.5. Burial History Reconstruction

To reconstruct the burial and thermal evolution of the study area, we employed Petromod 1D software (version 2016.2) to perform forward modeling of the burial history based on well data. The modeling process integrates geological, stratigraphic, and thermal parameters to simulate the subsidence and heat flow history through geological time. The input data include present-day stratigraphic thicknesses, lithological information (e.g., sandstone, shale, limestone), estimated erosion amounts, depositional ages, and corresponding lithological thermal conductivities and heat capacities. Regional paleogeothermal gradients and surface temperatures were also incorporated to constrain the thermal regime. The geothermal gradients used for thermal modeling during key geological intervals are specified as follows: 3 °C/100 m for both the Ordovician and Carboniferous, 2.8 °C/100 m during the Late Jurassic, and 3.9 °C/100 m by the end of the Early Cretaceous [4,8,9,10,11]. In unconformity intervals, erosion thickness was estimated based on stratigraphic correlation and vitrinite reflectance data (if available), ensuring accurate restoration of missing stratigraphy.
The model calculates the burial depth of each stratigraphic unit through time and the corresponding temperature evolution using a time-varying heat flow scenario. The output includes time–temperature (T–t) paths and maximum burial depths for each layer, which serve as important constraints for thermal maturity and low-temperature thermochronological modeling.

4. Results

4.1. Low-Temperature Thermochronology Results

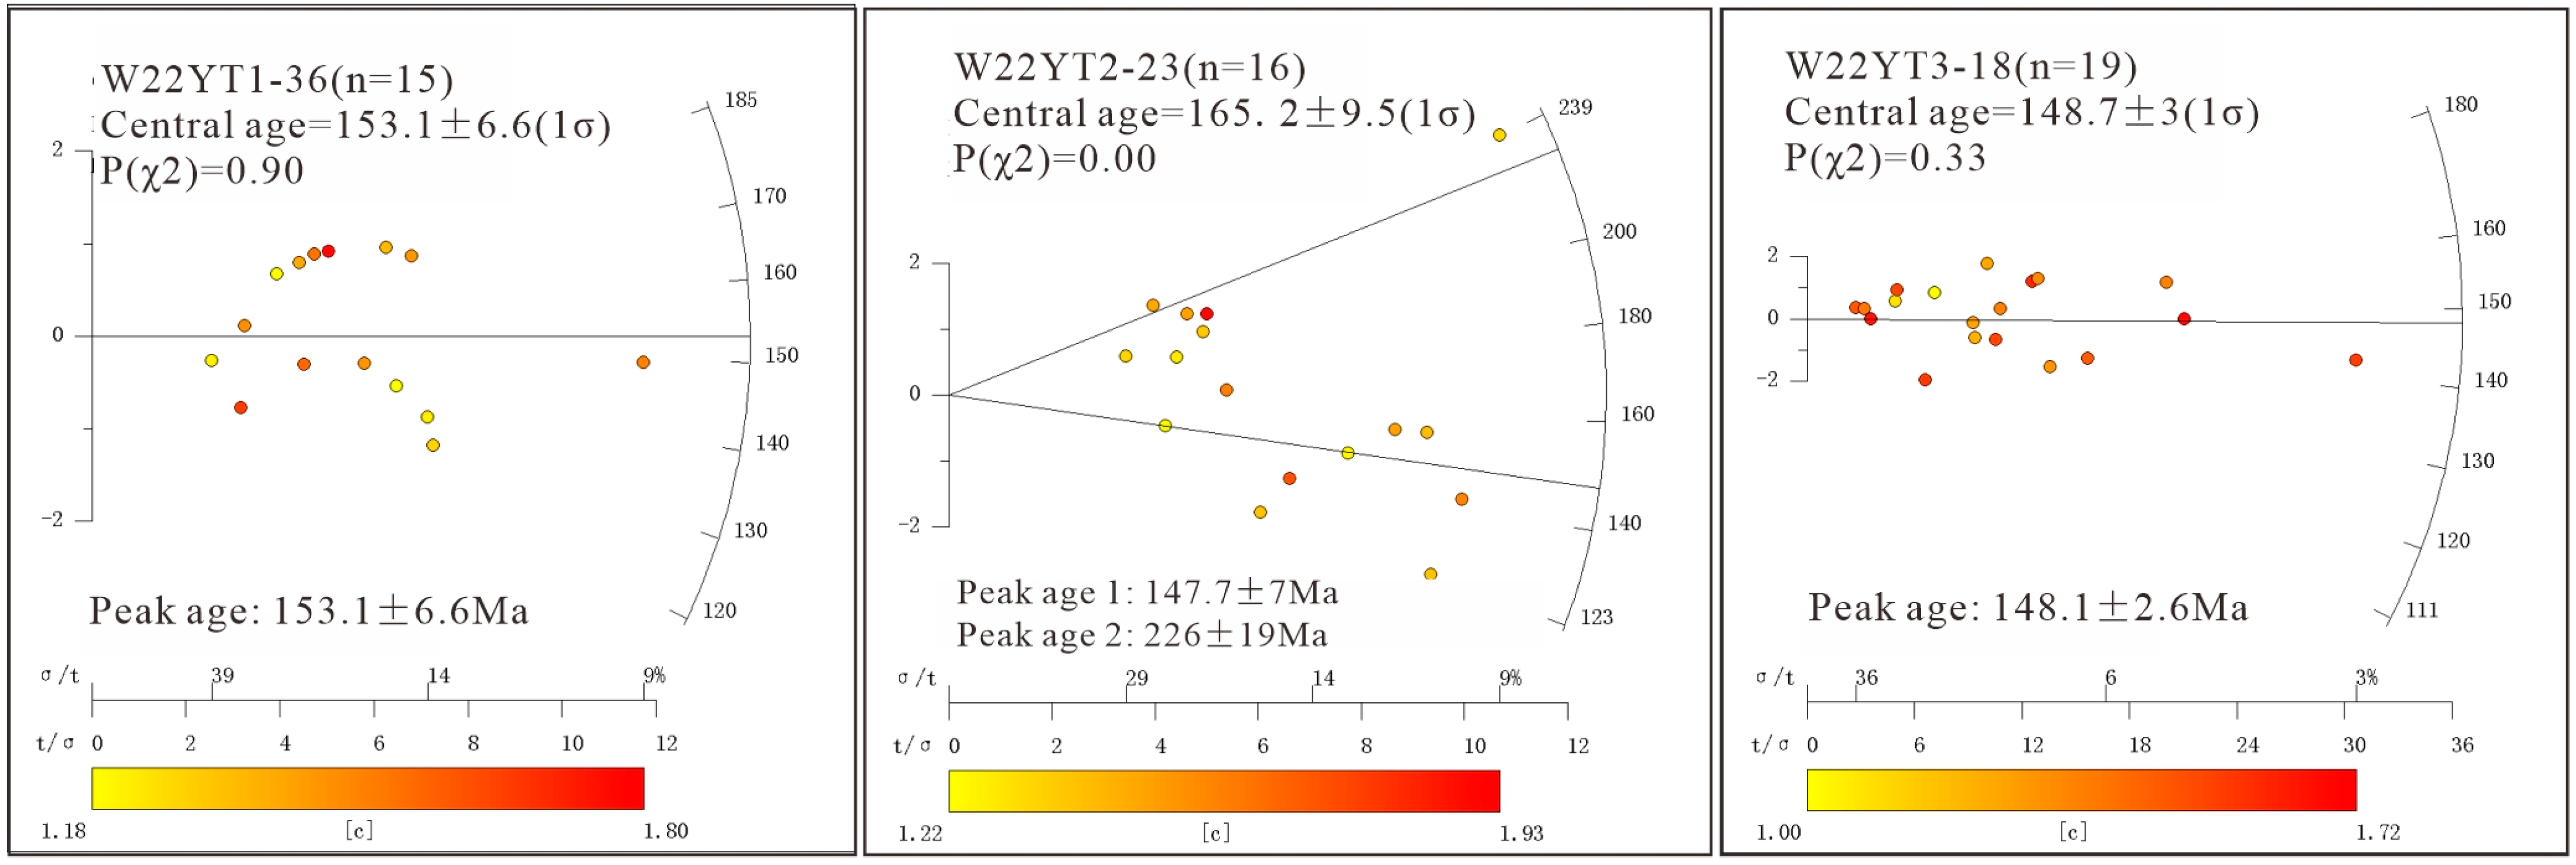
The central ages of the three sandstone samples from the study area (W22YT1-36, W22YT2-23, and W22YT3-18) are 153.1 ± 6.6 Ma, 165.2 ± 9.5 Ma, and 148.7 ± 3 Ma, respectively (Figure 4, Table 2), all significantly younger than the formation ages of the strata from which the samples were collected. The mean track lengths of the W22YT2-23 and W22YT3-18 are 12.09 ± 1.84 μm and 11.63 ± 1.02 μm, which are all shorter than the original spontaneous track length of 16.3 ± 0.9 μm, indicating that the samples underwent annealing and cooling in the Late Jurassic. Except for sample W22YT2-23, the remaining samples pass the chi-square test. The vitrinite reflectance of the mudstone samples from the Yanghugou Formation in well YT2 is approximately 0.6%–0.8%, corresponding to a maximum burial temperature of around 90–100 °C. This temperature is below the complete annealing threshold of apatite, indicating that the sample resides within the partial annealing zone. As a result, the single-grain ages derived from this sample do not represent a uniform age population. The peak ages of this sample, given by RadialPlotter software, are 226 ± 19 Ma and 147.7 ± 7 Ma [16]. The older peak ages may reflect provenance-related information, while the younger peak ages are more likely to record the timing of tectonic uplift after sediment transport to the study area. Additionally, the correlation between track length and AFT age indicates a complex cooling history in the region. Considering the different annealing kinetics [20], the chemical composition of the grains may influence AFT age and length [21,22,23,24,25,26,27,30]. However, the Dpar values in the samples range from 1.41 μm to 1.46 μm with minimal variation, showing no significant correlation with AFT age. This suggests that the chemical composition has little or no effect on the AFT ages (Figure 4 and Table 2).
Apatite (U–Th)/He (AHe) and zircon (U–Th)/He (ZHe) dating were conducted on W22YT1-36 and W22YT2-23, while only ZHe dating was performed on W22YT3-18. For sample W22YT1-36, the AHe ages are 30 Ma, 82 Ma, 6.8 Ma, and 63 Ma, with an average of approximately 46 Ma. The corresponding ZHe ages are 334 Ma, 369 Ma, 393 Ma, and 321 Ma, yielding an average of 354 Ma. Sample W22YT2-23 yields AHe ages of 19 Ma, 25 Ma, and 1 Ma (average ~15 Ma), and ZHe ages of 710 Ma, 317 Ma, and 265 Ma, with a mean of ~431 Ma. The anomalously old 710 Ma age may reflect an inherited signal or disturbance from earlier thermal events. For W22YT3-18, the ZHe ages are 1.2 Ma, 416 Ma, and 405 Ma, showing a wide temporal spread indicative of multiple thermal episodes (Table 3 and Table 4).
Overall, the AHe ages cluster within the Mesozoic to Cenozoic, likely reflecting episodes of tectonic uplift and exhumation during this period. In contrast, the ZHe ages span from the Paleozoic to possibly the Neoproterozoic, suggesting deeper thermal histories or provenance influences. The broad range and variability in the thermochronological data highlight the complex thermal evolution of the region and the differing thermal regimes experienced by each sample.

4.2. Thermal History Modeling

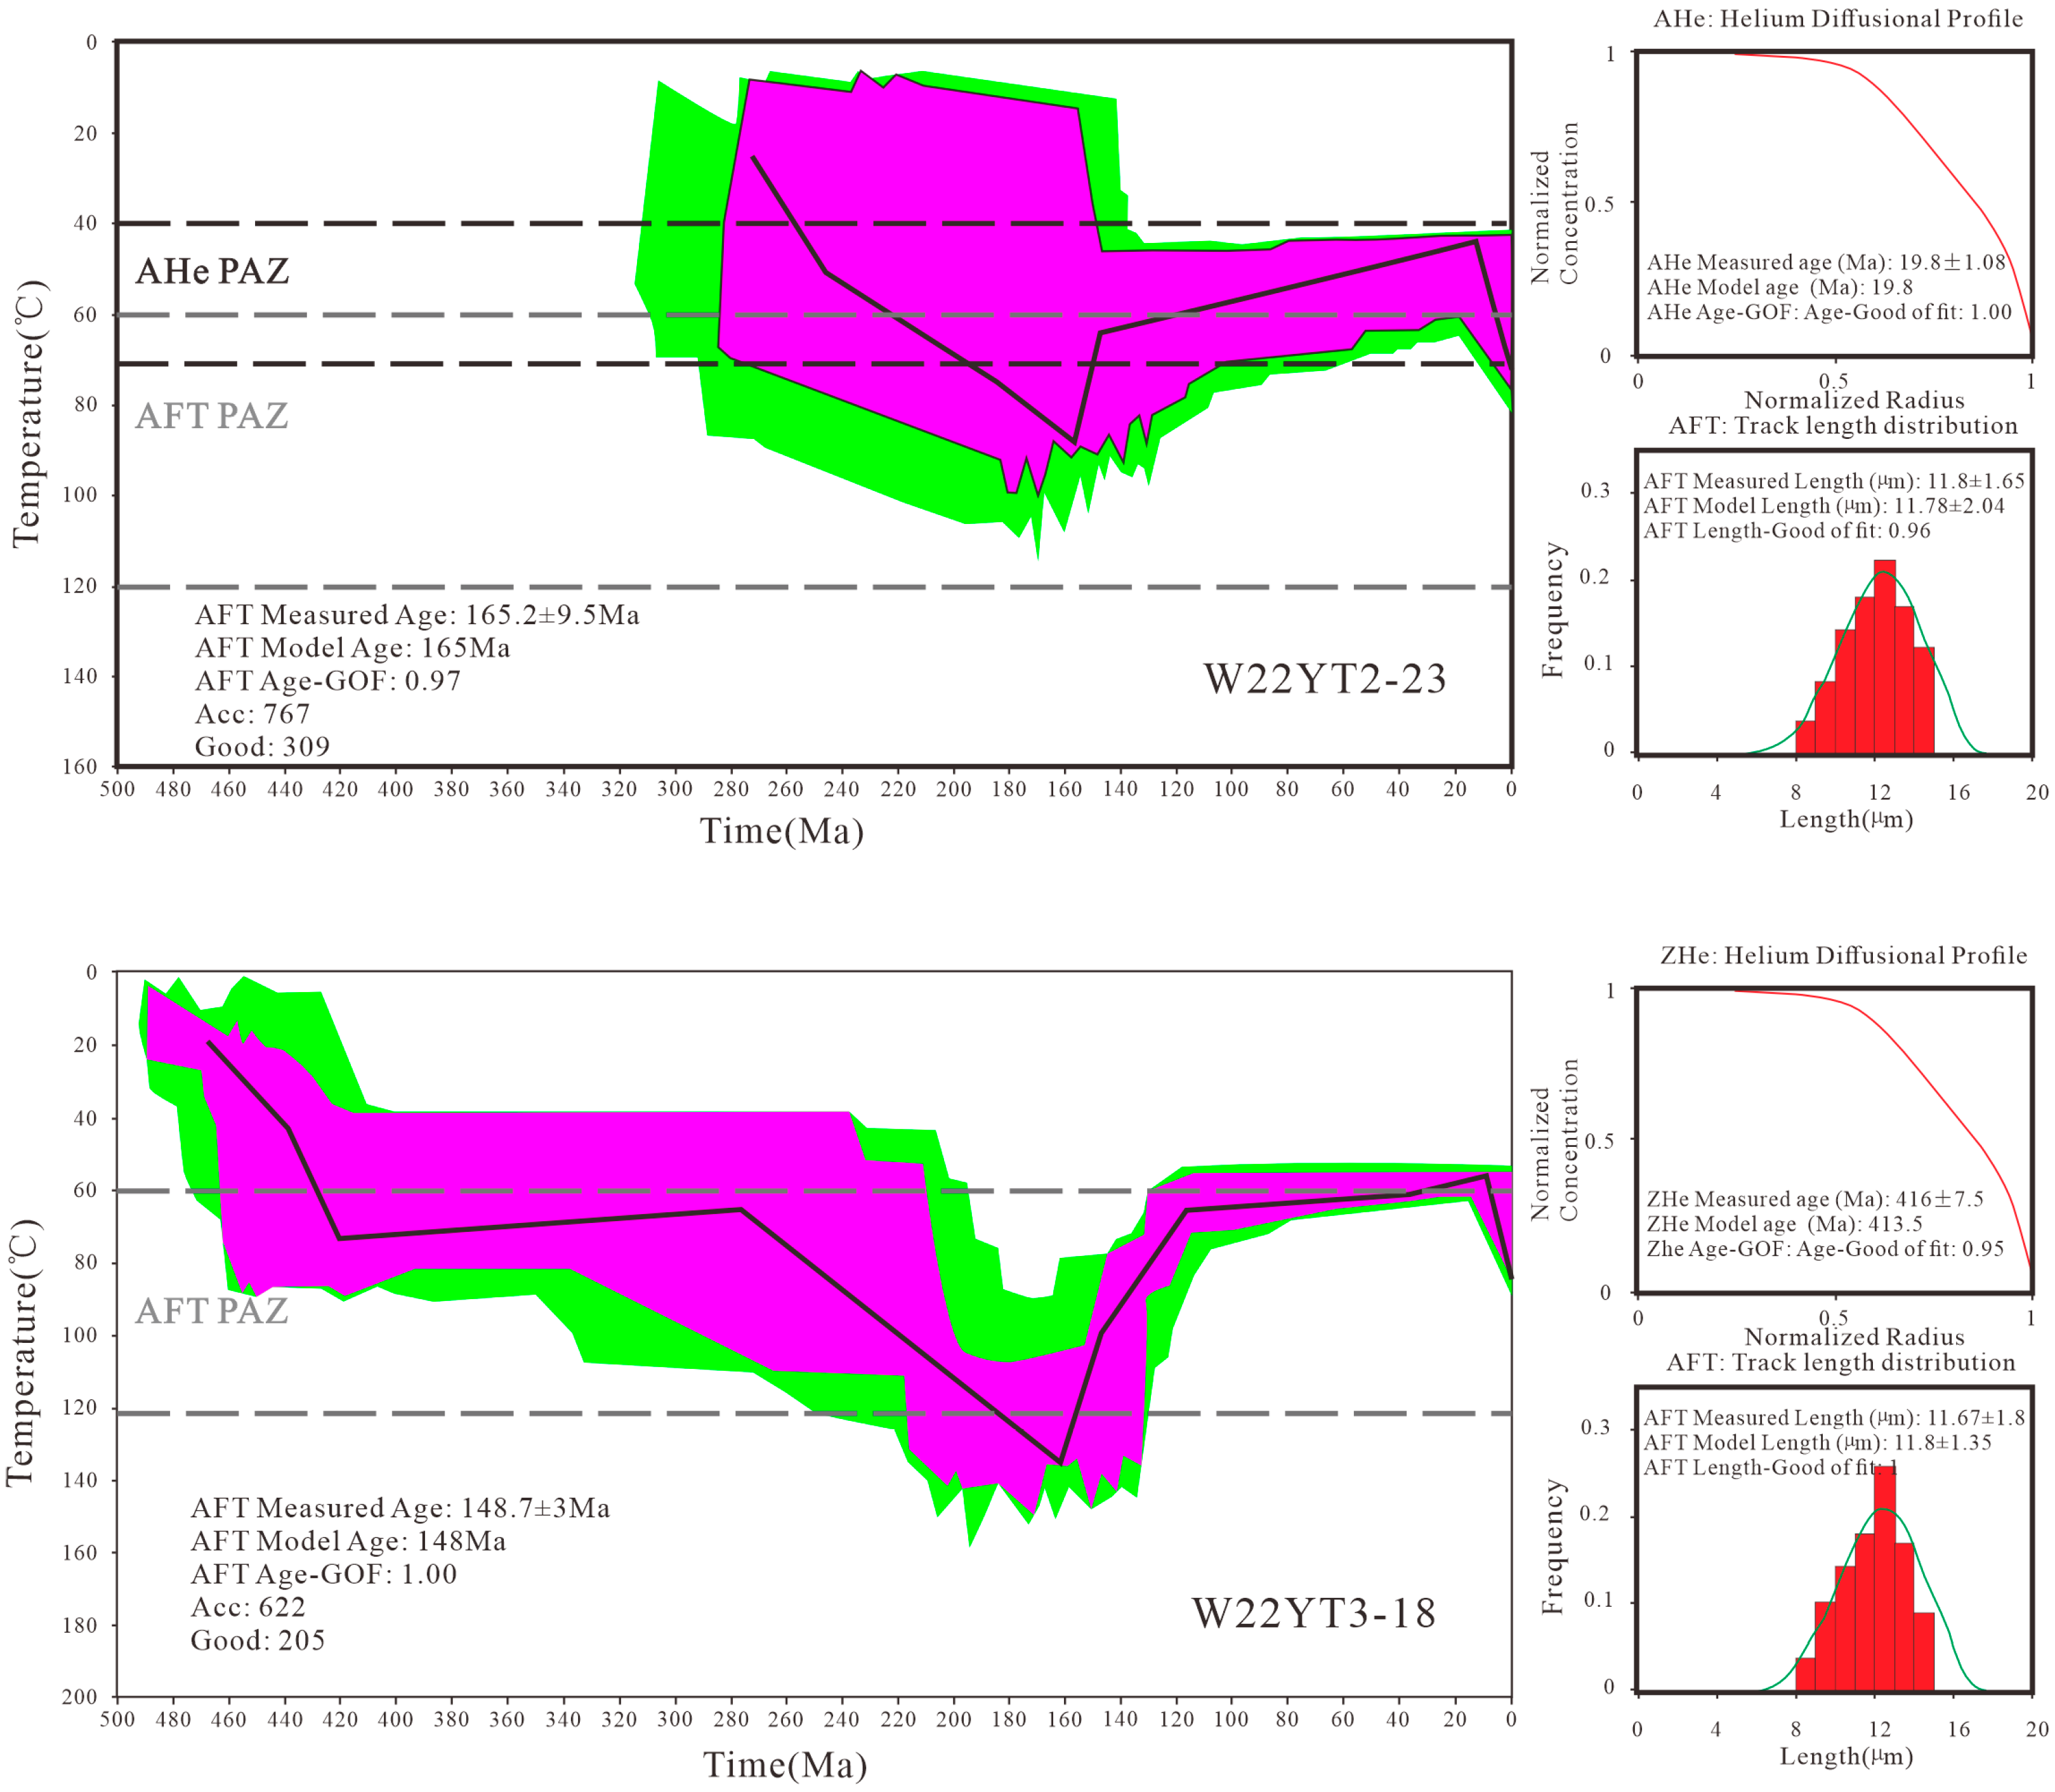
To better constrain the thermal evolution of the study area, thermal history modeling was performed on samples W22YT2-23 (from the Late Carboniferous, Yanghugou Formation) and W22YT3-18 (from the Late Ordovician sandstone). The two samples exhibit distinct cooling histories, reflecting spatial and temporal heterogeneity in the region’s tectonothermal evolution (Figure 5).
Sample W22YT2-23 remained at relatively shallow burial depths throughout its history, with temperatures consistently below 120 °C, indicating that it never reached the full annealing zone of apatite. The thermal model shows gradual cooling starting at ~160 Ma (Late Jurassic), followed by renewed subsidence and heating during the Late Cenozoic.
In contrast, sample W22YT3-18 displays a significantly different thermal history. The ZHe ages are widely scattered (1.2 Ma, 405 Ma, and 416 Ma), with the older values likely reflecting inherited signals and the youngest possibly indicating minor recent disturbance. The thermal model indicates gradual cooling beginning around 160 Ma (Late Jurassic), and the AFT age of 148.7 ± 3 Ma likely reflects a rapid cooling phase near 150 Ma, interpreted as a response to tectonic activity at that time. In the Late Cenozoic, the region also experienced renewed subsidence.
Together, the results highlight a spatial variability in exhumation history across the study area. W22YT2-23 records both Mesozoic and Cenozoic cooling, whereas W22YT3-18 is characterized mainly by Jurassic exhumation, suggesting differential tectonic reactivation and denudation since the Mesozoic.

5. Discussion

5.1. Uplift and Exhumation History of the Study Area

The study area is located in the southern segment of the western margin of the Ordos Basin, characterized by a complex structural setting influenced by multiple active fault systems. It is subject to the combined effects of the Mesozoic Yanshanian Orogeny and far-field compression from the northeastern margin of the Tibetan Plateau during the Cenozoic. Samples W22YT1, W22YT2, and W22YT3 are distributed on both sides of a major fault: YT1 is situated on the western side near the basin margin, while YT2 and YT3 lie on the eastern side, closer to the basin interior. Integrated thermochronological data and thermal history modeling indicate that the region has undergone a series of tectono-thermal events since the Late Paleozoic, exhibiting pronounced spatial and temporal heterogeneity. The timing of exhumation among the samples was strongly influenced by fault-controlled structural segmentation [5,31,32,33,34].

5.1.1. Paleozoic History Revealed by ZHe Ages

All three sample groups yielded relatively old zircon (U-Th)/He (ZHe) ages, indicating that the study area experienced significant geological events during the Paleozoic. The ages from sample YT1 are tightly clustered between 334 and 393 Ma, with an average age of 354 Ma, which likely reflects Late Devonian to Early Carboniferous orogenic processes or basin-related sedimentation and subsequent burial. Sample YT2 shows a wider range of ZHe ages from 265 to 710 Ma. Despite this scatter, the cluster between 265 and 317 Ma (average ca. 291 Ma) may correspond to a Late Carboniferous to Early Permian thermal event, while the oldest age of 710 Ma likely represents an inherited signal from the source area. Sample YT3 yields ZHe ages of 405–416 Ma (average ca. 410 Ma), corresponding to the Silurian–Devonian transition, suggesting it experienced an earlier phase of burial and heating.
Although apatite-based thermochronology records younger phases of exhumation, the preservation of these Paleozoic ZHe ages implies that the samples did not experience thermal conditions sufficient to fully reset zircon systems during the Mesozoic–Cenozoic. This indicates that the maximum burial temperatures during later tectonic activity remained below the partial retention zone (PRZ) of zircon, thus preserving information related to pre-Mesozoic thermal events. These older thermal signals are potentially linked to tectonism during the Variscan or Qinling orogenies. Overall, the ZHe ages reveal a complex pre-Mesozoic thermal history in the study area, which established heterogeneous initial conditions for subsequent thermal and tectonic evolution in the Mesozoic–Cenozoic.

5.1.2. Mesozoic Differential Uplift and the Role of Faulting

During the Late Mesozoic, the study area experienced significant tectonic uplift under the strong influence of the Yanshanian Orogeny, with markedly different responses observed on either side of the fault. Sample YT1 yielded a well-clustered apatite fission-track (AFT) central age of 153.1 ± 6.6 Ma, indicating rapid exhumation and cooling during the Late Jurassic. This cooling corresponds to a pronounced temperature drop from the partial annealing zone (PAZ) into the full retention zone, suggesting a relatively simple and well-defined thermal history. Although its ZHe age is relatively old (354 Ma), it was not fully reset by subsequent thermal events, implying that the sample was not deeply buried during the Mesozoic and has remained within a shallow structural setting since the Yanshanian. Furthermore, previous studies on the western side of the fault also report early exhumation events between 175Ma and 165 Ma based on fission-track data [6,34].
In contrast, samples YT2 and YT3, located on the eastern side of the fault, exhibit delayed cooling histories as revealed by thermochronological data and thermal modeling (Figure 5). For sample YT2 (W22YT2-23), the temperature declined from 80 °C to 52 °C between 165 and 135 Ma. Assuming a geothermal gradient of 30 °C/km, this corresponds to an exhumation depth of approximately 0.93 km and an average exhumation rate of ~0.031 km/Ma. From 140 to 20 Ma, the temperature gradually decreased to ~38 °C, followed by rapid cooling to the surface during the Cenozoic. This indicates a multi-phase cooling history that significantly postdates that of YT1.
Sample YT3 (W22YT3-18) experienced a more pronounced temperature drop from 140 °C to 100 °C between 160 and 140 Ma, corresponding to an exhumation depth of about 1.33 km and an exhumation rate of ~0.058 km/Ma—noticeably higher than that of YT2 during the same interval. This suggests internal variations in deformation and exhumation even within the eastern side of the fault. Its AFT central age is 148.7 ± 3 Ma, indicating that the timing of cooling was later than that of YT1.

5.1.3. Cenozoic Rejuvenation: Effects of Far-Field Himalayan Tectonics

In the thermal history modeling, both YT1 and YT2 exhibit a pronounced cooling trend beginning around 20 Ma, which closely corresponds to their apatite (U-Th)/He (AHe) ages-46 Ma for YT1 and 15 Ma for YT2, indicating that the study area underwent renewed tectonic exhumation during the Cenozoic. This phase of thermal-tectonic evolution is likely related to the rapid uplift of the northeastern Tibetan Plateau and the transmission of far-field compressional stresses, which reactivated faults and induced regional-scale uplift across the study area. In the Late Cenozoic, the region experienced renewed sedimentation. Although AHe data are not available for YT3, its thermal modeling results also suggest a late-stage rapid cooling trend, implying that it may have similarly experienced Cenozoic tectonic influence.
Integrating thermochronological data with thermal history modeling reveals clear spatiotemporal variations in exhumation history among the three samples, strongly governed by fault-related structural controls. The ZHe ages record a deep burial thermal history during the Paleozoic, establishing the thermal baseline prior to Mesozoic–Cenozoic exhumation. In the Late Jurassic, driven by the Yanshanian Orogeny, fault reactivation triggered early uplift on the western side (YT1, near the basin margin), while exhumation on the eastern side (YT2 and YT3, toward the basin interior) occurred progressively later. This pattern defines a tectonic exhumation sequence advancing from the basin margin toward the basin interior.
During the Cenozoic, far-field compressional stresses from the eastern Tibetan Plateau were transmitted to the western margin of the Ordos Basin, reactivating fault zones and inducing a region-wide rapid cooling event of variable magnitude. The NE-trending fault not only functioned as a tectonic boundary during both the Mesozoic and Cenozoic, but also dictated the timing and rate of thermal evolution. The differential thermal signatures recorded in YT1-YT2-YT3 represent a natural manifestation of lateral tectonic response and underscore the importance of fault systems in controlling localized thermal structures. These findings highlight the need for future regional tectono-thermal studies to more thoroughly consider the evolving roles of fault zones and their spatial influence on heat flow and exhumation dynamics.

5.2. Tectonic Evolution and Stress Regimes

The thermochronological data and thermal history modeling reveal that the western margin of the Ordos Basin has undergone multiple phases of tectonic uplift and cooling since the Paleozoic, driven by distinct regional stress regimes. These uplift events exhibit pronounced spatial and temporal differences, closely controlled by a fault system that divides the study area into contrasting tectonic blocks [10,32,35,36,37]. The fault not only influenced the onset and rate of exhumation but also served as a key structural boundary over geologic time [36,37,38].

5.2.1. Paleozoic: Deep Burial and Early Basin Development

The ZHe ages obtained from the samples (W22YT1-36: ~354 Ma, W22YT2-23: ~291 Ma, W22YT3-18: ~410 Ma) suggest that the source region experienced significant thermal events during the Late Devonian to Early Permian. These events are closely linked to orogenic processes along the southern margin of the North China Craton—such as the Variscan Orogeny and tectonic activity related to the Qinling and Qilian belts—as well as to basin thickening from extensive Late Paleozoic sedimentation.
The preservation of these ancient ages, without full resetting by subsequent thermal events, indicates that the study area did not experience burial deep enough during the Mesozoic or Cenozoic to reach the temperatures (~190 °C) required for complete zircon annealing [4,5,20]. This implies that the region remained outside high-temperature regimes during later tectonic evolution. Accordingly, the ZHe ages can be regarded as “thermal relics” of early-stage thermal history, providing valuable insight into the Paleozoic geodynamic and burial evolution of the region [35,38,39,40].

5.2.2. Mesozoic: Regional Uplift and Reactivation of Fault Systems

Between the Late Jurassic and Early Cretaceous, the study area experienced widespread tectonic uplift and rapid cooling, marking a critical transitional phase in its structural evolution. This stage was clearly governed by the Yanshanian Orogeny. Key structural features during this period include the early and rapid cooling of YT1 (on the western side of the fault) at ca. 153 Ma. The single-grain AFT ages of YT1 are relatively clustered, providing more reliable evidence for an early-stage exhumation event.
In contrast, samples YT2 and YT3 (on the eastern side of the fault) initiated uplift later than YT1, with peak cooling occurring between 147 and 121 Ma (Figure 5). Their thermal histories exhibit a “fast-then-slow” cooling pattern, and their AFT age distributions are more dispersed, indicating more complex, multi-phase tectonic activity and thermal disturbance. The exhumation rate progressively decreases from the fault’s western side (YT1) to the eastern side (YT2 and YT3), while the onset of cooling is correspondingly delayed. This defines a basinward-propagating tectonic uplift pattern from the basin margin toward the basin interior.
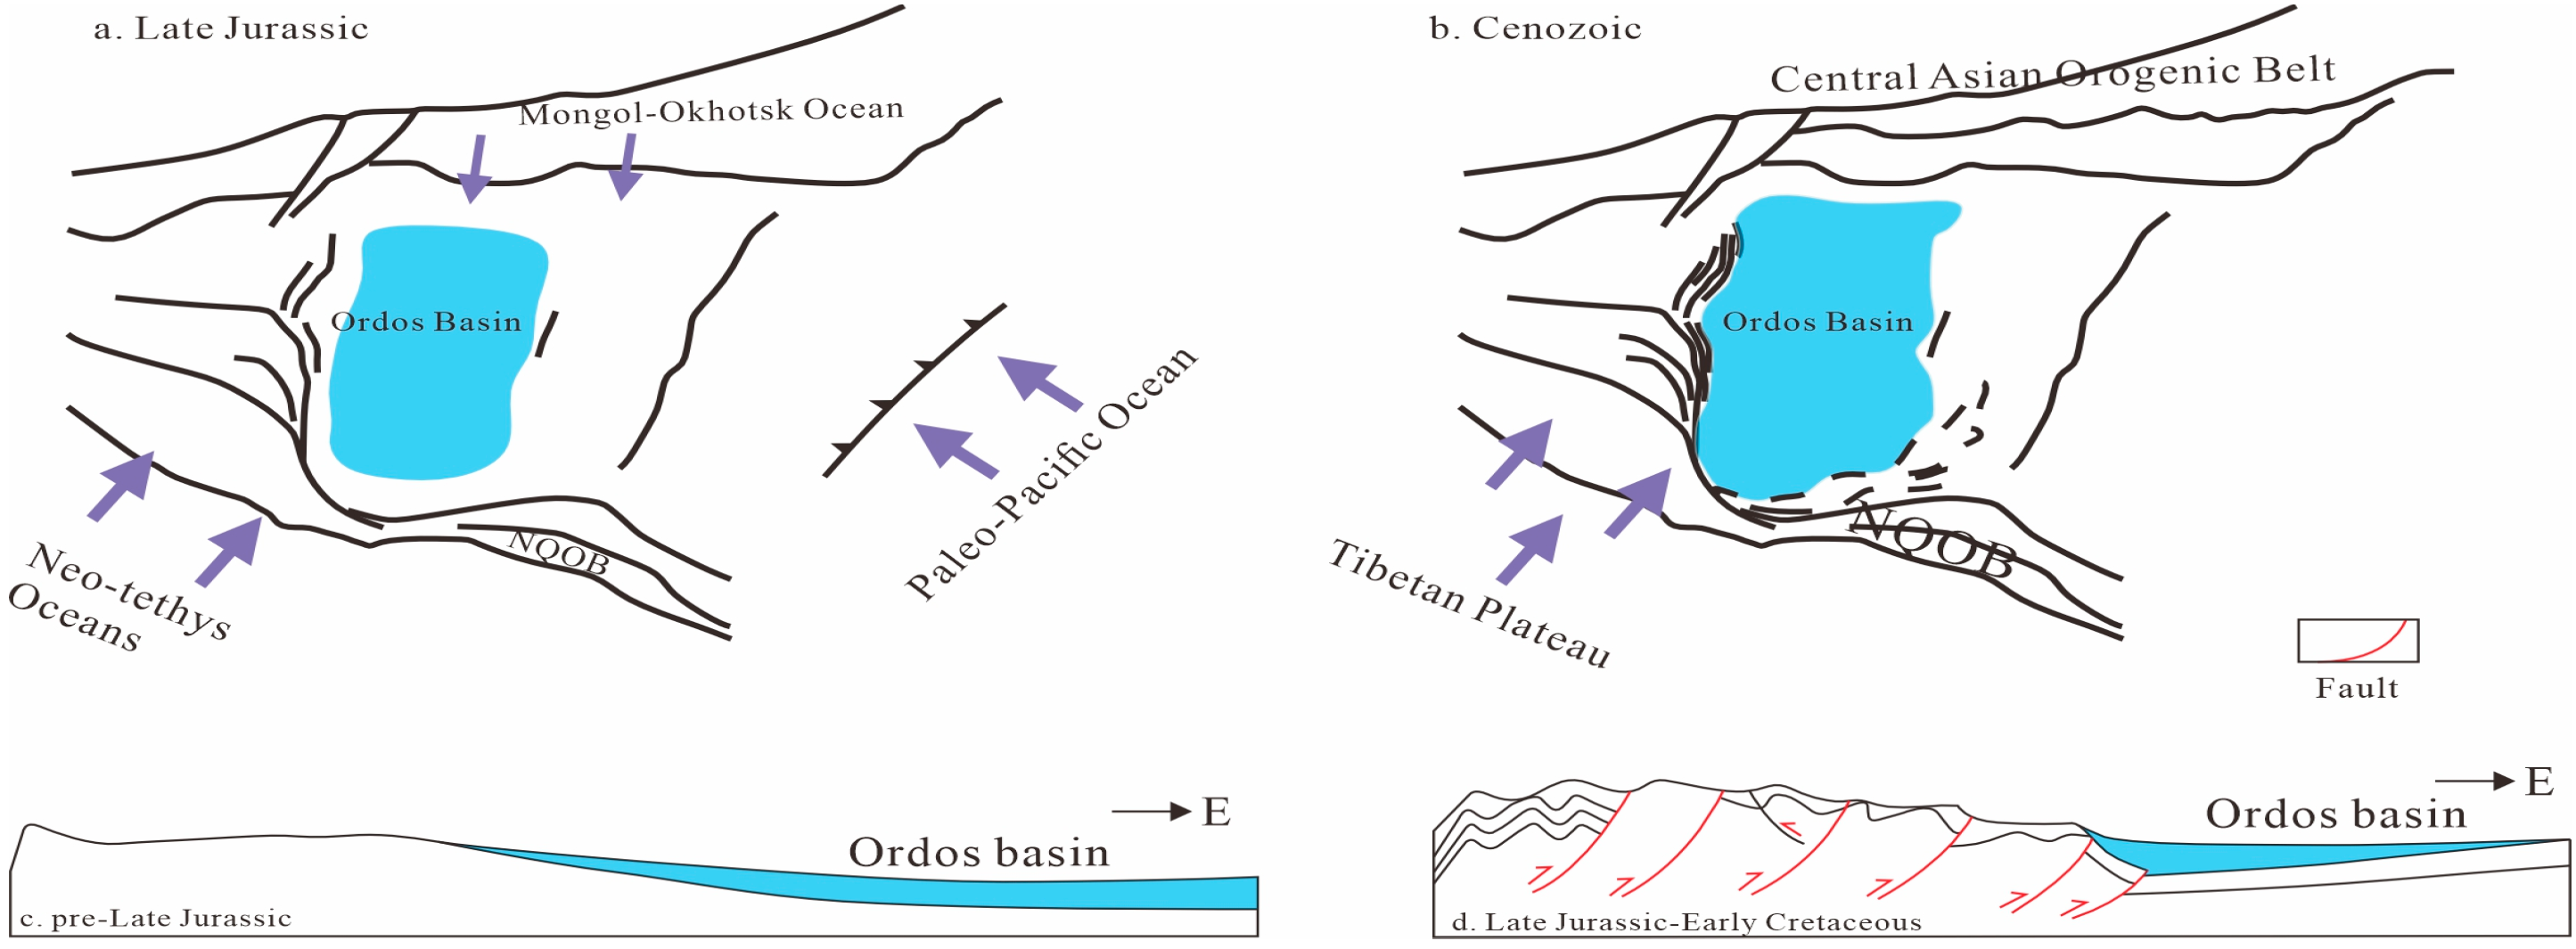
Since the Late Jurassic, the uplift of this stage was mainly controlled by the following geodynamic factors: the closure of the Mongol–Okhotsk Ocean in the north, the westward subduction of the Paleo–Pacific Plate beneath the Eurasian Plate in the east and the southwest Tethys tectonic domain. These processes induced widespread intracontinental deformation, leading to the development of numerous N–S-trending faults along the margins of the North China Craton [38,39,40,41]. The southern segment of the western margin of the Ordos Basin, where the study area is located, served as a key stress transmission zone, reflecting foreland-style deformation that occurred far from the main orogenic belt.

5.2.3. Cenozoic: Reactivation and Far-Field Response to Himalayan Tectonics

Thermal history modeling and apatite (U-Th)/He (AHe) dating reveal that both YT1 and YT2 underwent pronounced rapid cooling events since approximately 20 Ma, indicating renewed exhumation of the study area during the Cenozoic. Specifically, the average AHe age of YT1 is ca. 46 Ma, and that of YT2 is ca. 15 Ma, both pointing to significant Cenozoic cooling driven by tectonic uplift. Although YT3 lacks AHe data, its thermal modeling results also suggest an accelerated cooling trend in the late stage, implying that it may have been similarly affected. The Cenozoic uplift primarily occurred after the Early Miocene, with temperatures dropping rapidly from 40°C to 50°C to near-surface conditions [42,43,44,45].
This phase of tectonic activity is closely linked to the Cenozoic uplift of the Tibetan Plateau and the northeastward transmission of far-field compressional stresses. Although the study area lies beyond the plateau margin, its position at the outer edge of a foreland belt made it susceptible to stress transmission via inherited fault systems. These reactivated faults transmitted deformation toward the basin-margin boundary zone, triggering renewed uplift during the Cenozoic [43,44,45,46,47,48,49,50]. This highlights that the faults in the region acted as critical channels for stress transmission in the Cenozoic [51,52,53,54,55]. Their repeated reactivation was a key factor controlling the timing and magnitude of regional exhumation (Figure 6).
In conclusion, the exhumation history of the study area is characterized by pronounced multi-phase evolution, spatial heterogeneity, and strong structural boundary control. During the Mesozoic–Cenozoic uplift, the region exhibited clear tectonic segmentation and differential responses, particularly manifesting as a progressive thermal-tectonic pattern from the basin margin toward the interior under the influence of major fault systems. This pattern was further overprinted by far-field tectonic forces associated with the Himalayan Orogeny, reflecting the mechanisms of stress transmission and structural response within the interior of the Chinese continent, far from active plate boundaries.

5.3. Burial and Uplift History: Constraints on Hydrocarbon Generation and Accumulation

Regional tectonic events not only influence the thermal evolution of source rocks but also directly control the timing and efficiency of hydrocarbon accumulation. Basin uplift and exhumation can lead to hydrocarbon escape, trap destruction, or hinder source rocks from reaching the hydrocarbon generation threshold. In contrast, subsidence favors the continued burial and maturation of source rocks and better synchrony with trap formation, thus promoting hydrocarbon accumulation.
Four main sets of source rocks have been identified in the study area: the Ordovician Wulalike Formation, the Carboniferous Yanghugou Formation, the Permian coal-bearing strata (mainly the Shanxi and Taiyuan formations), and the Triassic Yanchang Formation [4]. However, since the Mesozoic, the region has undergone intense tectonic reworking, which significantly disrupted the original sedimentary-structural configuration of the Ordos Basin. The original extent of Paleozoic sedimentation and the distribution of Mesozoic lacustrine basins far exceeded the present-day boundaries of the basin, indicating that the original hydrocarbon-rich depressions were much larger than those currently preserved [9,10,11]. Intense tectonic deformation fragmented and dissected these depressions, disrupting the continuity and burial conditions of the source rocks and thereby reducing the hydrocarbon resource potential.
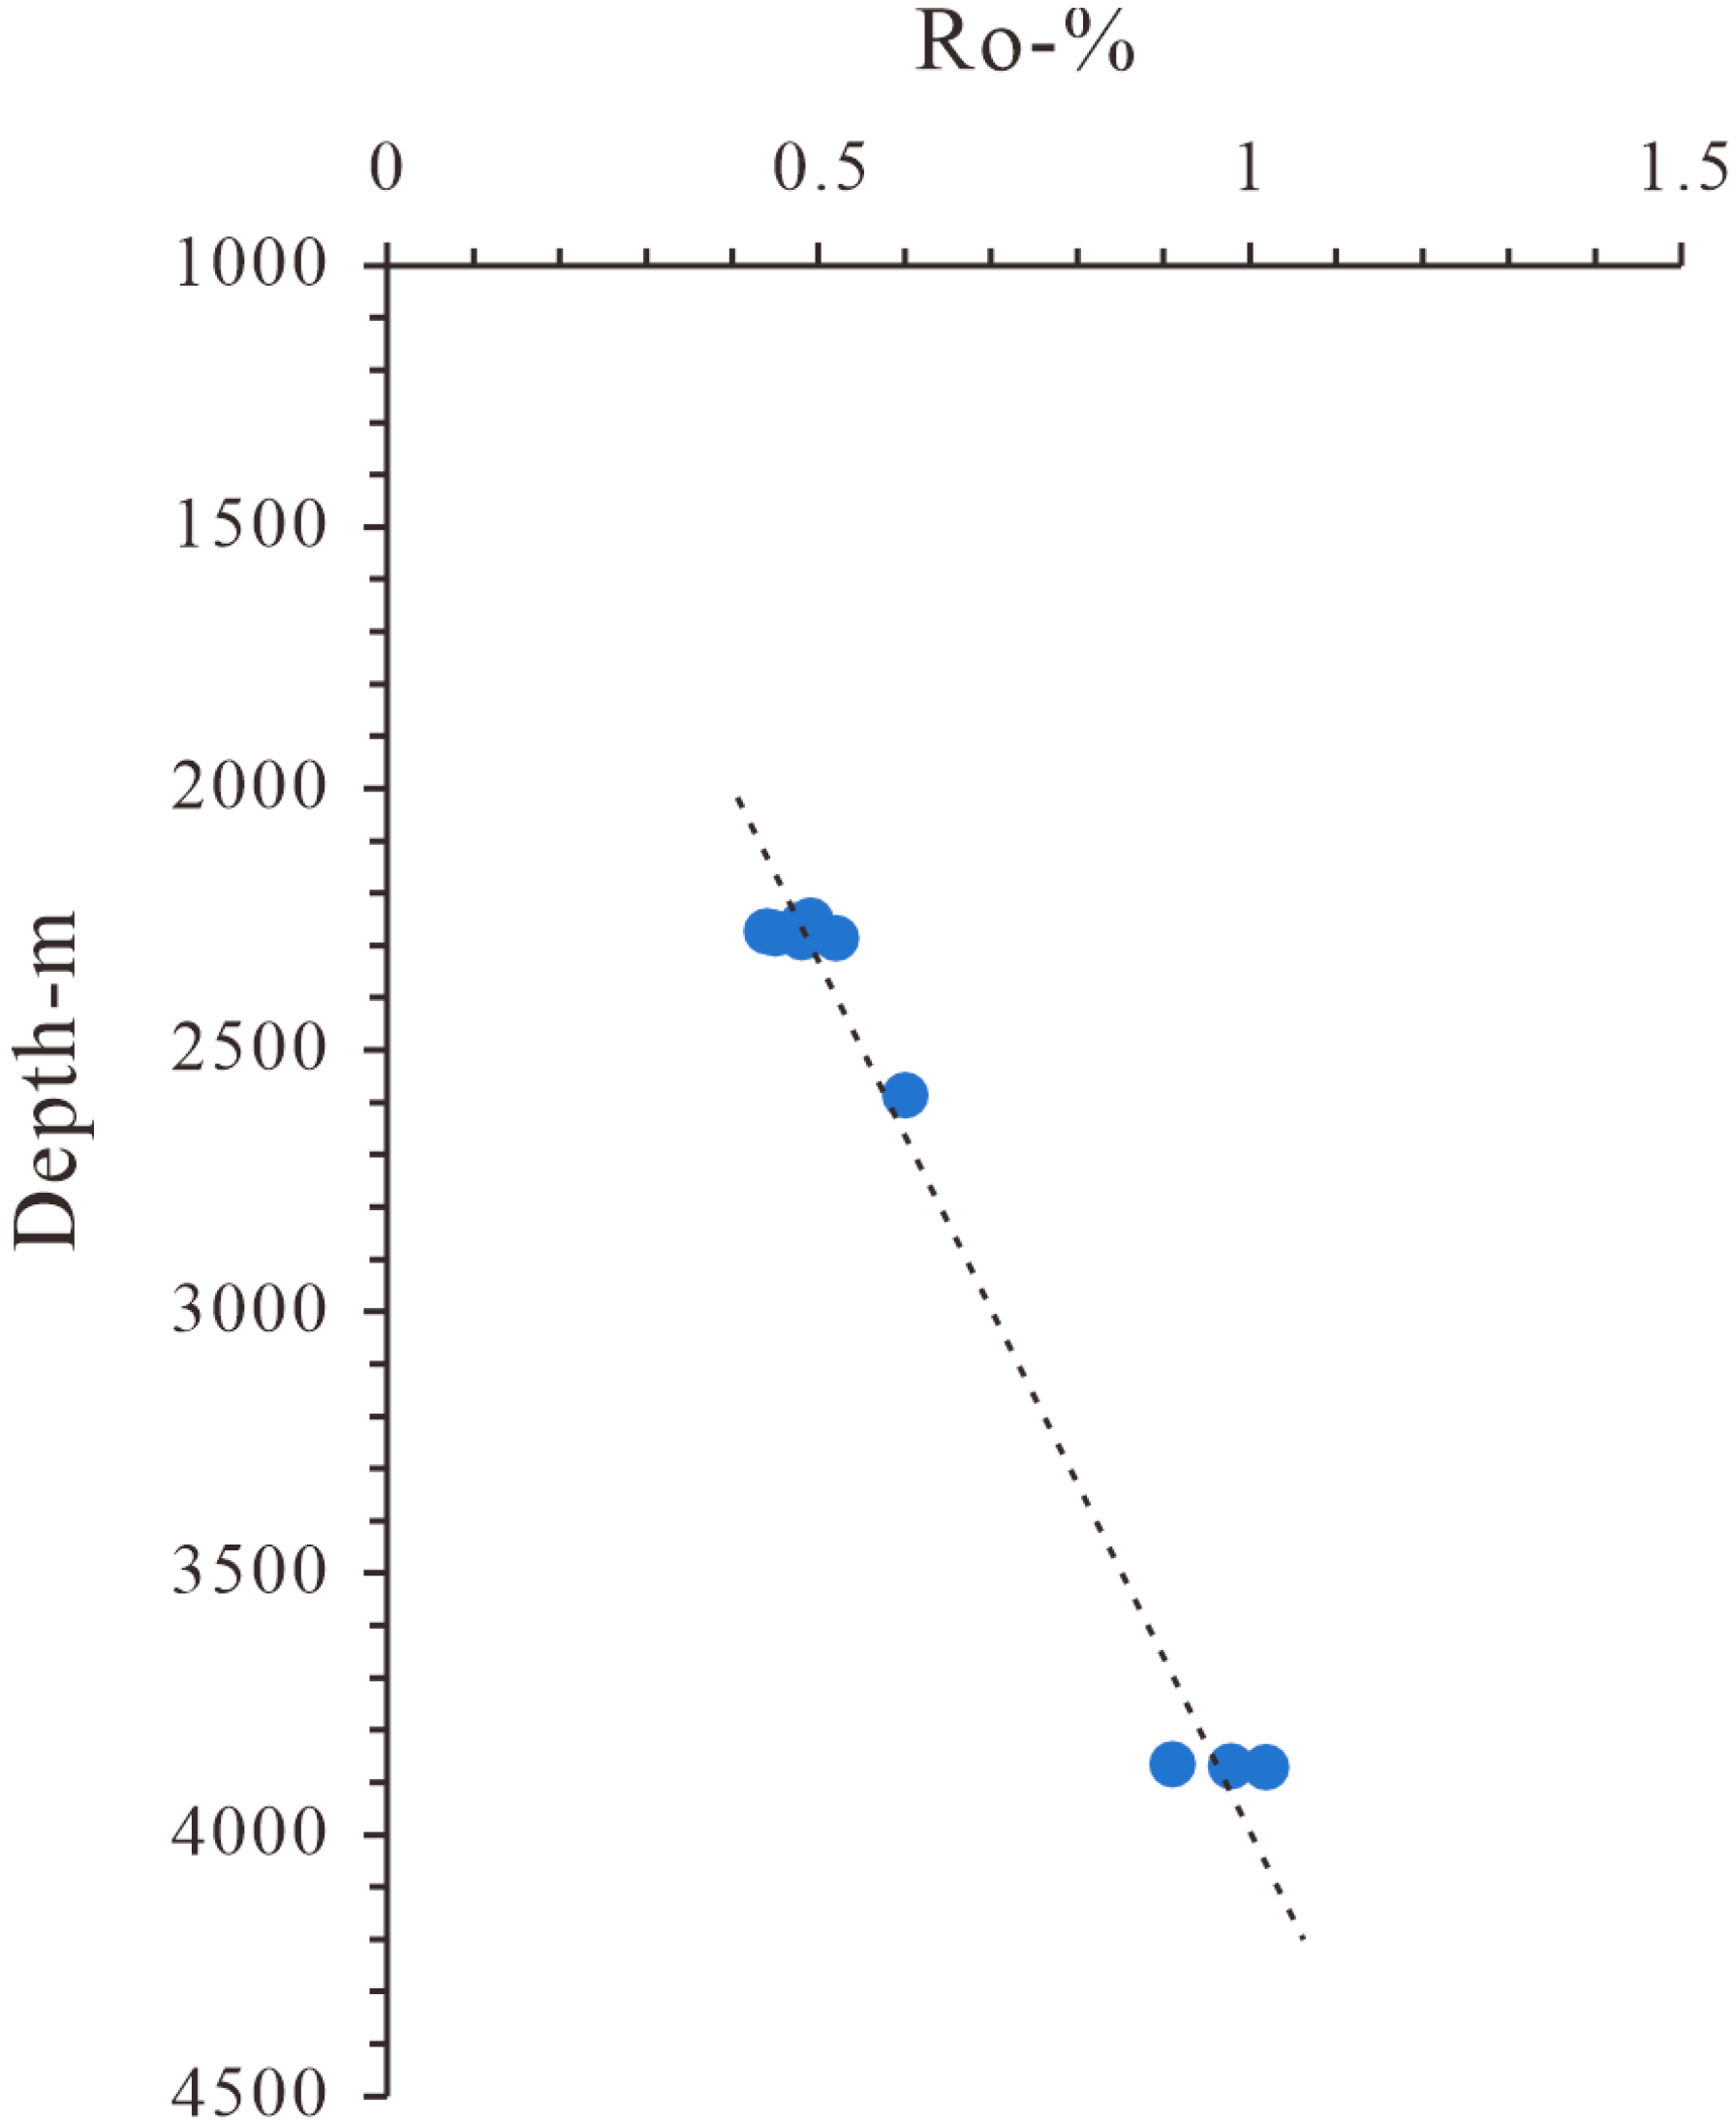
During the Yanshanian period, strong compressional and thrust-related deformation further intensified the lateral heterogeneity in source rock burial and preservation. Different segments experienced varying degrees of uplift and thrusting, resulting in significant differences in source rock burial depth, thermal maturity, and hydrocarbon generation potential. For example, source rock samples from the base of the Ordovician strata in Well YT2 show a vitrinite reflectance (Ro) of only 1.0%, indicating that they have not yet reached the gas generation window—significantly lower than equivalent strata in other parts of the study area (Figure 7). This can be attributed to intense thrust-related uplift in this region, which limited burial depth and thermal evolution, thereby restricting hydrocarbon generation.
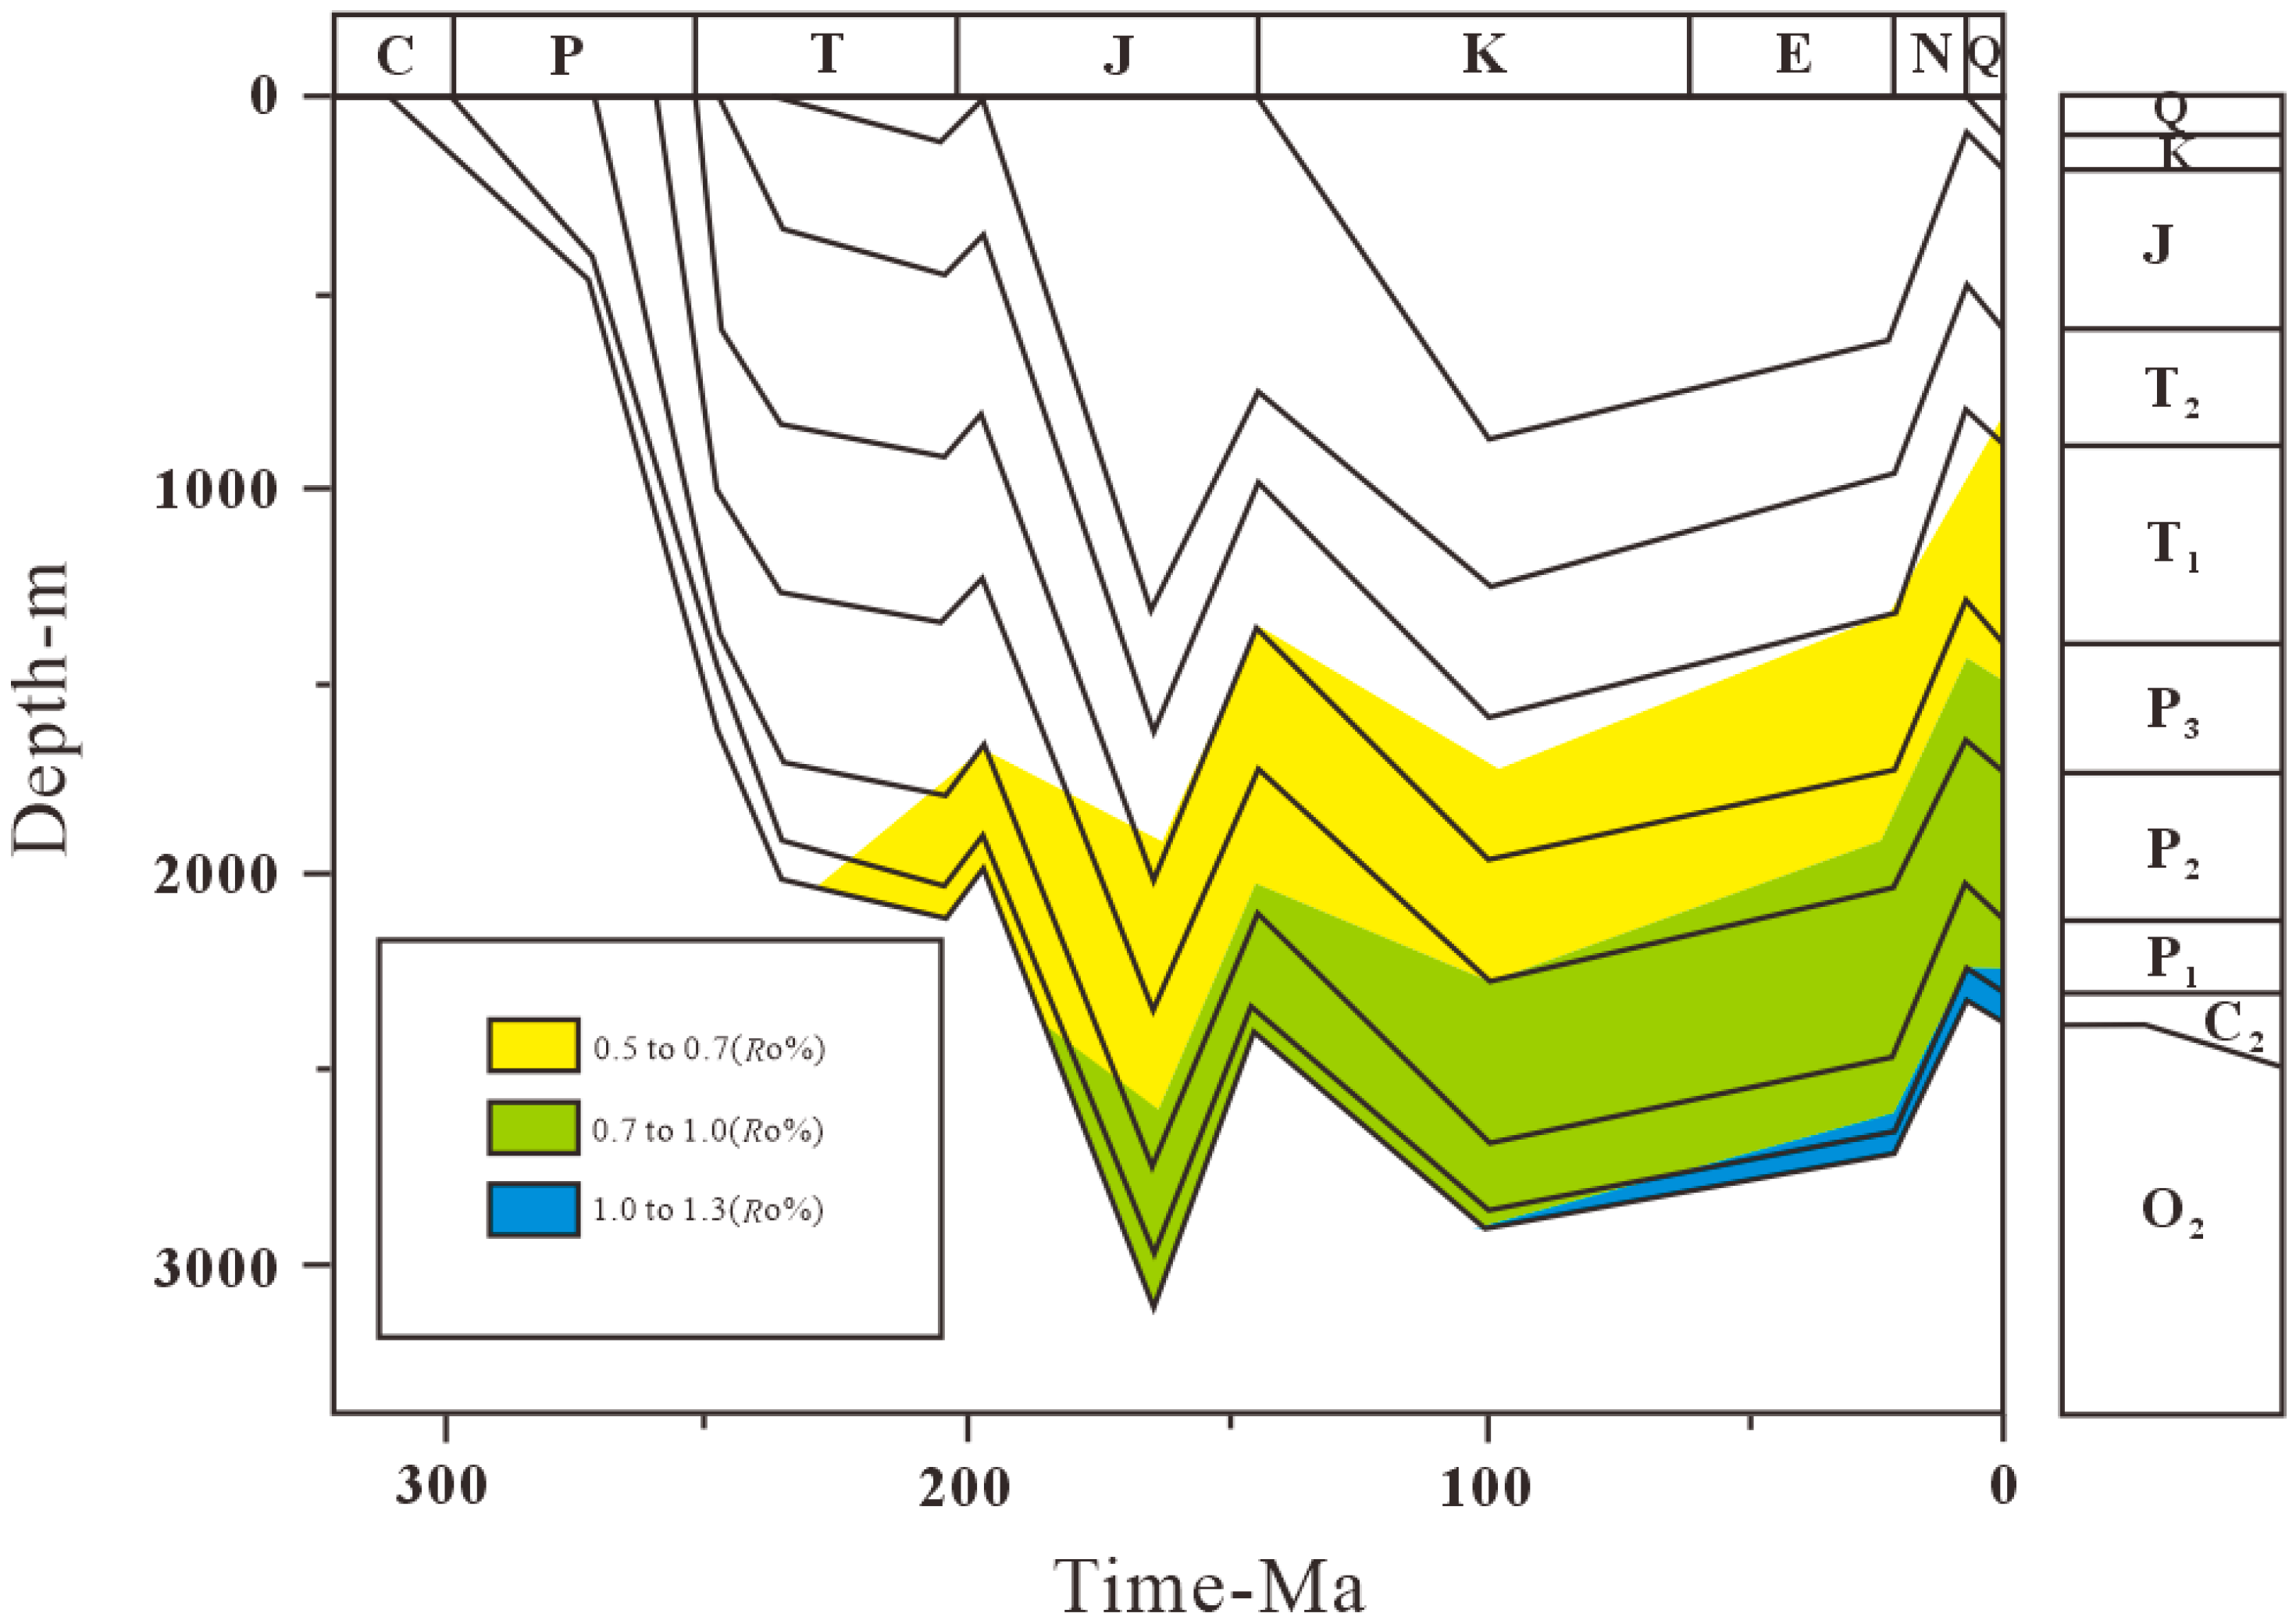
In terms of thermal evolution, both Mesozoic and Upper Paleozoic source rocks underwent a similar two-stage hydrocarbon generation process [9]. The first stage occurred mainly during the Middle–Late Triassic and peaked in the Late Jurassic, but hydrocarbons generated during this phase were often destroyed by intense uplift and tectonic compression in the Late Jurassic. The second stage began in the Early Cretaceous, when the region experienced long-term and substantial tectonic subsidence, allowing source rocks to become further buried and mature. This phase not only featured stronger hydrocarbon generation but also showed better temporal and spatial coupling with trap formation, making it the most critical period for hydrocarbon generation and accumulation—potentially continuing in some areas to the present day (Figure 8).
In summary, tectonic uplift has played a decisive role in the evolution of the hydrocarbon system in this region. Uplift can disrupt the burial and thermal evolution of source rocks, reducing their hydrocarbon generation potential, and may also lead to the escape of already generated hydrocarbons or the destruction of structural traps, ultimately hindering hydrocarbon accumulation.

6. Conclusions

(1)
Thermochronological and thermal modeling results from the study area reveal a complex, multi-stage exhumation history strongly influenced by both local fault systems and regional geodynamic processes. The ages reflect early deep burial and thermal events associated with Variscan and Qinling–Qilian tectonism. During the Mesozoic, the Yanshanian Orogeny triggered fault reactivation and differential uplift, with the western fault block (YT1) exhuming earlier and more rapidly than the eastern block (YT2, YT3), forming a pattern of tectonic uplift propagating from the basin margin toward the interior. In the Cenozoic, renewed exhumation and rapid cooling, especially after the Early Miocene, correlate with the far-field compressional effects of the Himalayan Orogeny and the uplift of the Tibetan Plateau. The fault system served as a conduit for stress transmission and a key control on the timing and rate of exhumation.
(2)
Thermal history reconstruction indicates that the study area reached its maximum burial and thermal maturity during the Late Jurassic, followed by a phase of significant exhumation. This timing coincides with the peak hydrocarbon generation for both Paleozoic and Mesozoic source rocks. However, the subsequent uplift and erosion—initiated in the Late Jurassic and intensified during later tectonic phases—led to the partial destruction of source rock continuity, deterioration of burial conditions, and potential hydrocarbon loss. Spatial variations in uplift intensity further resulted in uneven maturation levels and hydrocarbon generation capacity across different fault blocks. In the Yindongzi area, strong thrust-related uplift during the Yanshanian deformation inhibited source rock maturation, as evidenced by relatively low vitrinite reflectance values in some wells.
Collectively, the spatially variable uplift patterns, asynchronous cooling histories, and their direct influence on hydrocarbon generation and preservation highlight the segmented and stepwise tectonic response of the Ordos Basin margin to both proximal and distal geodynamic forces. These findings provide new insights into intracontinental deformation processes and their implications for petroleum systems in the interior of the Eurasian plate.

Author Contributions

Writing original draft, conceptualization, methodology, writing review editing, software, resources, data curation, formal analysis, G.X.; conceptualization, methodology, investigation, resources, writing—review and editing, supervision, project administration, funding acquisition, Z.R.; writing original draft, writing review editing, K.Q.; investigation, L.F.; investigation, J.C.; methodology, J.L., S.G. and Z.H. All authors have read and agreed to the published version of the manuscript.

Funding

Financial support for this study was jointly provided by the PetroChina Changqing Oilfield Company Science and Technology Major Projects “Research on Tectonic-Sedimentary Environment, Hydrocarbon Accumulation Conditions and Favorable Exploration Zones in the Deep Strata of Ordos Basin” (2024D1JC06) and the China Postdoctoral Science Foundation (2022M712568).

Data Availability Statement

The data that support the findings of this study are available from the corresponding author upon reasonable request.

Conflicts of Interest

Authors Liyong Fan and Jinbu Li were employed by the Exploration and Development Research Institute of PetroChina Changqing Oilfield Company. The remaining authors declare that the research was conducted in the absence of any commercial or financial relationships that could be construed as a potential conflict of interest.

References

  1. Xi, S.; Mo, W.; Liu, X.; Zhang, L.; Li, J.; Huang, Z.; Wang, M.; Zhang, C.; Zhu, Q.; Yan, Y.; et al. Shale gas exploration potential of the Ordovician Wulalike Formation in the western margin of the Ordos Basin: A case study of Zhongping 1 Well. Nat. Gas Geosci. 2021, 32, 1235–1246. [Google Scholar]
  2. Xing, G.Y.; Ren, Z.L.; Qi, K.; Guo, S.S.; Liu, Y.Z. Low-temperature thermochronologic analysis and geologic significance of the northern part of the western margin of the Ordos Basin: A case study of the Moergou profile in the Zhuozishan area, Inner Mongolia, China. Geol. J. 2024, 60, 871–882. [Google Scholar]
  3. Kapp, P.; DeCelles, P.G.; Gehrels, G.E.; Heizler, M.; Ding, L. Geological records of the lhasa-qiangtang and indo-asian collisions in the Nima area of central Tibet. Geol. Soc. Am. Bull. 2007, 119, 917–933. [Google Scholar] [CrossRef]
  4. Ren, Z.L.; Tian, T.; Li, J.B.; Wang, J.P.; Cui, J.P.; Li, H.; Tang, J.Y.; Guo, K. Research methods for thermal evolution history of sedimentary basins and progress in reconstructing thermal evolution history of overlapping basins. J. Earth Sci. Environ. 2014, 36, 1–20. [Google Scholar]
  5. Peng, H.; Wang, J.Q.; Liu, C.Y.; Zhang, S.H.; Zattin, M.; Wu, N.; Feng, Q. Thermochronological constraints on the Meso-Cenozoic tectonic evolution of the Haiyuan–Liupanshan region, northeastern Tibetan Plateau. J. Asian Earth Sci. 2019, 183, 103966. [Google Scholar] [CrossRef]
  6. Peng, H.; Wang, J.; Liu, C.; Zhao, H.; Huang, L.; Zhao, X.; Zhang, S.; Liang, C.; Wang, Z.; Catto, S.; et al. Long-term and multiple stage exhumation of the Ordos Basin, western North China Craton: Insights from seismic reflection, borehole and geochronological data. Earth-Sci. Rev. 2023, 238, 104349. [Google Scholar] [CrossRef]
  7. Sweeney, J.J.; Burnham, A.K. Evaluation of a simple model of vitrinite reflectance based on chemical kinetics. AAPG Bull. 1990, 74, 1559–1570. [Google Scholar] [CrossRef]
  8. Ren, Z.L. Study on the geothermal history of the Ordos Basin using the apatite fission track method. Chin. J. Geophys. 1995, 38, 339–349. [Google Scholar]
  9. Ren, Z.L.; Zhang, S.; Gao, S.L.; Cui, J.P.; Xiao, Y.Y.; Xiao, H. Tectonic thermal evolution history of the Ordos Basin and its significance for accumulation and mineralization. Sci. China Ser. D Earth Sci. 2007, 9, 23–32. [Google Scholar]
  10. Ren, Z.L.; Qi, K.; Liu, R.C.; Cui, J.P.; Chen, Z.P.; Zhang, Y.Y.; Yang, G.L.; Ma, Q. The dynamical background of Early Cretaceous tectonic thermal events in the Ordos Basin and their control on the accumulation periods of various minerals, including oil and gas. Acta Petrol. Sin. 2020, 36, 1213–1234. [Google Scholar]
  11. Ren, Z.L.; Cui, J.P.; Qi, K.; Yang, P.; Liu, X.S.; Zhang, C.L.; Yang, G.L.; Gao, Y.F.; Zhang, Y.; Xing, G.Y. New advances in the theoretical research and methods for restoring the thermal evolution history of deep and ultra-deep layers in overlapping basins. J. Northwest Univ. (Nat. Sci. Ed.) 2022, 52, 910–929. [Google Scholar]
  12. Ketcham, R.A. Forward and inverse modeling of low-temperature thermochronometry data. Rev. Mineral. Geochem. 2005, 58, 275–314. [Google Scholar] [CrossRef]
  13. Hasebe, N.; Barbarand, J.; Jarvis, K.; Carter, A.; Hurford, A.J. Apatite fission-track chronometry using laser ablation ICP-MS. Chem. Geol. 2004, 207, 135–145. [Google Scholar] [CrossRef]
  14. Dunkl, I. Trackkey: A Windows program for calculation and graphical presentation of fission track data. Comput. Geosci. 2002, 28, 3–12. [Google Scholar] [CrossRef]
  15. Flowers, R.M.; Farley, K.A.; Ketcham, R.A. A reporting protocol for thermochronologic modeling illustrated with data from the Grand Canyon. Earth Planet. Sci. Lett. 2015, 432, 425–435. [Google Scholar] [CrossRef]
  16. Vermeesch, P. RadialPlotter: A Java application for fission track, luminescence and other radial plots. Radiat. Meas. 2009, 44, 409–410. [Google Scholar] [CrossRef]
  17. Zhao, H.G.; Liu, C.Y.; Yao, Y.M.; Wang, F.; Yin, Y. Fission track evidence of differential uplift in the western Ordos Basin. J. Northwest Univ. (Nat. Sci. Ed.) 2007, 3, 470–474. [Google Scholar]
  18. Vassallo, R.; Jolivet, M.; Ritz, J.-F.; Braucher, R.; Larroque, C.; Sue, C.; Todbileg, M.; Javkhlanbold, D. Uplift age and rates of the Gurvan Bogd system (Gobi-Altay) by apatite fission track analysis. Earth Planet. Sci. Lett. 2007, 259, 333–346. [Google Scholar] [CrossRef]
  19. Donelick, R.A.; O’Sullivan, P.B.; Ketcham, R.A. Apatite fission-track analysis. Rev. Mineral. Geochem. 2005, 58, 49–94. [Google Scholar] [CrossRef]
  20. Farley, K.A.; Wolf, R.A.; Silver, L.T. The effects of long alpha-stopping distances on (U-Th)/He ages. Geochim. Cosmochim. Acta 1996, 60, 4223–4229. [Google Scholar] [CrossRef]
  21. Ketcham, R.A.; Carter, A.; Donelick, R.A.; Barbarand, J.; Hurford, A.J. Improved modeling of fission-track annealing in apatite. Am. Mineral. 2007, 92, 799–810. [Google Scholar] [CrossRef]
  22. Carlson, W.D.; Donelick, R.A.; Ketcham, R.A. Variability of apatite fission-track annealing kinetics: I. Experimental results. Am. Mineral. 1999, 84, 1213–1223. [Google Scholar] [CrossRef]
  23. Barbarand, J.; Carter, A.; Wood, I.; Hurford, T. Compositional and structural control of fission-track annealing in apatite. Chem. Geol. 2003, 198, 107–137. [Google Scholar] [CrossRef]
  24. Gautheron, C.; Tassan-Got, L.; Barbarand, J.; Pagel, M. Effect of alpha-damage annealing on apatite (U–Th)/He thermochronology. Chem. Geol. 2009, 266, 157–170. [Google Scholar] [CrossRef]
  25. George, A.D.; Marshallsea, S.J.; Wyrwoll, K.-H.; Jie, C.; Yanchou, L. Miocene cooling in the northern Qilian Shan, northeastern margin of the Tibetan Plateau, revealed by apatite fission-track and vitrinite-reflectance analysis. Geology 2001, 29, 939–942. [Google Scholar] [CrossRef]
  26. Gleadow, A.; Duddy, I.; Green, P.F.; Lovering, J. Confined fission track lengths in apatite: A diagnostic tool for thermal history analysis. Contr. Miner. Petrol. 1986, 94, 405–415. [Google Scholar] [CrossRef]
  27. Gleadow, A.; Duddy, I.; Lovering, J. Fission track analysis: A new tool for the evaluation of thermal histories hydrocarbon potential. APPEA J. 1983, 23, 93–102. [Google Scholar] [CrossRef]
  28. Laslett, G.; Green, P.F.; Duddy, I.; Gleadow, A. Thermal annealing of fission tracks in apatite 2. A quantitative analysis. Chem. Geol. Isot. Geosci. Sect. 1987, 65, 1–13. [Google Scholar] [CrossRef]
  29. Hurford, A.J. Standardization of fission track dating calibration: Recommendation by the Fission Track Working Group of the IUGS Subcommission on Geochronology. Chem. Geol. Isot. Geosci. Sect. 1990, 80, 171–178. [Google Scholar] [CrossRef]
  30. Hurford, A.J.; Green, P.F. The zeta age calibration of fission-track dating. Chem. Geol. 1983, 41, 285–317. [Google Scholar] [CrossRef]
  31. Perotti, M.; Andreucci, B.; Talarico, F.; Zattin, M.; Langone, A. Multianalytical provenance analysis of Eastern Ross Sea LGM till sediments (Antarctica): Petrography, geochronology, and thermochronology detrital data. Geochem. Geophys Geosyst. 2017, 18, 2275–2304. [Google Scholar] [CrossRef]
  32. Peng, H.; Ding, L.; Liu, C.Y.; Zattin, M.; Wang, L.C. Middle Triassic transcontinental connection between the North China Craton and the Paleo-Tethys Ocean. Commun. Earth Environ. 2024, 5, 775. [Google Scholar] [CrossRef]
  33. Wang, W.; Zhao, Y.; Liu, X.C.; Hu, J.M.; Wei, C.J.; Xiao, W.J.; Du, J.X.; Wang, S.L.; Zhan, L.Q. Metamorphism of diverse basement gneisses of the Ordos Basin: Record of multistage Paleoproterozoic orogenesis and constraints on the evolution of the western North China Craton. Precambrian Res. 2019, 328, 48–63. [Google Scholar] [CrossRef]
  34. Darby, B.J.; Ritts, B.D. Mesozoic contractional deformation in the middle of the Asian tectonic collage: The intraplate Western Ordos fold–thrust belt, China. Earth Planet. Sci. Lett. 2002, 205, 13–24. [Google Scholar] [CrossRef]
  35. Sun, J.P.; Dong, Y.P.; Zhao, J.F.; Chen, Q. Carboniferous to Triassic polyphase tectonic transition in the western North China craton: A retroarc basin response to termination of the middle segment of the Paleo-Asian Ocean. Geol. Soc. Am. Bull. 2024, 136, 4149–4174. [Google Scholar] [CrossRef]
  36. Faure, M.; Lin, W.; Chen, Y. Is the Jurassic (Yanshanian) intraplate tectonics of North China due to westward indentation of the North China block? Terra Nova 2012, 24, 456–466. [Google Scholar] [CrossRef]
  37. Gallagher, K. Transdimensional inverse thermal history modeling for quantitative thermochronology. J. Geophys. Res. Solid Earth 2012, 117, B02401. [Google Scholar] [CrossRef]
  38. Darby, B.J.; Ritts, B.D. Mesozoic structural architecture of the Lang Shan, North-Central China: Intraplate contraction, extension, and synorogenic sedimentation. J. Struct. Geol. 2007, 29, 2006–2016. [Google Scholar] [CrossRef]
  39. Liu, S.F. The coupling mechanism of basin and orogen in the western Ordos Basin and adjacent regions of China. J. Asian Earth Sci. 1998, 16, 369–383. [Google Scholar] [CrossRef]
  40. Zhang, J.; Yun, L.; Zhang, B.H.; Qu, J.F.; Zhao, H.; Hui, J.; Wang, Y.N.; Zhang, Y.P. Deformation at the easternmost Altyn Tagh Fault: Constraints on the growth of the northern Qinghai–Tibetan Plateau. Acta Geol. Sin. (Engl. Ed.) 2020, 94, 988–1006. [Google Scholar] [CrossRef]
  41. Wang, T.; Guo, L.; Zheng, Y.; Donskaya, T.; Gladkochub, D.; Zeng, L.; Li, J.; Wang, Y.; Mazukabzov, A. Timing and processes of late Mesozoic mid–lower-crustal extension in continental NE Asia and implications for the tectonic setting of the destruction of the North China Craton: Mainly constrained by zircon U–Pb ages from metamorphic core complexes. Lithos 2012, 154, 315–345. [Google Scholar] [CrossRef]
  42. Zhang, J.; Wang, Y.N.; Qu, J.F.; Zhang, B.H.; Zhao, H.; Yun, L. Mesozoic intracontinental deformation of the Alxa Block in the middle part of Central Asian Orogenic Belt: A review. Int. Geol. Rev. 2021, 63, 1490–1520. [Google Scholar] [CrossRef]
  43. Zhang, J.; Cunningham, D.; Qu, J.F.; Zhang, B.H.; Li, J.Y.; Zhao, H.; Niu, P.F.; Hui, J.; Yun, L.; Zhao, S.; et al. Poly-phase structural evolution of the northeastern Alxa Block, China: Constraining the Paleozoic–Recent history of the southern Central Asian Orogenic Belt. Gondwana Res. 2022, 105, 25–50. [Google Scholar] [CrossRef]
  44. Duvall, A.R.; Clark, M.K.; Kirby, E.; Farley, K.A.; Craddock, W.H.; Li, C.; Yuan, D.Y. Low-temperature thermochronometry along the Kunlun and Haiyuan Faults, NE Tibetan Plateau: Evidence for kinematic change during late-stage orogenesis. Tectonics 2013, 32, 1190–1211. [Google Scholar] [CrossRef]
  45. England, P.; Molnar, P. Right-lateral shear and rotation as the explanation for strike-slip faulting in eastern Tibet. Nature 1990, 344, 140. [Google Scholar] [CrossRef]
  46. Gehrels, G.E.; Yin, A.; Wang, X.-F. Magmatic history of the northeastern Tibetan Plateau. J. Geophys. Res. Solid Earth 2003, 108. [Google Scholar] [CrossRef]
  47. Craddock, W.; Kirby, E.; Zhang, H.P. Late Miocene-Pliocene range growth in the interior of the northeastern Tibetan Plateau. Lithosphere 2011, 3, 420–438. [Google Scholar] [CrossRef]
  48. England, P.; Houseman, G. Finite strain calculations of continental deformation: Comparison with the India-Asia collision zone. J. Geophys. Res. Solid Earth 1986, 91, 3664–3676. [Google Scholar] [CrossRef]
  49. Tapponnier, P.; Peltzer, G.; Le Dain, A.Y.; Armijo, R.; Cobbold, P. Propagating extrusion tectonics in Asia: New insights from simple experiments with plasticine. Geology 1982, 10, 611–616. [Google Scholar] [CrossRef]
  50. Tapponnier, P.; Zhiqin, X.; Roger, F.; Meyer, B.; Arnaud, N.; Wittlinger, G.; Jingsui, Y. Oblique stepwise rise and growth of the Tibet Plateau. Science 2001, 294, 1671–1677. [Google Scholar] [CrossRef]
  51. Lease, R.O.; Burbank, D.W.; Hough, B.; Wang, Z.C.; Yuan, D.Y. Pulsed Miocene range growth in northeastern Tibet: Insights from Xunhua Basin magnetostratigraphy and provenance. GSA Bull. 2012, 124, 657–677. [Google Scholar] [CrossRef]
  52. Lease, R.O.; Burbank, D.W.; Clark, M.K.; Farley, K.A.; Zheng, D.W.; Zhang, H.P. Middle Miocene reorganization of deformation along the northeastern Tibetan Plateau. Geology 2011, 39, 359–362. [Google Scholar] [CrossRef]
  53. Bernet, M.; Garver, J.I. Fission-track analysis of detrital zircon. Rev. Mineral. Geochem. 2005, 58, 205–237. [Google Scholar] [CrossRef]
  54. Bernet, M.; Van Der Beek, P.; Pik, R.; Huyghe, P.; Mugnier, J.; Labrin, E.; Szulc, A. Miocene to Recent exhumation of the central Himalaya determined from combined detrital zircon fission-track and U/Pb analysis of Siwalik sediments, western Nepal. Basin Res. 2006, 18, 393–412. [Google Scholar] [CrossRef]
  55. Bertrand, A.; Rosenberg, C.; Rabaute, A.; Herman, F.; Fügenschuh, B. Exhumation mechanisms of the Tauern Window (Eastern Alps) inferred from apatite and zircon fission track thermochronology. Tectonics 2017, 36, 207–228. [Google Scholar] [CrossRef]
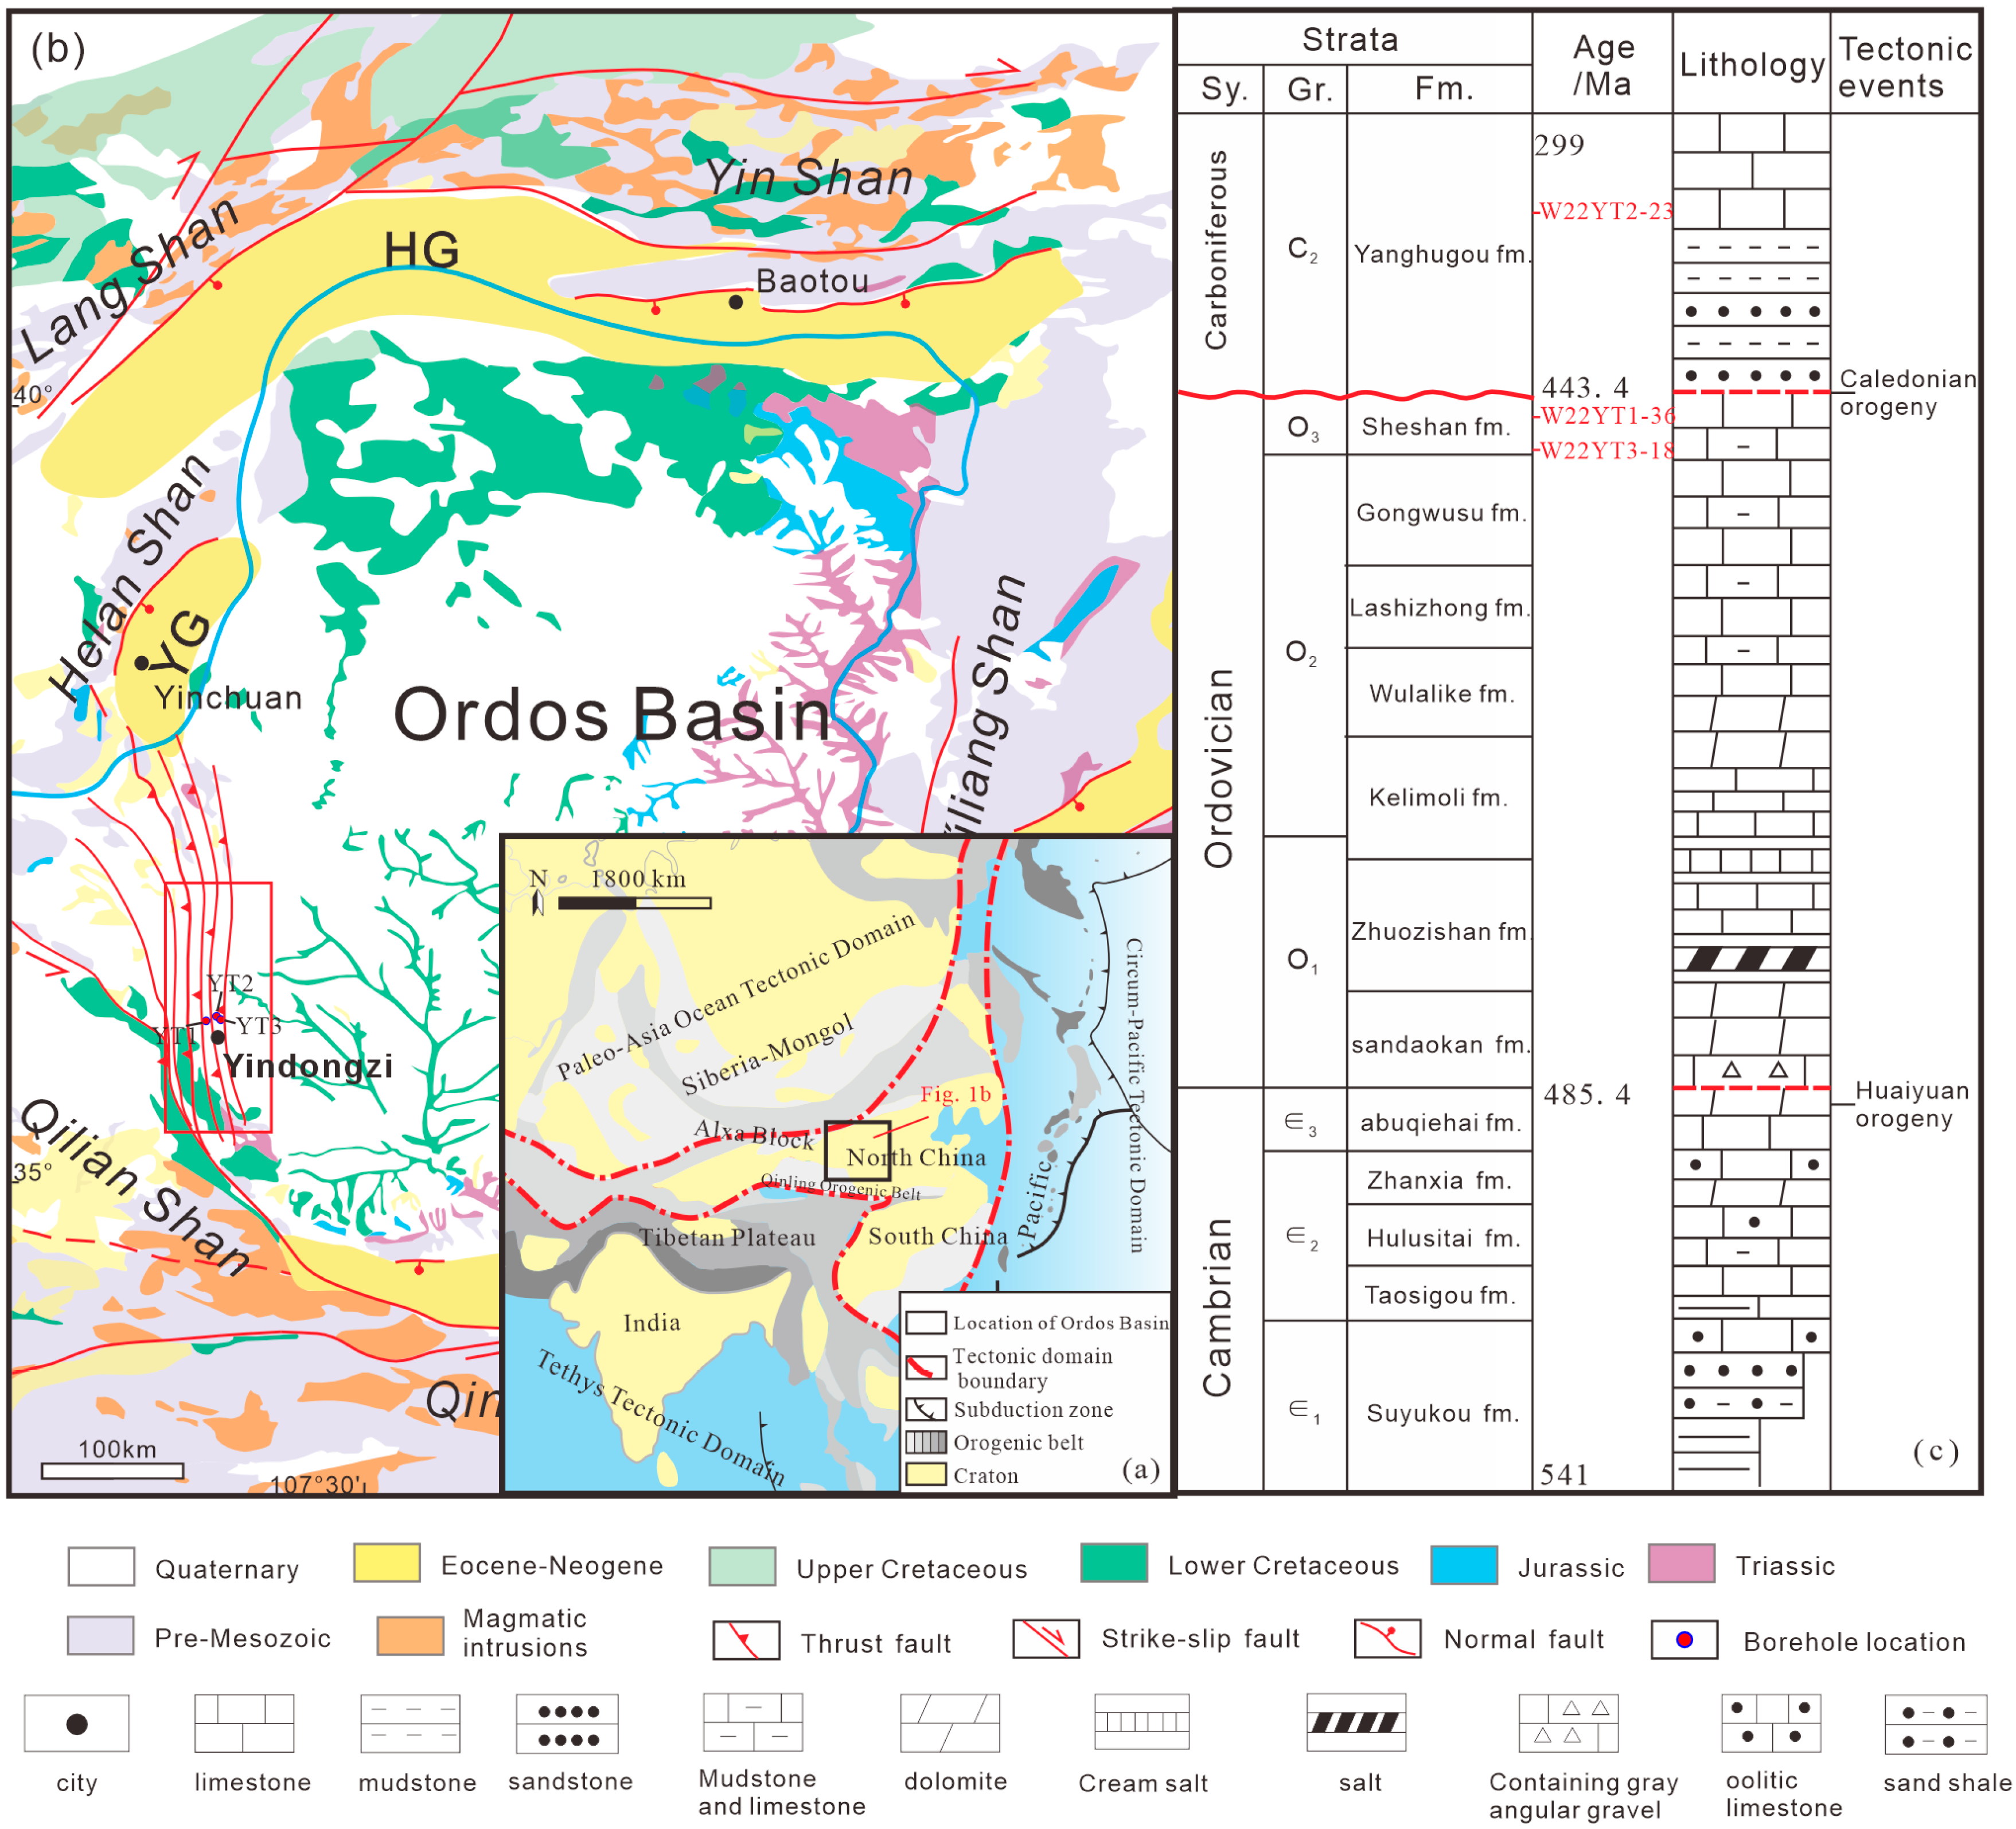
Figure 1. (a) Tectonic setting of China (modified from Peng et al. 2019 [5]), (b) Geological map of the Ordos Basin (modified from Peng et al. 2023 [6]) and the study area, (c) Stratigraphic units, simplified lithological column, and main evolution stages of the Ordos Basin.
Minerals 15 00893 g001
Figure 2. Sample locations in this study.
Minerals 15 00893 g002
Figure 3. Borehole photograph showing the fracture development of the samples. (a) W22YT1-36; (b) W22YT2-23; (c) W22YT3-18.
Minerals 15 00893 g003
Figure 4. AFT age Radial plots for samples.
Minerals 15 00893 g004
Figure 5. Thermal history inverse modeling calculated by HeFTy [12], using the annealing model of Ketcham et al. (2007) [21]. HeFTy modeling tests possible t-T curves by using the Monte–Carlo search method.
Minerals 15 00893 g005
Figure 6. Dynamic model diagram of the study area. The direction of the arrows represents the orientation of the applied stress, respectively (Modified from Peng et al. 2023 [6]). NQOB—Qinling Orogenic Belt.
Minerals 15 00893 g006
Figure 7. Vitrinite reflectance (Ro) vs. depth curve for Well YT2.
Minerals 15 00893 g007
Figure 8. Simulation diagram of the buried history and thermal history of YT2 well.
Minerals 15 00893 g008
Table 1. Sample information and summary of geochronology methods used.
Sample NO.Well of SamplesFormationLithologyDepth (m)Methods
W22YT1-36YT1O3Sandstone1206AFT, Ahe, ZHe
W22YT2-23YT2C2Sandstone2572.5AFT, Ahe, ZHe
W22YT3-18YT3O3Sandstone2310AFT, ZHe
Table 2. Fission-track age obtained by the LA-ICP method.
SamplenNsΡs (×106/cm2)238U(×10−6)Central age(Ma)P(χ2) (%)MTL(μm) (N)Dpar (μm)
W22YT1-36154682.7837.89 ± 8.52153.1 ± 6.690 1.42 ± 0.18
W22YT2-23165611.4923.33 ± 6.64165.2 ± 9.5012.09 ± 1.84(96)1.46 ± 0.18
W22YT3-181914512.0238.69 ± 4.64148.7 ± 33311.63 ± 1.02(89)1.41 ± 0.19
Note: n: number of measured grains; ρs (Ns): spontaneous track densities (track numbers measured); P (%): probability of obtaining χ2-test value, a probability >5% is indicative of a homogenous population; MTL: mean confined track lengths with c-axis correction.
Table 3. Borehole YT1 and YT2 apatite (U-Th)/He data.
SampleMass (ug)Rs (um)U (ppm)Th (ppm)Th/U[eU] (ppm)mol 4HeStd. mol 4HeFTCor Age (Ma)±σ (Ma)
W22YT1-36-A12.16 45.8 6.6 14.3 2.2 10.0 2.4595 × 10−153.2348 × 10−170.69830.32 1.66
W22YT1-36-A21.52 39.7 48.6 24.9 0.5 54.5 2.4486 × 10−143.0208 × 10−160.66782.38 4.40
W22YT1-36-A31.49 40.1 5.4 16.3 3.1 9.2 3.3023 × 10−167.3221 × 10−180.6566.80 0.39
W22YT1-36-A40.95 34.0 33.5 48.5 1.5 44.9 8.9168 × 10−151.0279 × 10−160.60963.78 3.37
W22YT2-23-A15.92 63.0 8.9 18.3 2.1 13.2 6.4588 × 10−158.3110 × 10−170.77519.78 1.08
W22YT2-23-A23.73 53.8 18.2 57.2 3.2 31.7 1.1963 × 10−141.3943 × 10−160.73525.54 1.34
W22YT2-23-A34.55 56.6 11.9 39.4 3.4 21.1 3.9245 × 10−161.0533 × 10−170.7461.02 0.06
Note: Rs, equivalent spherical radius; eU, effective uranium concentration; FT, α-ejection correction factor; Cor. Age, AHe age with α-ejection correction.
Table 4. Borehole YT1, YT2 and YT3 zircon (U-Th)/He data.
SampleMass (ug)Rs (um)U (ppm)Th (ppm)Th/U[eU] (ppm)mol 4HeStd. mol 4HeFTCor Age (Ma)±σ (Ma)
W22YT1-36-Z13.12 49.1 134.8 67.8 0.5 150.7 6.5955 × 10−138.0422 × 10−150.766334.37 17.96
W22YT1-36-Z23.32 45.1 595.3 121.1 0.2 623.8 3.1607 × 10−123.3923 × 10−140.753369.39 19.54
W22YT1-36-Z35.05 48.3 265.1 135.9 0.5 297.0 2.4956 × 10−123.0324 × 10−140.768393.98 20.86
W22YT1-36-Z45.31 55.5 212.7 187.5 0.9 256.8 1.8997 × 10−122.3433 × 10−140.791321.72 16.97
W22YT2-23-Z13.02 41.7 141.9 128.5 0.9 172.1 1.5036 × 10−121.8233 × 10−140.728710.40 37.65
W22YT2-23-Z25.12 524.0 88.2 37.1 0.4 96.9 6.7461 × 10−138.0519 × 10−150.783317.29 17.08
W22YT2-23-Z34.57 49.2 315.9 145.7 0.5 350.1 1.7803 × 10−122.2193 × 10−140.769265.41 14.12
W22YT3-18-Z12.85 40.2 203.7 169.1 0.9 243.5 1.1088 × 10−121.3392 × 10−140.718405.24 21.41
W22YT3-18-Z23.66 44.8 0.2 0.4 2.1 0.3 4.7691 × 10−189.3979 × 10−180.741.20 2.38
W22YT3-18-Z32.41 41.1 450.4 134.6 0.3 482.0 1.9361 × 10−122.4102 × 10−140.727416.86 22.14
Note: Rs, equivalent spherical radius; eU, effective uranium concentration; FT, α-ejection correction factor; Cor. Age, AHe age with α-ejection correction.
Disclaimer/Publisher’s Note: The statements, opinions and data contained in all publications are solely those of the individual author(s) and contributor(s) and not of MDPI and/or the editor(s). MDPI and/or the editor(s) disclaim responsibility for any injury to people or property resulting from any ideas, methods, instructions or products referred to in the content.