Article

Multifactorial Controls on Carbonate–Clastic Sedimentation in Rift Basins: Integrated Foraminiferal, Sequence Stratigraphic, and Petrophysical Analysis, Gulf of Suez, Egypt

1
Geology Department, Faculty of Science for Boys, Al-Azhar University, Nasr City 11884, Cairo, Egypt
2
Department of Mathematics and Statistics, College of Science, Imam Mohammad Ibn Saud Islamic University (IMSIU), Riyadh 11432, Saudi Arabia
3
Ente Nazionale Idrocarburi (Eni) Petroleum Corporation, New Cairo 11865, Cairo, Egypt
*
Author to whom correspondence should be addressed.
Minerals 2025, 15(8), 864; https://doi.org/10.3390/min15080864
Submission received: 22 July 2025 / Revised: 12 August 2025 / Accepted: 12 August 2025 / Published: 15 August 2025
(This article belongs to the Section Mineral Geochemistry and Geochronology)

Abstract

The lithological dichotomy in the Hammam Faraun Member (Gulf of Suez, Egypt) reveals a stable western flank with Nullipore carbonate deposits, contrasting with the clastic-prone eastern margin influenced by tectonic activity. This study aims to decipher multifactorial controls on spatial lithological variability and reservoir implications through (1) foraminiferal-based paleoenvironmental reconstruction; (2) integrated sequence stratigraphic–petrophysical analysis for sweet spot identification; and (3) synthesis of lateral facies controls. This study uniquely integrates foraminiferal paleoenvironmental proxies, sequence stratigraphy, and petrophysical analyses to understand the multifactorial controls on spatial variability and its implications for reservoir characterization. Middle Miocene sea surface temperatures, reconstructed between 19.2 and 21.2 °C, align with warm conditions favorable for carbonate production across the basin. Foraminiferal data indicate consistent bathyal depths (611–1238 m) in the eastern region, further inhibited in photic depths by clastic influx from the nearby Nubian Shield, increasing turbidity and limiting carbonate factory growth. Conversely, the western shelf, at depths of less than 100 m, supports thriving carbonate platforms. In the sequence stratigraphy analysis, we identify two primary sequences: LA.SQ1 (15.12–14.99 Ma), characterized by evaporitic Feiran Member deposits, and LA.SQ2 (14.99–14.78 Ma), dominated by clastic deposits. The primary reservoir comprises highstand systems tract (HST) sandstones with effective porosity ranging from 17% to 22% (calculated via shale-corrected neutron density cross-plots) and hydrocarbon saturation of 33%–55% (computed using Archie’s equation). These values, validated in Wells 112-58 (ϕe = 19%, Shc = 55%) and 113M-81 (ϕe = 17%, Shc = 33%), demonstrate the primary reservoir potential. Authigenic dolomite cement and clay content reduce permeability in argillaceous intervals, while quartz dissolution in clean sands enhances porosity. This research emphasizes that bathymetry, sediment availability, and syn-sedimentary tectonics, rather than climate, govern carbonate depletion in the eastern region, providing predictive parameters for identifying reservoir sweet spots in clastic-dominated rift basins.

Graphical Abstract

1. Introduction

1.1. Background and Rationale

The Gulf of Suez is considered a leading hydrocarbon basin and has attracted attention to oil exploration activities for years because of its complex rift history and productive reservoirs. This extensional basin formed in the late Oligocene and exhibits a high degree of tectonic compartmentalization, as geological processes caused approximately 16 to 35 km of extension, creating three major sub-basins—Darag (northern), Belayim (central), and Amal-Zeit (southern)—where these zones provided accommodation [1,2,3,4,5,6,7,8]. It has critical reservoirs within its syn-rift stratigraphy, with the Belayim Formation being one of them, including the Hammam Faraun Member, which defines a lithological dichotomy starkly between the clastic-dominated deposits on the eastern flank and the western Nullipore carbonate reservoir [9,10,11].
This lateral dichotomy arises from four key multifactorial controls. Tectonic asymmetry creates stable western horst blocks enabling carbonate platforms versus eastern fault-driven subsidence promoting clastic deposition [12,13]. Sediment provenance differs markedly, with proximity to Nubian Shield siliciclastics in the east contrasting with minimal terrigenous input in the west [14,15]. Bathymetric gradients further control deposition, as shallow photic zone conditions (<100 m) support western carbonates while deep bathyal settings (600+ m) inhibit eastern carbonate factories [16,17]. Sea-level dynamics show differential impacts, with high-amplitude fluctuations disrupting eastern carbonate continuity while stable conditions sustain western reefs [9,12]. The tectonically stable western margin, with its paleo highs submerged, contributed to the formation of carbonates in the shallow marine environment [18,19,20,21]. This setting favored nullipore algae and promoted reefal build-up due to the calm waters, warm temperatures, and minimal mesogenic material (terrigenous sediment input) [22,23,24,25,26]. Conversely, the eastern Gulf experienced active subsidence and was close to Nubian sediment sources. This proximity led to deeper bathyal settings, high clastic inputs, and turbidite sedimentation, which slowed down the development of carbonates [27,28]. Sea-level changes also enhanced these differences as a stable platform composed of carbonates formed in the west, whereas the east was subject to the deposition of mixed clastic carbonates [14,29].
Quantifying these controls is essential for optimizing hydrocarbon exploration strategies. The diagenesis and facies variations have provided the reservoir heterogeneity of such a long-term production area as the Nullipore reservoir, and they illustrate the necessity of implementing integrated stratigraphic-petrophysical simulations [8,10,15,26,30,31,32]. Likewise, the eastern clastics are shale-prone but need an assessment of the depositional cyclicity to define workable hydrocarbon units. This study deciphers the interrelationship between tectonics, sedimentology, and paleoenvironments, helping to improve predictive models that characterize reservoirs. By applying these insights, we enhance recovery mechanisms in one of Egypt’s economically significant basins.

1.2. Study Area

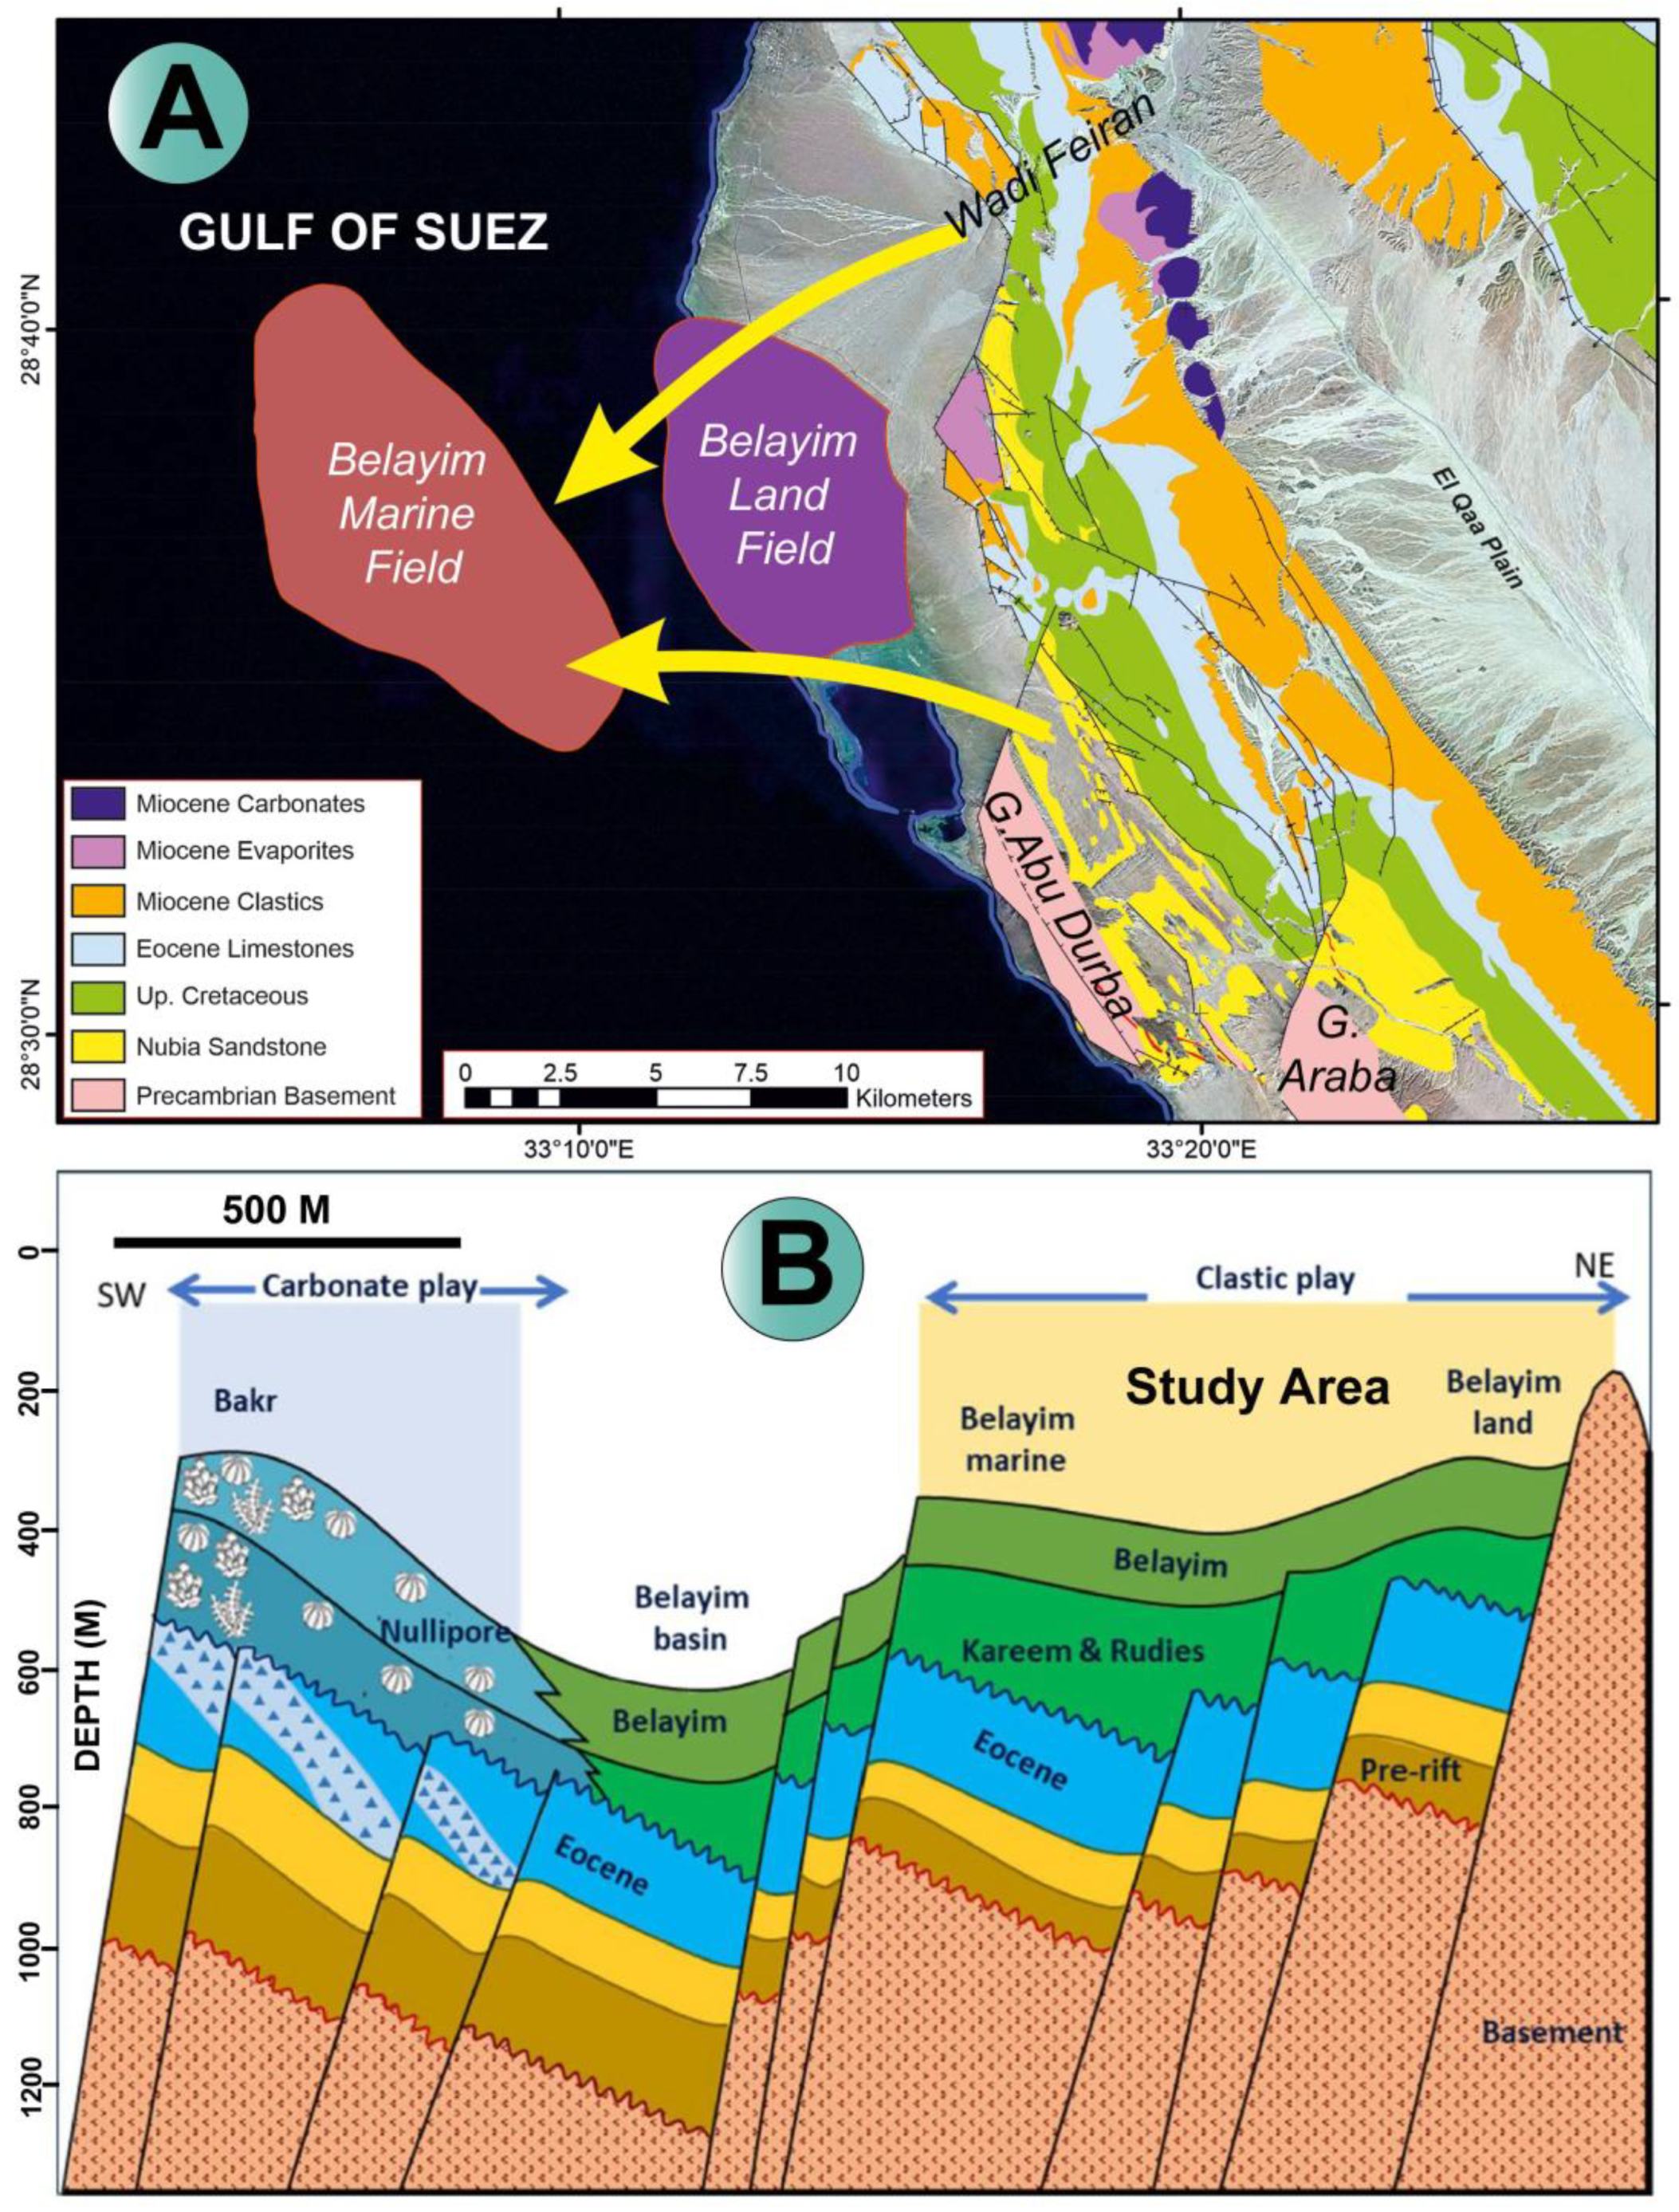
The study area is on the eastern axis of the Gulf of Suez, in Egypt, at the offshore Belayim Marine Oilfield, managed by Belayim Petroleum Company (PETROBEL). The oil field is in the tectonic central portion of the Gulf, characterized by horst blocks that are structurally upraised and tilted fault systems that form traps in northwest and southeast rift basin environments. Two critical wells—well-112-58 (borehole 2359–2422 m depth) and well-113M-81 (borehole 2050–2099 m depth; Figure 1A,C)—examine the Belayim Formation. This formation is a late Middle Miocene syn-rift unit formed during the region’s primary evaporitic cycle.
The syn-rift succession of the Gulf covers the Belayim Formation, which is younger than the Kareem Formation. The South Gharib and Zeit formations overlap the Belayim Formation. The investigation targets the Feiran and Hammam Faraun members, which are part of the four members divided within the Belayim Formation (Figure 1A). The Feiran Member, with a total thickness of 15 to 28 m (Figure 1A), features anhydrite interbedded with green to gray shale. This composition indicates that the environment was a restricted lagoonal to the hypersaline setting. These evaporates are the first evidence of the salt-tectonics in the Middle Miocene, and the stratigraphic thicknesses of the rocks rapidly increase farther into the Hammam Faraun fault zone, suggesting an active fault during the depositing of the rocks [12,13,31,33].
The Hammam Faraun Member, on the contrary, is composed of brownish calcareous shale interspersed with loose, porous sandstone beds deposited in shallow marine to marginal environments due to the activity of fault-controlled subsidence (Figure 1B). The lithology of the member changes laterally along the Gulf: carbonate facies dominate the west side (Nullipore reservoir), while clastic sedimentation occurs on the eastern side, which experiences extensive tectonic activity [22,34].
Figure 1. (A). Stratigraphic column of the Middle Miocene Belayim Formation showing the Feiran (anhydrite-shale) and Hammam Faraun (shale-sandstone) members with 50–65 m total thickness. (B). Tectonic setting of the Gulf of Suez rift basin with major fault blocks and Belayim Marine Oilfield location (modified after [35]). (C). Study area location map showing the offshore Belayim Marine Oilfield and key wells (112-58, 113M-81).
Minerals 15 00864 g001
The studied wells cut through these members, which lie beneath a dipping fault-block structure (Figure 1B). A central fault zone, the Baba-Markha fault, trends NW-SE, while a minor fault zone, the Hammam Faraun fault zone, is located to the northeast. This fault zone truncates the syn-rift stratigraphy and causes localized variations in the reservoir. Complex stratigraphy of the Belayim Formation appears to have been preserved along these faults due to exhumation during post-Middle Miocene displacement and hence is of significant importance in the study of rift basin clastic–carbonate transitions [12,36,37].

1.3. Objectives of the Study

This study tackles a central geological riddle within the Hammam Faraun Member: explaining the stark contrast between its clastic-dominated facies on the eastern Gulf of Suez and the carbonate Nullipore reservoir on the west. We hypothesize that this dichotomy arises from multifactorial controls, including tectonic subsidence, sediment supply, sea-level fluctuations, and paleoenvironmental conditions. To address this, three integrated objectives guide our research. First, we aim to reconstruct the depositional paleoenvironment using foraminiferal proxies (diversity, indices, SST curves, P/B ratios) to infer paleoclimate and paleobathymetry. These proxies help explain the paradoxically high carbonate productivity in the shallow, stable western Gulf versus the deeper waters and clastic influx dominating the tectonically active eastern flank [22,24,38].
Second, our combined reservoir characterization integrates sequence stratigraphic-petrophysical analysis to link Gamma Ray log patterns with systems tracts (TSTs vs. HSTs), identifying sweet spots in highstand sands and flow barriers within transgressive shales. This is complemented by laboratory measurements of SCAL (MICP, resistivity index) to define pore-throat heterogeneity, wettability, and compaction effects under overburden pressure, alongside petrographic analysis (SEM, XRD, thin sections) assessing diagenetic impacts like porosity, permeability, pore-occluding clays (illite, kaolinite), and carbonate cement. Note that these diverse measurements bridge scales from core to log.
Third, we synthesize these findings to delineate how lateral facies variability was controlled by the interplay of tectonics, sediment provenance, and sea-level processes. Ultimately, this framework aims to refine predictive models for hydrocarbon exploration in rift basins, particularly within structurally complex areas like the Belayim Marine Oilfield, by linking paleoenvironmental controls directly to reservoir-scale petrophysical properties.

1.4. Permissions and Data Confidentiality

In this research, the authorization to obtain the samples and gain data access by the Egyptian General Petroleum Corporation (EGPC) and Belayim Petroleum Company (PETROBEL), the operators of the Belayim Marine Oilfield, was done under strict confidentiality deals. Such arrangements avoid infringing intellectual property laws, protect proprietary geological and operational data, and allow academic study. We analyzed 33 samples of ditch-cuttings from boreholes 112-58 and 113M-81, using related well-log and core databanks while adhering to the confidentiality agreement. We have blinded sensitive details specific to the field to protect commercial interests. Our findings do not include any obstructive information regarding reservoirs or production. This shared cooperative framework complies with the industry standards of academic research in hydrocarbon exploration.

2. Geologic Setting

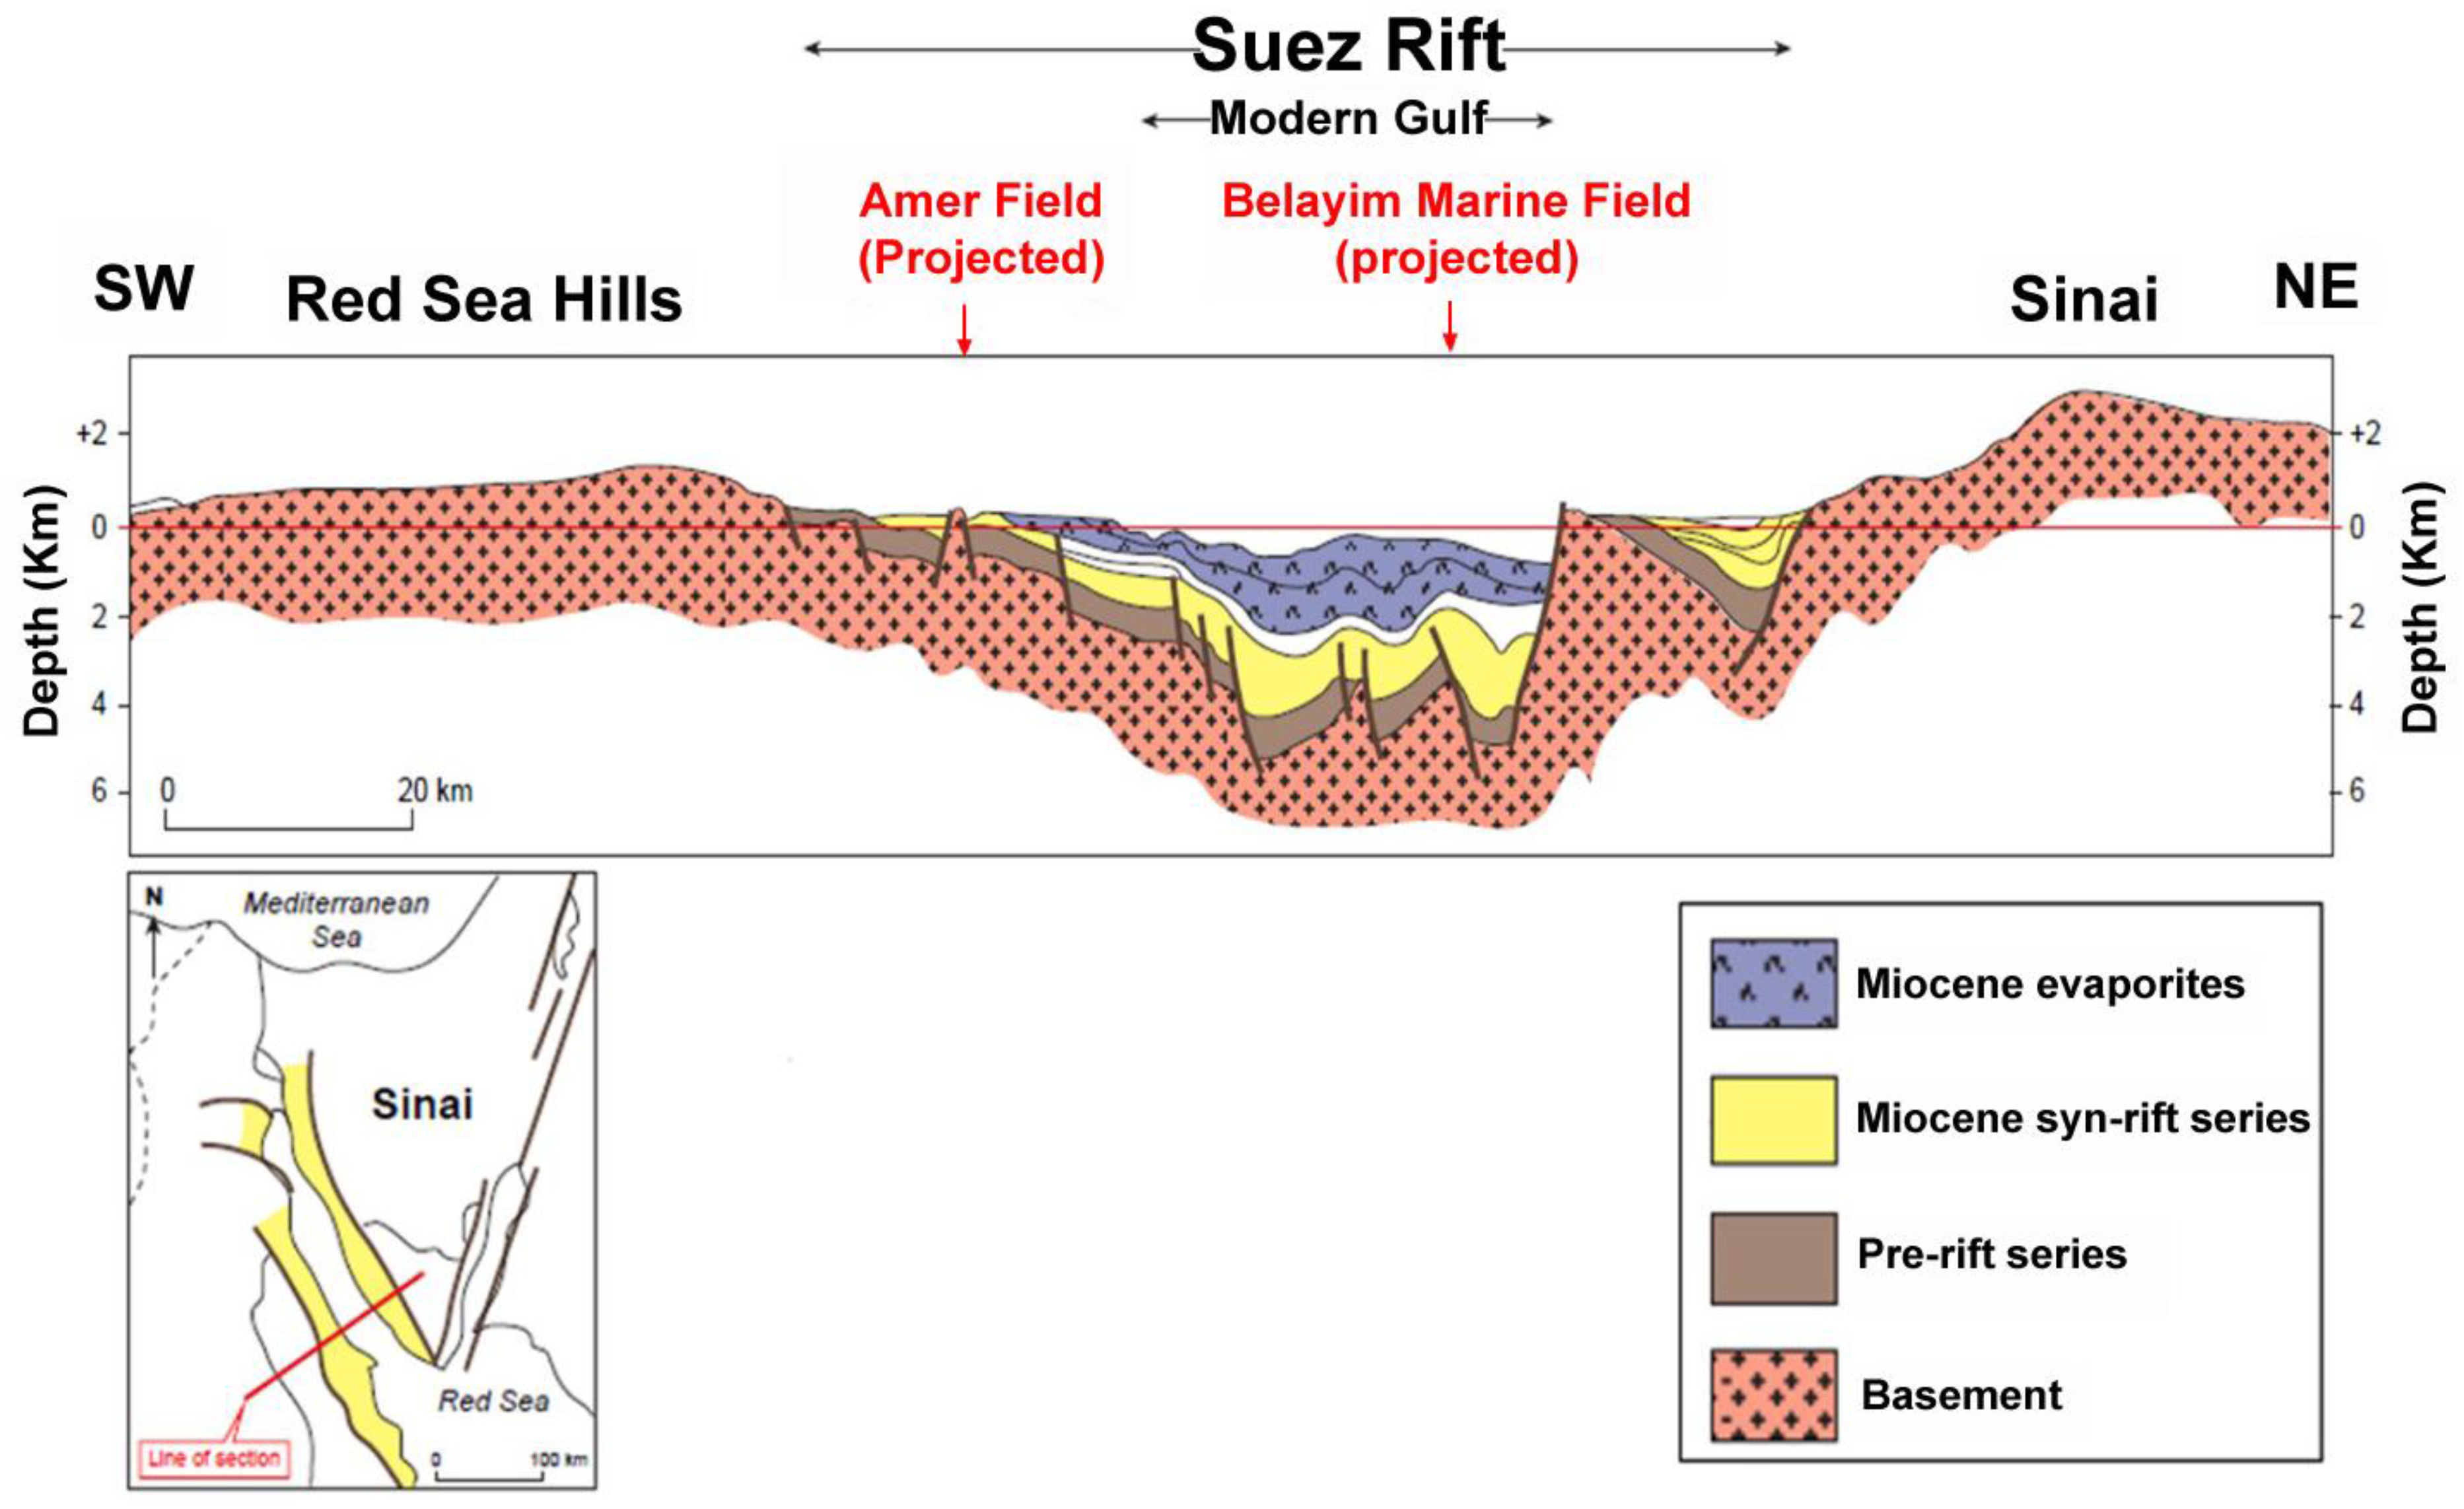
The Gulf of Suez is a northwest-trending continental rift, the northern prolongation of the Red Sea rift system (Figure 2). It has progressively developed since the late Oligocene period (~27–25 million years ago) under rift-normal extension, reactivation of pre-existing Pan-African basement structures, including NW-trending shear zones, and Mesozoic faults. The tectonic structure led to the chopping up of the basin into significant asymmetric half-grabens (Figure 2), namely the Darag, the Belayim, and Amal-Zeit sub-basins, formed by bands of accommodation, which decisively controlled the stacking and distribution of sediments and depositional environment during its history [39,40,41,42]. In this case, the rifting process proceeded in three specific tectonic stages, each having a distinguishing characteristic on the sedimentary record [43].
The first phase, the Rift Initiation (Chattian-Aquitanian), produced rotational blocks of faults through NE-SW extension. The continental red beds, which previously formed most of the sedimentation of this syn-rift period (Abu Zenima Formation), changed into shallow marine carbonates of the Nukhul Formation. The main rifting was followed by rapid subsidence, opening up marine access to the Mediterranean (Burdigalian-Serravallian). This marine access to the Mediterranean resulted in the deposition of shales of Globigerina, which the Lower Rudeis Formation characterizes. Important basin reorganization took place at ~16 million years, and this was associated with the Mid-Rudeis unconformity; this reorganization led to the elevation of rift shoulders, leading to the movement of coarse clastics forming the Upper Rudeis Formation. The tectonic regime changed once again at the epoch of the Transform Activation phase (Late Serravallian-Messinian), which began ~14 million years ago by establishing the transform boundary along the Levant-Aqaba boundary. This activation depressed the extension rates in the Gulf of Suez, isolating its sub-basins and initiating extensive evaporite accumulation—such as Belayim, South Gharib, and Zeit Formations—especially at the lowstand times [44]. A significant tectonic influence on deposition during these periods was the segmentation of the basins as controls of sediment accretion pathways, eustasy as a control on marine penetration (highstand carbonates) versus evaporite precipitation during lowstand basin isolation, and uplift of rift shoulders as a provider of siliciclastic materials such as the Abu Alaga fan delta, conglomerates.
In this tectonic scenario, the Belayim Formation is of special importance. Unconformably lying on top of the Kareem Formation, it consists of successively restricted marine deposits of evaporites, shales, and clastics. It has stratigraphy that portrays the interaction of tectonics and basin development. In the lower Feiran Member, thick intervals of anhydrite and halite pervade the strata, and conglomeratic sandstones interbed with them. These facies can relate to deposition in marginal marine sabkhas and fan deltas, with the clastic material sourced from the uplifted fault blocks bordering the basin [45]. Capping it, a brownish calcareous shale sequence (Hammam Faraun Member: thinly bedded limestone; brownish calcareous shale) reflects a continuing (marine?) connection with deeper water but represents deposition in a deeper, restricted marine basin (Zones N14: Foraminifera; ~11.5 million years ago; [46]), just before the evaporitic isolation recorded in younger formations. It was post-Middle Miocene tectonics, namely a significant offset of the Hammam Faraun border fault, that caused significant subsidence of 3 km of the hanging wall, thus inducing a noticeable thickening of the entire Belayim Formation into the fault system [12,33].
The depositional conditions of these members reflect the evolvement basin conditions. The evaporates and interbedded classics of the Feiran Member formed in tectonically constrained coastal plains (sabkhas) and fan delta complex affected by a clastic influx of the nearby rift shoulders (Figure 1A). The Hammam Faraun Member consists mainly of shale (Figure 1A), with minor carbonates forming in a deep, tectonically active basin. The deposition of the Hammam Faraun shales into the overlying evaporites of the South Gharib Formation makes an abrupt record of the last isolation of the basin that was triggered by a structural uplift of the Syrian Arc as well as the dead sea-level fall [39]. The identified stratigraphic-tectonic interrelationship reveals the sheer interrelationship between rift activity, eustatic cycles, and sediment supply in the formatting of the Miocene depositional systems of the Gulf of Suez [47,48]. This interrelationship is one of the fundamental mechanisms that drive lithological dissimilarity within even the Hammam Faraun Member itself.
Figure 2. Schematic cross-section illustrating the tectonic architecture of the Gulf of Suez rift (modified after [49]), highlighting rift shoulder relief, axial trough depth, and key structural elements.
Minerals 15 00864 g002

3. Materials and Methods

3.1. Sample Collection

Thorough sets of 33 ditch-cutting samples were collected from two key boreholes in the offshore Belayim Marine Oilfield (Figure 1C): well 112-58 (2359–2422 m) and well 113M-81 (2050–2099 m). Using conventional sampling at 3–6 m resolution, we achieved high-density stratigraphic coverage across 63 m (112-58) and 49 m (113M-81) sections, specifically targeting the Feiran and Hammam Faraun members of the Belayim Formation. Notably, three principles guided our sampling strategy: (1) isolating units between bounding heterolithic strata (South Gharib Formation above, Kareem Formation below) to maximize stratigraphic accuracy; (2) minimizing contamination by avoiding casing points and mud-rich intervals; and (3) capturing lateral depositional contrasts between eastern Gulf clastic-dominated successions and western carbonate counterparts. Each sample (~20 g) was recovered following standard oilfield practice, immediately sealed in hermetic containers to preserve microfossil integrity, and labeled with precise depth identifiers. This approach enabled robust reconstruction of depositional conditions while mitigating common pitfalls like caving or downhole mixing.

3.2. Foraminiferal Analysis

3.2.1. Sample Preparation for Biostratigraphy

The Feiran and Hammam Faraun member’s Ditch-cutting samples were processed to recover foraminiferal assemblages to conduct biostratigraphic analysis (Figure 3). We ensured the reliability and quality of the foraminiferal data by following specific methodological steps (Table 1). About 20 g of dry rock sample was disaggregated in clay with 10% H2O2 for 24 h to oxidize organic components and weaken clay cohesion, facilitating disaggregation while preserving microfossil integrity [50,51,52]. The samples were washed in tap water and wet sieved in 63 µm mesh to separate the >63 µm fraction. The residues were dried in an oven at 40 °C to avoid the thermal breakdown of delicate tests.

3.2.2. Foraminiferal Identification and Imaging

We observed the processed residues under a binocular stereomicroscope at 90× magnification and handpicked the specimens with fine brushes to dislodge them and minimize mechanical damage. High-resolution SEM images were acquired in the Nuclear Materials Authority of Egypt (NMA) at the acceleration voltage of 20 kV to obtain high taxonomic accuracy (Table 1). We conducted quantitative morphometric analyses (including test diameter, chamber count, and aperture characteristics) using scaled SEM micrographs, enhancing morphological clarity through contrast adjustment and noise reduction in Adobe Photoshop (v.CS4) (Figure 4). We carried out SEM imaging in high resolution to ensure taxonomic accuracy (Table 1; [54,55,59,60,61,62]). The taxonomic schemes were:
  • Planktonic foraminifera: Determined through the Mikrotax pforams database and biostratigraphic schemes as by [53,54,55,63].
  • Benthic foraminifera: Identified using the Mikrotax bforams Internet database by [59,61,62].
Through the strict procedure of sample processing and analysis, as illustrated in Table 1, highly well-preserved foraminiferal assemblages were always acquired to aid comprehensive biostratigraphic and paleoecological evaluation. This approach severely limited the quality and reliability of the resultant foraminiferal data that form the subsequent analyses, hence the high adherence levels to these methodological steps, as documented in Table 1.

3.3. Paleoenvironmental Reconstruction Using Foraminiferal Proxies

3.3.1. Paleoclimatic Analysis

We used a quantitative foraminiferal proxy to reconstruct paleoclimatic conditions and to test how thermal factors influence carbonate productivity. For robust statistical analysis, we standardized counts to a minimum of 300 well-preserved specimens per sample, following established paleontological protocols [64]. The indices of diversity Shannon Diversity Index (H = −∑ (pi ln pi)) where pi is the proportion of species (i) informed the assessment of the ecosystem stability, and so did Evenness (E = H/ln S) where S = species richness). Low nutrient availability or increased turbidity induces environmental stress, inhibiting the growth and metabolic activity of carbonate-secreting organisms [40,65,66].
The Cita–Spezzaferri approach was adopted to produce relative SST tendencies [67,68,69]. Climatically sensitive planktic foraminifera fall into two categories:
  • Warm-water indicators, representing tropical and subtropical taxa, receive a score of +1.
  • Cold-water indicators, including subpolar and gyre margin taxa, are assigned a score of −1.
Ambiguous climatic affiliation taxa have been omitted to limit interpretive bias. The results were obtained by summing values algebraically and correcting them to be equivalent to 100 percent of assemblage counts per sample [70,71]. The SST deviation curves were made. Positive/negative trends refer to warming/cooling periods about mean states.
Absolute SST (degrees Celsius) during summer was calculated using a transfer function fitted to low-latitude surface waters [72,73,74]:
T = 19.17A + 11.6B + 2.7C + 0.3D + 7
where A, B, C, and D are normalized proportions (%) of:
  • (A) Tropical assemblages
  • (B) Assemblages of subtropical origins
  • (C) Subpolar assemblages
  • (D) Gyre margin assemblages
The study calculated the proportion of assemblage counts based on over 300 counts of well-preserved tests and samples that fit recognized ecological preferences [64]. During the Miocene, the Gulf of Suez featured a subtropical environment [71,75,76], which allowed cosmopolitan taxa (Table 2) to cluster statistically into subtropical assemblages (B).

3.3.2. Paleobathymetric Analysis

We used three complementary proxies to solve paleodepths and assess how bathymetric factors influence clastic dominance:
  • Planktonic/Benthic (P/B) Ratios: P/P + B × 100 with a high percentage (>80%) as representing a distal, deep-marine environment.
  • Fisher Alpha (alpha): alpha = N (1 − x)/x (N is the total number of specimens, and x is the Simpson structure concentration) measures of water depth-associated gradients in diversity. This index correlates with water depth through non-linear diversity gradients: values are lowest in shallow stressed settings (e.g., supralittoral: α < 2), higher on continental shelves (α = 5–15), reduced in bathyal zones, and peak in abyssal plains (α = 5–20) [77,78,79,80].
  • Ref. [81] Depth Equation:
    Depth (m) = e(3.58718 + 0.03534 × %P)
    in which %P = P/P + B 100, P = planktonic, B = benthic counts. It rounded out several proxies in finding bathyal depths (>600 m) of the eastern Gulf where light restriction inhibited carbonate factories despite suitable SSTs.

3.4. Sequence Stratigraphy

The systematic gamma-ray log pattern correlation with paleo bathymetric zones determined using foraminiferal proxies (planktonic/benthic (P/B) ratios, Fisher diversity index, and paleodepth equations) provided the basis of sequence stratigraphy. This combined strategy identified depositional sequences and related systems tracts in the Hammam Faraun Member.
The methodology combined biostratigraphic studies with gamma-ray log patterns to further correlate a stratigraphic framework. Biostratigraphy and gamma-ray log evaluation were critical in identifying stacking patterns and stratigraphic surfaces in the sequence of stratigraphic structure. Gamma-ray log forms effectively indicate changes in grain sizes and sedimentological cycles because they directly reflect the sediment characteristics and depositional environmental features [82].
Analyzing the gamma-ray log shape allowed us to determine the grain size patterns and the relative sea-level fluctuations over the studied period [3]. The analysis showed five types of gamma-ray log trends: bell-shaped, funnel-shaped, symmetrical-shaped, cylindrical-shaped, and irregular trends. Ref. [83] suggests that all depositional environments observed to have a shallowing-upwards and a coarsening trend within them have three main types, including regressive barrier bars, prograding marine shelf fans, and prograding deltas or crevasse splays.
Table 2. Paleotemperature tolerances, and provinces of planktonic foraminifera from boreholes 112-58 and 113M-81, Belayim Marine Field, Gulf of Suez, Egypt. Sources: 1. [84]; 2. [85]; 3. [86]; 4. [87]; 5. [88]; 6. [68]; 7. [56]; 8. [89]; 9. [90]; 10. [91]; 11. [92]; 12. [93]; 13. [94]; 14. [95]; 15. [96]; 16. [97]; 17. [98]; 18. [99]; 19. [100]; 20. [101]; 21. [63]; 22. [102]; 23. [103]; 24. [75]; 25. [104]; 26. [105]; 27. [106]; 28. [107]; 29. [108]; 30. [109]; 31. [110]; 32. [111]; 33. [112]; 34. [113]; 35. [114]; 36. [115].
SpeciesTemperature ToleranceProvincesReferences
Trilobatus trilobusWarmTropical4, 10, 11, 12
Trilobatus bisphericusWarmTropical to Subtropical1, 3, 4, 5
Globigerinella obesaWarmTropical to Subtropical10
Globigerinoides subquadratusWarmTropical to Subtropical4, 10, 14
Globoturborotalita occlusaWarmTropical to Subtropical10, 15, 16
Globoturborotalita pseudopraebulloidesWarmTropical to Subtropical10, 17
Praeorbulina curvaWarmTropical to Subtropical1, 2, 4
Tenuitella clemenciaeWarmTropical to Subtropical2
Trilobatus sicanusWarmTropical to Subtropical1, 2, 4, 13
Globigerinella praesiphoniferaWarmTropical to Subtropical4, 10
Praeorbulina glomerosaWarmTropical to Subtropical1, 2, 4
Praeorbulina circularisWarmTropical to Subtropical1, 2
Globigerinoides italicusWarmTropical to Subtropical10
Dentoglobigerina venezuelanaWarmTropical to Subtropical8, 13, 19, 20, 21
Globigerina officinalisWarmTropical to Subtropical10
Orbulina suturalisWarmTropical to Temperate1, 2
Globigerinella siphoniferaWarmTropical to Temperate1, 2, 22
Globigerina falconensisColdTropical to Temperate1, 2
Trilobatus altospiralisColdTemperate to Subpolar9, 10
Trilobatus immaturusWarmCosmopolitan10, 23, 24
Globigerinoides obliquusWarmCosmopolitan10, 24, 25
Trilobatus quadrilobatusWarmCosmopolitan10, 24, 25
Globoturborotalita woodiWarmCosmopolitan4, 6, 9, 10, 26
Turborotalita quinquelobaWarmCosmopolitan17, 43, 44
Globigerinita glutinataWarmCosmopolitan17
Globoquadrina dehiscensWarmCosmopolitan3, 24
Paragloborotalia siakensisWarmCosmopolitan2, 9, 18
Globigerinita uvulaTemperateCosmopolitan9
Globigerina bulloidesColdCosmopolitan1, 2, 10, 27, 28, 29, 30
Orbulina universaColdCosmopolitan1, 2, 22
Catapsydrax unicavusColdCosmopolitan7, 8, 17, 31, 32, 33, 34
Globorotaloides suteriColdCosmopolitan7, 8, 35, 36
We obtained quantities of paleoecological preferences and proxies of representative planktonic foraminifera using the Paleontological Statistics Software Package (PAST) developed by [116]. Parameters obtained were P/B ratios, Fisher’s α diversity index, and paleodepth equations, which determined the pattern of species diversity. These were quantitative paleontological data that could be systematically associated with gamma-ray electric logs to identify the stacking pattern (progradational, retrogradational, or aggradational) and important stratigraphic surfaces.
In the analyzed boreholes, we identified Maximum Flooding Surfaces (MFS) at the top of fining-upward sedimentary packages in the gamma-ray logs. Peaks in the abundance and diversity of nannoplankton and foraminifer assemblages also indicated these surfaces [117,118,119]. Sequence boundaries (SBs) were identified using three diagnostic criteria: (1) Lithological variations and sharp contacts (e.g., abrupt evaporite-to-shale transitions); (2) Biostratigraphic turnover surfaces marked by evolutionary transitions in planktonic foraminifera; (3) Abrupt basinward shifts in gamma-ray log facies (>30 API units over <3 m section), indicating subaerial exposure or erosion [120,121].
Transgressive–regressive cycles were also identified in systems tract that lend themselves to established paleobathymetric tools and criteria [38,80,119,122,123,124]. The rising gamma-ray values dominated the transgressive systems tracts (TSTs) as they adjusted to the significant rise in depositional conditions and P/B ratios. In contrast, phases of coarsening and shallowing-upward trends define highstand systems tracts (HSTs), characterized by decreasing P/B ratios and progradational depositional patterns [17,80,119,125].

3.5. Petrophysical Parameters

3.5.1. Well Log Analysis

To analyze the reservoir properties and heterogeneity of classics in the Hammam Faraun Member (Belayim Formation), the present research combined detailed petrophysical interrogation of the two most significant wells: 112-58 and 113M-81. Conventional logs, such as gamma-ray (GR), neutron density, resistivity, and sonic logs, were analyzed to describe the reservoir zones.
The analysis of the well log performed consistently determined essential petrophysical characteristics such as porosity (ϕ), water saturation (Sw), and lithology (Table 1). The determination of Net pay was achieved through the application of this intense cut-off criteria (ϕ > 10%, Vsh < 35%, Sw < 50%) to target hydrocarbon-bearing ranges [30,126,127,128,129,130]. We used neutron density cross-plots to determine effective porosity (ϕe), applying a shale correction that indicated results between 15%–25% in good reservoir zones. Also, we utilized the gamma-ray log to calculate shale content (Vsh) using the Larionov equation. The data showed a direct relationship between high shale content and low permeability in argillaceous strata. Water saturation (Sw) was calculated with the help of the Archie equation referring to the partially saturated zones, whereas hydrocarbon saturation (Shc = 1 − Sw) showed productive intervals [15,131,132].
The log response analysis of facies identifies the depositional environments and differentiates between shoal, lagoon, and tidal flat environments. The combination of sequence stratigraphy and well-log data concepts was essential to help interpret the reservoir architecture and facies distribution in this multilateral formation [133,134].
The extensive synergy of these petrophysical properties further proved the non-homogeneity in the Hammam Faraun Member. The best reservoir quality was realized in clean and porous sandy facies, whereas there was a massive deception in shaly/tight cemented strata.

3.5.2. Core Analysis (Special Core Analysis Laboratory—SCAL)

We implemented a comprehensive core analysis program to complement the well-log analysis and provide a detailed characterization of rock properties. We strategically identified eight core plugs (1.5-inch diameter) to measure resistivity. We also used five core plugs for mercury injection capillary pressure (MICP) analysis and four for detailed petrographic analysis [135,136].
Sample clean-up was performed through the complete wash stage with a cold solvent extraction protocol involving chloroform (to remove the hydrocarbons) and methanol (to extract the salt and H2O). We carefully dried the sample in a humidity oven at 60% and 40% relative humidity. This standard cleaning protocol accurately determined the rock’s intrinsic properties [137,138,139].
We performed formation resistivity factor (FRF) analysis in an ambient room [140,141]. It simulated reservoir overburden pressure conditions of 7000 psig on the synthetic brine, with a total dissolved solids (TDS) concentration of 196,450 g/L. The resistivity index (RI) was also systematically calculated based on continuous oil injection tests undertaken under overburden pressure conditions. We established and conducted tests using clean and restored core states to assess the effects of wettability.
The selected samples were also subjected to mercury injection capillary pressure (MICP) tests to characterize the pore throat size distribution and obtain entry pressure values. Understanding the pore network connectivity and flow unit classification is crucial.
Fine-grained samples were carefully prepared in thin-section form by impregnation with blue-colored resin to emphasize porosity, staining certain mineral groups, and point counting analysis (200 points per section) to quantify mineralogical composition and textural relations and characterize them petrographically.
We examined the gold-coated samples using high-resolution scanning electron microscopy (SEM) to determine pore geometry and mineral morphology attributes. This SEM examined micro-heterogeneity and diagenetic factors influencing reservoir quality in great detail.
To establish the pleasing mineral composition, X-ray diffraction (XRD) analysis was undertaken purposely in clay fraction (<2 µm), and this provides vital data about the potential of formation damage due to the clay and the effect it may have on the performance of the reservoir.

3.6. Electrical Properties Determination

3.6.1. Cementation Exponent and Tortuosity Factor

We thoroughly conducted electrical measurements to determine the Cementation exponent (m) and the tortuosity factor (a). We vacuum-saturated core plugs (1.5 inches in diameter) within a stainless-steel vessel using synthetic formation brine (196,450 g/L TDS) at 7000 psig under vacuum saturation conditions to ensure complete pore filling, which we confirmed through gravimetry. The electrical resistance was checked at 1000 Hz on the Wayne Kerr component analyzer with repeatability tests. We used resistance values to determine the specific resistivity (Ro), and we calculated the formation factor (FF) using the formula FF = Rw/Ro, where Rw represents the resistivity of brine. The solution of (m) and (a) was obtained by using porosity (ϕ) determined in helium porosimetry FF = a ϕ−m [142]. We used thin-section petrography to cross-check the results and associate diagenetic cementation with pore tortuosity.

3.6.2. Saturation Exponent

We measured the saturation exponent (n) under two different circumstances: during the cleaned state process and the restored state process, each with an expected focus on various segments of the rock-fluid system conduction [115,143].
  • Cleaned State:
Cleaning the state started with sample insertion into a stainless-steel saturator. We performed an evacuation and saturation procedure using brine under pressure in the synthetic formation. Gravimetric verification confirmed that all pore spaces were fully saturated. We then inserted the plugs into a hydrostatic core holder specifically designed to monitor electrical resistance during the experiment.
A fully brine-saturated membrane was at the bottom of the core holder designed to release water and act as a very efficient hydrocarbon block. We began the experimental procedure by applying overburden pressure, which they successively raised to 100 psig. It measured the expelled brine quantity as a baseline value to obtain the pore volume decrease culture. The pressure of the overburden was then increased to 7000 psig in order to emulate the conditions of the reservoir.
In both cases (porosity reduction and resistivity), measurements were made after 60 min of volume stability. On these measurements, along with accurate sample size and brine property measurements, initial resistivity (RO), Formation Factor (FF), and cementation exponent (m) were derived.
The saturation reduction phase included injecting wavy pure mineral oil at a controlled speed of 0.02 cc/h using a positive displacement pump to induce a minimal pressure differential to represent quasi-static circumstances. The generation of brine was reviewed constantly through a graduated system of pipettes. Accordingly, the injection phase was held for at least 21 days to attain equilibrium conditions, with the recorded values being the resistance, phase angle, temperature, and oil pressure measured over 30 min in a period.
To calculate the mean water saturation, we subtracted the volume of displaced brine from the total pore volume. We then used the comprehensive continuous injection data set to compute the Resistivity Index and Saturation Exponent (n).
2.
Restored State:
We introduced the state restoration procedure to provide a more representative measurement of electrical properties in a reservoir wettability scenario. We saturated the core samples completely with brine and placed them under a confining pressure of 400 psig in a hydrostatic core holder. We injected refined mineral oil until we generated no brine, thereby establishing irreducible water conditions.
Next, they gradually elevated the overburden pressure to 7000 psig and accurately determined the displacement volume of oil due to the reduction of pore volume. By keeping the volume of water constant, they recalculated the irreducible water saturation (Swe) to account for pressure-induced volume changes in the relevant pores.
We successfully inserted the refined mineral oil into the dead crude oil and restored the sample under the reservoir’s temperatures and pressures for 25 days to recover wettability. This extended restoration process was essential for realizing a wettability change accurately reflecting reservoir conditions.
Afterward, we loaded the samples back into hydrostatic holders and applied overburden pressure at 7000 psig. The flooding sequence involved flooding with refined mineral oil, followed by simulating brine injection at a rate of 0.1 cc/min to ensure low-pressure differentiation and controlled displacement conditions.
We continuously checked oil production during the displacement using a graduated pipette system. The extensive data recording included measuring resistances, temperatures, and injection pressures at regular intervals. They used the volume of oil displaced to compute the average water saturation and calculated the Resistivity Index and Saturation Exponent (n) using all the collected data.
The methodological rigor ensured high-fidelity reconstruction of paleoenvironmental proxies critical for resolving carbonate–clastic transitions.

4. Results

4.1. Biostratigraphy and Age Determination

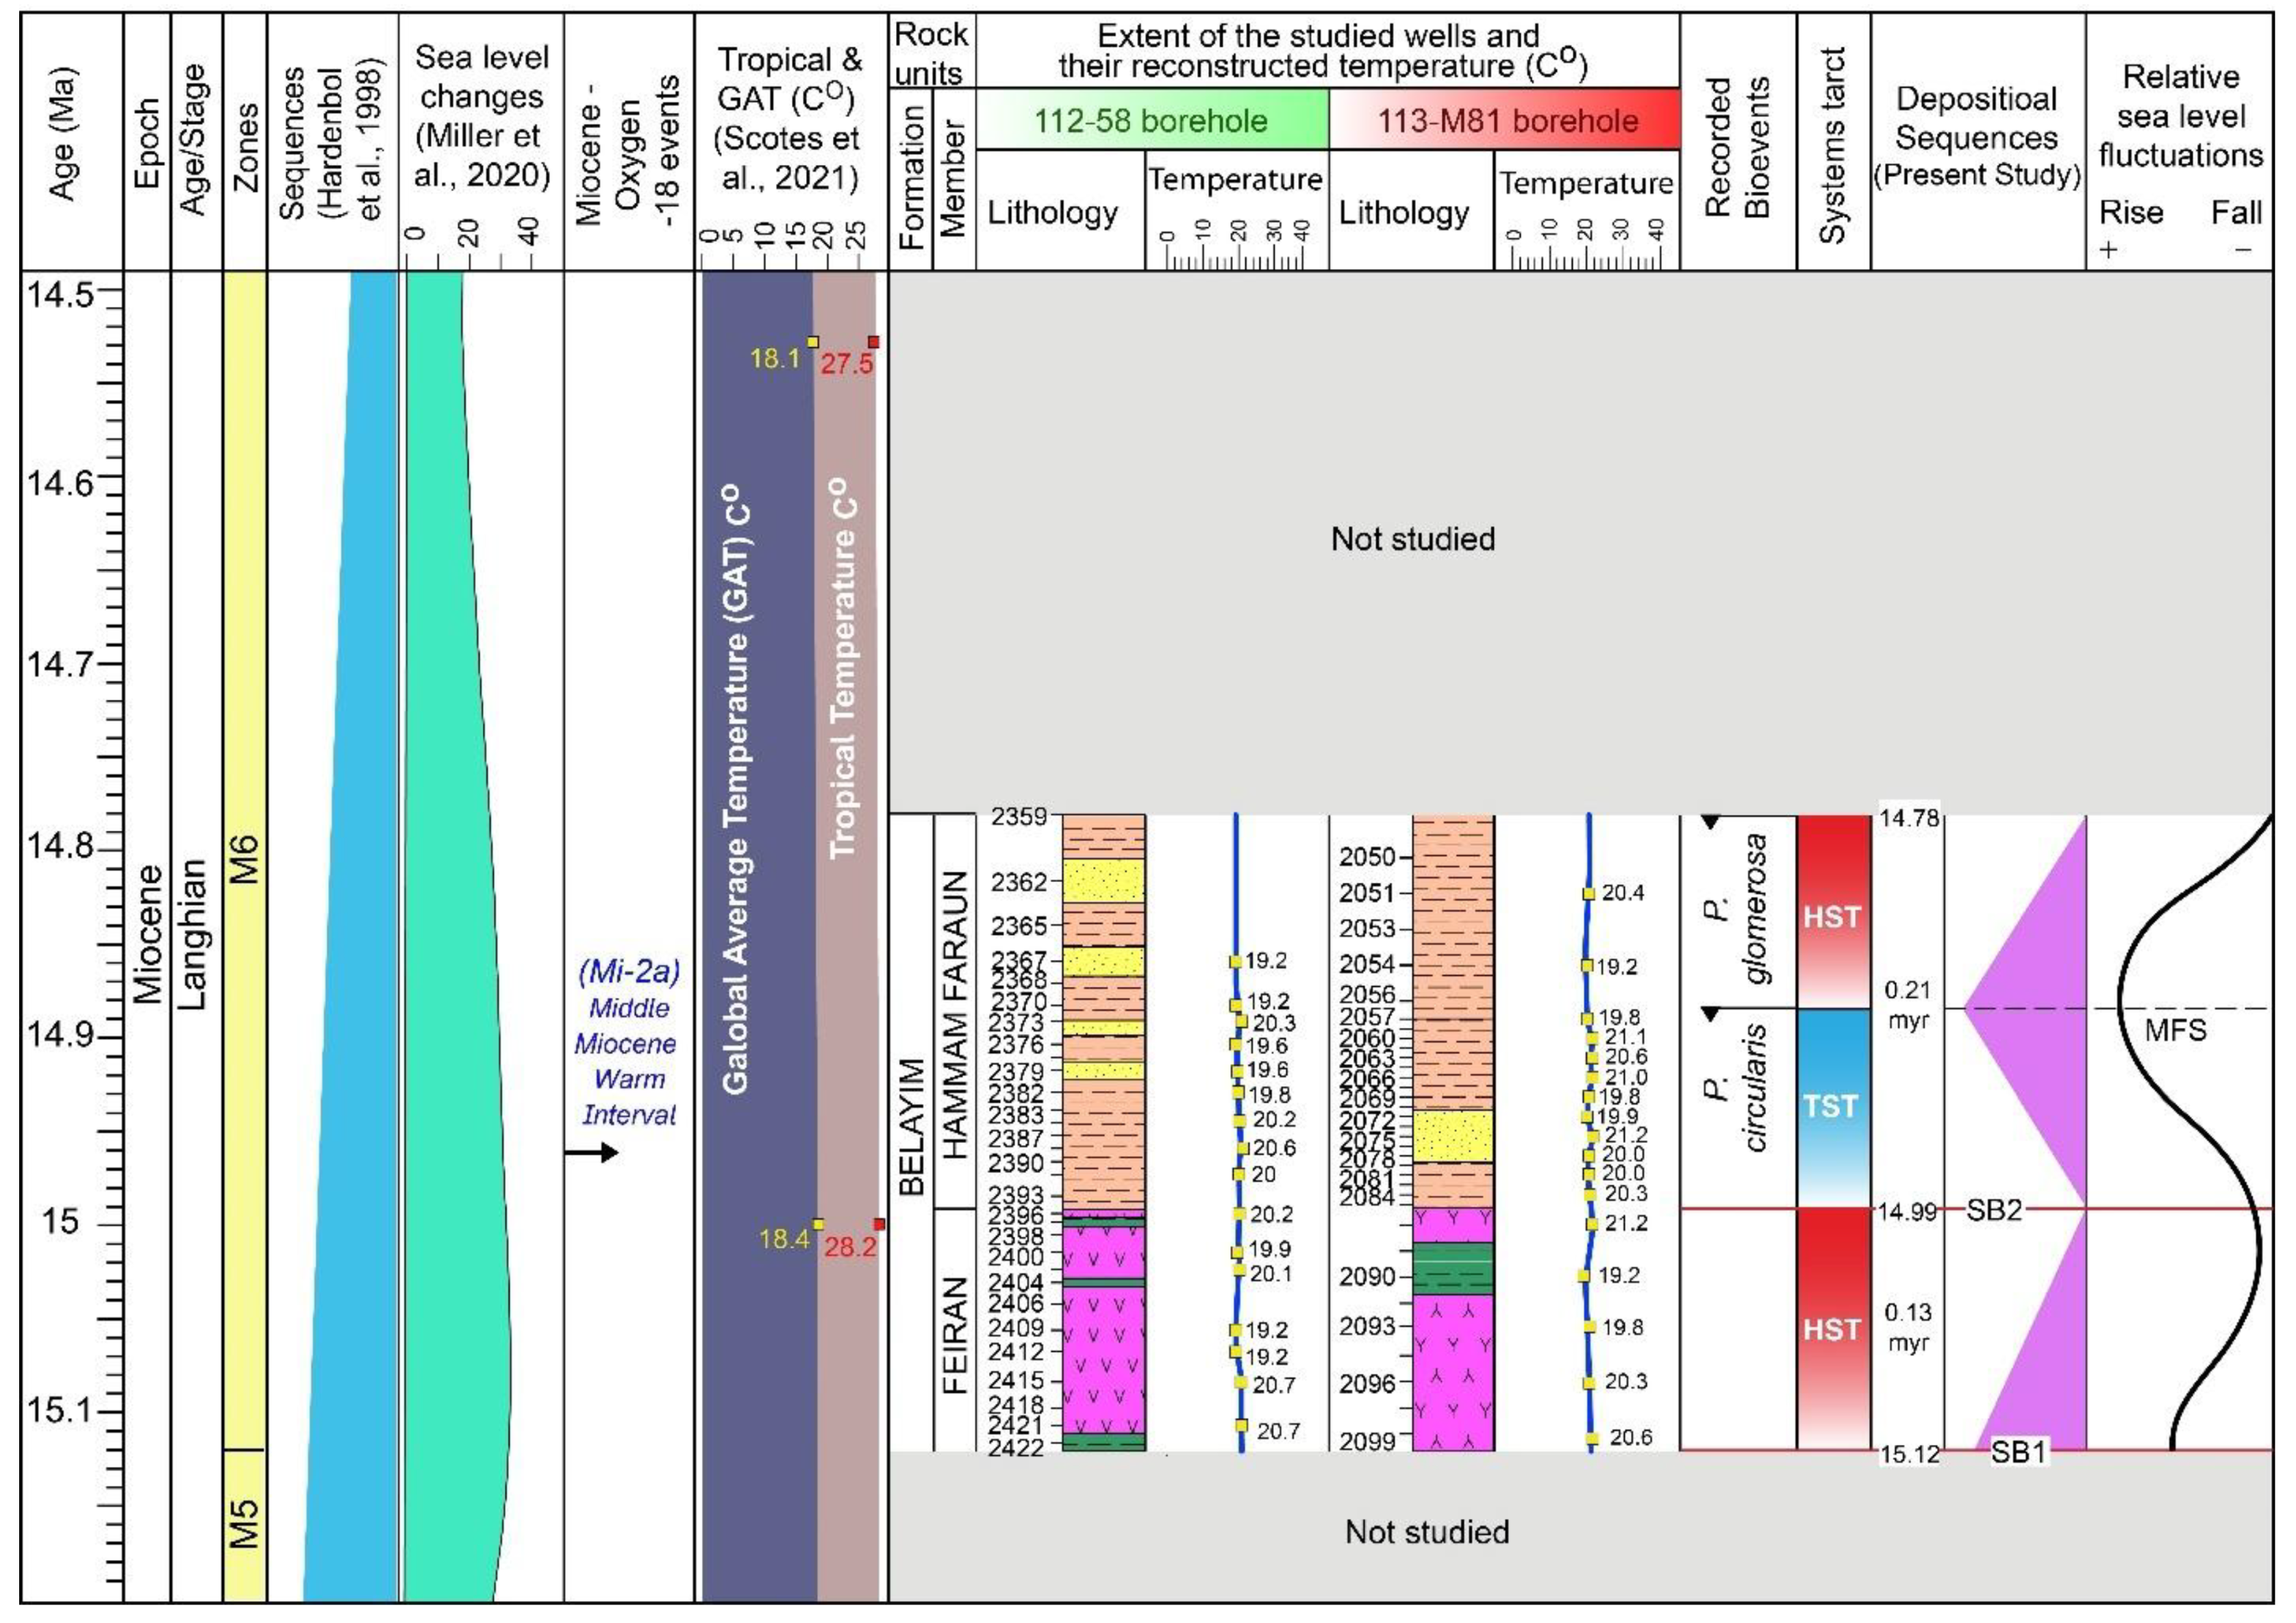
The detailed biostratigraphic scrutiny of analyzed boreholes indicates a well-supported chronostratigraphic account of the Feiran and Hammam Faraun members of the Belayim Formation. The biostratigraphic model confirms that the studied interval belongs to the Langhian age, specifically the M6 Zone of the Middle Miocene epoch (Figure 3). The age imparted to this age assignment encompasses a long temporal range of around 15.12 to 14.78 Ma that offers a solid time background of the depositional history of the examined succession (Table 3).
Orbulina universa and O. suturalis Total Range Zone as identified by [55,85] and referred to herein as M6 Zone 2422 m to 2359 m in borehole 112-58, and at 2099 m to 2050 m in borehole 113M-81 (Figure 3).
The age of determination rests on the identification of major bioevent records of the foraminiferal-based characteristics that uniquely mark the limit and internal divisions of the M6 Zone (Figure 3):
First Appearance Datums (FADs):
  • Orbulina suturalis—The species is a significant evolutionary step in developing the Orbulina lineage at the base of the M6 Zone at c. 15.12 Ma (Table 3).
  • Orbulina universa—We found the first occurrence of this species at the same biostratigraphic level, providing additional chronostratigraphic control (Table 3).
Last Appearance Datums (LADs):
  • Praeorbulina circularis—The disappearance of this species around 14.89 Ma stands out as a significant evolutionary transition in the time range considered here (Table 3).
  • Praeorbulina glomerosa s. str.—The final appearance of this subspecies is dated at around 14.78 Ma, which gives the constraint on the upper part of the succession under study (Table 3).
Foraminiferal assemblages have several other biostratigraphically valid taxa that indicated the Langhian age over the entire period under consideration. Praeorbulina sicana, Clavatorella bermudezi, and Globigerinatella insueta provide supportive evidence for the Middle Miocene chronostratigraphic level.
Stratigraphically, the M6 Zone’s lower boundary coincides with the lower boundary of the Feiran Member, whereas the top of the sampled interval bounds the upper limit.

4.2. Paleoclimatic Reconstruction

The paleoclimatic reconstruction of the Hammam Faraun Member shows a complete image of the environmental conditions in the Middle Miocene in the Gulf of Suez. Combined interpretation of indices of foraminiferal diversity, sea surface temperature (SST) curves, and composition of planktonic foraminiferal assemblages yield strong facts of stable, warm, subtropical climatic marine environments during the Langhian.
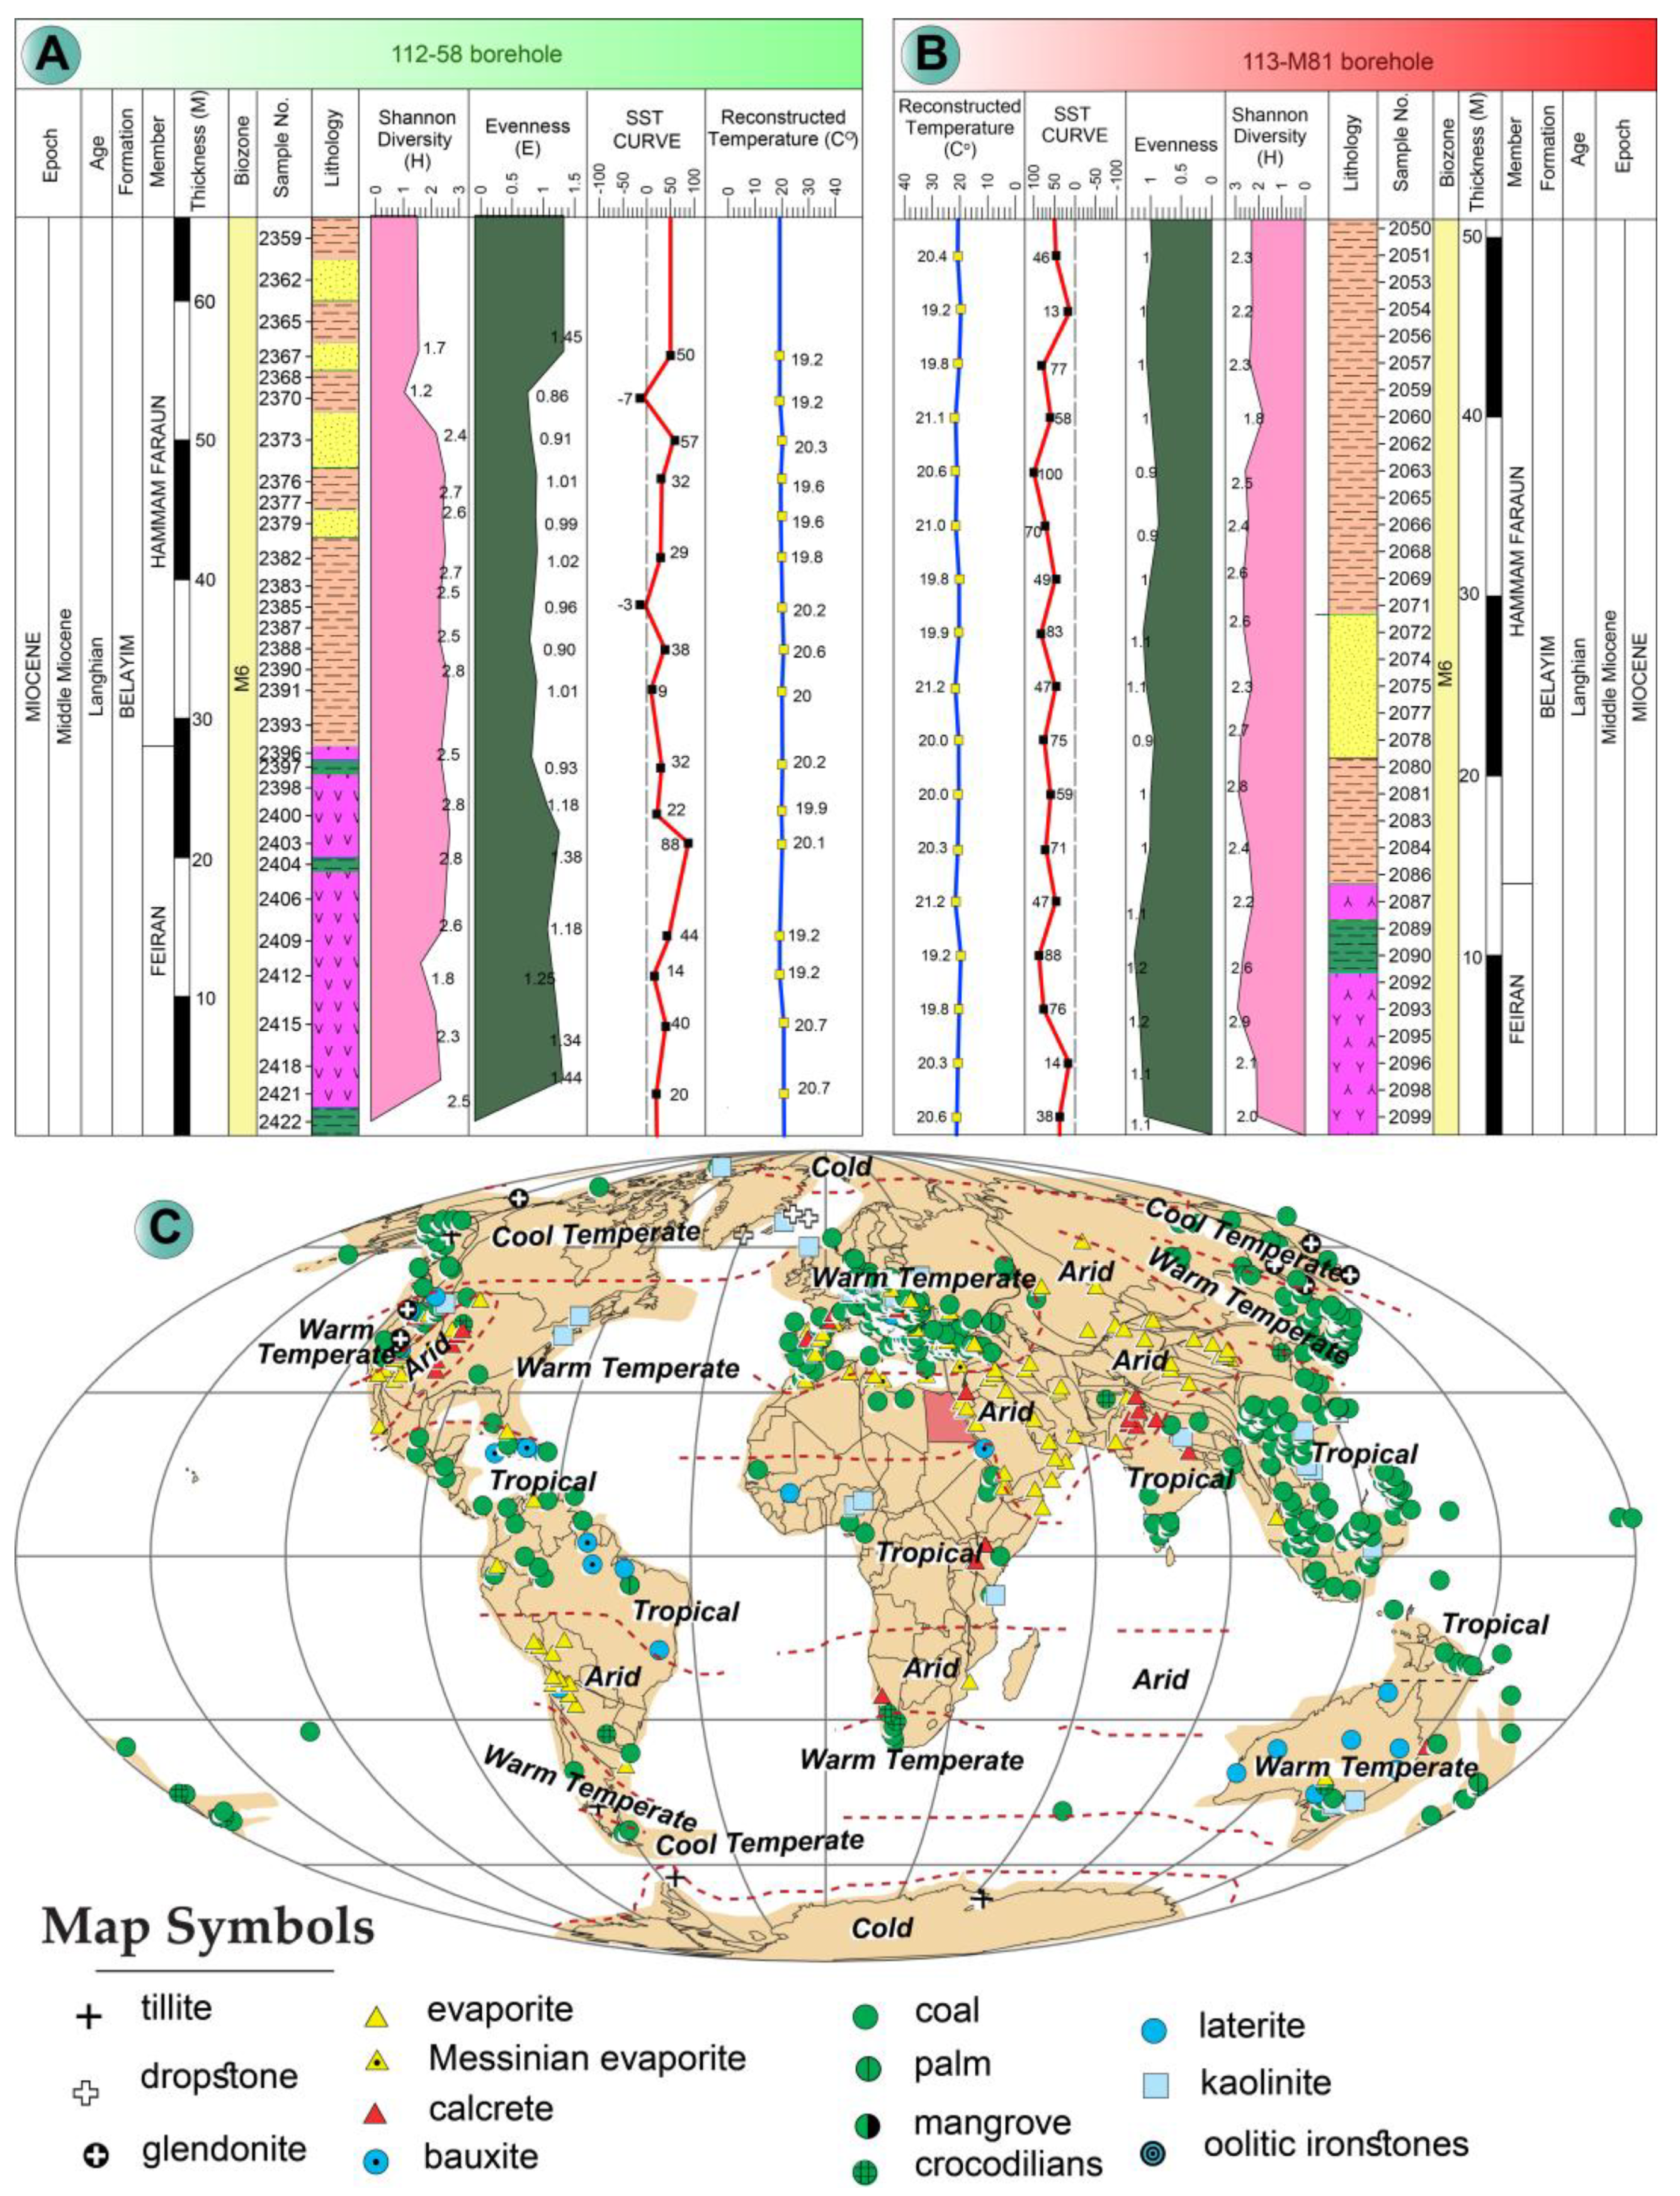
According to Shannon’s diversity values, the diversity of the foraminiferal is moderate and high in both the examined boreholes. In borehole 112-58, researchers recorded diversity values that initially started at a low of 1.2 but reached a high of 2.8, with most values clustered between 2.5 and 2.8, indicating high diversity throughout the studied interval (Figure 5A). In a similar way, the late borehole 113-M81 contains 1.8–2.9, which also demonstrates quite similar diversity patterns, only with a higher range maximum (Figure 5B).
Evenness values indicate the uniformity of the species in the foraminiferal assemblages. In the borehole section 112-58, the values of evenness are about 0.86–1.45, with the highest proportion of values between 0.9 and 1.0 indicating balanced species distribution without dominance of specific taxonomic groups (Figure 5A). The same can be observed in borehole 113-M 81 with even trends of 0.9 to 1.1 signifying similar community structuring in both places (Figure 5B).
We reconstructed sea surface temperatures in the Langhian Gulf of Suez to reveal regional climatic events and interactions with non-local trends during the Early-Middle Miocene. Positive values depict warm periods, and negative ones depict cooling periods. In borehole 112-58, SST curve values were between −7 and 88 (Figure 5A); in 113M-81, they were between 13 and 100 (Figure 5B).
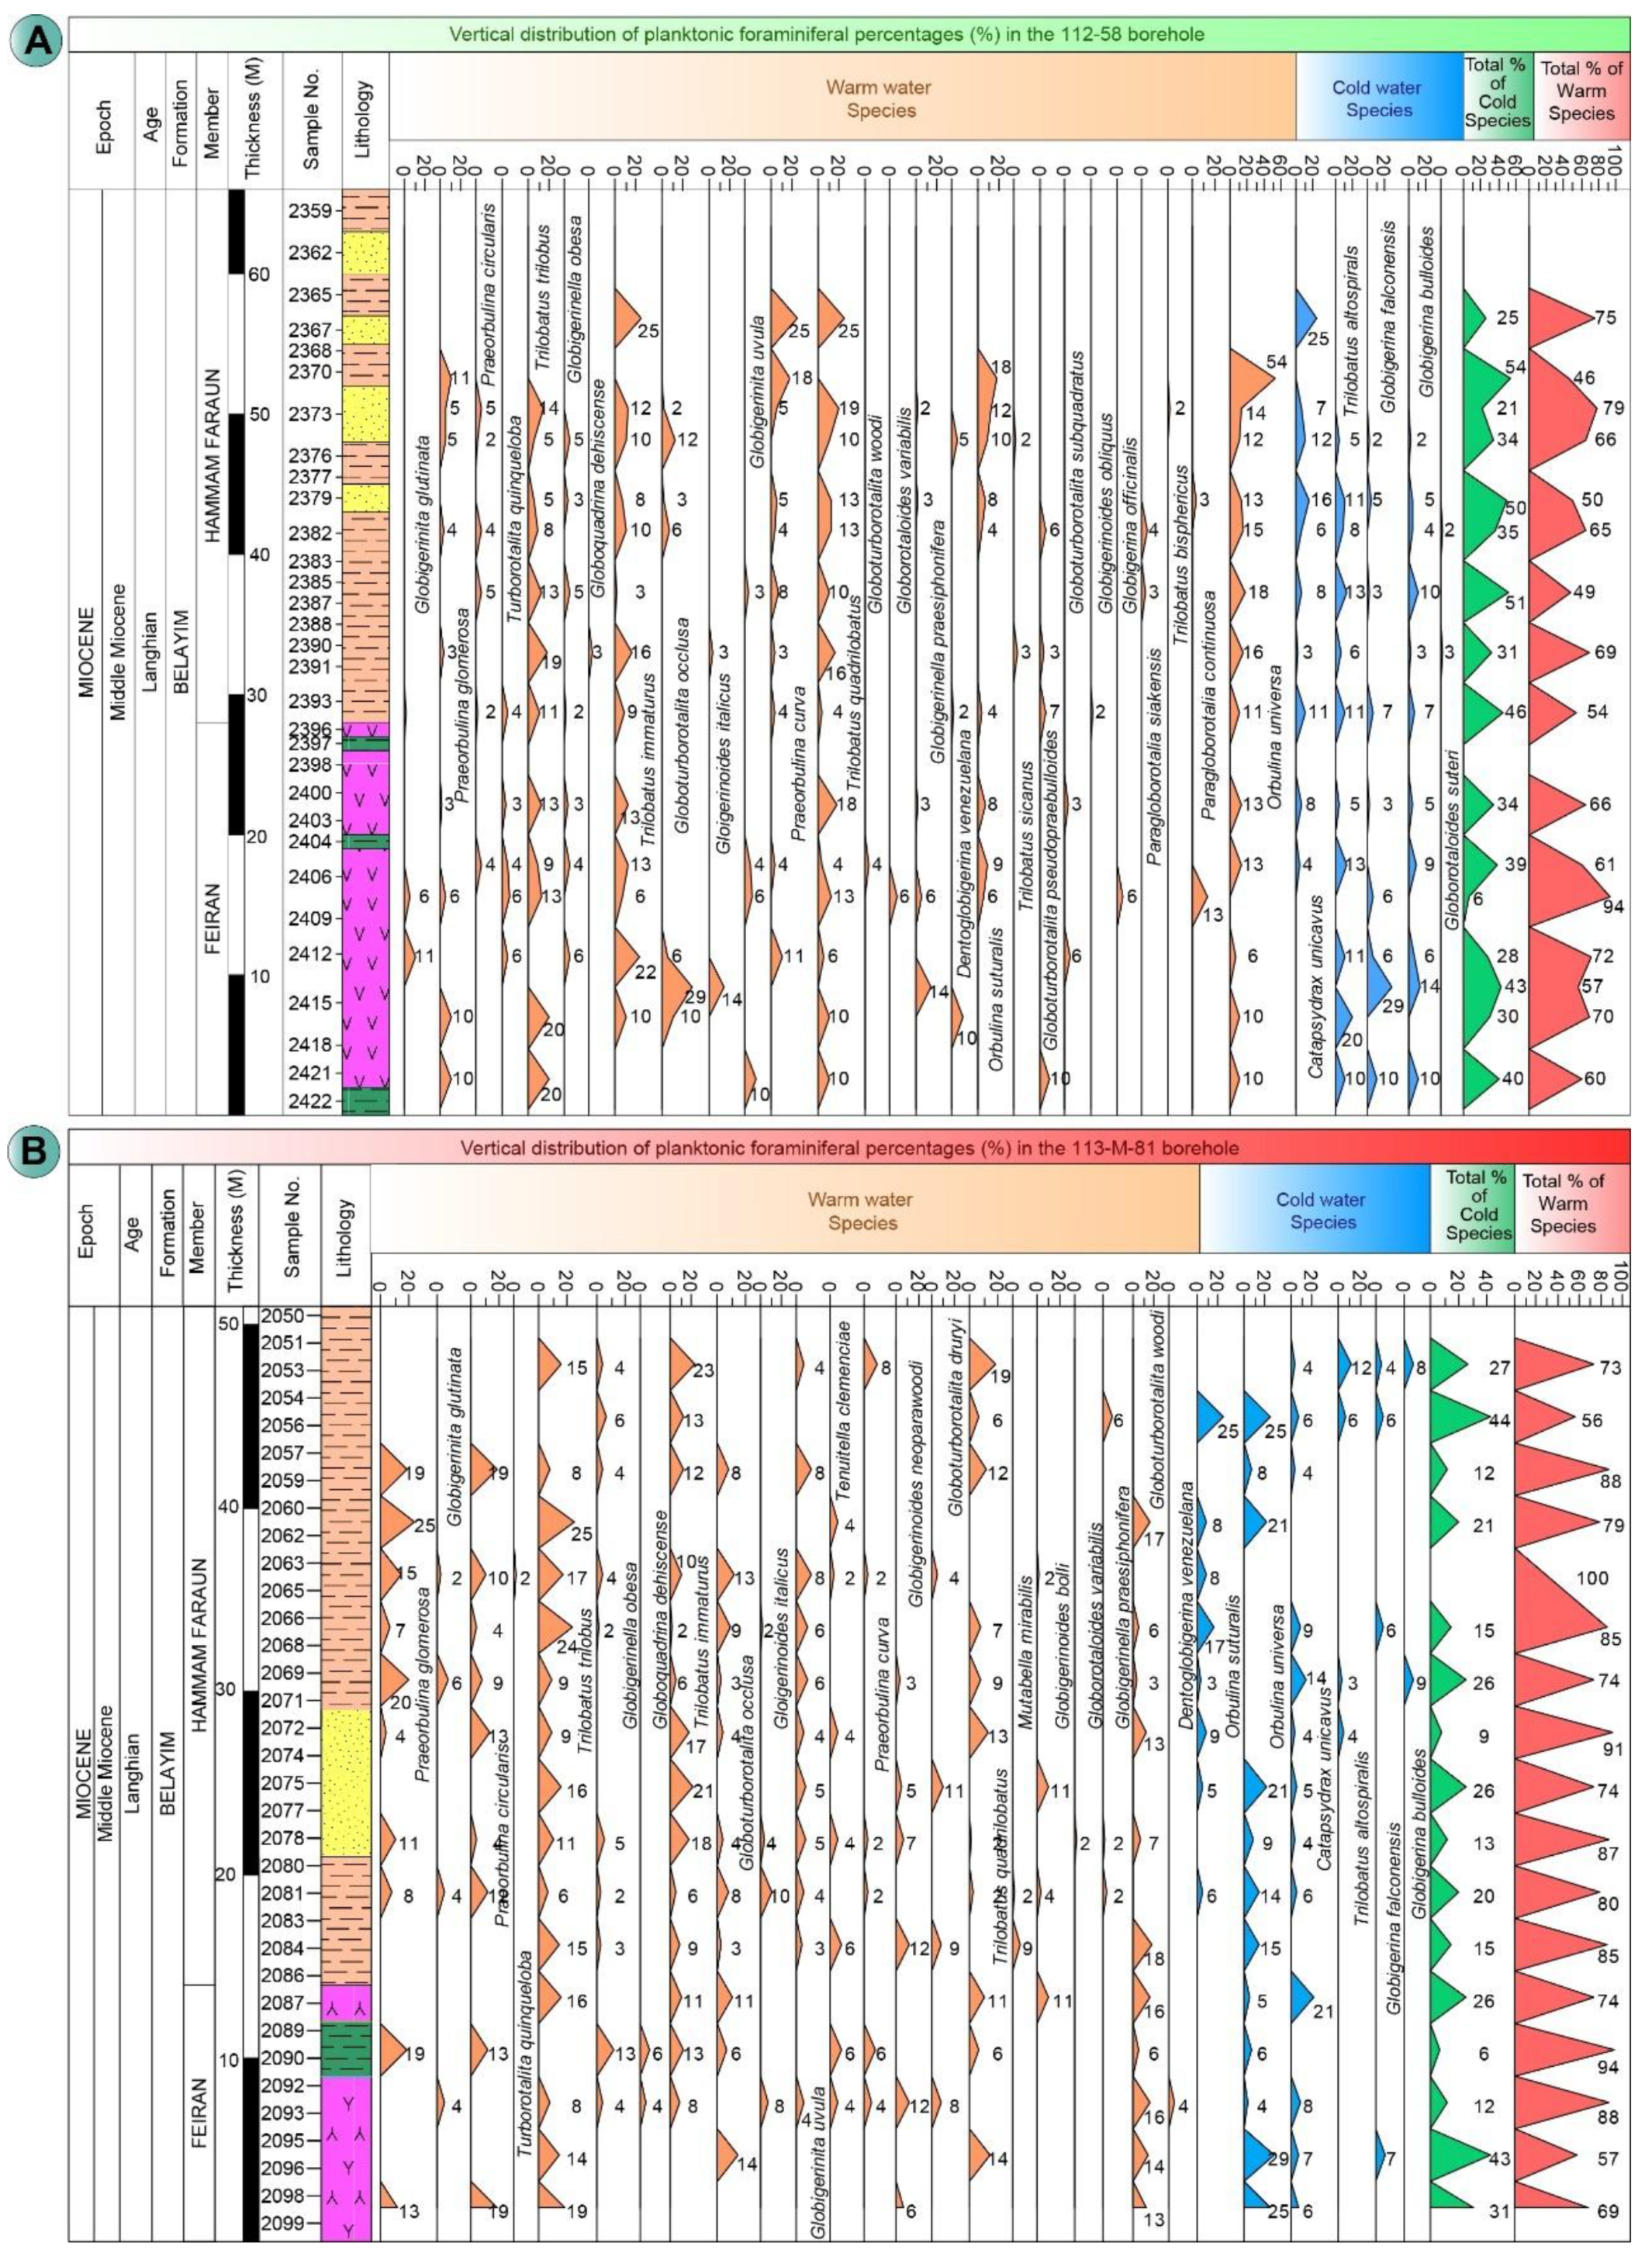
The SSTs obtained in boreholes 112-58 are within a range of 19.2 °C to 20.7 °C and with an average temperature of 20.2 °C ± 1 °C (Figure 5A). In the temperature graph, the conditions are pretty stable with few fluctuations in temperature all over the Hammam Faraun Member. Remarkably, the upper parts of the section show minor cooling trends, which may indicate regional or global climatic changes during the later depositional periods. The consistent dominance of warm-water planktonic foraminiferal species throughout the section indicates persistently warm conditions (Figure 6). Key taxa include Trilobatus quadrilobatus (25%–30% of total assemblage; Figure 6A), Trilobatus trilobus (high prevalence; Figure 6A,B), Orbulina universa (abundant; Figure 6A), and Praeorbulina glomerosa (notably abundant in lower sections; Figure 6B). Globigerinoides species maintained moderate-to-high abundances throughout.
The quantitative part shows a distinct thermal signature within the assemblages of foraminifera. In both boreholes, warm-water species will always make 60%–80% of the total assemblage (Figure 6A,B), and cold-water species, at most, will constitute only 20%–43% of the total fauna. The consistent dominance of warm-water taxa (red) over cold-water forms (green) in foraminiferal assemblages (Figure 5A,B), visually evident in stratigraphic pie charts, corroborates subtropical conditions. This qualitative interpretation is quantitatively supported by transfer function-derived SSTs of 19.2–21.2 °C (mean 20.2 °C ± 1 °C; Figure 4).

4.3. Paleobathymetric Reconstruction

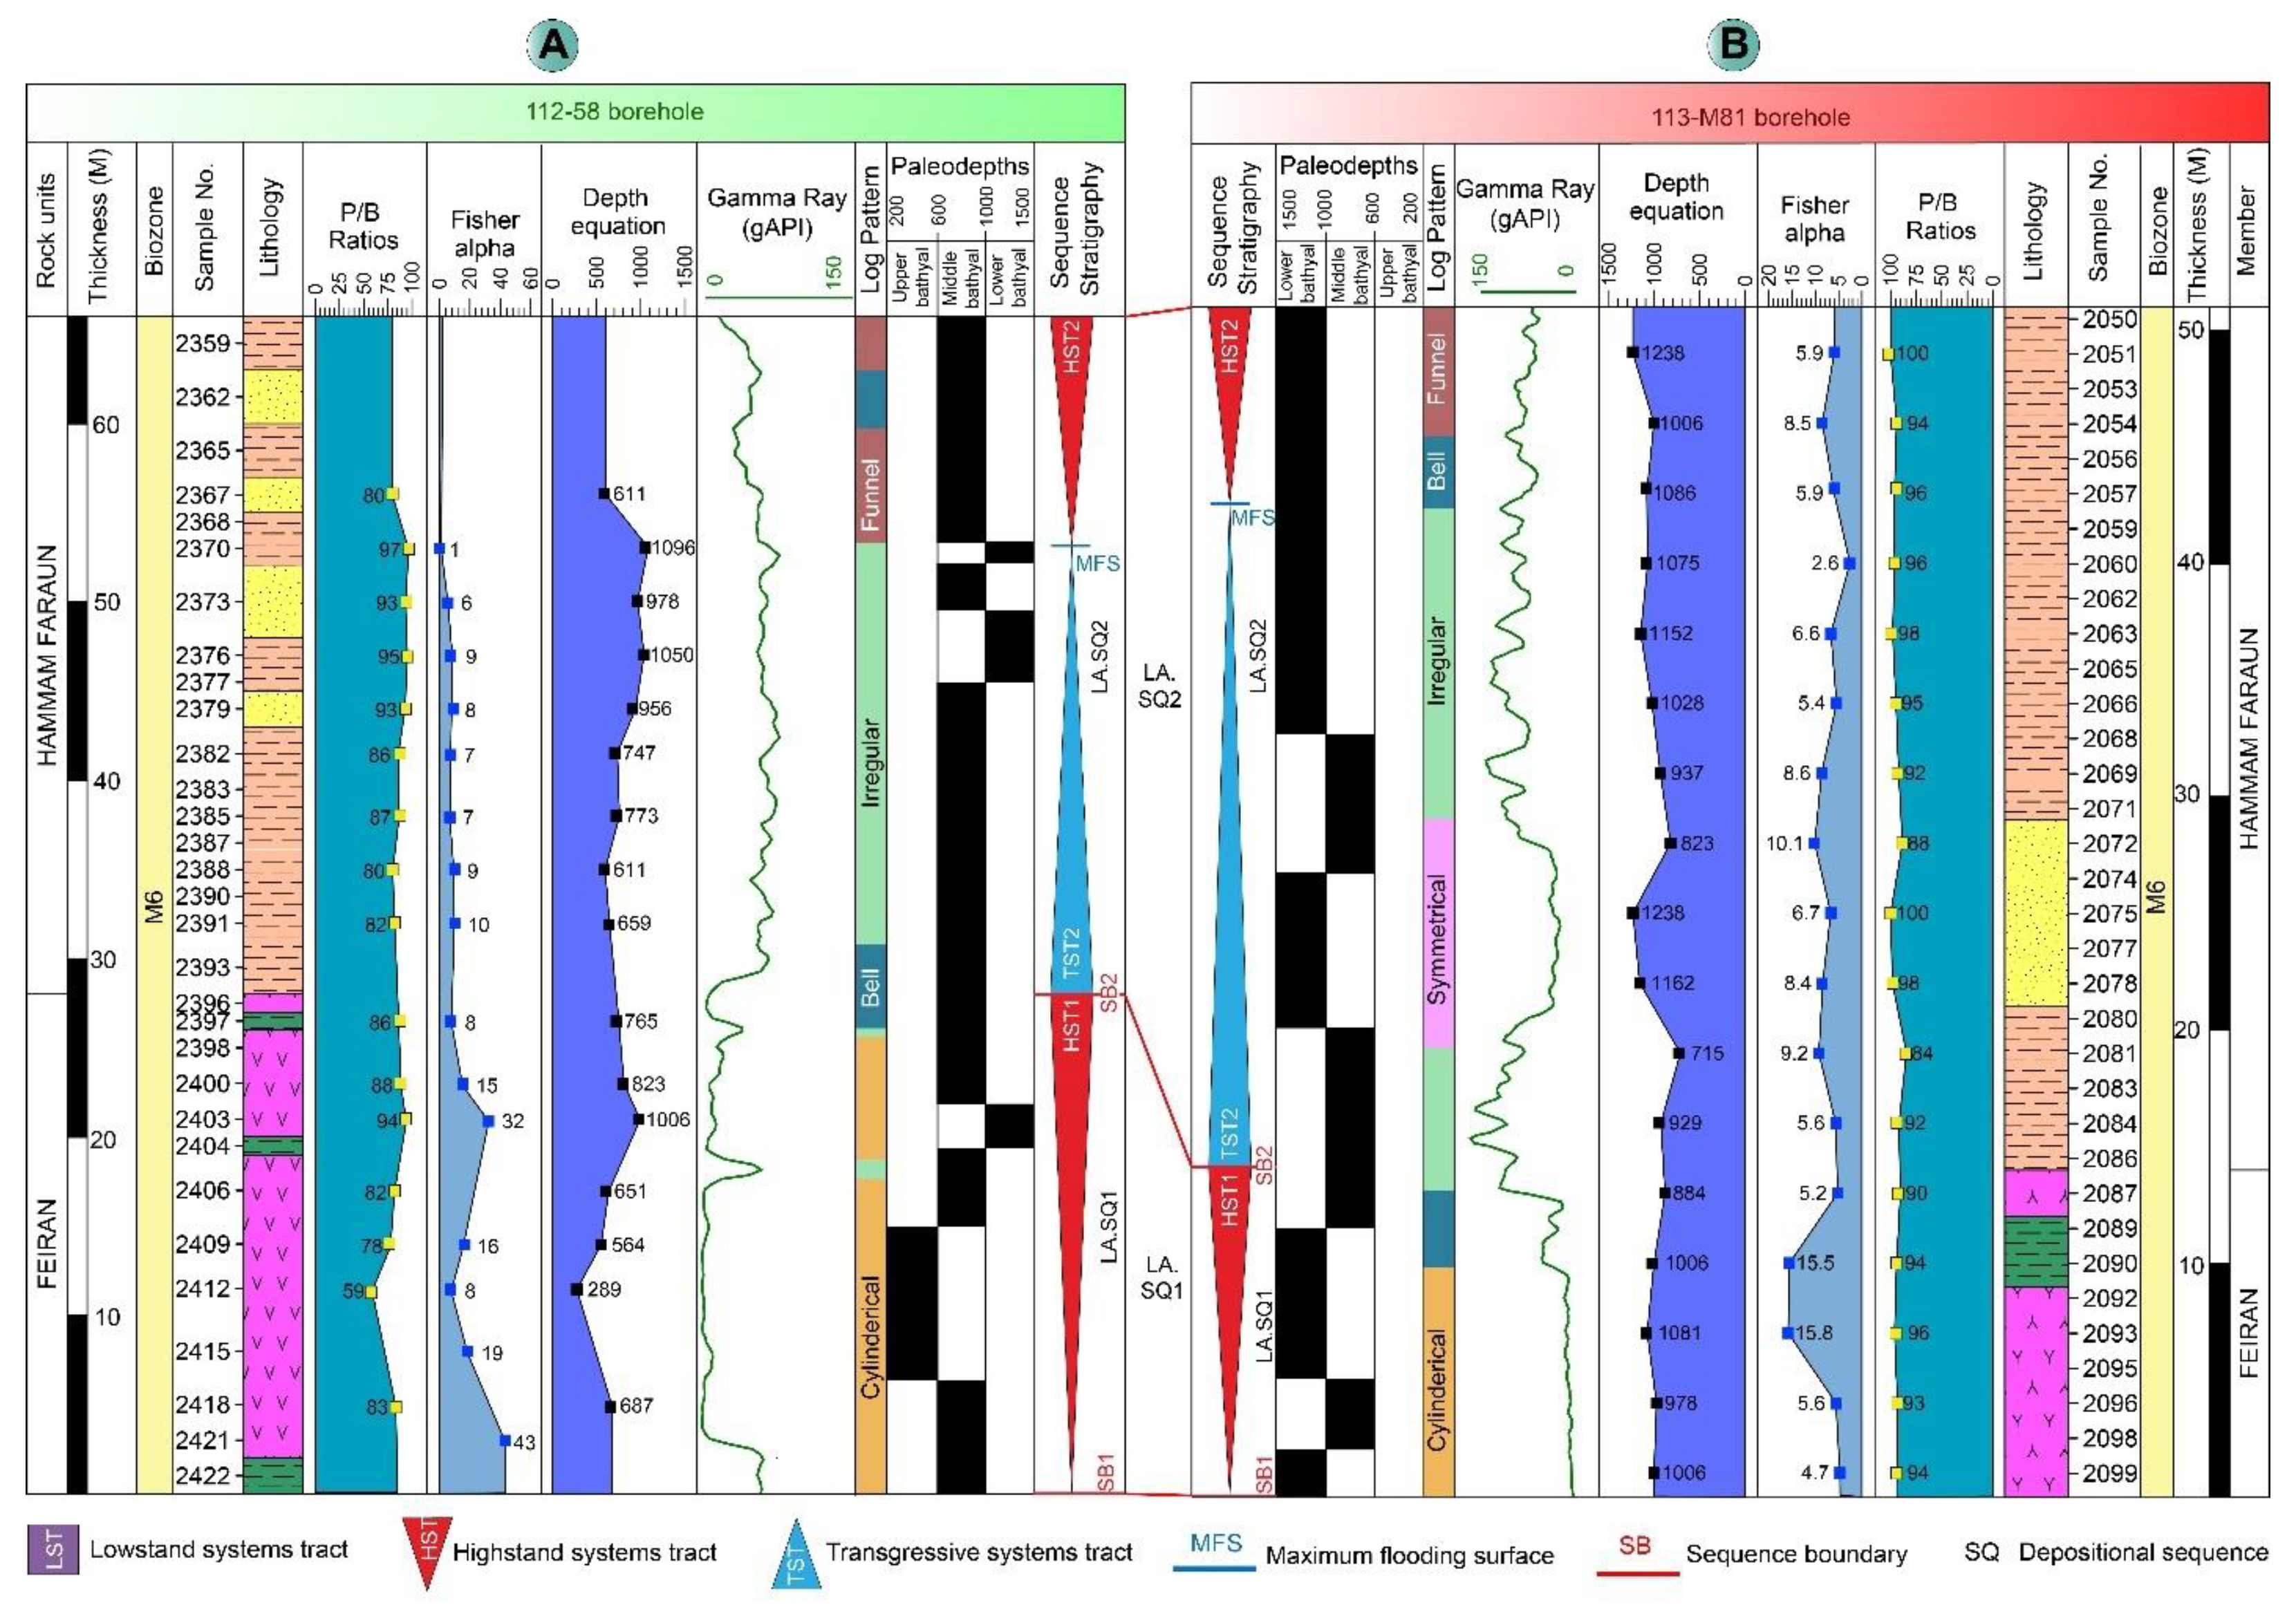
Paleobathymetric reconstructions of the Hammam Faraun Member were prepared by detailed study of foraminiferal proxies, combining planktonic-to-benthic foraminiferal ratios (P/B ratios), Fisher alpha diversity indices of foraminifera and quantitative estimates of depth equations (Figure 7). In both considered boreholes, the information about the depositional environment provided by the paleodepth analysis has proven to be very important, with the figures of the depth equation providing a value of the paleodepth that ranges between 611 and 1238 m in both the 112-58 borehole (Figure 7A) and the 113-M81 borehole (Figure 7B).
Planktonic to benthic ratios in the foraminifers are significant indicators of the paleobathymetry of both boreholes under study. In the 112-58 borehole (Figure 7A), the P/B ratios show an alternation between 59 and 97, but in the 113-M81 borehole (Figure 7B), they correspond, in both cases, to the limits between 84 and 100 during all the sections studied.
The indices of Fisher alpha diversity provide valuable supporting evidence for paleobathymetric interpretation when integrated with other proxies (e.g., P/B ratios), as species diversity patterns correlate with depth gradients [77,78,144]; (Figure 7). The most significant variation in the Fisher alpha values is displayed in 113-M81 (Figure 7B), with the least in 112-58 (Figure 7A) and most in the central phase (7–10).
Deposition is allowed in this zone between 611–1238 m, and this locates the position of the depositional environment at the upper to middle bathyal environment, which means greater marine depth at the time of sedimentation. The association of high P/B ratios with the estimated paleodepths supports the conclusion of bathyal deposition since, in general, the high P/B ratios of 80–90-plus are typical of greater than 200–300 m depth, in good accordance with the quantitative estimates of the paleodepths using the depth equations.
The temporal variation in Fisher alpha values across successive sections reflects changes in paleoceanographic conditions within the bathyal environment. Consistent Fisher alpha values (7–15.8) align with established bathyal diversity ranges. When integrated with high P/B ratios (84–100), these proxies collectively indicate deposition in upper-middle bathyal depths (611–1238 m), where planktonic dominance reflects reduced benthic productivity and enhanced planktonic test preservation in deep-water settings (Figure 6).The paleoenvironmental condition exhibits consistency in the P/B ratio (84–100) and Fisher’s alpha values (7–15.8) throughout the studied intervals, showing no significant changes (Figure 7A,B). The invariant proxies signify inconsequential amounts of shallowing actions and recommend long-term deep-sea sedimentation uninfluenced by high-efficiency sea level changes. The uniformity in the top-down thicknesses of the two boreholes (112-58 and 113M-81) indicates that local tectonic processes did not control the accommodation space in this region; subsidence in the syn-rift regime did. Light limitation in the sub-200 m was a factor in photosynthetic biota (e.g., nullipore algae) at that depth. At the same time, warm SSTs maintained carbonate production on the western shoals elsewhere and explained the lithological contrast across the rift basin.

4.4. Sequence Stratigraphic Framework

The sequence stratigraphy analysis compared patterns in Gamma Ray logs with paleo bathymetric zones defined using the proxy markers of foraminifera, defining two distinct depositional units of the Middle Miocene sequence: LA.SQ1 (15.12–14.99 Ma) and LA.SQ2 (14.99–14.78 Ma; Figure 7 and Figure 8).
The single systems tract, HST1 (Highstand Systems Tract 1), characterizes LA.SQ1 and includes the anhydrite deposits of the Feiran Member of the Belayim Formation (Figure 7). Its base, SB1 (15.12 Ma), is defined by a >30 API gamma-ray shift over <2 m, eroding underlying Kareem Formation shales. The sequence lasted for 0.13 million years, from 15.12 Ma, marked by the first appearance datum (FAD) of Orbulina suturalis and Orbulina universa, to 14.99 Ma, ending at sequence boundary SB2 (Figure 8). SB2 is marked by a sharp lithological contact (Feiran Member evaporites to Hammam Faraun Member shales), a >40 API GR increase, and cessation of bioturbation (Figure 7 and Figure 8). The sea level changes during this interval show a pronounced decrease, as indicated by the anhydrite deposition of HST1, recording the falling relative sea level due to syn-rift tectonic uplift, eventually leading to sabkha-type anhydrite precipitation under restricted marine conditions (Figure 8).
Conversely, LA.SQ2 contains two separate systems tracts, TST2 (Transgressive Systems Tract 2) and HST2 (Highstand Systems Tract 2), that together form the Hammam Faraun Member (Figure 7). Such a sequence records a detailed transgressive–regressive cycle that initiates with deepening conditions in TST2 and concludes with shallowing conditions in HST2. LA.SQ2 lasts for a period of 0.21 million years, from 14.99 Ma to 14.78 Ma, with the last appearance datum (LAD) of Praeorbulina glomerosa (Figure 8). TST2 is the lower unit of the Hammam Faraun Member. It contains retrogradation shales deposited with the sea-level rise to the Maximum Flooding Surface (MFS) according to the record of the LAD of Praeorbulina circularis (Figure 8). During the ensuing sea-level fall, the progradational sandstones of HST2 in the upper unit of the Hammam Faraun Member deposited, coinciding with international sea-level reductions noted by [57,145] within the same time window.
The reconstruction of Sea Surface Temperatures (SSTs) obtained from boreholes 112-58 and 113-M81, located within the Gulf of Suez, and the global climatic phases described within the Miocene epoch by [146] indicates considerable paleoclimatic correlations corresponding to Middle Miocene times. A comparative evaluation of the delineated depositional sequences with the eustatic and regional models defined by [57] indicates multiple levels of concordance with previously defined stratigraphic schemes, where LA.SQ2 is better correlated with world trends than LA.SQ1 is mainly when analyzed against Langhian sequences defined within the eustatic-regional model developed by [57]. Figure 8 provides a detailed graphical representation of the positions of the boreholes together with their associated systems tracts, effectively displaying the temporal and geographical distribution of the depositional sequences within the studied area.
The paleoclimatic reconstruction further reveals that during the Mi2a oxygen isotope event, the surface water temperatures of the Gulf of Suez exceeded the Global Average Temperature (GAT) by about 1.8–2.1 °C (Figure 8). The noted temperature anomaly represents a regional amplification of global climatic trends by the increased regional warming typical of the Middle Miocene Climatic Optimum.
Both examined boreholes effectively preserve the architectural sequence, with boreholes 112-58 (2359–2422 m) showing all of LA.SQ1 (HST1 anhydrite) and LA.SQ2 (TST2 shales transitioning to HST2 sandstones). In contrast, borehole 113-M81 (2050–2099 m) preserves LA.SQ2, with TST2, shales upwards into the HST2 sandstones typical of the Hammam Faraun Member. The combination of biostratigraphic markers, including the First Appearance Datum (FAD) and Last Appearance Datum (LAD) of important planktonic foraminiferal taxa, provides excellent chronostratigraphic control on the demarcation of sequence boundaries and system tracts and thus on precise global climate change and sea level change correlations.
The architectural sequence records a fundamental change in the control of sediment deposition: LA.SQ1 records tectonically localized control, attested by anhydrite occurrence within basin boundaries, while LA.SQ2 records a trend towards eustatic control in the Langhian. Such a change explains the difference between the lack of carbonates on evaporative highs of LA.SQ1 and the classically-dominated sedimentary fill of subsiding troughs in LA.SQ2. In addition, region-wide warming of sea surface temperature during Mi2a further predisposed the basin to more extensive clastic input accommodated by the transgression in LA.SQ2.

4.5. Petrophysical Analysis

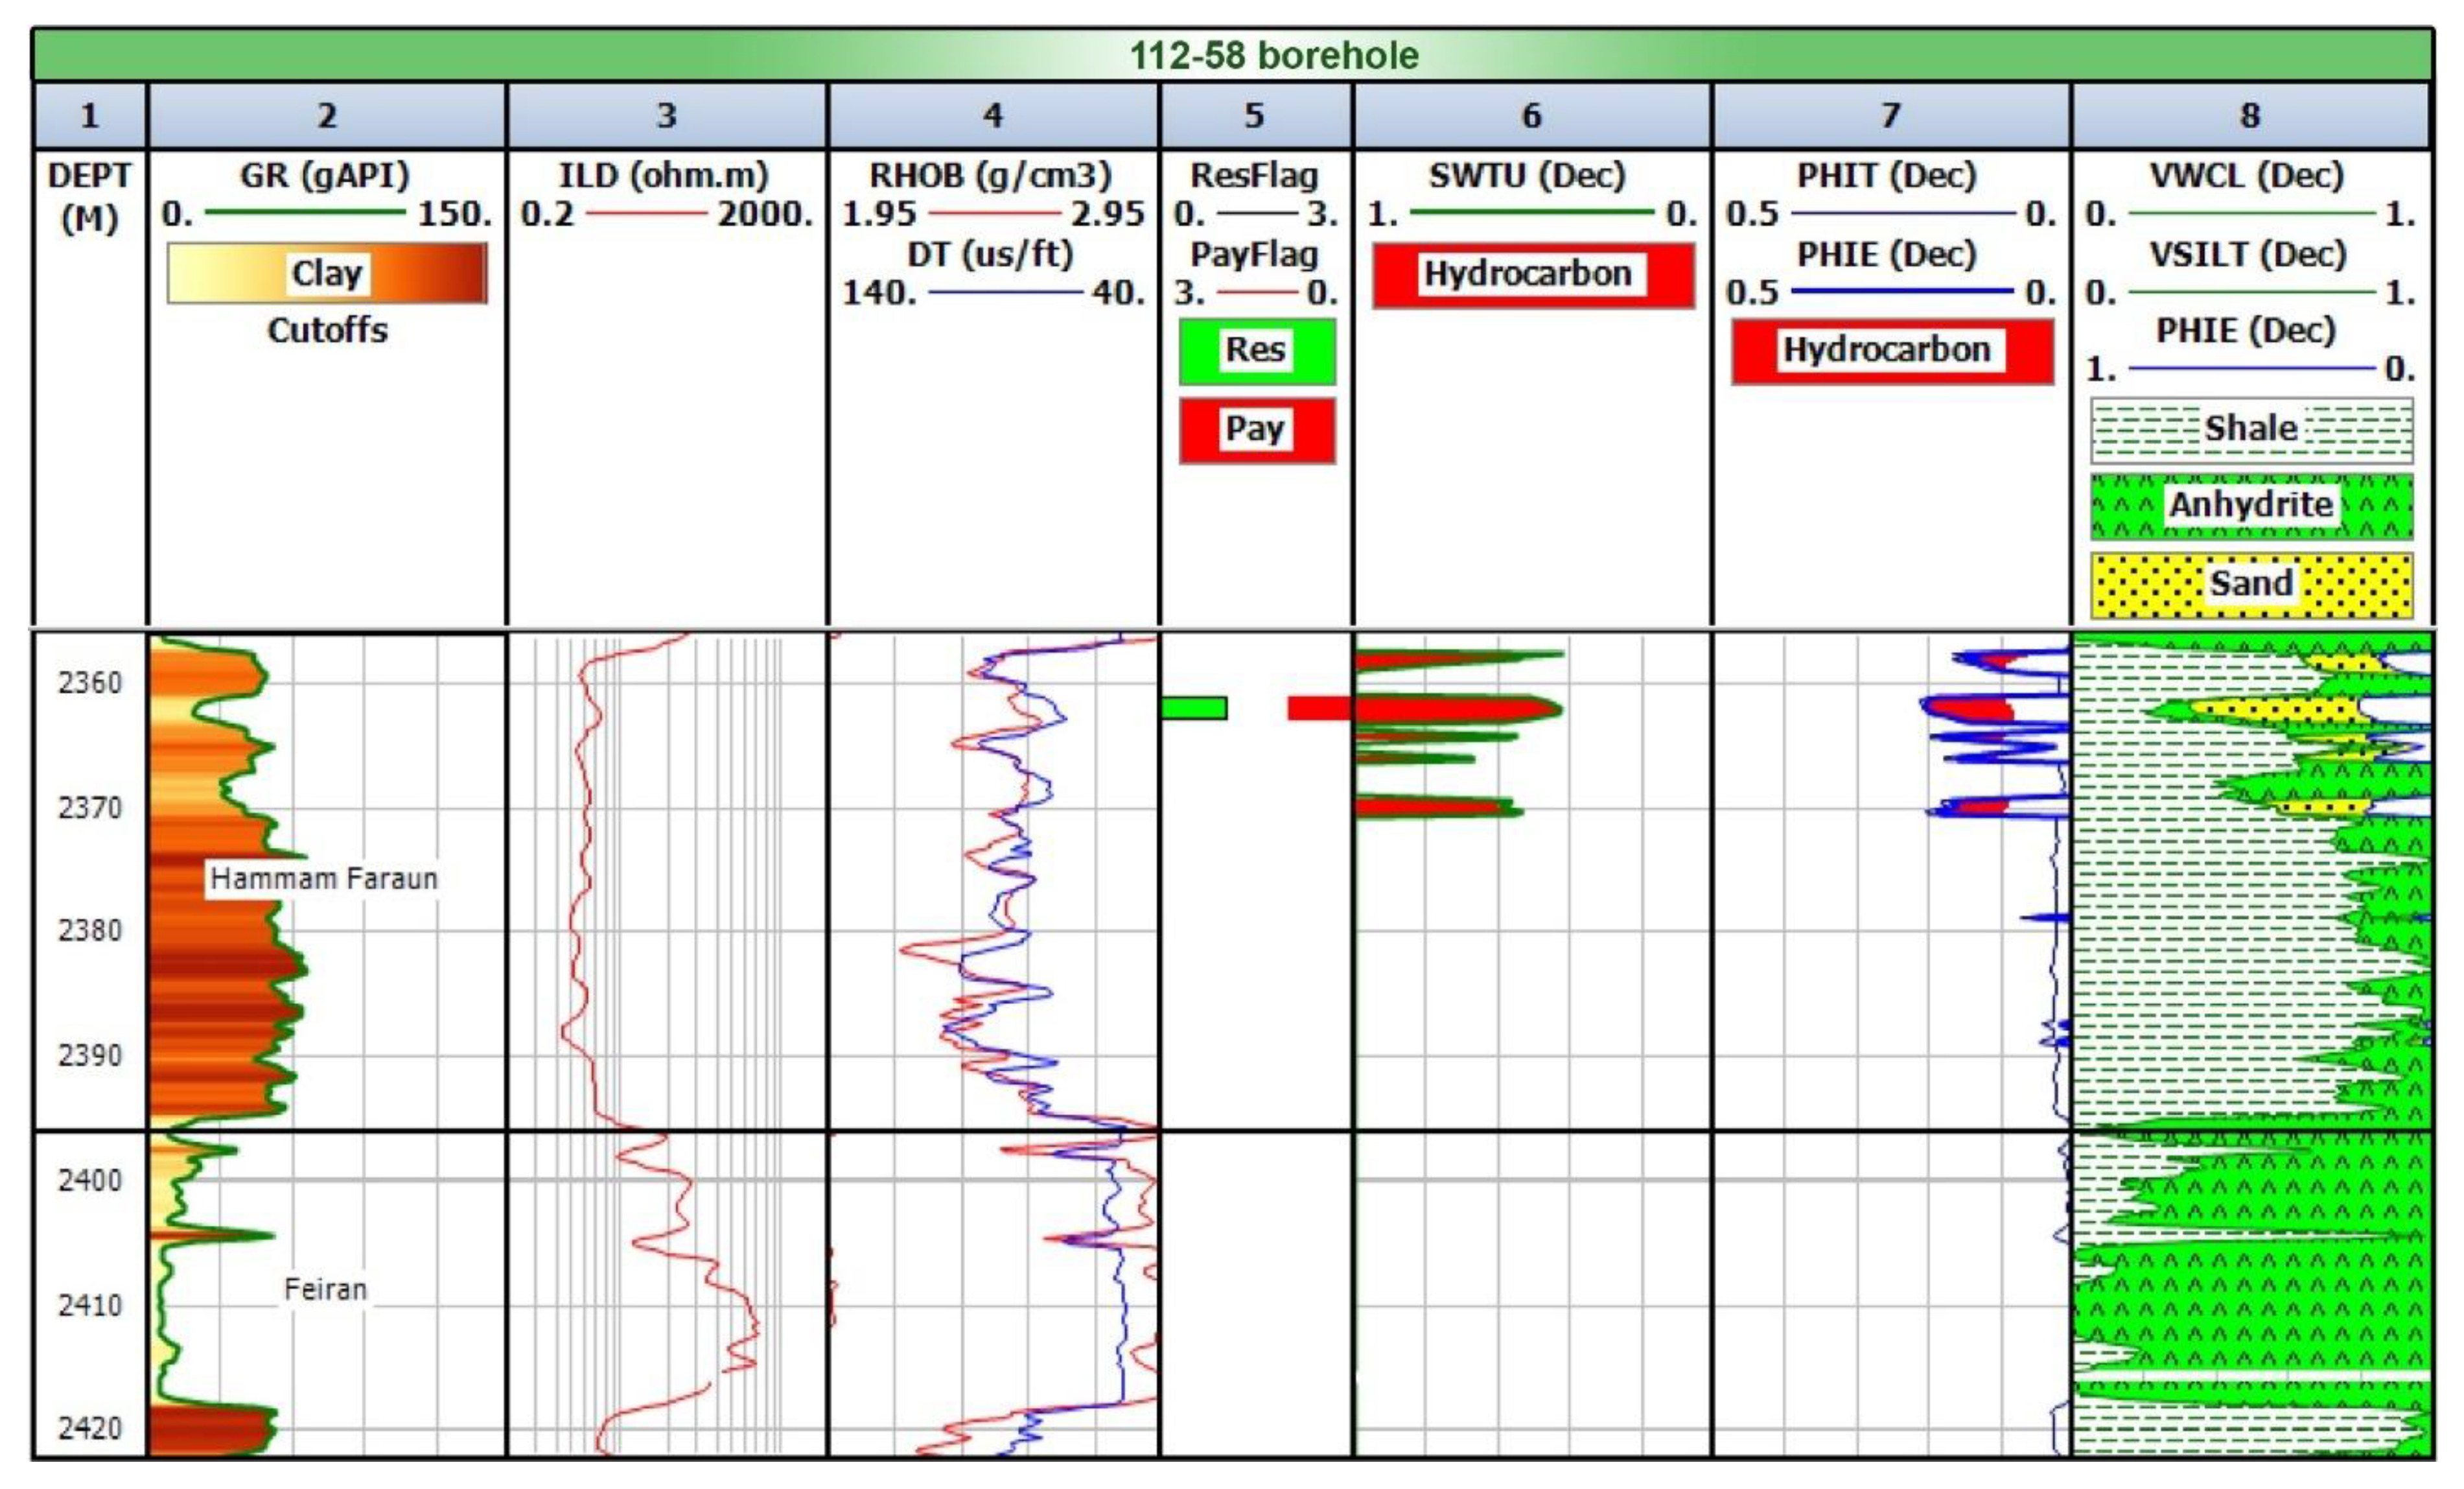
The complete evaluation of Computer-Processed Interpretation (CPI) logs of wells 112-58 and 113M-81 (Figure 9 and Figure 10) provides valuable insights into reservoir qualities of the Hammam Faraun Member of the Belayim Formation. Graphical displays created using CPI indicate high vertical variability of reservoir qualities with a repeating train of both high- and low-quality zones caused by an active depositional setting combined with subsequent diagenesis. This detailed visualization delineates areas of heterogeneous facies types, such as porous, grain-dominated carbonates as central flow units, juxtaposed to more compact, mud-dominated zones that have the potential to act as vertical flow barriers (Figure 9 and Figure 10). Vertical porosity values observed, spread from 15 to 22%, and permeabilities exhibiting variation through many orders of magnitude reflect a considerable rise in both wells. Moreover, patterns of the distribution of the fluids show associated heterogeneity with alternating intervals saturated with hydrocarbons to those bearing waters, thus depicting the compartmentalized nature of the formation.
The facies heterogeneity represented on the CPI plots indicates heterogeneous strata with differing reservoir qualities, which reflect cyclical depositional and diagenetic activity. Variations within these qualities create a complex web of potential flow channels and barriers that directly affect reservoir performance since alternating high and low permeability zones create a superimposed geometry such that responses to production vary widely along different intervals. Intervals with high permeability and porosity make excellent targets to perforate and complete, while more constricted zones may require stimulation to enhance connectivity.
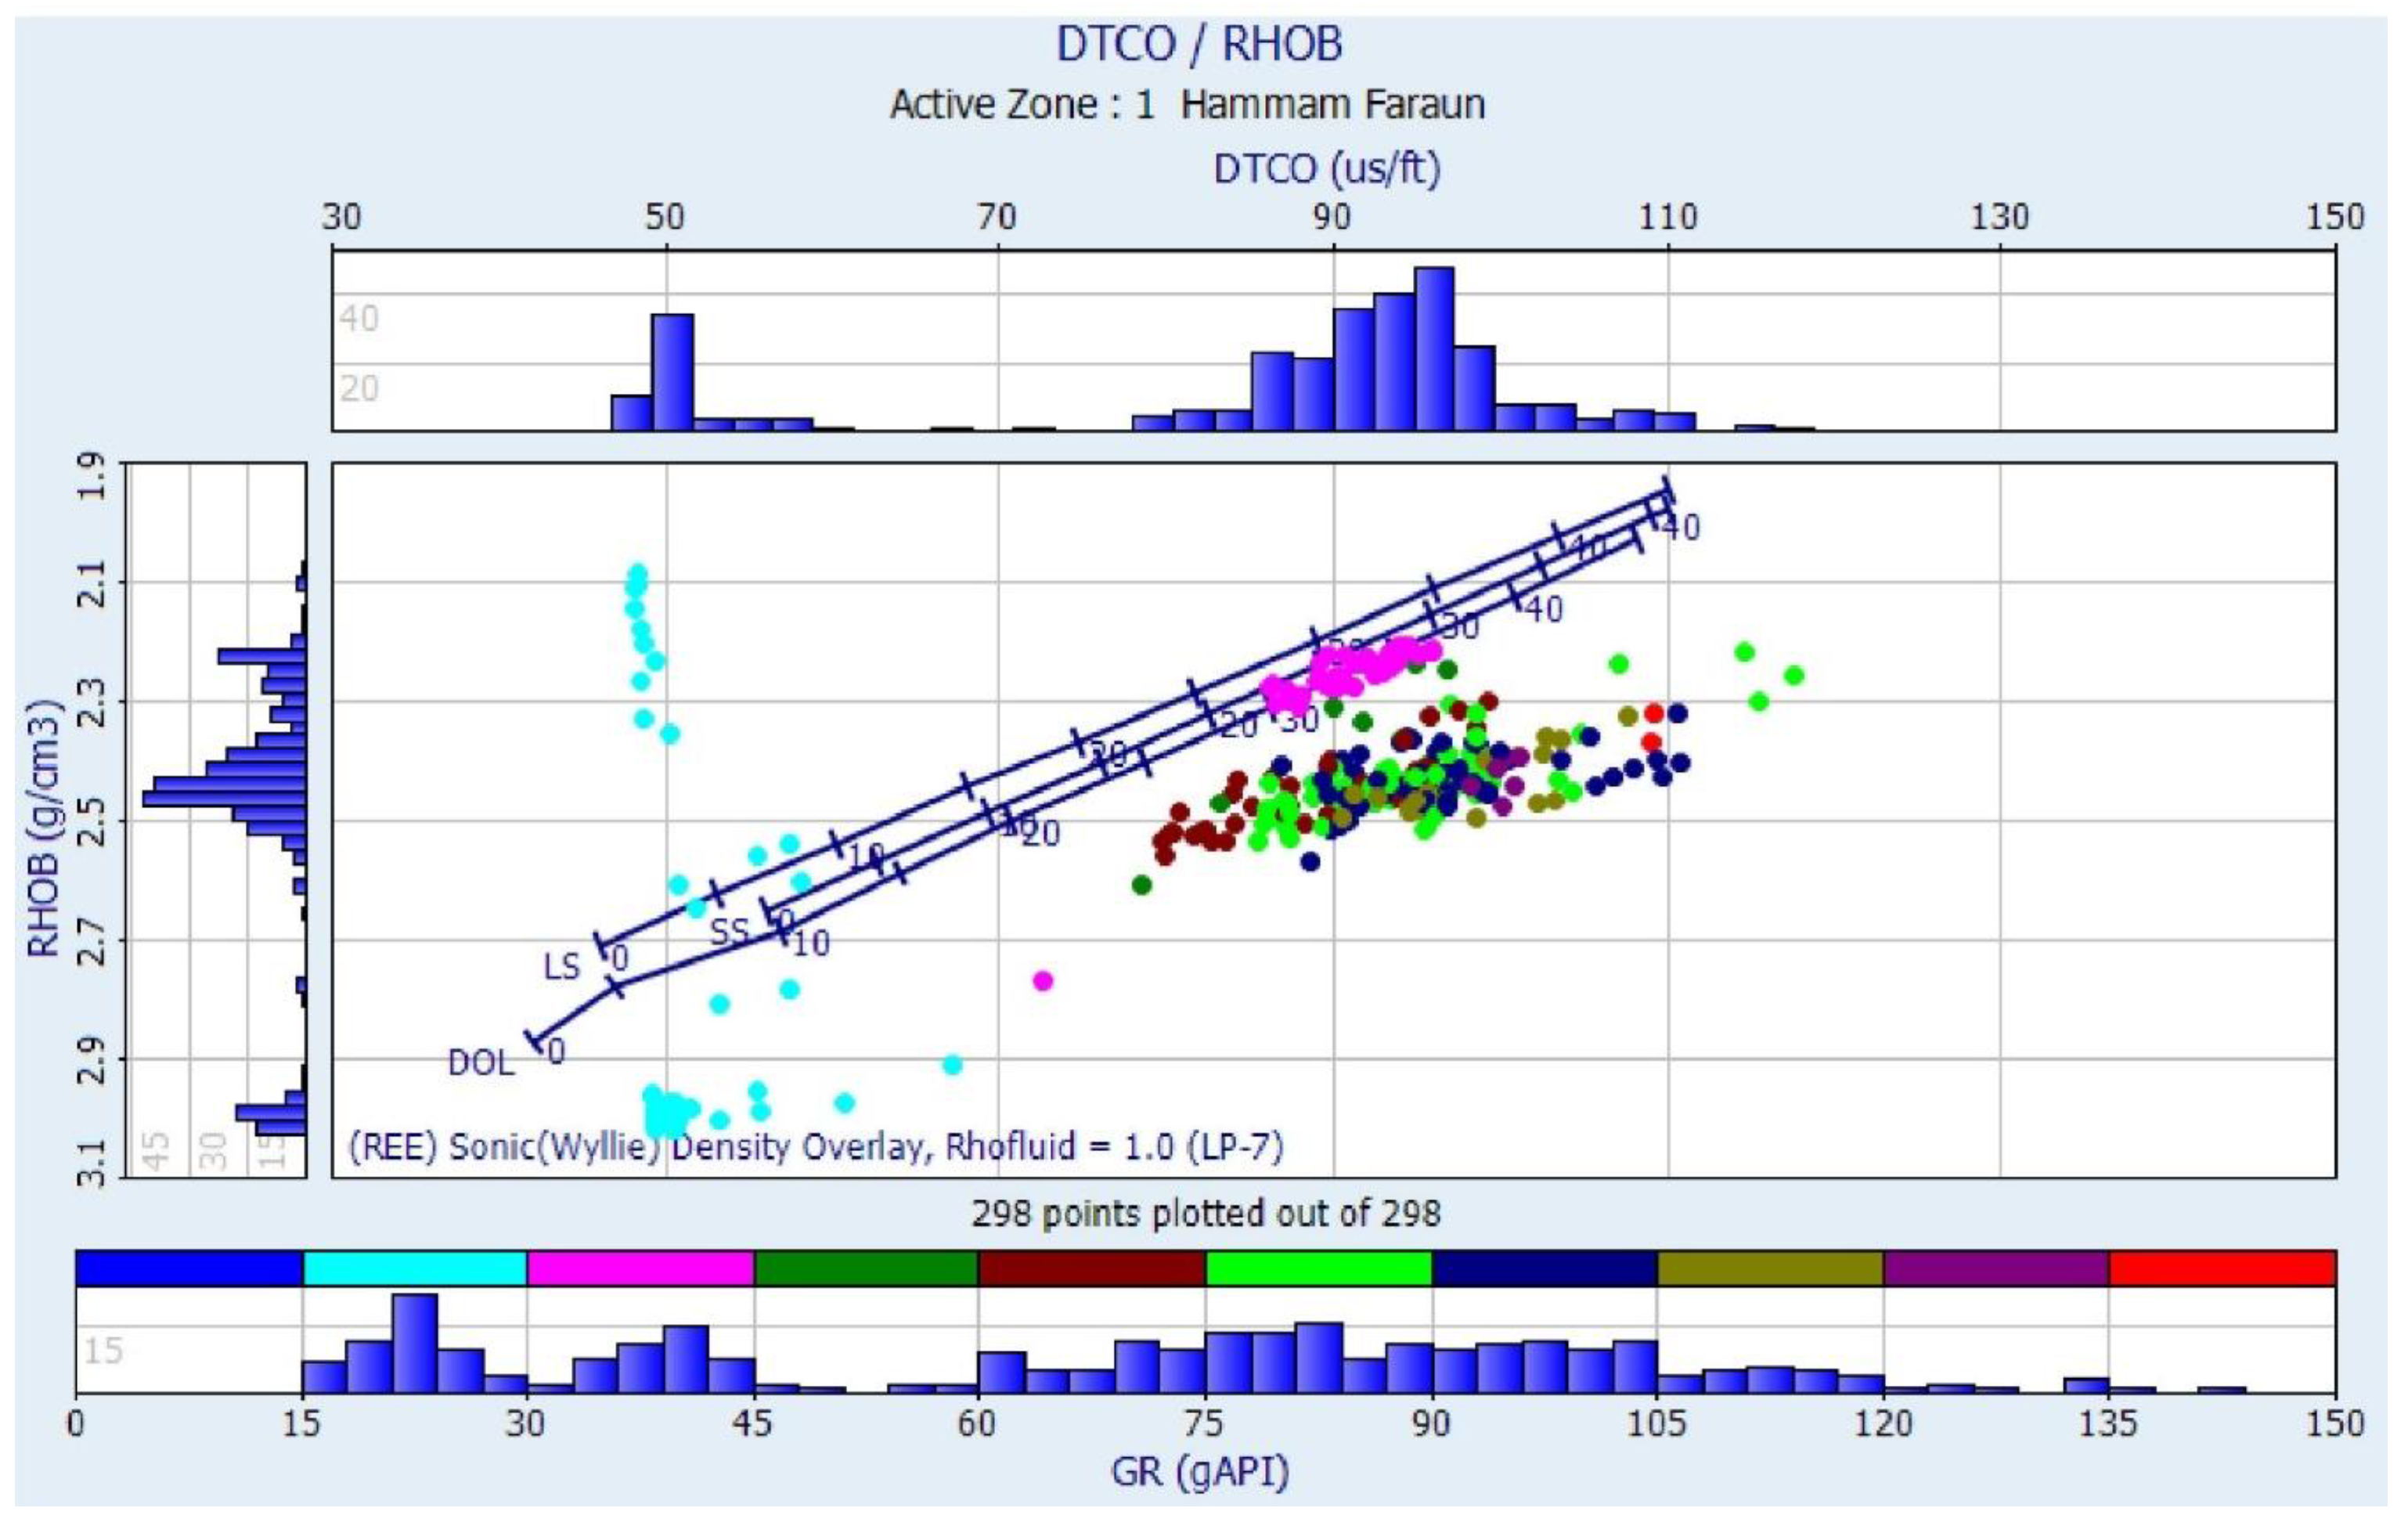
The Sonic Density cross-plot (Figure 11) confirms the occurrence of a mixture of carbonate–clastic lithology within the Hammam Faraun Member, indicated by trends of data corresponding to both limestone/sandstone (low DT with high RHOB) and shale/siltstone lithologies. Three distinct lithologic clusters, critical to reservoir characterization, are defined using the DTCO-RHOB cross-plot. A cluster corresponding to dolomite (DOL) displays high-density values (2.7–2.9 g/cm3) and lower transit times (40–55 μs/ft), indicating the presence of high-density zones altered by diagenesis. These zones likely have the potential to form pore space through dolomitization.
Such a cluster corresponding to limestone (LS) is defined by moderate density (2.5–2.7 g/cm3) and transit times (50–70 μs/ft) that reflect compact, tight-siliciclastic facies of carbonates with diminishing reservoir potential. The sandstone (SS) cluster reflects low-density values (2.1–2.3 g/cm3) and high transit times (70–90 μs/ft) that reflect porous siliciclastic reservoir facies with a high storage capacity.
Data shows significant lithological variation, with a prevalence of low RHOB values (less than 2.3 g/cm3) and high DTCO values (more than 80 μs/ft). On the other hand, high-density areas are equivalent to high-density values (more than 2.5 g/cm3) and low transit times (less than 60 μs/ft; Figure 11). The low variation between DTCO and RHOB reflects the lack of a gas effect in the intervals studied. This cross-plot analysis highlights sandstone and porous limestone intervals as primary reservoir targets. In contrast, dense dolomite and tight limestone are non-reservoir facies or possible targets for fracture stimulation.
Net Pay Thickness analysis shows a remarkable difference between the two wells, which has important implications for reservoir development strategy. Well 112-58 has a more productive zone with a thickness of 1.8 m and a higher hydrocarbon saturation of 55% (see Table 4). In comparison, the interval in 113M-81 is thicker at 2.7 m but is less productive, with a hydrocarbon saturation of only 33% (see Table 4). The high shale content in the 113M-81 borehole, which reaches 41%, primarily accounts for the difference, while the 112-58 borehole has a shale content of only 26%. The adverse effects on reservoir performance are reduced effective permeability, decreased porosity, and increased retention capacity.
Effective Porosity (ϕe) measurements range between 17% and 19% (see Table 4) for the two wells, indicating a modest degree of reservoir quality typical of mixed carbonate–clastic reservoirs. Well 112-58 exhibits a slightly better porosity of 19%, which we can directly link to its cleaner lithological composition and lower shale content (Vsh). Such a correlation of shale content with porosity is consistent with well-established petrophysical principles, where clay minerals are known to block pore spaces, thus reducing overall reservoir quality through pore-filling and pore-lining mechanisms.
The Water Saturation (Sw) analysis has important production implications that distinguish the reservoir potential of the two wells. Well 112-58 has a better Sw of 45% (Table 4), indicative of a high potential for the recovery of hydrocarbons and that the well is facing beneficial conditions within the reservoir. Well 113M-81 has a higher value of Sw at 67%, and this might reflect a possible transition to water-saturated facies within the reservoir unit or simply the effect of the capillary trap within finer lithologies. A higher saturation value and the higher percentage of shales in Well 113M-81 indicate that this is encountering a less favorable portion of the reservoir system. This situation likely reflects a facies transition zone from reservoir to non-reservoir rock, a rise within the unit of the depositional sequence, or proximity to the initial oil–water contact.
The integration of petrophysical log data with sequence stratigraphy unlocks important vertical and lateral heterogeneity within the Hammam Faraun reservoir, thus providing key insights into depositional mechanisms that control reservoir quality (Figure 8). Graphical plotting of the P/B ratio displays cyclical reservoir quality variation with R-values ranging from 0.8 to 239.5, correlatable with the high-energy and low-energy depositional environments that controlled the facies distribution and associated reservoir quality. Higher P/B values (above 100) indicate coarse-grained, permeable layers characteristic of highstand systems tracts (HSTs), which possess excellent reservoir quality. These layers also show reduced sigma values and define the main producing zones within the formation. Lowered P/B values (below 50) manifest within the framework of dense, shalier layers characteristic of transgressive systems tracts (TSTs) that function to form a vertically sealing seal to fluid movement and result in the compartmentalization of the reservoir.
The differences in unit thickness among the comparative units highlight the significant facies transitions within the study area. Of particular interest are the relatively intact carbonate facies of the 112-58 borehole that have porosity-permeability features favorably compared to those of the corresponding clay-rich units within the proximal 113M-81 well. Sharp contrasts of P/B ratios and sigma values distinguish sequence boundaries, corresponding to cycles of depositional energy and sea levels that controlled sediment availability and accommodation space.
This detailed petrophysical evaluation identifies three distinct reservoir flow units that have unique production behavior and petrophysical properties. The upper unit corresponds to HST deposits with consistently high-quality reservoir characteristics, the intermediate unit to transitional facies with moderate reservoir potential, and the lower unit to variable quality that is a function of the specific local depositional conditions. This compartmentalization within this reservoir highlights the importance of accurate completion practices and optimal position of prefs to increase the recovery of hydrocarbons within this complex carbonate–clastic framework, where a detailed understanding of vertical and lateral heterogeneity is critical to successful field development and production maximization.

4.6. Petrographic Analysis

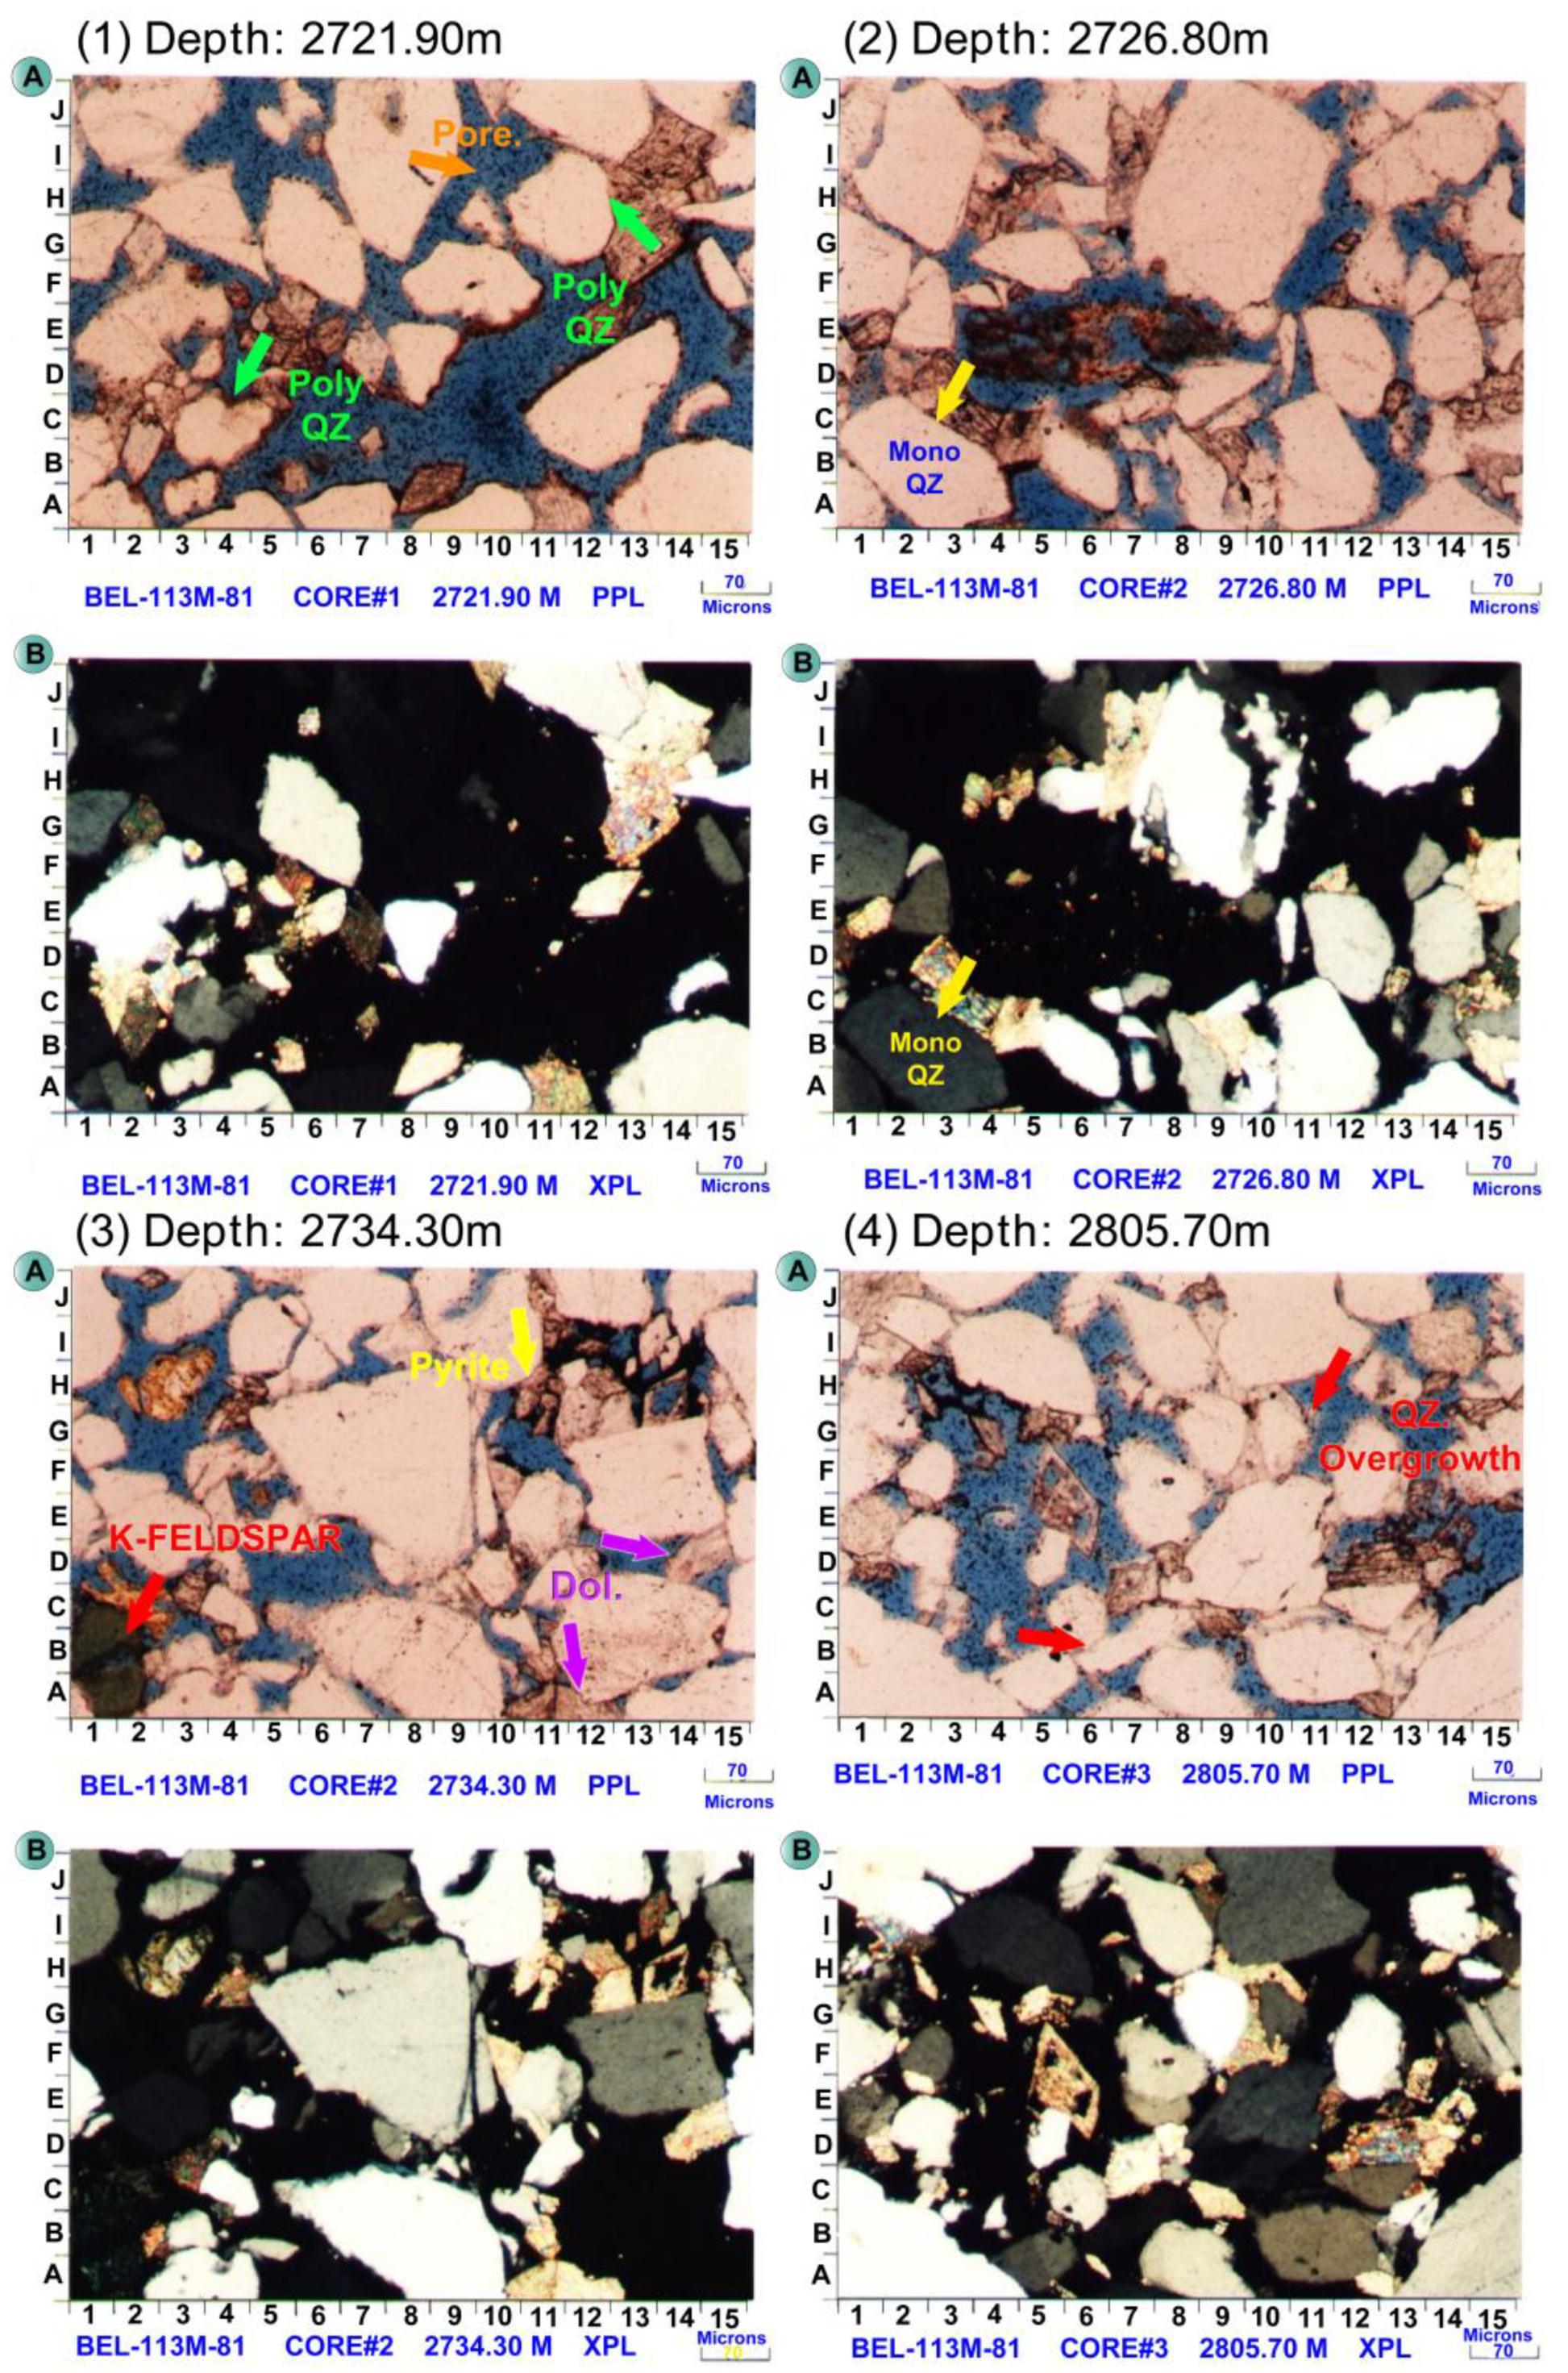
The petrographic study of four representative thin sections, also supported by scanning electron microscopy (SEM) imagery of the Hammam Faraun Member, provides extensive details about the reservoir quality of the sandstone concerning its composition, texture, and diagenesis (Table 5, Figure 12 and Figure 13).
The analyzed samples consist of quartz arenites with a predominant component of monocrystalline quartz that is the primary framework component (46.5%–51%), together with subordinate detrital material including polycrystalline quartz (2.5%–4.5%; Figure 12 thin section (1) photo A; C 3–4 and H 11; green arrows), feldspars (trace–2%), lithic particles (claystone and chert), glaucony (trace–1.5%), micas (trace–0.5%), and phosphatic particles. Such a high compositional maturity reflects high sediment reworking and transportation activities that have allowed the summation of the most chemically and mechanically stable components at the expense of the less stable material.
The lithology of framework grains is analyzed with the study of monocrystalline quartz, showing characteristic undulose extinction with trace to minor fluid and solid inclusions and indicative of sources from metamorphic and plutonic source rocks (Figure 12 photo B; A–C 1–4, thin section (2) yellow arrow). Polycrystalline quartz, with a composite crystal morphology and sutured texture along the grain boundary, indicates a granitic origin, coincident with the source from crystalline basement complexes of the Red Sea Hills and the Sinai [147,148]. Feldspar occurs in trace to minor amounts (Figure 12 photo A; stained yellow, thin section (3); red arrow), where plagioclase tends to undergo alteration and leaching along cleavage planes, thus increasing porosity through solution mechanisms. Coincident with the qualitative occurrence of K-feldspar and plagioclase, this indicates origin from crystalline basement rocks, and the degree of alteration corresponds to the effects of burial diagenesis and fluid migration on the evolution of reservoirs.
The lithic particles consisting of detrital chert and claystone constituents form minor percentages together with detrital clays (0.5%–2%; see Figure 12) that reflect a limited sedimentary source input. The occurrence of glaucoma as oxidized pellets (see photo A Figure 12; D–E 4–6) suggests intervals of slow sedimentation rates and seafloor floor conditions that allowed the growth of authigenic minerals. Muscovite-dominant micas and denser minerals such as zircon, tourmaline, and epidote indicate a multicomponent origin. Both igneous and metamorphic sources contribute to the extensive clastic framework, which features predominantly quartz derived from igneous and metamorphic processes.
The texture of these sandstones suggests a lack of compaction, with the abundance of point grain contacts indicative of a lack of substantial mechanical compaction upon burial. Preserving this open framework texture has been critical to providing primary porosity and permeability. These sandstones contain well-preserved primary interparticle porosity, which is still higher due to the development of secondary intraparticle pore space through the dissolution of feldspar, lithic clasts, and carbonates. There is a considerable range in pore size, between 30 and 350 μm, with larger pore sizes (>200 μm) developed through complete leaching out of grains that have resulted in the removal of framework components. Connectedness of the pore network is determined to be good to very good, allowing efficient fluid movement and increasing reservoir quality.
Point-counted porosity values (23% to 26.5%) correlate very well with helium porosity (23.1% to 25.5%) values, thus confirming the quality of the petrographic Analysis and supporting the petrographic assessments (Table 5). The excellent retention of high porosity is critical to sandstones that have experienced burial diagenesis, with documentation of the combined effects of minimal compaction, differential dissolution activity, and the protective role of earlier diagenesis stages.
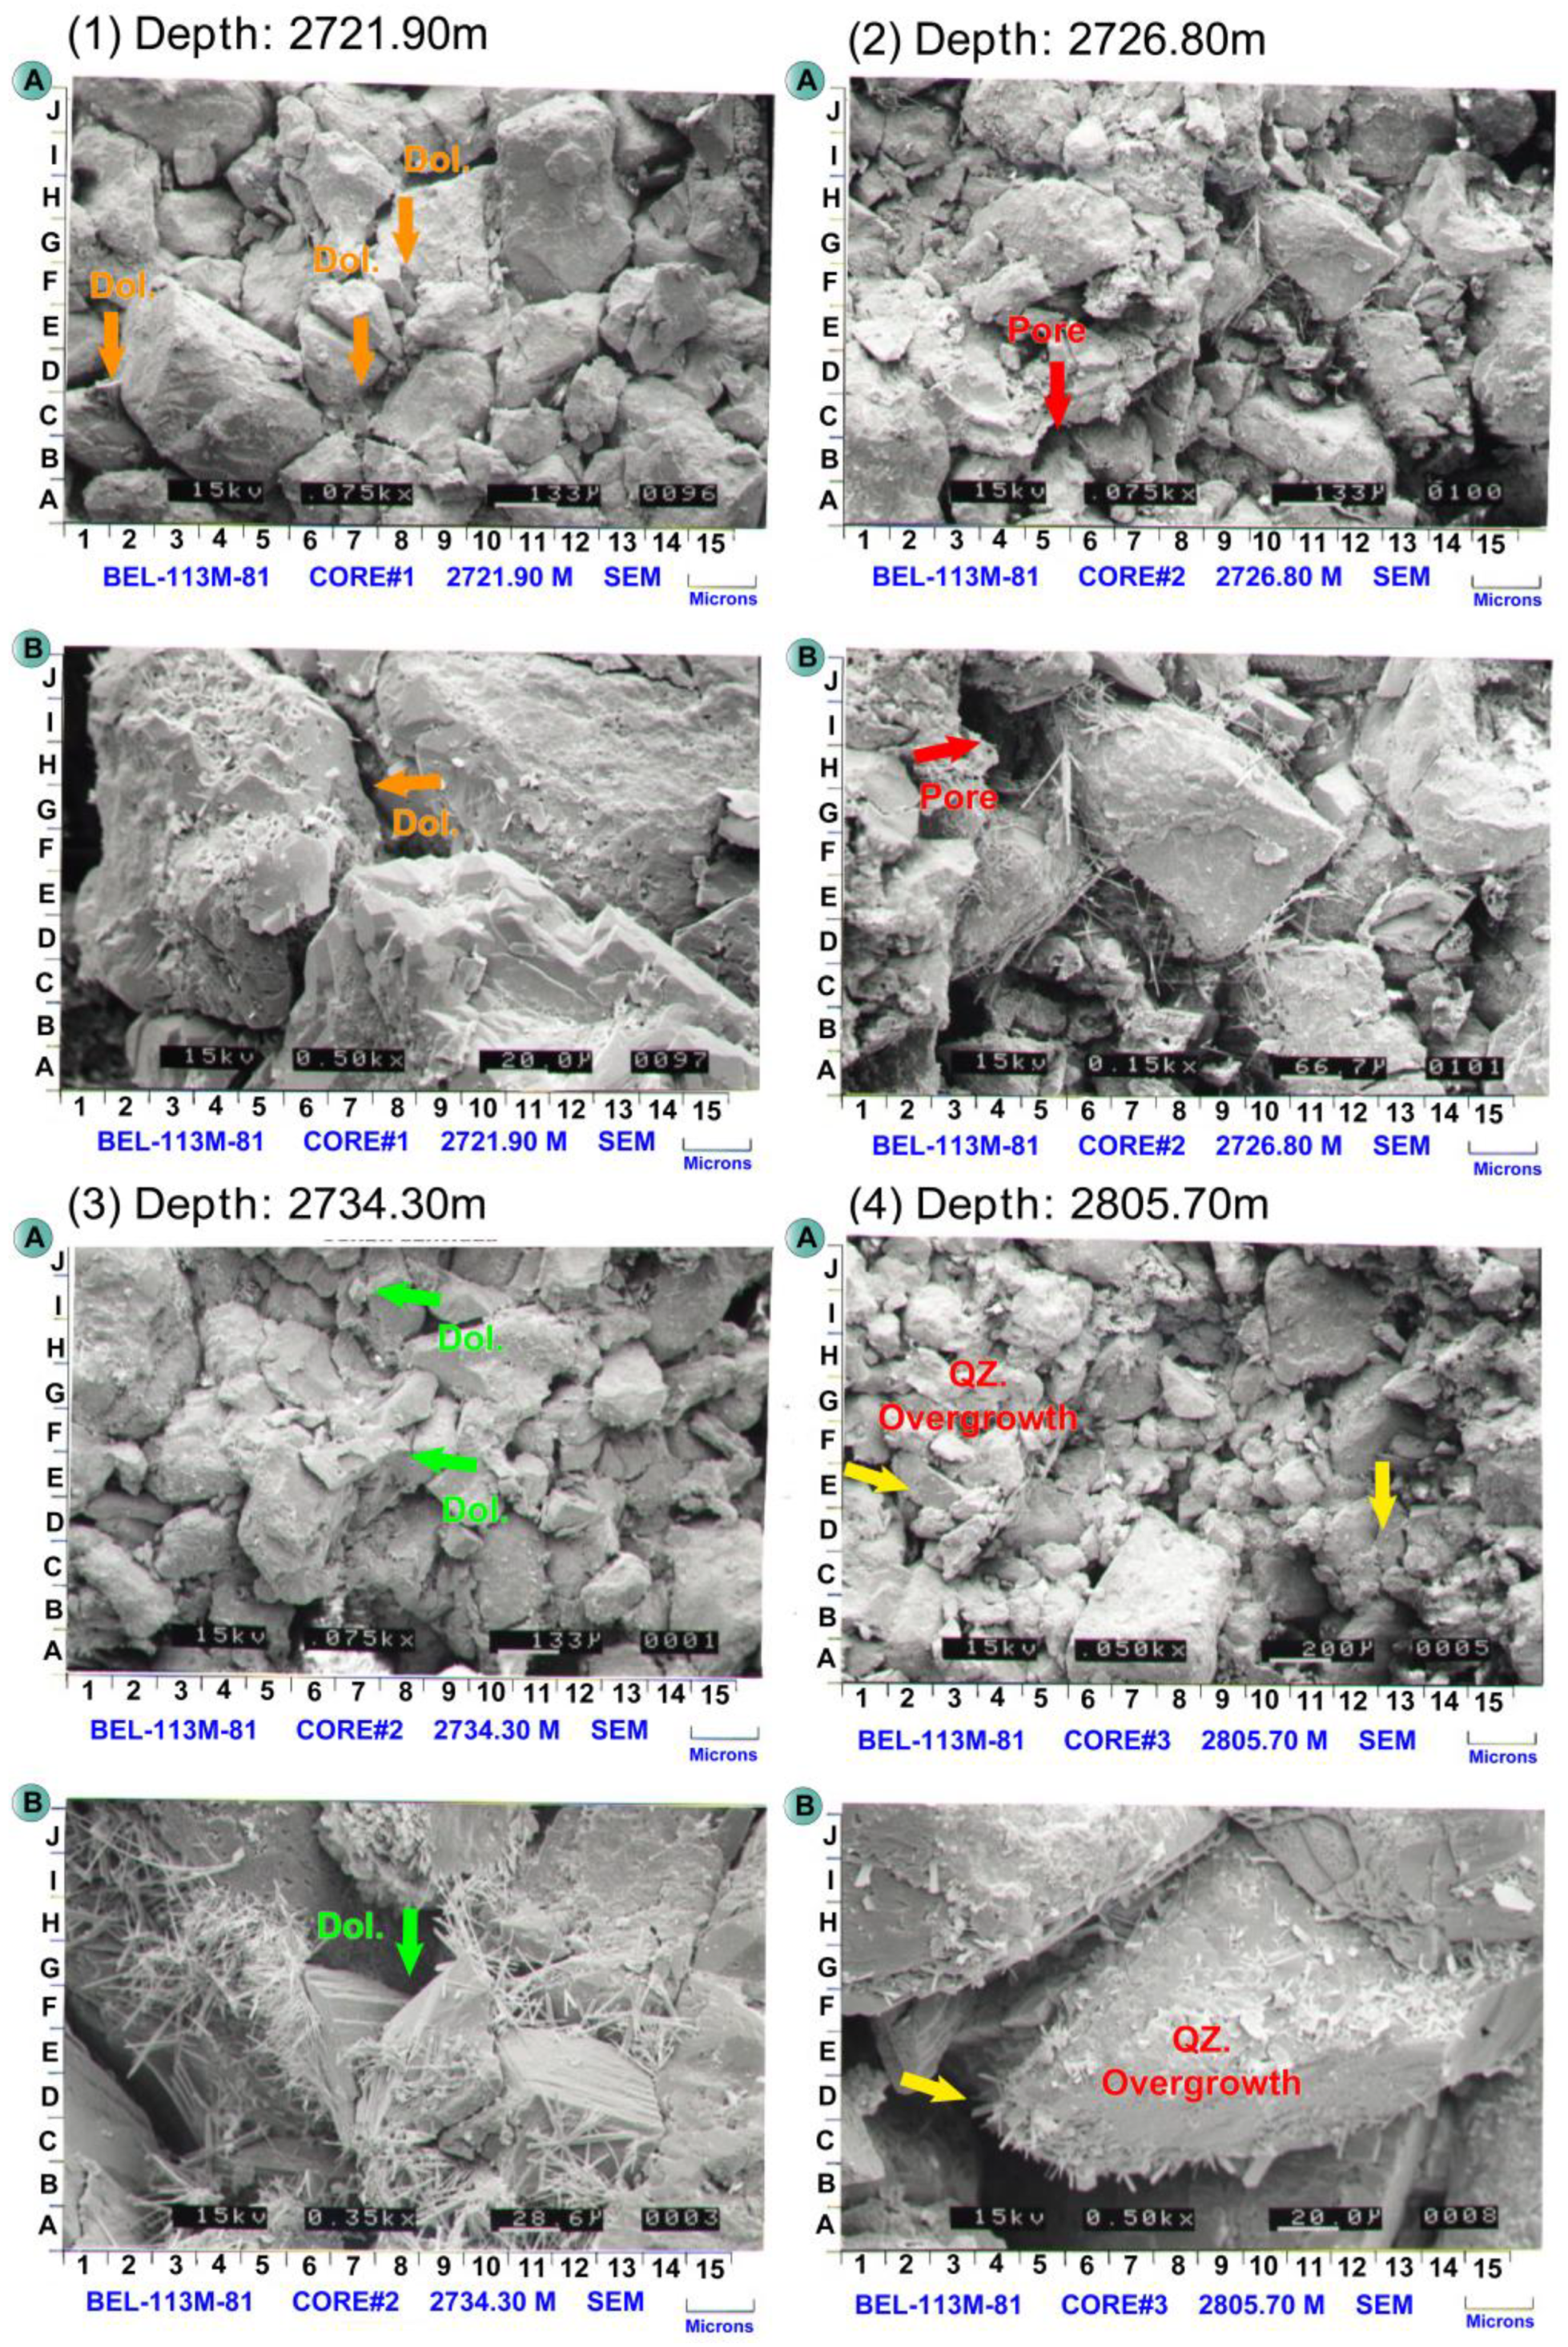
Diagenesis has an important impact on reservoir quality, typified by specific mineral dissolution and precipitation stages. Authigenic cement plays a significant role in defining reservoir characteristics, with dolomite being the principal diagenetic constituent, making up 10% to 16.5% of the total content, and the major cement accounting for pore occlusion in the sandstone matrix (Figure 12 photo B of thin section (3) A 11–12, E 14–15 & H 11–14; purple arrows). The carbonate cement displays various morphologies, such as large forms that plug pores and replacement textures in which it has selectively replaced feldspar grains and lithic clasts, forming euhedral rhombic crystals, as illustrated by scanning electron microscopy (SEM) images (Figure 13). The widespread occurrence of dolomite cement is indicative of the impact of carbonate-rich formation waters. It attests to the complex interaction between clastic and carbonate depositional settings in the Hammam Faraun Member.
The quartz overgrowths make up about 1%–2.5% of the total rock volume (Figure 13 SEM (4) E2 & D 13; yellow arrows) with syntaxial rims on detrital quartz grains that not only reduce porosity and permeability but also contribute to mechanical strengthening, thus hindering further compaction. Pyrite appears in the form of single crystals and framboidal groups, making up 0.5%–1.5%, that indicate the presence of reduced conditions at early diagenesis, probably associated with organic matter decay within sea sedimentary environments (Figure 12 thin section (3) photo A; H10; yellow arrow).
The mineralogical makeup of the clay is important to reservoir effectiveness, with detrital clays making up only 0.5%–2% of the total volume of the rock. On the other hand, authigenic kaolinite (≤11%) is characterized by pore-overgrowth and booklet-shaped crystallite orientation, often covering grain surfaces and subsequently reducing pore space (Figure 13 SEM (2) photo A–B 5; red arrows). Authigenic kaolinite forms closely with the alteration processes of feldspar, where acidic pore fluids, generated by the decomposition of organic material or meteoric flushing, selectively leach aluminum-rich feldspars. X-ray diffraction studies confirm the illite formed through direct decomposition of feldspar and some of the original kaolinite undergoing high-temperature, partial metamorphism due to progressive burial.
The porosity development in these sandstone reservoirs demonstrates the complex interplay between porosity enhancement and reduction mechanisms. Dissolution of feldspar and carbonate minerals plays a significant role in developing secondary porosity, enhancing storage capacity in quartz-rich regions (Figure 12 thin section (1) photo A1, B3 & I 8–10; orange arrow). In contrast, dolomite cementation and clay formation further reduce permeability and create localized flow barriers (Figure 13 SEM (3) photo E–F 6–7 & I 7). The result of this diagenetic variation is a heterogeneous reservoir character, where the dissolution of susceptible grains creates enhanced porosity in quartz-rich regions, and dolomite cementation closes off pores in clay-rich regions (Figure 13 SEM (1) photo C 1–2, C7 and F8).
The diagenetic sequence obtained through petrographic studies indicates a first phase of early marine diagenesis characterized by the development of glaucony and the precipitation of pyrite. Deeper burial diagenesis follows, causing feldspar dissolution, kaolinite precipitation, and quartz overgrowth growth (Figure 12, photographs A, B 7 & H 11, thin section (4); red arrows). Subsequent diagenesis characterized the samples with dolomite cementation and illite formation, while episodes of leaching created secondary porosity. These diagenetic events highlight the crucial role played by leaching and cementation as the contrasting mechanisms that control the final quality of the reservoir, with the interaction between porosity-reducing cementation and porosity-generating dissolution controlling the final qualities of the reservoir.
This detailed petrographic Analysis explains the different controls on clastic dominance in the Hammam Faraun Member. The quartz-rich detritus from igneous-metamorphic sources overwhelmingly dominates the provenance signature, setting the fundamental clastic backdrop that supports the member’s reservoir quality. Diagenetic partitioning, through selective dissolution and cementation processes, further strengthens this clastic dominance; in particular, the retention of secondary porosity in quartz arenites is responsible for the member’s favorable reservoir quality, while authigenic dolomite cementation enables the formation of localized permeability barriers and thus adds to the reservoir heterogeneity.
The petrographic characterization indicates that the lowering of carbonates indicates both the diagenetic dissolution of carbonates and the provenance-related predominance of quartz. Authigenic dolomite indicates a late-diagenetic process that blocks pore space and does not relate to original sedimentation. Strengthening secondary porosity through selective leaching has been a key factor in maintaining high-quality reservoir qualities within these sandstones dominated by quartz. Compositional maturity coupled with the absence of compaction and favorable diagenesis has resulted in sandstones with excellent porosity preservation and favorable permeability characteristics, making them attractive targets for reservoirs within the Hammam Faraun Member. A delicate interplay among depositional composition, absence of compaction, and favorable diagenesis ultimately controls the presence of clastic reservoirs seen within the formation, where understanding the petrographic controls is important to predict reservoir quality variation within the field and to optimize a completion strategy to extract hydrocarbon.

4.7. Core Analysis (SCAL) Results

Special Core Analysis (SCAL) on core samples representative of the Hammam Faraun Member provides a detailed understanding of reservoir rock properties and fluid behavior of the reservoir, essential to reservoir characterization and development planning (Figure 13, Figure 14 and Figure 15). Joint Analysis involving thin-section petrography, scanning electron microscopy (SEM), X-ray diffraction (XRD), and specialized core tests reveals the complex interrelationships between mineralogically detailed composition, pore geometry, and electrical behavior that control reservoir behavior.
Integrated thin-section microscopy, scanning electron microscopy (SEM), and X-ray diffraction (XRD) analyses confirm that the mineralogical composition of the Hammam Faraun Member consists mainly of quartz-dominated arenites (46.5%–51% monocrystalline quartz) with subordinate dolomite cement (10%–16.5%), authigenic kaolinite (≤11%), and minor feldspars, glaucony, and heavy minerals (see Table 5). Reservoir quality, as assessed by helium porosity and permeability measurements, is highly heterogeneous: high-quality areas (e.g., Sample 5 at 2722.31 m depth) show a porosity of 25.7% and permeability of 2637 mD (Figure 16A), while tighter zones (e.g., Sample 12 at 2726.03 m) have reduced values (18.6% porosity and 408 mD; Figure 16B). Wettability analysis indicates mixed-wet behavior, showing a preferential affinity for hydrocarbons in quartz-rich areas and water-wet behavior in clay-dolomite-rich laminae, thus controlling fluid flow paths.
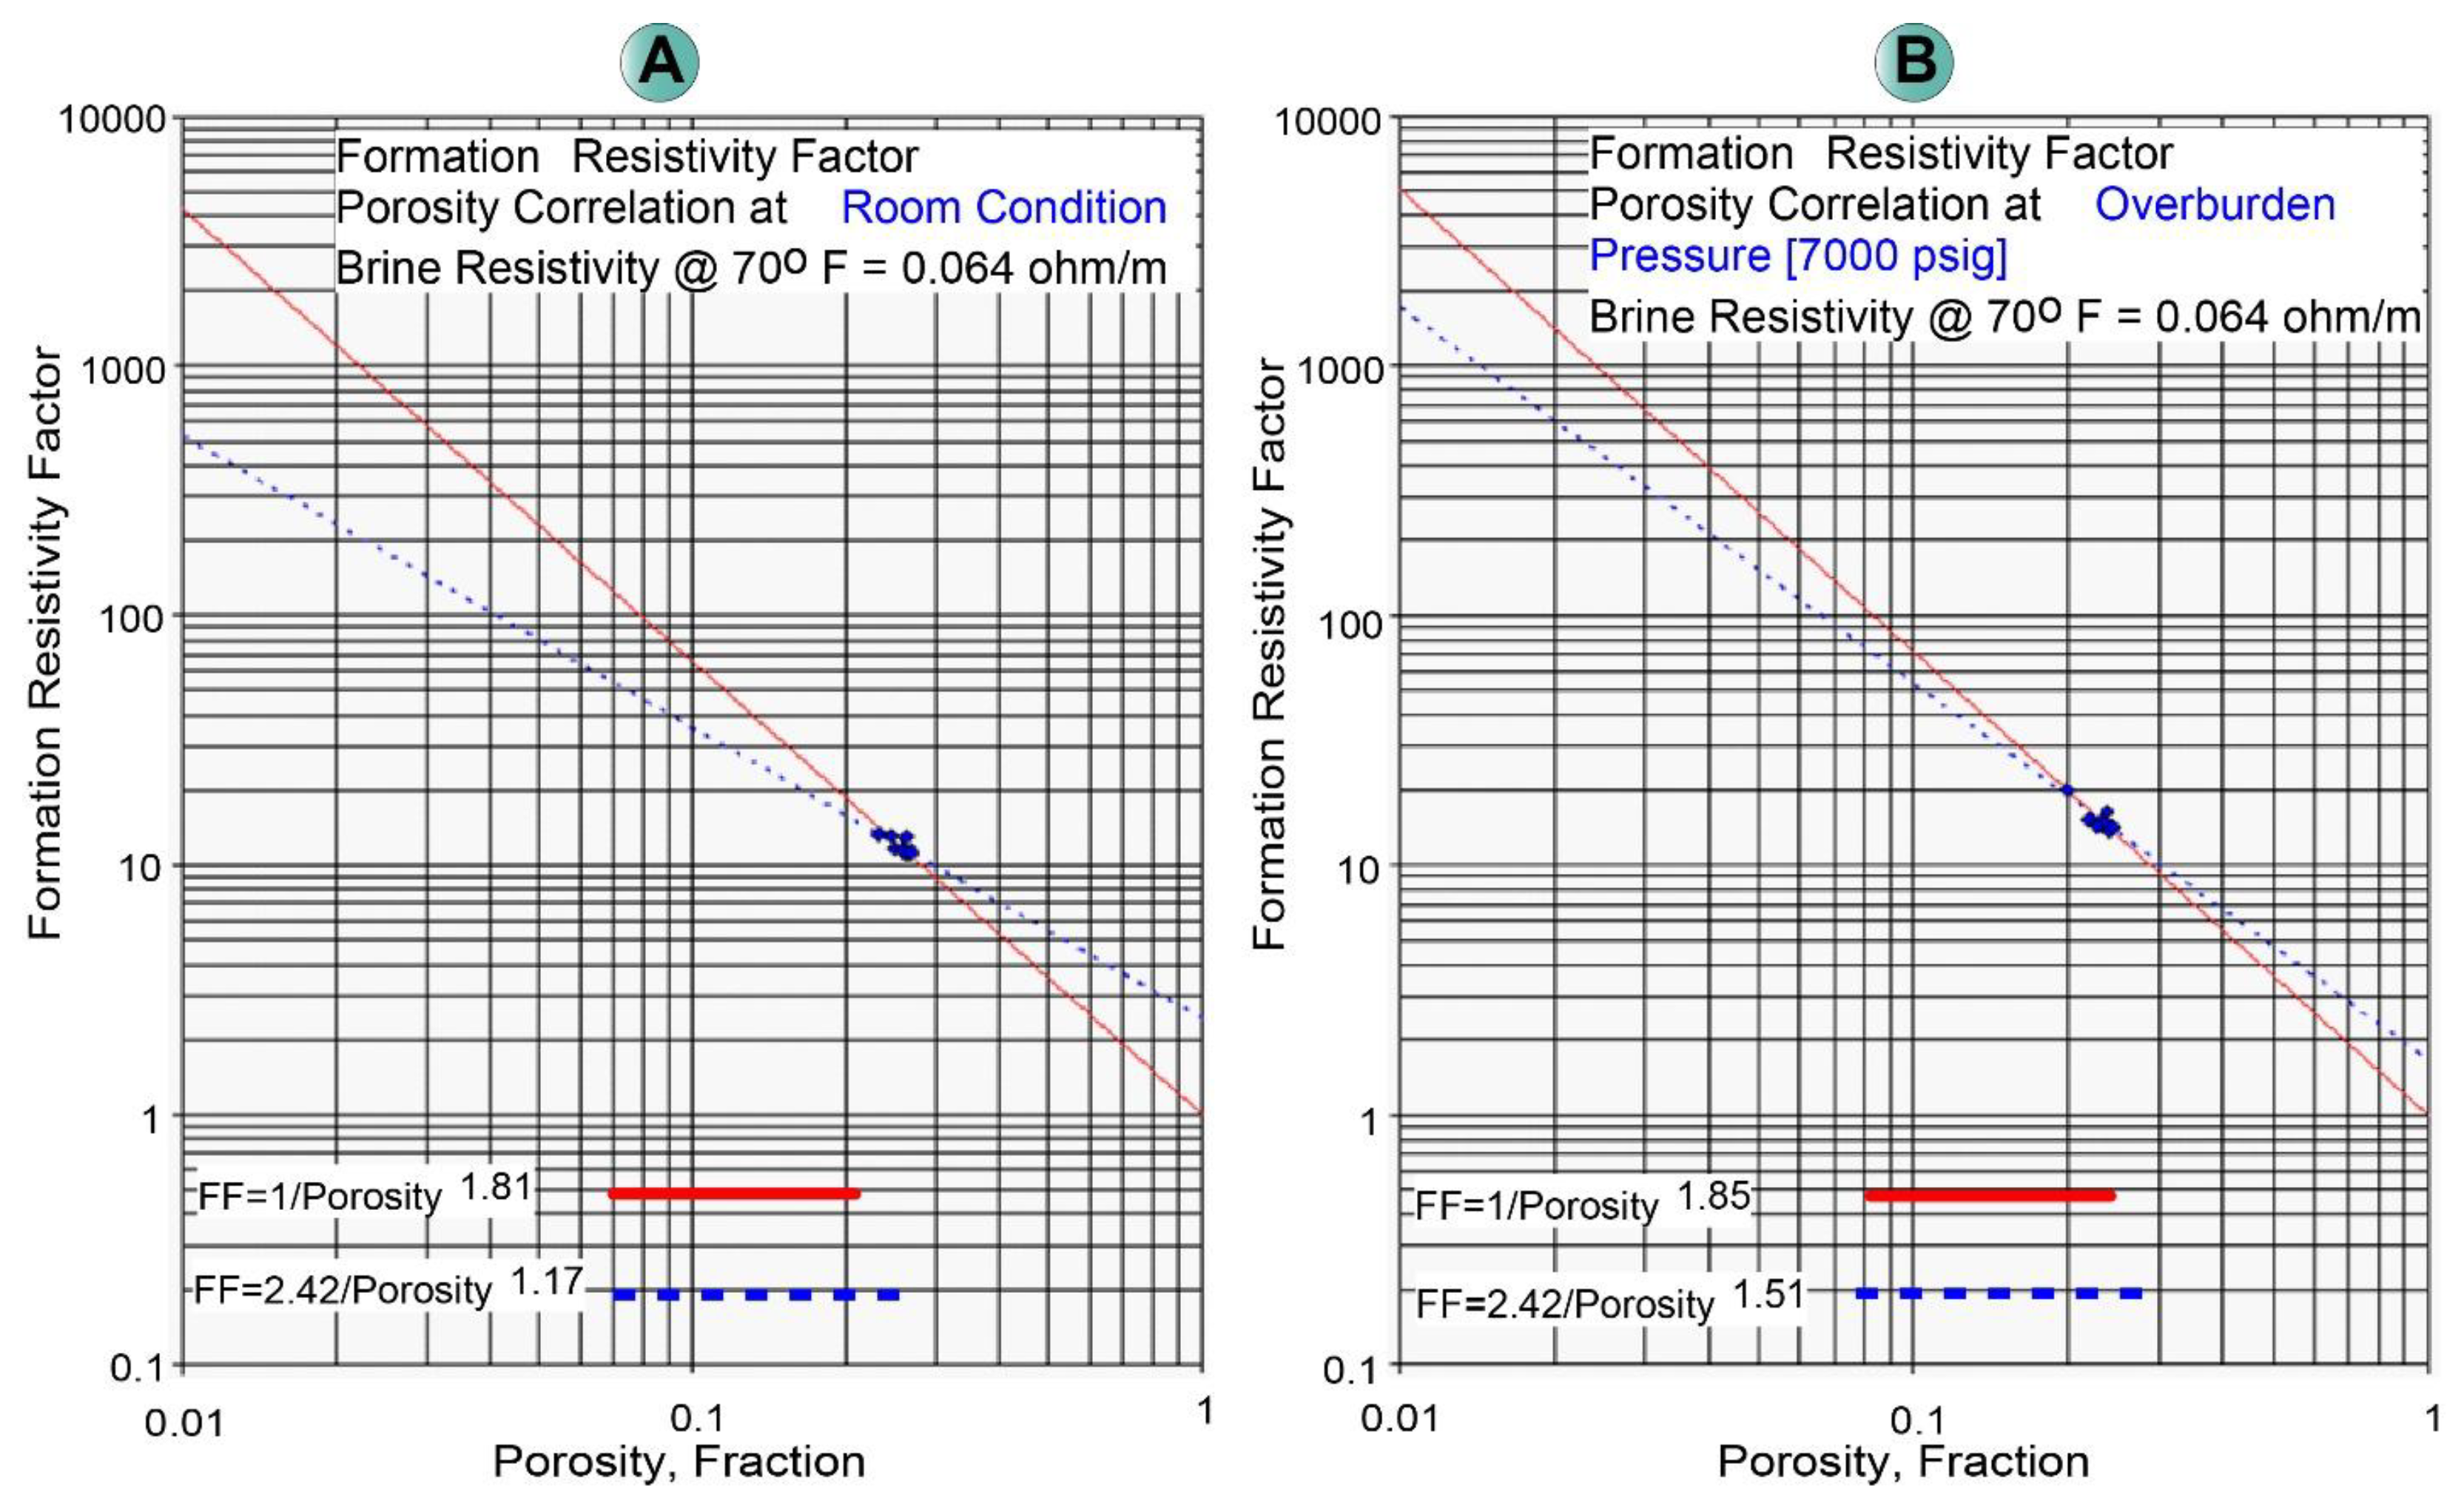
Formation Resistivity Factor determinations were made by systematic electrical measurements, following rigorous sample preparation procedures. Measurements of FRF under simulated overburden pressure conditions (up to 7000 psig; Figure 13A,B) suggest a moderate degree of pore connectivity, with cementation exponents (m) of 1.9–2.1, and tortuosity factors (a) of 0.8–1.1 (Table 2; Figure 14B). These results reflect the impact of quartz overgrowths and dolomite cementation on the electrical flow pathways, where lower cementation exponents in quartz-dominated zones imply improved pore connectivity.
We conducted resistivity index and saturation exponent determinations under both cleaned and restored state conditions to evaluate the effects of wettability and fluid flow characteristics (Figure 15). RI experiments demonstrate distinct saturation exponents (n) between testing conditions:
  • Cleaned State: n = 1.8–2.0, indicating that the pore networks of freshly cleaned samples are homogeneous (Figure 14A,B).
  • Restored State: n = 2.1–2.3, suggesting increased tortuosity due to clay swelling and pore-throat constriction under native hydrocarbon saturation conditions (Figure 15C).
The Analysis of measurements in cleaned and restored conditions reveals significant wettability effects that researchers must incorporate into accurate water saturation calculations from logs and reservoir characterization.
The Mercury Injection Capillary Pressure (MICP) analysis provides a detailed characterization of pore throat distribution and pore-system attributes, which are imperative to understanding fluid dynamic behavior. Laboratory sample preparation included thorough washing and drying procedures followed by systematic mercury injection under controlled pressure with precise volume measurements. Information derived through MICP identifies pore-system attributes (Figure 16):
  • Sample 5 (2722.31 m): Low entry pressure (6.75 psi), pore throat radii ranging from 1.28–0.049 μm (Figure 16A), and unimodal distribution, confirming excellent pore connectivity and flow capacity.
  • Sample 12 (2726.03 m): Higher entry pressure (13.4 psi), finer pore throats (0.63–0.032 μm; Figure 16B), and multimodal distribution, revealing pore-filling clay (kaolinite) and dolomite cement as permeability inhibitors.
The diagenetic heterogeneity identified through petrographic studies directly influences the vertical heterogeneity of pore structure. Different cementation and clay content degrees create distinct permeability units, resulting in varying reservoir qualities. SCAL results quantify the degree to which diagenesis affects the mobility of fluids within the Hammam Faraun Member:
  • Quartz-rich zones exhibit low cementation exponents (m = 1.9), unimodal MICP curves, and preferential hydrocarbon wettability, favoring efficient hydrocarbon flow and recovery.
  • Dolomite-cemented intervals show elevated saturation exponents (n = 2.3), high entry pressures, and complex pore throat distributions, acting as flow baffles that compartmentalize the reservoir.
  • Mixed wettability characteristics create heterogeneous flow patterns that influence sweep efficiency and require tailored completion strategies.
Evaluations include mineralogically guided pore structure and electrical properties and provide key input parameters to reservoir simulation studies, relative permeability modeling, and the study of capillary pressure behavior. These evaluations emphasize the importance of efficient completion designs that account for the high vertical and lateral pore structure heterogeneity and its ensuing influence on fluid flow behavior and recovery efficiency. This SCAL method links mineralogy and pore structure to reservoir dynamic behavior, thus supporting the clastic dominance model through quantifiable fluid-rock interaction and providing key input data to reservoir development strategies.

5. Discussion

5.1. Multifactorial Controls on Carbonate Depletion and Clastic Dominance

The lithological dichotomy reflects a recurring pattern in the Gulf of Suez rift system, where bathymetry, sediment supply, and tectonics override uniform climatic conditions. The stable SSTs (20.2 °C ± 1 °C) and high foraminiferal diversity (H = 1.2–2.9) confirm subtropical conditions during Langhian deposition. This thermal stability—despite eastern carbonate depletion—demonstrates bathymetry and clastic influx (not climate) governed facies partitioning, aligning with Red Sea rift analogs [15,44]. In the Al-Hamd Field (Western Gulf of Suez), reefal carbonates thrived on stable horst blocks with clear, shallow waters (<50 m), while eastern troughs accumulated clastics due to proximity to Nubian Shield sediment sources [10,24]. Similarly, the Nullipore reservoir developed exclusively on submerged paleohighs along the western margin, whereas axial sub-basins (e.g., Darag Basin) received siliciclastic-dominated fills under identical SSTs [22,28].

5.1.1. Influence of Paleoclimate

Reconstructed sea surface temperatures (SSTs) averaged 20.2 °C ± 1 °C (range: 19.2–21.2 °C; Figure 5), indicating consistently warm, subtropical conditions during the Langhian stage. These temperatures are theoretically optimal for carbonate-secreting organisms like nullipore algae and corals, enabling reef formation—as demonstrated by the extensive Nullipore reservoir development in the western Gulf.
However, this thermal optimum did not translate to significant carbonate production in the eastern basin. Non-climatic factors likely explain the discrepancy: excessive water depth limited light availability, while substantial clastic influx from eastern rift shoulders diluted carbonate potential. Thus, although SSTs supported basin-wide carbonate productivity, bathymetry and sediment supply diminished their impact in the eastern trough. While warm SSTs facilitated western Nullipore growth, bathymetric and sedimentologic barriers prevented similar development in the east—a pattern observed in Miocene evaporitic cycles across the Red Sea [44,46]. Critically, the eastern flank received 2–3× more clastic material than the west [14], overwhelming carbonate deposition despite optimal temperatures.

5.1.2. Influence of Paleobathymetry

Reconstructed bathyal depths of 611–1238 m in the eastern Gulf limited light penetration below the euphotic zone (~100 m), inhibiting photosynthetic biota like nullipore algae despite warm SSTs (20.2 °C) [12,24]. These photic constraints directly suppressed carbonate production at depths > 600 m, explaining the clastic dominance in the Hammam Faraun Member. This contrasts sharply with the stable, shallow (<100 m) western shelf, where horst blocks preserved platforms conducive to carbonate factories.
High P/B ratios (84–100) and Fisher α values (7–15.8) diagnose a bathyal setting with planktonic foraminifera dominating benthic taxa due to low benthic productivity—consistent with axial sub-basins like the Darag Basin [12]. The stability of these proxies confirms syn-rift subsidence (not sea-level fluctuations) controlled accommodation, forming an axial trough in the east while shielding western platforms.
Bathymetry thus overrode climate as the primary driver of carbonate depletion in the eastern Gulf. Depths > 600 m restricted carbonate growth by: (1) limiting light for photosynthetic organisms (e.g., nullipore algae, corals); (2) increasing turbidity from clastic influx; and (3) reducing thermocline temperatures (<15 °C) despite warm surface waters. These deep, low-energy conditions facilitated siliciclastic accumulation while precluding shallow-water carbonate development. Consequently, the eastern basin favored clastic deposition, whereas the western shelf remained a prolific carbonate factory.

5.1.3. Comparative Geological Factors: Eastern vs. Western Gulf of Suez

  • The dichotomy is a result of the different geologic circumstances of the rift basin that created disparate depositional settings in the form of four interplaying main factors (Table 1):
  • Depositional Environment: The eastern basin was a high-energy, turbid, deep-marine bathyal environment (>600 m) that suppressed carbonates, while the western shelf was in the neritic zone (<100 m), where clear, shallow water promoted extensive reefal growth.
  • Sediment Supply: Proximity to the Nubian Shield brought an abundance of quartzose clastics into the eastern trough via fault-scarp drainage networks that diluted the potential of carbonate. The paleohigh-bound western platform received minimal terrigenous supply and predominantly featured in situ carbonate (Figure 17A).
  • Sea-Level Changes: High-amplitude sea-level fluctuations in the east caused repetitive alternation between clastic (lowstand) and mixed carbonate–clastic (highstand) sedimentation, which disrupted the continuity of carbonate factories. Sea levels in the west were stable, with ongoing reefal growth (Figure 17B).
Tectonic Activity: Syn-rift subsidence (3 km hanging-wall drop along the Hammam Faraun fault; [33] on the eastern margin facilitated rapid sediment remobilization and deepening. Tectonically stable western horst blocks offered refuge for sheltered carbonate platforms under little structural disturbance (Figure 17B).
The region’s geologic history resulted from an interaction between tectonism and sea-level change. To the east, there was rapid subsidence in rifting, and the principal three-kilometer fall along the Hammam Faraun fault, reported by [33], created a deep axial trough. Tectonic subsidence amplified water depth change. However, stable horst blocks in the western regions provided a place for building shallow-water platforms. The proximity of the eastern basin to the Nubian Shield also provided a high input of quartz-rich sediment, diluting the potential for building carbonate rock (Figure 17A). On the contrary, the western shelf received practically none of this clastic material (Figure 17B). The difference in sediment supply shapes the sequence architecture. In the east, the transgressive systems tract of the LA.SQ2 sequence comprises shales (Figure 8), which are deepening the sea to limit light penetration. The following highstand systems tract in the east comprises sands and pulses of clastic sediment supply during periods of declining sea level.
By contrast, the western area exhibits continuous carbonate-dominated highstand systems tracts (Figure 17B). The absence of the Nullipore reservoir in the eastern Gulf is not due to adverse climate but to rift-controlled bathymetry and tectonically amplified sediment supply. Clastic dominance was the inevitable result of a depositional environment with aphotic water, elevated tectonic activity, and overbearing clastic sediment supply, collectively overcoming carbonate potential. This study illustrates that tectonic segmentation in syn-rift basins can overprint global climatic optima, imposing sudden lateral facies transitions over distances of <50 km. This multivariate model explains the ubiquitous carbonate depletion of the Hammam Faraun Member despite optimum SSTs, providing predictive criteria for reservoir distribution in rift basins globally.
Rapid syn-rift subsidence (exemplified by the ~3 km displacement on the Hammam Faraun fault [33] generated an asymmetric half-graben, enhancing sediment flux from the Nubian Shield—a pattern recurring in rift shoulders like the Abu Alaga fan delta [39]. Gulf-scale extensional processes produced consistent bathymetric trends: rapid Middle Miocene subsidence formed an eastern axial deep trough while preserving western shallow platforms. High-amplitude sea-level fluctuations further disrupted eastern carbonate continuity, unlike the stable western platform where reefs thrived continuously during highstands [22]. This reconstruction definitively attributes carbonate depletion to bathyal environments and tectonic drivers—not climate—accounting for abrupt facies transitions characteristic of Red Sea-type rifts [35].

5.2. Sequence Stratigraphic and Petrophysical Interpretation

The sequence stratigraphic model, built using gamma-ray log motif and foraminiferal paleobathymetric proxy correlation (P/B ratios, Fisher α), recognizes two depositional sequences (LA.SQ1: 15.12–14.99 Ma; LA.SQ2: 14.99–14.78 Ma; Figure 8). LA.SQ1 (HST1) comprises Feiran Member anhydrites deposited under regional tectonic uplift and basin restriction. The sequence does not match global sea-level curves [145,150] and suggests overprinting eustatic signals by prevailing tectonics (Figure 8). In contrast, LA.SQ2 represents a complete transgressive–regressive cycle: TST2 (transgressive shales) and HST2 (progradational sandstones). The sequence top (LAD Praeorbulina glomerosa) correlates with global Langhian sea-level falls, testifying to increased eustatic control. Reconstructed Gulf SSTs were 1.8–2.1 °C higher than global averages during the Mi2a event (Figure 13), increasing evaporation and positioning the basin to receive increased clastic supply under LA.SQ2. The tectonic-eustasy interaction explains the shift from carbonate-constrained evaporites (LA.SQ1) to clastic-dominated fill (LA.SQ2) of subsiding troughs.
Petrophysical Analysis (logs: Figure 9 and Figure 10; core data: Table 4) verifies vertical and lateral heterogeneity of the Hammam Faraun reservoir. Vertically, HST2 sandstones are of superior reservoir quality (ϕe up to 22%, Sw ≤ 45%, net pay 1.8–2.7 m), corresponding to low gamma-ray, high porosity/permeability log motifs and unimodal MICP pore-throat distributions (e.g., Sample 5: entry pressure 6.75 psi, Figure 16A). TST2 shales are barriers to flow (high gamma-ray, ϕe < 10%, Sw > 65%) with multimodal MICP curves indicating pore-occluding clays (Sample 12: entry pressure 13.4 psi, Figure 16B). Lateral heterogeneity is evident in Well 112-58, which is of superior reservoir quality (ϕe 19%, Vsh 26%, Sh 55%) compared to 113M-81 (ϕe 17%, Vsh 41%, Sh 33%; Table 4), indicating proximal (quartz-rich) versus distal (clay-rich) facies in HST2. Shale content (Vsh) is the most important detractor of reservoir quality: high Vsh is coincident with decreased effective porosity (through pore-filling/lining clays), increased Sw (capillary trapping), and decreased permeability, with direct consequences for hydrocarbon producibility.
Differences in wettability exert a strong influence on resistivity behavior. SCAL measurements under restored-state conditions (simulated reservoir wettability) yield greater saturation exponents (n = 2.1–2.3) than cleaned-state measurements (n = 1.8–2.0; Figure 15). This is due to pore-throat narrowing by swelling clay (kaolinite, illite) and mixed-wet behavior—hydrocarbon-wet in the quartz zones and water-wet in the clay-dolomite laminae. Archie-based Sw calculations thus require n-value corrections to avoid underestimating water saturation in the clay-rich zones.
As measured by MICP, pore-structure heterogeneity governs fluid mobility and recovery efficiency. Quartz-dominated HST2 intervals exhibit unimodal pore-throat distributions (radius: 1.28–0.049 µm) and low tortuosity (FRF a = 0.8–1.1, m = 1.9) that favor high fluid mobility (Figure 16A). Dolomite-cemented or clay-rich intervals exhibit multimodal throats, smaller radius (0.63–0.032 µm), and greater tortuosity (m = 2.1–2.3), creating flow baffles that compartmentalize the reservoir (Figure 16B). Targeted completions are needed, focusing on highstand “sweet spots” and avoiding low-permeability TST barriers.
Authigenic clay minerals (kaolinite ≤ 11%, illite) pose serious risks to formation damage. Kaolinite booklets (Figure 13) are highly mobilizable and capable of moving and plugging pore throats during production. Illite, resulting from feldspar alteration or kaolinite transformation, leads to a decrease in permeability by fibrous pore-bridging. These clays also add water retention, increasing Sw and decreasing relative permeability to hydrocarbons. Mitigating techniques, such as clay-stabilizing completion fluids, are needed to sustain productivity in argillaceous intervals.
In combination, sequence architecture and petrophysical heterogeneity underscore a depositional-diagenetic control over clastic dominance: HST2 sands form quality reservoirs in which quartz content and dissolution-controlled porosity prevail, while tectonically forced bathyal depth and shale-prone TSTs suppress the growth of carbonates, compartmentalizing flow.

5.3. Correlation of Local Sequences with Regional and Global Events

The Analysis shows that regional tectonic activity in the Gulf of Suez closely links the recognized depositional sequences in the two members of the Belayim Formation—the LA.SQ1 sequence, dating from 15.12 to 14.99 Ma of the Feiran Member, correlates with the onset of the Transform Activation phase around 14 Ma—meanwhile, LA.SQ2, which spans from 14.99 to 14.78 Ma of the Hammam Faraun Member, also reflects this tectonic influence (Figure 17B). During this development, the Levant-Aqaba transform borders slowed down extension rates and sub-basin isolation and began evaporite deposition (Figure 8 and Figure 13). Anhydrite-rich HST1 records basin restriction through tectonic uplift along the Hammam Faraun fault zone in syn-rift, in accord with regional evidence for fault-controlled subsidence and evaporite deposition during this time [44].
LA.SQ2 (TST2 shales and HST2 sandstones) correlates with increased basin-bounding Hammam Faraun fault-controlled subsidence, generating space for deep-marine clastic deposition. The TST2 (deepening) to HST2 (shallowing) transition is correlative with hanging-wall subsidence pulses produced by post-14 Ma reactivation of NW-SE faults (Figure 8), confirming regional models of fault-controlled syn-rift stratigraphy [12].
Global sequence timing demonstrates irregular coupling with eustasy and climate. LA.SQ1 (15.12–14.99 Ma) is poorly correlated with contemporaneous global sea-level curves [145] and reflects eustatic signals overprinted by tectonics in the development of evaporites (Figure 8). LA.SQ2 (14.99–14.78 Ma) correlates well with global events:
  • The TST2 transgression (14.99–14.89 Ma) correlates with the eustatic model of Langhian flooding proposed by [57]. The deep-water shales and elevated P/B ratios (>90%; Figure 7) express this flooding.
  • The HST2 regression (14.89–14.78 Ma) is correlated with the Langhian sea-level fall monitored by [57,145]. The definition includes prograding sandstones and highlights the precipitous decline in P/B ratios (Figure 8).
Climatically, reconstructed Gulf SSTs (20.2 °C ± 1 °C; Figure 5) were 1.8–2.1 °C above global averages during the Mi2a oxygen isotope event (~14.8 Ma; Figure 13). The anomaly is consistent with more regional warming during the Middle Miocene Climatic Optimum [146,151,152], which would have raised evaporation during LA.SQ1 and accelerated siliciclastic weathering and transport during LA.SQ2. The warm, stable conditions (as evidenced by elevated foraminiferal diversity; Figure 5) excluded glacially forced sea-level change, emphasizing tectonics as the dominant control on sequence architecture (Figure 17).
Hammam Faraun’s successions thus document an alteration from tectonically controlled (LA.SQ1) to eustatically controlled (LA.SQ2) sedimentation, superimposed over a regional warming trend. The model explains the transition from evaporite isolation to clastic-dominated fill and how rift processes interacted with the global climate to control reservoir heterogeneity.

6. Summary and Conclusions

This integrated study clarifies the primary controls behind the stark lithological contrast in the Hammam Faraun Member (Gulf of Suez rift basin), where stable western horsts host carbonate-rich Nullipore reservoirs while the tectonically active eastern flank is dominated by clastics. Crucially, bathymetry not uniform subtropical SSTs (19.2–21.2 °C) governed this dichotomy. Paleobathymetric proxies (P/B ratios: 84–100; depths: 611–1238 m) confirm light limitation below the euphotic zone inhibited eastern carbonate production, amplified by clastic influx from the Nubian Shield and syn-rift subsidence (~3 km along the Hammam Faraun fault).
Sequence stratigraphy delineates two units: LA.SQ1 (Feiran evaporites, tectonically controlled) and LA.SQ2 (Hammam Faraun, eustatically modulated). The latter contains the primary reservoir (HST2 sandstones), exhibiting significant heterogeneity. Proximal HST2 facies (Well 112-58: φe 19%, Sh 55%) outperform distal equivalents (Well 113M-81: φe 17%, Sh 33%) due to lower shale content. Authigenic dolomite cement (10–16.5%) and clays (kaolinite ≤ 11%, illite) degrade permeability, while mixed wettability necessitates corrected saturation exponents (n = 2.1–2.3 in restored state) for accurate Sw calculation.
For reservoir optimization:
  • Account for compaction effects and pore-throat heterogeneity (MICP data) in static/dynamic models.
  • Prioritize clay stabilization and wettability-modifying surfactants in EOR designs.
  • Map “sweet spots” using 3D seismic and diagenetic studies to target quartz-rich HST2 zones.
This work confirms rift-specific bathymetry and tectonics—not climate—as the dominant controls on carbonate depletion, providing a predictive framework for reservoir characterization in clastic-dominated rift basins.

Author Contributions

H.M.A.: conceptualization, research design, field investigation, micropaleontological analysis, stratigraphic interpretation, data curation, formal analysis, visualization, sequence stratigraphic framework, figure preparation, writing—original draft, writing—review and editing, supervision, and project administration, the final approval of the version to be published. H.E.S.: statistical analysis, interpretation of the data, literature review, writing—review and editing, figure preparation, funding acquisition, writing—original draft, the final approval of the version to be published. M.F.: conceptualization, fieldwork coordination, sedimentological logging, sample processing, data interpretation, figure preparation, sequence stratigraphic framework, and writing—review and editing, the final approval of the version to be published. A.H.I.H.: conceptualization, analysis and interpretation of the data, visualization, writing—original draft, the final approval of the version to be published. A.B.G.: statistical analysis, drafting of paper, literature review, funding acquisition, writing—original draft, the final approval of the version to be published. M.R.: conceptualization, research design, petrophysical analysis, analysis and interpretation of the data, visualization, figure preparation, writing—original draft, the final approval of the version to be published. All authors have read and agreed to the published version of the manuscript.

Funding

This work was supported and funded by the Deanship of Scientific Research at Imam Mohammad Ibn Saud Islamic University (IMSIU) (grant number IMSIU-DDRSP2502).

Data Availability Statement

Datasets are unavailable publicly but can be obtained from the corresponding author upon reasonable request.

Conflicts of Interest

The authors declare no known competing financial interests or personal relationships that could influence this work. However, note that Ahmed Hassan Ismail is an employee of Ente Nazionale Idrocarburi (Eni) Petroleum Corporation. The paper reflects the views of the scientists, not the company.

References

  1. Bosworth, W. A model for the three-dimensional evolution of continental rift basins, north-east Africa. Geol. Rundschau 1994, 83, 671–688. [Google Scholar] [CrossRef]
  2. Moustafa, A.M. Block Faulting of the Gulf of Suez. In Proceedings of the 5th Exploration Seminar; Unpublished Report; Egyptian General Petroleum Company: Cairo, Egypt, 1976; pp. 1–19. [Google Scholar]
  3. Ayyad, H.M.; Fathy, M.; Hewaidy, A.G.A.; Abdallah, A. Sequence stratigraphy of the Burdigalian Rudeis Formation in Ras El-Ush oil field, Gulf of Suez: Application of gamma-ray analysis and biostratigraphy. Mar. Pet. Geol. 2020, 122, 104694. [Google Scholar] [CrossRef]
  4. Khattab, M.A.; Radwan, A.E.; El-Anbaawy, M.I.; Mansour, M.H.; El-Tehiwy, A.A. Three-dimensional structural modelling of structurally complex hydrocarbon reservoir in October Oil Field, Gulf of Suez, Egypt. Geol. J. 2023, 58, 4146–4164. [Google Scholar] [CrossRef]
  5. Othman, A.A.A.; Fathy, M.; Hashem, M.E. Three-dimensional static reservoir modelling of Kareem sandstone reservoir, Tawilla Oil Field, at the southern region of Gulf of Suez, Egypt. Geol. J. 2024, 59, 3258–3277. [Google Scholar] [CrossRef]
  6. Lee, E.Y.; Fathy, D.; Xiang, X.; Spahić, D.; Ahmed, M.S.; Fathi, E.; Sami, M. Middle Miocene syn-rift sequence on the central Gulf of Suez, Egypt: Depositional environment, diagenesis, and their roles in reservoir quality. Mar. Pet. Geol. 2025, 174, 107305. [Google Scholar] [CrossRef]
  7. Moawad, S.K.; Baghdady, A.R.; Moustafa, A.R.; Helmy, H.M.; El-Hadidy, S.M. Structural control on basin architecture and hydrocarbon play types of the Miocene carbonate reservoirs, southern Gulf of Suez rift, Egypt. Mar. Pet. Geol. 2025, 177, 107365. [Google Scholar] [CrossRef]
  8. Nabawy, B.S.; Mansour, A.S.; Rashed, M.A.; Afify, W.S.M. Implementation of sedimentary facies and diagenesis on the reservoir quality of the Aquitanian-Burdigalian Rudeis Formation in the Gulf of Suez, Egypt: A comparative surface and subsurface study. Geol. J. 2020, 55, 4543–4563. [Google Scholar] [CrossRef]
  9. Sallam, E.S.; Ruban, D.A. Facies analysis and depositional environments of the Miocene syn-rift carbonate–siliciclastic rock packages in the northwest Gulf of Suez, Egypt. Carbonates Evaporites 2020, 35, 10. [Google Scholar] [CrossRef]
  10. Abouelhassan, M.M.; Abu-Hashish, M.F.; Ashry, H.M. Impact of diagenetic processes on the petrophysical properties and quality of the Miocene “Reefal limestone” reservoir in Al-Hamd field, Gulf of Suez, Egypt. Carbonates Evaporites 2021, 36, 21. [Google Scholar] [CrossRef]
  11. Said, S.M.; Sakran, S. Geometry and kinematics of right-lateral transpressional faults and growth folds, the western side of the Gulf of Suez, Egypt. Geol. J. 2022, 57, 276–291. [Google Scholar] [CrossRef]
  12. Gawthorpe, R.L.; Jackson, C.A.-L.; Young, M.J.; Sharp, I.R.; Moustafa, A.R.; Leppard, C.W. Normal fault growth, displacement localisation and the evolution of normal fault populations: The Hammam Faraun fault block, Suez rift, Egypt. J. Struct. Geol. 2003, 25, 883–895. [Google Scholar] [CrossRef]
  13. Sobhy, H.; Moustafa, A.R. Impact of structural geometry of tilted fault blocks on hydrocarbon entrapment and deposition of syn-rift clastic reservoirs: Belayim Marine field (Gulf of Suez rift). Mar. Pet. Geol. 2024, 160, 106631. [Google Scholar] [CrossRef]
  14. El Zefzaf, T.; El Fattah, M.A.; Proett, M.A.; Engelman, B.; Bassiouny, A. Formation Testing and Sampling Using an Oval Pad in Al Hamd Field, Egypt. In Proceedings of the SPE Annual Technical Conference and Exhibition, San Antonio, TX, USA, 24–27 September 2006; Volume 3, pp. 1816–1826. [Google Scholar]
  15. Ali, A.; Abdelhady, A.A.; Mohamed, R.S.A.; Fathy, D.; Hashem, M.; Ahmed, M.S.; Aboueldahab, S.M.; Khalil, M.M.; Farag, M.H. Depositional and diagenetic drivers of heterogeneous reservoir quality in the Neogene strata of the Red Sea (Egypt). Carbonates Evaporites 2025, 40, 88. [Google Scholar] [CrossRef]
  16. Bosworth, W. Geological Evolution of the Red Sea: Historical Background, Review, and Synthesis. In The Red Sea; Rasul, N.M.A., Stewart, I.C.F., Eds.; Springer: Berlin/Heidelberg, Germany, 2015; pp. 45–78. ISBN 978-3-662-45201-1. [Google Scholar]
  17. Ayyad, H.M.; Hewaidy, A.G.A.; Omar, M.; Fathy, M. Sequence stratigraphy and reservoir quality of the Gulf of Suez syn-rift deposits of the Nukhul formation: Implications of rift initiation and the impact of eustacy and tectonic on deposition. Mar. Pet. Geol. 2023, 156, 106459. [Google Scholar] [CrossRef]
  18. Hewaidy, A.G.A.; Farouk, S.; Ayyad, H.M. Nukhul formation in wadi baba, southwest sinai peninsula, Egypt. GeoArabia 2012, 17, 103–120. [Google Scholar] [CrossRef]
  19. Hewaidy, A.G.A.; Farouk, S.; Ayyad, H.M. Foraminifera and sequence stratigraphy of Burdigalian—Serravallian successions on the eastern side of the Gulf of Suez, southwestern Sinai, Egypt. Neues Jahrb. Geol. Paläontol.-Abh. 2013, 270, 151–170. [Google Scholar] [CrossRef]
  20. Hewaidy, A.G.A.; Farouk, S.; Ayyad, H.M. Integrated biostratigraphy of the upper Oligocene-middle Miocene successions in west central Sinai, Egypt. J. Afr. Earth Sci. 2014, 100, 379–400. [Google Scholar] [CrossRef]
  21. Karaca, E.; Yılmaz, İ.Ö.; Çifci, G.; Tortopoğlu, B.; Akın, S. Integrated fracture analysis for improved oil recovery in the reefal limestones of Soğucak formation, Northwest Thrace Basin, Türkiye. Mar. Pet. Geol. 2025, 171, 107198. [Google Scholar] [CrossRef]
  22. Scott, R.W.; Govean, F.M. Early depositional history of a rift basin: Miocene in Western Sinai. Palaeogeogr. Palaeoclimatol. Palaeoecol. 1985, 52, 143–158. [Google Scholar] [CrossRef]
  23. Mansour, A.S.; Abd-Ellatif, M.T. Dolomitization of the Miocene carbonates in Gebel Abu Shaar El Qiblie and Salum area, Egypt: A petrographical and geochemical comparative study. Carbonates Evaporites 2013, 28, 347–363. [Google Scholar] [CrossRef]
  24. El-Fakharany, M.; Afife, M.; Fares, M. Reservoir quality of Nullipore formation, Ras Fanar oil field concession, Gulf of Suez, Egypt. Int. J. Sci. Eng. Appl. Sci. 2016, 2, 368–383. [Google Scholar]
  25. Noyahr, C.V.; Weissenberger, J.A.W.; Harris, N.B.; Banks, J. A facies- and sequence stratigraphy-based reservoir model for a carbonate reef complex: South Swan Hills oil pool, Alberta. Mar. Pet. Geol. 2023, 152, 106226. [Google Scholar] [CrossRef]
  26. Youssef, E.-S.A.A. Dolomitization and dedolomitization of Miocene carbonates at Gabal El-Safra, Sherm el Sheikh area, sinai, Egypt. Carbonates Evaporites 1997, 12, 185–191. [Google Scholar] [CrossRef]
  27. Chowdhary, L.R.; Taha, S. History of exploration and geology of Ras Budran, Ras Fanar and Zeit Bay oil fields. In Proceedings of the Egyptian General Petroleum Corporation, 8th Exploration Conference, Cairo, Egypt, 17–23 November 1986; p. 42. [Google Scholar]
  28. Kassab, M.; El Gebaly, A.; Abass, A.; El Kady, E. Integrated petrophysical and mineral composition of Miocene reservoirs (Kareem and Belayim Formations), Belayim onshore oil field, Gulf of Suez, Egypt: A case study. Arab. J. Geosci. 2021, 14, 1–18. [Google Scholar] [CrossRef]
  29. Thiébaud, C.E.; Robson, D.A. the Geology of the Area Between Wadi Wardan and Wadi Gharandal, East Clysmic Rift, Sinai, Egypt. J. Pet. Geol. 1979, 1, 63–75. [Google Scholar] [CrossRef]
  30. Aziz, E.A.A.E.; Gomaa, M.M. Petrophysical and seismic evaluation of pre rift sediments of the southern Gulf of Suez basin, Egypt. Carbonates Evaporites 2024, 39, 96. [Google Scholar] [CrossRef]
  31. Corlett, H.; Hodgetts, D.; Hirani, J.; Rotevatn, A.; Taylor, R.; Hollis, C. A geocellular modelling workflow for partially dolomitized remobilized carbonates: An example from the Hammam Faraun Fault block, Gulf of Suez, Egypt. Mar. Pet. Geol. 2021, 126, 104831. [Google Scholar] [CrossRef]
  32. Jamil, M.; Siddiqui, N.A.; Rahman, A.H.B.A.; Ibrahim, N.A.; Bin Ismail, M.S.; Ahmed, N.; Usman, M.; Gul, Z.; Imran, Q.S. Facies heterogeneity and lobe facies multiscale analysis of deep-marine sand-shale complexity in the West Crocker Formation of Sabah Basin, NW Borneo. Appl. Sci. 2021, 11, 5513. [Google Scholar] [CrossRef]
  33. Patton, T.L.; Moustafa, A.R.; Nelson, R.A.; Abdine, S.A. Tectonic Evolution and Structural Setting of the Suez Rift. In Interior Rift Basins; American Association of Petroleum Geologists: Tulsa, OK, USA, 1994; pp. 9–55. Available online: https://pubs.geoscienceworld.org/books/book/1314/chapter/107170273 (accessed on 1 January 1994).
  34. Ali Ali, E.K.; Emad El Din Abd Elrazik, E.; Shebl Azam, S.; Ahmed Hassan, S. Integrated petrophysical and lithofacies studies of lower-middle Miocene reservoirs in Belayim marine oil field, Gulf of Suez, Egypt. J. Afr. Earth Sci. 2016, 117, 331–344. [Google Scholar] [CrossRef]
  35. Younes, A.I.; McClay, K.R. Development of accommodation zones in the Gulf of Suez-Red Sea rift, Egypt. Am. Assoc. Pet. Geol. Bull. 2002, 86, 1003–1026. [Google Scholar] [CrossRef]
  36. Moustafa, A.R.; Abdeen, M.M. Structural setting of the Hammam Faraun block, eastern side of the Suez rift. J. Univ. Kuwait 1992, 19, 291–309. [Google Scholar]
  37. Henaish, A.; El Shinawi, A.; Awad, M. Internal architecture and structural evolution of a horst relay zone from the northern Gulf of Suez rift, Egypt: Implications for syn-rift sedimentation. Mar. Pet. Geol. 2023, 150, 106170. [Google Scholar] [CrossRef]
  38. Ayyad, H.M.; Hewaidy, A.G.A.; Farouk, S.; Samir, A.; Bazeen, Y.S. Sequence stratigraphy of the upper Oligocene–middle Miocene succession in west–central Sinai, Egypt. Geol. J. 2023, 58, 264–282. [Google Scholar] [CrossRef]
  39. Bosworth, W.; McCaly, K. Structural and stratigraphic evolution of the Gulf of Suez rift, Egypt: A synthesis. In Peri-Tethyan Rift/Wrench Basins and Passive Margins; Ziegler, P.A., Cavazza, W., Robertson, A.H.F., Crasquin- Soeau, S., Eds.; Mémoire Musee Histoire Naturelle, PeriTethys Memoir 6; French National Museum Natural History: Paris, France, 2001; Volume 186, pp. 567–606. [Google Scholar]
  40. Kehew, A.E.; Milewski, A.; Soliman, F. Reconstructing an extreme flood from boulder transport and rainfall–runoff modelling: Wadi Isla, South Sinai, Egypt. Glob. Planet. Chang. 2010, 70, 64–75. [Google Scholar] [CrossRef]
  41. Bosworth, W.; Khalil, S.; Clare, A.; Comisky, J.; Abdelal, H.; Reed, T.; Kokkoros, G. Integration of outcrop and subsurface data during the development of a naturally fractured Eocene carbonate reservoir at the East Ras Budran concession, Gulf of Suez, Egypt. Geol. Soc. Spec. Publ. 2014, 374, 333–359. [Google Scholar] [CrossRef]
  42. Deaf, A.S.; El Soughier, M.I.; Gentzis, T.; Makled, W.A. Hydrocarbon source rock potential of the Lower Eocene carbonates from the Abu Darag sub-basin, Gulf of Suez, Egypt: Integrated organic geochemical and petrographic analyses. Mar. Pet. Geol. 2021, 132, 105235. [Google Scholar] [CrossRef]
  43. Zwaan, F.; Schreurs, G.; Adam, J. Effects of sedimentation on rift segment evolution and rift interaction in orthogonal and oblique extensional settings: Insights from analogue models analysed with 4D X-ray computed tomography and digital volume correlation techniques. Glob. Planet. Chang. 2018, 171, 110–133. [Google Scholar] [CrossRef]
  44. Bosworth, W.; Huchon, P.; McClay, K. The Red Sea and Gulf of Aden Basins. J. Afr. Earth Sci. 2005, 43, 334–378. [Google Scholar] [CrossRef]
  45. Richardson, M.; Arthur, M.A. The Gulf of Suez-northern Red Sea neogene rift: A quantitive basin analysis. Mar. Pet. Geol. 1988, 5, 247–270. [Google Scholar] [CrossRef]
  46. Orszag-Sperber, F.; Harwood, G.; Kendall, A.; Purser, B.H. A Review of the Evaporites of the Red Sea-Gulf of Suez Rift BT—Sedimentation and Tectonics in Rift Basins Red Sea:-Gulf of Aden; Purser, B.H., Bosence, D.W.J., Eds.; Springer: Dordrecht, The Netherlands, 1998; pp. 409–426. [Google Scholar] [CrossRef]
  47. Hewaidy, A.G.A.; Abd El-Moghny, M.W.; Ayyad, H.M.; Gameel, O. Biostratigraphy, microfacies analysis and sequence stratigraphy of the Miocene succesions in Cairo-Suez District, Egypt. AI Azhar Bull. Sci. 2018, 29, 39–59. [Google Scholar]
  48. Ayyad, H.; Hewaidy, A.G.; Hewaidy, A. Chattian-Aquitanian calcareous nannofossil biostratigraphy of the Nukhul Formation in Wadi Baba Section, West Central Sinai, Egypt. Stratigraphy 2016, 13, 67–81. [Google Scholar] [CrossRef]
  49. Evans, A.L. Miocene sandstone provenance relations in the Gulf of Suez: Insights into synrift unroofing and uplift history. Am. Assoc. Pet. Geol. Bull. 1990, 74, 1386–1400. [Google Scholar] [CrossRef]
  50. Snyder, S.W.; Huber, B.T. Preparation Techniques for Use of Foraminifera in the Classroom. Paleontol. Soc. Pap. 1996, 2, 231–236. [Google Scholar] [CrossRef]
  51. Hewaidy, A.A.; Ayyad, H.M.; Labaidy, N. Biostratigraphy of the Miocene successions in the Sadat Area, west Gulf of Suez-Egypt. Egypt. J. Geol. 2020, 64, 455–470. [Google Scholar] [CrossRef]
  52. Hewaidy, A.G.A.; Ayyad, H.M.; Abdallah, A. Subsurface lower–middle Miocene biostratigraphy of Ras El Ush oil field, G. Zeit Area, Gulf of Suez, Egypt. AI Azhar Bull. Sci. 2018, 29, 1–18. [Google Scholar]
  53. Berggren, W.A.; Kent, D.V.; Swisher, C.C.; Aubry, M.-P. A Revised Cenozoic Geochronology and Chronostratigraphy. In Geochronology, Time Scales and Global Stratigraphic Correlation; SEPM Society for Sedimentary Geology: Tulsa, OK, USA, 1995; pp. 129–212. Available online: https://pubs.geoscienceworld.org/books/book/1041/chapter/10528799 (accessed on 1 January 1995).
  54. Lourens, L.; Hilgen, F.; Shackleton, N.J.; Laskar, J.; Wilson, D. The Neogene Period BT—A Geologic Time Scale; Gradstein, F., Ogg, J., Smith, A., Eds.; Cambridge University Press: Cambridge, UK, 2004. [Google Scholar]
  55. Wade, B.S.; Pearson, P.N.; Berggren, W.A.; Pälike, H. Review and revision of Cenozoic tropical planktonic foraminiferal biostratigraphy and calibration to the geomagnetic polarity and astronomical time scale. Earth-Sci. Rev. 2011, 104, 111–142. [Google Scholar] [CrossRef]
  56. Coxall, H.K.; Spezzaferri, S.; Sciences, O.; Building, M.; Place, P.; Sciences, E. Taxonomy, Biostratigraphy, and Phylogeny of Oligocene Catapsydrax, Globorotaloides, and Protentelloides. In Atlas of Oligocene Planktonic Foraminifera; Cushman Foundation for Foraminiferal Research: Lawrence, KS, USA, 2018; pp. 79–124. [Google Scholar]
  57. Hardenbol, J.; Thierry, J.; Farley, M.B.; Jacquin, T.D.; Graciansky, P.C.; Vail, P.R. Mesozoic and Cenozoic sequence chronostratigraphic framework of European basins. In Mesozoic and Cenozoic Sequence Stratigraphy of European Basins; SEPM Society for Sedimentary Geology: Tulsa, OK, USA, 1998; Volume 60. [Google Scholar]
  58. King, D.J.; Wade, B.S.; Liska, R.D.; Miller, C.G. A review of the importance of the Caribbean region in Oligo-Miocene low latitude planktonic foraminiferal biostratigraphy and the implications for modern biogeochronological schemes. Earth-Sci. Rev. 2020, 202, 102968. [Google Scholar] [CrossRef]
  59. Souaya, F.J. Miocene Foraminifera of the Gulf of Suez Region, U.A.R. Part 4: Paleoecology and Age. Micropaleontology 1966, 12, 493. [Google Scholar] [CrossRef]
  60. Berggren, W.A.; Hilgen, F.J.; Langereis, C.G.; Kent, D.V.; Obradovich, J.D.; Raffi, I.; Raymo, M.E.; Shackleton, N.J. Late Neogene chronology: New perspectives in high-resolution stratigraphy. Geol. Soc. Am. Bull. 1995, 107, 1272–1287. [Google Scholar] [CrossRef]
  61. Cicha, I.; Rögl, F.; Rupp, C.; Ctyroka, J. Oligocene–Miocene Foraminifera of the Central Paratethys. Abh. Senckenberg. Naturforschenden Ges. 1998, 549, 1–325. [Google Scholar]
  62. Holbourn, A.; Henderson, A.S.; MacLeod, N. Atlas of Benthic Foraminifera; Natural History Museum: London, UK, 2013; 642p. [Google Scholar]
  63. Wade, B.S.; Pearson, P.N.; Olsson, R.K.; Fraass, A.J.; Leckie, R.M.; Hemleben, C. Taxonomy, Biostratigraphy, and Phylogeny of Oligocene and Lower Miocene Dentoglobigerina and Globoquadrina. In Atlas of Oligocene Planktonic Foraminifera; Wade, B.S., Olsson, R.K., Pearson, P.N., Huber, B.T., Berggren, W.A., Eds.; Cushman Foundation for Foraminiferal Research: Glen Allen, VA, USA, 2018; Volume 46. [Google Scholar]
  64. Bé, A.W.H. An ecological, zoogeographic and taxonomic review of recent planktonic foraminifera. In Oceanic Micropaleontology; Academic Press: London, UK, 1977; pp. 1–100. [Google Scholar]
  65. Hewaidy, A.G.A.; Farouk, S.; Ayyad, H.M. Paleoclimatic Analysis of the Late Oligocene/Middle Miocene Planktonic Fauna of West Central Siani, Egypt. Egypt. J. Paleontol. 2013, 13, 29–48. [Google Scholar]
  66. Langodan, S.; Cavaleri, L.; Portilla, J.; Abualnaja, Y.; Hoteit, I. Can we extrapolate climate in an inner basin? The case of the Red Sea. Glob. Planet. Chang. 2020, 188, 103151. [Google Scholar] [CrossRef]
  67. Cita, M.B.; Vergnaud-Grazzini, C.; Robert, C.; Chamley, H.; Ciaranfi, N.; d’Onofrio, S. Paleoclimatic record of a long deep sea core from the eastern Mediterranean. Quat. Res. 1977, 8, 205–235. [Google Scholar] [CrossRef]
  68. Spezzaferri, S. Planktonic foraminiferal paleoclimatic implications across the Oligocene-Miocene transition in the oceanic record (Atlantic, Indian and South Pacific). Palaeogeogr. Palaeoclimatol. Palaeoecol. 1995, 114, 43–74. [Google Scholar] [CrossRef]
  69. Rögl, F.; Spezzaferri, S. Foraminiferal paleoecology and biostratigraphy of the Mühlbach section (Gaindorf Formation, Lower Badenian), Lower Austria. Ann. Naturhistorischen Museums Wien. Ser. A für Mineral. Petrogr. Geol. Paläontologie Anthropol. Prähistorie 2002, 104, 23–75. [Google Scholar]
  70. Antonarakou, A.; Drinia, H.; Tsaparas, N.; Dermitzakis, M.D. Micropaleontological parameters as proxies of late Miocene surface water properties and paleoclimate in Gavdos Island, eastern Mediterranean. Geodiversitas 2007, 29, 379–399. [Google Scholar]
  71. Ayyad, H.M.; Bazeen, Y.S.; Samir, A.; Ghanem, S.G.; Ali, A.H.; Gaafar, A.T.; Abdel-Gawad, A. Foraminiferal Proxies Reveal Miocene Climatic Shifts in the Gulf of Suez: Insights from the Rudeis and Kareem Formations on Lithostratigraphic Ambiguities and Central Paratethys Climatic Linkages During Burdigalian-Langhian Intervals. Geol. J. 2025. [Google Scholar] [CrossRef]
  72. Imbrie, J.; Kipp, N. A New Micropaleontological Method for Quantitative Paleoclimatology: Application to a Late Pleistocene Caribbean Core. In The Late Cenozoic Glacial Ages; Yale University Press: New Haven, CT, USA, 1971; pp. 71–181. Available online: https://cir.nii.ac.jp/crid/1570572700955781248 (accessed on 12 May 2025).
  73. Guiot, J.; de Vernal, A. Chapter Thirteen Transfer Functions: Methods for Quantitative Paleoceanography Based on Microfossils. Dev. Mar. Geol. 2007, 1, 523–563. [Google Scholar] [CrossRef]
  74. Saraswati, P.K.; Srinivasan, M.S. Micropaleontology. Micropaleontology: Principles and Applications; Springer International Publishing: Cham, Switzerland, 2016; pp. 1–224. Available online: http://link.springer.com/10.1007/978-3-319-14574-7 (accessed on 29 December 2015).
  75. Nikolaev, S.D.; Oskina, N.S.; Blyum, N.S.; Bubenshchikova, N.V. Neogene–Quaternary variations of the ‘Pole–Equator’ temperature gradient of the surface oceanic waters in the North Atlantic and North Pacific. Glob. Planet. Chang. 1998, 18, 85–111. [Google Scholar] [CrossRef]
  76. Bonnefille, R. Cenozoic vegetation, climate changes and hominid evolution in tropical Africa. Glob. Planet. Chang. 2010, 72, 390–411. [Google Scholar] [CrossRef]
  77. Murray, J.W. Ecology and Applications of Benthic Foraminifera; Cambridge University Press: Cambridge, UK, 2006; pp. 1–426. [Google Scholar]
  78. Douglas, R.G.; Woodruff, F. Deep sea benthic foraminifera. Sea 1981, 7, 1233–1327. [Google Scholar]
  79. Pippèrr, M. Characterisation of Ottnangian (middle Burdigalian) palaeoenvironments in the North Alpine Foreland Basin using benthic foraminifera-A review of the Upper Marine Molasse of southern Germany. Mar. Micropaleontol. 2011, 79, 80–99. [Google Scholar] [CrossRef]
  80. Ayyad, H.M.; El-Sharnoby, A.A.; El-Morsy, A.M.; Ahmed, M.A.; El-Deeb, A.A. Quantitative reconstruction of paleoenvironmental conditions in the Gulf of Suez during the Burdigalian-Langhian (early to middle Miocene) using benthic foraminifera. Palaeogeogr. Palaeoclimatol. Palaeoecol. 2018, 503, 51–68. [Google Scholar] [CrossRef]
  81. Van Der Zwaan, G.J.; Jorissen, F.J.; de Stigter, H.C. The depth dependency of planktonic/benthic foraminiferal ratios: Constraints and applications. Mar. Geol. 1990, 95, 1–16. [Google Scholar] [CrossRef]
  82. Selley, R.C. Porosity gradients in North Sea oil-bearing sandstones. J. Geol. Soc. London 1978, 135, 119–132. [Google Scholar] [CrossRef]
  83. Selley, R.C. Elements of Petroleum Geology; Gulf Professional Publishing: London, UK, 1998; pp. 37–145. [Google Scholar]
  84. Aze, T.; Ezard, T.H.G.; Purvis, A.; Coxall, H.K.; Stewart, D.R.M.; Wade, B.S.; Pearson, P.N. A phylogeny of Cenozoic macroperforate planktonic foraminifera from fossil data. Biol. Rev. 2011, 86, 900–927. [Google Scholar] [CrossRef]
  85. Kennett, J.P.; Srinivasan, M.S. Neogene Planktonic Foraminifera: A Phylogenetic Atlas; Distributed by Worldwide by Van Nostrand Reinhold; Hutchinson Ross: New York, NY, USA, 1983; p. 265. Available online: https://searchworks.stanford.edu/view/1047922 (accessed on 18 October 1983).
  86. Keller, G. Depth stratification of planktonic foraminifers in the Miocene ocean. In The Miocene Ocean: Paleoceanography and Biogeography; Kennett, J.P., Ed.; Geological Society of America: Boulder, CO, USA, 1985. [Google Scholar] [CrossRef]
  87. Pearson, N.; Shackelton, J.; Hall, A.M. Stable isotopic evidence for the sympatric divergence of Globigerinoides trilobus and Orbulina universa (planktonic foraminifera). J. Geol. Soc. Lond. 1997, 154, 295–302. [Google Scholar] [CrossRef]
  88. Pearson, P.N.; Shackleton, N.J. 20. Neogene Multispecies Planktonic Foraminifer Stable Isotope Record, site 871, limalok guyot1. Proc. Ocean. Drill. Program. Sci. Results 1995, 144, 401–410. [Google Scholar]
  89. Poore, R.Z.; Matthews, R.K. Oxygen isotope ranking of late Eocene and Oligocene planktonic foraminifers: Implications for Oligocene sea-surface temperatures and global ice-volume. Mar. Micropaleontol. 1984, 9, 111–134. [Google Scholar] [CrossRef]
  90. Spezzaferri, S. Planktonic Foraminiferal Biostratigraphy and Taxonomy of the Oligocene and Lower Miocene in the Oceanic Record: An Overview; Palaeontographia Italica; Pacini Editore: Pisa, Italy, 1994; Available online: https://books.google.com.eg/books?id=sANkuAAACAAJ (accessed on 10 August 2025).
  91. Spezzaferri, S.; Olsson, R.K.; Hemleben, C. Taxonomy, Biostratigraphy, and Phylogeny of Oligocene to Lower Miocene Globigerinoides and Trilobatus; Wade, B.S., Olsson, R.K., Pearson, P.N., Huber, B.T., Berggren, W.A., Eds.; Atlas of Oligocene Planktonic Foraminifera; Cushman Foundation for Foraminiferal Research: Glen Allen, VA, USA, 2018; Volume 46. [Google Scholar]
  92. Bé, A.W.H.; Tolderlund, D.S. Distribution and Ecology of Living Planktonic Foraminifera in Surface Waters of the Atlantic and Indian Oceans. The Micropaleontology of Oceans; Cambridge University Press: London, UK, 1971; pp. 105–159. [Google Scholar]
  93. Hemleben, C.; Spindler, M.; Anderson, O.R. Modern Planktonic Foraminifera, 1st ed.; Springer: New York, NY, USA, 1989; p. XIII-363. Available online: http://link.springer.com/10.1007/978-1-4612-3544-6 (accessed on 6 December 2012).
  94. Pearson, P.N.; Ditchfield, P.W.; Singano, J.; Harcourt-Brown, K.G.; Nicholas, C.J.; Olsson, R.K.; Shackleton, N.J.; Hall, M.A. Warm tropical sea surface temperatures in the Late Cretaceous and Eocene epochs. Nature 2001, 413, 481–487. [Google Scholar] [CrossRef]
  95. Todd, R.; Cloud, P.; Low, D.; Schmidt, R. Probable occurrence of Oligocene on Saipan. Am. J. Sci. 1954, 252, 673–682. [Google Scholar] [CrossRef]
  96. Grunert, P.; Soliman, A.; Ćorić, S.; Roetzel, R.; Harzhauser, M.; Piller, W.E. Facies development along the tide-influenced shelf of the Burdigalian Seaway: An example from the Ottnangian stratotype (Early Miocene, middle Burdigalian). Mar. Micropaleontol. 2012, 84–85, 14–36. [Google Scholar] [CrossRef]
  97. Stewart, D.R.M.; Pearson, P.N.; Ditchfield, P.W.; Singano, J.M. Miocene tropical Indian Ocean temperatures: Evidence from three exceptionally preserved foraminiferal assemblages from Tanzania. J. Afr. Earth Sci. 2004, 40, 173–189. [Google Scholar] [CrossRef]
  98. Pearson, P.N.; Wade, B.S. Taxonomy and stable isotope paleoecology of well-preserved planktonic foraminifera from the Upper Oligocene of Trinidad. J. Foraminifer. Res. 2009, 39, 191–217. [Google Scholar] [CrossRef]
  99. Leckie, M.; Wade, B.; Pearson, P.; Fraass, A.; King, D.; Olsson, R.; Silva, I.; Spezzaferri, S.; Berggren, W. Taxonomy, Biostratigraphy, and Phylogeny of Oligocene and Early Miocene Paragloborotalia and Parasubbotina; Cushman Foundation for Foraminiferal Research: Lawrence, KS, USA, 2018. [Google Scholar]
  100. Wade, B.; Fucek, V.; Kamikuri, S.-I.; Bartol, M.; Luciani, V.; Pearson, P. Successive extinctions of muricate planktonic foraminifera (Morozovelloides and Acarinina) as a candidate for marking the base Priabonian. Newsl. Stratigr. 2012, 45, 245–262. [Google Scholar] [CrossRef]
  101. Wade, B.S.; Pearson, P.N. Planktonic foraminiferal turnover, diversity fluctuations and geochemical signals across the Eocene/Oligocene boundary in Tanzania. Mar. Micropaleontol. 2008, 68, 244–255. [Google Scholar] [CrossRef]
  102. Vergnaud Grazzini, C. Non-equilibrium isotopic compositions of shells of planktonic foraminifera in the Mediterranean sea. Palaeogeogr. Palaeoclimatol. Palaeoecol. 1976, 20, 263–276. [Google Scholar] [CrossRef]
  103. Gasperi, J.T.; Kennett, J.P. Vertical thermal structure evolution of Miocene surface waters: Western equatorial Pacific DSDP Site 289. Mar. Micropaleontol. 1993, 22, 235–254. [Google Scholar] [CrossRef]
  104. Chaisson, W.P.; Pearson, P. Planktonic foraminifer biostratigraphy at Site 925: Middle Miocene-Pleistocene. Proc. Ocean Drill. Program Sci. Results 1997, 154, 3–31. [Google Scholar] [CrossRef]
  105. Hooyberghs, H.J.F.; de Meuter, F.J.C. Biostratigraphy and Interregional Correlation of the Miocene Deposits of Northern Belgium Based on Planktonic Foraminifera: The Oligocene-Miocene Boundary on the Southern Edge of the North Sea Basin. In Mededelingen van de Koninklijke Academie voor Wetenschappen, Letteren en Schone Kunsten van België, Klasse der Wetenschappen; Paleis der Academiën: Brussels, Belgium, 1972; Available online: https://books.google.com.eg/books?id=P6QczwEACAAJ (accessed on 7 October 2020).
  106. Spero, H.J.; Lea, D.W. Experimental determination of stable isotope variability in Globigerina bulloides: Implications for paleoceanographic reconstructions. Mar. Micropaleontol. 1996, 28, 231–246. [Google Scholar] [CrossRef]
  107. Niebler, H.-S.; Hubberten, H.-W.; Gersonde, R. Oxygen Isotope Values of Planktic Foraminifera: A Tool for the Reconstruction of Surface Water Stratification BT—Use of Proxies in Paleoceanography: Examples from the South Atlantic; Fischer, G., Wefer, G., Eds.; Springer: Berlin/Heidelberg, Germany, 1999; pp. 165–189. [Google Scholar] [CrossRef]
  108. Schiebel, R.; Hemleben, C. (Eds.) Classification and Taxonomy of Extant Planktic Foraminifers BT—Planktic Foraminifers in the Modern Ocean; Springer: Berlin/Heidelberg, Germany, 2017; pp. 11–110. [Google Scholar] [CrossRef]
  109. Brummer, G.-J.; Kucera, M. Taxonomic review of living planktonic foraminifera. J. Micropalaeontol. 2022, 41, 29–74. [Google Scholar] [CrossRef]
  110. Arthur, M.; Dean, W.; Zachos, J.C.; Kaminski, M.; Reig, S.; Elmstrom, K. Geochemical Expression of Early Diagenesis in Middle Eocene-Lower Oligocene Pelagic Sediments in the Southern Labrador Sea, Site 647, ODP Leg 105. Proc. Ocean. Drill. Program: Sci. Results 1989, 105, 111–135. [Google Scholar]
  111. van Eijden, A.J.M.; Ganssen, G.M. An Oligocene multi-species foraminiferal oxygen and carbon isotope record from ODP Hole 758A (Indian Ocean): Paleoceanographic and paleo-ecologic implications. Mar. Micropaleontol. 1995, 25, 47–65. [Google Scholar] [CrossRef]
  112. Wade, B.S.; Berggren, W.A.; Olsson, R.K. The biostratigraphy and paleobiology of Oligocene planktonic foraminifera from the equatorial Pacific Ocean (ODP Site 1218). Mar. Micropaleontol. 2007, 62, 167–179. [Google Scholar] [CrossRef]
  113. Moore, T.C., Jr.; Wade, B.S.; Westerhold, T.; Erhardt, A.M.; Coxall, H.K.; Baldauf, J.; Wagner, M. Equatorial Pacific productivity changes near the Eocene-Oligocene boundary. Paleoceanography 2014, 29, 825–844. [Google Scholar] [CrossRef]
  114. Barrera, E.C.; Huber, B.T. Paleogene and early Neogene stable isotope record of foraminifera from ODP Leg 119 samples. PANGAEA. https://doi.org/10.1594/PANGAEA.758193. Barron, J; Larsen, B; et al. (Eds.) Supplement to: Barrera, EC; Huber, BT (1991): Paleogene and Early Neogene Oceanography of the Southern Indian Ocean: Leg 119 Foraminifer Stable Isotope Results. Proc. Ocean. Drill. Program Sci. Results Coll. Stn. (Ocean. Drill. Program) 1991, 119, 693–717. [Google Scholar]
  115. Sexton, P.F.; Wilson, P.A.; Pearson, P.N. Palaeoecology of late middle Eocene planktic foraminifera and evolutionary implications. Mar. Micropaleontol. 2006, 60, 1–16. [Google Scholar] [CrossRef]
  116. Boucot, A.J.; Xu, C.; Scotese, C.R.; Morley, R.J. Phanerozoic Paleoclimate: An Atlas of Lithologic Indicators of Climate; SEPM Concepts in Sedimentology and Paleontology: Tulsa, OK, USA, 2013; p. 484. Available online: https://pubs.geoscienceworld.org/books/book/1966 (accessed on 10 August 2025).
  117. Hammer, Ø.; Harper, D.A.T.; Ryan, P.D. Past: Paleontological statistics software package for education and data analysis. Palaeontol. Electron. 2001, 4, 4. [Google Scholar]
  118. Ayyad, H.M. Calcareous nannofossil biostratigraphy and paleoclimatology of the Paleocene succession, Tenida area, Western Desert, Egypt. Rev. Micropaleontol. 2018, 61, 37–54. [Google Scholar] [CrossRef]
  119. Ayyad, H.M.; Hewaidy, A.G.A.; Al-Labaidy, N.A. Sequence stratigraphy of the Miocene siliciclastic–carbonate sediments in Sadat Area, north-west of Gulf of Suez: Implications for Miocene eustasy. Geol. J. 2022, 57, 2255–2270. [Google Scholar] [CrossRef]
  120. Bazeen, Y.S.; Kassab, W.G.; Moneer, E.S.M.; Abu El-Kheir, G.A.; AbdelGawad, M.K.; Ayyad, H.M. Integrated biostratigraphy and chemostratigraphy of the Maastrichtian–Danian succession at Abu Minqar, Egyptian Western Desert: Implications for sequence stratigraphy and tectonic influence. Cretac. Res. 2024, 154, 105723. [Google Scholar] [CrossRef]
  121. Mitchum, R.M.; Vail, P.R. Seismic Stratigraphy and Global Changes of Sea Level, Part 7: Seismic Stratigraphic Interpretation Procedure. In Seismic Stratigraphy—Applications to Hydrocarbon Exploration; Payton, C.E., Ed.; American Association of Petroleum Geologists: Tulsa, OK, USA, 1977; Volume 26. [Google Scholar] [CrossRef]
  122. Catuneanu, O. Principles of Sequence Stratigraphy; Elsevier: Amsterdam, The Netherlands, 2006. [Google Scholar]
  123. Loutit, T.S.; Hardenbol, J.; Vail, P.R.; Baum, G.R. Condensed Sections: The key to Age Determination and Correlation of Continental Margin Sequences. In Sea-Level Changes: An Integrated Approach; Society of Economic Paleontologists Mineralogists: Tulsa, OK, USA, 1988; pp. 183–213. [Google Scholar]
  124. Armentrout, J.M. High Resolution Sequence Biostratigraphy: Examples from the Gulf of Mexico Plio-Pleistocene; Geological Society Special Publication: London, UK, 1996; Volume 104, pp. 65–86. [Google Scholar]
  125. Vail, P.R.; Wornardt, W. An Integrated Approach to Exploration and Development. In Well Log-Seismic Sequence Stratratigraphic Analysis, 41st ed.; Gulf Coast Association of Geological Societies Transactions: Houston, TX, USA, 1991; pp. 630–650. [Google Scholar]
  126. Hewaidy, A.G.A.; Ayyad, H.M.; Abd El-Moghny, M.W.; Gameel, O. Sequence stratigraphy and biozonation of the Upper Eocene Anqabiya Formation, Gebel Anqabiya, Egypt. Geosci. J. 2019, 23, 357–375. [Google Scholar] [CrossRef]
  127. Asquith, G.B. Log Evaluation of Shaly Sandstones: A Practical Guide; American Association of Petroleum Geologists: Tulsa, OK, USA, 1990. [Google Scholar] [CrossRef]
  128. Gawad, E.A.; Fathy, M.; Reda, M.; Ewida, H. Petroleum geology: 3D reservoir modelling in the central Gulf of Suez, Egypt, to estimate the hydrocarbon possibility via petrophysical analysis and seismic data interpretation. Geol. J. 2021, 56, 5329–5342. [Google Scholar] [CrossRef]
  129. Reda, M.; Fathy, M.; Gawad, E.A. Comprehensive 3D reservoir modelling and basin analysis: An insight into petroleum geology to re-evaluate the hydrocarbon possibilities in the Siwa Basin, North-Western Desert, Egypt. Geol. J. 2022, 57, 1600–1616. [Google Scholar] [CrossRef]
  130. Ayyad, H.M.; El-Moghny, M.W.A.; Abuseda, H.; Samir, A.; Bazeen, Y.S. Sequence stratigraphy and reservoir characterization of the lower Eocene rocks (Thebes Formation) along the Tethyan Ocean’s southern margin: Biostratigraphy and petrophysical parameter applications. Int. J. Earth Sci. 2023, 112, 1091–1112. [Google Scholar] [CrossRef]
  131. Asquith, G.; Krygowski, D.; Henderson, S.; Hurley, N. (Eds.) Basic Relationships of Well Log Interpretation; Basic Well Log Analysis; American Association of Petroleum Geologists: Tulsa, OK, USA, 2004; Volume 16. [Google Scholar] [CrossRef]
  132. Talabani, S.; Boyd, D.; El Wazeer, F.; Al Arfi, S. Validity of Archie Equation in Carbonate Rocks. In Proceedings of the Abu Dhabi International Petroleum Exhibition and Conference, Abu Dhabi, United Arab Emirates, 13–15 October 2000; pp. 643–650. [Google Scholar] [CrossRef]
  133. Al-Marzouqi, M.I.; Budebes, S.; Sultan, E.; Bush, I.; Griffiths, R.; Gzara, K.B.M.; Ramamoorthy, R.; Husser, A.; Jeha, Z.; Roth, J.; et al. Resolving carbonate complexity. Oilf. Rev. 2010, 22, 40–55. [Google Scholar]
  134. Van Wagoner, J.C.; Mitchum, R.M.; Campion, K.M.; Rahmanian, V.D. Siliciclastic Sequence Stratigraphy in Well Logs, Cores, and Outcrops: Concepts for High-Resolution Correlation of Time and Facies; American Association of Petroleum Geologists Museum Methods in Exploration Series 7; American Association of Petroleum Geologists: Tulsa, OK, USA, 1990. [Google Scholar]
  135. Catuneanu, O. Principles of Sequence Stratigraphy, 2nd ed.; Elsevier: Amsterdam, The Netherlands, 2022; ISBN 9780444533531. [Google Scholar]
  136. Wei, D.; Gao, Z.; Zhang, C.; Fan, T.; Tsau, J.-S. Characterization of the deeply buried microporous limestone: Case study from the Shunnan area, Tarim Basin, NW China. Geol. J. 2020, 55, 4920–4935. [Google Scholar] [CrossRef]
  137. Dong, F.; Zhou, C.; Zhou, J.; Ding, X.; Sheng, J.; Li, K.; Ren, D.; Lu, X. Study of the pore structure and fractal characteristics of mixed-sediments reservoirs based on low-temperature gas adsorption and high-pressure mercury injection. Carbonates Evaporites 2025, 40, 52. [Google Scholar] [CrossRef]
  138. Kohshima, S.; Takeuchi, N.; Uetake, J.; Shiraiwa, T.; Uemura, R.; Yoshida, N.; Matoba, S.; Godoi, M.A. Estimation of net accumulation rate at a Patagonian glacier by ice core analyses using snow algae. Glob. Planet. Chang. 2007, 59, 236–244. [Google Scholar] [CrossRef]
  139. Finkenbinder, M.S.; Abbott, M.B.; Steinman, B.A. Holocene climate change in Newfoundland reconstructed using oxygen isotope analysis of lake sediment cores. Glob. Planet. Chang. 2016, 143, 251–261. [Google Scholar] [CrossRef]
  140. Cornamusini, G.; Talarico, F.M. Miocene Antarctic ice dynamics in the Ross Embayment (Western Ross Sea, Antarctica): Insights from provenance analyses of sedimentary clasts in the AND-2A drill core. Glob. Planet. Chang. 2016, 146, 38–52. [Google Scholar] [CrossRef]
  141. Moradi, M.; Kadkhodaie, A. The impact of geological and petrophysical heterogeneities on Archie’s exponents: A case study for Sarvak carbonate reservoir, Dezful Embayment, southwest Iran. Carbonates Evaporites 2024, 39, 35. [Google Scholar] [CrossRef]
  142. Nienhaus, H.; Yogeshwar, P.; Mörbe, W.; Tezkan, B.; Büttner, C.; Legler, M.; Buske, S.; Lushetile, B.; Wennrich, V.; Melles, M. Geophysical and geological exploration of the Aurus clay pan as an archive of the long-term climatic and environmental history of the Namib Desert. Glob. Planet. Chang. 2023, 230, 104259. [Google Scholar] [CrossRef]
  143. Archie, G.E. The Electrical Resistivity Log as an Aid in Determining Some Reservoir Characteristics. Trans. AIME 1942, 146, 54–62. [Google Scholar] [CrossRef]
  144. Ding, X.; You, G.; Yiming, A.; Liu, H.; Jiang, W.; Cao, Z.; Zha, M.; Qu, J. Origin of Overpressure and Its Influence on Hydrocarbon Leakage in Mosuowan Uplift of the Junggar Basin, NW China. Geol. J. 2025, 60, 700–715. [Google Scholar] [CrossRef]
  145. Gooday, A.J. Biodiversity of foraminifera and other protists in the deep sea: Scales and patterns. Belgian J. Zool. 1999, 129, 61–80. [Google Scholar]
  146. Miller, K.G.; Browning, J.V.; John Schmelz, W.; Kopp, R.E.; Mountain, G.S.; Wright, J.D. Cenozoic sea-level and cryospheric evolution from deep-sea geochemical and continental margin records. Sci. Adv. 2020, 6, eaaz1346. [Google Scholar] [CrossRef]
  147. Scotese, C.R.; Song, H.; Mills, B.J.W.; van der Meer, D.G. Phanerozoic paleotemperatures: The earth’s changing climate during the last 540 million years. Earth-Sci. Rev. 2021, 215, 103503. [Google Scholar] [CrossRef]
  148. Mitchell, N.C.; Ligi, M.; Preine, J.; Liebrand, D.; Ali, M.; Decarlis, A. Contourite-like deposits suggest stronger-than-present circulation in the Plio-Pleistocene Red Sea. Glob. Planet. Chang. 2024, 240, 104527. [Google Scholar] [CrossRef]
  149. Moustafa, A.R. Exploratory Notes for the Geologic Maps of the Eastern Side of the Suez Rift (Western Sinai Peninsula), Egypt; Geology Department, Faculty of Science, Ain Shams University: Cairo, Egypt, 2004. [Google Scholar]
  150. Sayed, M.; Salim, S.; El Araby, A.M.; Hammed, M. The implications of structural control on the miocene carbonate reservoirs of Bakr-Al Hamd oil fields, Gulf of Suez. J. Pet. Explor. Prod. Technol. 2024, 14, 1149–1172. [Google Scholar] [CrossRef]
  151. Khan, A.A.; Zan, J.; Fang, X.; Zhang, W.; Jadoon, U.F. Global warming drove the Mid-Miocene climate humidification in the northern Tibetan Plateau. Glob. Planet. Chang. 2023, 226, 104135. [Google Scholar] [CrossRef]
  152. Sun, J.; Liu, W.; Windley, B.F.; Xu, L.; Lü, T. Enhanced aridity in the interior of Asia after the Middle Miocene Climatic Optimum driven by global cooling. Glob. Planet. Chang. 2025, 245, 104691. [Google Scholar] [CrossRef]
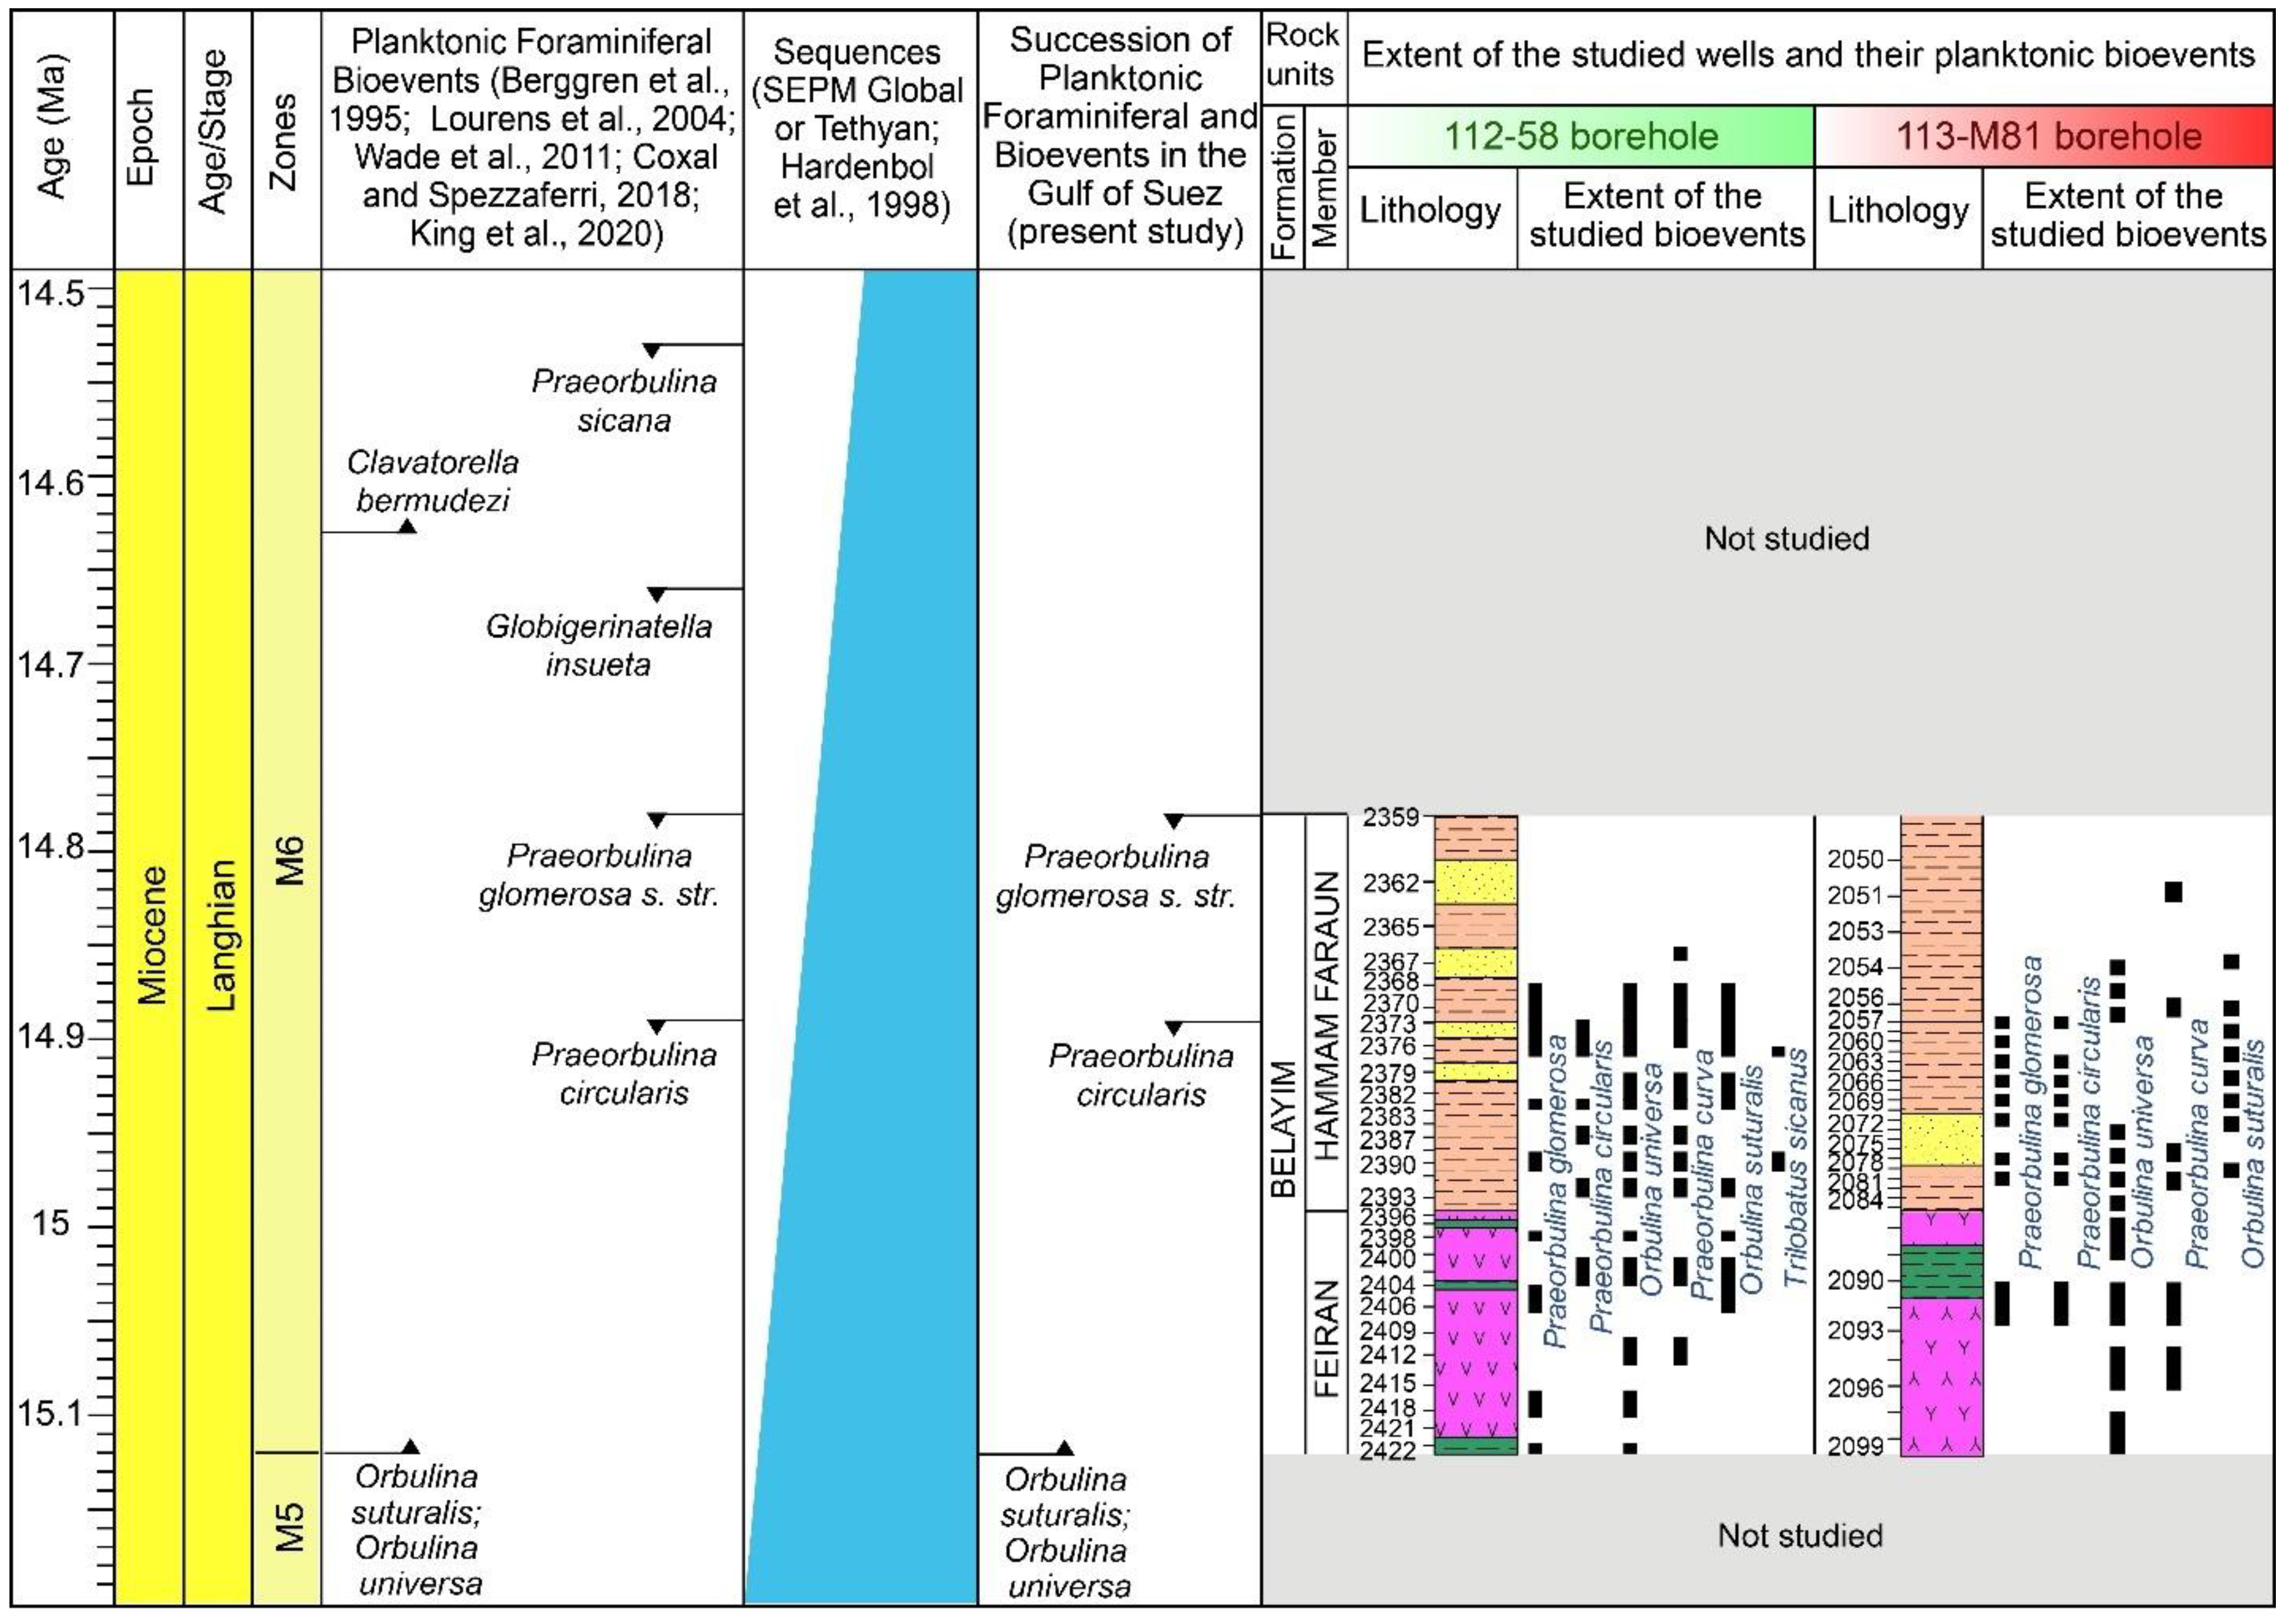
Figure 3. Integrated biostratigraphic framework for wells 112-58 and 113M-81 showing stratigraphic ranges of key planktonic foraminifera defining the Orbulina universa Total Range Zone (M6 Zone, Langhian; 15.12–14.78 Ma) and evolutionary transition from Praeorbulina (P. curva, P. glomerosa) to Orbulina (O. suturalis, O. universa) lineages [53,54,55,56,57,58].
Minerals 15 00864 g003
Figure 4. High-resolution SEM images of diagnostic selected foraminiferal species. The scale bar in each image represents 250 μm. 1. Catapsydrax unicavus Bolli, Loeblich and Tappan, sample no. 2397, 112-58 borehole; 2. Globigerinella obesa (Bolli), sample no. 2054, 113-M81 borehole; 3. Globigerinella praesiphonifera (Blow), sample no. 2084, 113-M81 borehole; 4. Globigerinita glutinata (Egger), sample no. 2409, 112-58 borehole; 5. Globigerinita uvula (Ehrenberg), sample no. 2096, 113-M81 borehole; 6. Globigerina bulloides d’Orbigny, sample no. 2391, 112-58 borehole; 7. Globoquadrina dehiscens (Chapman, Parr & Collins), sample no. 2069, 113-M81 borehole; 8. Globoturborotalita occlusa (Blow and Banner), sample no. 2382, 112-58 borehole; 9. Orbulina suturalis Brönnimann, sample no. 2373, 112-58 borehole; 10. Orbulina universa d’Orbigny, sample no. 2370, 112-58 borehole; 11. Praeorbulina circularis (Blow), sample no. 2376, 112-58 borehole; 12. Praeorbulina curva (Blow), sample no. 2093, 113-M81 borehole; 13. Praeorbulina glomerosa (Blow), sample no. 2403, 112-58 borehole; 14. Tenuitella clemenciae (Bermudez), sample no. 2081, 113-M81 borehole; 15. Trilobatus altospiralis Spezzaferri, sample no. 2054, 113-M81 borehole; 16. Trilobatus immaturus (Le Roy), sample no. 2054, 113-M81 borehole; 17. Trilobatus quadrilobatus (d’Orbigny), sample no. 2391, 112-58 borehole; 18. Trilobatus trilobus (Reuss), sample no. 2397, 112-58 borehole; 19. Turborotalita quinqueloba (Natland), sample no. 2397, 112-58 borehole; 20. Bolivina dilatata hyalina Hofman, sample no. 2403, 112-58 borehole; 21. Bolivina dilatata maxima Cicha & Zapletalov, sample no. 2382, 112-58 borehole; 22. Cibicides droogeri Souaya, sample no. 2382, 112-58 borehole; 23. Cibicidoides austriacus (d’Orbigny), sample no. 2081, 113-M81 borehole; 24. Cibicidoides ungerianus ungerianus (d’Orbigny), sample no. 2081, 113-M81 borehole; 25. Lenticulina limbosa (REUSS), sample no. 2057, 113-M81 borehole; 26. Pappina breviformis (Papp & Turnovsky), sample no. 2409, 112-58 borehole; 27. Uvigerina multistriata Hantken, sample no. 2397, 112-58 borehole; 28. Uvigerina vicksburgensis Cushman & Ellis, sample no. 2409, 112-58 borehole.
Minerals 15 00864 g004
Figure 5. Paleoclimatic reconstruction of the Hammam Faraun Member (Langhian, 15.12–14.78 Ma) using foraminiferal proxies. (A,B) Sea surface temperature (SST) and diversity indices (Shannon H, Evenness E) for wells 112−58 and 113M-81 show stable subtropical conditions with SSTs of 19.2–21.2 °C (mean 20.2 °C ± 1 °C), high diversity (H: 1.2–2.9), and high evenness (E: 0.86–1.45). Minor cooling occurs in upper sections. (C) Paleogeographic map (modified after [116]) showing lithologic climate indicators consistent with arid subtropical conditions in the Gulf of Suez during the Miocene.
Minerals 15 00864 g005
Figure 6. Stratigraphic distribution and thermal affinity of planktonic foraminifera in the Hammam Faraun Member (Langhian, M6 Zone). Vertical distribution of warm- and cold-water assemblages in boreholes 112-58 (A) and 113M-81 (B).
Minerals 15 00864 g006
Figure 7. Sequence-stratigraphic paleobathymetric reconstruction for the Belayim Formation. The reconstruction showing SB1 (base Feiran Member) identified by >30 API gamma-ray shift and erosional truncation; SB2 (Feiran–Hammam Faraun contact) marked by abrupt evaporite-to-shale transition (A) Borehole 112-58 (LA.SQ1: Feiran anhydrite; Hammam Faraun LA.SQ2: TST2 shales → HST2 sandstones). (B) Borehole 113M-81 (Hammam Faraun LA.SQ2: TST2 shales → HST2 sandstones). Paleodepths (611–1238 m), P/B ratios (84–100), and Fisher α indices (7–15.8) indicate persistent bathyal conditions.
Minerals 15 00864 g007
Figure 8. Sequence stratigraphic framework, paleoclimate, and global correlations for Belayim Formation. LA.SQ1 (Feiran anhydrite) reflects rift-driven restriction with poor eustatic correlation, while LA.SQ2 (Hammam Faraun) aligns with global Langhian sea-level fall [145]. Gulf of Suez SSTs during Mi2a (~14.8 Ma) exceeded global averages by 1.8–2.1 °C, amplifying evaporation and siliciclastic flux. Sequence surfaces constrained by foraminiferal datums (FAD O. suturalis; LAD P. glomerosa) [57,146,147].
Minerals 15 00864 g008
Figure 9. Computer-Processed Interpretation (CPI) plots showing vertical variations in reservoir characteristics and facies heterogeneity within the Hammam Faraun Member (Belayim Formation, borehole 112-58).
Minerals 15 00864 g009
Figure 10. Computer-Processed Interpretation (CPI) plots effectively demonstrate vertical variations in reservoir characteristics and facies heterogeneity within the studied formation in the 113M-81 borehole.
Minerals 15 00864 g010
Figure 11. Sonic transit time (DTCO) versus bulk density (RHOB) cross-plot for the Hammam Faraun Member, delineating three lithologic clusters: sandstone (SS; low density, high transit time), limestone (LS; moderate density/transit time), and dolomite (DOL; high density, low transit time). Highlights porous sandstones as primary reservoir targets and identifies dense carbonates as potential non-reservoir facies.
Minerals 15 00864 g011
Figure 12. Petrographic characteristics of Hammam Faraun Member sandstones. Thin-section photomicrographs under plane-polarized (A) and cross-polarized (B) light from borehole 113M-81 at depths of (1) 2721.90 m, (2) 2726.80 m, (3) 2734.30 m, and (4) 2805.70 m, all showing dolomitic quartz arenite with fine-grained, moderately to poorly sorted, and moderately cemented characteristics.
Minerals 15 00864 g012
Figure 13. High-resolution SEM images illustrating key diagenetic controls on reservoir quality in the Hammam Faraun Member sandstones. SEM photomicrographs showing general (A) and close-up (B) views from borehole 113M-81 at depths of (1) 2721.90 m, (2) 2726.80 m, (3) 2734.30 m, and (4) 2805.70 m.
Minerals 15 00864 g013
Figure 14. Formation Resistivity Factor (FRF) analysis under simulated reservoir overburden pressure (7000 psig). (A) Cross-plot of FRF vs. porosity (ϕ) for core plugs from HST2 sandstones (Well 112-58; 2722.31–2726.03 m depth), deriving Archie parameters: cementation exponent (m = 1.9–2.1) and tortuosity factor (a = 0.8–1.1). (B) Representative FRF curves quantifying pore-network tortuosity, with lower m-values indicating enhanced connectivity in quartz-rich zones (Sample 5) vs. reduced flow in dolomite-cemented intervals (Sample 12).
Minerals 15 00864 g014
Figure 15. Resistivity Index (RI) analysis under simulated reservoir conditions (7000 psig). (A,B) Cleaned-state measurements showing homogeneous pore networks (n = 1.8–2.0). (C) Restored-state measurements (hydrocarbon saturation) exhibiting increased saturation exponents (n = 2.1–2.3) due to clay-induced pore-throat narrowing and mixed wettability.
Minerals 15 00864 g015
Figure 16. Mercury Injection Capillary Pressure (MICP) pore-throat characterization of HST2 sandstones (Well 112-58). (A) Sample 5 (2722.31 m): Unimodal distribution, low entry pressure (6.75 psi), and broad pore-throat radii (1.28–0.049 μm) indicating excellent connectivity in quartz-dissolution-enhanced zones. (B) Sample 12 (2726.03 m): Multimodal distribution, high entry pressure (13.4 psi), and finer throats (0.63–0.032 μm) revealing permeability reduction by pore-filling kaolinite and dolomite cement. Scales: Pore-throat radius (μm) vs. incremental mercury saturation (%).
Minerals 15 00864 g016
Figure 17. Provenance and transport of syn-rift clastics: (A) Landsat TM image (modified after [13]) showing Wadi Feiran and Nubia Valley source areas (G. Abu Durba fault block) supplying Belayim fields, with yellow arrows indicating transport paths; surface geology after [12]. (B) E-W oriented schematic from Gulf of Suez eastern margin (Belayim) to western margin (Amer-Bakr-Al Hamd fields) (after [149]).
Minerals 15 00864 g017
Table 1. Summary of the foraminiferal analysis protocol, outlining key steps, procedures, and their respective purposes in ensuring data reliability and taxonomic accuracy.
StepProtocolPurpose
Disaggregation10% H2O2, 24-h reactionGentle clay removal
Sieving63 µm meshIsolate diagnostic > 63 µm fraction
Drying40 °C ovenPrevent test dissolution/fragmentation
ImagingSEM (20 kV); Adobe Photoshop CS4Morphometric analysis & taxonomic validation
TaxonomyIntegrated Mikrotax databases + peer-reviewed schemesEnsure consistency with global biostratigraphic standards
Table 3. Key stratigraphic framework of the studied boreholes.
BioeventAge (Ma)Depth (m)Member Boundary
FAD O. suturalis15.122422 (112-58)Base Feiran
LAD P. circularis14.892373 (112-58)Feiran/H.F. transition
LAD P. glomerosa14.782359 (112-58)Top Hammam Faraun
Table 4. The key reservoir characteristics of the Hammam Faraun Member in the study region demonstrate significant variability in petrophysical parameters.
Well NameReservoirNet Pay Thickness (m)Effective Porosity (%)Shale Content (%)Water Saturation (%)Hydrocarbon Saturation (%)
112-58Hammam Faraun1.819264555
113M-812.717416733
Table 5. Summary of Geological Controls Governing Facies Dichotomy in the Gulf of Suez.
Control FactorEastern Gulf (Hammam Faraun Member)Western Gulf (Nullipore Reservoir)
PaleobathymetryBathyal depths (>600 m); light-limited carbonate suppressionNeritic depths (<100 m); optimal for photic-dependent biota
Depositional EnvironmentDeep marine (bathyal; >600 m); high-energy, turbid conditionsShallow marine (neritic; <100 m); clear, stable waters
TectonicsActive syn-rift subsidence; fault-controlled sediment remobilizationStable horst blocks; minimal structural disruption
Sediment SupplyHigh clastic influx (proximal to Nubian Shield sources)Limited terrigenous input; dominance of in situ carbonate production
Sea-Level DynamicsHigh-frequency, high-amplitude fluctuations disrupt carbonate factoriesStable sea levels enable continuous carbonate growth and reefal continuity
Disclaimer/Publisher’s Note: The statements, opinions and data contained in all publications are solely those of the individual author(s) and contributor(s) and not of MDPI and/or the editor(s). MDPI and/or the editor(s) disclaim responsibility for any injury to people or property resulting from any ideas, methods, instructions or products referred to in the content.