Article

Impact of Landfill Sites on Coastal Contamination Using GIS and Multivariate Analysis: A Case from Al-Qunfudhah in Western Saudi Arabia

Geology and Geophysics Department, College of Science, King Saud University, Riyadh 11451, Saudi Arabia
*
Author to whom correspondence should be addressed.
Minerals 2025, 15(8), 802; https://doi.org/10.3390/min15080802
Submission received: 6 July 2025 / Revised: 25 July 2025 / Accepted: 27 July 2025 / Published: 30 July 2025

Abstract

The contamination due to coastal landfill is a growing environmental concern, particularly in fragile marine ecosystems, where leachate can mobilize toxic elements into soil, water, air, and sediment. This study aims to assess the impact of a coastal landfill in Al-Qunfudhah, western Saudi Arabia, on nearby coastal sediments by identifying the concentration, distribution, and ecological risk of potentially toxic elements (PTEs) using geospatial and multivariate analysis tools. The results indicate significant accumulation of Pb, Zn, Cu, and Fe, with Pb reaching alarming levels of up to 1160 mg/kg in the landfill area, compared to 120 mg/kg in the coastal sediments. Zn contamination also exhibited substantial elevation, with values reaching 278 mg/kg in landfill soil and 157 mg/kg in coastal sediment. The enrichment factor values indicate moderate to severe enrichment for Pb (up to 73.20) and Zn (up to 6.91), confirming anthropogenic influence. The contamination factor analysis categorized Pb contamination as very high (CF > 6), suggesting significant ecological risk. Comparison with sediment quality guidelines suggest that Pb, Zn, and Cu concentrations exceeded threshold effect levels (TEL) in some samples, posing potential risks to marine organisms. The spatial distribution maps revealed pollutant migration from the landfill toward the coastal zone, emphasizing the necessity of monitoring and mitigation strategies. As the first comprehensive study on landfill-induced PTEs contamination in Al-Qunfudhah, these findings provide essential insights for environmental management and pollution control policies along the Red Sea coast.

1. Introduction

Coastal environments are extremely dynamic and essential to worldwide biodiversity, economic development, and human well-being. However, these delicate environments are increasingly at risk due to pollution from human activities, with landfill sites being a major source of contamination [1]. Among the different types of landfills, municipal solid waste (MSW) landfills, such as the one studied here, are particularly concerning when located near coastlines. The Al-Qunfudhah landfill, which is the focus of this study, is an active municipal landfill that receives domestic, commercial, and limited industrial waste. Landfills near coastal areas release various pollutants, including potentially toxic elements (PTEs), organic toxins, and microplastics, which negatively impact soil, groundwater, and marine ecosystems [2,3]. These contaminants can persist in the environment, accumulating in sediments and aquatic organisms, ultimately causing long-term ecological harm. Pollution from coastal landfills significantly affects air, water, and soil quality. Toxic leachates containing hazardous elements such as arsenic, lead, chromium, and nickel can seep into groundwater and spread into marine habitats, further increasing contamination levels [4]. Additionally, greenhouse gases and volatile organic compounds are released by landfill discharges, contributing to air pollution and environmental degradation. Wind and water currents further disperse these pollutants, expanding their ecological impact across a wider area [3].
Marine organisms, including coral reefs, mollusks, and fish, are highly vulnerable to pollution from coastal landfills. PTEs, in particular, can accumulate in marine species’ tissues, disrupting biological functions and posing health risks to organisms at higher trophic levels, including humans [5,6]. Coral reefs, vital biodiversity hubs, are especially sensitive to PTE exposure, which can lead to bleaching, reduced calcification, and overall ecosystem decline [7]. Similarly, mollusks and fish inhabiting contaminated waters often experience physiological and reproductive impairments, impacting fisheries and food security. Coastal landfills present a major environmental hazard to marine ecosystems by leaching toxic substances, particularly PTEs, into nearby sediments and water bodies. These pollutants, derived from industrial, municipal, and household waste, tend to accumulate in marine life, resulting in bioaccumulation and biomagnification throughout the food chain [8]. PTEs such as lead, cadmium, copper, and zinc are of particular concern due to their long-term persistence in sediments. Over time, they gradually enter the aquatic environment through processes such as erosion, tidal movements, and groundwater infiltration [9].
Once introduced into the marine environment, PTEs can interfere with physiological and metabolic processes in marine organisms, causing oxidative stress, enzyme inhibition, and DNA damage. These disruptions can ultimately lead to decreased reproductive success and population decline [10]. Benthic organisms, which inhabit or interact with contaminated sediments, are particularly at risk due to prolonged exposure to metal-rich substrates, often accumulating toxins at levels that exceed safe thresholds [11]. Filter-feeding species such as bivalves and oysters absorb metals from both the water column and suspended sediments, making them valuable bioindicators of HM contamination. However, higher trophic levels are also at risk from their buildup of harmful compounds, including humans who eat tainted seafood [12,13]. Chronic exposure to landfill-derived pollutants in fish has been linked to neurological disorders, immune suppression, and developmental abnormalities, threatening both marine biodiversity and fisheries-based economies [14]. Furthermore, landfill leachates contribute to sediment degradation, leading to the loss of critical habitats such as seagrass beds and coral reefs, which are essential for supporting marine biodiversity and coastal ecosystem stability [15].
Despite global recognition of landfill risks, relatively few studies have addressed the direct influence of active municipal landfills on marine sediment contamination in arid, semi-arid, and developing regions, particularly in the Red Sea basin. Given the increasing global dependence on coastal landfills, addressing their impact on marine life requires urgent regulatory action, improved waste management practices, and ongoing environmental monitoring to mitigate the long-term consequences of PTE pollution.
To effectively assess pollution levels from landfill sites, researchers employ various contamination indices and statistical analytical tools. Indices such as the contamination factor (CF), geo-accumulation index (Igeo), and enrichment factor (EF) are commonly used to quantify contamination in soil and sediments, offering valuable insights into the extent of human-induced pollution [16]. Additionally, advanced statistical techniques like principal component analysis (PCA) and hierarchical cluster analysis (HCA) help identify pollution sources and analyze their spatial distribution [17]. By integrating these approaches, scientists can develop targeted mitigation strategies to manage and reduce coastal pollution, promoting the sustainability of marine ecosystems and coastal communities. The use of Geographic Information Systems (GIS) and remote sensing (RS) technologies has greatly improved the ability to map and monitor contamination in coastal sediments. These tools provide detailed spatial and temporal analyses of pollution trends, enabling researchers to pinpoint PTE accumulation hotspots and assess anthropogenic impacts with high accuracy [18,19].
Over the past two decades, numerous studies have examined coastal sediment contamination along the Red Sea in Saudi Arabia (e.g., [20,21,22,23,24,25,26,27,28,29,30,31,32,33,34,35]). These studies have documented significant pollution resulting from human activities, including industrial discharge, urban runoff, and maritime transport. PTE contamination has been a key area of focus due to its persistence in the environment and potential ecological toxicity. However, most of these studies have focused on industrial or urban sources, with limited emphasis on the contribution of coastal landfills to marine contamination, particularly in mid-sized towns such as Al-Qunfudhah. This study aims to evaluate the impact of an active municipal landfill on coastal contamination in Al-Qunfudhah, western Saudi Arabia, using a combination of GIS, contamination indices, and multivariate statistical analysis. Specifically, it seeks to (1) quantify PTE concentrations in coastal sediments, (2) map their spatial distribution, (3) assess potential ecological risks, and (4) differentiate between natural and anthropogenic sources of contamination.
This work represents the first comprehensive evaluation of landfill-induced PTE contamination in the Al-Qunfudhah region. By integrating GIS with advanced multivariate statistical techniques, it offers a systematic approach to identifying contamination hotspots and pinpointing pollution sources with enhanced precision. Furthermore, this research addresses a critical gap in coastal pollution studies by establishing a direct link between landfill-derived contaminants and ecotoxicological risks, providing new insights into the long-term environmental effects of improper waste management. The findings will serve as a foundational reference for future environmental monitoring initiatives and contribute scientific evidence to support regulatory measures aimed at mitigating coastal pollution along the Red Sea.

2. Materials and Methods

2.1. Study Area

The study area is situated along the Al-Qunfudhah coastline on the southwestern coast of Saudi Arabia, adjacent to the Red Sea. It lies east of the Asir mountain range, where the underlying geology primarily consists of Proterozoic volcanic–sedimentary formations from the Arabian Shield [36,37]. The landfill is located approximately 1.5 km inland from the coast and primarily receives municipal solid waste. The coastal stretch analyzed in this study includes intertidal zones potentially affected by leachate migration. Figure 1 illustrates the location of both landfill and coastal sampling sites, with improved clarity and labeled sample points based on GPS coordinates.
In total, 37 samples were collected during fieldwork in March 2025: 18 soil samples were taken exclusively from the landfill site, and 19 sediment samples were collected along the Al-Qunfudhah shoreline. A stainless steel grab sampler was used to prevent contamination during collection (Figure 1). The intertidal sediments consist of fine to coarse sandy mud, with a mix of terrestrial and biogenic materials. The terrestrial fraction originates from the Arabian Shield, while biogenic elements are deposited onshore by tidal activity and storms [1]. Sample locations were recorded using a handheld GPS device with ±3 m accuracy, and all samples were stored in plastic bags at 4 °C to prevent degradation before laboratory analysis.

2.2. Sample Preparation and Elemental Analysis

To guarantee homogeneity, all samples were dried at 100 °C and pulverized with a non-metallic mortar and pestle. Each sample was then sieved to <63 µm to obtain fine-grained sediment fractions suitable for geochemical analysis. At the ALS Geochemistry Lab in Jeddah, Saudi Arabia, inductively coupled plasma-atomic emission spectrometry (ICP-AES) was used to measure concentrations of Fe, As, Mn, Al, Co, Ni, V, Zn, Cr, Pb, and Cu. Instrumentation included the Thermo Fisher iCAP 6500 (Thermo Fisher Scientific, St San Francisco, CA, USA) and PerkinElmer Optima series (PerkinElmer, Inc., Waltham, MA, USA).
Sample digestion was conducted using aqua regia (HNO3:HCl = 1:3), heating the mixture on a sand hot plate at 60–120 °C for 45 min to ensure total digestion. The solution was then filtered and diluted to 50 mL with deionized water prior to analysis. To ensure accuracy, multi-element standards prepared in an acid matrix were used for instrument calibration. Certified reference materials (CRMs), such as those provided by NIST and Sigma-Aldrich (St. Louis, MI, USA), were analyzed alongside study samples. Duplicate and split samples were used to verify precision and reproducibility. Validation metrics confirmed the reliability of the ICP-AES results [38,39].

2.3. Mapping and Assessment of the PTEs

The spatial distribution maps were generated using ArcGIS Pro 3.0.1. The inverse distance weighted (IDW) interpolation method was applied to create continuous surfaces representing the PTEs across the study area. IDW estimates values at unsampled locations based on a weighted average of nearby locations, where weights decrease with distance, making it a practical and widely used method for this type of environmental spatial analysis [40].
To assess contamination levels and ecological risks, the following indices were applied: enrichment factor (EF), geo-accumulation index (Igeo), contamination factor (CF), and ecological risk index (RI) [32,41,42]. The classification of these indicators is explained in Table S1, and each index is described below.

2.3.1. Enrichment Factor (EF)

The EF helps distinguish anthropogenic inputs from natural background concentrations. It is calculated using
EF = (C/X)sample/(C/X)background
where C is the concentration of the target element, X is the concentration of the normalizing element (typically Fe), and (C/X)background is the background reference ratio. Iron was selected as the normalizing element due to its high natural abundance and conservative geochemical behavior. To validate its use, we confirmed that Fe exhibited a coefficient of variation (CV%) below 15% across the dataset, indicating stable distribution.
The geochemical background values (Bn) used for all indices were uniformly derived from globally recognized average shale values, as reported by [43]. These values were selected due to the absence of established local baselines and to facilitate global comparisons. The same background reference values are consistently applied in the calculations for EF, Igeo, CF, and RI.

2.3.2. Geo-Accumulation Index (Igeo)

Igeo quantifies the degree of metal pollution relative to background levels using the formula
Igeo = log2[C/(1.5 × Bn)]
where C is the measured concentration of the element, Bn is the geochemical background concentration (as noted above), and 1.5 = correction factor accounting for natural variability.

2.3.3. Contamination Factor (CF)

This index provides a straightforward measure of contamination severity.
CF = C/Bn
where C is the measured concentration of the element in the sample, and Bn is the same background concentration used in the EF and Igeo calculations.

2.3.4. Ecological Risk Factor (Eri) and Risk Index (RI)

The potential ecological risk of each element and the total risk are calculated using
Eri = Tri × CFi
RI = ΣEri = Σ(Tri × CFi)
where Tri is a biological toxic response factor, and CFi is the contamination factor for each element. The toxic response factors used were Zn = 1, Cr = 2, Ni = 6, Cu = 5, Pb = 5, and As = 10 [40]. The same shale-derived background concentrations (Bn) are used to calculate all CF values referenced here.

3. Results

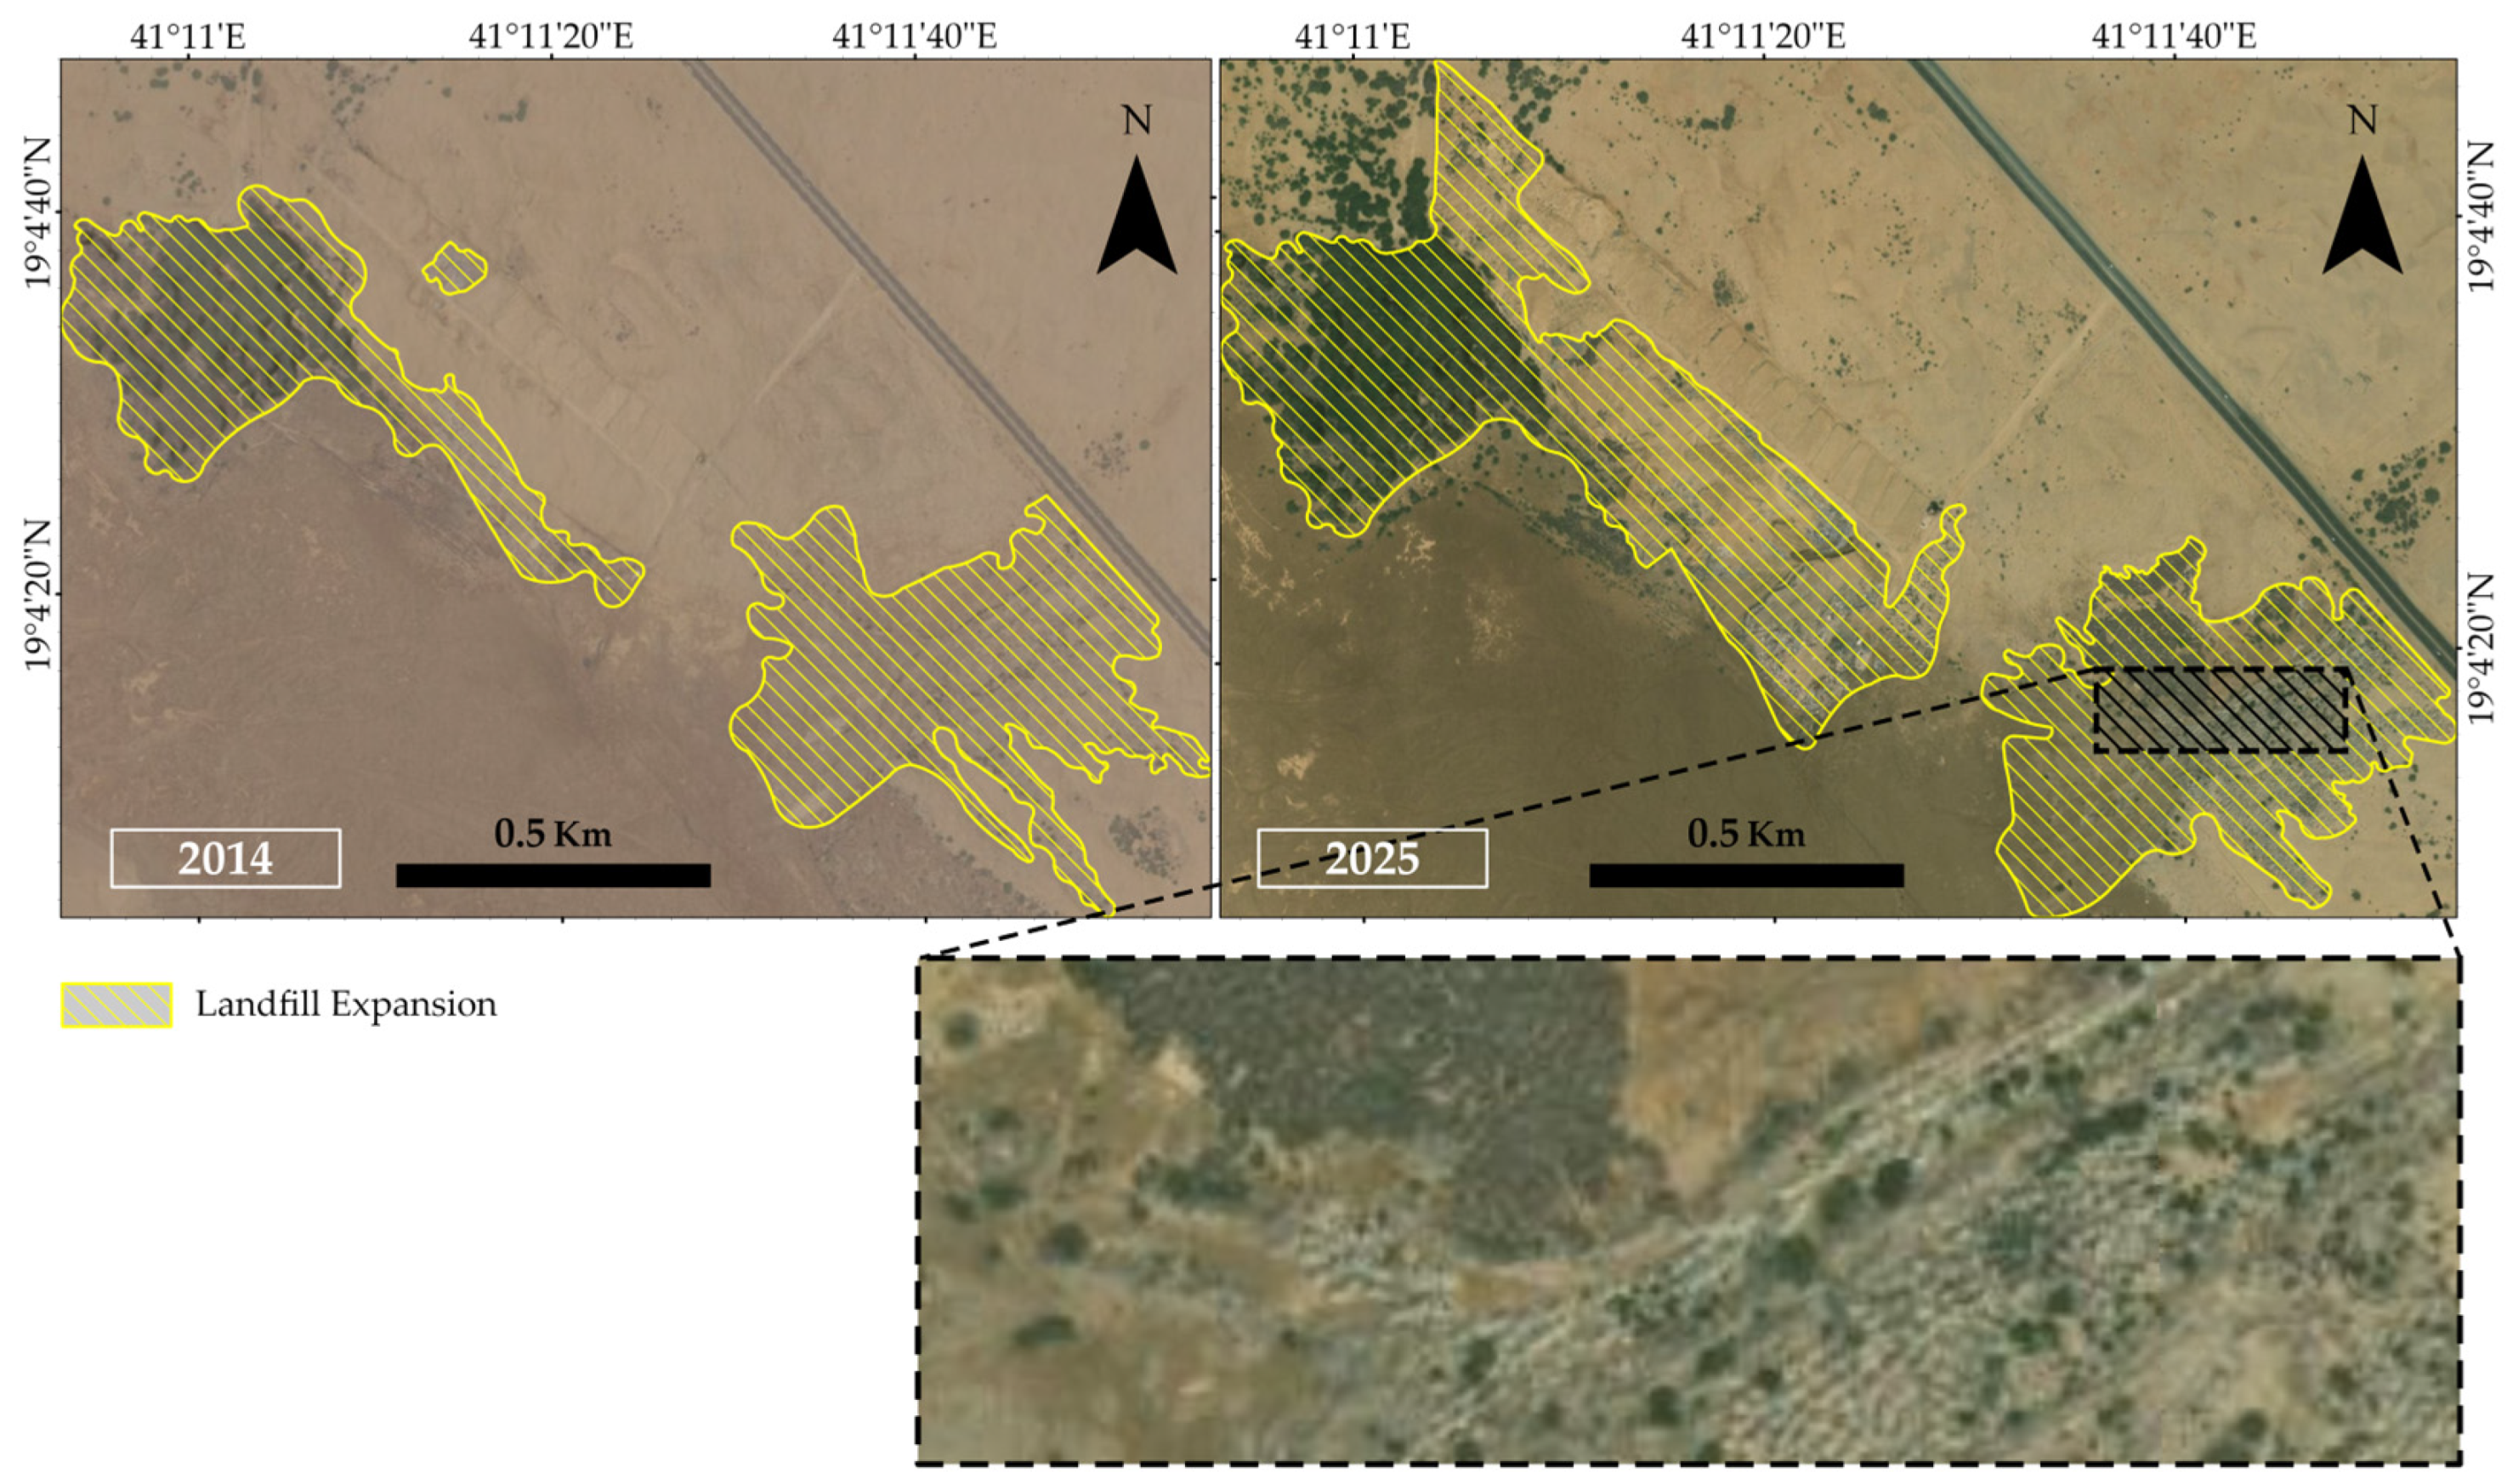
3.1. Temporal Changes in the Al-Qunfudhah Landfill Area

The Al-Qunfudhah landfill predominantly receives municipal solid waste, including household waste, construction debris, and limited amounts of electronic and industrial waste. The landfill is unengineered and lacks detailed stratigraphic records. However, field observations and sample descriptions indicate that the waste is spread over the surface with a thickness estimated between 1 to 3 m in the most active dumping zones. The top 10 cm of soil was specifically targeted in our sampling due to its high potential for surface contamination and runoff interactions. Currently, the landfill is not protected by any engineered containment systems such as liners, leachate collection mechanisms, or surface runoff controls. This lack of infrastructure facilitates the migration of leachate into the surrounding environment, particularly during seasonal rainfall events.
In this study, the December 2014 image was selected along with the most recent image available from 27 February 2025, using Esri Wayback Imagery (ArcGIS Pro 3.0.1), (Figure 2). To calculate and define the landfill area and its expansion, the authors utilized GIS to digitize the landfill boundaries for each period analyzed. The analysis revealed that the landfill area remained unchanged from 2014 until the end of January 2021, after which it expanded and remained the same until the most recent image used in 2025. This approach enabled precise measurement of the expansion areas, allowing for effective monitoring of temporal changes over time. More importantly, this temporal analysis directly supports the spatial distribution of potentially toxic elements (PTEs) observed in our results. Thus, the integration of satellite-derived landfill growth with field-based contamination data provides critical insight into how spatial and temporal changes in landfill activity correlate with environmental degradation. This highlights the importance of incorporating geospatial tools into long-term pollution monitoring programs.

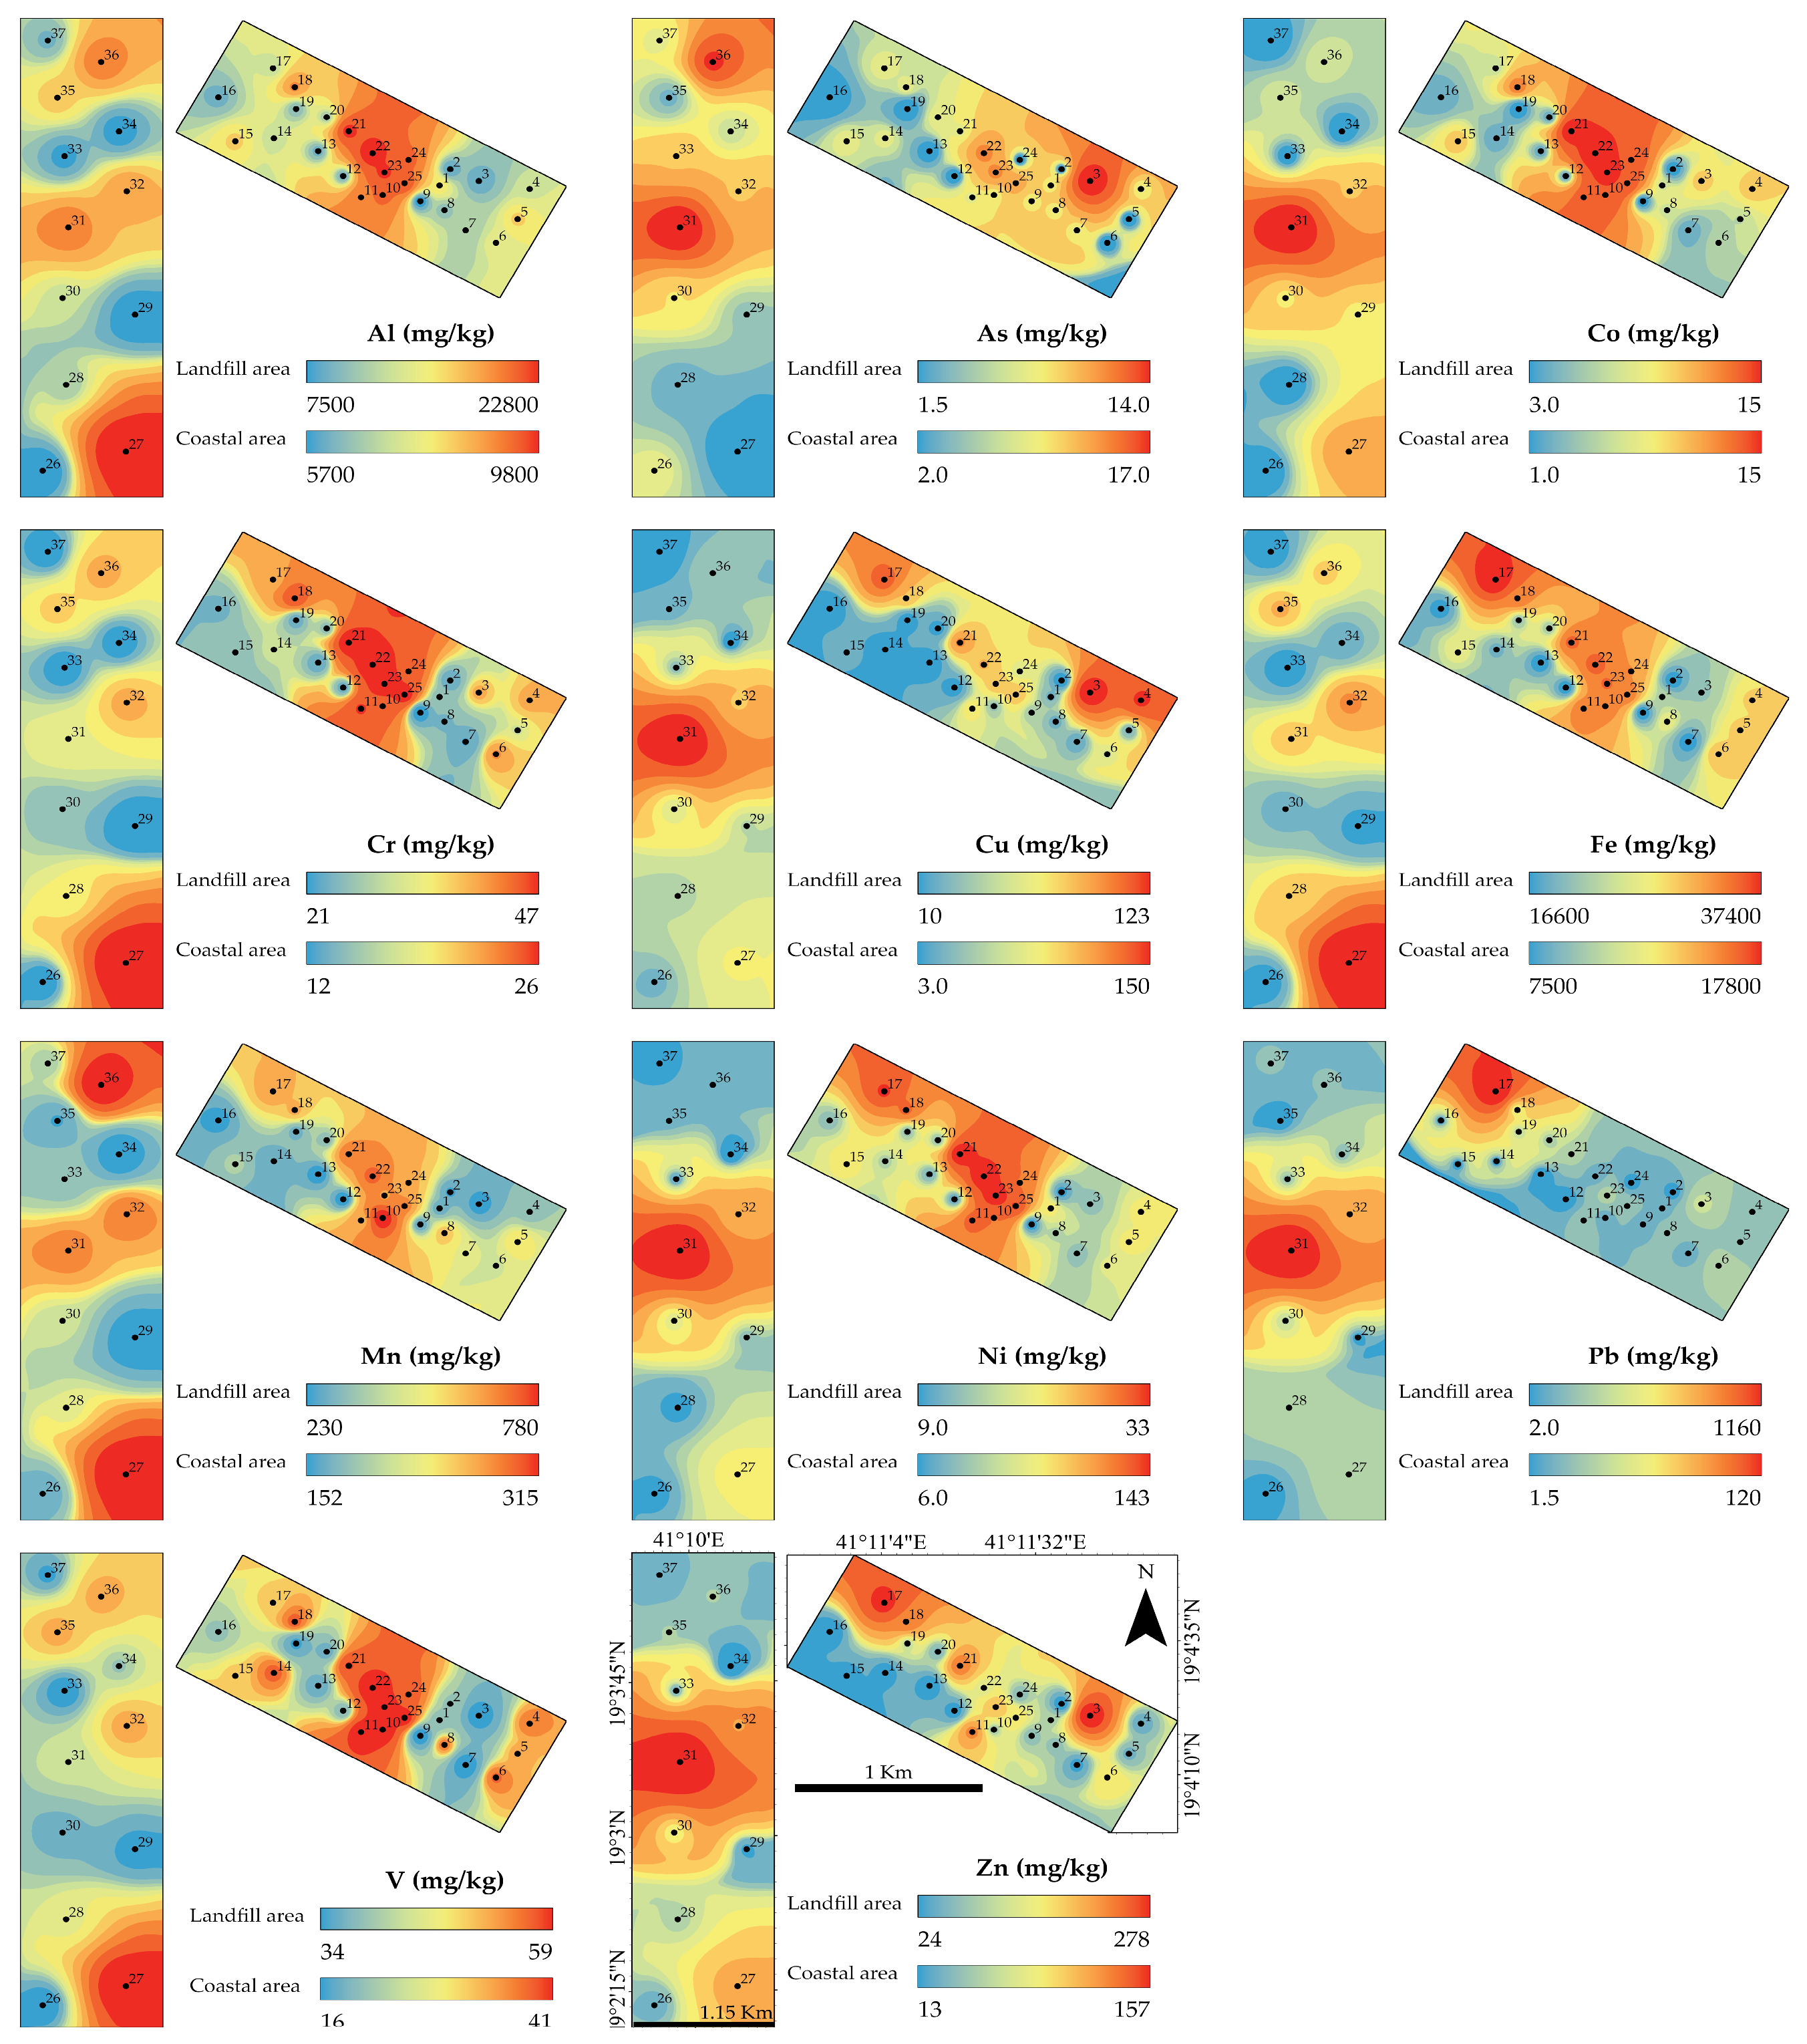
3.2. Concentrations of PTEs in Soils and Sediments

The accumulation of PTEs in marine sediments poses significant risks to benthic organisms, including mollusks, crustaceans, and corals, which play a vital role in maintaining coastal biodiversity. Research indicates that prolonged exposure to PTEs can impair reproductive functions, hinder shell formation, and slow overall growth rates in these species [44]. Additionally, the bioaccumulation of these contaminants in fish and higher trophic-level organisms raises serious concerns for food safety and human health [45]. The analysis of PTE concentrations in landfill soil and coastal sediments reveals considerable variation in pollutant levels across different samples (Table S2). The highest average concentrations were recorded for Fe (18,813 mg/kg) and Al (11,033 mg/kg), followed by Mn (327.26 mg/kg), Zn (65.36 mg/kg), Pb (69.51 mg/kg), V (39.08 mg/kg), Cu (29.92 mg/kg), Ni (22.10 mg/kg), Cr (26.74 mg/kg), Co (5.74 mg/kg), and As (4.47 mg/kg). The spatial distribution of PTEs in the soil and sediment of the Al-Qunfudhah area reveals significant contamination trends, with notable disparities between the landfill zone and adjacent coastal sediments (Figure 3). Certain samples displayed particularly high concentrations, indicating potential contamination hotspots. For instance, sample 31 (coastal sediment) contained the highest levels of Cu (150 mg/kg), Co (15 mg/kg), Ni (143 mg/kg), and As (17 mg/kg), suggesting HM accumulation likely driven by anthropogenic activities.
Additionally, sample 17 (landfill soil) recorded exceptionally high Fe (37,400 mg/kg) and Pb (1160 mg/kg) concentrations, pointing to significant industrial or waste-related contributions. Sample 22 (landfill soil) exhibited elevated levels of V (59 mg/kg), Cr (47 mg/kg), and Ni (33 mg/kg), further underscoring the influence of landfill activities on soil contamination. Conversely, the least contaminated samples were found among coastal sediments, suggesting that natural dilution and dispersion processes help mitigate pollutant concentrations. Notably, Sample 26 contained the lowest levels of Fe (7800 mg/kg), Cr (12 mg/kg), and Pb (1.5 mg/kg). Likewise, Sample 37 recorded the lowest concentrations of Al (6200 mg/kg), Cu (3 mg/kg), and Ni (7 mg/kg), while Sample 34 had the lowest Mn (152 mg/kg) and Zn (13 mg/kg) concentrations.

3.3. Environmental Risks of PTEs

3.3.1. Enrichment Factor

The EF is a widely used geochemical tool for evaluating PTE pollution and distinguishing between natural and anthropogenic sources [46]. It is determined by normalizing the concentration of a PTE against a reference element, typically iron (Fe), and comparing it to background levels. The spatial distribution of EF values in the Al-Qunfudhah landfill area reveals strong anthropogenic influences, particularly within the landfill zone compared to coastal sediments. Pb enrichment ranged from 0.25 to 73.20, with most samples showing minimal enrichment, while a few exhibited significantly higher values (Figure 4). Soil sample 17, with an EF of 73.20, indicates severe contamination, likely due to improper disposal of hazardous waste, battery residues, or industrial emissions [47]. Similarly, sediment sample 31 (EF = 26.47) suggests significant pollution, potentially linked to leaded gasoline residues, waste incineration, or landfill leachate infiltration [48].
The EF values for Zn ranged from 0.71 to 7.29, indicating moderate to significant enrichment. Notably, soil sample 3 (EF = 6.91) and sediment sample 31 (EF = 7.29) suggest contamination sources such as industrial discharge, landfill leachate, and the corrosion of galvanized materials [14]. In contrast, chromium EF values ranged from 0.45 to 0.86 in both soil and sediment, implying its presence is primarily due to natural lithogenic sources, as values below 2 suggest minimal anthropogenic influence [48]. Ni exhibited minimal enrichment in soil (0.38–0.62), while sediment samples showed a broader range (0.46 to 9.28), with Sample 31 (EF = 9.28) reflecting a notable anthropogenic contribution, potentially linked to industrial processes, metal plating, or waste disposal [49]. Similarly, copper EF values varied from 0.37 to 6.45 in soil and 0.37 to 14.70 in sediment, with sample 31 recording the highest contamination (EF = 14.70), likely due to electronic waste, plumbing materials, or landfill leachate. Arsenic EF values ranged between 0.19 and 5.77, with sediment samples 31 (EF = 5.77) and 36 (EF = 5.14) exhibiting the highest levels, suggesting localized contamination from industrial effluents [50]. Manganese EF values fell between 0.66 and 1.65, indicating no significant enrichment and suggesting a predominantly lithogenic origin. Cobalt EF values ranged from 0.23 to 3.48, with moderate enrichment observed in sediment sample 31 (EF = 3.48), potentially due to contamination from metal industry waste and landfill leachate [14,51]. Finally, vanadium EF values were between 0.46 and 0.99, indicating no significant enrichment and confirming its primarily natural geochemical background.

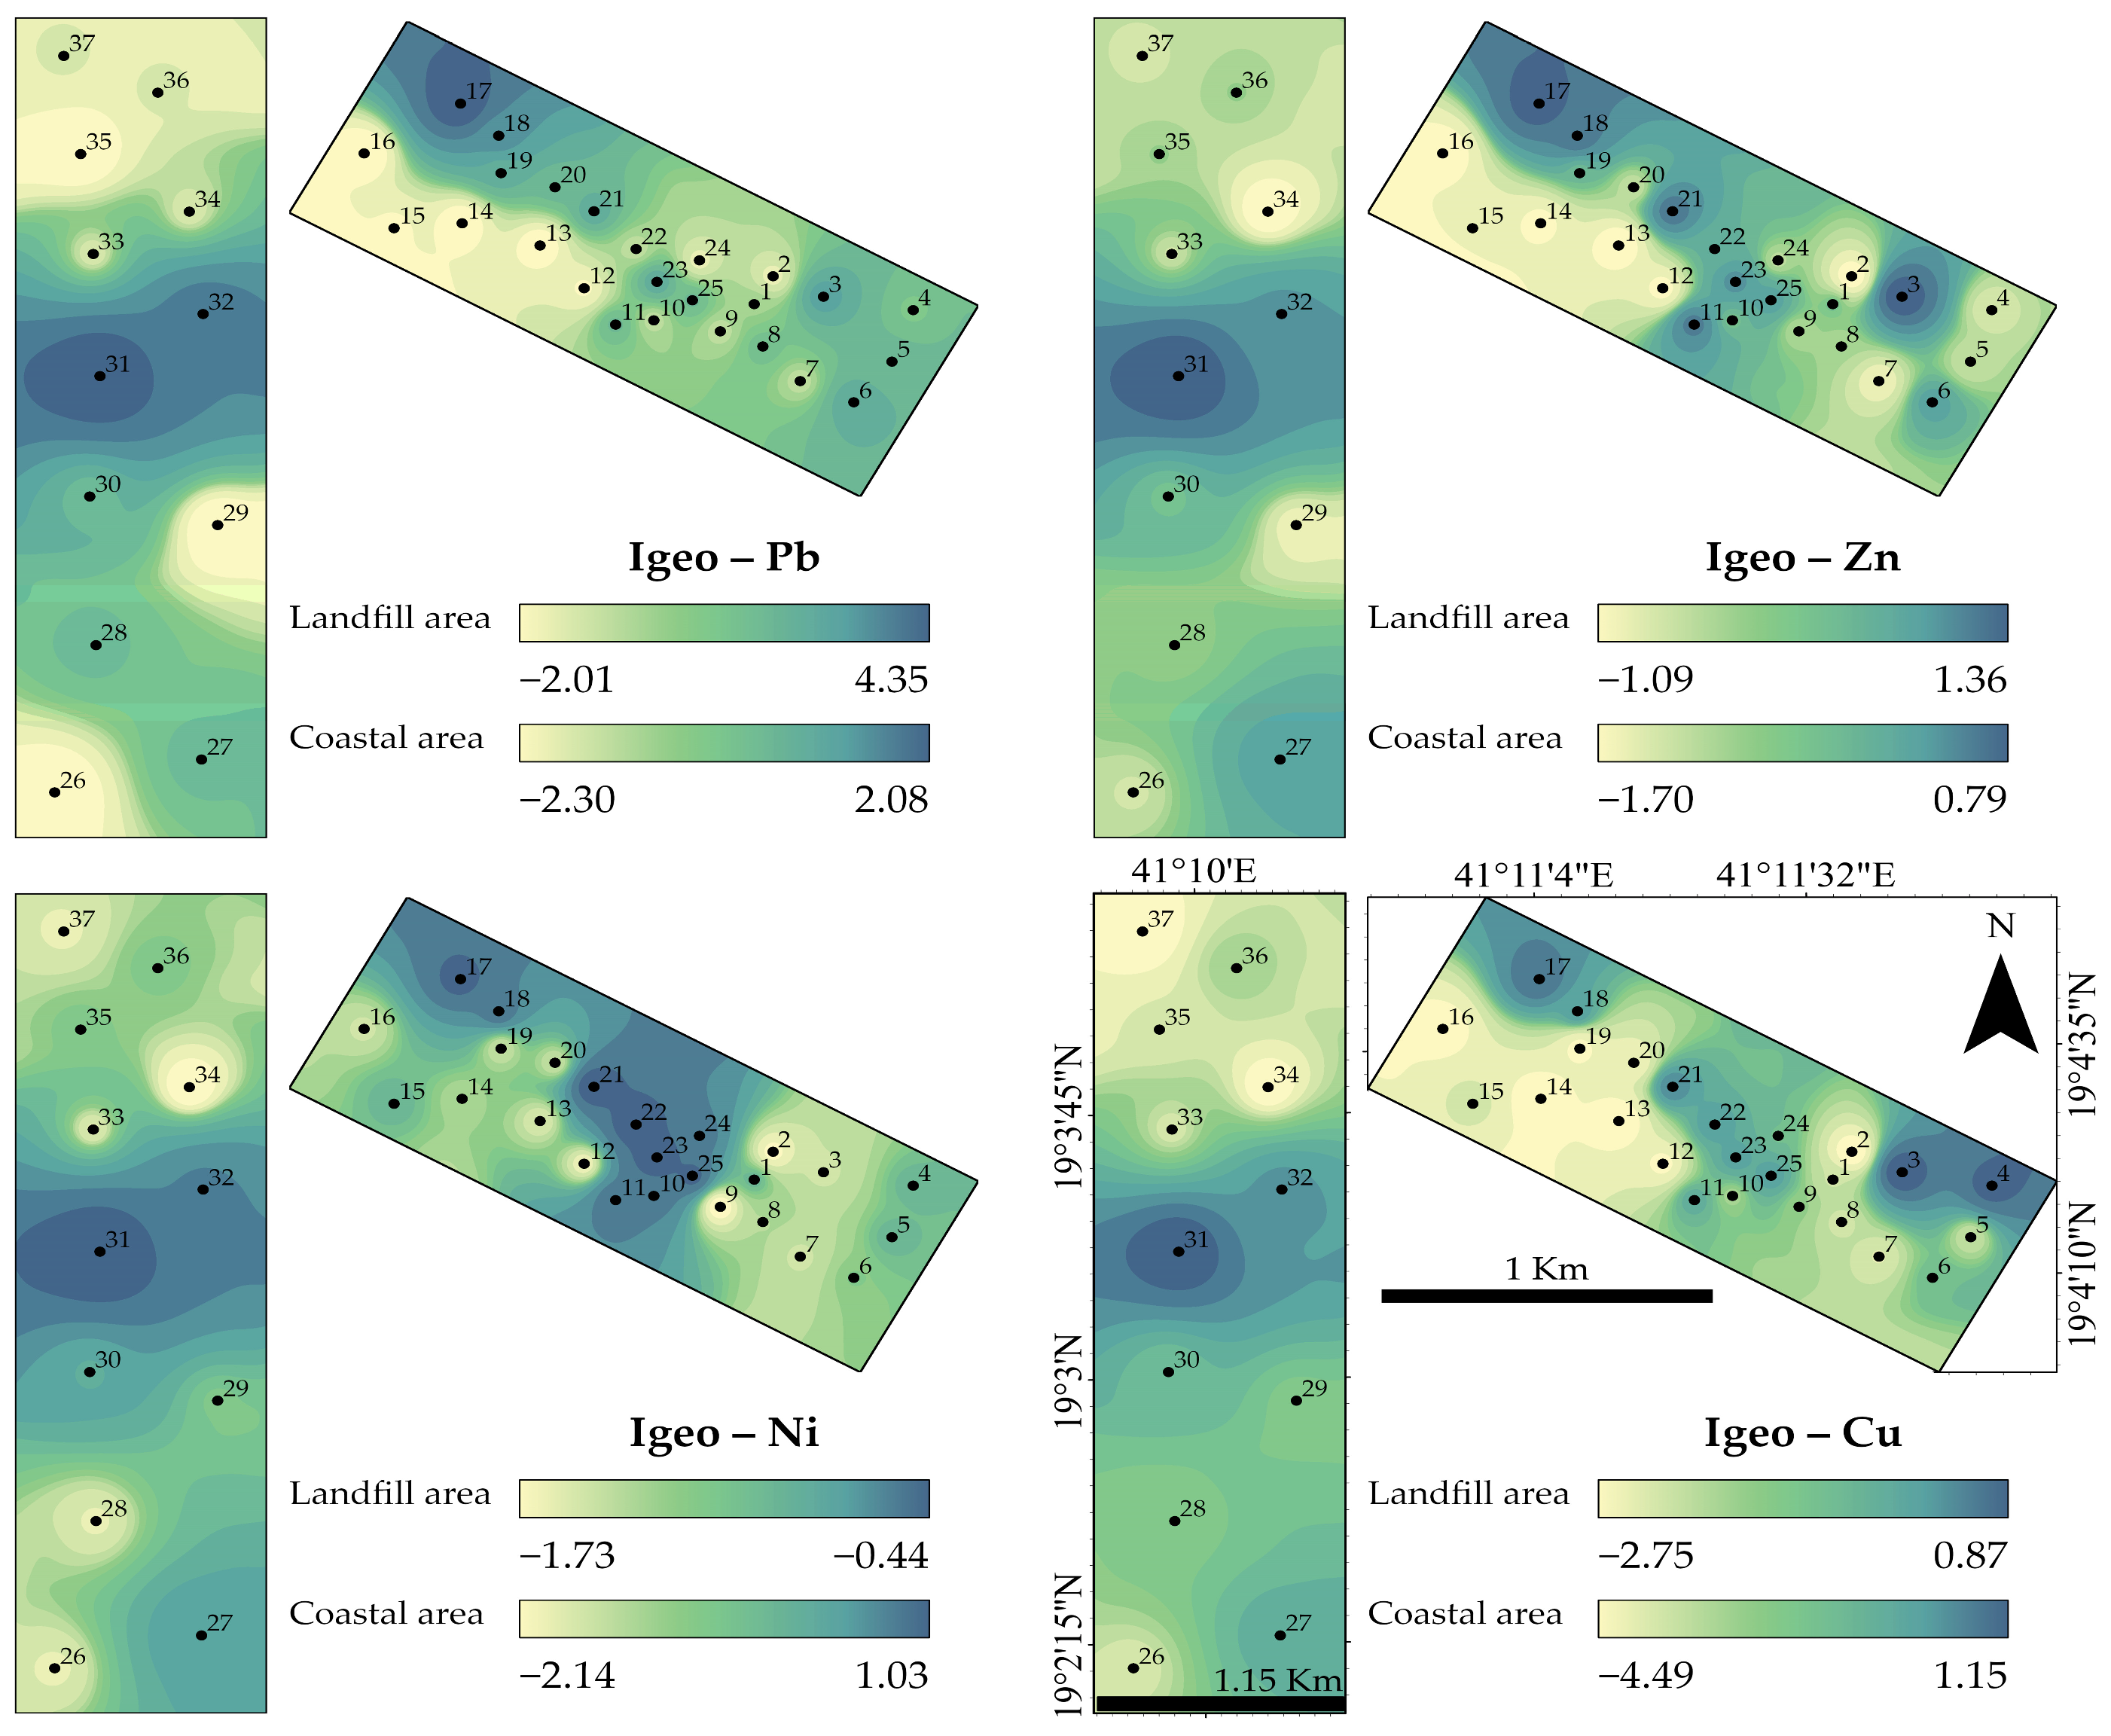
3.3.2. Geoaccumulation Index

The Igeo is a widely used metric for assessing heavy metal contamination in environmental samples, particularly soils and sediments. In the Al-Qunfudhah landfill area, the spatial distribution of Igeo values highlights varying contamination levels, with certain metals exhibiting notable localized enrichment (Figure 5). Most soil samples display negative Igeo values, suggesting minimal contamination and concentrations within natural background levels. However, Zn shows moderate contamination in Sample S3 (Igeo = 1.36), likely attributed to anthropogenic sources such as industrial discharge or waste disposal. Pb, in particular, exhibits significant contamination, with Sample 17 recording an Igeo of 4.35, classifying it as heavily to extremely contaminated. This suggests a localized source of pollution, possibly from lead-acid batteries or industrial waste [51]. In contrast, sediment samples indicate higher contamination levels, particularly for Cu, Pb, and Ni. Copper contamination is evident in Sample S31 (Igeo = 1.15), possibly linked to electronic waste or agricultural runoff [52]. Likewise, lead in Sample S31 reached an Igeo of 2.08, indicating moderate to heavy pollution, likely resulting from industrial emissions or landfill leachate infiltration. Additionally, nickel contamination in S31 (Igeo = 1.03) suggests inputs from industrial discharge or the weathering of nickel-bearing rocks. Meanwhile, elements such as V, Co, and Mn largely maintained negative Igeo values, indicating that their presence is predominantly due to natural geological processes rather than anthropogenic activities. A comparison between soil and sediment samples reveals that sediments exhibited higher contamination levels, indicating the transport of PTEs from landfill leachate or surface runoff into depositional environments. This pattern aligns with previous research suggesting that landfill leachate is a major contributor to PTEs pollution in nearby ecosystems.

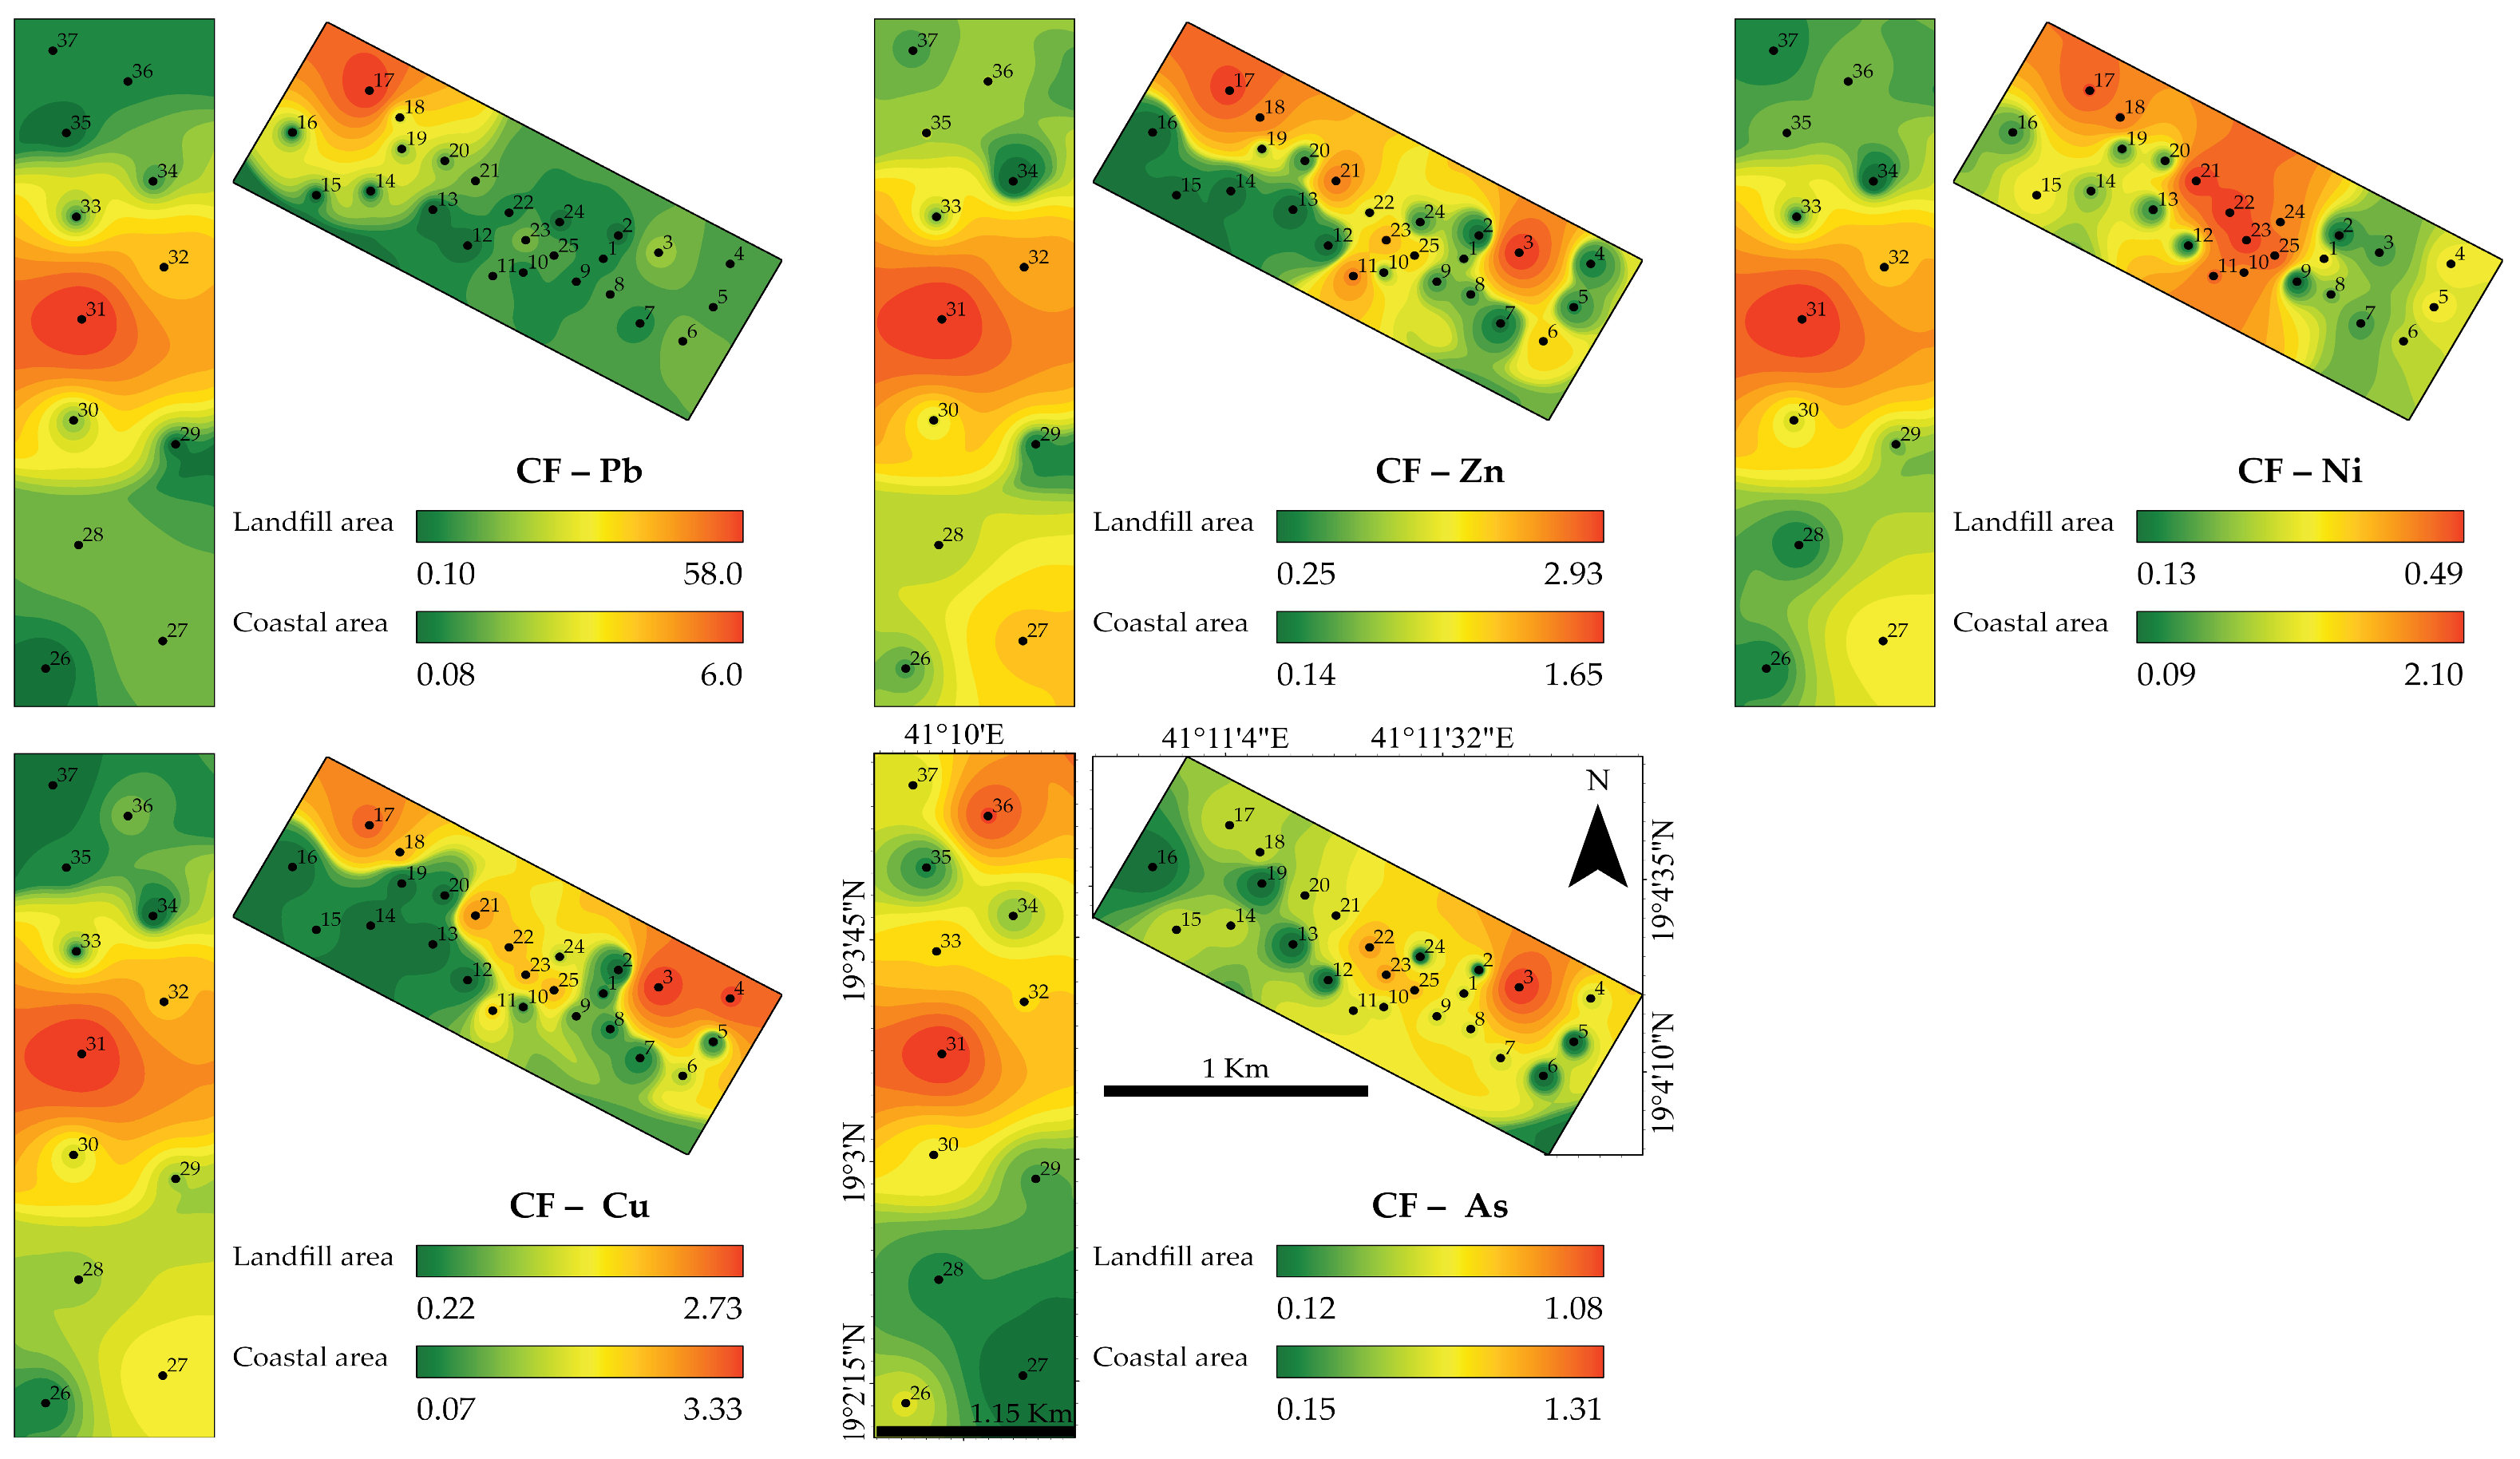
3.3.3. Contamination Factor

The CF is a widely applied index for evaluating HM contamination levels in environmental samples. Analysis of CF values in soil and sediment samples from the Al-Qunfudhah landfill area reveals significant variations in contamination, with certain metals exhibiting localized pollution hotspots (Figure 6). Among soil samples, Pb showed the highest contamination, particularly in Sample S17, where the CF reached an alarming 58.00, indicating extreme pollution. Such elevated Pb levels are often linked to anthropogenic sources such as battery waste, industrial emissions, and electronic waste [14]. Additional Pb contamination was evident in Sample S31 (CF = 6.00), suggesting considerable pollution in specific locations. Zinc contamination was also notable, with Sample S3 recording the highest CF (2.93), indicating moderate contamination, potentially originating from galvanized materials, rubber tire wear, or agricultural runoff [53]. Copper contamination was particularly pronounced in Sample S31 (CF = 3.33), which may be attributed to its extensive use in electrical components, plumbing materials, and pesticides [54].
Sediment samples generally exhibited higher contamination factors (CF) for specific PTEs compared to soil, indicating greater metal accumulation in depositional environments. Ni showed a maximum CF of 2.10 in Sample S31, signifying moderate contamination likely originating from industrial discharge or the natural weathering of ultramafic rocks [55]. As also presented elevated contamination in S31 (CF = 1.31), raising environmental concerns due to its high toxicity even at low concentrations, with industrial waste being a common source [56]. Manganese (Mn) displayed moderate contamination in certain sediment samples, peaking at CF = 0.92 in S10, suggesting contributions from both geological sources and industrial activities. A comparison of soil and sediment contamination reveals that sediments tend to accumulate higher levels of PTEs, as evidenced by elevated CF values for Pb, Cu, and Ni. This pattern aligns with previous studies, highlighting the role of landfill leachate and surface runoff in transporting and depositing contaminants in sedimentary environments [18].

3.3.4. Risk Index

The risk index (RI) for PTEs in soil and sediment samples from the Al-Qunfudhah landfill revealed considerable variations, pointing to localized contamination hotspots. RI values, which evaluate the cumulative ecological risk of multiple metals, ranged from 5.32 to 305.47, with an average of 27.34. While most samples indicated low to moderate risk, certain areas exhibited extreme contamination, necessitating immediate environmental action. Soil samples showed particularly high Pb contamination, with S17 recording the highest RI (305.47), indicating a severe pollution hotspot likely linked to battery waste, industrial emissions, and e-waste disposal [14]. The second-highest RI was observed in S3 (35.39), largely influenced by elevated Cu (13.67) and As (10.77), both of which pose significant environmental and health hazards. Copper contamination in this sample is attributed to industrial and agricultural activities, such as pesticide applications, plumbing materials, and electronic waste [54]. Other soil samples, including S21 (16.74), S22 (14.58), and S23 (17.04), exhibited moderate to high RI values, primarily due to Cu, Ni, and As contamination. Nickel presence in these samples suggests possible sources such as industrial discharge, natural rock weathering, and metal plating processes [55]. In contrast, Zn and Cr presented relatively low risk across soil samples, with Zn reaching a peak RI of 2.93 in S3, likely stemming from vehicle emissions and tire wear [53].
Sediment samples generally exhibited lower RI values compared to soil, with the exception of S31, which recorded a high RI of 74.97. This elevated risk was primarily driven by high Pb (30.00), Cu (16.67), and As (13.08), underscoring the tendency of sediments to accumulate and concentrate PTEs over time [57]. The buildup of these contaminants increases their bioavailability and potential toxicity in aquatic ecosystems, posing significant threats to benthic organisms and the broader food web [8]. Moderate ecological risk was also noted in S32 (17.50) and S36 (14.17), where arsenic remains a key concern. Meanwhile, cobalt (Co) and vanadium (V) exhibited relatively low ecological risk across all samples, with their highest RI values recorded in S31 (0.33) and S22 (0.91), respectively. When comparing soil and sediment contamination, soil samples exhibited greater variability in risk, with extreme hotspots like S17 significantly influencing the dataset. In contrast, sediments displayed a more uniform contamination distribution, indicating that PTEs are being mobilized and deposited in downstream environments through leachate migration and surface runoff [8].

3.3.5. Soil and Sediment Quality Guidelines (SQGs)

In order to assess the potential ecological and human health risks posed by the presence of potentially toxic elements (PTEs), this study compared measured concentrations in both coastal sediments and landfill soils to internationally recognized guidelines. Importantly, sediment and soil matrices were evaluated separately, using reference values specific to each medium.
Sediment Assessment
For sediment samples, we applied the Sediment Quality Guidelines (SQGs) developed by [58], which define Effects Range-Low (ERL) and Effects Range-Median (ERM) thresholds to assess ecological risk in marine environments. As shown in Table 1, most PTEs, including Cr, As, and Zn occurred at levels well below their ERL values in over 90% of samples, suggesting minimal ecological risk. Cu and Ni presented moderate concern: 24.33% and 27.03% of samples, respectively, which exceeded their ERL thresholds (34 mg/kg for Cu and 20.9 mg/kg for Ni), although none surpassed the ERM values, indicating localized rather than widespread contamination. Pb was the most critical contaminant, exceeding the ERL in 41.67% of sediment samples and surpassing the ERM threshold (218 mg/kg) in one case, with Sample S17 recording an extremely high concentration of 1160 mg/kg. This is of particular concern due to Pb’s persistence and bioaccumulative properties, which pose long-term threats to marine biota and ecosystems [59].
Soil Assessment
For landfill soil samples, we referred to USEPA soil screening levels (SSLs) for residential land use, which provide thresholds above which remediation or further risk assessment may be required. As shown in Table 2, most PTEs in soils were within safe limits; however, several elements raised concern. Arsenic significantly exceeded the USEPA residential SSL of 0.39 mg/kg in nearly all samples, with a mean concentration of 4.47 mg/kg. Ni exceeded its SSL of 30 mg/kg in 27.03% of samples. Pb exceeded the residential threshold (400 mg/kg) in at least one case again. Sample S17, matching the sediment findings, showed a Pb level of 1160 mg/kg. In contrast, Cr, Zn, and Cu were all below their respective residential SSLs in nearly all samples.

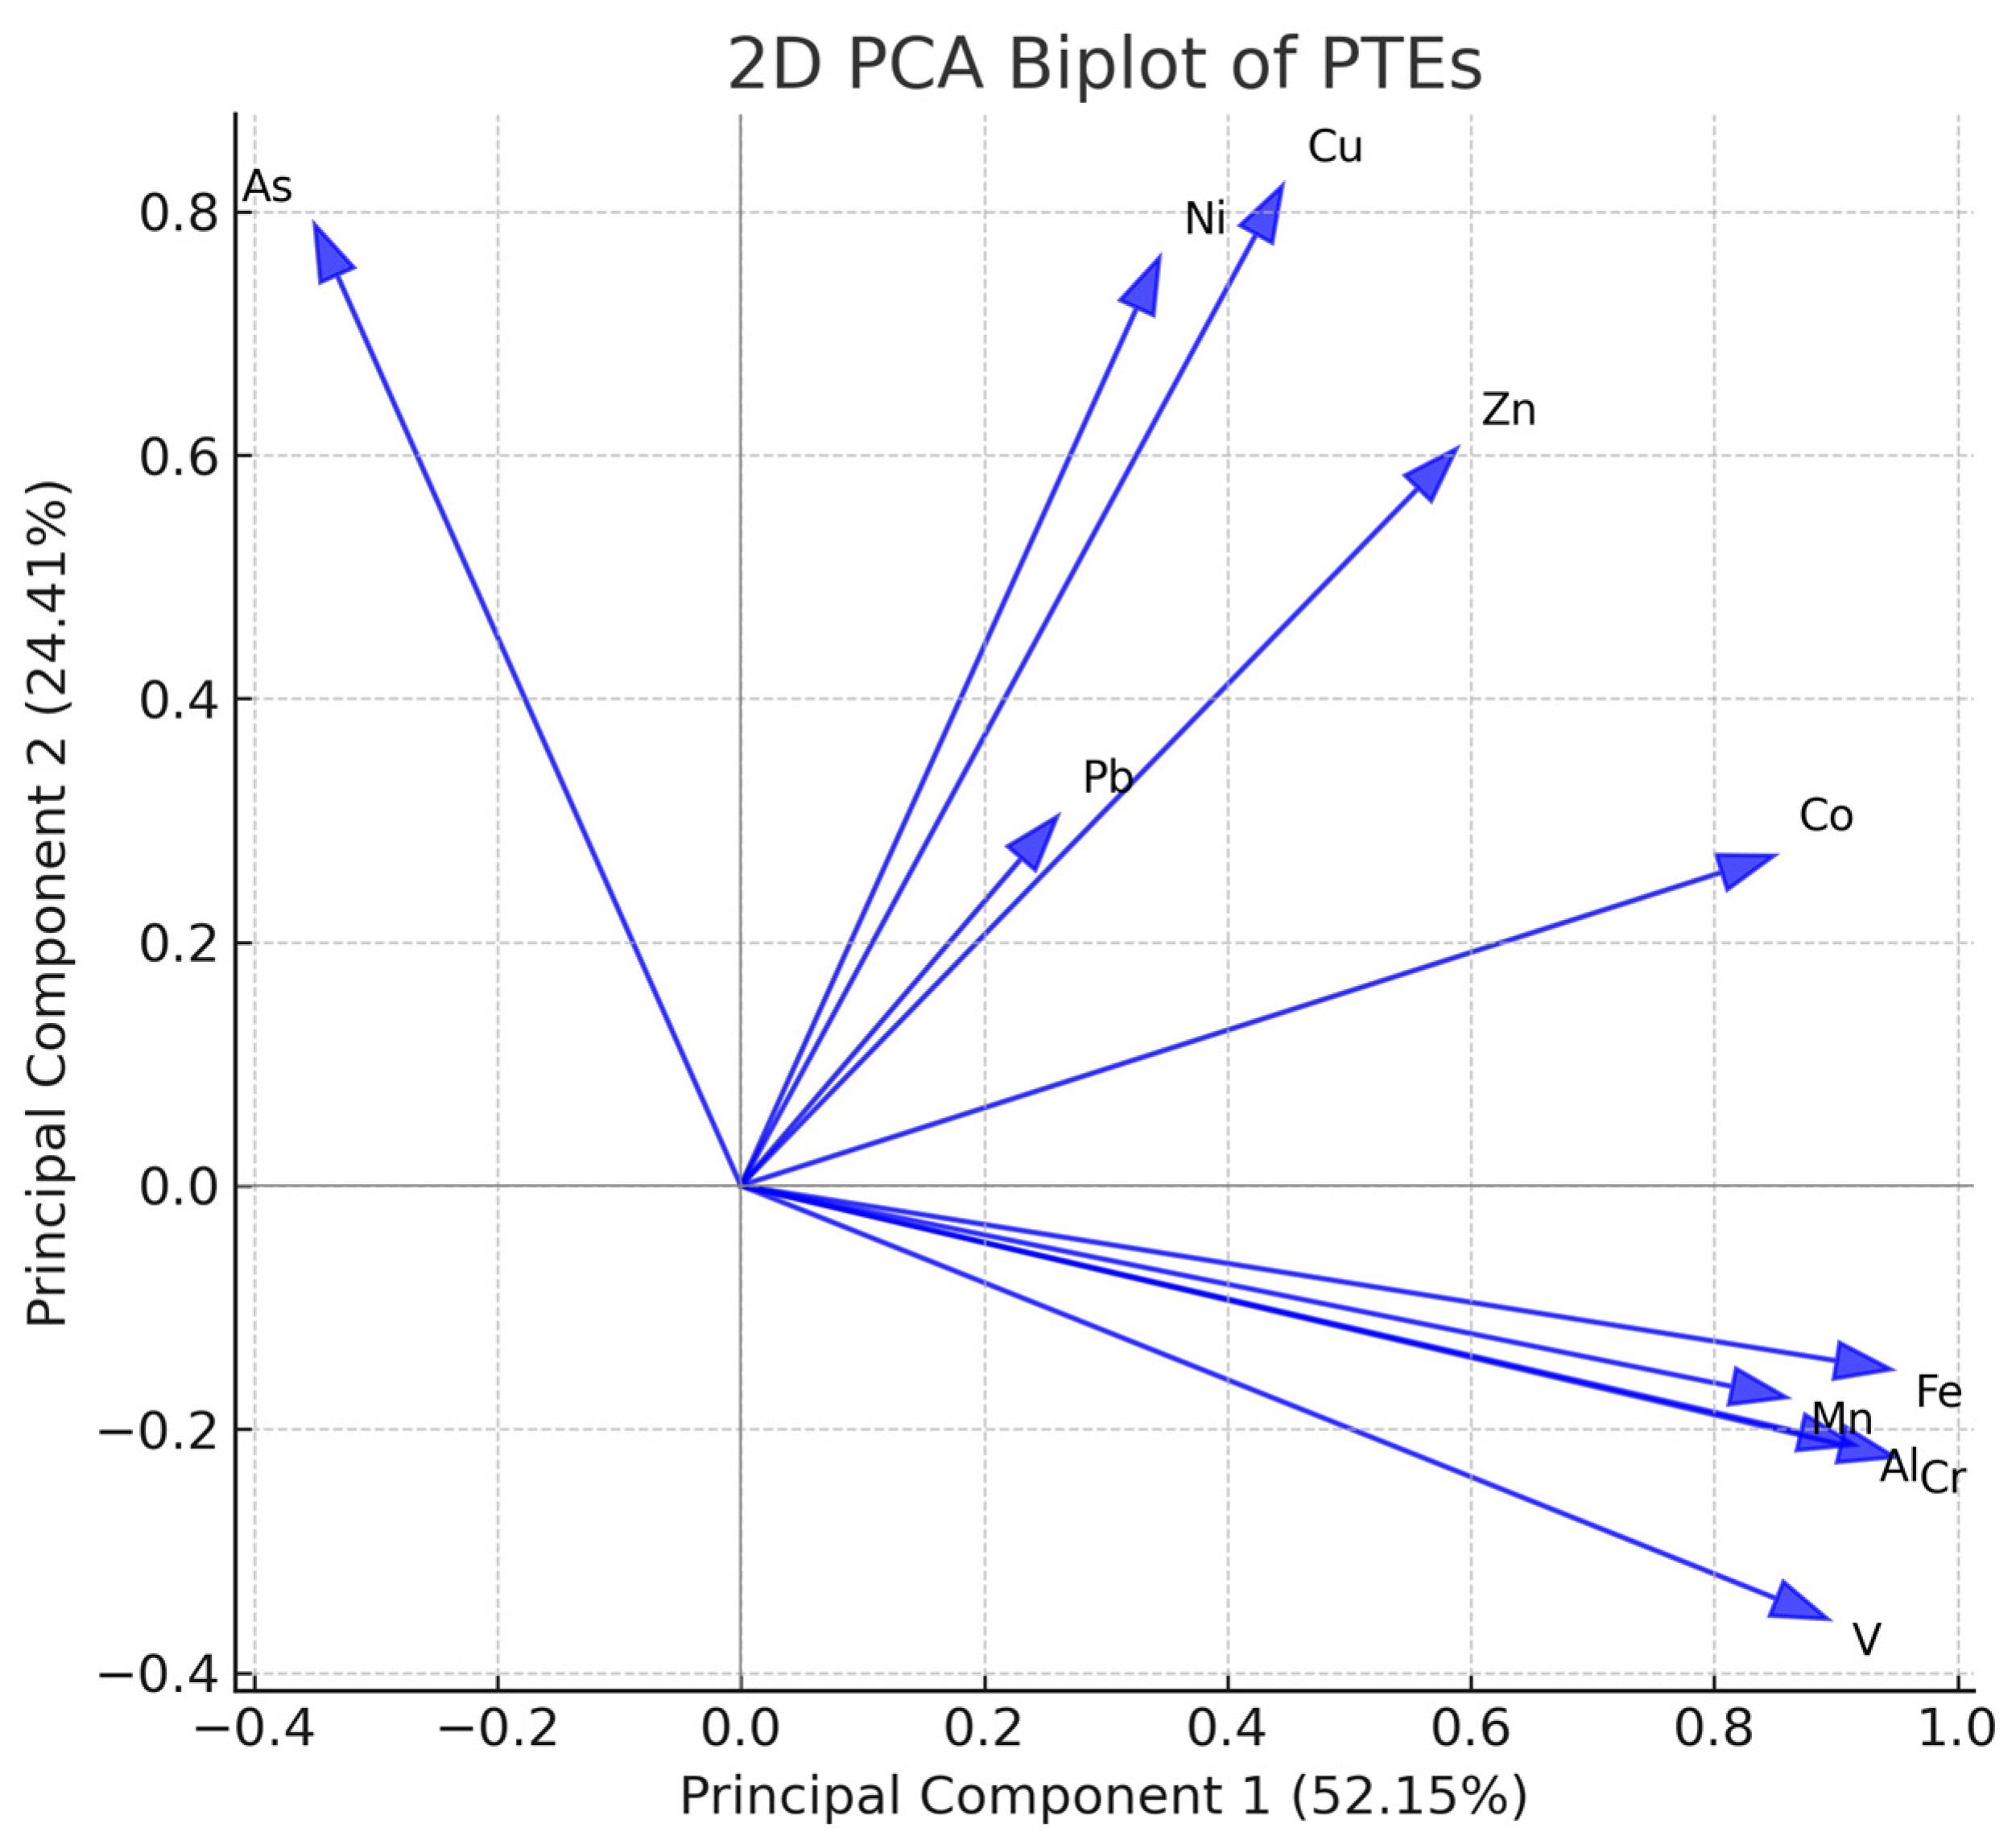
3.4. Potential Sources of PTEs

The correlation matrix of PTEs from the Al-Qunfudhah landfill soil and sediment samples provides insights into potential contamination sources and geochemical interactions (Table 3). Strong positive correlations suggest common sources, whereas negative correlations indicate different geochemical behaviors or pollution pathways [1]. Among the strongest correlations, Al showed a high positive correlation with Cr (r = 0.936, p < 0.01), V (r = 0.847, p < 0.01), and Fe (r = 0.825, p < 0.01). Moreover, strong correlation was observed between Fe-Cr (r = 0.921, p < 0.01), Fe-V (r = 0.909, p < 0.01), and Fe-Mn (r = 0.802, p < 0.01). On the other hand, the strong correlations between Cu and Zn (r = 0.794, p < 0.01) and Pb and Zn (r = 0.517, p < 0.01) indicate an anthropogenic influence. These metals are widely recognized as industrial pollutants, often linked to sources such as metal scrap, batteries, vehicle emissions, and waste disposal [35]. The presence of Cu–Zn and Pb–Zn correlations suggests contamination from landfill leachates and industrial waste, which may pose significant environmental risks, including bioaccumulation in marine organisms and potential groundwater pollution [60]. Arsenic presents an interesting case, as it showed negative correlations with Fe (r = −0.511, p < 0.01), Cr (r = −0.470, p < 0.01), and V (r = −0.610, p < 0.01). This suggests that As originates from different sources compared to these metals, possibly from human-induced factors rather than natural weathering. Arsenic contamination is of particular concern due to its toxicity and potential for groundwater infiltration, which can lead to serious health risks [61]. The correlation patterns observed in the Al-Qunfudhah landfill indicate a complex interplay between natural and human-induced factors. Metals such as Fe, Cr, and Mn appear to be primarily derived from natural geochemical processes, whereas Cu, Zn, and Pb exhibit strong anthropogenic signals. The weak correlation between Ni and V (r = 0.045) further highlights that different contamination pathways may be influencing metal distribution.
Two important statistical tests for assessing whether factor analysis is suitable for a particular dataset are Bartlett’s Test of Sphericity and the Kaiser–Meyer–Olkin (KMO) measure of sampling adequacy (Table 4). These tests help assess the suitability of using dimensionality reduction techniques to analyze correlations between PTEs from soil and sediment samples at the Al-Qunfudhah landfill. A moderate degree of sample adequacy is indicated by the KMO value of 0.644 [62]. A highly significant chi-square value (χ2 = 628.227, df = 55, p < 0.001) was obtained using Bartlett’s Test of Sphericity, suggesting that there are strong correlations between the variables and that the correlation matrix is not an identity matrix. This result confirms that factor analysis is suitable for the dataset, as the null hypothesis stating that the PTEs are uncorrelated can be rejected with high confidence [8]. The presence of significant correlations suggests that the PTEs may originate from common sources, either natural or anthropogenic, and could be grouped into factors representing different pollution pathways [62].
In environmental studies, factor analysis is often used to identify pollution sources, distinguishing between lithogenic (natural) and anthropogenic (human-induced) contributions [46]. Principal component analysis (PCA) is a widely used statistical technique for identifying patterns in complex datasets, particularly in environmental pollution studies. The component matrix presents the factor loadings for each PTE across three extracted components, explaining a total variance of 88.27% (Figure 7, Table S6). This means that these three components effectively capture the majority of the information in the dataset, making PCA a suitable approach for analyzing pollution sources. The PC1 explained 52.15% of the total variance, with strong positive loadings for Al (0.915), Cr (0.948), Fe (0.945), Mn (0.859), Co (0.849), and V (0.893). The PC2 accounted for 24.41% of the total variance and was characterized by high positive loadings for As (0.789), Cu (0.821), Ni (0.762), and Zn (0.605). The PC3 explained 11.71% of the total variance and primarily loaded positively on Pb (0.839) and Zn (0.363).

4. Discussion

The spatial distribution patterns highlight a contaminant gradient, with the highest concentrations occurring in proximity to the landfill and progressively decreasing toward the coastal sediments, emphasizing the role of leachate migration and hydrodynamic processes in metal dispersion [35,63]. The elevated concentrations of Pb, Zn, and Cu point to anthropogenic sources such as electronic waste disposal, metal corrosion, and industrial runoff [64,65]. Notably, Sample 17 recorded an exceptionally high Pb concentration (1160 mg/kg), far exceeding globally accepted safety thresholds [66]. Cr concentrations varied significantly across samples, with some exceeding 30 mg/kg, which could be attributed to industrial waste [67]. Additionally, elevated As levels detected in several samples raise serious environmental and public health concerns due to their high toxicity and long-term persistence in soil and water systems [68]. Mn and Ni concentrations are notably high, likely due to their mobility and accumulation from surface runoff [69]. Additionally, As and Pb levels exceed baseline concentrations typically found in unpolluted marine environments, suggesting that landfill leachate is contributing to marine contamination [70]. A particularly notable observation was the elevated Zn concentration in Sample 31, which may be linked to industrial coatings, tire wear particles, or urban runoff [71]. The high bioavailability of Zn in sediments poses potential risks to marine invertebrates and fish, potentially leading to long-term disruptions in the marine ecosystem [47,72].
The use of contamination indices helped confirm pollutant origins and risks. Enrichment factor (EF) values were highest for Pb and Cu, with Sample S17 showing a Pb EF of 73.20, indicating severe contamination. Sample S31 also showed elevated EF values for Cu (14.70), As (5.77), and Ni (9.28), confirming it as a sedimentary hotspot influenced by landfill runoff. These results strongly suggest anthropogenic pollution pathways from landfill activities. The dispersal of these pollutants toward coastal sediments appears to be influenced by tidal movements and groundwater percolation [73]. This enrichment pattern highlights the progressive mobilization of contaminants from landfill leachates into the marine environment, raising concerns about potential ecological risks [74]. Geo-accumulation index (Igeo) analysis revealed that Pb, Cu, and Ni displayed moderate to extreme contamination levels in select samples, particularly S17 and S31. This aligns with industrial and landfill-related waste inputs, posing risks to both marine life and human health [66,67,68]. Similarly, contamination factor (CF) values revealed extreme Pb contamination in S17 (CF = 58.00), as well as elevated Cu and Ni levels in sediment samples. The mobility of these metals poses significant risks to aquatic ecosystems, as they can bioaccumulate in benthic assemblages and enter the food chain, leading to adverse ecological and health effects [49,60,75]. The risk index (RI) provided a cumulative ecological risk assessment, with S17 again ranking highest (RI = 305.47), followed by S31 (RI = 74.97), suggesting contamination from landfill leachate [76]. In soil, Pb concentrations in Sample S17 far exceeded the EPA’s residential screening level of 400 mg/kg, indicating a significant public health hazard. In sediment, Cu and Ni exceeded ERLs in 24.33% and 27.03% of samples, respectively, and Pb surpassed the ERM threshold in one case, further supporting the presence of ecotoxicological risks, impacting benthic organisms, bioaccumulation in the food chain, and overall sediment quality [59,77].
The strong correlation between many elemental pairs, such as Al–Cr, Al–V, Al–Fe, Fe–Cr, Fe–V, and Fe–Mn, suggesting that their presence in the sediments is primarily due to natural weathering of parent rock materials [8]. These metals are commonly associated with lateritic soil formations and iron-rich minerals, reinforcing the idea of natural geochemical processes influencing their concentrations [18]. PC1 explained 52.15% of the variance and grouped elements such as Fe, Al, Cr, Mn, Co, and V. These PTEs are commonly associated with the Earth’s crust and natural geological formations [46]. High correlations among these elements suggest that they originate from lithogenic sources, such as weathering of parent rocks or sediment deposition from surrounding areas [60]. Similar findings in other coastal pollution studies indicate that Fe, Al, and Mn are primarily derived from soil erosion and sediment transport rather than anthropogenic inputs [78]. The presence of chromium (Cr) in this group may also indicate natural inputs from local rock formations, although anthropogenic contributions (e.g., industrial waste) cannot be ruled out entirely. PC2 (24.41%) comprised As, Cu, Ni, and Zn. These metals are typically linked to anthropogenic activities, including industrial emissions, landfill leachate, and urban runoff [8,61]. The strong association of Cu and Ni with this component suggests contamination from electronic waste, corrosion of metal structures, and industrial discharge [1]. The presence of Zn in this component aligns with its common usage in galvanization, batteries, and automobile industries, indicating pollution from nearby urban and industrial activities [14]. PC3 (11.71%) was dominated by Pb and Zn, reflecting a mixed pollution source, likely tied to localized landfill-related activities. The presence of potentially toxic metals (As, Cu, Ni, Pb, and Zn) in anthropogenic components suggests that landfill leachate and waste mismanagement contribute significantly to environmental contamination. This aligns with studies that have identified improper landfill disposal as a key driver of coastal soil and sediment pollution [48,79,80]. The association of Pb with PC3 highlights contamination from vehicular emissions, lead-based paints, and battery disposal, which are common pollution sources in landfill sites [50,81,82].

5. Conclusions

The findings of this study reveal significant PTE contamination in both landfill soil and adjacent coastal sediments, highlighting the critical environmental impact of landfill leachates in Al-Qunfudhah, Saudi Arabia. Elevated concentrations of Pb, Cu, As, and Ni were particularly evident in soil samples collected from the areas of recent landfill expansion (e.g., Samples S17 and S22), suggesting that the increase in landfill area after 2021 likely contributed to intensified surface pollution. Furthermore, sediment sample S31 identified as a contamination hotspot, lies within the predicted drainage pathway from the newer landfill zones, indicating the potential role of surface runoff in transporting contaminants from recently expanded waste deposits. The EF and Igeo indices indicate that anthropogenic activities, including industrial discharge, improper waste disposal, and urban runoff, are major contributors to contamination. The CF values confirm substantial pollution, particularly for Pb, necessitating immediate remediation strategies. Additionally, comparisons with SQGs suggest that certain metals exceed safe ecological limits, potentially affecting marine biota. As the first study to assess the direct impact of landfill leachates on coastal sediments in this region, the results provide a critical foundation for future environmental monitoring and policy interventions to mitigate PTE pollution along the Red Sea coast.

Supplementary Materials

The following supporting information can be downloaded at https://www.mdpi.com/article/10.3390/min15080802/s1. Table S1: Contamination indices for PTEs examined in Al-Qunfudhah soil and sediment. Table S2: Concentration of PTEs (mg/kg) in Al-Qunfudhah soil and sediment. Table S3: Results of EF in Al-Qunfudhah soil and sediment. Table S4: Results of CF in Al-Qunfudhah soil and sediment. Table S5: Results of Igeo in Al-Qunfudhah soil and sediment. Table S6: Principal component loadings and the three extracted PCs with varimax normalized rotation.

Author Contributions

Conceptualization, T.A., A.S.E.-S. and H.M.A.; methodology, T.A. and H.M.A.; software, T.A. and N.R.; validation, H.M.A. and N.R.; writing—original draft preparation, T.A., A.S.E.-S., N.R. and H.M.A.; writing—review and editing, T.A., A.S.E.-S., N.R. and H.M.A.; project administration, T.A.; funding acquisition, T.A. All authors have read and agreed to the published version of the manuscript.

Funding

This research was funded by Ongoing Research Funding program (ORF-2025-791), King Saud University, Riyadh, Saudi Arabia.

Data Availability Statement

The data are contained within the article.

Acknowledgments

The authors extend their appreciation to Ongoing Research Funding program (ORF-2025-791), King Saud University, Riyadh, Saudi Arabia.

Conflicts of Interest

The authors declare no conflicts of interest.

References

  1. Alharbi, T.; El-Sorogy, A.S.; Rikan, N.; Salem, Y. Geographic Information System and Contamination Indices for Environmental Risk Assessment of Landfill Disposal Sites in Central Saudi Arabia. Sustainability 2024, 16, 9822. [Google Scholar] [CrossRef]
  2. Al-Odaini, N.A.; Zakaria, M.P.; Abas, M.R.; Hamzah, M.S.; Juahir, H. Surface runoff and riverine transport of microplastics: A review of current understanding and future research directions. Mar. Pollut. Bull. 2020, 158, 111398. [Google Scholar] [CrossRef]
  3. Raphela, T.; Manqele, N.; Erasmus, M. The impact of improper waste disposal on human health and the environment: A case of Umgungundlovu District in KwaZulu Natal Province, South Africa. Front. Sustain. 2024, 5, 1386047. [Google Scholar] [CrossRef]
  4. Peng, Y.; Chen, C.; Li, Y.; Zhou, Q.; Zhang, Y. Pollution characteristics and risk assessment of heavy metals in leachate from landfill sites: A global perspective. J. Environ. Manag. 2021, 281, 111842. [Google Scholar] [CrossRef]
  5. Hernández-Terrones, L.M.; Null, K.A.; Ortega-Camacho, D.; Paytan, A. Water quality assessment in the Mexican Caribbean: Impacts on coral reefs. Mar. Pollut. Bull. 2015, 101, 112–121. [Google Scholar] [CrossRef]
  6. El Zokm, G.M.; Okbah, M.A.; Younis, A.M.; Khairy, H.M. Ecological and health risk assessment of heavy metals accumulation in coastal marine organisms from the southeastern Mediterranean Sea, Egypt. Mar. Pollut. Bull. 2023, 186, 114404. [Google Scholar] [CrossRef]
  7. Huang, Y.; Li, Y.; Liu, Q.; Zeng, G.; Xiao, R. Influence of heavy metals on coral reefs and marine organisms: A review. Mar. Pollut. Bull. 2021, 167, 112343. [Google Scholar] [CrossRef]
  8. Alam, M.; Rohani, M.d.F.; Hossain, M.d.S. Heavy metals accumulation in some important fish species cultured in commercial fish farm of Natore, Bangladesh and possible health risk evaluation. Emerg. Contam. 2023, 9, 100254. [Google Scholar] [CrossRef]
  9. Nur-E-Alam, M.; Salam, M.A.; Dewanjee, S.; Hasan, M.F.; Rahman, H.; Rak, A.E.; Islam, A.R.M.T.; Miah, M.Y. Distribution, Concentration, and Ecological Risk Assessment of Trace Metals in Surface Sediment of a Tropical Bangladeshi Urban River. Sustainability 2022, 14, 5033. [Google Scholar] [CrossRef]
  10. Wu, H.; Xu, W.; He, Y.; Xu, Y. Effects of heavy metal pollution on aquatic animal health: A comprehensive review. Aquat. Toxicol. 2021, 234, 105813. [Google Scholar] [CrossRef]
  11. Barletta, M.; Lima, A.R.A.; Costa, M.F. Distribution, sources, and consequences of contaminants in estuaries and coasts: A review from the South American perspective. Sci. Total Environ. 2019, 651, 1199–1218. [Google Scholar] [CrossRef] [PubMed]
  12. El-Sorogy, A.S.; Youssef, M. Assessment of heavy metal contamination in intertidal gastropod and bivalve shells from central Arabian Gulf coastline, Saudi Arabia. J. Afr. Earth Sci. 2015, 111, 41–53. [Google Scholar] [CrossRef]
  13. Liu, Y.; Liu, X.; Liu, J.; Liu, Y. Bioaccumulation and biomagnification of heavy metals in marine organisms and implications for human health. Mar. Pollut. Bull. 2022, 182, 113939. [Google Scholar] [CrossRef]
  14. Ali, H.; Khan, E.; Ilahi, I. Environmental chemistry and ecotoxicology of hazardous heavy metals: Environmental persistence, toxicity, and bioaccumulation. J. Chem. 2019, 2019, 6730305. [Google Scholar] [CrossRef]
  15. Selvaraj, K.; Mohan, V.R.; Szefer, P. Evaluation of metal contamination in coastal sediments of the Bay of Bengal, India: Geochemical and statistical approaches. Mar. Pollut. Bull. 2004, 49, 174–185. [Google Scholar] [CrossRef]
  16. Varol, M. Assessment of heavy metal contamination in sediments of the Tigris River (Turkey) using pollution indices and multivariate statistical techniques. J. Hazard. Mater. 2011, 195, 355–364. [Google Scholar] [CrossRef]
  17. Alzahrani, H.; El-Sorogy, A.S.; Alghamdi, A.G.; Alasmary, Z.; Albugami, T.M.R. A multivariate and geographic-information-system approach to assess environmental and health hazards of Fe, Cr, Zn, Cu, and Pb in agricultural soils of Western Saudi Arabia. Sustainability 2025, 17, 1610. [Google Scholar] [CrossRef]
  18. El-Sorogy, A.S.; Al Khathlan, M.H. Assessment of potentially toxic elements and health risks of agricultural soil in Southwest Riyadh, Saudi Arabia. Open Chem. 2024, 22, 20240017. [Google Scholar] [CrossRef]
  19. Kahal, A.Y.; El-Sorogy, A.S.; Meroño de Larriva, J.E.; Shokr, M.S. Mapping soil contamination in arid regions: A GIS and multivariate analysis approach. Minerals 2025, 15, 124. [Google Scholar] [CrossRef]
  20. Badr, N.B.; El-Fiky, A.A.; Mostafa, A.R.; Al-Mur, B.A. Metal pollution records in core sediments of some Red Sea coastal areas, Kingdom of Saudi Arabia. Environ. Monit. Assess. 2009, 155, 509–526. [Google Scholar] [CrossRef]
  21. Lourino-Cabana, B.; Lesven, L.; Charriau, A.; Billon, G.; Ouddane, B.; Boughriet, A. Potential risks of metal toxicity in contaminated sediments of Deule River in Northern France. J. Hazard. Mater. 2011, 186, 2129–2137. [Google Scholar] [CrossRef]
  22. Pan, K.; Lee, O.O.; Qian, P.Y.; Wang, W.X. Sponges and sediments as monitoring tools of metal contamination in the eastern coast of the Red Sea, Saudi Arabia. Mar. Pollut. Bull. 2011, 62, 1140–1146. [Google Scholar] [CrossRef] [PubMed]
  23. Al-Sofyani, A.A.; Marimuthu, N.; Wilson, J.J. A rapid assessment of Scleractinian and non-Scleractinian coral growth forms along the Saudi Arabian coast, Red Sea. J. Ocean Univ. China 2014, 13, 243–248. [Google Scholar] [CrossRef]
  24. Ghandour, I.; Basaham, S.; Al-Washmi, A.; Masuda, H. Natural and anthropogenic controls on sediment composition of an arid coastal environment: Sharm Obhur, Red Sea, Saudi Arabia. Environ. Monit. Assess. 2014, 186, 1465–1484. [Google Scholar] [CrossRef] [PubMed]
  25. Basaham, A.S.; El-Sayed, M.; Ghandour, I.M.; Masuda, H. Geochemical background for the Saudi Red Sea coastal systems and its implication for future environmental monitoring and assessment. J. Environ. Earth Sci. 2015, 74, 4561–4570. [Google Scholar] [CrossRef]
  26. Basaham, A.S.; Ghandour, I.M.; Haredy, R.A. Controlling factors on the geochemistry of Al-Shuaiba and Al-Mejarma coastal lagoons, Red Sea, Saudi Arabia. Open Geosci. 2019, 11, 426–439. [Google Scholar] [CrossRef]
  27. Kahal, A.; El-Sorogy, A.S.; Alfaifi, H.; Almadani, S.; Ghrefat, H.A. Spatial distribution and ecological risk assessment of the coastal surface sediments from the Red Sea, northwest Saudi Arabia. Mar. Pollut. Bull. 2018, 137, 198–208. [Google Scholar] [CrossRef]
  28. Kahal, A.; El-Sorogy, A.S.; Qaysi, S.; Almadani, S.; Kassem, S.M.; Al-Dossari, A. Contamination and ecological risk assessment of the Red Sea coastal sediments, southwest Saudi Arabia. Mar. Pollut. Bull. 2020, 154, 111125. [Google Scholar] [CrossRef] [PubMed]
  29. Al-Mur, B.A.; Al-Shaikh, I.; Sayed, E.M.A. Heavy metals pollution in marine sediments and environment: A case study of Jeddah coast, Red Sea, Saudi Arabia. Mar. Pollut. Bull. 2020, 156, 111162. [Google Scholar]
  30. Karuppasamy, M.; Qurban, M.A.B.; Krishnakumar, P.K. Metal contamination assessment in the sediments of the Red Sea coast of Saudi Arabia. In Oceanographic and Biological Aspects of the Red Sea; Springer: Cham, Switzerland, 2019; pp. 147–170. [Google Scholar]
  31. Abdel-Moati, M.A.R.; Al-Omran, A.M.; Al-Zahrani, M.A. Heavy metals distribution in the coastal sediments of the Red Sea, Saudi Arabia. Earth Environ. Sci. 2021, 51, 126–142. [Google Scholar]
  32. Youssef, M.; Al Otaibi, S.; El-Sorogy, A.S. Distribution, source, and contamination of heavy metals in coastal sediments of Jeddah, Red Sea, Saudi Arabia. Bull. Environ. Contam. Toxicol. 2024, 113, 12. [Google Scholar] [CrossRef]
  33. Youssef, M.; El-Sorogy, A.; Osman, M.; Ghandour, I.; Manaa, A. Distribution and metal contamination in core sediments from the North Al-Wajh area, Red Sea, Saudi Arabia. Mar. Pollut. Bull. 2020, 152, 110924. [Google Scholar] [CrossRef]
  34. El-Sorogy, A.S.; Youssef, M.; Al-Kahtany, K. Evaluation of coastal sediments for heavy metal contamination, Yanbu area, Red Sea coast, Saudi Arabia. Mar. Pollut. Bull. 2021, 163, 111966. [Google Scholar] [CrossRef]
  35. Alharbi, T.; El-Sorogy, A.S.; Al-Katany, K.; Alhejji, S.S.S. Ecological health hazards and multivariate assessment of contamination sources of potentially toxic elements from Al-Lith coastal sediments, Saudi Arabia. Minerals 2024, 14, 1150. [Google Scholar] [CrossRef]
  36. El-Sawy, E.K.; Abd-Allah, A.M.; El-Fakharani, A.; Helaly, A.M.S. An integrated remote sensing, aeromagnetic and field study of the Ablah shear zone (Asir Terrane, Saudi Arabia): Structural styles and implications for the tectonic evolution. J. Asian Earth Sci. 2022, 224, 105034. [Google Scholar] [CrossRef]
  37. Eldosouky, A.M.; El-Qassas, R.A.Y.; Pham, L.T.; Abdelrahman, K.; Alhumimidi, M.S.; El Bahrawy, A.; Mickus, K.; Sehsah, H. Mapping Main Structures and Related Mineralization of the Arabian Shield (Saudi Arabia) Using Sharp Edge Detector of Transformed Gravity Data. Minerals 2022, 12, 71. [Google Scholar] [CrossRef]
  38. Thompson, M.; Ellison, S.L.R.; Wood, R. The international harmonized protocol for the proficiency testing of analytical chemistry laboratories. Pure Appl. Chem. 2011, 78, 145–196. [Google Scholar] [CrossRef]
  39. Gao, X.; Chen, C. Heavy metal pollution status in surface sediments of the coastal Bohai Bay. Water Res. 2012, 46, 1901–1911. [Google Scholar] [CrossRef] [PubMed]
  40. Achilleos, G.A. The Inverse Distance Weighted interpolation method and error propagation mechanism–creating a DEM from an analogue topographical map. J. Spat. Sci. 2011, 56, 283–304. [Google Scholar] [CrossRef]
  41. Hakanson, L. An ecological risk index for aquatic pollution control: A sedimentological approach. Water Res. 1980, 14, 975–1001. [Google Scholar] [CrossRef]
  42. Weissmannová, H.D.; Pavlovská, J. Indices of soil contamination by heavy metals—Methodology of calculation for pollution assessment (minireview). Environ. Monit. Assess. 2017, 189, 616. [Google Scholar] [CrossRef]
  43. Turekian, K.; Wedepohl, K. Distribution of the elements in some major units of the Earth’s crust. Geol. Soc. Am. Bull. 1961, 72, 175–192. [Google Scholar] [CrossRef]
  44. Wang, X.; Zhang, L.; Yang, J. Impact of heavy metals on coral reef ecosystems. Mar. Pollut. Bull. 2023, 181, 1139. [Google Scholar]
  45. Alzahrani, H.; El-Sorogy, A.S.; Qaysi, S. Assessment of human health risks of toxic elements in coastal area between Al-Khafji and Al-Jubail, Saudi Arabia. Mar. Pollut. Bull. 2023, 196, 115622. [Google Scholar] [CrossRef]
  46. Zhang, J.; Liu, C.L.; Wang, L.J. Using enrichment factor and geo-accumulation index to assess heavy metal contamination in sediments of a river system in eastern China. Environ. Sci. Pollut. Res. 2020, 27, 14573–14584. [Google Scholar] [CrossRef]
  47. Agbeshie, A.A.; Adjei, R.; Anokye, J.; Banunle, A. Municipal waste dumpsite: Impact on soil properties and heavy metal concentrations, Sunyani, Ghana. Sci. Afr. 2020, 8, e00390. [Google Scholar] [CrossRef]
  48. Jiang, Y.; Wang, Q.; Wang, H.; Li, Y.; Zhang, H. Environmental risk assessment of heavy metals in coastal landfill leachates and surrounding soils: A case study in Southeast China. Environ. Pollut. 2021, 268, 115784. [Google Scholar] [CrossRef]
  49. Bhuiyan, M.A.H.; Parvez, L.; Islam, M.A.; Dampare, S.B.; Suzuki, S. Heavy metal pollution of coal mine-affected agricultural soils in the northern part of Bangladesh. J. Hazard. Mater. 2009, 173, 384–392. [Google Scholar] [CrossRef]
  50. Tang, W.; Wang, S.; Zhang, S. Arsenic distribution, enrichment, and ecological risk in coastal sediments influenced by anthropogenic activities. Environ. Pollut. 2022, 308, 119669. [Google Scholar] [CrossRef]
  51. Kjeldsen, P.; Barlaz, M.A.; Rooker, A.P.; Baun, A.; Ledin, A.; Christensen, T.H. Present and long-term composition of MSW landfill leachate: A review. Crit. Rev. Environ. Sci. Technol. 2002, 32, 297–336. [Google Scholar] [CrossRef]
  52. Xin, X.; Shentu, J.; Zhang, T.; Yang, X.; Baligar, V.C.; He, Z. Sources, Indicators, and Assessment of Soil Contamination by Potentially Toxic Metals. Sustainability 2022, 14, 15878. [Google Scholar] [CrossRef]
  53. Alloway, B.J. Heavy Metals in Soils: Trace Metals and Metalloids in Soils and Their Bioavailability, 3rd ed.; Springer: Berlin/Heidelberg, Germany, 2013. [Google Scholar] [CrossRef]
  54. Khan, Z.H.; Naushad, M.; Lima, E.C.; AlOthman, Z.A.; Ranjan, S. Heavy metal contamination in aquatic systems and associated human health risk assessment: A comprehensive review. Ecotoxicol. Environ. Saf. 2022, 236, 113528. [Google Scholar] [CrossRef]
  55. Kabata-Pendias, A. Trace Elements in Soils and Plants, 4th ed.; CRC Press: Boca Raton, FL, USA, 2011. [Google Scholar] [CrossRef]
  56. Bhattacharya, P.; Mukherjee, A.B.; Bundschuh, J.; Zevenhoven, R.; Loeppert, R.H. (Eds.) Arsenic in Soil and Groundwater Environment: Biogeochemical Interactions, Health Effects and Remediation; Elsevier: Amsterdam, The Netherlands, 2017. [Google Scholar]
  57. Chabukdhara, M.; Nema, A.K. Heavy metals assessment in urban soil around industrial clusters in Ghaziabad, India: Probabilistic health risk approach. Ecotoxicol. Environ. Saf. 2013, 87, 57–64. [Google Scholar] [CrossRef]
  58. Long, E.R.; MacDonald, D.D.; Smith, S.L.; Calder, F.D. Incidence of adverse biological effects within ranges of chemical concentrations in marine and estuarine sediments. Environ. Manag. 1995, 19, 81–97. [Google Scholar] [CrossRef]
  59. MacDonald, D.D.; Ingersoll, C.G.; Berger, T.A. Development and evaluation of consensus-based sediment quality guidelines for freshwater ecosystems. Arch. Environ. Contam. Toxicol. 2000, 39, 20–31. [Google Scholar] [CrossRef]
  60. El-Sorogy, A.S.; Al-Kahtany, K.; Alharbi, T.; Al Hawas, R.; Rikan, N. Geographic Information System and Multivariate Analysis Approach for Mapping Soil Contamination and Environmental Risk Assessment in Arid Regions. Land 2025, 14, 221. [Google Scholar] [CrossRef]
  61. Hader, D.P.; Helbling, E.W.; Villafane, V.E. Anthropogenic Pollution of Aquatic Ecosystems; Springer Nature: Cham, Switzerland, 2021; p. 426. [Google Scholar] [CrossRef]
  62. Hair, J.F.; Black, W.C.; Babin, B.J.; Anderson, R.E. Multivariate Data Analysis, 7th ed.; Pearson Education Limited: London, UK, 2014. [Google Scholar]
  63. Hashim, M.; Yusof, N.F.F.M.; Zainal, Z. Pollution status of heavy metals in the Red Sea coastal sediments: A case study from Jizan, Saudi Arabia. Environ. Geochem. Health 2019, 41, 1189–1205. [Google Scholar]
  64. Karbassi, A.R.; Monavari, S.M.; Bidhendi, G.R.N. Heavy metals in coastal landfill leachate: Sources and mitigation strategies. Mar. Pollut. Bull. 2021, 162, 111885. [Google Scholar]
  65. Ali, H.; Khan, E.; Sultan, S. Heavy metal contamination from electronic waste: Sources, effects, and management. Environ. Sci. Pollut. Res. 2022, 29, 42055–42073. [Google Scholar] [CrossRef]
  66. World Health Organization (WHO). Lead Poisoning and Health. 2021. Available online: https://www.who.int/news-room/fact-sheets/detail/lead-poisoning-and-health (accessed on 28 July 2025).
  67. Bhowmik, R.; Debnath, B.; Saha, A. Chromium pollution from industrial sources: A review of environmental impacts. Sci. Total Environ. 2022, 806, 150448. [Google Scholar]
  68. Shang, W.; Yang, M.; Han, Z.; Chen, X. Distribution, contamination assessment, and sources of heavy metals in surface sediments from the south of the North Yellow Sea, China. Mar. Pollut. Bull. 2023, 196, 115577. [Google Scholar] [CrossRef]
  69. Rezaei, R.; Ghanbarpour, M.; Tajarrod, M. Assessment of heavy metal pollution and ecological risk in coastal sediments influenced by landfill leachate. Mar. Pollut. Bull. 2023, 189, 114709. [Google Scholar] [CrossRef]
  70. Suthar, S.; Chhimpa, V.; Singh, S. Sources and health risks of heavy metals contamination in roadside soil: A review. Environ. Chem. Lett. 2021, 19, 3935–3955. [Google Scholar] [CrossRef]
  71. Arif, N.; Yadav, V.; Singh, S.; Singh, S.; Ahmad, P.; Mishra, R.K.; Sharma, S.; Tripathi, D.K.; Dubey, N.K.; Chauhan, D.K. Influence of high and low levels of plant-beneficial heavy metal ions on plant growth and development. Front. Environ. Sci. 2016, 4, 69. [Google Scholar] [CrossRef]
  72. Merly, L.; Lange, L.; Meÿe, M.; Hewitt, A.M.; Koen, P.; Fischer, C.; Muller, J.; Schilack, V.; Wentzel, M.; Hammerschlag, N. Blood plasma levels of heavy metals and trace elements in white sharks (Carcharodon carcharias) and potential health consequences. Mar. Pollut. Bull. 2019, 142, 85–92. [Google Scholar] [CrossRef]
  73. Shriadah, M.A.; Madkour, H.A.; El-Tokhi, M. Environmental implications of metal contamination in marine sediments along the Red Sea, Saudi Arabia. Environ. Pollut. 2023, 318, 120879. [Google Scholar]
  74. Kumar, V.; Sharma, A.; Kumar, R.; Bhardwaj, R.; Kumar Thukral, A.; Rodrigo-Comino, J. Assessment of heavy-metal pollution in three different Indian water bodies by combination of multivariate analysis and water pollution indices. Hum. Ecol. Risk Assess. Int. J. 2018, 26, 1–16. [Google Scholar] [CrossRef]
  75. Xia, F.; Qu, L.; Wang, T.; Wang, H.; Zhang, C. Ecological risk assessment and source identification of heavy metals in surface sediments from the Liao River Basin. Int. J. Environ. Res. Public Health 2018, 15, 2280. [Google Scholar] [CrossRef]
  76. Smith, A.H.; Lingas, E.O.; Rahman, M. Contamination of drinking-water by arsenic in Bangladesh: A public health emergency. Bull. World Health Organ. 2000, 78, 1093–1103. [Google Scholar]
  77. Förstner, U.; Wittmann, G.T.W. Metal Pollution in the Aquatic Environment; Springer Science & Business Media: Berlin/Heidelberg, Germany, 2012. [Google Scholar] [CrossRef]
  78. Allafta, H.; Opp, C. Spatio-temporal variability and pollution sources identification of the surface sediments of Shatt Al-Arab River, Southern Iraq. Sci Rep 2020, 10, 6979. [Google Scholar] [CrossRef]
  79. Bhuyan, M.S.; Bakar, M.A.; Islam, M.S. Heavy metal contamination in surface water and sediment of the Old Brahmaputra River in Bangladesh. Environ. Nanotechnol. Monit. Manag. 2017, 8, 273–279. [Google Scholar] [CrossRef]
  80. Adrees, M.; Ali, S.; Rizwan, M.; Ibrahim, M.; Abbas, F.; Farid, M.; Bharwana, S.A. The effect of excess copper on growth and physiology of important food crops: A review. Environ. Sci. Pollut. Res. 2015, 22, 8148–8162. [Google Scholar] [CrossRef] [PubMed]
  81. Srivastava, S.; Shukla, A.; Rajput, V.D.; Kumar, K.; Minkina, T.; Mandzhieva, S.; Shmaraeva, A.; Suprasanna, P. Arsenic Remediation through Sustainable Phytoremediation Approaches. Minerals 2021, 11, 936. [Google Scholar] [CrossRef]
  82. Khan, S.; Shah, I.A.; Muhammad, S.; Malik, R.N.; Shah, M.T. Arsenic and Heavy Metal Concentrations in Drinking Water in Pakistan and Risk Assessment: A Case Study. Hum. Ecol. Risk Assess. Int. J. 2015, 1020–1031. [Google Scholar] [CrossRef]
Figure 1. Location map of the landfill and sampling sites along the Red Sea coast.
Minerals 15 00802 g001
Figure 2. Change in surface area of landfill site from 2014 to 2025. The yellow line determines the boundaries of the landfill. The zoomed-in area provides a closer view of the landfill surface.
Minerals 15 00802 g002
Figure 3. Spatial distribution of PTEs in the soil and coastal sediment of the Al-Qunfudhah area.
Minerals 15 00802 g003
Figure 4. Spatial distribution of EF per sample locations for Pb, Zn, Ni, Cu, As, and Co in the Al-Qunfudhah area.
Minerals 15 00802 g004
Figure 5. Spatial distribution of Igeo per sample locations for Pb, Zn, Ni, and Cu in the Al-Qunfudhah area.
Minerals 15 00802 g005
Figure 6. Spatial distribution of CF per sample locations for Pb, Zn, Ni, Cu and As in the Al-Qunfudhah area.
Minerals 15 00802 g006
Figure 7. Two-dimensional PCA biplot showing the loading vectors of PTEs on the first two principal components.
Minerals 15 00802 g007
Table 1. Distribution of sediment samples in the ranges established by Sediment Quality Guidelines (SQGs) according to PTE levels (mg/kg), using ERL and ERM values.
PTEsMean Conc.ERLERM<ERL (%)>ERL & <ERM (%)>ERM (%)
Cu29.923427075.67 (28)24.33 (9)0
Ni22.1020.951.670.27 (26)27.03 (10)2.70 (1)
Zn65.3615041091.89 (34)8.11 (3)0
As4.478.27091.89 (34)8.11 (3)0
Cr26.7481370100 (37)00
Pb69.5146.721858.33 (35)2.70 (1)2.70 (1)
Table 2. Summary of landfill soil PTE concentrations compared to USEPA soil screening levels (SSLs) for residential use.
PTEsMean Conc.USEPA Residential SSLExceeds SSL (%)
Pb69.514002.70 (1)
Cu29.92700
Ni22.103027.03 (10)
As4.470.39Significant
Cr26.742100
Zn65.3623000
Table 3. The correlation matrix of the analyzed PTEs.
AlAsCoCrCuFeMnNiPbVZn
Al1
As−0.380 *1
Co0.843 **−0.0111
Cr0.936 **−0.470 **0.747 **1
Cu0.1820.429 **0.553 **0.2631
Fe0.825 **−0.511 **0.644 **0.921 **0.3081
Mn0.843 **−0.330 *0.711 **0.790 **0.1740.802 **1
Ni0.2030.421 **0.656 **0.1100.728 **0.1250.1761
Pb0.001−0.0410.0260.0850.2930.423 **0.1690.1641
V0.847 **−0.610 **0.625 **0.941 **0.1520.909 **0.780 **0.0450.0851
Zn0.3120.2240.480 **0.459 **0.794 **0.566 **0.331 *0.430 **0.517 **0.3141
*. Correlation is significant at the 0.05 level (2-tailed); **. Correlation is significant at the 0.01 level (2-tailed).
Table 4. The KMO test for PTEs of Al Qunfudhah soil and sediment.
KMO and Bartlett’s Test
Kaiser–Meyer–Olkin Measure of Sampling Adequacy.0.644
Bartlett’s Test of SphericityApprox. Chi-Square628.227
df55
Sig.0.000
Disclaimer/Publisher’s Note: The statements, opinions and data contained in all publications are solely those of the individual author(s) and contributor(s) and not of MDPI and/or the editor(s). MDPI and/or the editor(s) disclaim responsibility for any injury to people or property resulting from any ideas, methods, instructions or products referred to in the content.

