Article

Comparative Evaluation of X-Ray Transmission and X-Ray Luminescence Sorting Technologies for Fine Diamond Recovery

1
Department of Chemical and Biological Engineering, University of Saskatchewan, 57 Campus Drive, Saskatoon, SK S7N 5A9, Canada
2
Saskatchewan Research Council, Bay 4, 820 51st Street East, Saskatoon, SK S7K 0X8, Canada
3
Natural Resources Canada, CanmetMINING, 555 Booth Street, Ottawa, ON K1A 0G1, Canada
4
Six-S GmbH, Hinter der Kirche 1A, 22880 Wedel, Germany
5
Rio Tinto Exploration Canada Inc., 300-815 West Hastings St., Vancouver, BC V6E 1B4, Canada
6
TOMRA Sorting Inc., 1536 Cole Blvd, Suite 225, Lakewood, CO 80401, USA
*
Author to whom correspondence should be addressed.
Minerals 2025, 15(8), 773; https://doi.org/10.3390/min15080773
Submission received: 20 April 2025 / Revised: 18 July 2025 / Accepted: 18 July 2025 / Published: 23 July 2025
(This article belongs to the Section Mineral Processing and Extractive Metallurgy)

Abstract

A study of 300 diamonds in the 2–4 mm size range revealed that X-ray transmission demonstrated a predictable relationship for detecting diamonds, with all diamonds being identified. In contrast, X-ray luminescence showed no consistent relationship between diamond characteristics and detection, and not all diamonds were identified using this method. When comparing the X-ray transmission response of diamonds to common gangue minerals found in dense media separation concentrates, X-ray transmission was found to incidentally detect small amounts of gangue particles. However, no such gangue detection occurred with X-ray luminescence, which responded only to diamonds. In pilot-scale tests, a belt-fed X-ray transmission sorter with a pressurized air ejection mechanism and a chute-fed X-ray luminescence sorter with a mechanical paddle ejection system were evaluated. The X-ray transmission sorter produced an average of 0.28 kg of concentrate per gram of diamonds separated, while the X-ray luminescence sorter generated 0.37 kg of concentrate per gram of diamonds separated. The X-ray transmission sorter achieved 99% diamond recovery, whereas the X-ray luminescence sorter achieved 91% diamond recovery. The higher concentrate mass obtained from the X-ray luminescence sorter is attributed to the ineffectiveness of the mechanical paddles, despite the superior contrast between gangue and diamonds in detection.

1. Introduction

Sensor-based sorting (SBS) technology has become a cornerstone in recycling and food industries, contributing significantly to the production processes that meet daily demands. Despite its success in these sectors, SBS integration into the mining industry has fallen behind [1,2]. While the diamond industry has utilized X-ray luminescence (XRL) SBS since the 1970s, broader mining applications have only seen the notable adoption of SBS technologies in the last 15 years [3,4]. The 1990s brought significant advancements in sorter hardware and software, revitalizing SBS in mining, particularly through the emergence of X-ray transmission (XRT) sorters [4,5]. More recently, XRT has gained prominence in coarse diamond recovery, challenging the longstanding dominance of XRL over the past five decades [4]. Notably, an XRT sorter capable of final diamond recovery in the 2–4 mm size range has recently become commercially available, marking a significant technological leap.
Photoluminescence in diamonds occurs when the electromagnetic radiation of a specific frequency (such as X-rays) excites an electron within a crystal from its ground state in the valence band to an excited state in the conduction band. As the electron returns to the valence band, the energy difference between these bands, known as the band gap, is released as a photon in the visible light spectrum. This phenomenon is associated with centers in the diamond’s crystal lattice caused by internal defects or impurities [6,7]. Diamonds’ XRL response is primarily characterized by the emission of blue light, commonly known as the “A-band,” which peaks at around 450 nm (2.8 eV) at room temperature [8,9,10,11]. To leverage this phenomenon, XRL sorters use an X-ray source to induce luminescence, with a photodetector measuring the emitted light’s intensity. When the luminescence surpasses a predetermined threshold, the sorter initiates a mechanical process to automatically separate the identified diamond particles from the rest of the material [4].
X-ray attenuation occurs when X-rays are absorbed as they pass through matter, a process influenced by material properties such as density, thickness, and atomic density [12,13,14]. Dual-energy X-ray transmission (DE-XRT) sorters utilize a single X-ray source and two line-scan sensors to measure this attenuation, with one sensor capturing high-energy signals and the other recording low-energy signals [15]. These signals are then converted into digital images. The captured images are divided into pixels, which are classified using “density curves” in the two-dimensional high-energy, low-energy space, which corresponds to the relative atomic density of the observed material [16]. Subsequent image analysis is applied to classify individual particles, helping distinguish different particle types [17,18].
By addressing the limitation of XRL sorters, XRT technology is able to recover non-luminescent or weak luminescent diamonds, particularly Type 2 diamonds, which lack nitrogen in their crystal lattice [19]. These Type 2 diamonds, often larger and more valuable, are crucial to diamond value management, especially as their concentration in deposits can vary significantly, sometimes comprising up to 50% of certain lithological units [20]. However, XRT also has drawbacks, including variable contrast between gangue and diamonds depending on the mineralogy of different deposits, which can affect recoveries. Additionally, XRT sorters are limited to processing dry material in the 2–4 mm size range due to mechanical feeder mechanisms that are negatively impacted by the unpredictable flow in wet conditions, unlike XRL sorters, which can operate effectively in wet environments.
The effectiveness of SBS technology hinges on its ability to distinguish valuable particles from non-valuable ones, requiring a clear contrast in some physical properties for the theoretical feasibility of separation. Considering diamonds as one of the most luxurious minerals ever, as well as their rarity, stunning beauty, and, consequently, very high price, it is of utmost importance that there are well-established scientific techniques for their proper evaluation. This research investigates and addresses several key questions in this area of sorting technology for fine diamond recovery: Is there a discernible relationship between XRL or XRT signals and diamond characteristics? Is there a measurable difference in the theoretical performance of XRL and XRT technologies in diamond recovery? How will these differences manifest in actual equipment performance? This study will add valuable insights into XRT sorting technology that will benefit industries involved in natural diamond production and recovery.

2. Materials and Methods

2.1. Diamond and Gangue Samples

Diamonds and gangue minerals in the 2–4 mm size range were obtained from a single Canadian kimberlite deposit. A total of 300 diamonds were selected from a larger population, where 212 counts of Type 1 and 88 counts of Type 2 diamonds were present. The diamonds were selected through a random quarter split.
Non-diamond materials were collected to serve as a contrast to the diamond minerals studied in this research. This collection included kimberlite, the host rock that transports diamonds to the surface, along with mantle minerals typically associated with kimberlite, such as olivine, chromite, garnet, ilmenite, and clinopyroxene. Kimberlites erupt through existing geological deposits, which means that minerals not typically associated with kimberlite can also be found in certain deposits. Therefore, common non-associated minerals, such as mica schist (along with mica flakes) and mudstone, were analyzed. In total, 177 particles were selected to be representative of kimberlite geology, with quantities ranging from 18 to 32 particles per mineral class, all within the 2–4 mm size range. For the purposes of this study, these materials are collectively referred to as “gangue particles.”

2.2. Diamond Characterization

A detailed characterization of the 300 diamonds was carried out, and this characterization included measurements of the following:
  • Weight: Diamonds were weighed to four decimal places in grams using a Mettler Toledo XS205 Dual Range scale, professionally calibrated to ensure precise measurements.
  • Size: Diamonds were measured in millimeters for their X, Y, and Z dimensions. The X dimension represents the largest dimension, the Y dimension is the largest perpendicular to the X dimension, and the Z dimension is the smallest perpendicular to the X dimension.
  • Color: Diamond color was assessed using a colorimeter and graded according to the GIA color scale from D to K [21,22]. Brown color content was categorized separately as significant brown hue, light brown hue, or none using the OGI Systems Ltd. ColorGrade F300 rough grading colorimeter.
  • Shape: Shape classification followed the Saskatchewan Research Council’s rough diamond definitions and methodology, with visual assessments conducted to ensure consistency [22].
  • Clarity: Clarity was classified following the Saskatchewan Research Council’s definitions, recording the presence of inclusions [22]. Diamonds without inclusions were classified as having the highest clarity.
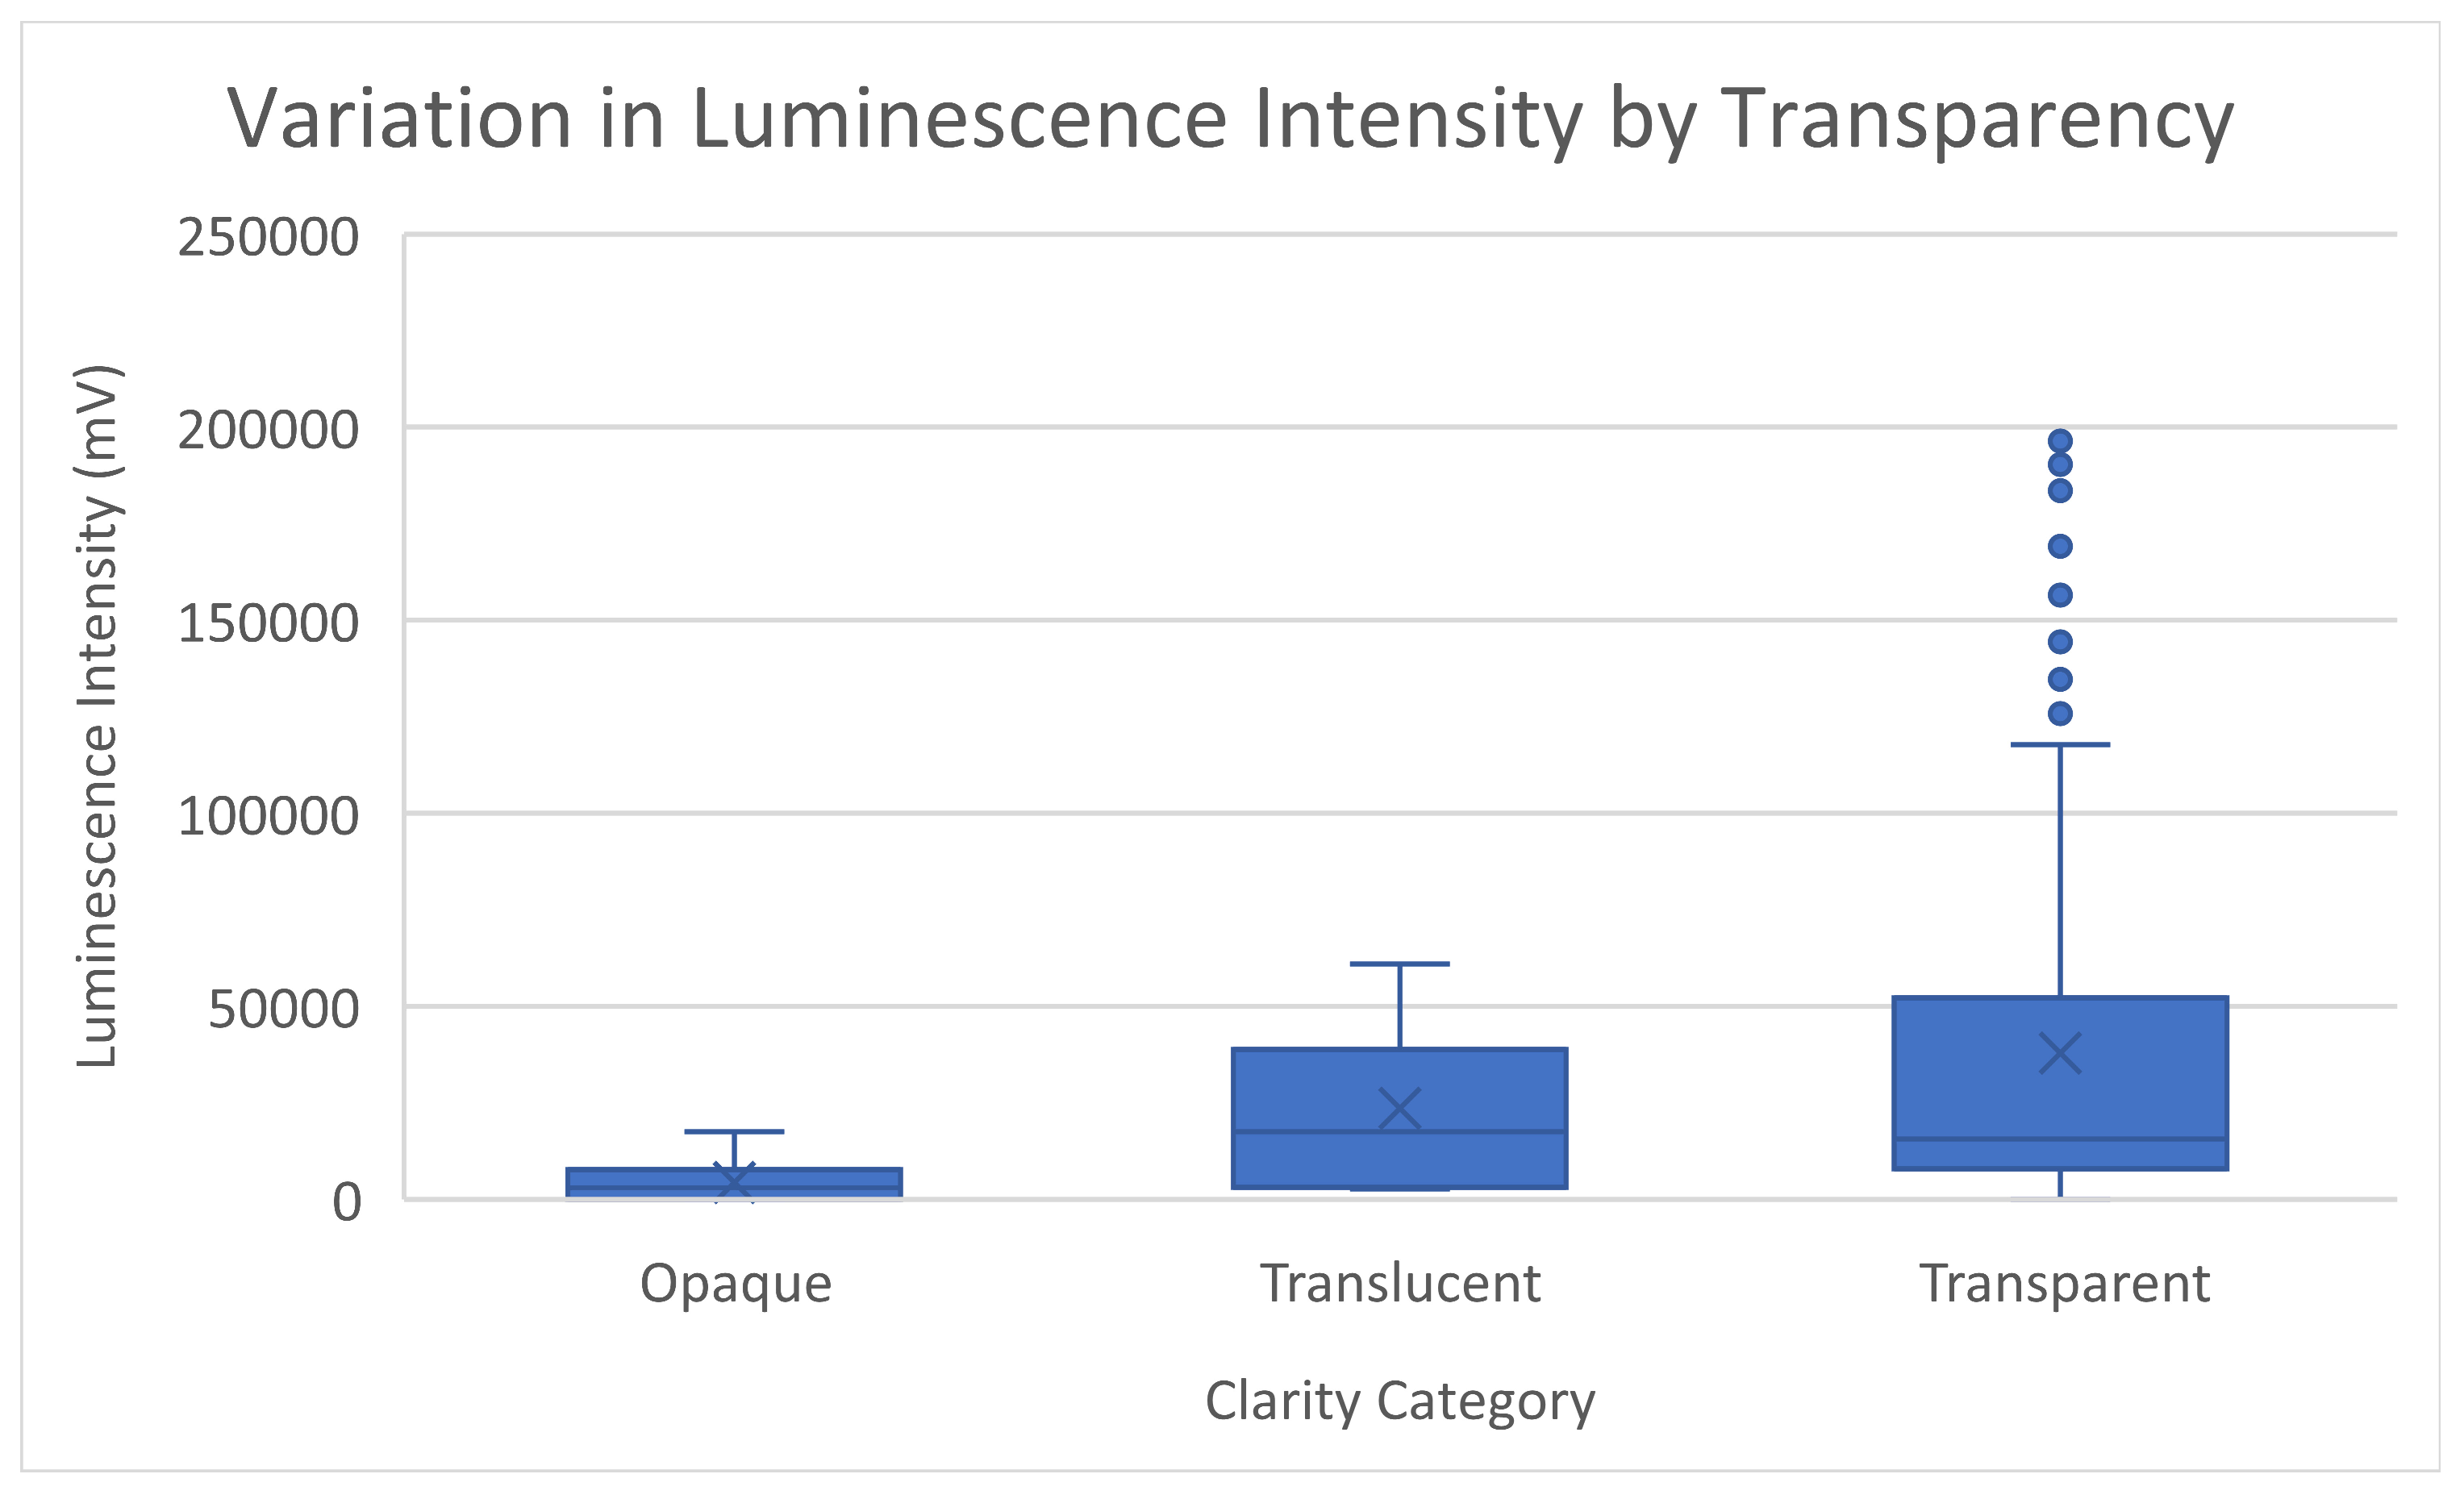
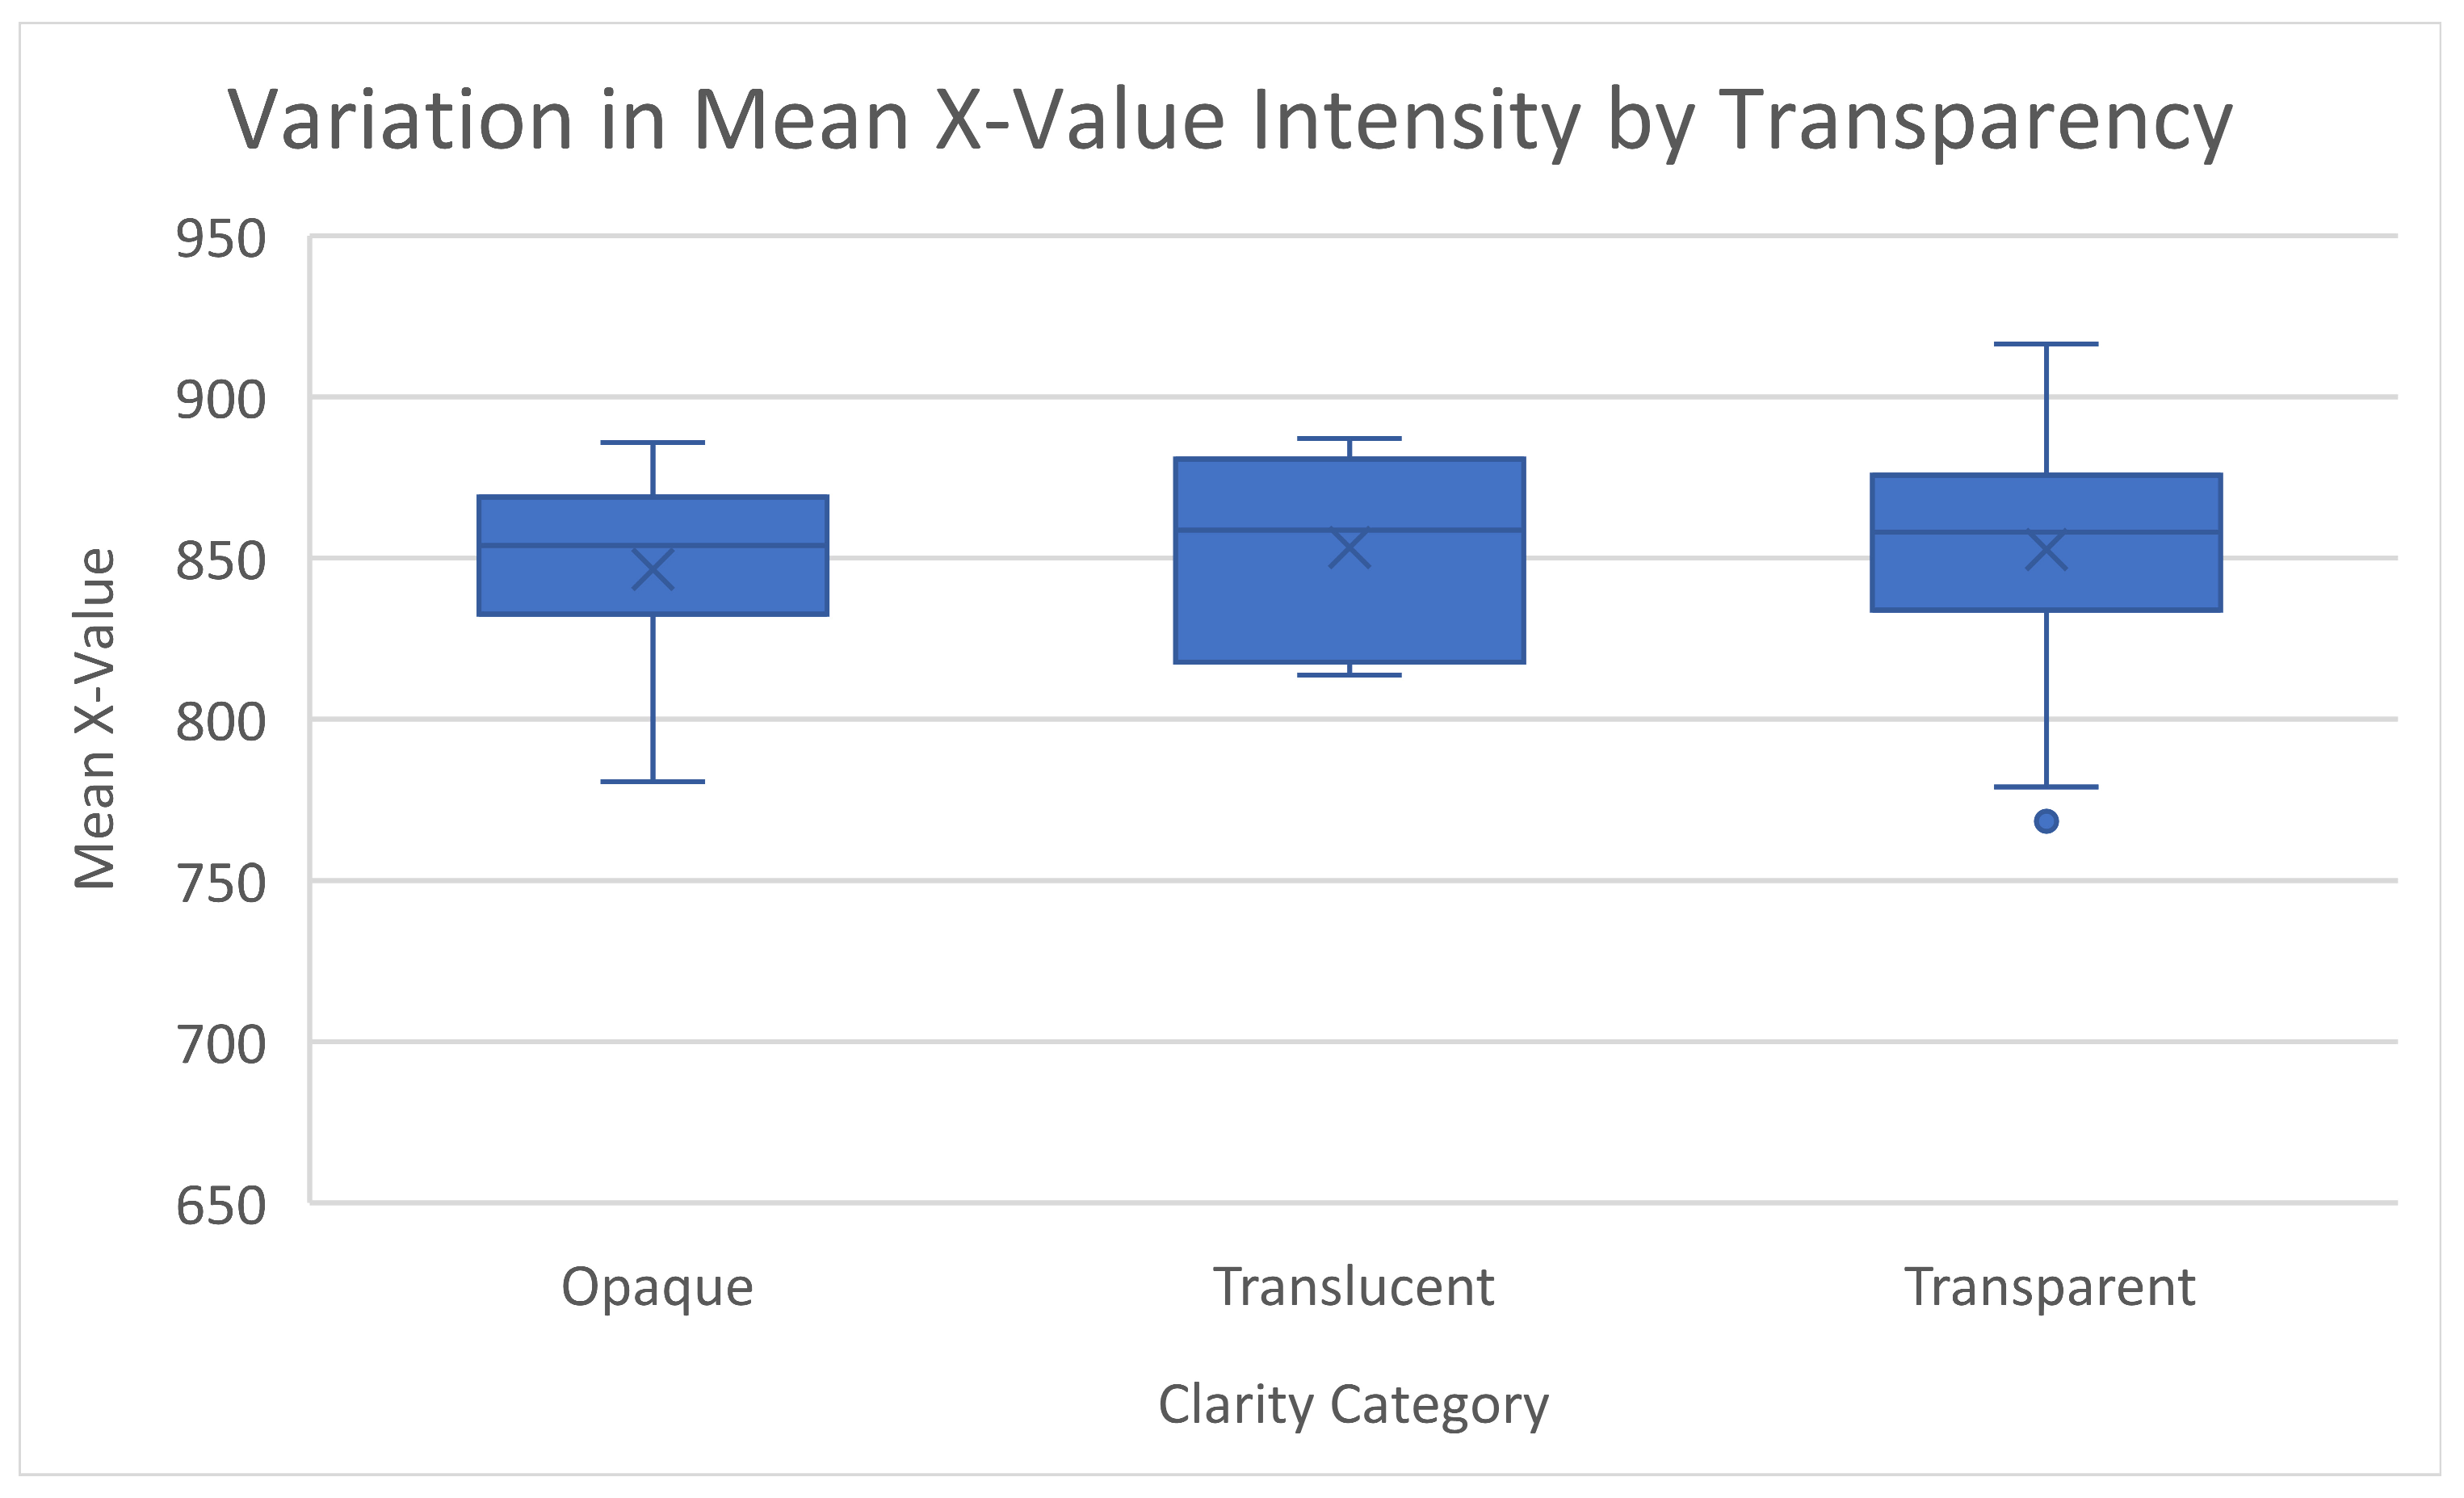
  • Transparency: Transparency was evaluated based on the Saskatchewan Research Council’s methodology [22]. This measures the ability of light to travel through the diamond. The categories include transparent, translucent, and opaque in order of decreasing transparency.
  • Fluorescence: Fluorescence was measured as the diamond’s visible blue light response to ultraviolet light (320–400 nm), using the OGI Systems Ltd. ColorGrade F300 rough grading colorimeter.
  • Stress: Diamond stress was measured using the I.David Polariscope, recording birefringence as low, moderate, or high, according to the Saskatchewan Research Council’s definitions [22].
  • Nitrogen Concentration, Nitrogen Aggregation State, and Diamond Typing: Fourier transform infrared spectroscopy (FTIR) was used to measure nitrogen concentration, nitrogen aggregation state (including the percentage of 1aA and 1aB centers), and diamond type. The Perkin Elmer Spotlight 400 FTIR unit was used to capture the diamond’s infrared spectra, identifying nitrogen-related internal bonds. The nitrogen content was determined by calculating the normalized area under spectral peaks corresponding to A-center (1282 cm−1), B-center (1185 cm−1), and platelet peaks (1358–1380 cm−1) based on established absorption coefficients. Nitrogen defects associated with N3, N2, and NV centers were not measured, as they do not contribute to A-band luminescence.

2.3. X-Ray Transmission Tests

A TOMRA COM 300 XRT (Colorado, USA) Final Diamond Recovery Sorter measured the X-ray transmission responses of every diamond and gangue particle individually. In this process, each particle was individually affixed to a thin plastic sheet and conveyed through the X-ray source and detectors on a moving belt. As the particles passed through, they were measured with the sensor’s pixel size, i.e., spatial resolution, of 0.4 mm by 0.4 mm. For each pixel, high- and low-energy X-ray absorption readings were recorded, generating a high-intensity versus low-intensity plot. The key metrics used as continuous variables for each particle include the following:
-
The average high-intensity value (x);
-
Average low-intensity value (y);
-
Number of pixels.
Standard deviations for both high and low intensities for each particle (in each scatter) were calculated and documented.

2.4. X-Ray Luminescence Tests

The kinetics of A-band diamond luminescence can be classified into several key phases [23,24]. The “Luminescent Rise” describes the time taken for a diamond’s luminescence to reach peak intensity from a state of zero luminescence and excitation. “Luminescent Decay” refers to the time it takes for luminescence to return to zero after reaching its peak. This decay process is divided into two components: the “Fast Luminescent Decay Component,” characterized by a sharp drop in intensity immediately after the peak, and the “Slow Luminescent Decay Component,” which represents the gradual return to a state of zero luminescence. In diamond recovery applications, XRL sorters primarily focus on the fast luminescence response.
A Bourevestnik POLUS-M XRL Sorter measured the X-ray luminescence responses of every diamond and gangue particle individually. Each particle was exposed to X-rays, and the visible light response was recorded as a time series of intensity values measured in millivolts (mV) every 0.1 milliseconds (ms) over a 2.5 ms duration. The continuous metrics recorded included the following:
-
Luminescence intensity;
-
Total fast center luminescence intensity;
-
Total slow center luminescence intensity;
-
Fast center decay time;
-
Slow center decay time.
The rise time was not measured due to the excitation preceding luminescence detection, though it is not essential for evaluating X-ray luminescence in this context.
Luminescence intensity was measured as the peak visible light response and was recorded as the maximum light intensity reading measured from a particle. The time it took for the slope of reduction in luminescence intensity to shift after reaching peak intensity was calculated as the fast luminescent decay time. The total fast center luminescence intensity was calculated as the difference in energy between the luminescence intensity at its peak and the luminescence intensity value at the end of the fast luminescent decay. The slow luminescent decay time was calculated by measuring the linear slope between the fast decay point and the last recorded luminescence intensity value and then extrapolating the time it would take for the luminescence intensity to become zero. The total slow center luminescence intensity was calculated as the difference in energy between the luminescence intensity value at the end of the fast luminescence decay and zero luminescence intensity.

2.5. Statistical Diamond Sample Set Analysis

The continuous variables for diamond characterization used in this study are as follows:
-
Weight;
-
Size;
-
Fluorescence;
-
Nitrogen concentration;
-
The percentage of 1aA centers.
It is important to note that the percentages of 1aA and 1aB centers sum to 100% [25], so only the percentage of the 1aA centers was used to avoid multicollinearity. The variables classified as categorical included the following:
-
Color;
-
Shape;
-
Clarity;
-
Transparency;
-
Stress;
-
Diamond typing.
Categorical variables were analyzed using box plots, while continuous variables were assessed through best subsets multiple regression. This is a statistical technique used in multiple linear regression to find the optimal combination of variables. This method systematically evaluates all possible combinations of independent variables, ranking them based on criteria such as maximizing the adjusted R2 while minimizing the number of variables. By doing so, it helps to identify the most favorable model [26,27,28,29].

3. Results and Discussion

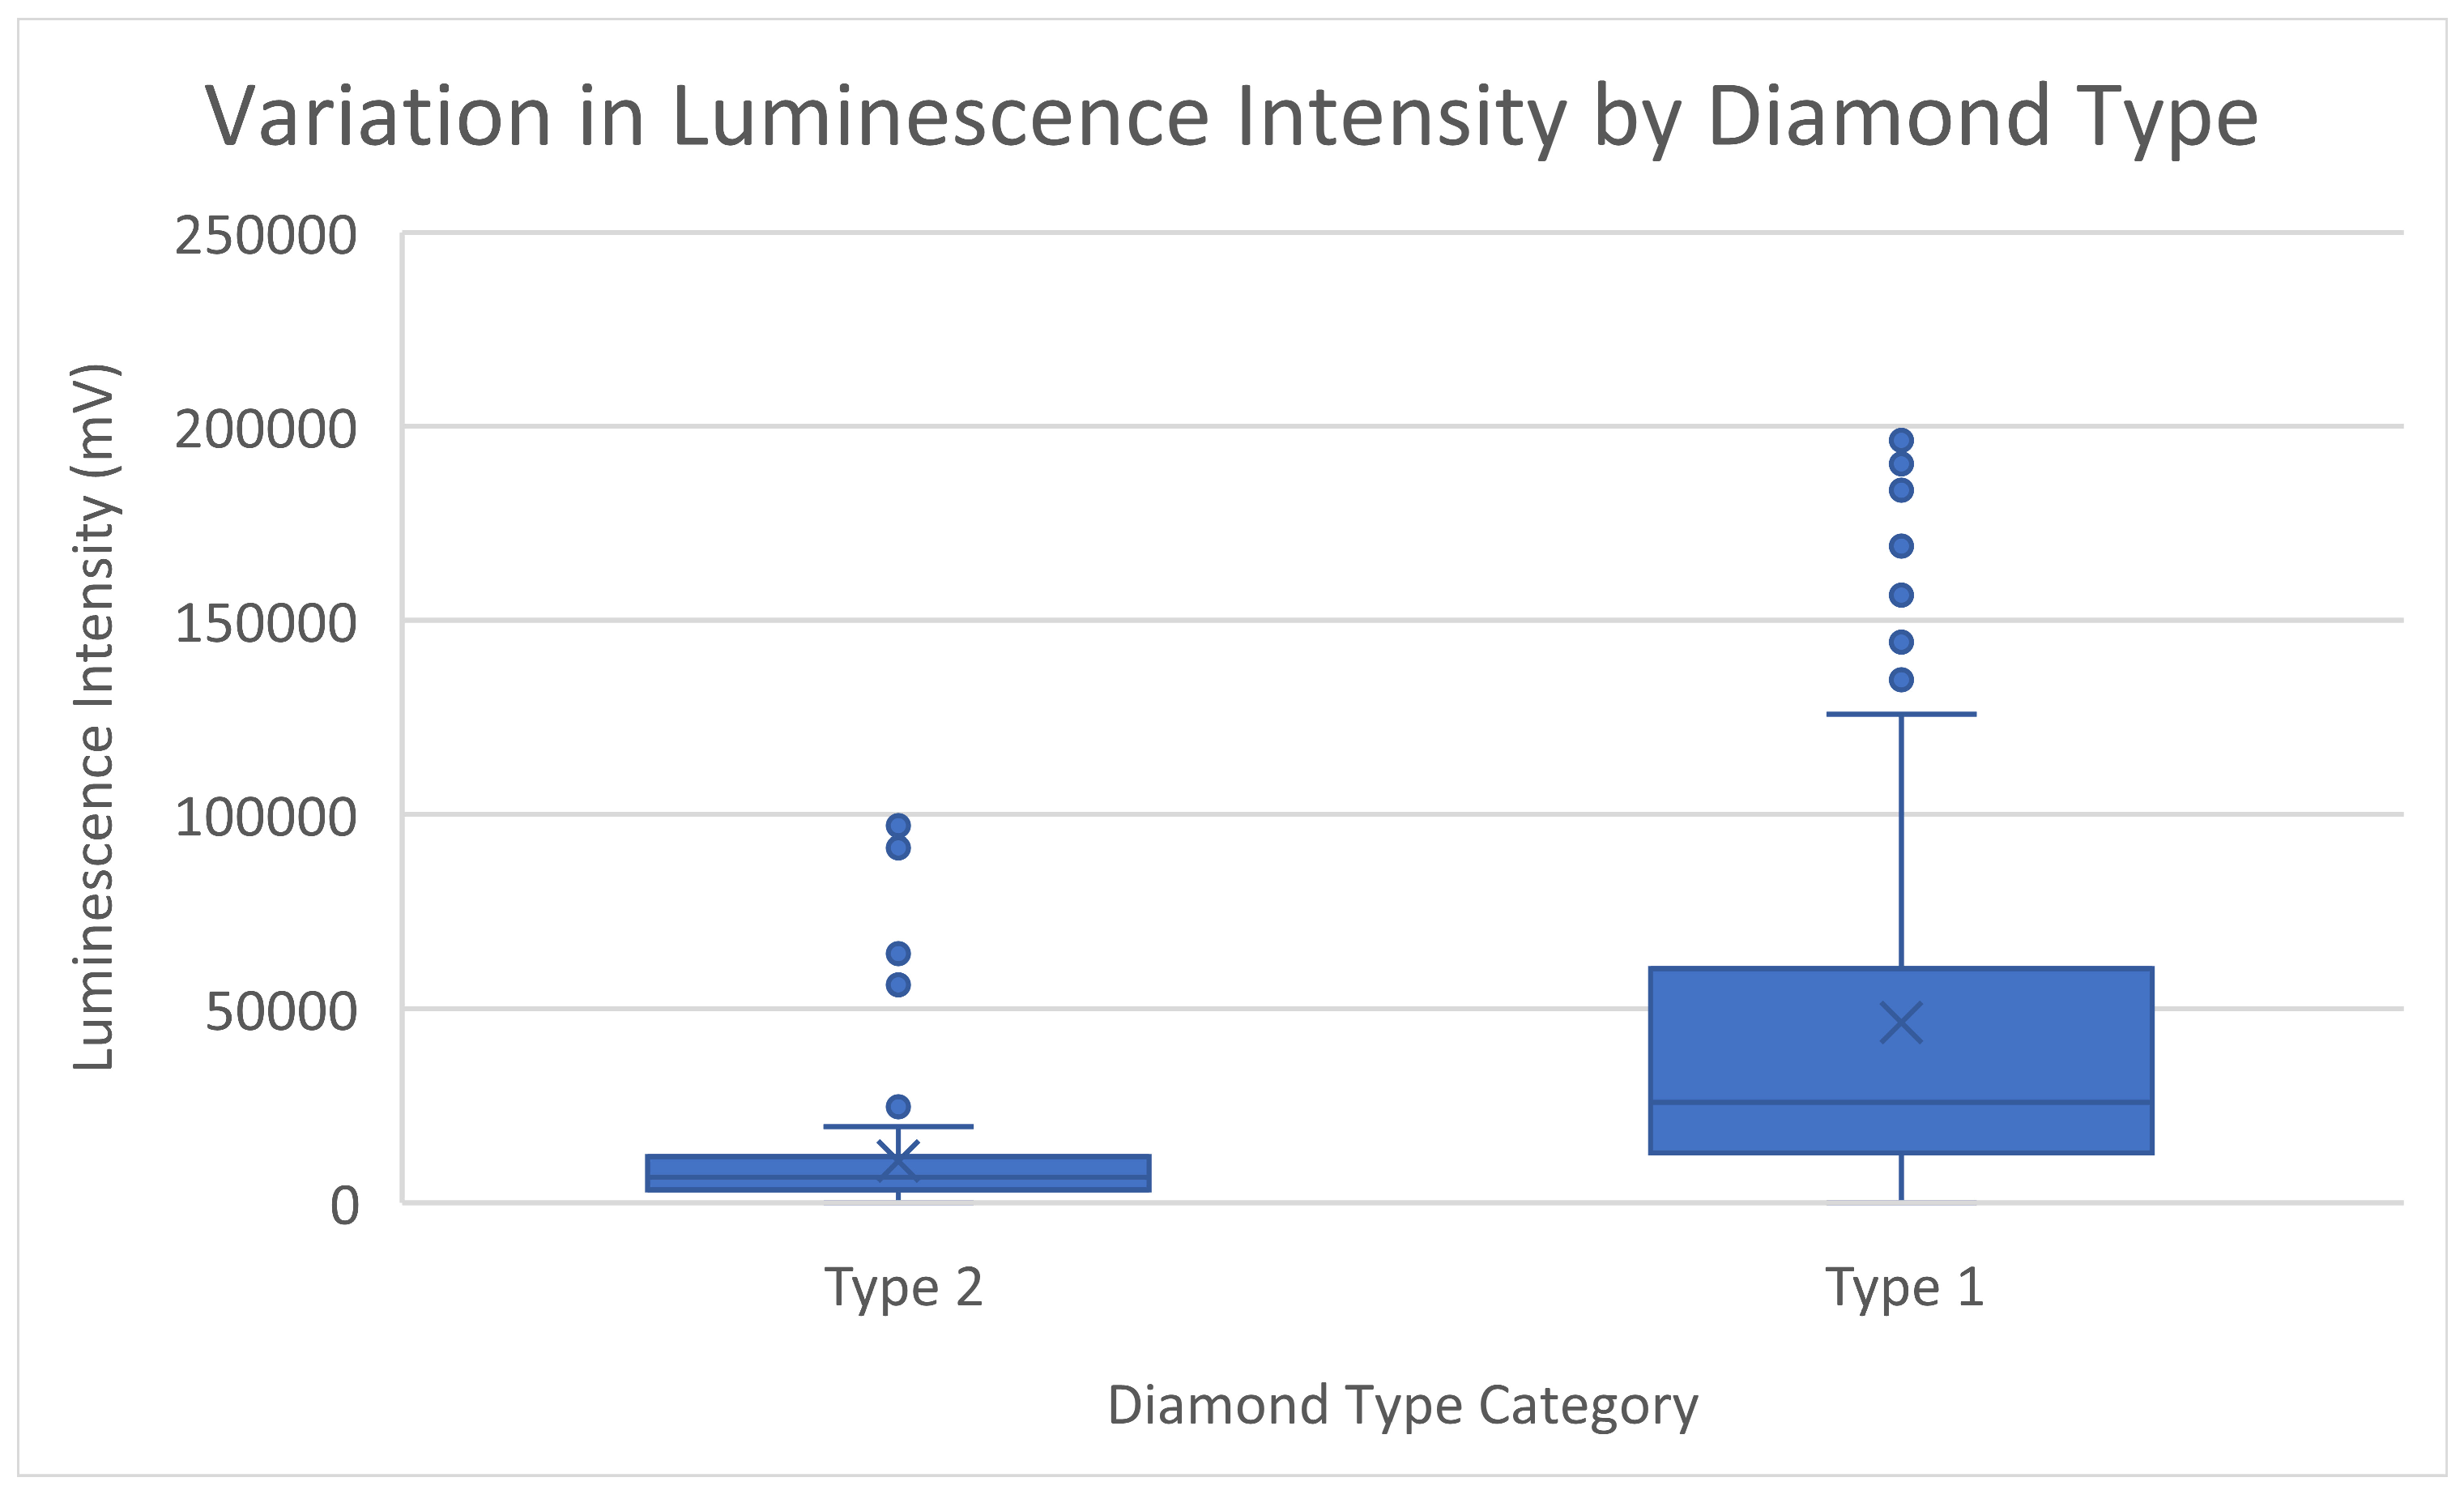
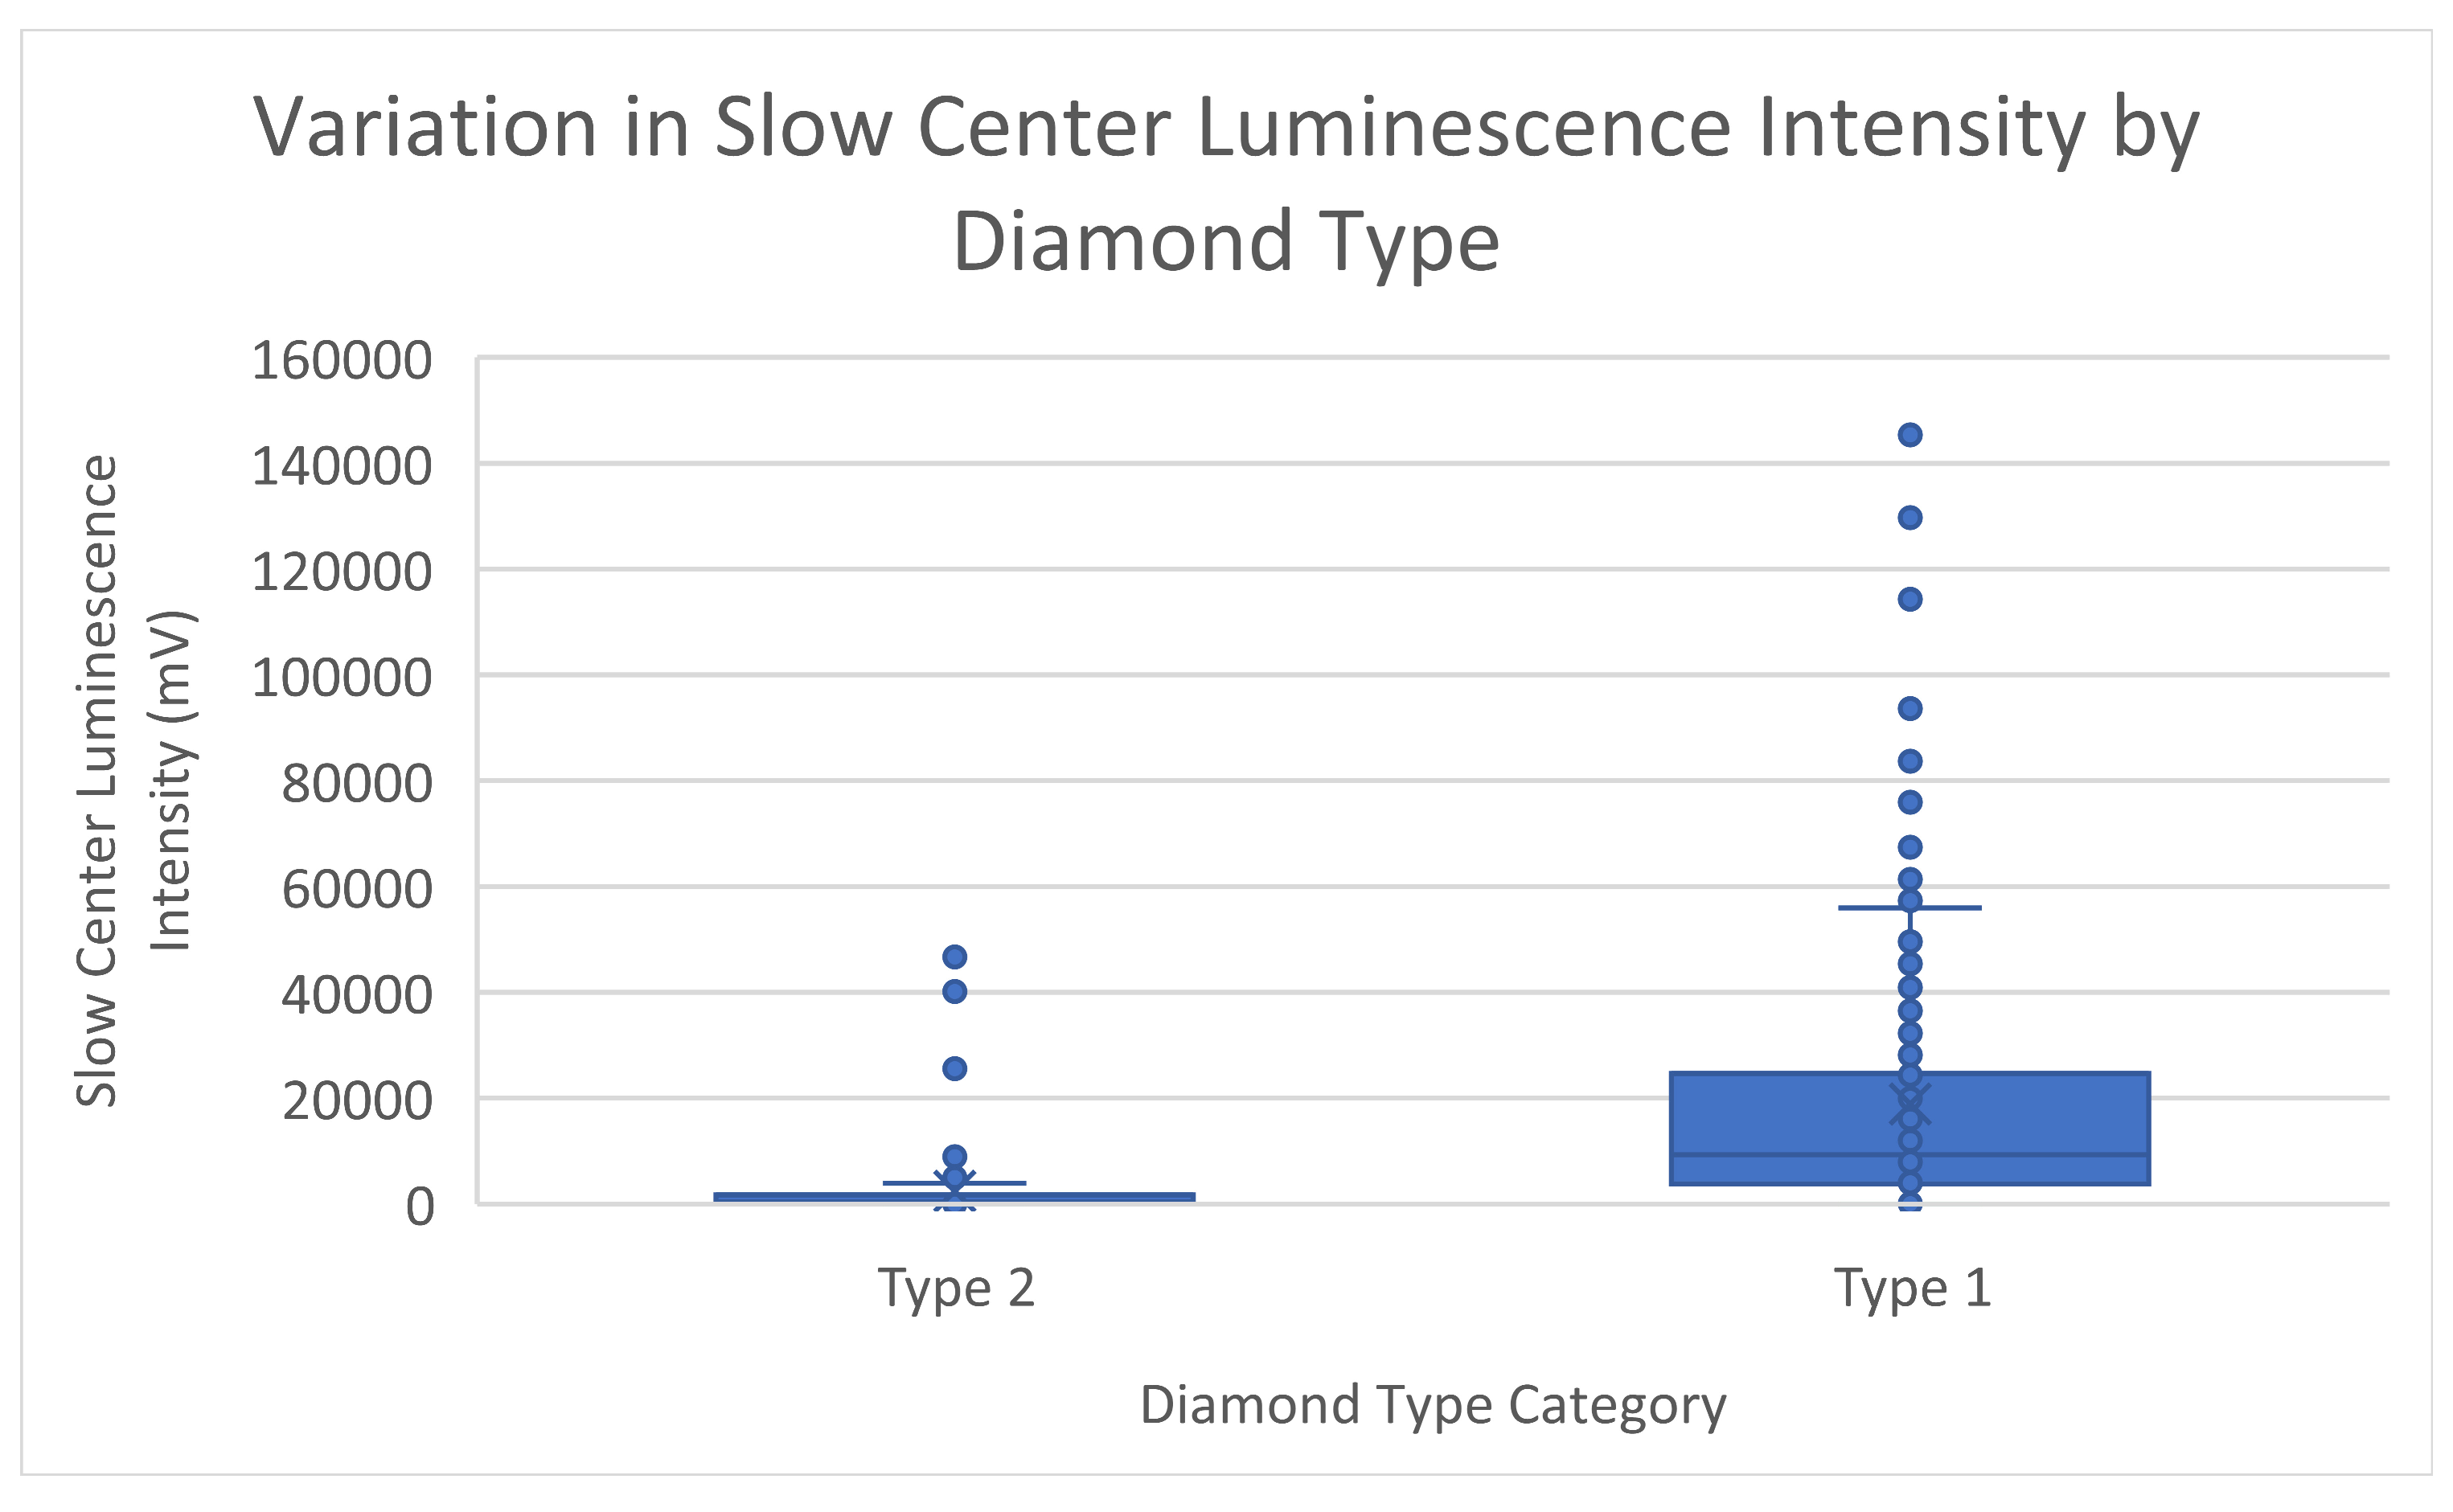
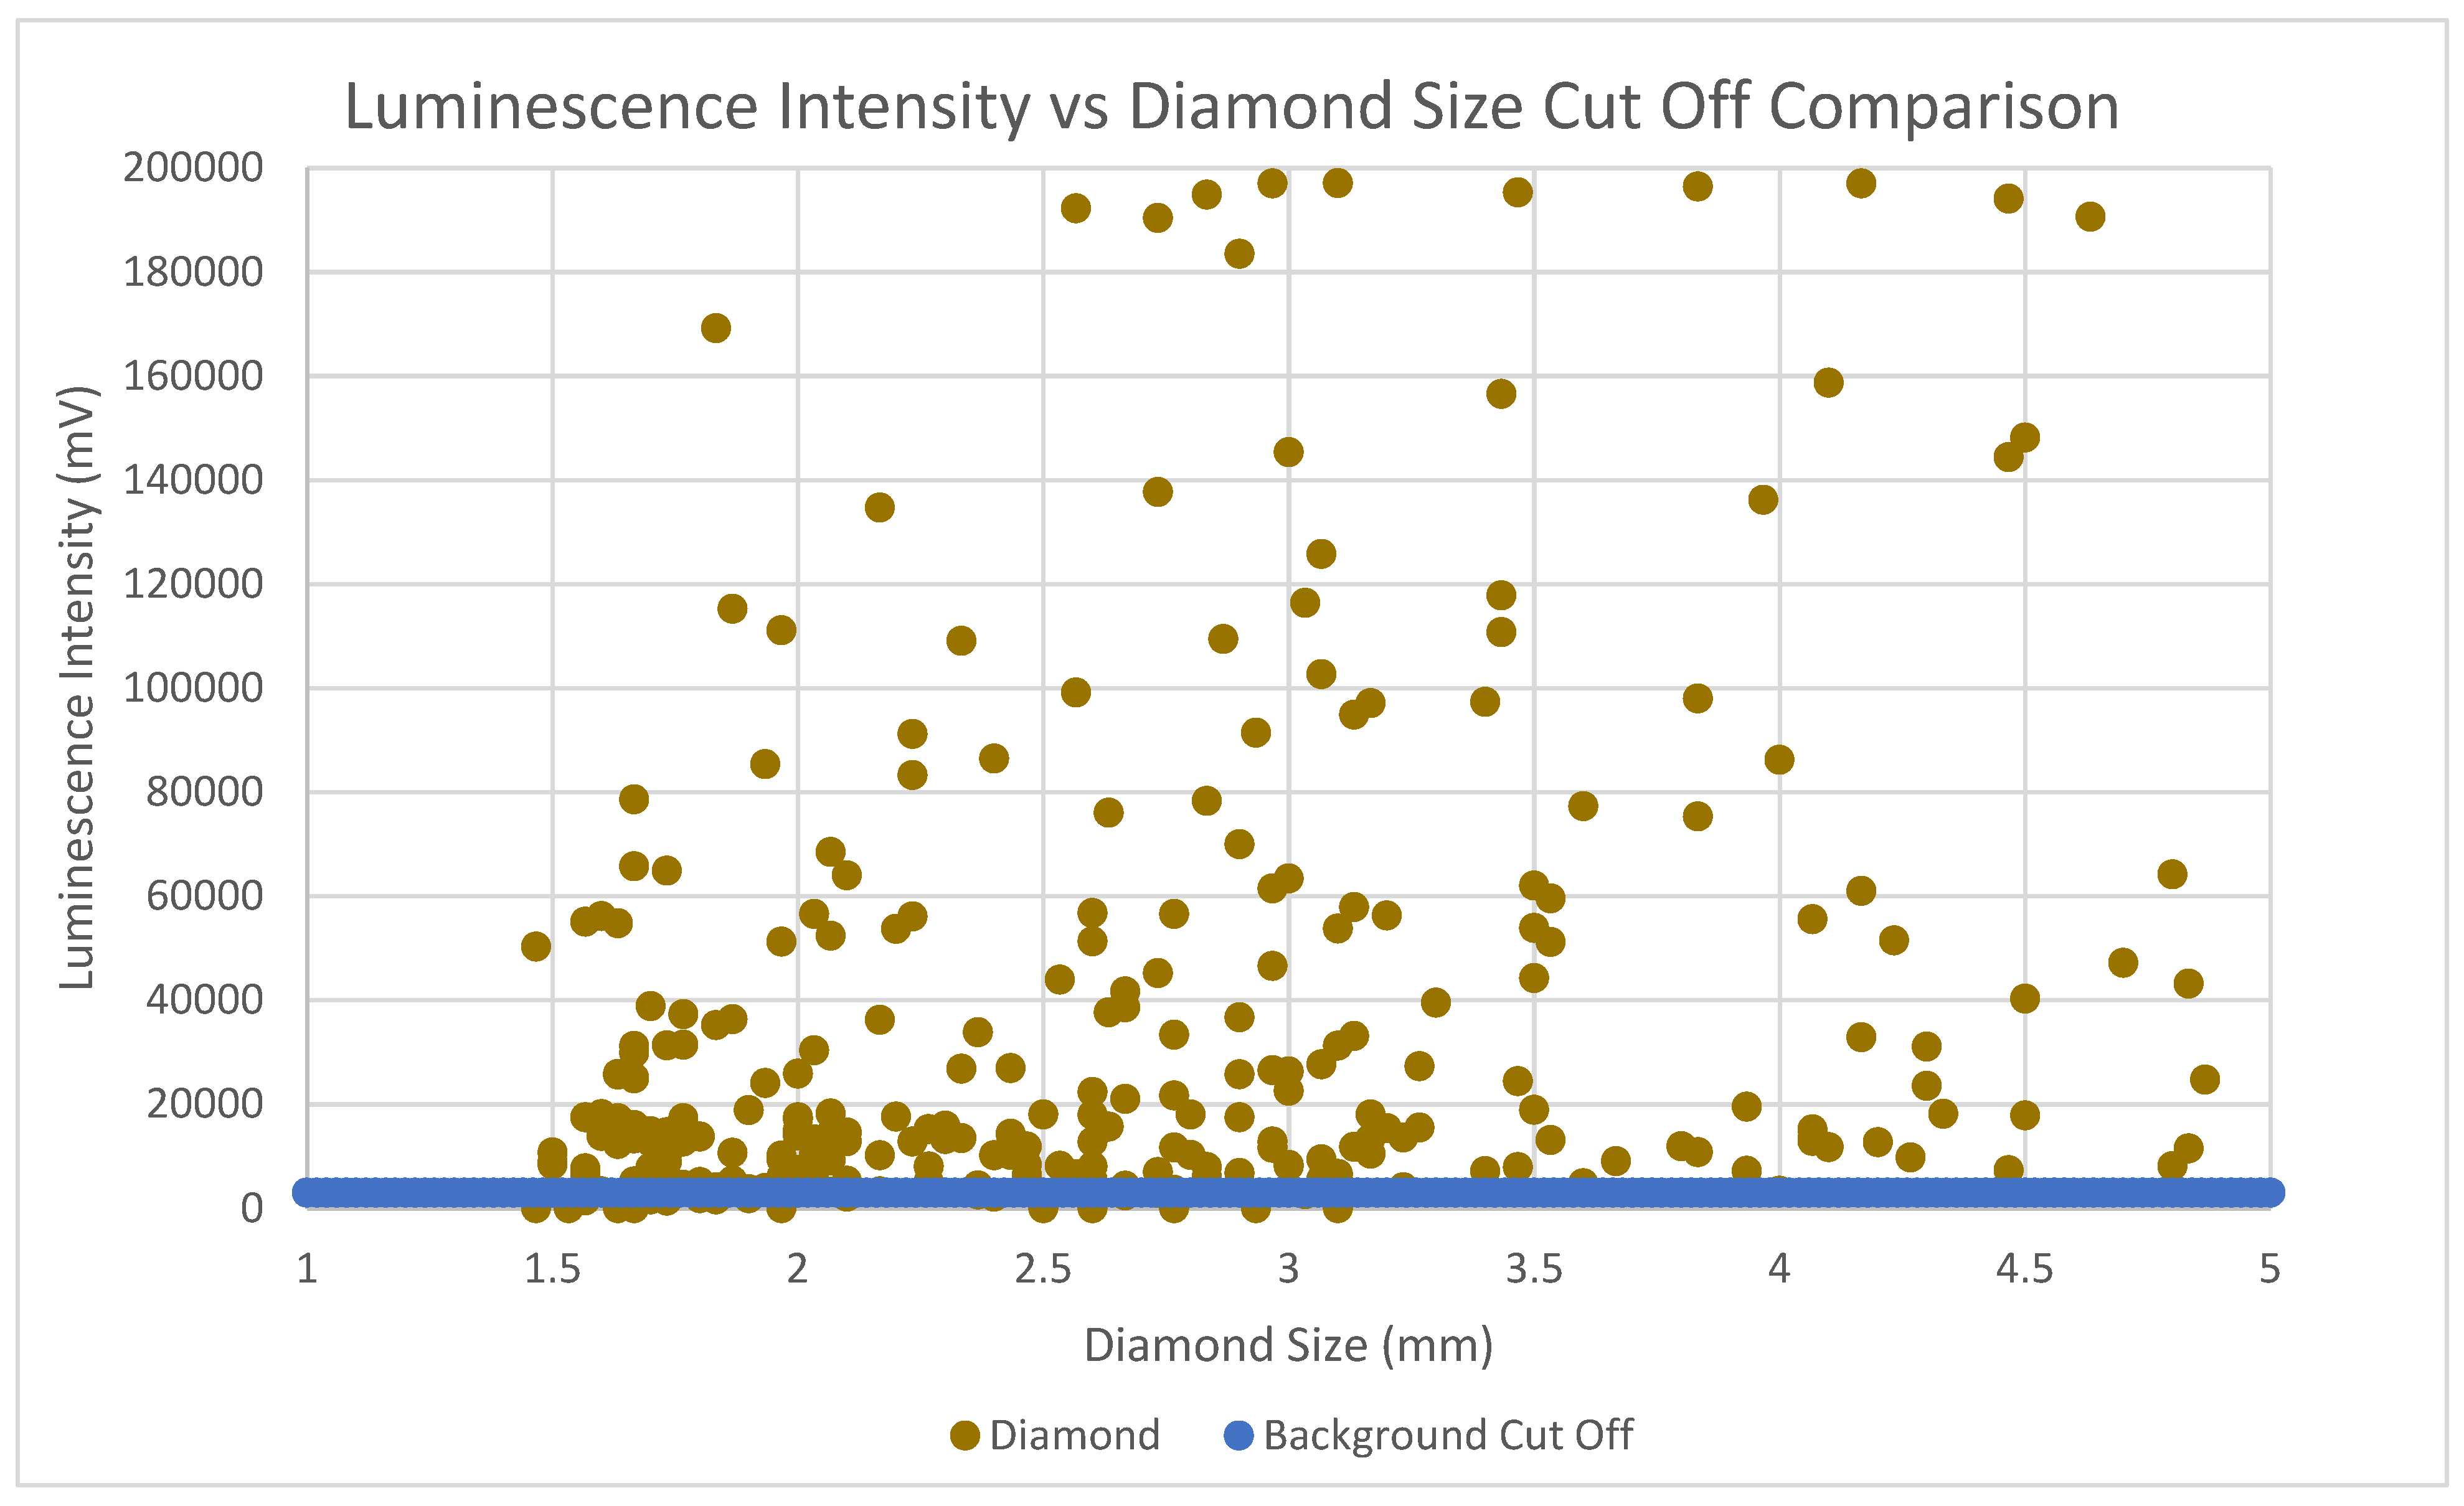
3.1. XRL Diamond Response

Table 1 provides a summary of the results of best subsets multiple regression between independent diamond characteristics classified as continuous variables and the XRL response dependent variables, along with the corresponding adjusted R-squared values. There appears to be no clear or consistent relationship between fluorescence; weight; the diamond’s X, Y, and Z dimensions; the percentage of 1aA arrangements; nitrogen content; and various aspects of luminescence—such as intensity and duration for both fast and slow centers. Overall, the correlations amongst these variables are weak, and no significant connections were found when considering multiple diamond characteristics together.
Type 2 diamonds, by definition, contain no nitrogen. The analysis of categorical variables and response variables reveals that these diamonds typically exhibit minimal luminescence across all measured variables—peak, fast center, and slow center intensities (Figure 1, Figure 2 and Figure 3).
Notably, Type 2 diamonds are also closely linked with opaque transparency (Figure 4) and low clarity (Figure 5) in this population, both of which further diminish luminescence response. Interestingly, Type 2 diamonds that do have a luminescence response tend to display low-intensity but long-duration luminescence (Figure 6), suggesting the presence of unmeasured defects.
Higher levels of diamond transparency and clarity correspond with increased luminescence intensity across peak, fast center, and slow center measurements. This relationship likely stems from the role of inclusions in obstructing the dispersion of X-ray-stimulated light, as inclusions do not emit light themselves, reducing overall emission. Additionally, lower transparency impedes light dispersion within the diamond, diminishing luminescence. These findings are consistent with Raman & Jayaraman’s observations that physical characteristics affecting light refraction can affect the measured luminescence response [7]. Furthermore, the trends identified in Type 2 diamonds, which exhibit minimal luminescence, are consistent with observations from other studies [6,30].
The interplay between different diamond characteristics and the corresponding luminescence response suggests the presence of independent and possibly synergistic or competitive effects that are not fully accounted for by the variables in this study. This idea is supported by the ongoing variations observed across all analyses, even in the presence of identified trends.

3.2. XRT Diamond Response

Table 2 summarizes the best subsets multiple regression analysis, showing the adjusted R-squared values and the relationship between continuous independent diamond characteristics and the XRT response dependent variables. No correlation was found between X-ray transmission response and diamond attributes such as color, shape, brown color, transparency, clarity, or stress level. However, weight and size (represented by the Z dimension) were found to be highly correlated with, and therefore predictive of, the X-ray transmission response of diamonds in this study. This aligns with theoretical expectations, as factors like material density, thickness, and atomic composition influence X-ray attenuation. Due to multicollinearity, the X and Y measurements were excluded from the regression model. As a result, the Z measurement serves as a representative indicator of the overall diamond’s size.
There is an absence of a discernible relationship between categorical variables (color, shape, brown color, transparency, clarity, and stress level) and the continuous XRT variables (mean x-value, mean y-value, x-value standard deviation, y-value standard deviation, and number of pixels). An example of this can be seen in Figure 7 and Figure 8. This lack of correlation is expected, considering that XRT detection primarily relies on factors influencing X-ray attenuation, such as material density, thickness, and atomic density. None of these critical factors is encapsulated in the measurements of the analyzed categorical variables.

3.3. Diamond and Gangue XRL Response Comparison

All gangue particles failed to exhibit any detectable luminescence signal when stimulated by X-rays, theoretically highlighting a complete contrast between diamonds and these minerals. A minimum luminescence signal strength of 3000 millivolts is utilized when assessing theoretical diamond recovery in this study. This is carried out to factor in surface reflections and ambient light interference that can result in unintended ejections when operating an XRL sorter.
This cutoff is illustrated in relation to the luminescence intensity response in Figure 9, with the corresponding responses detailed by diamond type in Table 3. It should be noted that the diamond sizes presented in Figure 9 represent average measurements calculated from the X, Y, and Z variables. Based on this graph, 95% of Type 1 diamonds will be recovered while only 77% of Type 2 diamonds will be recovered at this threshold (Table 3).

3.4. Diamond and Gangue XRT Response Comparison

Figure 10 visually demonstrates an X-ray transmission density curve for sorting diamonds from gangue minerals based on the responses gathered from particles examined in this study. The actual separation is calculated based on whether the number of pixels generated by an individual particle below the black separation curve meets a certain percentage threshold. Table 4 tabulates the number of particles of each mineral type at different pixel percentage thresholds where all diamonds were detected and were able to be recovered. The results demonstrate that a high contrast between the diamonds and the gangue particles can be achieved without compromising diamond recovery. However, to avoid potential mechanical ineffectiveness that could result in diamonds not being recovered, a threshold of 5%–20% may be used, meaning that gangue misplacement into the product stream is unavoidable to a certain degree.

3.5. Sorter Performance Comparison

A performance comparison was conducted between two diamond recovery sorters: the Flowsort TSXR 2/19 W XRL continuous excitation sorter, an established technology from 1985, and the TOMRA COM XRT 300 Final Recovery sorter, a modern system from 2021. Both sorters processed material at 400 kg/hour, with settings calibrated for the ore deposit. The XRL uses a chute-style water-assisted feed method with a mechanical flap separator, while the XRT employs a belt feed system and a pressurized air ejector.
A bulk sample of 400 tonnes of kimberlite ore was crushed and then concentrated via dense medium separation. From this, 2.3 tonnes were tested using the XRT sorter, and 5.7 tonnes were tested using the XRL sorter. The bulk sampling program spanned several years and involved varying amounts of samples available for each testing phase, resulting in differences in the quantities of the material tested by the XRT and XRL units. The results from a pilot scale comparison are summarized in Table 5. The XRT sorter created 0.28 kg of concentrate per gram of diamonds recovered, while the XRL sorter yielded 0.37 kg. The overall selectivity of the sorting process is influenced by incidental particle identification and separation and can result in increased amounts of gangue in the concentrate.
The XRT produced 0.52 g of material per activation of the separation mechanism compared to the 0.87 g produced by the XRL. This efficiency metric is particularly affected by incidental particle separations. According to Robben [5], the flap-style ejection mechanism used by the XRL sorter tends to result in more incidental separations than the air ejectors used by the XRT. This effect is demonstrated by the fact that of the ejections carried out by the XRT, 92% of them were incidental compared to 85% for the XRL. The percentage of incidentally ejected particles is close despite the fact that the XRT ejection mechanism fired nearly twice as much (13) for every diamond recovered compared to the XRL (7). Based on the luminescence response profile of the gangue, the XRL sorter should have no incidental identifications, but it is likely that reflected light and external light leakage caused false activations of the ejection mechanism.
For this population of diamonds, the XRT achieved a diamond recovery rate of 99%, while the XRL achieved 91%. This aligns with previous observations that particles with low to no luminescence are not easily recoverable by the XRL. In contrast, the XRT’s recovery rate, although high, may be slightly diminished by missed particle separations, likely due to mechanical handling issues. For instance, a round diamond may roll on the presentation/transport belt, causing a timing mismatch with the pneumatic ejection.

4. Conclusions

The following conclusions can be drawn from this research:
Sensor-based sorting technology using XRT is a feasible alternative to XRL for diamond recovery within the 2–4 mm size range. Although XRT is unsuitable for wet conditions in this size range, it demonstrates significant advantages, including high consistency, greater control, and increased flexibility in adjustments.
The impact of diamond characteristics on XRT and XRL responses emphasizes the importance of application-specific considerations when selecting a sorting technology. XRL sorting is vulnerable to variations in diamond clarity, transparency, and nitrogen content, potentially leading to inconsistent and unpredictable detection outcomes. In contrast, XRT technology provides more reliable and predictable detection, resulting in superior diamond recovery rates. However, XRT may be susceptible to greater gangue mineral misclassification.
A comparative evaluation of sorting performance within a single diamond deposit revealed that XRT technology recovered a higher proportion of diamonds compared to XRL—99% versus 91%. Additionally, the concentrate produced by XRT contained less gangue material, a result attributed to the differences in the specific ejection mechanisms employed by each unit. The XRT concentrate contained 3.45% diamonds versus 2.63% of the XRL concentrate. Consequently, the choice between XRT and XRL technologies should be guided by a thorough assessment of ore body geology, mineral constituents, and diamond characteristics, as these factors collectively determine the contrast between diamonds and the surrounding ore—a critical factor in the effectiveness of the sorting technology for any given application.
The authors recommend that research building upon this study should focus on assessing additional crystal lattice defects in future research. These defects should be evaluated with XRL response using the methodology established in this study. Furthermore, it is recommended to evaluate the responses of additional gangue minerals, such as zircons, to the XRL and XRT response.

Author Contributions

Conceptualization, S.A.; Methodology, Z.L., S.A. and L.H.; Software, A.D.F.; Validation, A.D.F.; Formal analysis, Z.L. and A.D.F.; Investigation, Z.L.; Resources, S.A., L.H., A.D.F., C.R., Y.K. and R.T.; Data curation, Z.L. and R.T.; Writing—original draft, Z.L. and S.A.; Writing—review & editing, S.A., L.H., A.D.F. and C.R.; Supervision, S.A.; Project administration, S.A. and Y.K. All authors have read and agreed to the published version of the manuscript.

Funding

This research received no external funding.

Data Availability Statement

The original contributions presented in this study are included in the article. Further inquiries can be directed to the corresponding author.

Conflicts of Interest

Author Chris Robben was employed by the Six-S GmbH, Author Yuri Kinakin was employed by the Rio Tinto Exploration Canada Inc., Author Russell Tjossem was employed by the TOMRA Sorting Inc. The remaining authors declare that the research was conducted in the absence of any commercial or financial relationships that could be construed as a potential conflict of interest.

References

  1. Wotruba, H. Sensor Sorting Technology—Is the Minerals Industry Missing a Chance? 2015. Available online: https://www.semanticscholar.org/paper/Sensor-sorting-technology-is-the-minerals-industry-Wotrnba/a5077e93683462c42c74f602fcba3d85df385d82 (accessed on 4 January 2024).
  2. Wotruba, H.; Robben, C. Sensor-based ore sorting in 2020. At-Automatisierungstechnik 2020, 68, 231–238. [Google Scholar] [CrossRef]
  3. Loftus, W.K.B.; Simpson, H.S.; King, M.J. Recovery Plant Practice at DeBeers Consolidated; The Southern African Institute of Mining and Metallurgy: Johannesburg, South Africa, 1970; Available online: https://pdf4pro.com/view/recovery-plant-practice-atdebeers-consolidated-2a191a.html (accessed on 20 December 2023).
  4. Robben, C.; Wotruba, H. Sensor-Based Ore Sorting Technology in Mining—Past, Present and Future. Minerals 2019, 9, 523. [Google Scholar] [CrossRef]
  5. Robben, C. Characteristics of Sensor-Based Sorting Technology and Implementation in Mining; Rheinisch-Westfälische Technische Hochschule: Aachen, Germany, 2013. [Google Scholar]
  6. Mironov, V.P.; Emelyanova, A.S.; Shabalin, S.A.; Bubyr, E.V.; Kazakov, L.V.; Martynovich, E.F. X-ray luminescence in diamonds and its application in industry. AIP Conf. Proc. 2021, 2392, 020010. [Google Scholar] [CrossRef]
  7. Raman, C.V.; Jayaraman, A. The luminescence of diamond and its relation to crystal structure. Proc. Indian Acad. Sci. Sect. A 1950, 32, 65. [Google Scholar] [CrossRef]
  8. Dean, P.J. Bound Excitons and Donor-Acceptor Pairs in Natural and Synthetic Diamond. Phys. Rev. B 1965, 139, A588–A602. [Google Scholar] [CrossRef]
  9. Gaft, M.; Reisfeld, R.; Panczer, G. Modern Luminescence Spectroscopy of Minerals and Materials; Springer: Berlin/Heidelberg, Germany, 2005. [Google Scholar] [CrossRef]
  10. Lang, A.R.; Field, J.E. Internal Structure. In The Properties of Diamond; Academic Press: Cambridge, MA, USA, 1979; pp. 425–469. [Google Scholar]
  11. Zaitsev, A.M. Optical Properties of Diamond; Springer: Berlin/Heidelberg, Germany, 2001. [Google Scholar] [CrossRef]
  12. Chappell, M. Transmission—X-rays. In Principles of Medical Imaging for Engineers: From Signals to Images; Springer: Berlin/Heidelberg, Germany, 2019; pp. 9–18. [Google Scholar] [CrossRef]
  13. Rutherford, R.A.; Pullan, B.R.; Isherwood, I. X-ray energies for effective atomic number determination. Neuroradiology 1976, 11, 23–28. [Google Scholar] [CrossRef] [PubMed]
  14. Zabinsky, S.I.; Rehr, J.J.; Ankudinov, A.; Albers, R.C.; Eller, M.J. Multiple-scattering calculations of x-ray-absorption spectra. Phys. Rev. B Condens. Matter. 1995, 52, 2995–3009. [Google Scholar] [CrossRef] [PubMed]
  15. Veras, M.M.; Young, A.S.; Born, C.R.; Szewczuk, A.; Neto, A.C.B.; Petter, C.O.; Sampaio, C.H. Affinity of dual energy X-ray transmission sensors on minerals bearing heavy rare earth elements. Miner. Eng. 2020, 147, 106151. [Google Scholar] [CrossRef]
  16. Riedel, F.; Dehler, M. Recovery of unliberated diamonds by x-ray transmission sorting. In Proceedings of the Diamonds Source to Use Conference, SAIMM, Gaborone, Botswana, 1–3 March 2010. [Google Scholar]
  17. Neubert, K.; Wotruba, H. Investigations on the Detectability of Rare-Earth Minerals Using Dual-Energy X-ray Transmission Sorting. J. Sustain. Met. 2016, 3, 3–12. [Google Scholar] [CrossRef]
  18. Zhang, Y.; Yoon, N.; Holuszko, M.E. Assessment of Sortability Using a Dual-Energy X-ray Transmission System for Studied Sulphide Ore. Minerals 2021, 11, 490. [Google Scholar] [CrossRef]
  19. Sasman, F.; Deetlefs, B.; van der Westhuyzen, P. Application of diamond size frequency distribution and XRT technology at a large diamond producer. J. South. Afr. Inst. Min. Met. 2018, 118, 1–6. [Google Scholar] [CrossRef]
  20. Star–Orion South Diamond Project, Significant Proportions of Type IIa Diamonds Present at Star and Orion South. Star Diamonds. 4 March 2019. Available online: www.stardiamondcorp.com (accessed on 7 January 2024).
  21. GIA. GIA 4Cs Color D-to-Z. 2023. Available online: https://4cs.gia.edu/en-us/diamond-color/ (accessed on 5 January 2024).
  22. Saskatchewan Research Council. Rough Diamond Descriptions; An internal resource of the Saskatchewan Research Council (SRC); Saskatchewan Research Council: Saskatoon, SK, Canada, 2023. [Google Scholar]
  23. Dean, P.; Male, J. Some properties of the visible luminescence excited in diamond by irradiation in the fundamental absorption edge. J. Phys. Chem. Solids 1964, 25, 1369–1383. [Google Scholar] [CrossRef]
  24. Vladimirov, E. X-Ray Luminescence Sorters: A Series of Lectures; Bourevestnik: Saint-Petersburg, Russia, 2012. [Google Scholar]
  25. Breeding, C.M.; Shigley, J.E. The “Type” Classification System of Diamonds and Its Importance in Gemology. Gems Gemol. 2009, 45, 96–111. [Google Scholar] [CrossRef]
  26. Hastie, T.; Tibshirani, R.; Friedman, J. The Elements of Statistical Learning; Springer Science & Business Media: New York, NY, USA, 2009. [Google Scholar]
  27. Hosmer, D.W.; Jovanovic, B.; Lemeshow, S. Best Subsets Logistic Regression. Biometrics 1989, 45, 1265–1270. [Google Scholar] [CrossRef]
  28. King, J.E. Running a Best-Subsets Logistic Regression: An Alternative to Stepwise Methods. Educ. Psychol. Meas. 2003, 63, 392–403. [Google Scholar] [CrossRef]
  29. Pennsylvania State University. Best Subsets Regression, Adjusted R-Sq, Mallows Cp. 2018. Available online: https://online.stat.psu.edu/stat462/node/197/ (accessed on 8 October 2023).
  30. Vyatkin, S.V.; Kriulina, G.Y.; Garanin, V.K.; Koshchug, D.G.; Vasilyev, E.A. The Effect of Aggregation of Impurity Nitrogen on Diamond X-Ray Luminescence. Mosc. Univ. Geol. Bull. 2018, 73, 161–165. [Google Scholar] [CrossRef]
Figure 1. Box plot comparison of variation in luminescence intensity by diamond type.
Minerals 15 00773 g001
Figure 2. Box plot comparison of variation in fast center luminescence intensity by diamond type.
Minerals 15 00773 g002
Figure 3. Box plot comparison of variation in slow center luminescence intensity by diamond type.
Minerals 15 00773 g003
Figure 4. Box plot comparison of variation in luminescence intensity by diamond transparency.
Minerals 15 00773 g004
Figure 5. Box plot comparison of variation in luminescence intensity by diamond clarity.
Minerals 15 00773 g005
Figure 6. Box plot comparison of variation in slow center luminescence duration in microseconds (μs) by diamond type.
Minerals 15 00773 g006
Figure 7. Box plot comparison of variation in mean X value by diamond transparency.
Minerals 15 00773 g007
Figure 8. Box plot comparison of variation in mean X value by diamond clarity.
Minerals 15 00773 g008
Figure 9. Type 2 diamond luminescence intensity response comparison.
Minerals 15 00773 g009
Figure 10. Total combined pixel distribution of all particle types on an XRT high-energy (x) vs. low-energy (y) plot. Top: Without diamond pixels. Bottom: With diamond pixels.
Minerals 15 00773 g010
Table 1. XRL continuous variable response summary.
Luminescence IntensityFast Center Luminescence IntensityFast Center Decay TimeSlow Center Luminescence IntensitySlow Center Decay Time
FluorescenceXXXXX
WeightX
X Dimension Measurement (mm)
Y Dimension Measurement (mm)XXX
Z Dimension Measurement (mm)
Percentage of 1aA CentersXXXXX
Nitrogen Content (ppm)XX
Adj R2%41.5033.5736.1947.7122.41
Table 2. XRT continuous variable response summary.
Average Low-Intensity ValueAverage High-Intensity ValueStandard Deviation of the Low-Intensity ValuesStandard Deviation of the High-Intensity ValuesNumber of Pixels
Fluorescence
WeightXXXXX
X Dimension Measurement (mm)
Y Dimension Measurement (mm)
Z Dimension Measurement (mm)XXXX
Percentage of 1aA Centers
Nitrogen Content (ppm)
Adj R2%87.4288.2387.0586.1196.27
Table 3. XRL calculated diamond recovery data.
Type 1Type 2
Diamond Count21288
% Recoverable by XRL95%77%
Table 4. Percentage of gangue particles classified as diamond density at a given threshold by XRT. * Only 8 of the 23 mica flakes were detected.
% of Particles Classified as Diamond Density at a Given Threshold
MaterialTotal Number of Particles5% Low-Density Pixels10% Low-Density Pixels20% Low-Density Pixels30% Low-Density Pixels
Kimberlite210%0%0%0%
Mudstone2319%0%0%0%
Serpentinised Olivine3213%3%0%0%
Ilmenite2990%66%3%0%
Garnets300%0%0%0%
Clinopyroxenes240%0%0%0%
Mica Schist180%0%0%0%
Mica Flakes23 *0%0%0%0%
Table 5. Kilograms of concentrate created per gram of diamonds ejected by the XRT and XRL sorters.
kg of Concentrate Created Per g of Diamonds Separatedg of Material Separated per Fire of the Separation% of Incidental Separations# of Fires of the Separation Mechanism per DiamondDiamond Recovery
XRL0.370.8785%791%
XRT0.280.5292%1399%
Disclaimer/Publisher’s Note: The statements, opinions and data contained in all publications are solely those of the individual author(s) and contributor(s) and not of MDPI and/or the editor(s). MDPI and/or the editor(s) disclaim responsibility for any injury to people or property resulting from any ideas, methods, instructions or products referred to in the content.

