
Controls on Stylolite Formation in the Upper Cretaceous Kometan Formation, Zagros Foreland Basin, Iraqi Kurdistan

 , ,
, ,  , and
, and
Abstract
1. Introduction
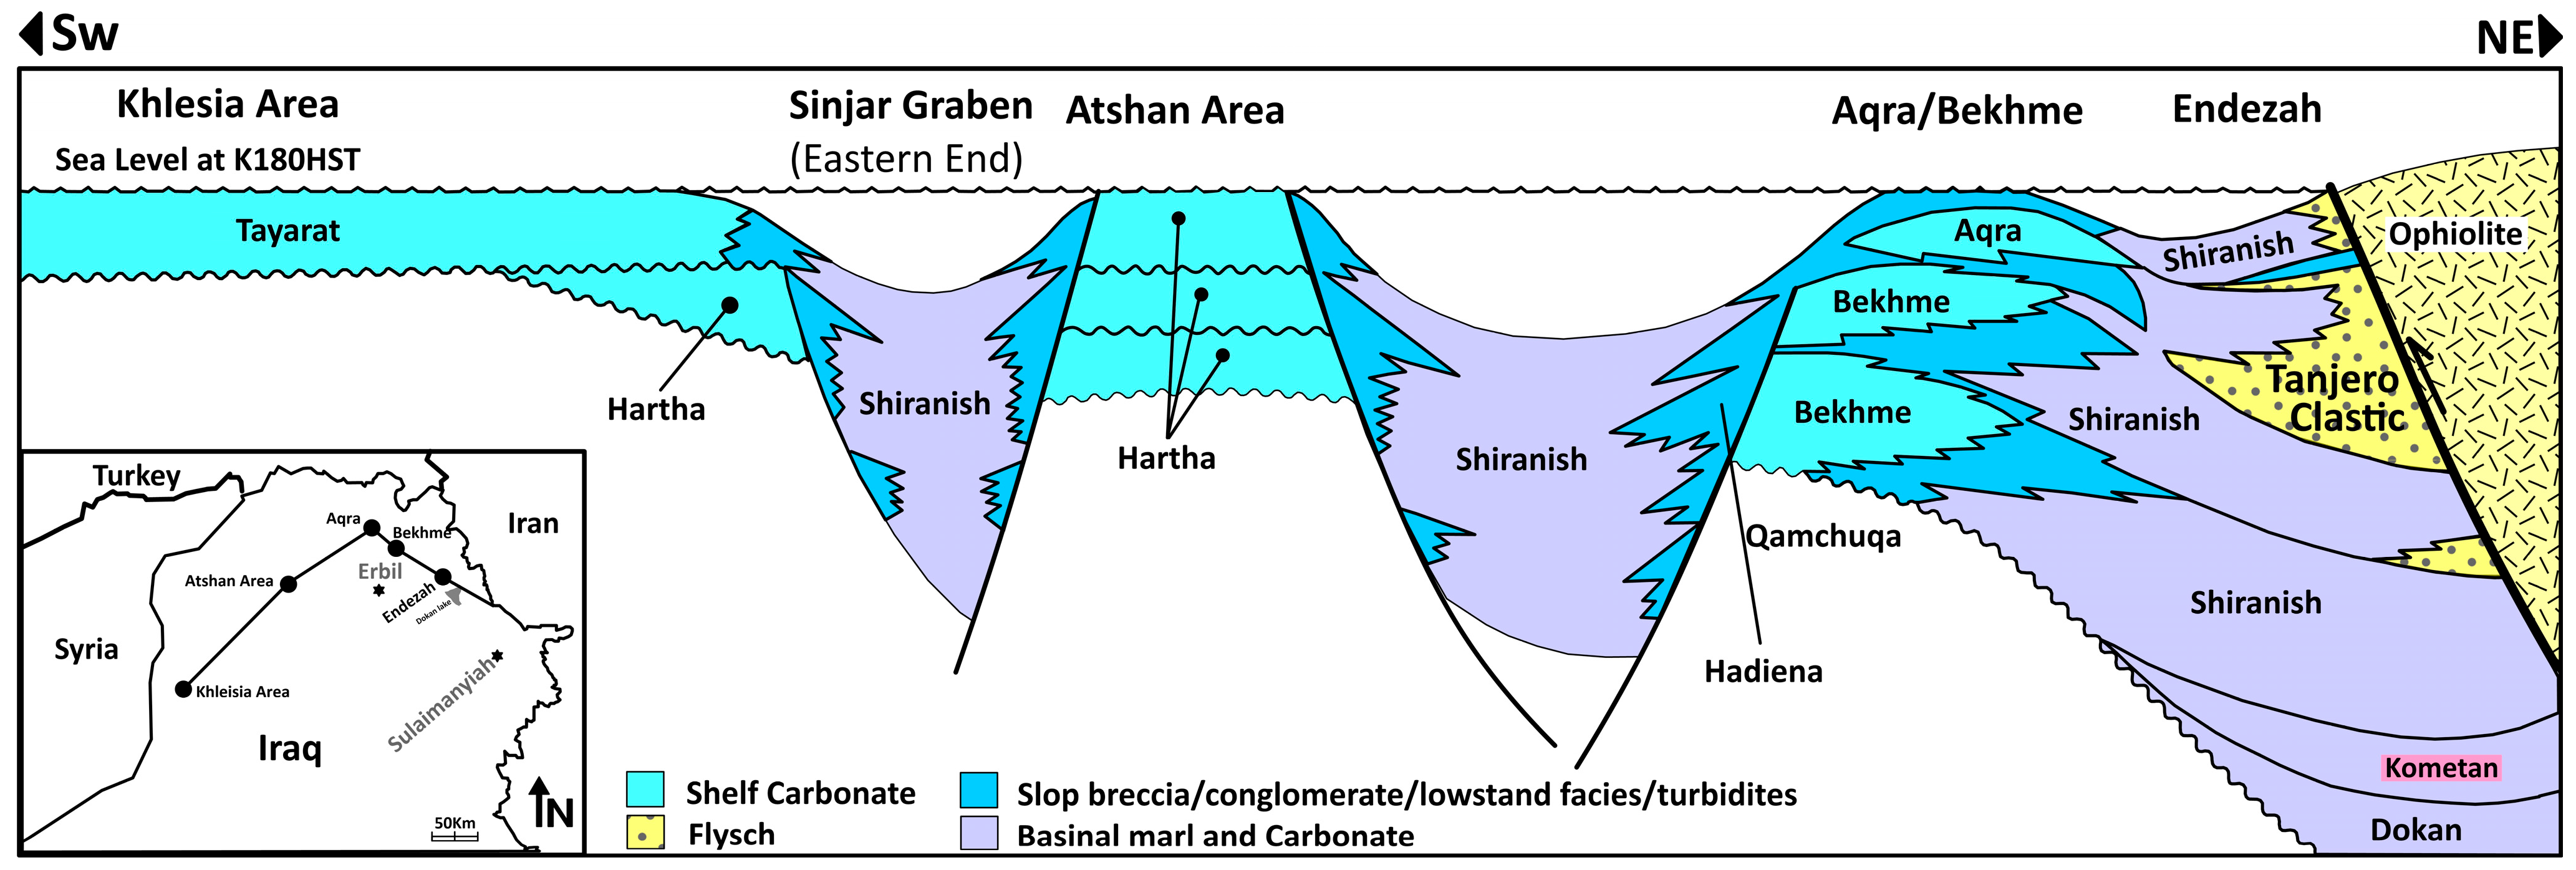
2. Geological Setting
3. Materials and Methods
4. Results
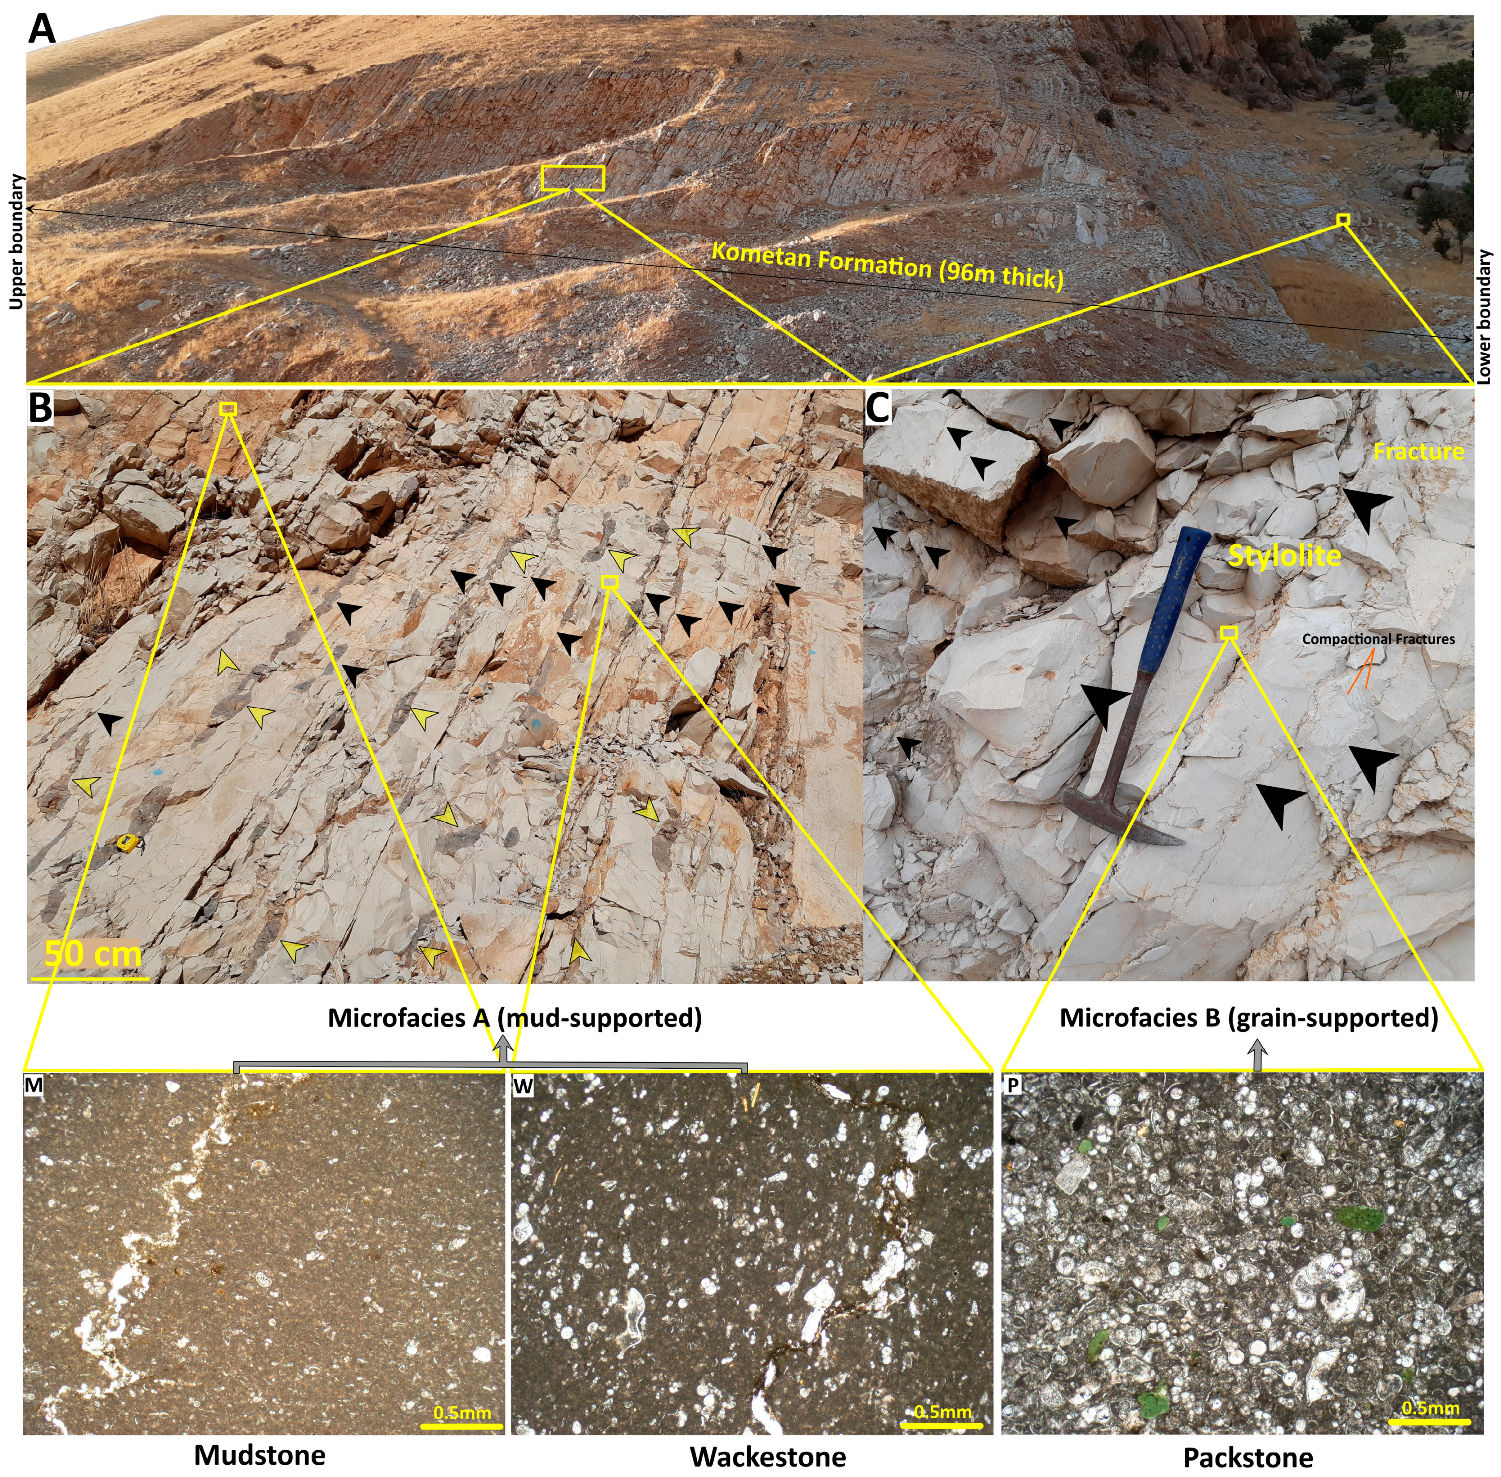
4.1. Microfacies
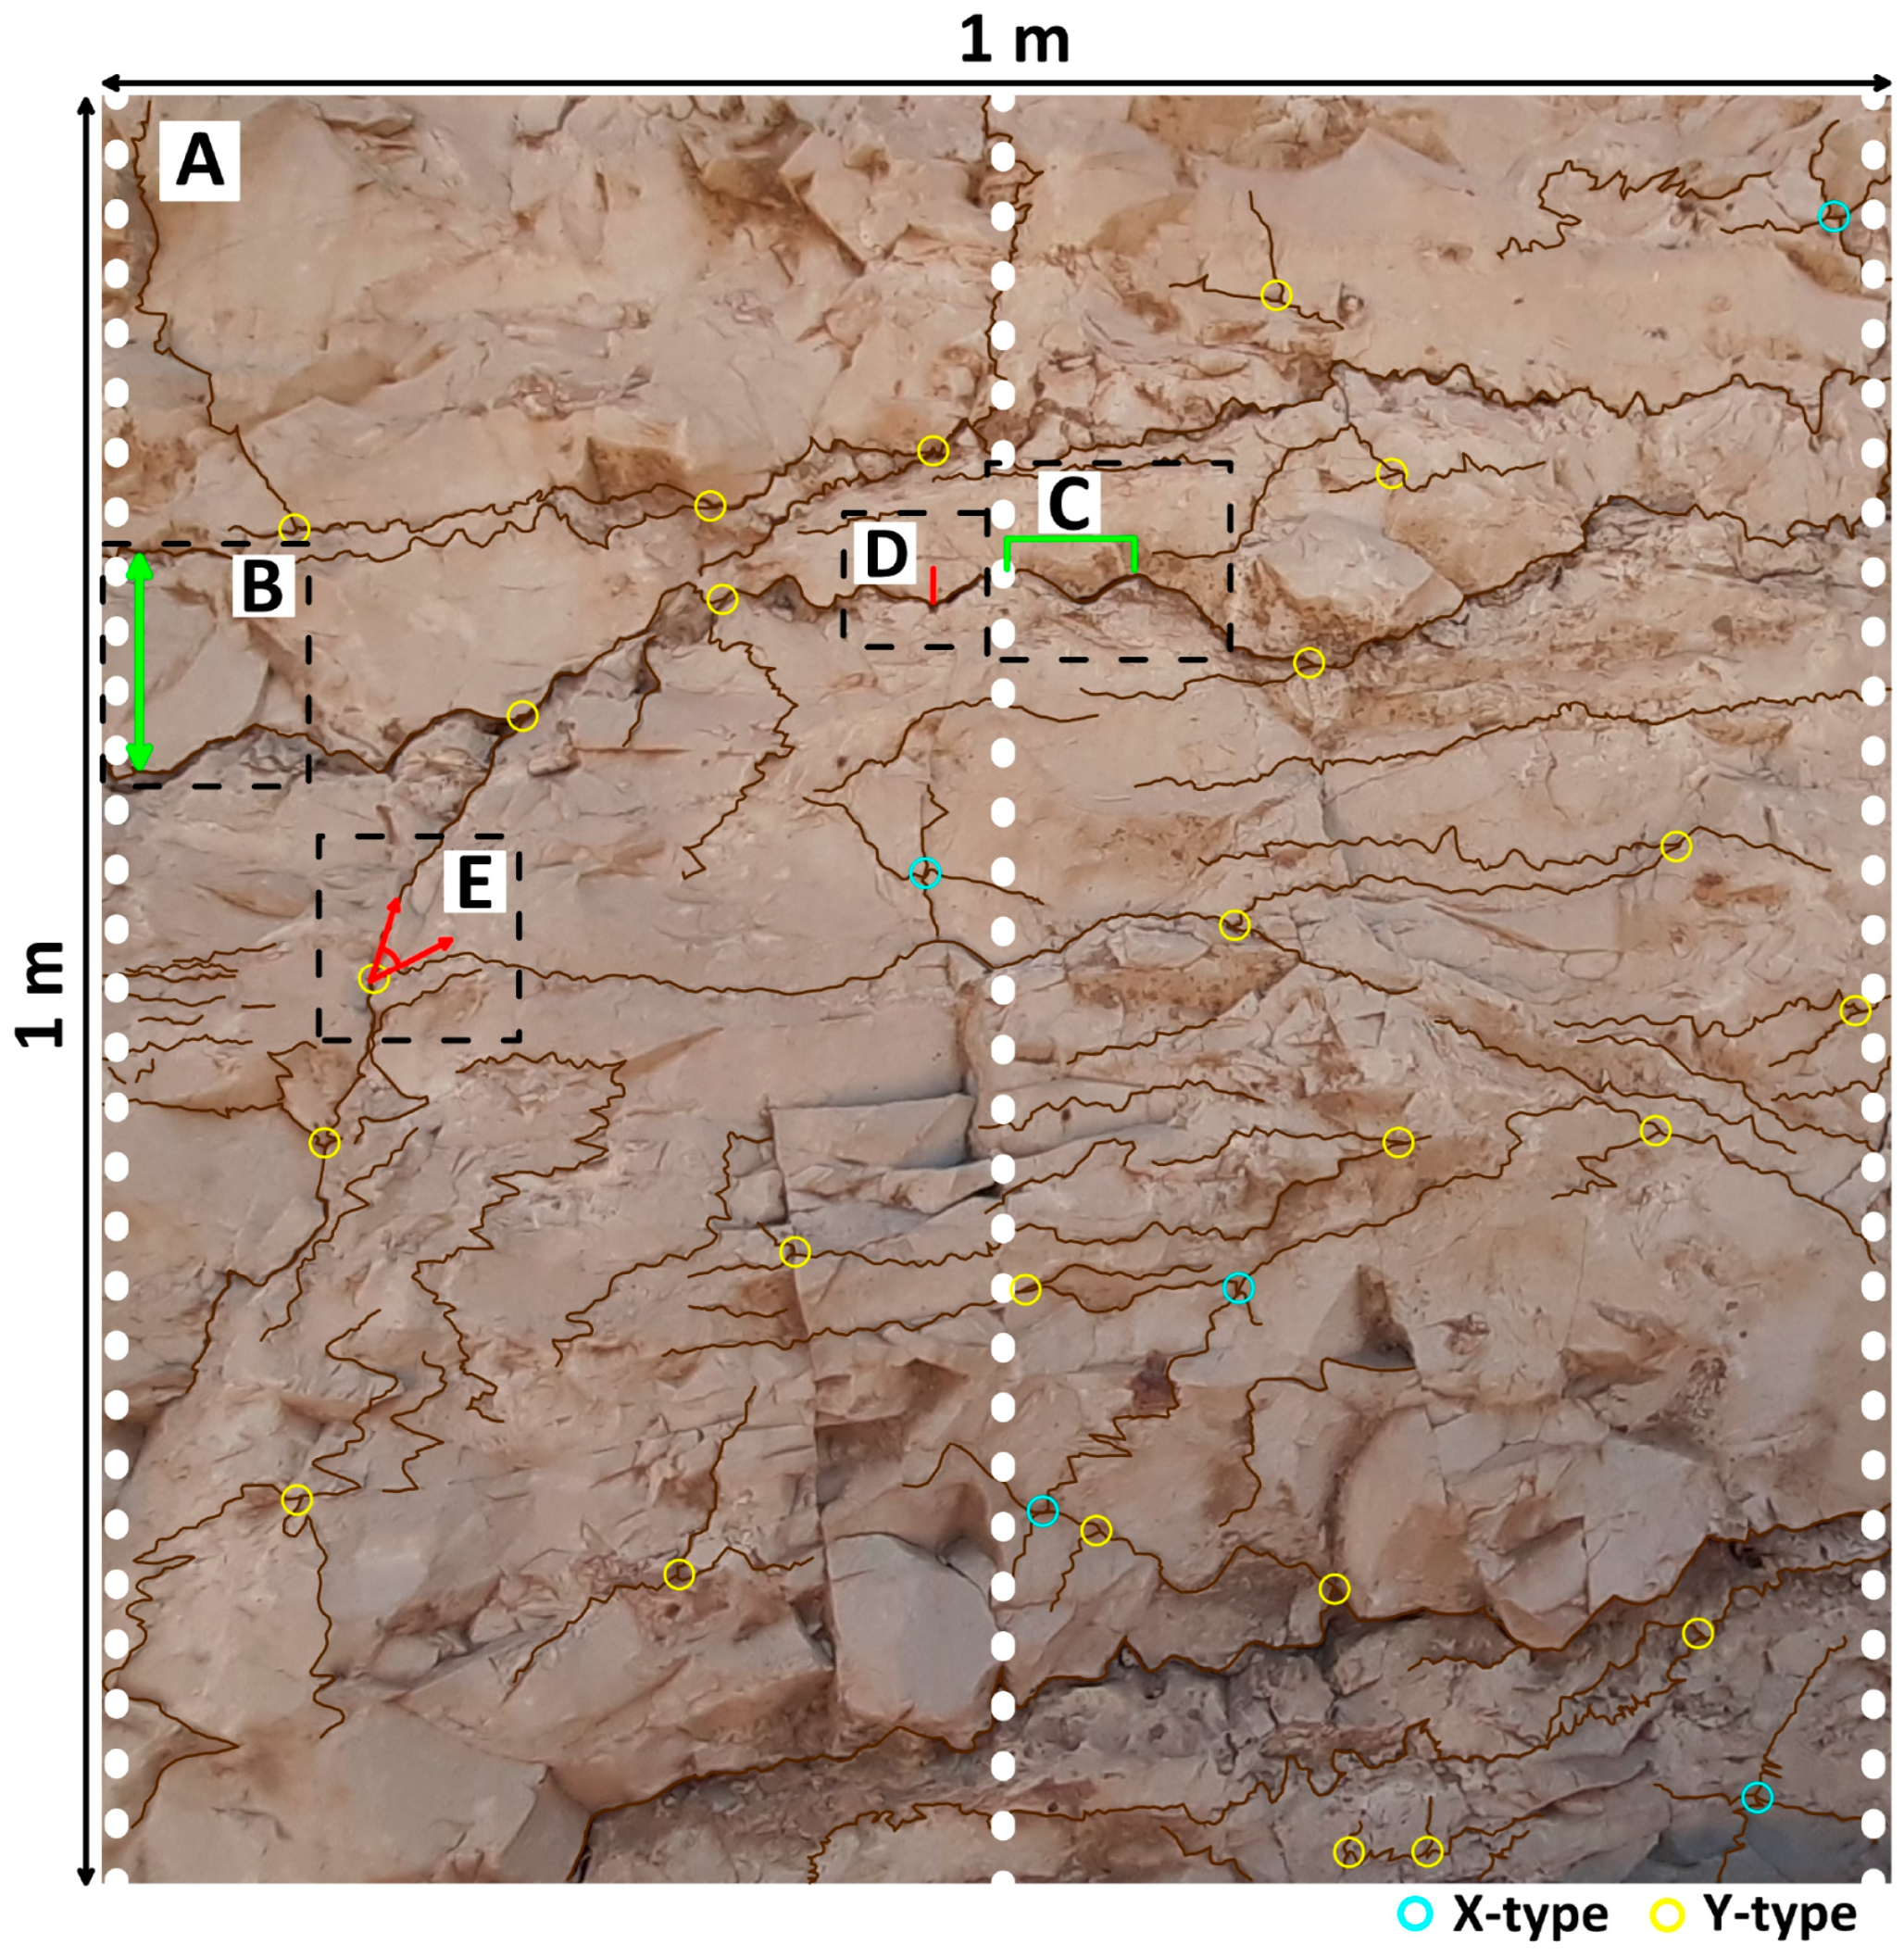
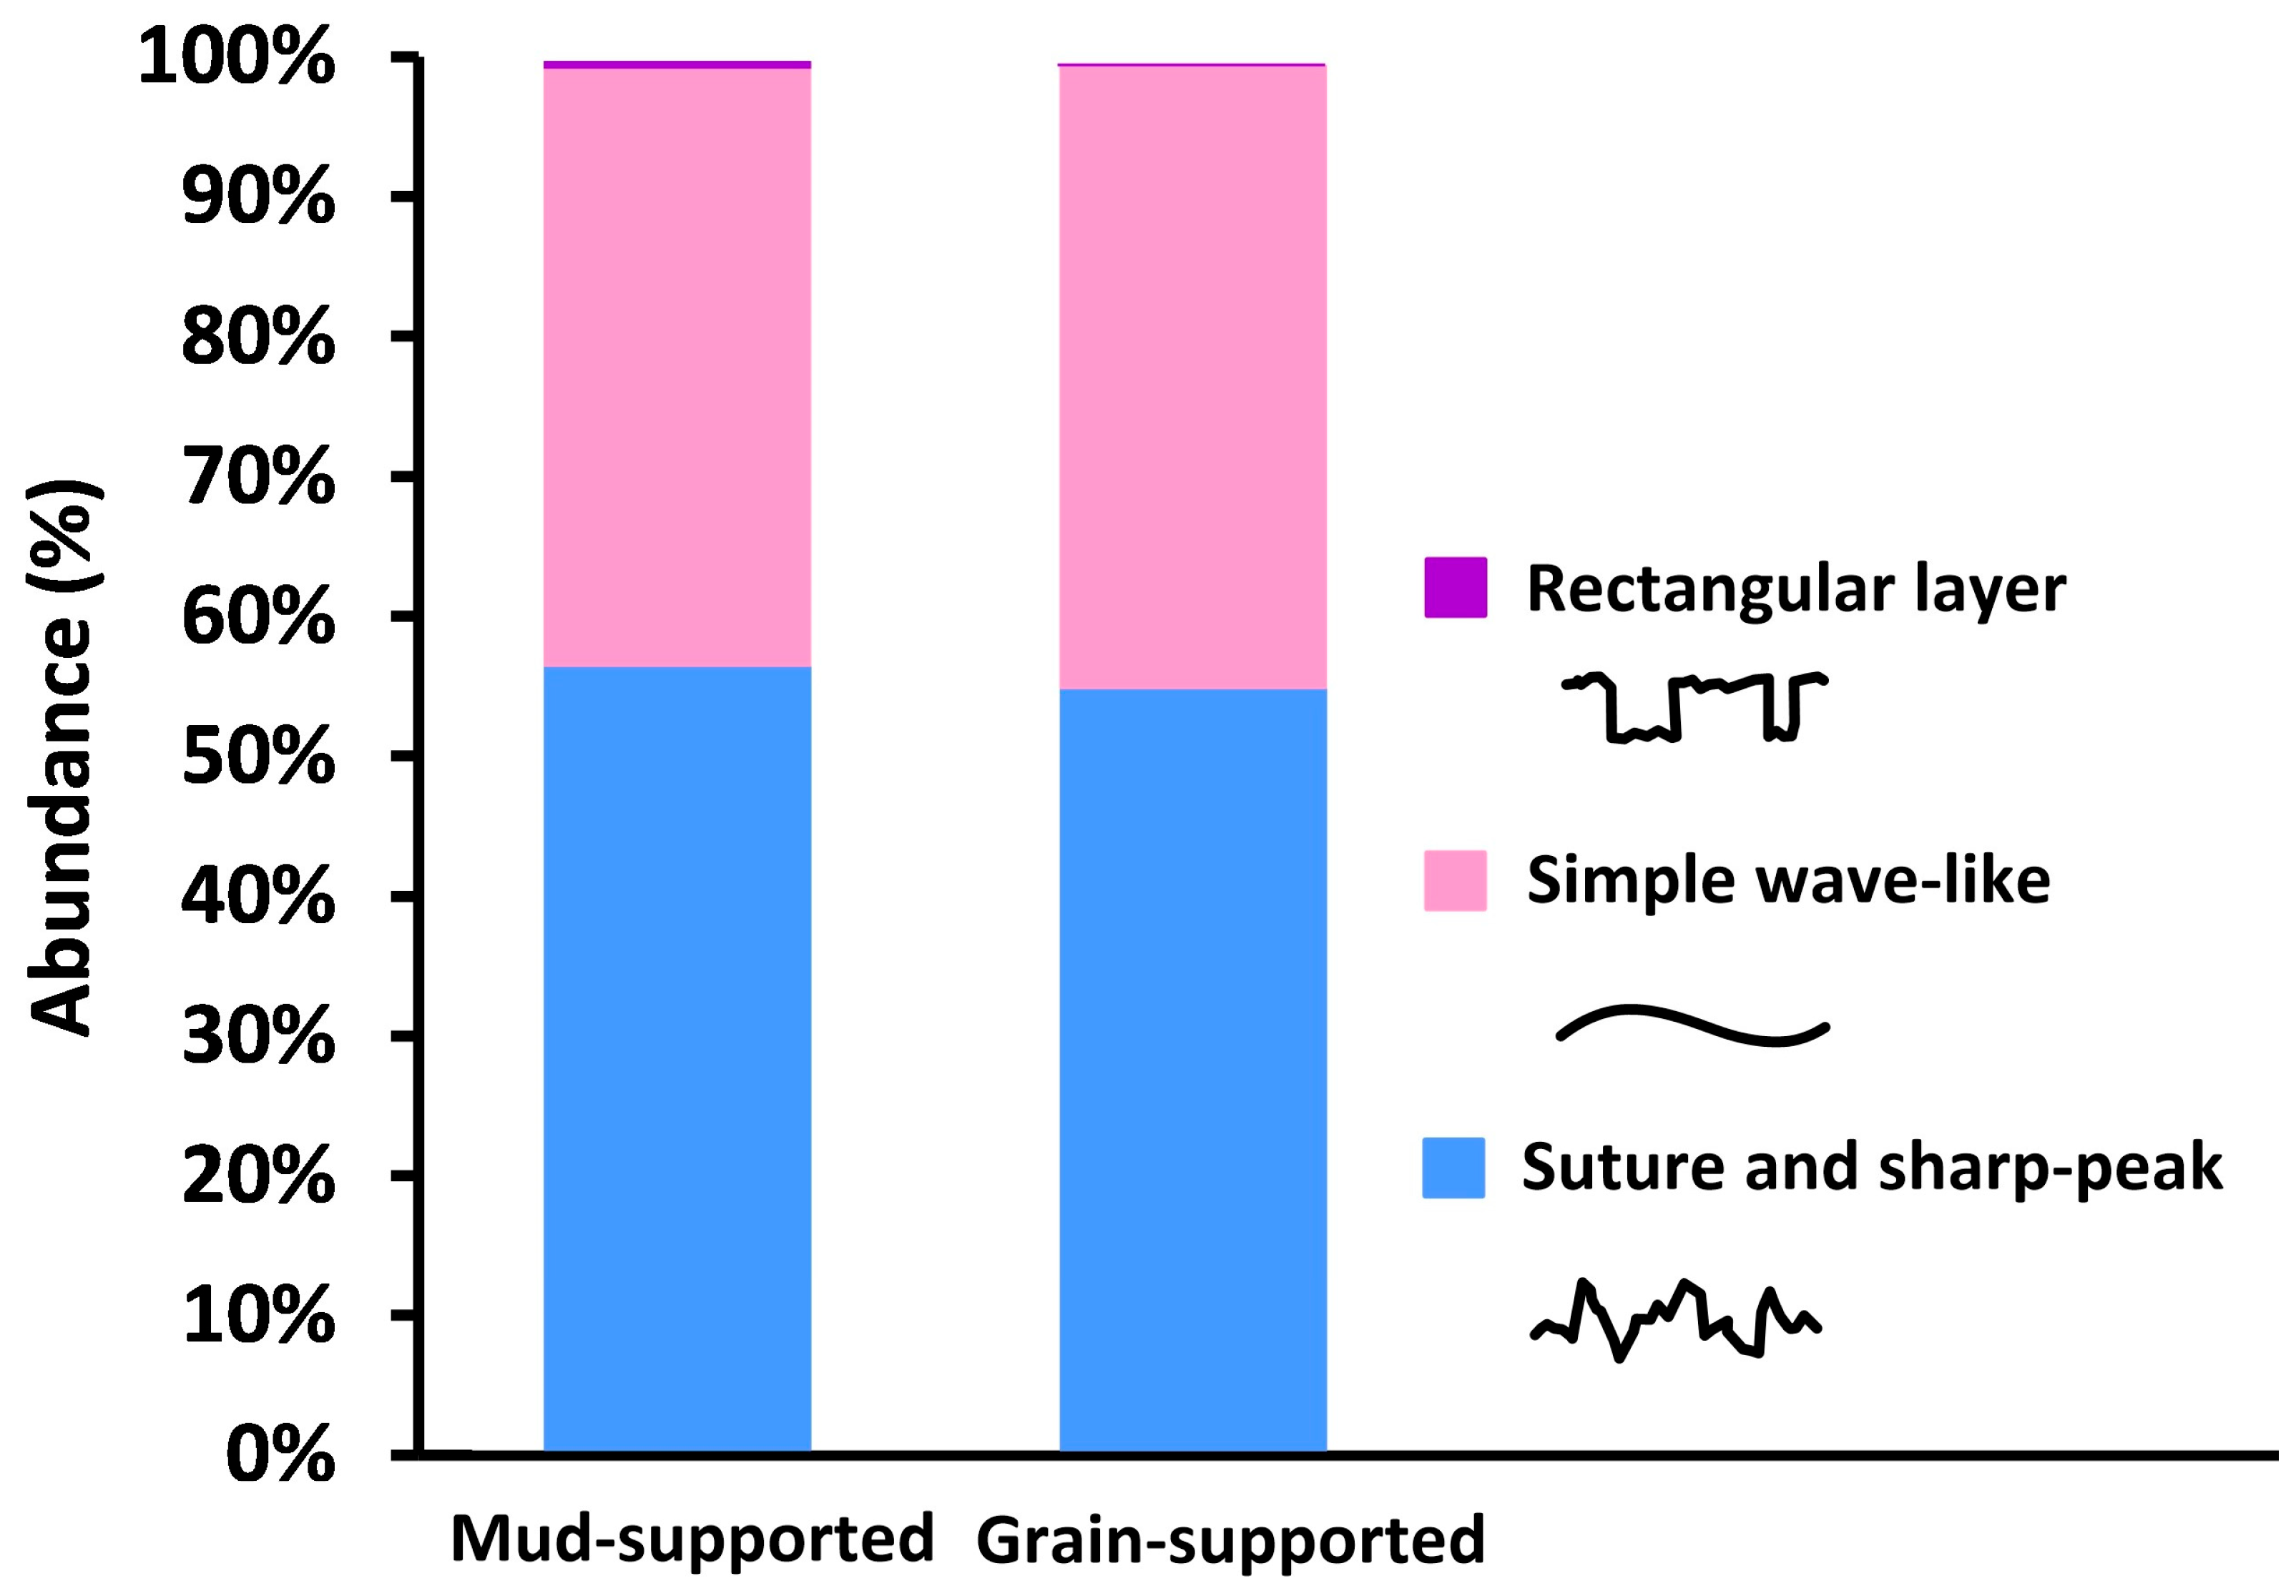
4.2. Stylolite Morphology and Distribution
4.3. Present Day Stylolitic Porosity
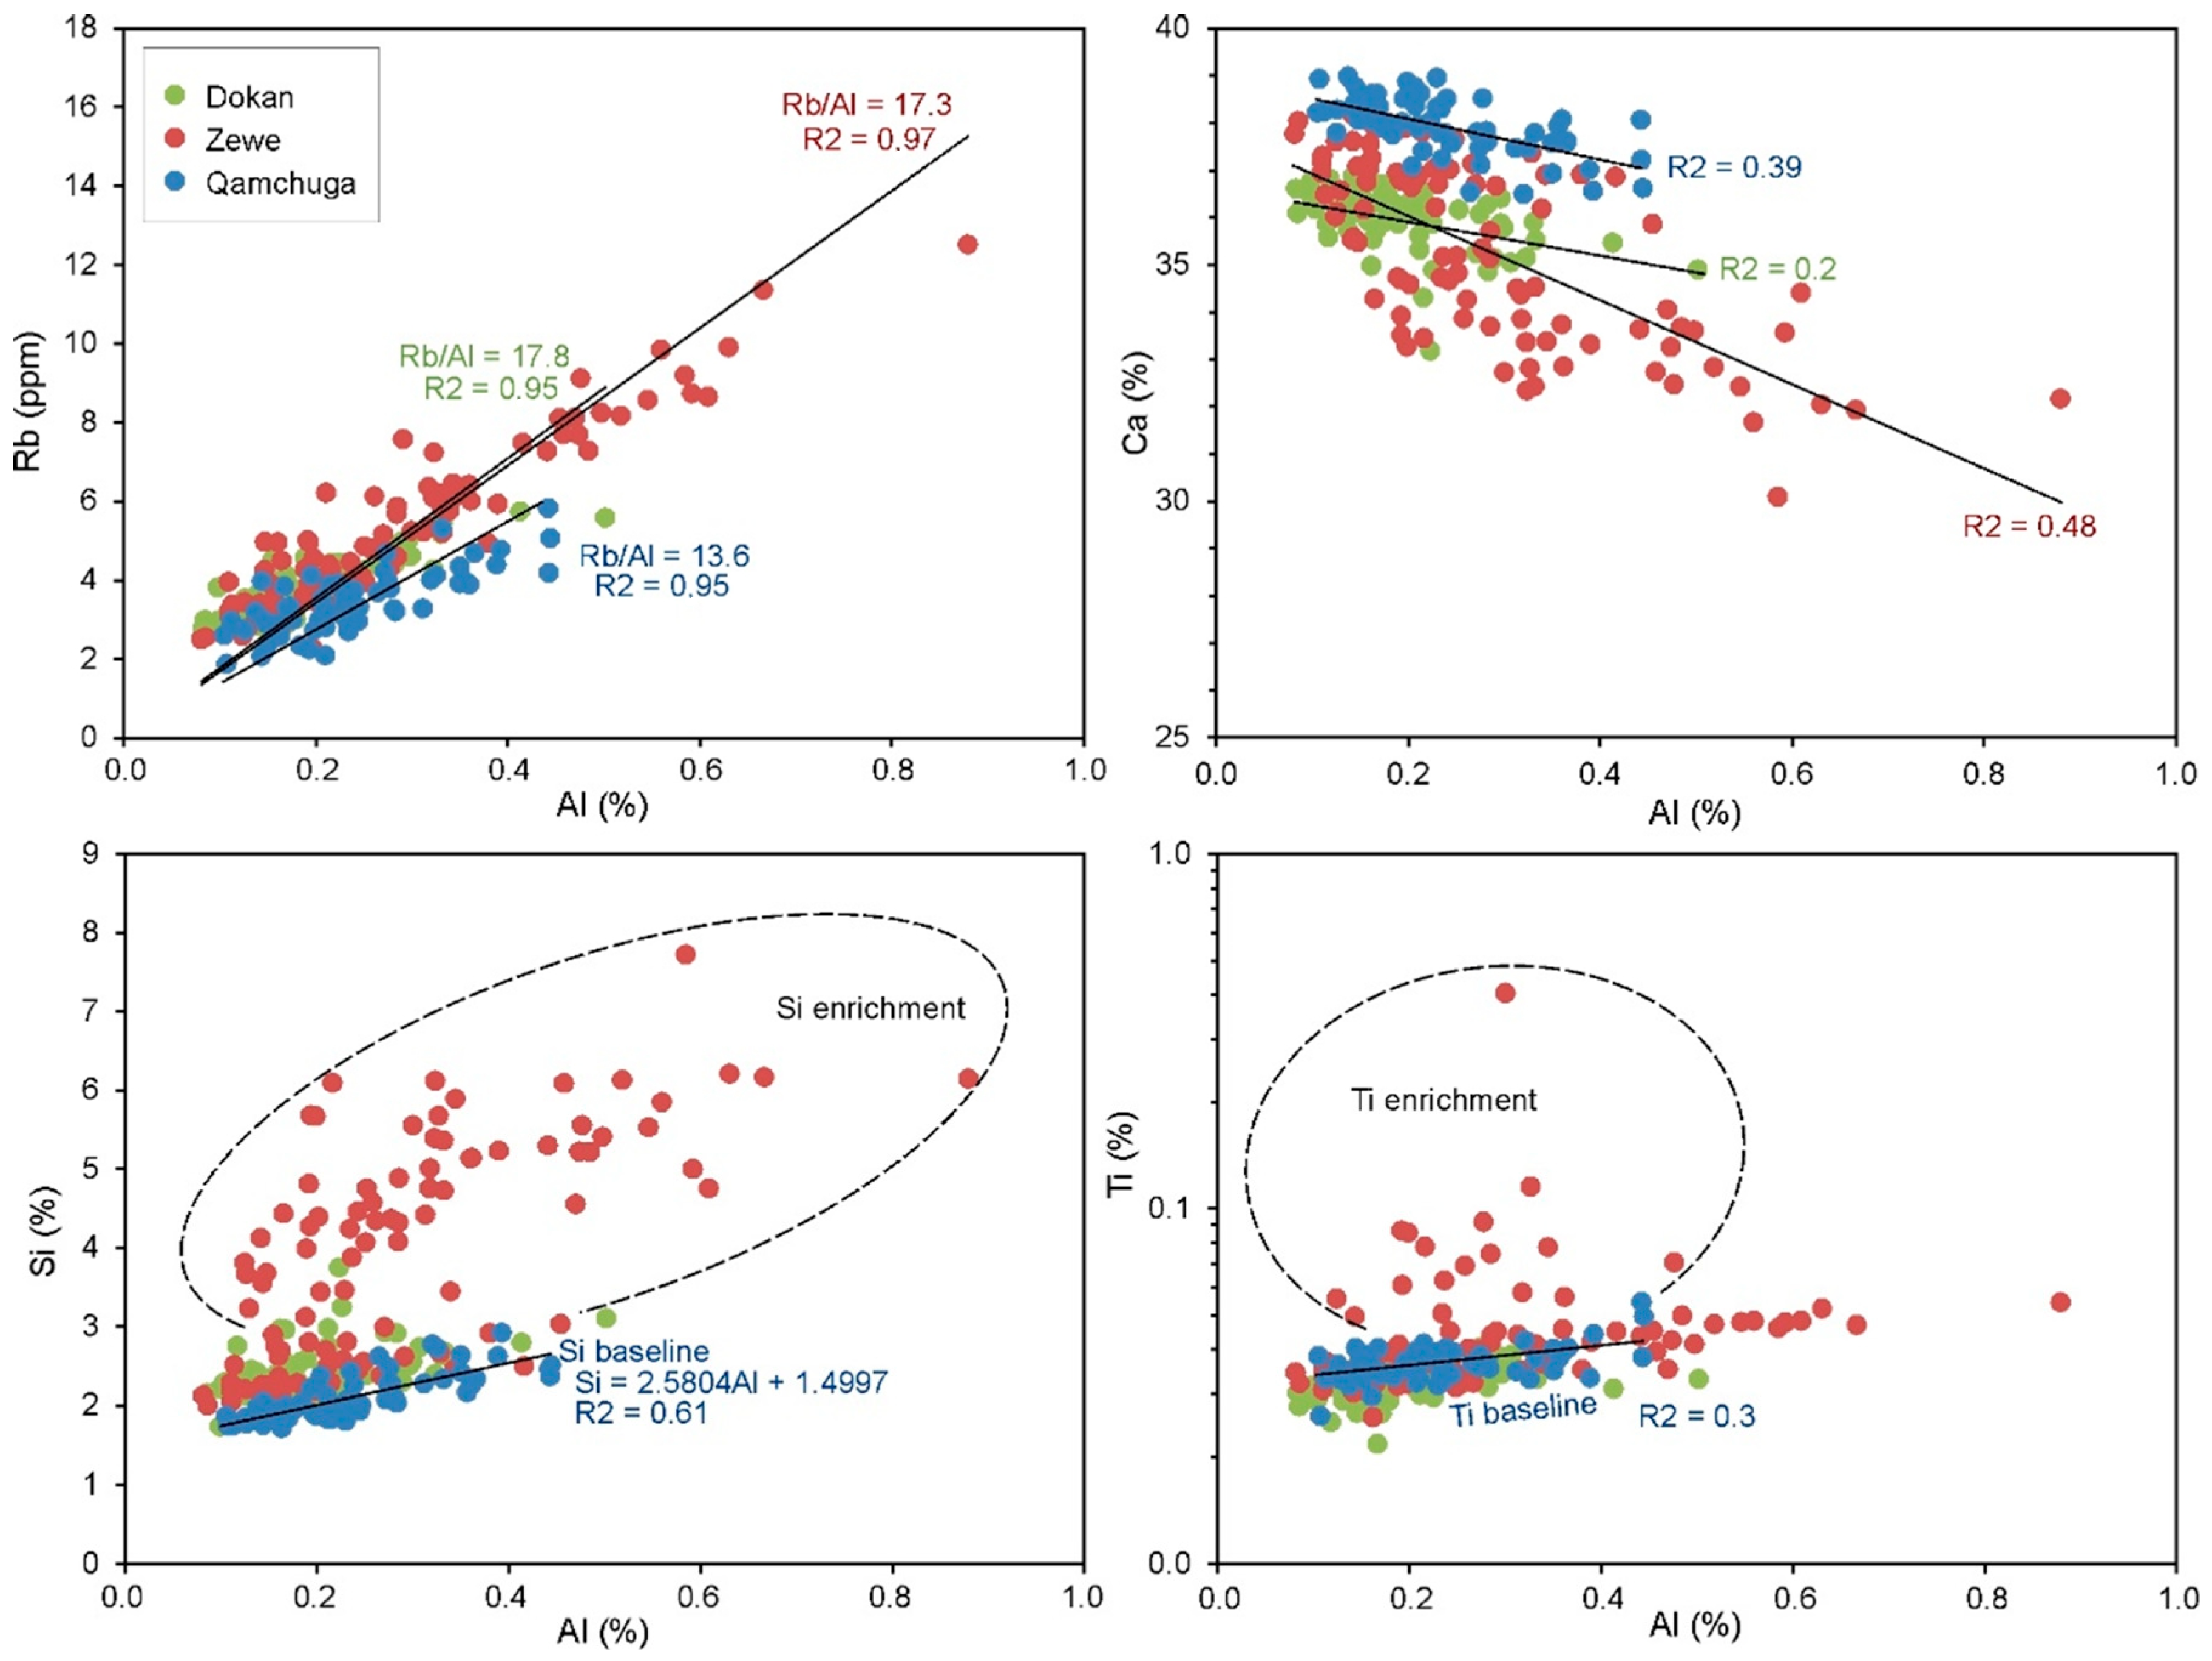
4.4. Elemental Geochemistry
5. Discussion
5.1. Relationships Between Stylolite Morphology and Host Rock
5.2. Stylolite Distribution
5.3. Impact of Stylolite on Porosity
6. Conclusions
Supplementary Materials
Author Contributions
Funding
Data Availability Statement
Acknowledgments
Conflicts of Interest
References
- Lucia, F.J.; Kerans, C.; Jennings, J.W., Jr. Carbonate reservoir characterization. J. Pet. Technol. 2003, 55, 70–72. [Google Scholar] [CrossRef]
- Ehrenberg, S.N.; Nadeau, P.H. Sandstone vs. carbonate petroleum reservoirs: A global perspective on porosity-depth and porosity-permeability relationships. AAPG Bull. 2005, 89, 435–445. [Google Scholar] [CrossRef]
- Ehrenberg, S.N. Porosity destruction in carbonate platforms. J. Pet. Geol. 2006, 29, 41–52. [Google Scholar] [CrossRef]
- Harris, P.M. Delineating and quantifying depositional facies patterns in carbonate reservoirs: Insight from modern analogs. AAPG Bull. 2010, 94, 61–86. [Google Scholar] [CrossRef]
- Palermo, D.; Aigner, T.; Nardon, S.; Blendinger, W. Three-dimensional facies modeling of carbonate sand bodies: Outcrop analog study in an epicontinental basin (Triassic, southwest Germany). AAPG Bull. 2010, 94, 475–512. [Google Scholar] [CrossRef]
- Ronchi, P.; Di Giulio, A.; Ceriani, A.; Scotti, P. Contrasting fluid events giving rise to apparently similar diagenetic products; late-stage dolomite cements from the Southern Alps and central Apennines, Italy. Geol. Soc. Lond. Spec. Publ. 2010, 329, 397–413. [Google Scholar] [CrossRef]
- Rashid, F.; Glover, P.W.J.; Lorinczi, P.; Collier, R.; Lawrence, J. Porosity and permeability of tight carbonate reservoir rocks in the north of Iraq. J. Pet. Sci. Eng. 2015, 133, 147–161. [Google Scholar] [CrossRef]
- Ebner, M.; Koehn, D.; Toussaint, R.; Renard, F. The influence of rock heterogeneity on the scaling properties of simulated and natural stylolites. J. Struct. Geol. 2009, 31, 72–82. [Google Scholar] [CrossRef]
- Vandeginste, V.; John, C.M. Diagenetic implications of stylolitization in pelagic carbonates, Canterbury Basin, offshore New Zealand. J. Sediment. Res. 2013, 83, 226–240. [Google Scholar] [CrossRef]
- Koehn, D.; Ebner, M.; Renard, F.; Toussaint, R.; Passchier, C.W. Modelling of stylolite geometries and stress scaling. Earth Planet. Sci. Lett. 2012, 341, 104–113. [Google Scholar]
- Ben-Itzhak, L.L.; Aharonov, E.; Karcz, Z.; Kaduri, M.; Toussaint, R. Sedimentary stylolite networks and connectivity in limestone: Large-scale field observations and implications for structure evolution. J. Struct. Geol. 2014, 63, 106–123. [Google Scholar] [CrossRef]
- Humphrey, E.; Gomez-Rivas, E.; Neilson, J.; Martín-Martín, J.D.; Healy, D.; Yao, S.; Bons, P.D. Quantitative analysis of stylolite networks in different platform carbonate facies. Mar. Pet. Geol. 2020, 114, 104203. [Google Scholar] [CrossRef]
- Paganoni, M.; Al Harthi, A.; Morad, D.; Morad, S.; Ceriani, A.; Mansurbeg, H.; Al Suwaidi, A.; Al-Aasm, I.S.; Ehrenberg, S.N.; Sirat, M. Impact of stylolitization on diagenesis of a Lower Cretaceous carbonate reservoir from a giant oilfield, Abu Dhabi, United Arab Emirates. Sediment. Geol. 2016, 335, 70–92. [Google Scholar] [CrossRef]
- Martín-Martín, J.D.; Gomez-Rivas, E.; Gómez-Gras, D.; Travé, A.; Ameneiro, R.; Koehn, D.; Bons, P.D. Activation of stylolites as conduits for overpressured fluid flow in dolomitized platform carbonates. Geol. Soc. Lond. Spec. Publ. 2018, 459, 157–176. [Google Scholar] [CrossRef]
- Heap, M.; Reuschlé, T.; Baud, P.; Renard, F.; Iezzi, G. The permeability of stylolite-bearing limestone. J. Struct. Geol. 2018, 116, 81–93. [Google Scholar] [CrossRef]
- Toussaint, R.; Aharonov, E.; Koehn, D.; Gratier, J.P.; Ebner, M.; Baud, P.; Rolland, A.; Renard, F. Stylolites: A review. J. Struct. Geol. 2018, 114, 163–195. [Google Scholar] [CrossRef]
- Bruna, P.O.; Lavenu, A.P.; Matonti, C.; Bertotti, G. Are stylolites fluid-flow efficient features? J. Struct. Geol. 2019, 125, 270–277. [Google Scholar] [CrossRef]
- Humphrey, E.; Gomez-Rivas, E.; Koehn, D.; Bons, P.D.; Neilson, J.; Martín-Martín, J.D.; Schoenherr, J. Stylolite-controlled diagenesis of a mudstone carbonate reservoir: A case study from the Zechstein_2_Carbonate (Central European Basin, NW Germany). Mar. Pet. Geol. 2019, 109, 88–107. [Google Scholar] [CrossRef]
- Gomez-Rivas, E.; Martín-Martín, J.D.; Bons, P.D.; Koehn, D.; Griera, A.; Travé, A.; Llorens, M.G.; Humphrey, E.; Neilson, J. Stylolites and stylolite networks as primary controls on the geometry and distribution of carbonate diagenetic alterations. Mar. Pet. Geol. 2022, 136, 105444. [Google Scholar] [CrossRef]
- Burgess, C.J.; Peter, C.K. Formation, distribution, and prediction of stylolites as permeability barriers in the Thamama Group, Abu Dhabi. In Proceedings of the Middle East Oil Technical Conference and Exhibition, Bahrain, 11–14 March 1985; p. 13698. [Google Scholar]
- Finkel, E.A.; Wilkinson, B.H. Stylolitization as Source of Cement in Mississippian Salem Limestone, West-Central Indiana. AAPG Bull. 1990, 74, 174–186. [Google Scholar] [CrossRef]
- Alsharhan, A.S.; Sadd, J.L. Stylolites in Lower Cretaceous Carbonate Reservoirs, UAE. In Middle East Models of Jurassic/Cretaceous Carbonate Systems; SEPM Society for Sedimentary Geology: Tulsa, OK, USA, 2000. [Google Scholar]
- Bergen, D.V.; Carozzi, A.V. Experimentally-Simulated Stylolitic Porosity in Carbonate Rocks. J. Pet. Geol. 1990, 13, 179–192. [Google Scholar] [CrossRef]
- Carozzi, A.V.; Bergen, D.V. Stylolitic Porosity in Carbonates: A Critical Factor for Deep Hydrocarbon Production. J. Pet. Geol. 1987, 10, 267–282. [Google Scholar] [CrossRef]
- Lind, I.; Nykjaer, O.; Priisholm, S.; Springer, N. Permeability of Stylolite-Bearing Chalk. J. Pet. Technol. 1994, 46, 986–993. [Google Scholar] [CrossRef]
- Harris, N.B. Low-Porosity Haloes at Stylolites in the Feldspathic Upper Jurassic Ula Sandstone, Norwegian North Sea: An Integrated Petrographic and Chemical Mass-Balance Approach. J. Sediment. Res. 2006, 76, 444–459. [Google Scholar] [CrossRef]
- Chandra, V.; Wright, P.; Barnett, A.; Steele, R.; Milroy, P.; Corbett, P.; Geiger, S.; Mangione, A. Evaluating the Impact of a Late-Burial Corrosion Model on Reservoir Permeability and Performance in a Mature Carbonate Field Using Near-Wellbore Upscaling. Geol. Soc. Lond. Spec. Publ. 2015, 406, 427–445. [Google Scholar] [CrossRef]
- Barnett, A.J.; Wright, V.P.; Chandra, V.S.; Jain, V. Distinguishing Between Eogenetic, Unconformity-Related and Mesogenetic Dissolution: A Case Study from the Panna and Mukta Fields, Offshore Mumbai, India. Geol. Soc. Lond. Spec. Publ. 2018, 435, 67–84. [Google Scholar] [CrossRef]
- Morad, D.; Nader, F.H.; Morad, S.; Al Darmaki, F.; Hellevang, H. Impact of Stylolitization on Fluid Flow and Diagenesis in Foreland Basins: Evidence from an Upper Jurassic Carbonate Gas Reservoir, Abu Dhabi, United Arab Emirates. J. Sediment. Res. 2018, 88, 1345–1361. [Google Scholar] [CrossRef]
- Baud, P.; Rolland, A.; Heap, M.; Xu, T.; Nicolé, M.; Ferrand, T.; Reuschlé, T.; Toussaint, R.; Conil, N. Impact of Stylolites on the Mechanical Strength of Limestone. Tectonophysics 2016, 690, 4–20. [Google Scholar] [CrossRef]
- Koehn, D.; Rood, M.P.; Beaudoin, N.; Chung, P.; Bons, P.D.; Gomez-Rivas, E. A New Stylolite Classification Scheme to Estimate Compaction and Local Permeability Variations. Sediment. Geol. 2016, 346, 60–71. [Google Scholar] [CrossRef]
- Neilson, J.E.; Oxtoby, N.H.; Simmons, M.D.; Simpson, I.R.; Fortunatova, N.K. The Relationship Between Petroleum Emplacement and Carbonate Reservoir Quality: Examples from Abu Dhabi and the Amu Darya Basin. Mar. Pet. Geol. 1998, 15, 57–72. [Google Scholar] [CrossRef]
- Aqrawi, A.A.M.; Goff, J.C.; Horbury, A.D.; Sadooni, F.N. The Petroleum Geology of Iraq; Scientific Press Ltd.: Beaconsfield, UK, 2010; p. 424. [Google Scholar]
- Jassim, S.Z.; Goff, J.C. (Eds.) Geology of Iraq; DOLIN, s.r.o.: Prague, Czech Republic; Geological Society of London: London, UK, 2006. [Google Scholar]
- Martin, A.Z. Late Permian to Holocene Paleofacies Evolution of the Arabian Plate and Its Hydrocarbon Occurrences. GeoArabia 2001, 6, 445–504. [Google Scholar] [CrossRef]
- Muttoni, G.; Gaetani, M.; Kent, D.V.; Sciunnach, D.; Angiolini, L.; Berra, F.; Garzanti, E.; Mattei, M.; Zanchi, A. Opening of the Neo-Tethys Ocean and the Pangea B to Pangea A Transformation during the Permian. GeoArabia 2009, 14, 17–48. [Google Scholar] [CrossRef]
- Sharland, P.R.; Casey, D.M.; Davies, R.B.; Simmons, M.D.; Sutcliffe, O.E. Arabian Plate Sequence Stratigraphy—Revisions to SP2. GeoArabia 2001, 9, 199–214. [Google Scholar] [CrossRef]
- Szabo, F.; Kheradpir, A. Permian and Triassic Stratigraphy, Zagros Basin, South-West Iran. J. Pet. Geol. 1978, 1, 57–82. [Google Scholar] [CrossRef]
- Alavi, M. Regional Stratigraphy of the Zagros Fold-Thrust Belt of Iran and Its Proforeland Evolution. Am. J. Sci. 2004, 304, 1–20. [Google Scholar] [CrossRef]
- Sadooni, F.N.; Alsharhan, A.S. Stratigraphy, Lithofacies Distribution, and Petroleum Potential of the Triassic Strata of the Northern Arabian Plate. AAPG Bull. 2004, 88, 515–538. [Google Scholar] [CrossRef]
- Bordenave, M.L. The Origin of the Permo-Triassic Gas Accumulations in the Iranian Zagros Foldbelt and Contiguous Offshore Areas: A Review of the Palaeozoic Petroleum System. J. Pet. Geol. 2008, 31, 3. [Google Scholar] [CrossRef]
- English, J.M.; Lunn, G.A.; Ferreira, L.; Yacu, G. Geologic Evolution of the Iraqi Zagros, and Its Influence on the Distribution of Hydrocarbons in the Kurdistan Region. AAPG Bull. 2015, 99, 231–272. [Google Scholar] [CrossRef]
- Hussein, H.S.; Bábek, O.; Mansurbeg, H.; Shahrokhi, S. Outcrop-to-Subsurface Correlation and Sequence Stratigraphy of a Mixed Carbonate–Siliciclastic Ramp Using Element Geochemistry and Well Logging; Upper Cretaceous Kometan Formation, Zagros Foreland, NE Iraq. Sediment. Geol. 2024, 459, 106547. [Google Scholar] [CrossRef]
- Haddad, S.N.S.; Amin, M.A. Mid-Turonian–Early Campanian Sequence Stratigraphy of Northeast Iraq. GeoArabia 2007, 12, 135–176. [Google Scholar] [CrossRef]
- Dunham, R.J. Classification of Carbonate Rocks According to Depositional Textures. In Classification of Carbonate Rocks—A Symposium; AAPG Memoir: Tulsa, OK, USA, 1962; Volume 1, pp. 108–121. [Google Scholar]
- Scholle, P.A.; Ulmer-Scholle, D.S. A Color Guide to the Petrography of Carbonate Rocks: Grains, Textures, Porosity, Diagenesis; AAPG Memoir 77; AAPG: Tulsa, OK, USA, 2003; p. 474. [Google Scholar]
- Flügel, E.; Munnecke, A. Microfacies of Carbonate Rocks: Analysis, Interpretation and Application; Springer: Berlin/Heidelberg, Germany, 2010; p. 976. [Google Scholar]
- Hammer, Ø.; Harper, D.A. Paleontological Data Analysis; John Wiley & Sons: Hoboken, NJ, USA, 2024. [Google Scholar]
- Hammer, Ø. PAST: Paleontological statistics software package for education and data analysis. Palaeontol. Electron. 2001, 4, 9. [Google Scholar]
- Massey, F.J., Jr. The Kolmogorov-Smirnov test for goodness of fit. J. Am. Stat. Assoc. 1951, 46, 68–78. [Google Scholar] [CrossRef]
- Manzocchi, T. The connectivity of two-dimensional networks of spatially correlated fractures. Water Resour. Res. 2002, 38, 1–20. [Google Scholar] [CrossRef]
- Sanderson, D.J.; Nixon, C.W. The use of topology in fracture network characterization. J. Struct. Geol. 2015, 72, 55–66. [Google Scholar] [CrossRef]
- Grove, C.; Jerram, D.A. jPOR: An ImageJ macro to quantify total optical porosity from blue-stained thin sections. Comput. Geosci. 2011, 37, 1850–1859. [Google Scholar] [CrossRef]
- Haines, T.J.; Neilson, J.E.; Healy, D.; Michie, E.A.; Aplin, A.C. The impact of carbonate texture on the quantification of total porosity by image analysis. Comput. Geosci. 2015, 85, 112–125. [Google Scholar] [CrossRef]
- Folk, R.L.; Ward, W.C. Brazos River bar (Texas); a study in the significance of grain size parameters. J. Sediment. Res. 1957, 27, 3–26. [Google Scholar] [CrossRef]
- Bábek, O.; Kumpan, T.; Calner, M.; Šimíček, D.; Frýda, J.; Holá, M.; Ackerman, L.; Kolková, K. Redox geochemistry of the red ‘orthoceratite limestone’ of Baltoscandia: Possible linkage to mid-Ordovician palaeoceanographic changes. Sediment. Geol. 2021, 420, 105934. [Google Scholar] [CrossRef]
- Magni, S.; Martín-Martín, J.D.; Bons, P.D.; Gomez-Rivas, E. Stylolites in carbonate rocks: Morphological variability according to the host rock texture. Minerals 2025, 15, 132. [Google Scholar] [CrossRef]
- Wanless, H.R. Limestone response to stress: Pressure solution and dolomitization. J. Sediment. Res. 1979, 49, 437–462. [Google Scholar] [CrossRef]
- Railsback, L.B. Lithologic controls on morphology of pressure-dissolution surfaces (stylolites and dissolution seams) in Paleozoic carbonate rocks from the mideastern United States. J. Sediment. Res. 1993, 63, 513–522. [Google Scholar] [CrossRef]
- Andrews, L.M.; Railsback, L.B. Controls on stylolite development: Morphologic, lithologic, and temporal evidence from bedding-parallel and transverse stylolites from the US Appalachians. J. Geol. 1997, 105, 59–73. [Google Scholar] [CrossRef]
- Aharonov, E.; Katsman, R. Interaction between pressure solution and clays in stylolite development: Insights from modeling. Am. J. Sci. 2009, 309, 607–632. [Google Scholar] [CrossRef]
- Tucker, M.E.; Wright, V.P. Carbonate Sedimentology, 2nd ed.; John Wiley & Sons: Boston, MA, USA, 2009; p. 482. [Google Scholar]
- Zeeb, C.; Gomez-Rivas, E.; Bons, P.D.; Blum, P. Evaluation of sampling methods for fracture network characterization using outcrops. AAPG Bull. 2013, 97, 1545–1566. [Google Scholar] [CrossRef]
- Koehn, D.; Renard, F.; Toussaint, R.; Passchier, C.W. Growth of stylolite teeth patterns depending on normal stress and finite compaction. Earth Planet. Sci. Lett. 2007, 257, 582–595. [Google Scholar]


| Facies | Characteristic Component | Spacing (cm) | Wavelength (cm) | Amplitude (cm) | Junction Intensity (i/m) | Connection Angle (°) |
|---|---|---|---|---|---|---|
| A | Planktonic foraminiferal mudstone and wackestone | 6.92 | 3.39 | 0.66 | 0.73 | 37.5 |
| B | Planktonic foraminiferal packstone with glauconite | 8.91 | 3.09 | 0.65 | 0.69 | 27.5 |
| wt. % | ppm | |||||||||||||||||
|---|---|---|---|---|---|---|---|---|---|---|---|---|---|---|---|---|---|---|
| Elements | Ca | Si | P | Al | Fe | K | Ti | Mn | Sr | Zn | V | Cu | Ni | Zr | Pb | Rb | As | Mo |
| Mean | 36.41 | 2.99 | 1.23 | 0.29 | 0.13 | 0.10 | 0.04 | 0.01 | 658 | 124 | 81 | 18 | 16 | 10 | 5 | 5 | 2 | 2 |
| CV (%) | 7.4 | 43.3 | 4.7 | 101.0 | 111.3 | 177.5 | 68.7 | 74.6 | 29.5 | 1415.3 | 731 | 30.7 | 28.3 | 33.2 | 77.0 | 61.1 | 27.1 | 72.9 |
Disclaimer/Publisher’s Note: The statements, opinions and data contained in all publications are solely those of the individual author(s) and contributor(s) and not of MDPI and/or the editor(s). MDPI and/or the editor(s) disclaim responsibility for any injury to people or property resulting from any ideas, methods, instructions or products referred to in the content. |
© 2025 by the authors. Licensee MDPI, Basel, Switzerland. This article is an open access article distributed under the terms and conditions of the Creative Commons Attribution (CC BY) license (https://creativecommons.org/licenses/by/4.0/).
Share and Cite
Hussein, H.S.; Bábek, O.; Mansurbeg, H.; Martín-Martín, J.D.; Gomez-Rivas, E. Controls on Stylolite Formation in the Upper Cretaceous Kometan Formation, Zagros Foreland Basin, Iraqi Kurdistan. Minerals 2025, 15, 761. https://doi.org/10.3390/min15070761
Hussein HS, Bábek O, Mansurbeg H, Martín-Martín JD, Gomez-Rivas E. Controls on Stylolite Formation in the Upper Cretaceous Kometan Formation, Zagros Foreland Basin, Iraqi Kurdistan. Minerals. 2025; 15(7):761. https://doi.org/10.3390/min15070761
Chicago/Turabian StyleHussein, Hussein S., Ondřej Bábek, Howri Mansurbeg, Juan Diego Martín-Martín, and Enrique Gomez-Rivas. 2025. "Controls on Stylolite Formation in the Upper Cretaceous Kometan Formation, Zagros Foreland Basin, Iraqi Kurdistan" Minerals 15, no. 7: 761. https://doi.org/10.3390/min15070761
APA StyleHussein, H. S., Bábek, O., Mansurbeg, H., Martín-Martín, J. D., & Gomez-Rivas, E. (2025). Controls on Stylolite Formation in the Upper Cretaceous Kometan Formation, Zagros Foreland Basin, Iraqi Kurdistan. Minerals, 15(7), 761. https://doi.org/10.3390/min15070761