Article

Applicability Analysis with the Improved Spectral Unmixing Models Based on the Measured Hyperspectral Data of Mixed Minerals

1
Institute of Geography and Tourism, Qujing Normal University, Qujing 655011, China
2
Institute for Ecological Research and Pollution Control of Plateau Lakes, School of Ecology and Environmental Science, Yunnan University, Kunming 650500, China
3
Faculty of Land Resource Engineering, Kunming University of Science and Technology, Kunming 650093, China
*
Authors to whom correspondence should be addressed.
Minerals 2025, 15(7), 715; https://doi.org/10.3390/min15070715
Submission received: 21 May 2025 / Revised: 22 June 2025 / Accepted: 3 July 2025 / Published: 6 July 2025
(This article belongs to the Section Mineral Exploration Methods and Applications)

Abstract

Hyperspectral technology can non-destructively identify and analyze minerals. However, the quantitative inversion of different components in mixed minerals remains difficult in mineral spectral analysis. A set of mineral samples was prepared from dolomite and gypsum, varying in their components. Three improved spectral decomposition models were proposed: the Continuum Removal-Fully Constrained Linear Spectral Model (CR-FCLSM), the Natural Logarithm-Fully Constrained Linear Spectral Model (NL-FCLSM), and the Ratio Derivative Model (RDM). The unmixing Abundance Error (AE) was 0.161, 0.051, and 0.082 for CR-FCLSM, NL-FCLSM, and RDM. The results of the three improved linearized unmixing models are better than those of the traditional linear spectral unmixing model. The NL-FCLSM effectively enhanced the linear characteristics of the spectrum, making it more suitable for two mineral mixing scenarios. The systematic bias of CR-FCLSM may be due to its insufficient sensitivity to low-abundance signals. The stability of RDM depends on the selection of a strong linear band. The unmixing experiments of the measured spectra and the data from the USGS spectral library demonstrate that the improved linear unmixing model is more accurate than the traditional linear spectral model and simpler to calculate than the nonlinear spectral model, providing a new approach for demodulating hyperspectral images.

1. Introduction

As a crucial means of modern remote sensing analysis, hyperspectral unmixing technology has demonstrated significant application value across multiple disciplinary fields [1,2,3]. The decomposition of mixed pixels is a topic of significant interest in hyperspectral remote sensing research. Spectral unmixing can accurately identify alterations in mineral zones in geological and mineral resources, and its exploration efficiency is significantly improved compared to traditional methods [4,5]. In environmental monitoring, based on the unmixing results of characteristic minerals, the spread of mine pollution can be effectively tracked, and the risk of heavy metals in soil can be evaluated [6,7]. In planetary science, this method supports the quantitative analysis of the distribution of hydrated minerals on Mars [8]. In the cultural heritage field, it is applied to the analysis of the composition of mineral pigment [9]. Additionally, the quantitative inversion of different components in current mixed minerals has always been a complex task in mineral hyperspectral analysis. This is primarily due to the combined influence of factors such as mineral composition, mixing methods, particle size differences, and scattering and transmission variations. When conducting linear unmixing based on VNIR-SWIR reflection spectra, inherent nonlinear problems arise in the mixed minerals. Clark quantified the nonlinear effect of mineral mixtures for the first time. He proved that the error of the linear model in the mixture could reach 30%–40% [10]. The radiative transport theory proposed by Hapke reveals that light scattering between mineral particles is the leading cause of nonlinearity [11]. It is noted that a superposition of particle size effects and secondary alterations is present in the mixed spectra of Martian minerals, providing a key empirical basis for subsequent nonlinear unmixing models [12].
In the early research, Shipman proposed a semi-empirical model for desert mineral exploration to explore the feasibility of spectral deconvolution [13]. The Hapke model lays the foundation for the quantitative analysis of optical constants and provides a more physically interpretable explanation for spectral decomposition [14]. However, the environmental dependence of semi-empirical methods limits the generalization ability. Keshava and Mustard are dominated by the linear spectral mixture model and achieve efficient calculations through end-element extraction [15]. However, their drawback is that they are unable to handle nonlinear effects such as multiple scattering. To address the issue of linear assumptions failing, scholars have introduced nonlinear spectral models for improvement. The Hapke improved model introduces the phase function and scattering parameters to quantify the influence of multiple scattering [16]. Bioucas was the first to classify hyperspectral unmixing techniques into geometric methods, statistical methods, and sparse regression methods [17]. Nonlinear models are limited by the complexity of parameters or interpretability, and the calculation process is often rather complex. In recent years, deep learning technology has begun to be applied to the decomposition of complex mixed spectra; however, it requires a large amount of training data, and the black box problem remains to be solved [18]. The data types and observation conditions used in different studies vary, and the applicability of the reference value of the unmixing model across various scenarios is limited [19]. Conducting unmixing experiments on binary mixtures (dolomite and gypsum) in a laboratory environment allows for the avoidance of many external environmental factors, enabling a comparison of the unmixing accuracy of the traditional linear spectral model and three improved linearized spectral unmixing models. We aim to develop a method for unmixing mixed minerals that is more accurate than the traditional linear spectral model, simpler than the nonlinear spectral model, and has broader applicability. Furthermore, we also introduced the mineral dataset of the USGS spectral database to verify the adaptability of the improved linear unmixing model in other mineral combinations. These research results can provide a theoretical basis for mineral unmixing in hyperspectral remote sensing images.

2. Materials and Methods

2.1. Experimental Design and Data Acquisition

In previous experiments involving mixed minerals, the symbiotic and associated properties of minerals were typically considered, and binary mixtures were synthesized in the laboratory. For example, minerals such as Olivine and Pyroxene, as well as chlorite and vermiculite, are selected to design binary mixtures [20]. In this study, Dolomite (CaMg(CO3)2) and Gypsum (CaSO4·0.5H2O) were selected to prepare mixed mineral samples. The selection of these two mineral combinations is a comprehensive consideration of the geological symbiotic background and the availability of materials. The symbiotic combination of dolomite and gypsum is a typical geological environment marker of a highly arid and high-salinity evaporation environment, and it is also an important indicator for mineral exploration of evaporation salt deposits such as potash salts. The symbiosis of gypsum and dolomite in nature is a typical sign of the evaporative sedimentary environment, primarily formed in high-salinity, closed basins, through metasomatism during buried diagenesis, and in areas with medium- to low-temperature hydrothermal activities. In the closed salt lake systems of arid and semi-arid climates, the continuous evaporation of magnesium-rich water bodies results in the preferential precipitation of dolomite. Subsequently, sulfate concentration precipitates gypsum, forming the sequence of “dolomite—gypsum—rock salt” (such as Lop Nur Salt Lake in Xinjiang, China) [21]. During the burial and diagenetic stage, magnesium-rich fluids transform carbonate rocks through dolomitization, while anhydrite hydrates and turns into gypsum. The two present an interlayered structure (such as Triassic evaporites in Sichuan, China) [22]. Medium and low-temperature hydrothermal activities promote the synergistic precipitation of dissolved substances in the ascending channel, forming gypsum-dolomite vein-like symbionts (such as the fluorite mining area in Hunan, China) [23]. The dolomite and plaster of Paris selected in this study are white powders, with a mesh size of 400 and uniform particle sizes, free from impurities and exhibiting good whiteness. To ensure the composition and purity of this experiment’s dolomite and gypsum samples. The X-Ray Diffractometer (XRD) instrument can accurately obtain both qualitative phase analysis results and quantitative phase content results for substances. In order to verify the material composition and corresponding purity of dolomite and gypsum samples in this experiment, the two pure mineral samples were tested by XRD. The entrusted testing institution was the Analytic and Testing Research Center of Yunnan. The instrument used for the test was a D/Max 2200 X-ray diffractometer produced by Rigaku, Japan. The technical indicators include 36 kV, 30 mA, and a step of 0.02°. The testing fields include phase qualitative and quantitative analysis, nanocrystal size, crystallinity, and cell refinement. The quantitative analysis results of Figure 1a show that in the dolomite mineral sample, CaMg(CO3)2 accounts for 88.76%, Mg(CO3) for 7.25%, SiO2 for 0.96%, and Mg3(Si2O5)2(OH)2 accounts for 3.03%. The quantitative analysis results of Figure 1b indicate that the content of CaSO4·0.5H2O in the gypsum mineral samples is above 99%. These two pure mineral samples meet the requirements of this experiment for mineral purity.
The specific gravity of different minerals varies, and the mixed mineral powder sample is a mixture of two minerals in various proportions of volume rather than by weight. To meet the needs of experimental design and ensure the accuracy of the mixed volume proportion of mineral powder, it is necessary to accurately obtain the actual specific gravity of dolomite powder and gypsum powder used in this experiment. Therefore, when preparing samples, the specific gravity ratio of dolomite and gypsum mineral powder in this experiment should be calculated first (specific gravity of gypsum/ specific gravity of dolomite). Relevant experiments have shown that the specific gravity of gypsum is generally 2.5–2.7 g/cm3, and that of dolomite is 2.8–2.9 g/cm3 [24]. The empirical value of the specific gravity ratio of gypsum and dolomite can be calculated as 0.86–0.96. The actual calculation method involves loading the two types of mineral powder into a white, circular vessel of the same size and weighing it after multiple compactions with a plastic plate. After removing the vessel’s weight, the specific gravity ratio of the two kinds of mineral powder can be obtained as 0.869, which conforms to the empirical values above. According to the measured specific gravity ratio of the two types of mineral powder, the dolomite powder and gypsum powder are weighed according to the calculated weight, and 19 mixed mineral powders are measured. The sample number and weight allocation of each mixed mineral powder are shown in Table 1.
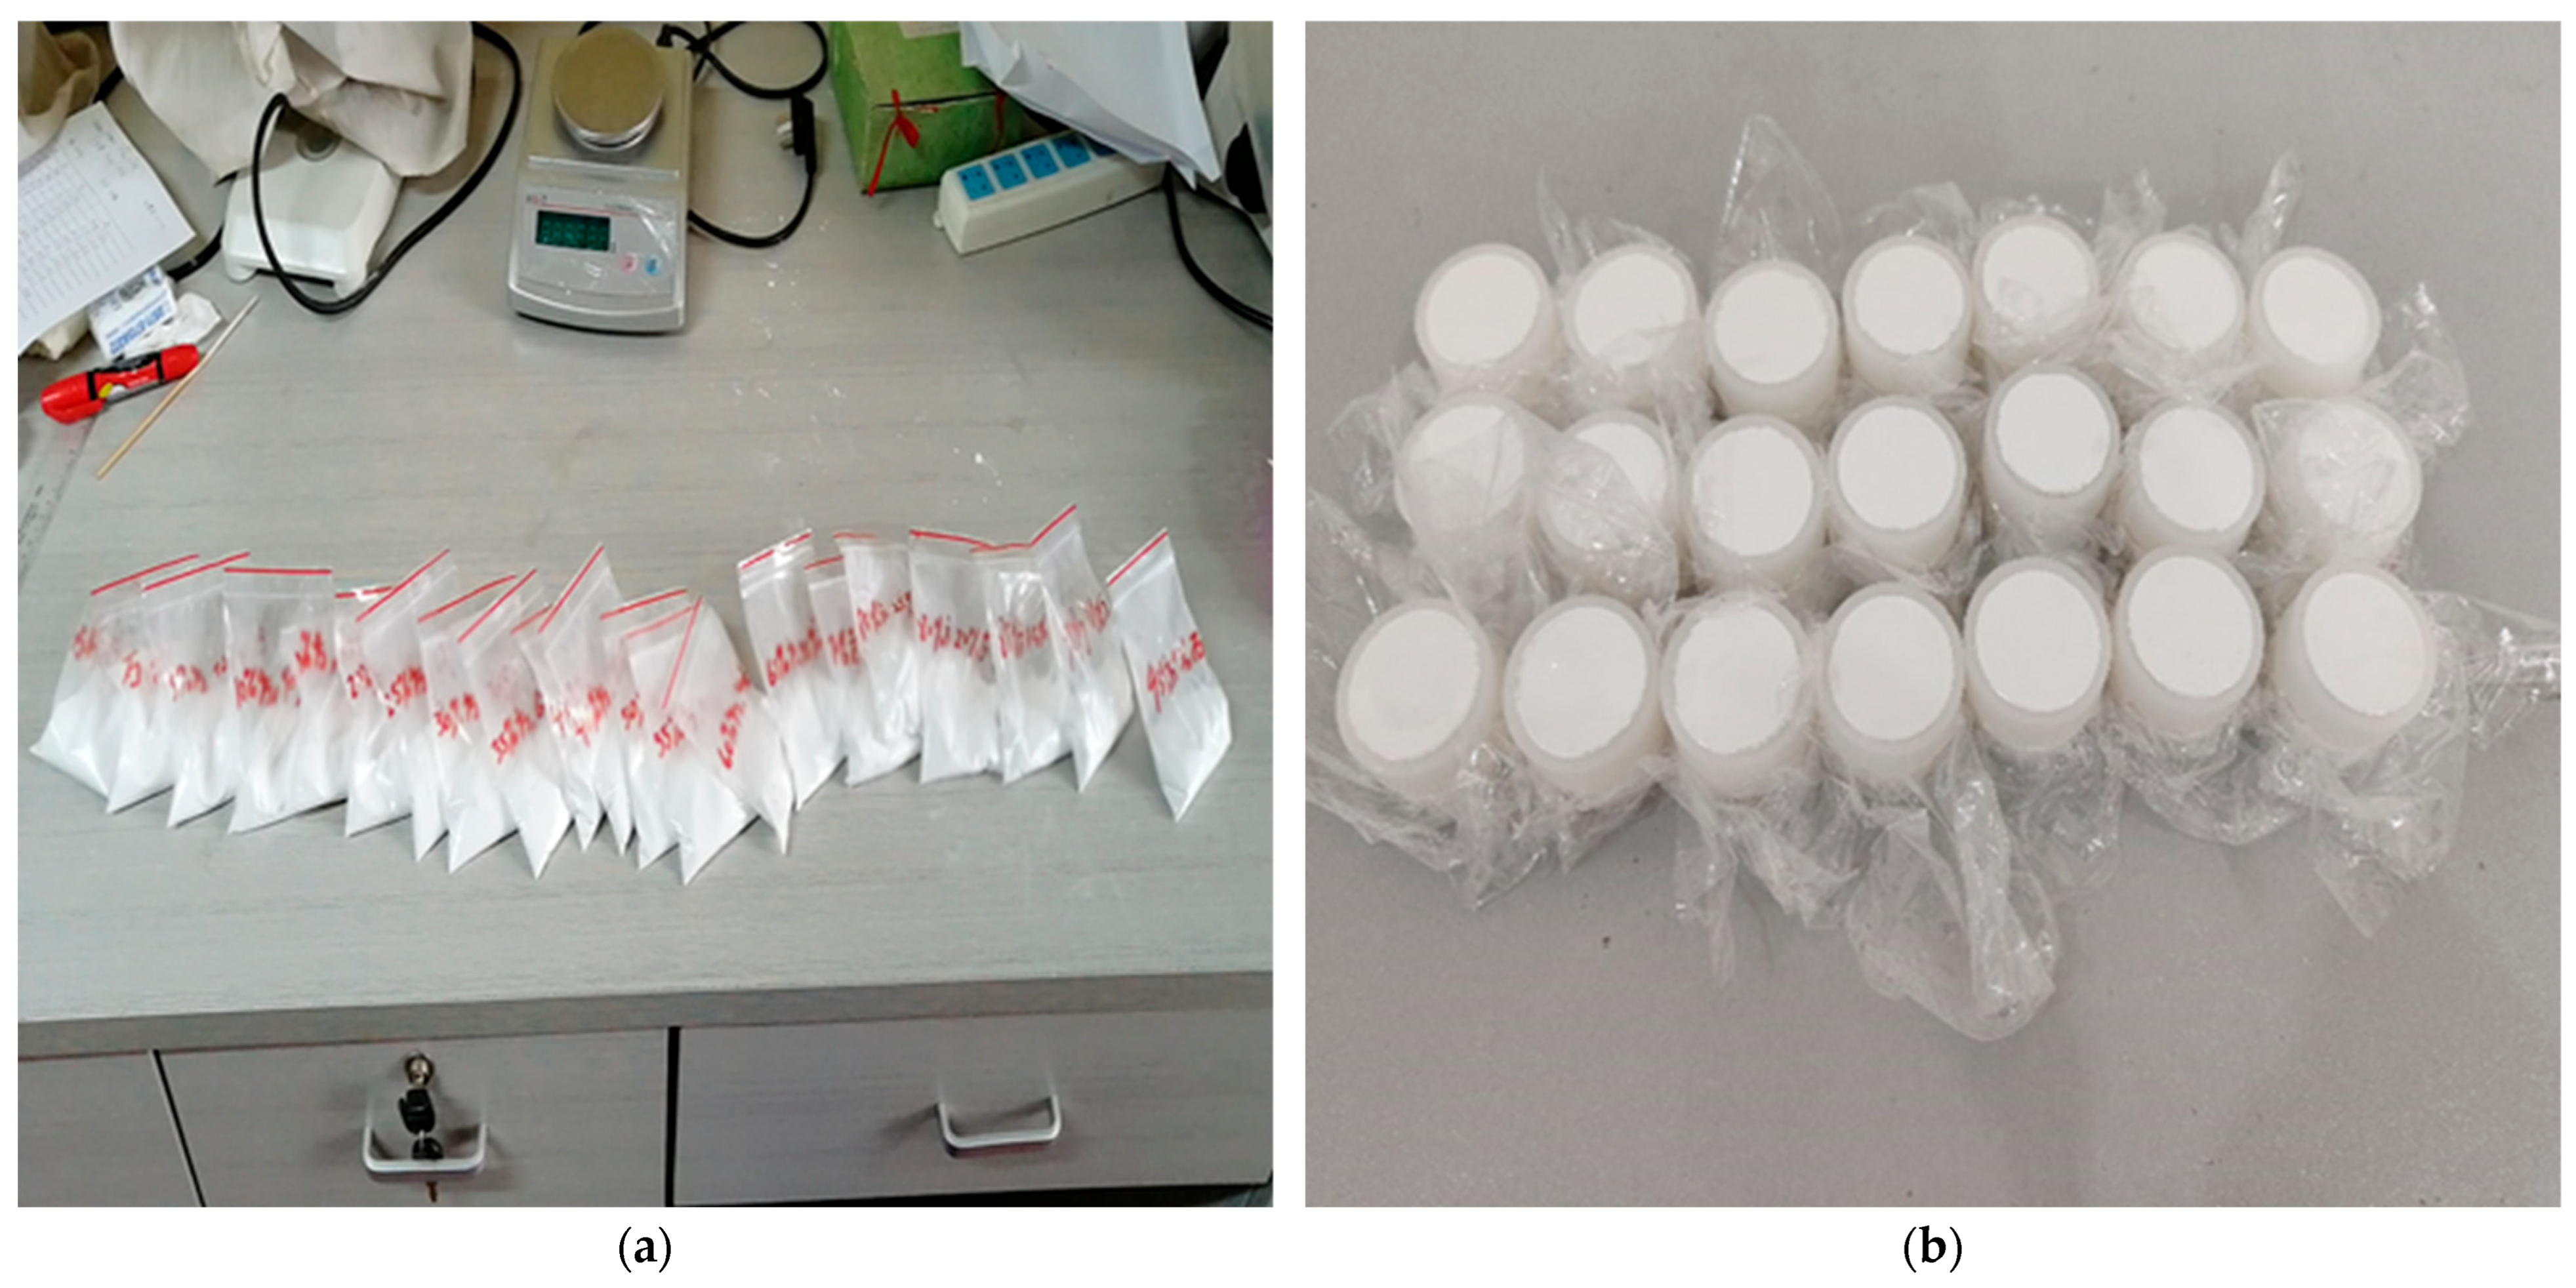
As the spectrometer probe is circular, the prepared mixed mineral powder is evenly stirred and then placed in a circular container to facilitate the collection of spectral data. The plastic plate is pressed multiple times, sealed, and fastened with cling film. It should be noted that the plastic plate must be wiped with a clean paper towel after each compaction to avoid mutual contamination between the surface mineral powder of each sample. The HX-102T electronic balance is used to weigh the mineral powder. The weighing range is 0–100 g, with a readability of 0.01 g. It offers the advantages of high precision and a fast reaction speed. Figure 2 shows the mixed mineral samples before and after packaging.
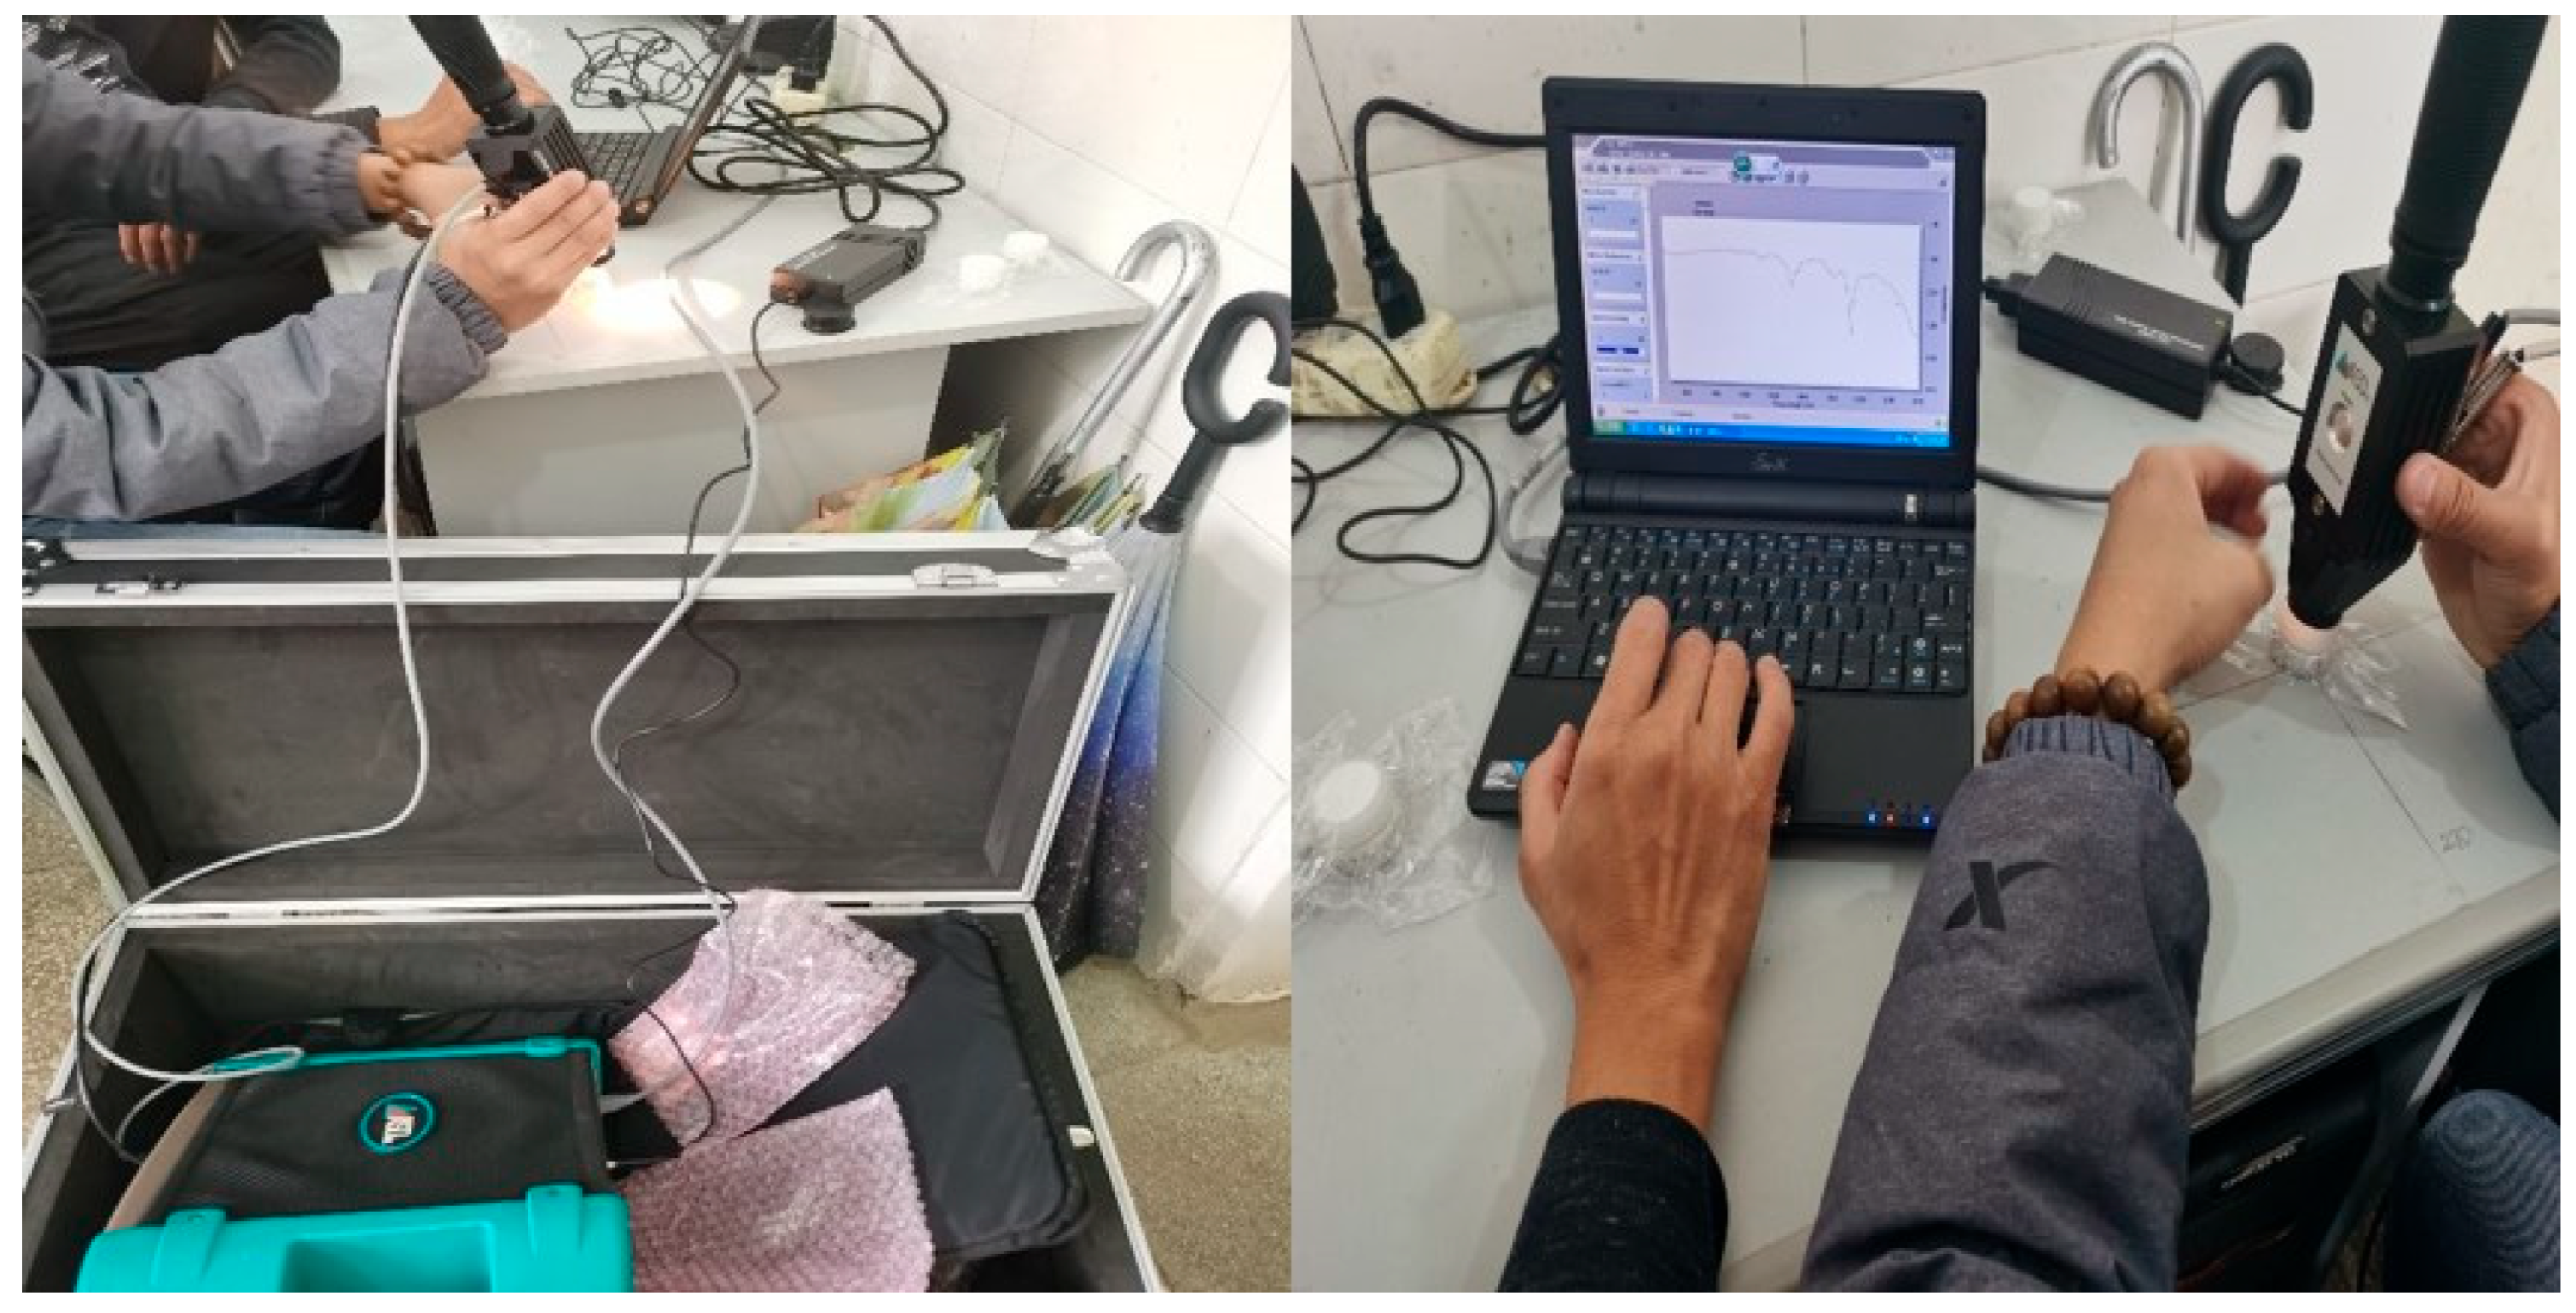
The spectrometer used to collect mixed minerals in this paper is the ASD FieldSpec3 ground object spectrometer. The wavelength range of the spectrum collected by the spectrometer is 350~2500 nm. The spectrometer probe integrates an optical fiber, a halogen light source, and a standard plate, allowing direct contact with the measured target to obtain its spectrum. The inter-spectral data resolution is 1 nm, and the output spectral data band number is 2151. We place the packaged mixed mineral apparatus on the platform to ensure the uniformity of each sample collection process. During measurement, the probe ring should be pressed vertically against the apparatus. Rotate clockwise at intervals of 90° to measure the spectral data at four sampling angles, with each azimuth Angle measured thrice. The spectral measurement process is shown in Figure 3. Finally, each mineral sample will get 12 measured spectra, and the original spectral data of each sample will be obtained after calculating the arithmetic average. The Experimental data collection process minimizes the influence of redundant factors in the laboratory environment to better compare the difference in unmixing accuracy between the improved linearized spectral unmixing model and the traditional linear unmixing model [25].

2.2. Linear Spectrum Mixing Model and Evaluation Index

The linear spectrum model regards the target scene as a mixture of endmembers in different proportions, so that the reflectivity spectrum will transmit this mixture feature in the same proportion. A linear relationship exists between the hybrid and endmember spectra. The Fully Constrained Linear Spectral Model (FCLSM) assumes that the reflectance spectrum of the mixed pixel is a linear combination of the spectral reflectance of each endmember within the pixel and its percentage in the pixel area, serving as the weight coefficient. In Equation (1), Rλ represents the reflectance of the sample in λ band, n indicates the number of endmembers contained in the mixed sample, ai represents the percentage of the area occupied by the i-th endmember in the sample, Rλi is the spectral reflectance of the i-th endmember in the λ band, and the ε is the error term. The two constraints on the abundance vector are the nonnegative abundance constraint (Equation (2)) and the abundance sum constraint (Equation (3)) [26]:
R λ = i = 1 n a i R λ i + ε
a i 0 , i = 1 , 2 , , n
i = 1 n a i = 1 , i = 1 , 2 , , n
In some cases, it is necessary to directly compare the error between the inversion abundance and the actual abundance of each mixed pixel without involving the number of samples or the unmixing results of different bands. In this case, Abundance Error (AE) can be used as an evaluation index to measure the unmixing results, allowing the abundance inversion results of each mixed pixel to be compared quickly and intuitively.
A E = a i a i
In Equation (4), AE represents the error in the abundance of a mixed mineral sample, ai represents the true abundance of the sample, and ai represents the predicted abundance obtained by the model.

2.3. Improved Linearized Spectral Unmixing Model

Most mixed minerals have the most significant nonlinear effects in the 2.3–2.5 μm band, and the traditional linear unmixing error is relatively large. Gypsum has firm absorption peaks at 1.4 μm, 1.9 μm, and 2.2 μm, and dolomite has overlapping absorption in the 2.3–2.5 μm band due to the vibration of CO32−. Dolomite and gypsum have characteristic absorption peaks in the short-wave infrared band (1.0–2.5 μm). However, after mixing, nonlinear spectral responses are generated due to the mutual interference of crystal structures. The nonlinear characteristic wavelengths of different minerals are different. The band data from 350 to 2500 nm are adopted for the unmixing calculation. This is conducive to comparing the accuracy of the unmixing model at the same band scale and enhancing the model’s generalization ability [27]. By employing specific universal linearization processing methods, spectral nonlinear mapping is converted into linear mapping, thereby enhancing model applicability and ensuring unmixing accuracy. The variable transformation method in global linearization is the core technology for converting nonlinear equations into linear forms through mathematical transformation. The core principle is to change the variable relationship through function mapping so that the originally nonlinear curve presents a linear feature in a specific coordinate system [28]. Based on previous studies and their combination, this paper selects three typical linearization processing models: logarithmic transformation, envelope line removal, and ratio derivative. Combining the Linear Spectral Model, three improved linearized spectral unmixing models have been proposed.

2.3.1. CR-FCLSM

The envelope removal spectrum is often known as hull correction. After removing the envelope, the absorption and reflection characteristics of the spectral curve can be highlighted. The envelope can be understood as the background contour on a spectral curve, which is connected by the local maximum values at the inflection points of multiple spectral curves. The envelope removal model has been successfully applied to analyze mineral unmixing on the Moon and Mars. The envelope removal steps are as follows:
(1)
All maximum points on the spectral curve are obtained after the spectrum is derived and the maximum point is found.
(2)
Take the maximum point as the starting point, calculate the slope of the line between the maximum point and each subsequent maximum point in the long-wave direction. The point with the most significant slope is the following endpoint of the envelope and is calculated according to the method used for the last point.
(3)
Repeat step (2) in the short-wave direction;
(4)
Connect all endpoints to get the envelope of the curve. Envelope removal is the division of the reflectance values on each band of the spectral curve by the reflectance values on the envelope. After the envelope is removed, the reflectance of the peak point on the spectral curve becomes 1, and the reflectance of the non-peak point will be less than 1. The formula for envelope removal is as follows [29]:
R c r = R R c
In Equation (5), Rcr represents the reflectance after the envelope is removed from a mixed mineral sample, R represents the original reflectance of the sample, and Rc is the envelope spectrum of the sample. This paper first removes the original data’s envelope removal model. Then, linear spectral unmixing based on Rcr is referred to as the Continuum Removal—Fully Constrained Linear Spectral Model (CR-FCLSM).

2.3.2. NL-FCLSM

The natural logarithm transformation can convert reflectance into absorptivity. The natural logarithm has a beneficial effect on eliminating the nonlinear effects of the spectrum, thereby playing a vital role in the analysis of absorption characteristics. Suppose the spectrum is simulated as a linear mixture of multiple energy absorption actions. In that case, converting the reflectance spectrum to the natural logarithm spectrum is necessary. In addition, the effect of photon brightness on absorption depth characteristics can be effectively eliminated by processing the spectral data through a natural logarithm. The natural logarithm is calculated as follows [30]:
A = log ( 1 R )
In Equation (6), A is the absorption spectrum, and R is the reflectance spectrum. Theoretically, the absorption rate is calculated based on the transmittance of photon energy through a non-scattered sample, and the absorption rate calculated using reflectivity is not entirely rigorous. However, in many NIR reflection spectral analysis experiments, the natural logarithm transformation method is often used to calculate the absorption rate. It has achieved excellent results in practical spectral applications, allowing the above effects to be ignored in these applications. In this paper, the natural logarithm of the original reflectance spectrum is processed first. Then, the linear unmixing of the natural logarithm spectrum is referred to as the Natural Logarithm—Fully Constrained Linear Spectral Model (NL-FCLSM).

2.3.3. RDM

The ratio derivative spectroscopy method, based on linear spectrum mixing theory, combines derivative analysis and spectral mixing analysis, which can effectively reduce the influence of background factors on the spectrum, enhance spectral contrast, and minimize the correlation coefficient between similar spectra. Based on the basic theory of linear spectrum mixing, the ratio derivative calculation method is applied to unmixing mixed pixels, named the Ratio Derivative Model (RDM). Based on the linear spectral mixing model, when the mixed pixel contains only two kinds of end-element ratio derivative model, the formula is as follows [31]:
R ( λ i ) = F 1 × R 1 ( λ i ) + F 2 × R 2 ( λ i ) + ε ( λ i )
In Equation (7), the λ i represents i-th band, R ( λ i ) represents the reflectance of the band, F1 is the abundance of the first endmember component in the mixture, F2 is the abundance of the second endmember component in the mix, and the ε ( λ i ) is the error term of the i-th spectral band.
Both sides of Equation (8) divide the reflectance spectrum of the second component:
R ( λ i ) R 2 ( λ i ) = F 2 + F 1 × R 1 ( λ i ) R 2 ( λ i ) + ε ( λ i ) R 2 ( λ i )
Take the derivative of lambda on both sides:
d R ( λ i ) R 2 ( λ i ) d λ = F 1 × d R 1 ( λ i ) R 2 ( λ i ) d λ + d ε ( λ i ) R 2 ( λ i ) d λ
It can be seen from Equation (9) that the content of the second component (F2) in the formula is removed after derivation. The reflectance spectrum is only linearly related to the abundance of the first endmember.
It can be seen from Equation (10) that dividing both sides of Equation (8) gives the abundance of the first endmember:
F 1 = d R ( λ i ) R 2 ( λ i ) d λ / d R 1 ( λ i ) R 2 ( λ i ) d λ d ε ( λ i ) R 2 ( λ i ) d λ / d R 1 ( λ i ) R 2 ( λ i ) d λ
The error term includes nonlinear mixing factors and random noise. If the error term is not considered, the abundance result of the first endmember can be simplified as Equation (11):
F 1 = d R ( λ i ) R 2 ( λ i ) d λ / d R 1 ( λ i ) R 2 ( λ i ) d λ
Similarly, the simplified calculation of the abundance of the second endmember is as follows, Equation (12):
F 2 = d R ( λ i ) R 1 ( λ i ) d λ / d R 2 ( λ i ) R 1 ( λ i ) d λ

3. Results and Discussion

3.1. Change Analysis of Spectral Characteristics of Mixed Minerals

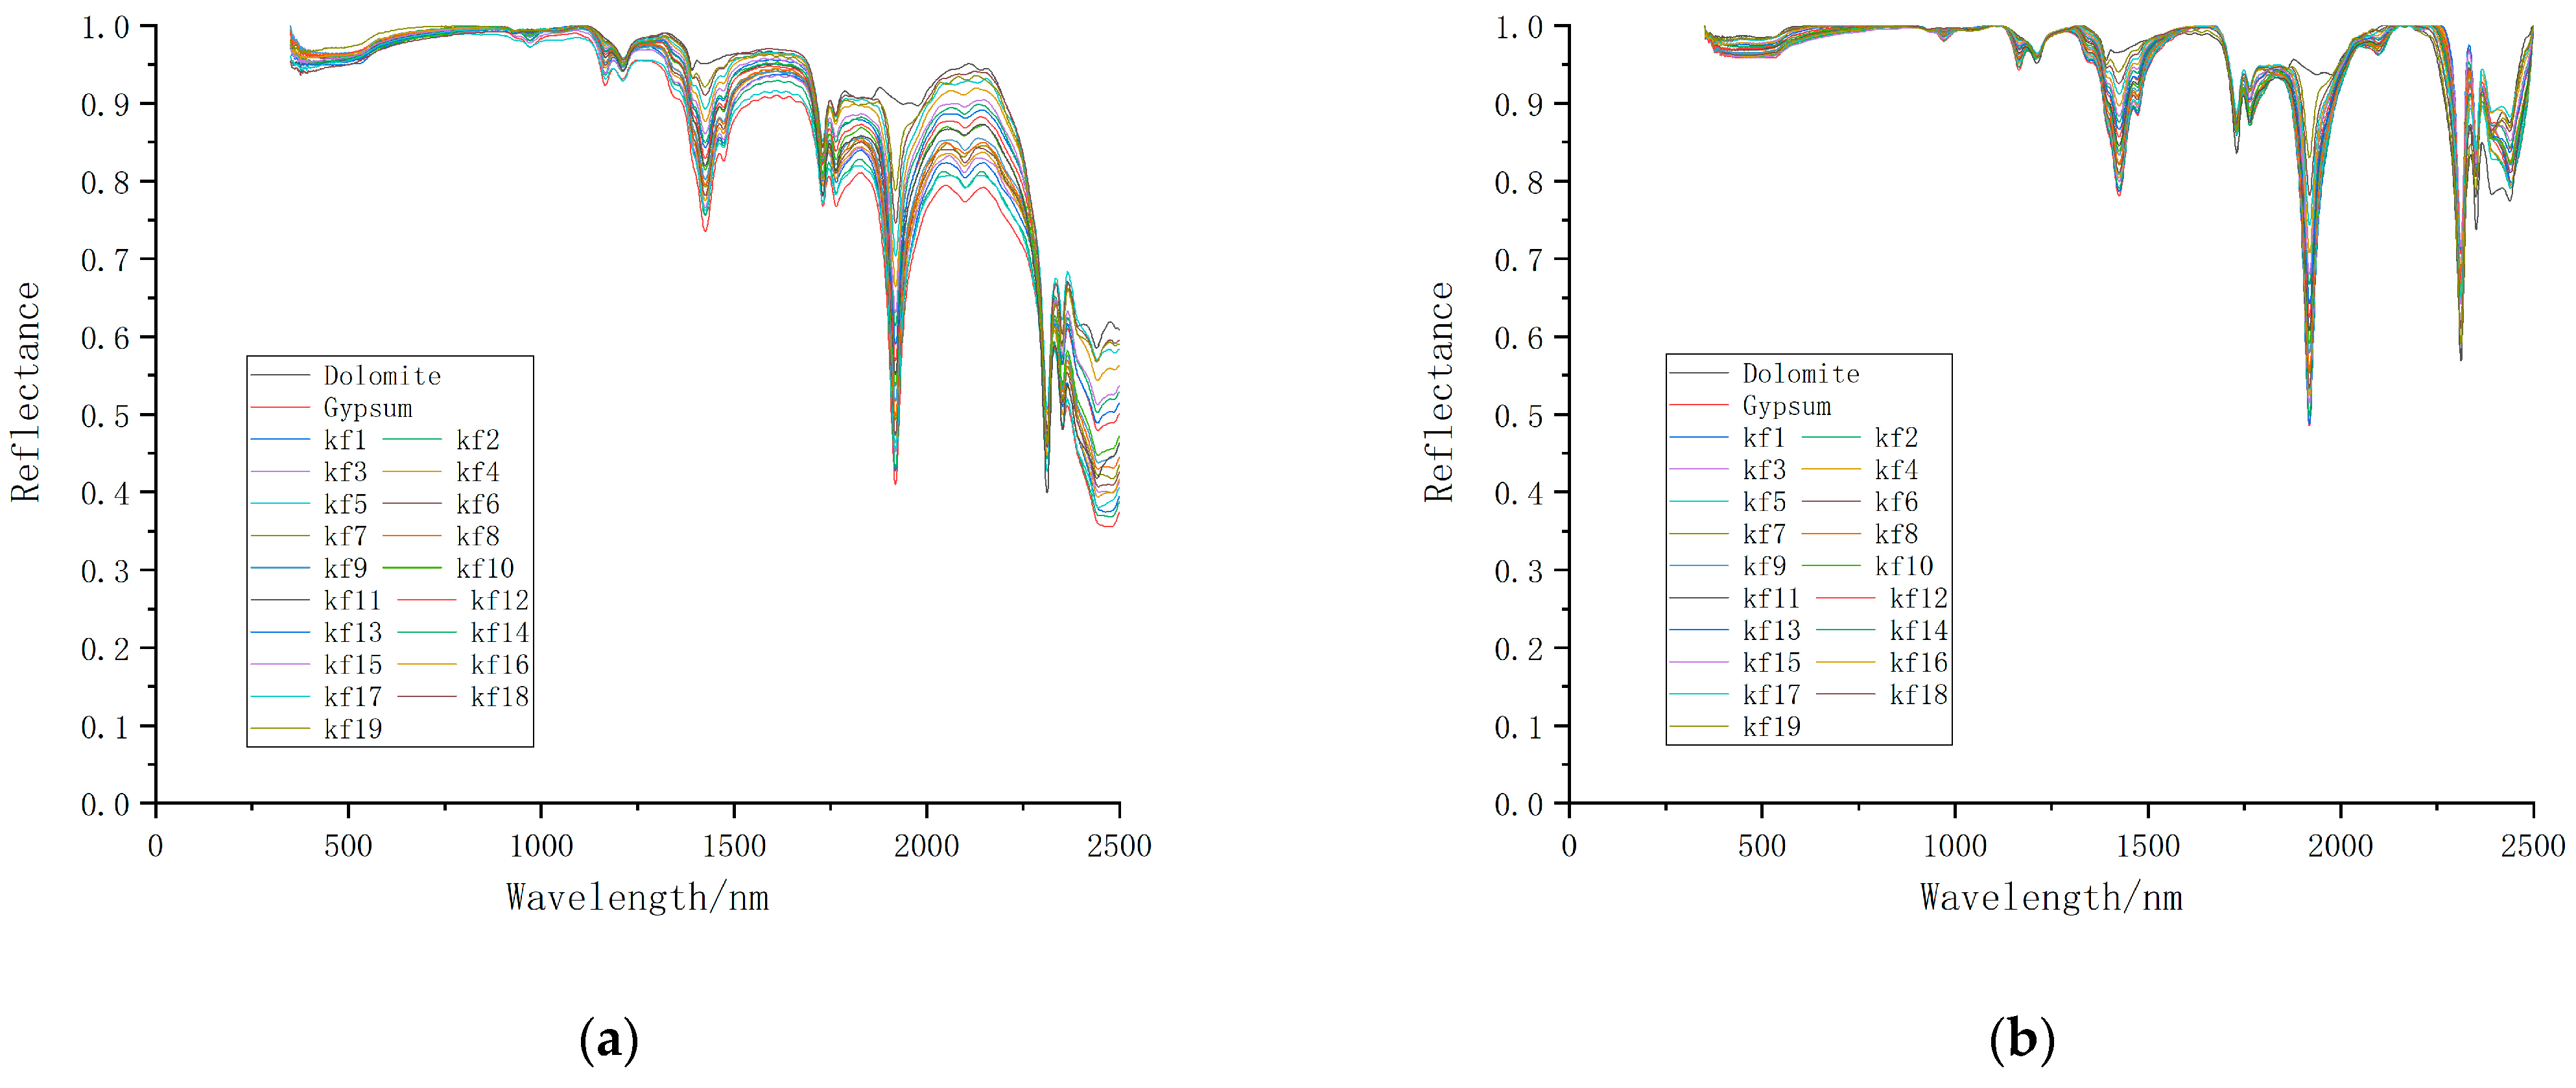
The envelope removal method is an effective spectral analysis technique for enhancing the absorption features of interest. It can effectively highlight the absorption and reflection features of the spectral curve and normalize the reflectivity to a range of 0 to 1. The absorption features of the spectrum are also normalized to a consistent spectral background, which facilitates comparison of feature values with those of other spectral curves to extract feature bands for classification and recognition. The normalized spectral data of 19 mixed mineral samples and two pure mineral samples were taken as experimental data, and envelope removal was performed on them. The spectral curve of mixed minerals after envelope removal is shown in Figure 4. After envelope removal, the spectral values are normalized to 0–1. The location of the characteristic bands remains unchanged by envelope removal, and the three characteristic absorption valleys of the mixed minerals are still located at 1430, 1920, and 2314 nm.
The significance of envelope removal: The envelope elimination method can effectively highlight the absorption, reflection, and emission characteristics of the spectral curve and normalize them to a consistent spectral background, which facilitates comparison of characteristic values with those of other spectral curves. However, after the envelope is removed, the absorption characteristics of the spectral curve are reduced, among which the maximum absorption depth at 1430 nm is reduced from 0.28 to 0.19, the maximum absorption depth at 1920 nm is reduced from 0.62 to 0.52, and the maximum absorption depth at 2314 nm is reduced from 0.60 to 0.43. Additionally, the original spectrum exhibits a distinct spectral interval in the 2375–2500 nm band. However, this spectral separability is lost in the envelope removal spectral curve. This phenomenon may be due to the fact that the spectral curves of mixed minerals are twice normalized, which amplifies the weak absorption characteristic information and compresses the strong absorption characteristic information. Especially on the reflectance spectrum, some originally highly distinguishable pop information packet complexes become inseparable after being removed, which increases the difficulty of subsequent unmixing.
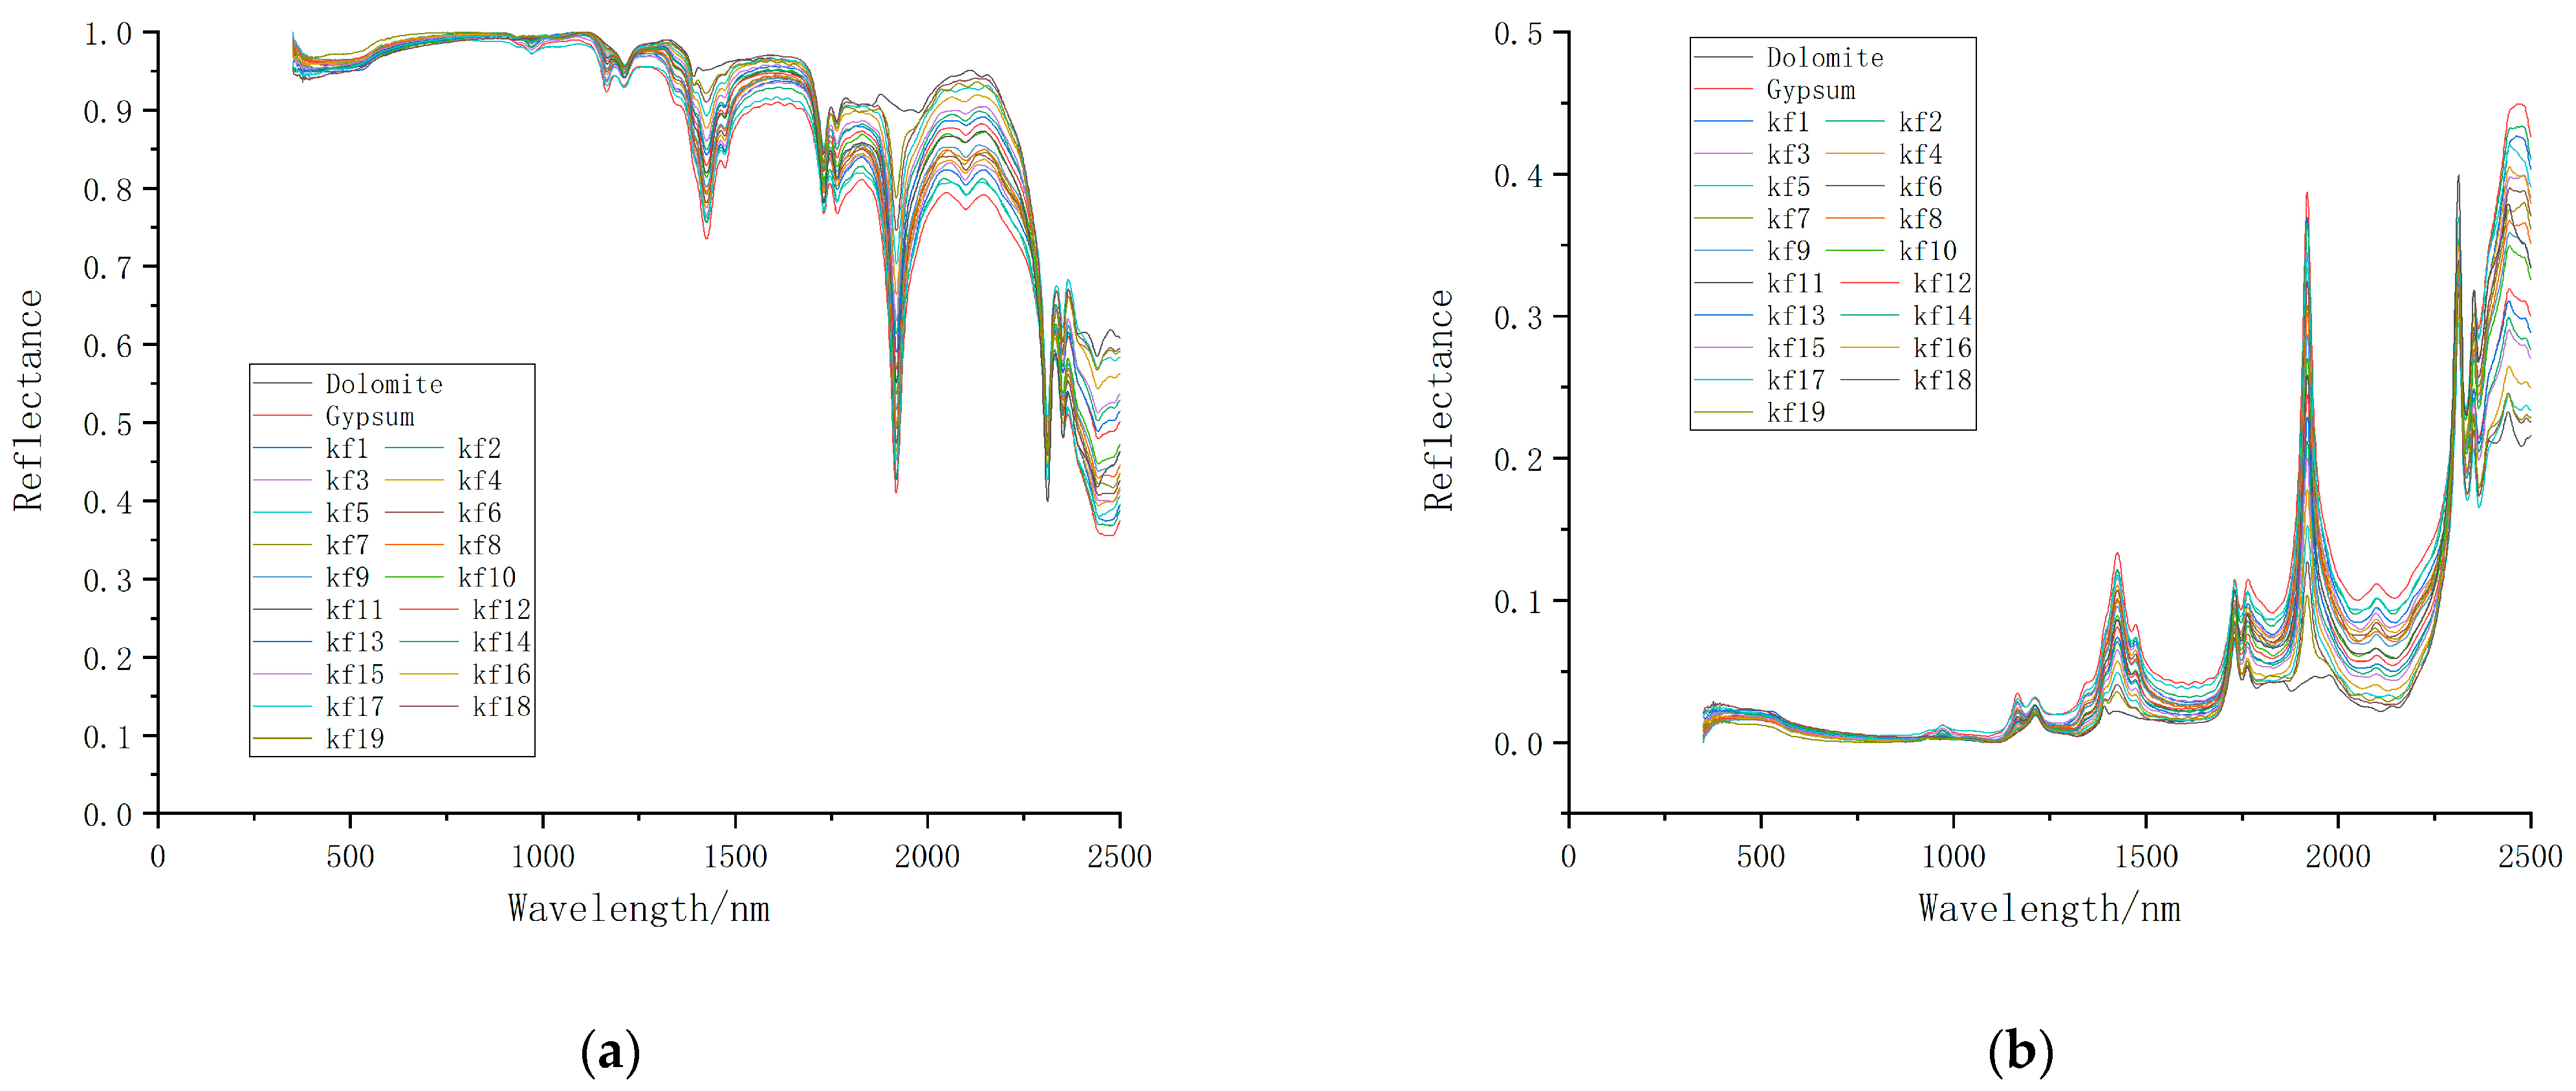
The natural logarithmic transformation of the reflectance spectrum of the mixed mineral powder can make the absorption characteristics of the sample reflectance. The content of the material components exhibits a linear correlation, indicating that the reflectance data have been linearized. Taking the natural logarithm of the reflectance spectrum is conducive to highlighting the absorption characteristic information of different mineral powder samples, effectively eliminating the nonlinear effect in the mineral absorption characteristics. The separability of the spectral curve increases in some bands, thereby having a particularly positive effect on the unmixing of mineral spectra. The natural logarithmic spectral curves of pure and mixed minerals are shown in Figure 5. After natural logarithm treatment, the spectrum is compressed, and the reflectance value ranges from 0 to 0.5. After logarithmic transformation, the spectral curves of all mineral powder samples are vertically reversed. The three characteristic absorption valleys in the original normalized spectrum near 1430, 1920, and 2314 nm are reversed to form a new reflection characteristic peak. Because the reflection spectrum is compressed, the reflection peak depth of the spectral curve after natural logarithm treatment is also reduced. The natural logarithm spectral curves of the mixed minerals show two “gentle and broad” absorption valleys in the bands of 1500–1750 nm and 2000–2250 nm. In addition, the original spectrum has a significant spectral interval in the 2375–2500 nm band, and this spectral separability feature is still preserved in the natural logarithm spectral curve. The natural logarithm treatment changes the reflectance spectra of mixed minerals almost completely, strengthens the weak absorption characteristic information on the spectral curve, and enhances the overall spectral resolvability locally.
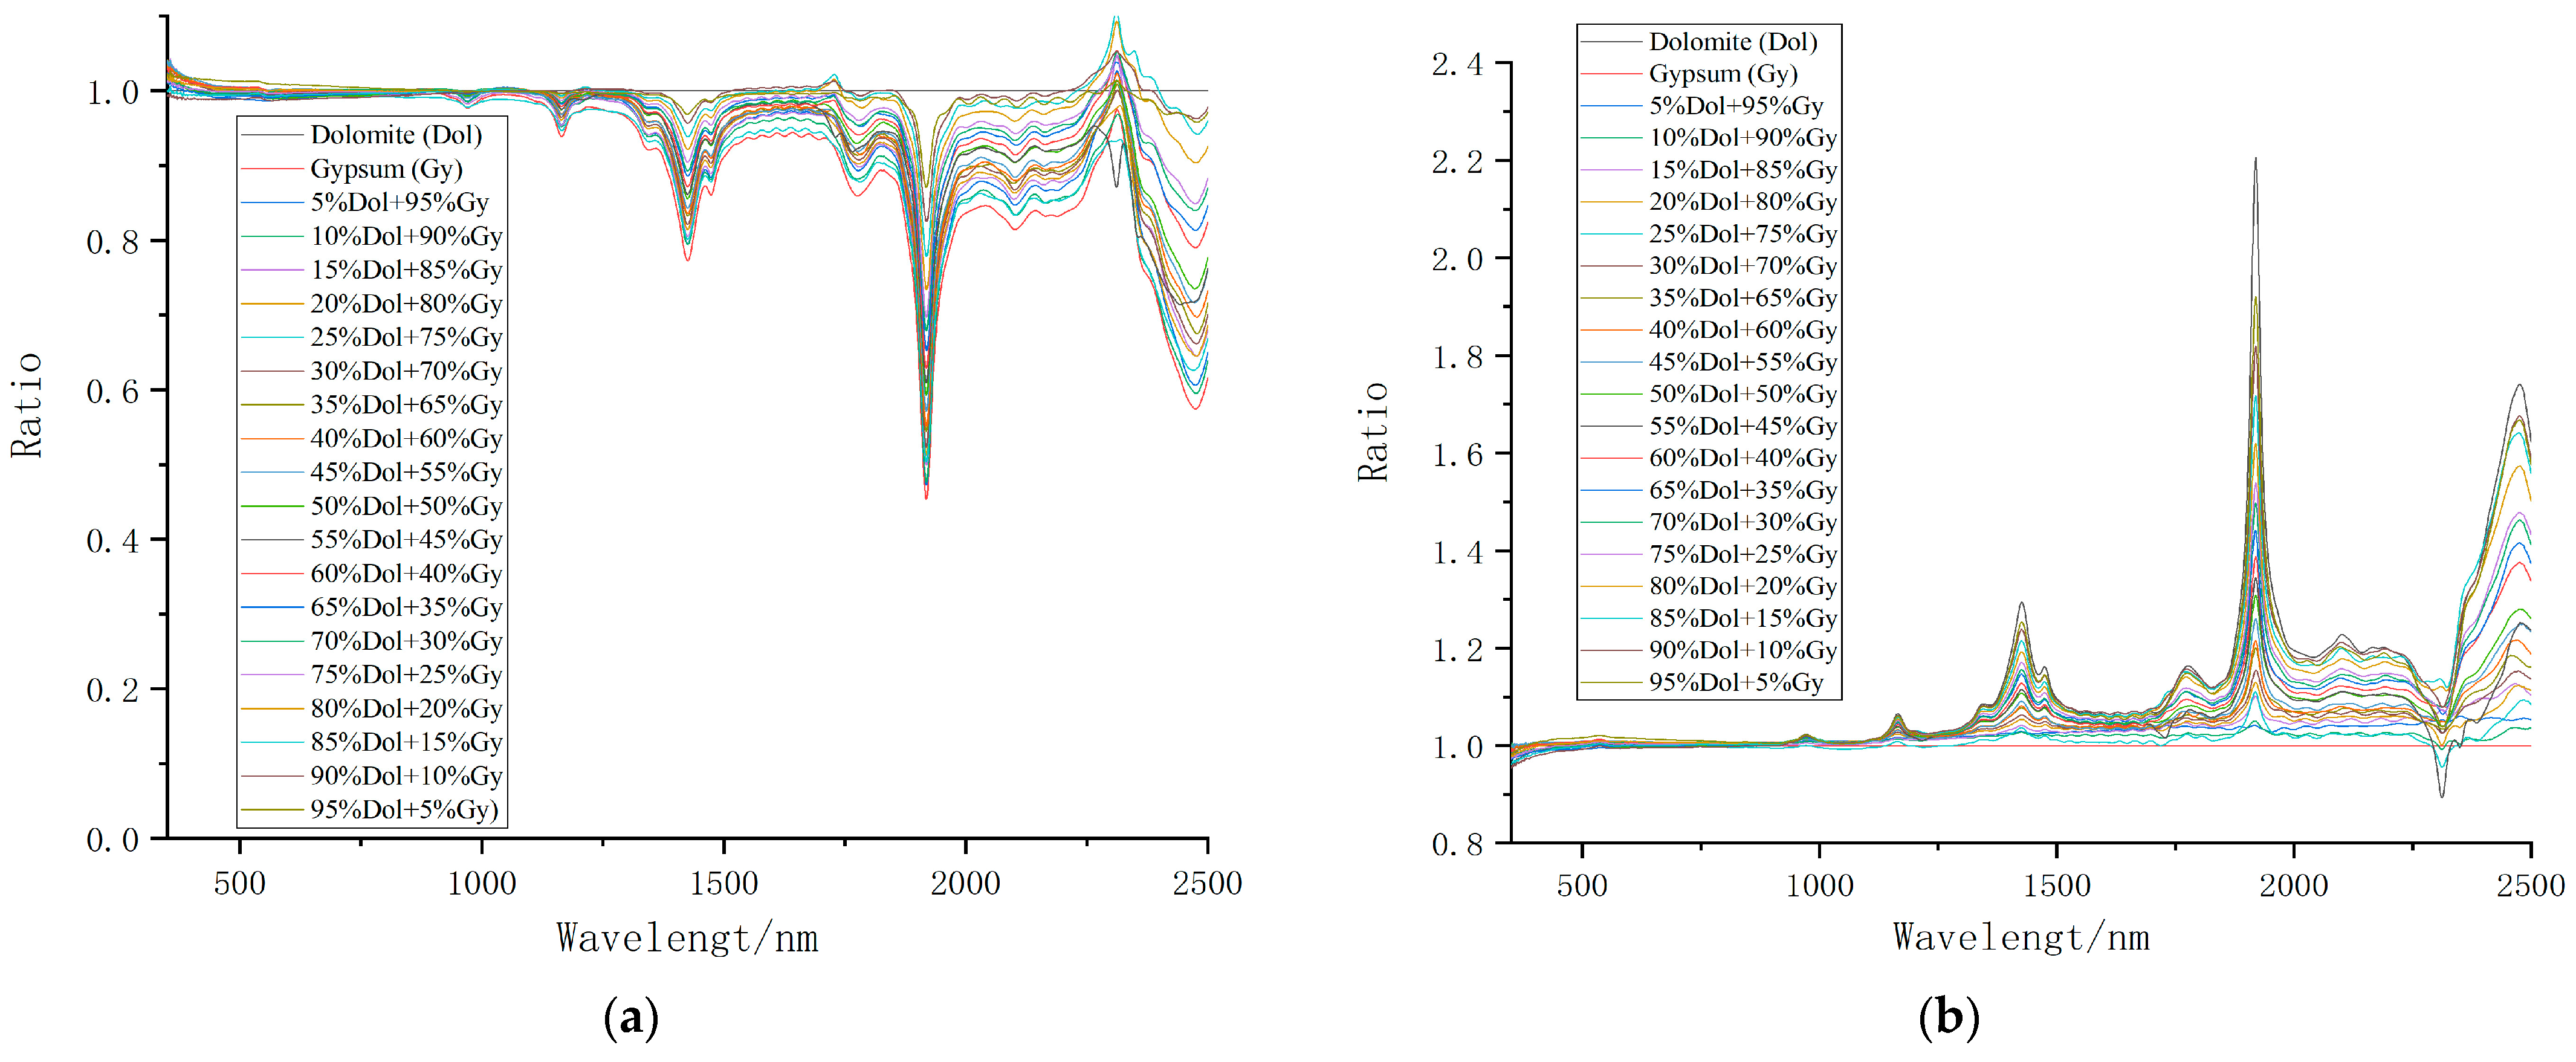
The reflectance spectra of the mixed minerals are treated using dolomite and gypsum spectra as divisors, respectively, to obtain the ratio spectra of the mixed minerals. Figure 6a takes the reflectance spectrum of dolomite as a divisor. It can be seen that the ratio spectrum of dolomite is a straight line (black line) with a constant value of 1. In contrast, the gypsum (red line) ratio spectrum is located at the bottom of the coordinate system. The ratio spectrum of other mixed mineral samples is distributed between two pure minerals, and the ratio spectrum value is less than 1. Only around 2314 nm is greater than 1. When the ratio derivative spectra were compared with the original spectra, it was found that the spectral characteristics of dolomite at 1430 nm and 1920 nm were eliminated after the spectral ratio calculation. Similarly, the spectral characteristics of gypsum are strengthened. When the reflectance spectrum of gypsum is used as a divisor, the ratio spectrum of the mineral is shown in Figure 6b. It can be seen from the figure that the ratio spectrum of gypsum at this time is a straight line with a constant value of 1 (red line), while the ratio spectrum of dolomite is the largest (black line). The ratio spectrum of other mixed mineral samples is also distributed between the pure minerals. The ratio spectral values of the mixed minerals are generally greater than 1, with only slight deviations from 1 near 2314 nm. The spectral characteristics of gypsum in the ratio spectrum are eliminated, and the spectral characteristics of dolomite are highlighted, especially in the 1430 and 1920 nm bands.
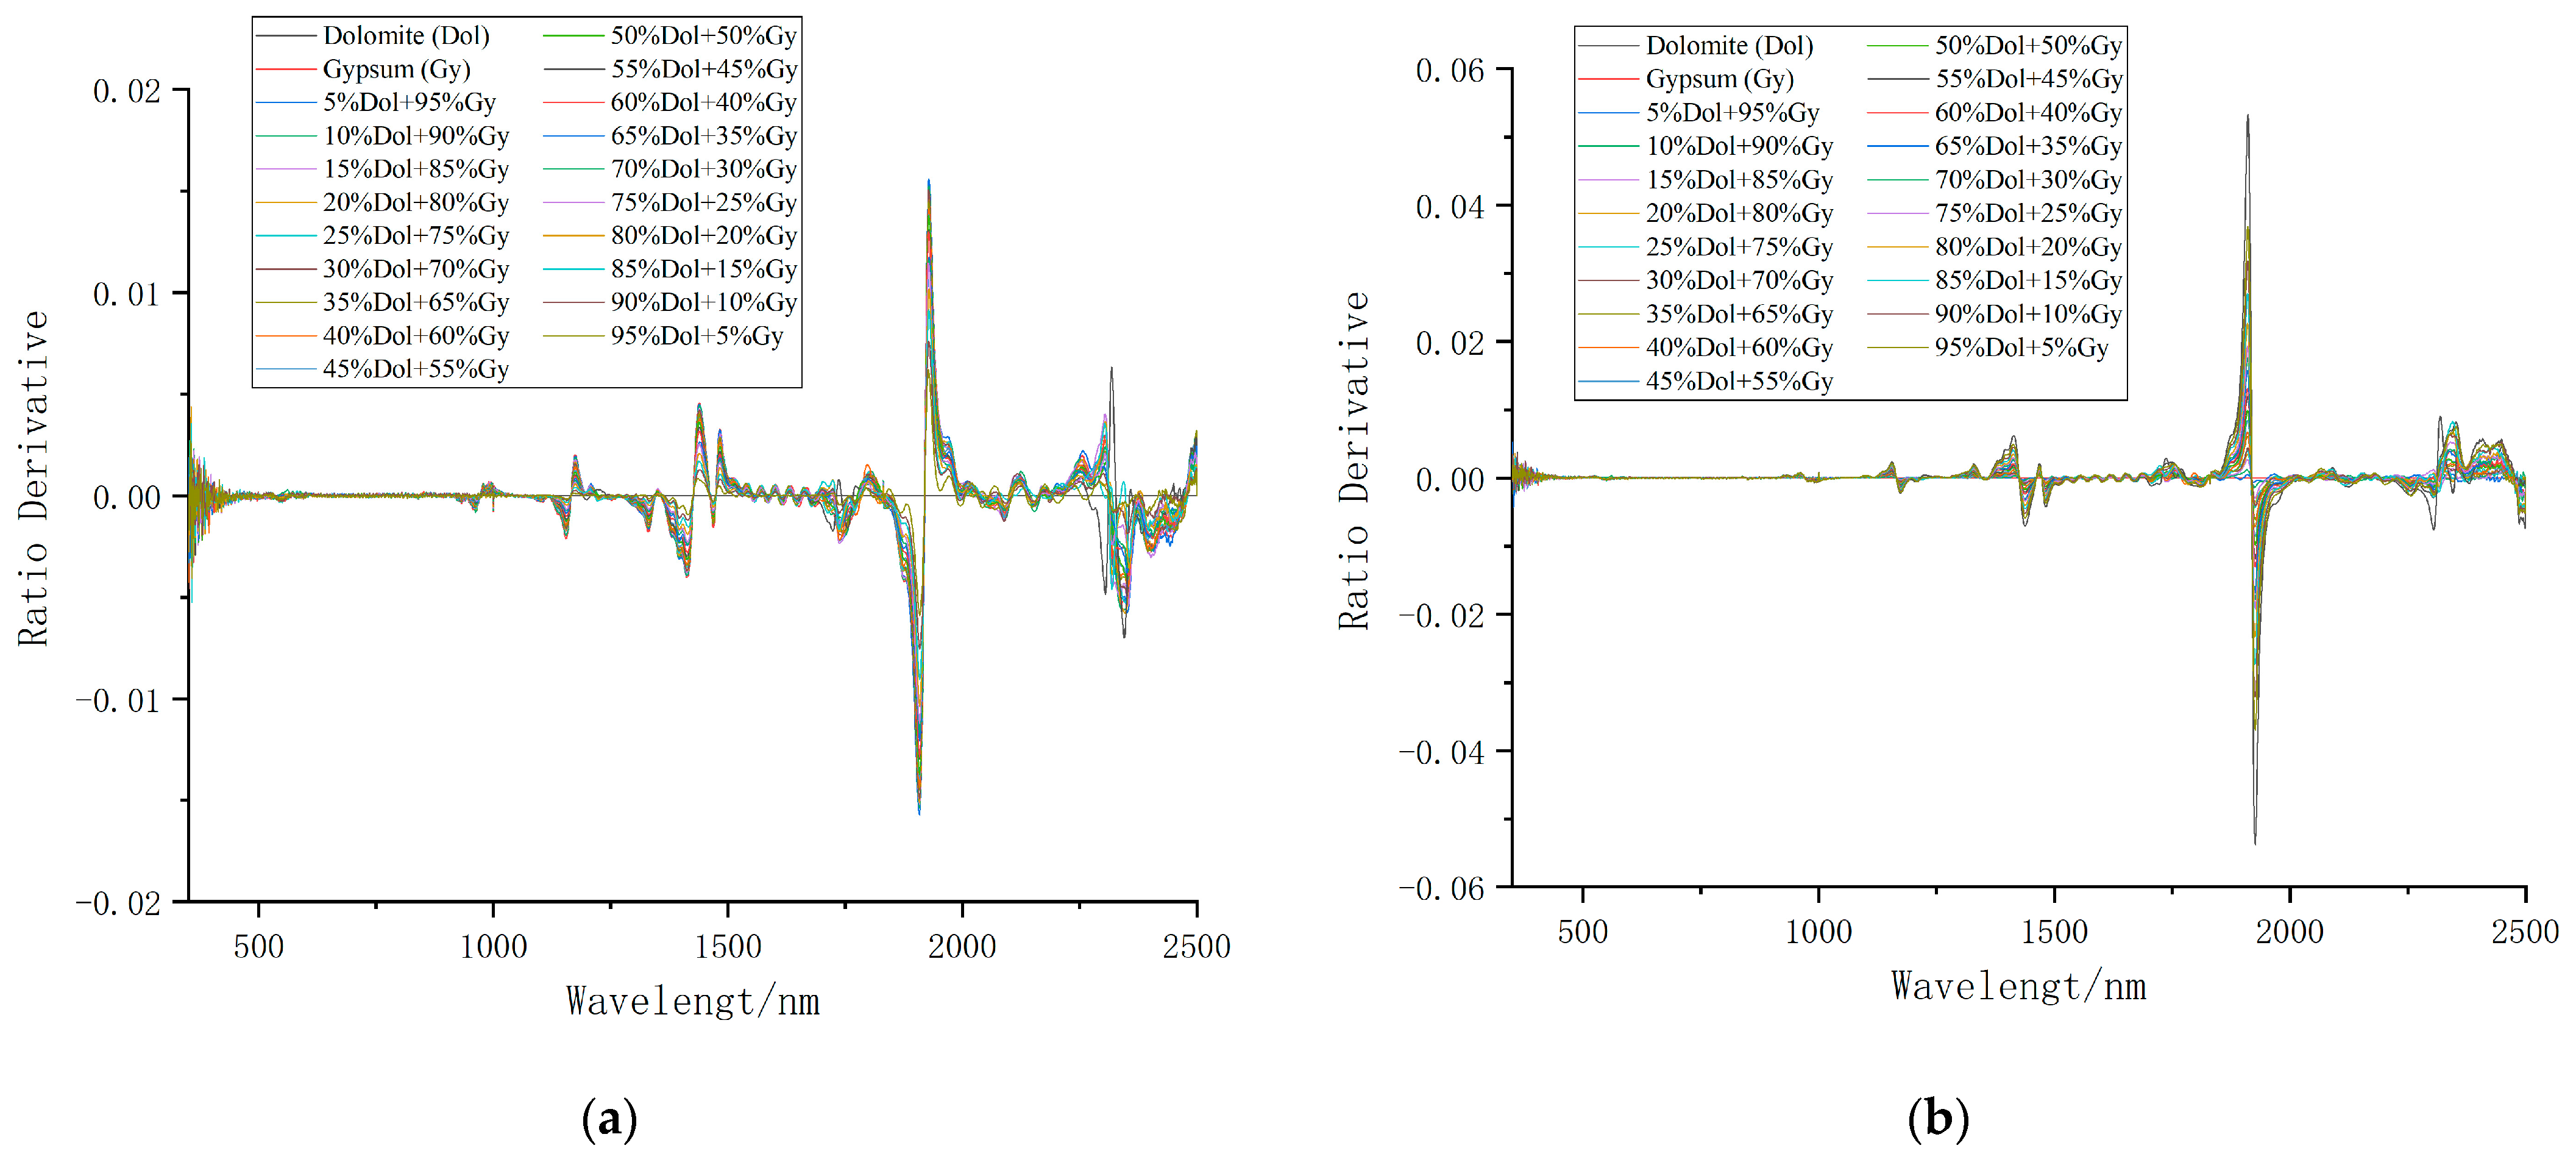
The two groups’ ratio derivative spectra were derived according to the formula, and the ratio derivative spectra of the mixed minerals were obtained. In binary mixtures, the ratio derivative spectrum can effectively eliminate the effect of abundance as a divisor endmember so that the reflectance spectrum is only linearly related to the abundance of another endmember. As shown in Figure 7a, the value of dolomite in the ratio derivative spectrum retaining the gypsum feature is always 0. It indicates that the influence of dolomite is eliminated in the background spectrum, and the ratio derivative spectrum of the mixed mineral is only linearly related to the abundance of gypsum. In particular, there is a clear demarcation point at 1919 nm, and the minimum value of the ratio derivative spectrum at 1909 nm on the left side of this point corresponds to the maximum value of the ratio derivative spectrum at 1928 nm on the right side. The derivative spectrum of other mixed minerals is distributed between the two pure minerals, and its curve is closer to the side with a more significant proportion of minerals. The ratio derivative spectra of the mixed minerals in Figure 7b eliminate the gypsum’s spectral characteristics and retain the dolomite’s spectral characteristics. Through the above analysis, we find that the spectral ratio derivative calculation can suppress the endmember spectral feature of the divisor as the background, thus highlighting the influence of another endmember on the spectrum of mixed minerals. The extent to which this spectral feature is highlighted or suppressed differs in different radio spectrum bands. Therefore, the analysis suggests that adopting the linearization method can effectively enhance the resolvable ability of different spectral curves, regardless of their spectral characteristics. However, an overly ideal linearization level can lead to the problem of feature loss in the original spectrum. Therefore, various studies must consider the balanced relationship between the degree of linearization and spectral characteristics, depending on the experimental purpose.

3.2. Analysis of Unmixing Accuracy for Three Linearized Spectral Models

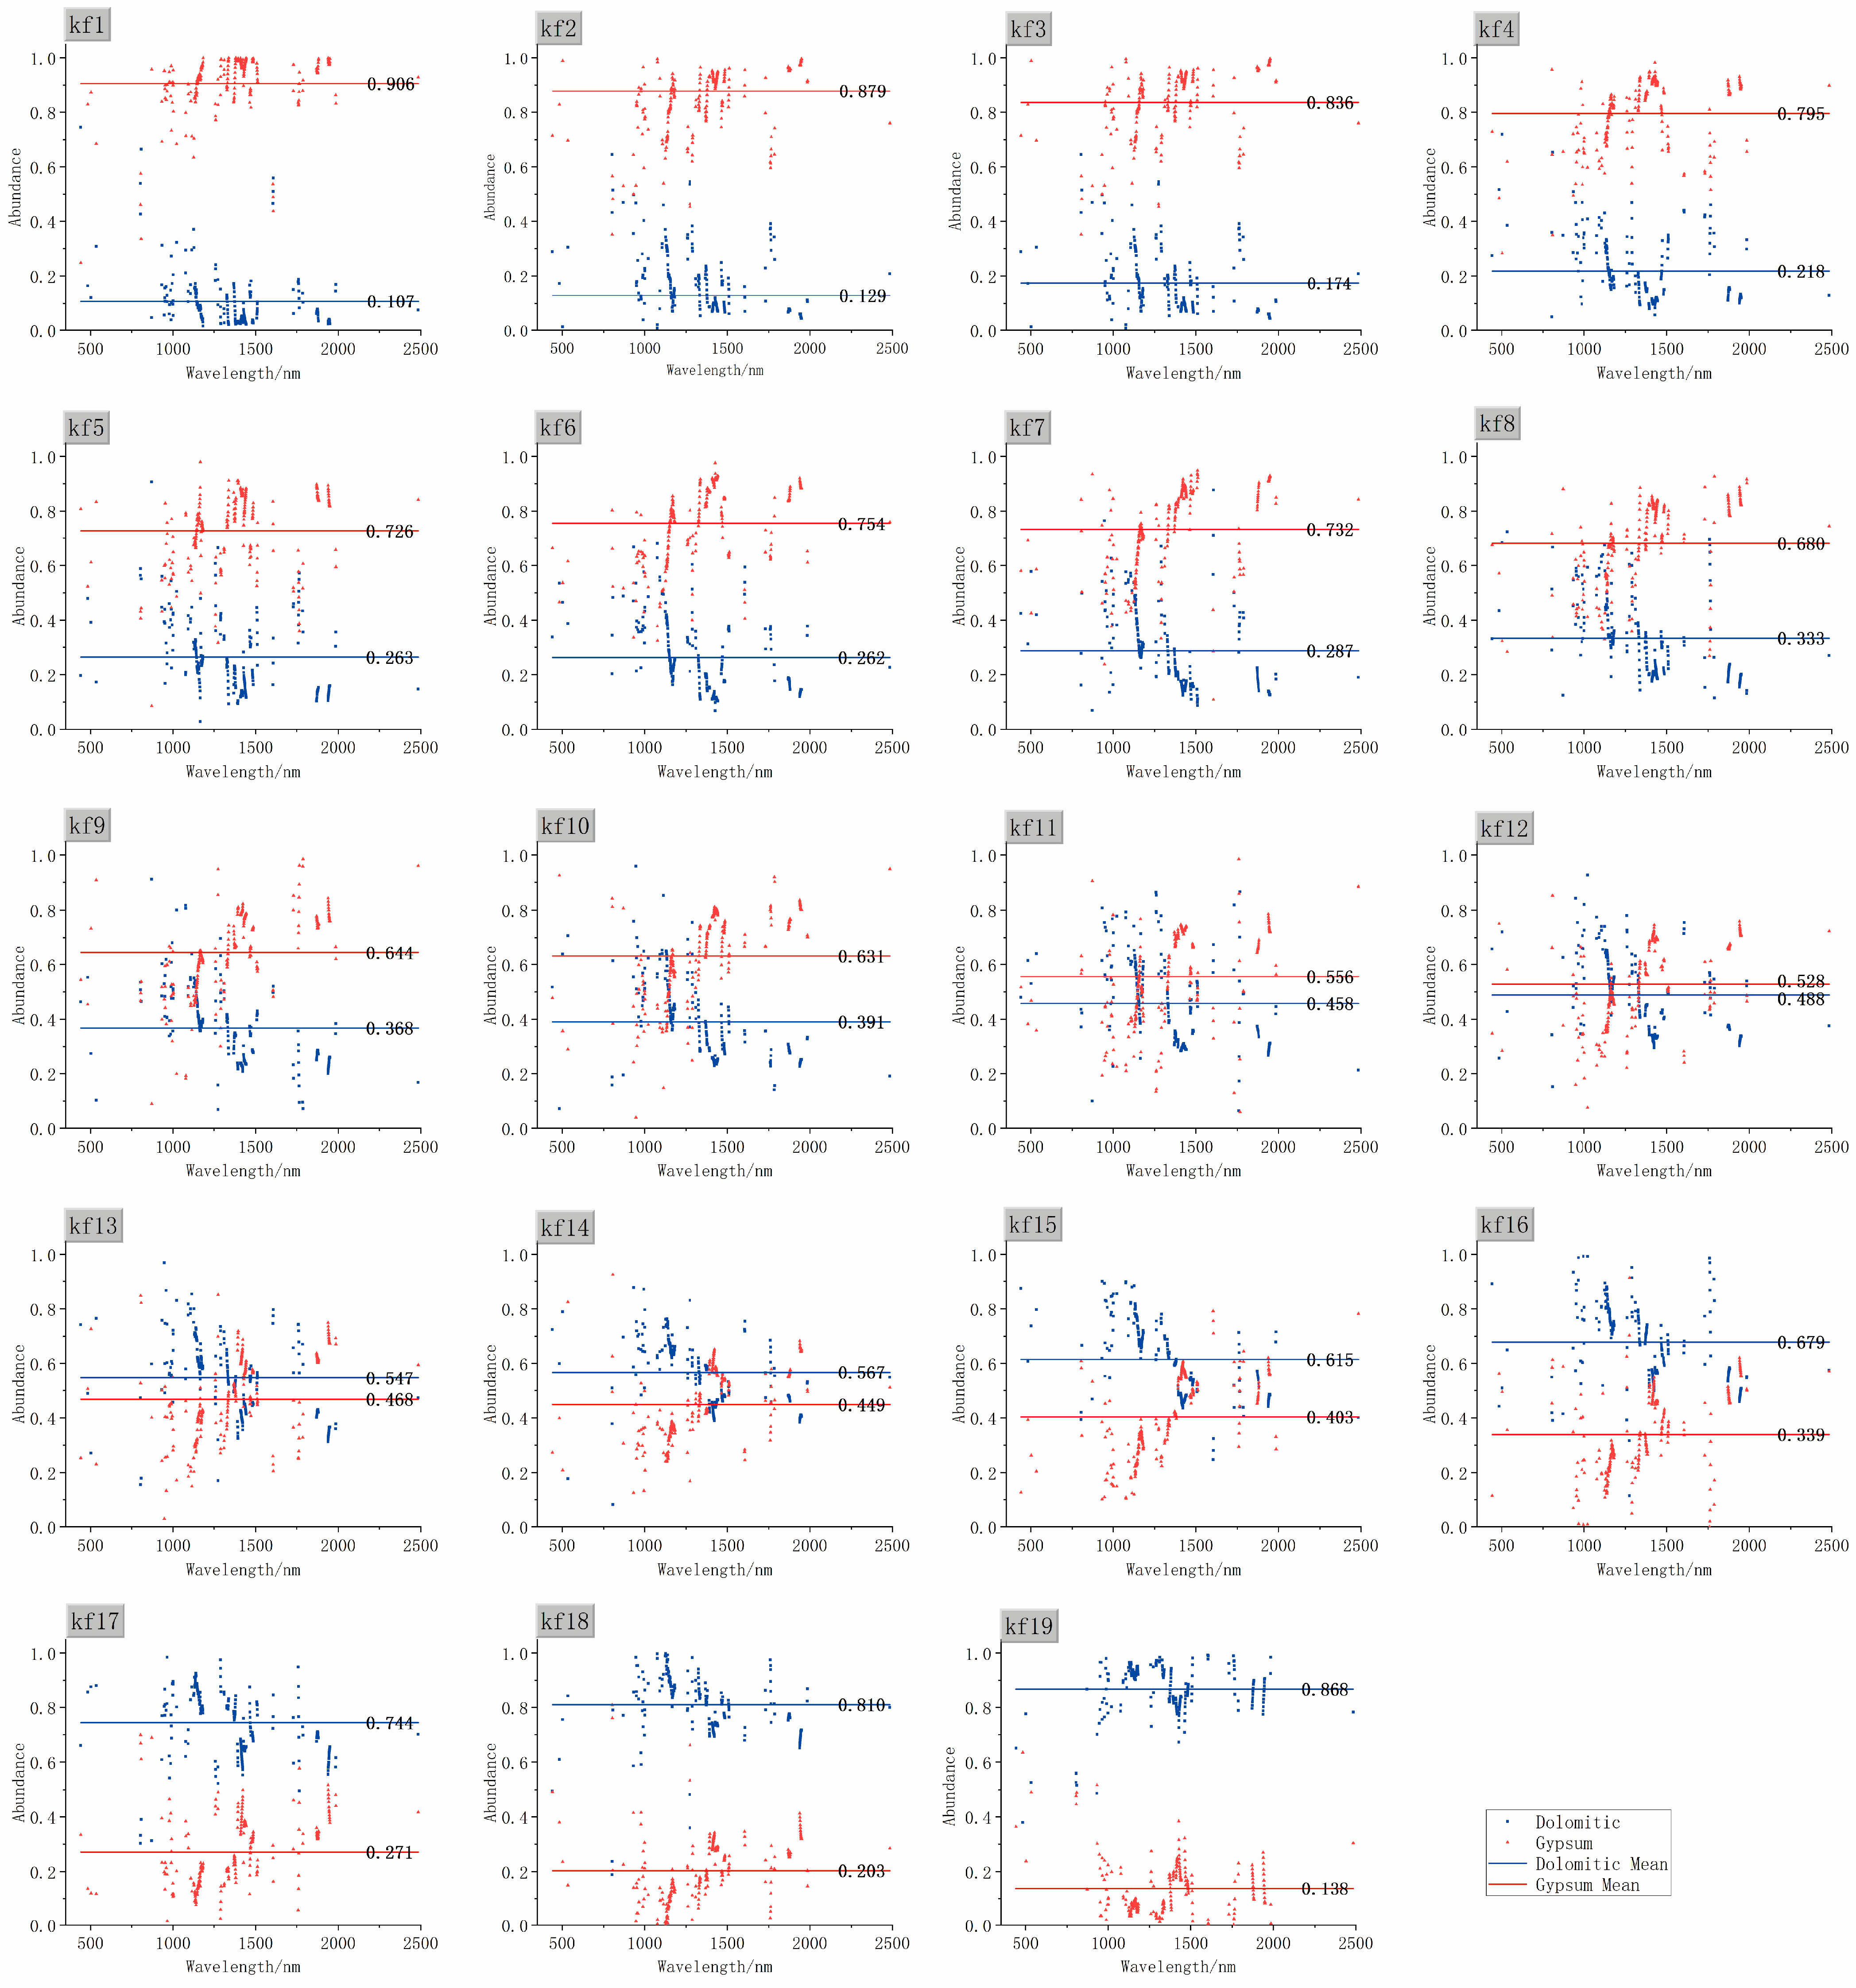
According to the calculation methods of CR-FCLSM and NL-FCLSM, the dolomite abundance and gypsum abundance of each mixed mineral sample are obtained by unmixing calculation. The abundance calculation of all mixed mineral samples based on RDM is shown in Figure 8. It is found from the abundance solution results of the entire band that not all the reflectance spectra of each band conform to the linear mixture model. The nonlinearity degree of spectral mixing in different bands varies, and so does the noise level. Therefore, the inversion results of the abundance of gypsum and dolomite in the mixed mineral powder even exceed the abundance range of 0–1 in some bands. In similar studies, bands are often sorted according to the abundance difference, and bands with minor unmixing errors are selected as strongly linear bands for further analysis. The error between the endmember and actual abundance is relatively small on these bands. The strong linear band refers to the band where the spectral value of reflectance has a strong linear relationship with the abundance of terminal components. The error between the abundance of terminal components obtained by inversion and the abundance in these bands is relatively small. Since this study needs to compare the universal unmixing effects of different linear unmixing models, it is too idealistic to compare the unmixing abundance of the strong linear band. Therefore, based on the unmixing abundance of dolomite, bands with abundance values greater than 1 and less than 0 are eliminated, and the remaining bands with abundance values of 0–1 are left to calculate the arithmetic average. The band with an abundance value in the range of 0–1 was selected to obtain the average abundance value as the sample abundance unmixing result, based on the RDM method, for comparison of the suitability of the three models. It can ensure the abundance of value after screening and facilitate an understanding of the mixing accuracy, as well as aid in comparing the suitability of RDM models.
The actual abundance, unmixing abundance, and abundance difference of dolomite in 19 mixed mineral samples are shown in Table 2. The sum of the abundance of CR-FCLSM and NL-FCLSM is 1, so the difference in the unmixing abundance of the two minerals is also the same. However, because there is no restriction on the abundance in the calculation method of RDM, there is a slight deviation in the difference between the two minerals’ unmixing abundance in some samples. However, it has little influence on comparing the overall unmixing results. The actual dolomite abundance ranges from 0.05 to 0.95. The unmixing abundance of CR-FCLSM ranges from 0.007 to 0.837, with an average abundance difference of 0.160, indicating a significant underestimation trend throughout, especially in samples with low abundance, such as the difference in kf1, which is only 0.043. However, the deviation of high-abundance samples gradually converges. The abundance of NL-FCLSM ranges from 0.087 to 0.907, and the mean difference in its abundance is 0.051, which is significantly better than that of CR-FCLSM. The model was stable in the medium abundance range (kf8) but slightly overestimated for the high abundance sample (kf19). The unmixing abundance of RDM ranges from 0.107 to 0.868, and the mean difference in abundance is 0.078. The overall accuracy of RDM falls between those of the previous two methods. However, the performance of low and high-abundance samples is inconsistent.
The actual abundance, unmixing abundance, and abundance difference results of gypsum in 19 mixed mineral samples are shown in Table 3. The comparison between the measured data and the unmixing results of the three models revealed that the unmixing abundance of CR-FCLSM ranged from 0.163 to 0.993, with a mean difference in abundance of 0.161. The overall performance was slightly overestimated, especially in the low-abundance sample (kf19). The deviation was significant and gradually decreased as the abundance increased. The average unmixing error of NL-FCLSM is 0.051. Its accuracy is significantly better than that of CR-FCLSM. It remains stable in the medium abundance (kf10) and high abundance (kf1) intervals. Only a few samples have abnormal deviations due to nonlinear interference. The range of RDM unmixing abundance is 0.138–0.906, and the mean difference is 0.087. The performance of RDM is between the previous two. However, the model’s adaptability to low-abundance samples is limited. The average abundance errors of CR-FCLSM, NL-FCLSM, and RDM were 0.161, 0.051, and 0.087, respectively.

3.3. Comparison Between the Traditional Linear Spectral Unmixing Model and the Improved Linear Unmixing Model

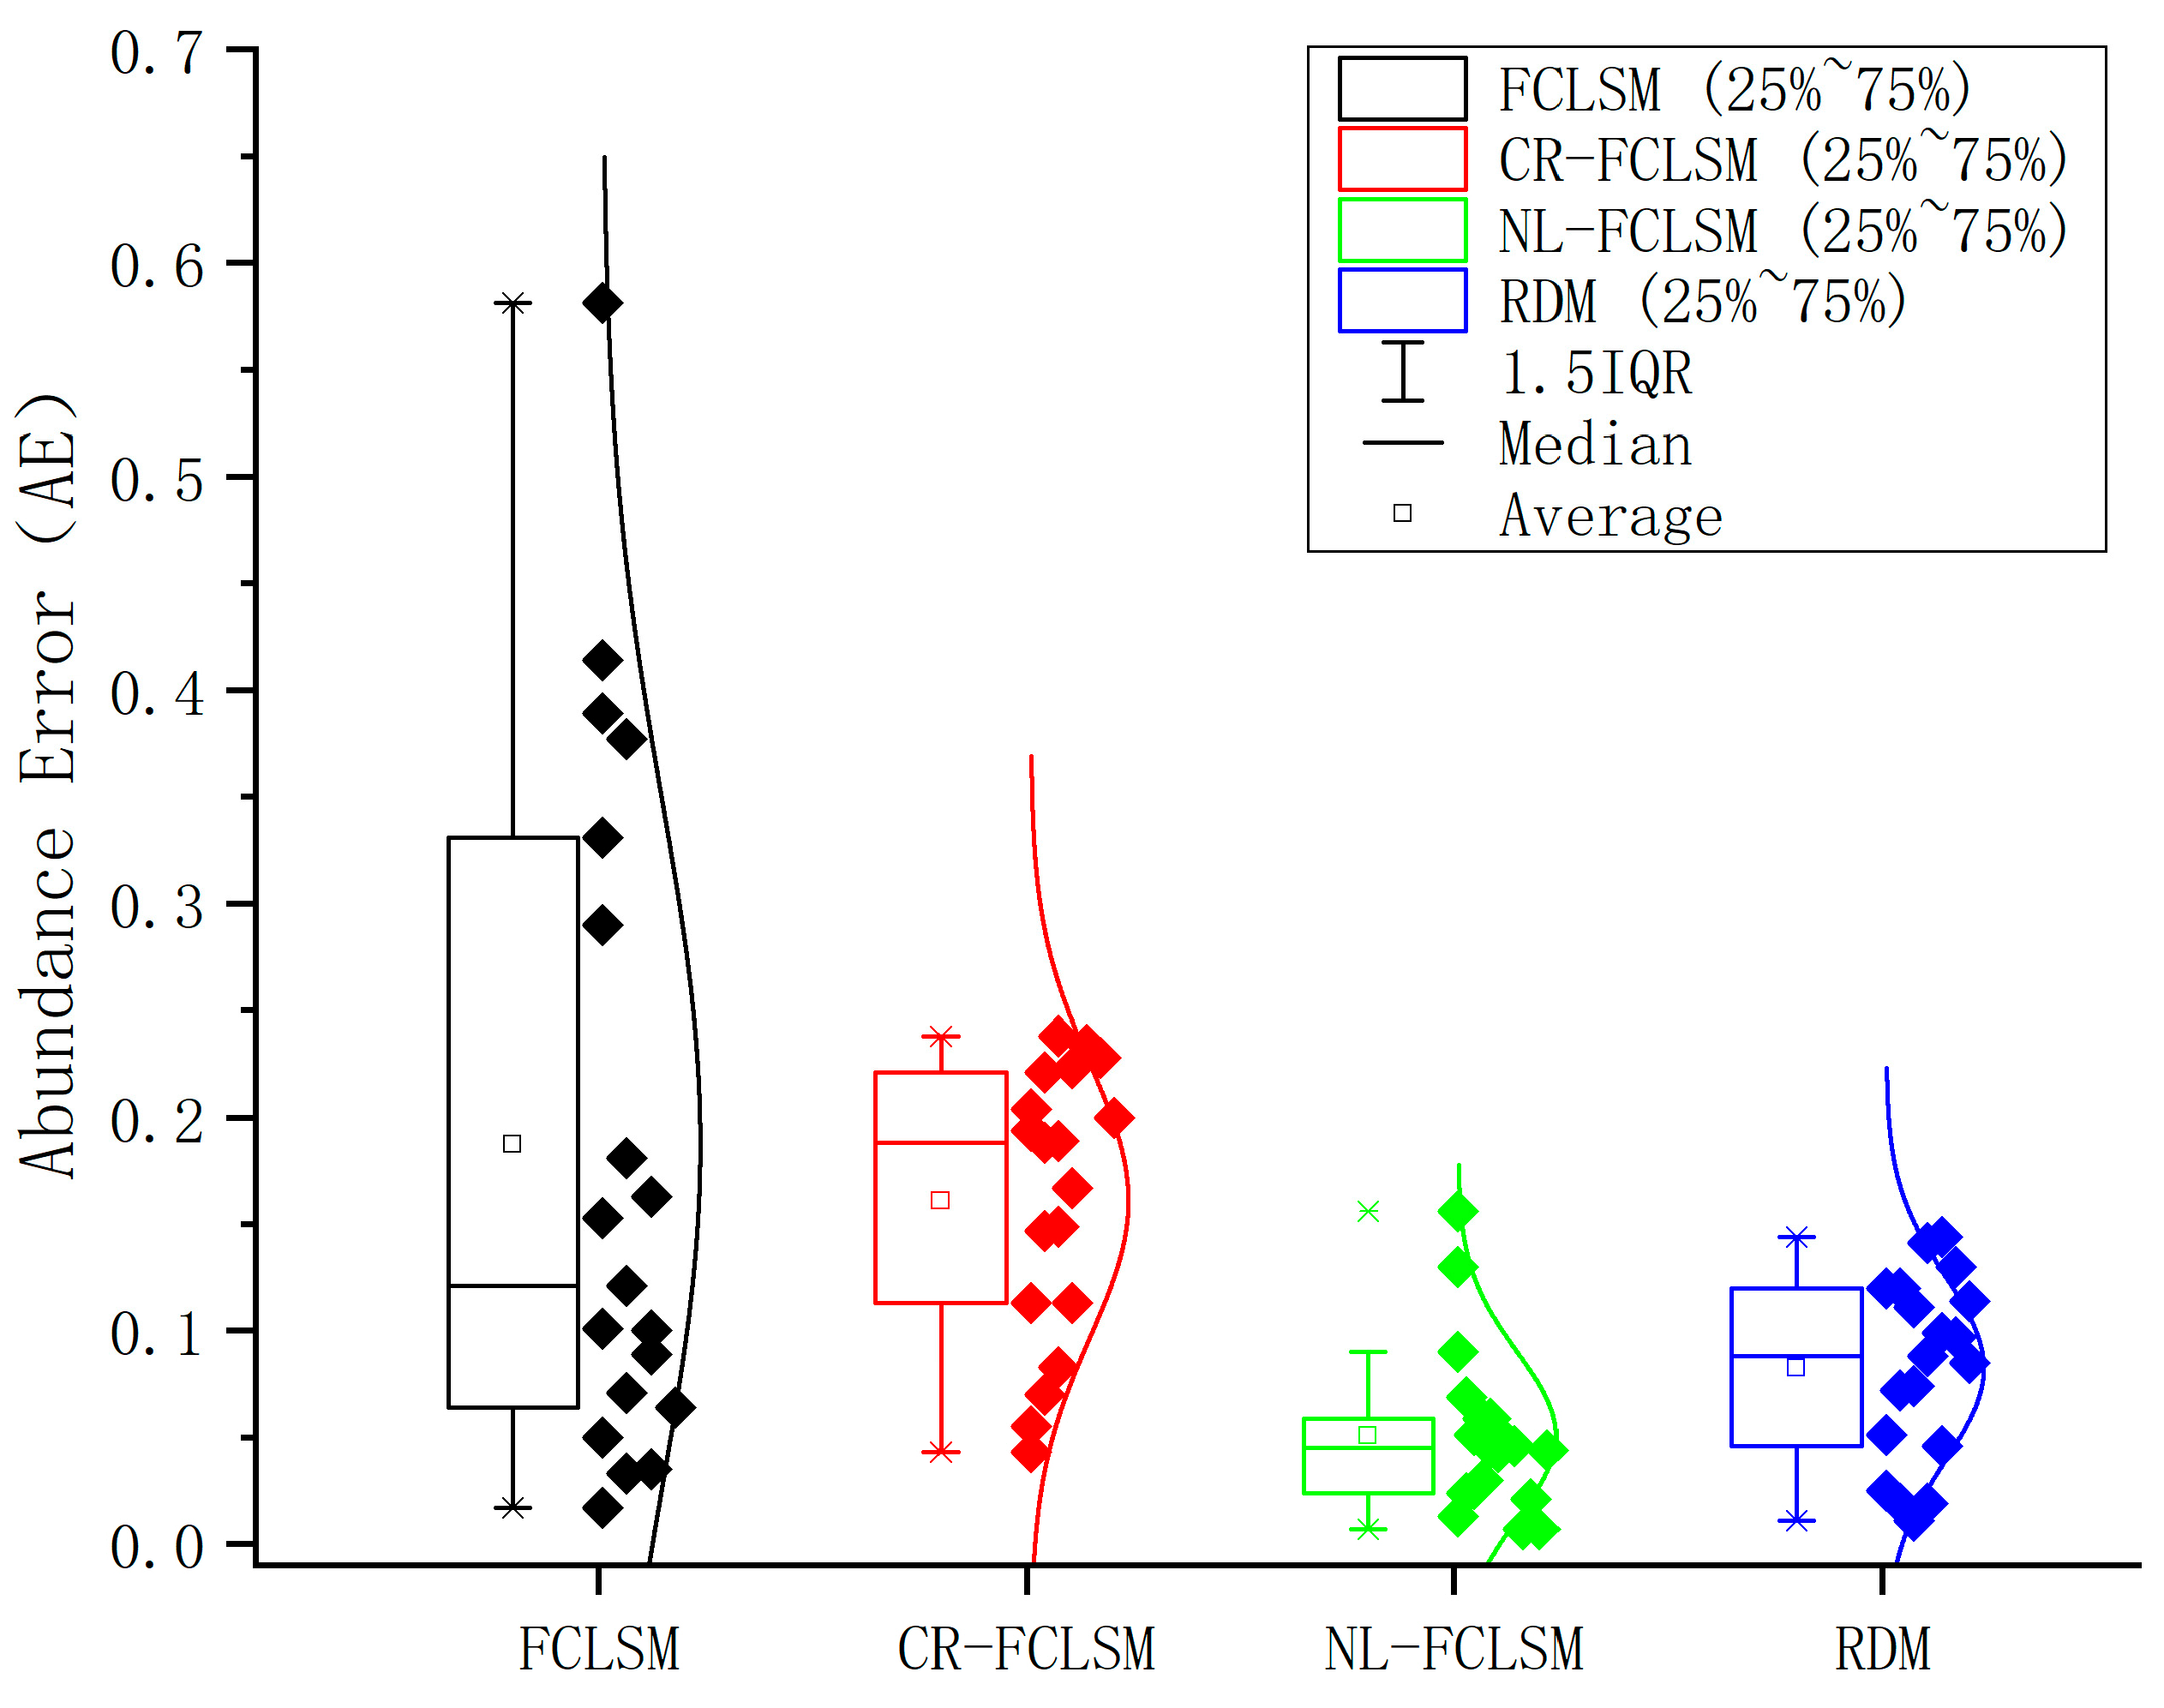
Adding FCLSM to the comparison is to find a more accurate method than the traditional linear spectral model, but one that is more general than the nonlinear regression model for unmixing mixed minerals. Figure 9 shows the error box plots of mixed mineral abundance under three linearization models. Among the three improved linearized spectral unmixing models, CR-FCLSM has the lowest unmixing accuracy, with an average abundance difference of 0.161, which is close to the 0.187 of FCLSM. It indicates that spectral envelope removal can improve the unmixing accuracy to a certain extent, but the effect is limited. The unmixing error of RDM is centered, with an average abundance difference of 0.082. The unmixing error of NL-FCLSM is the smallest, and the average abundance difference obtained by this model is only 0.051. There is also a significant difference between the three linearized models in the upper and lower abundance ranges. Among them, CR-FCLSM has the most significant limit of abundance difference, reaching 0.195, indicating that the data fluctuates wildly, but it is still better than FCLSM. NL-FCLSM has the lowest limit of abundance difference, only 0.02, which suggests that the abundance error is very concentrated.
It can be seen from the median and standard distribution curves that the median line of CR-FCLSM is inclined to the upper side of the box and close to the upper quartile, which indicates that the distribution of abundance difference in this model is strongly skewed and the distribution of abundance difference does not conform to the normal distribution. The median lines of NL-FCLSM and RDM are located in the middle of the box, indicating that the distribution of abundance errors is uniform, with no deviation in some samples. The distribution of abundance differences is more in line with a normal distribution. Considering that the average abundance difference of NL-FCLSM is basically at the 0.05 level, the unmixing accuracy has approached the result of the color mixing simulation experiment, which is very satisfactory for the spectral mixing of complex minerals [32]. The study also demonstrates that the spectral mixing of the two mineral pigments exhibits strong nonlinear mixing characteristics, and the unmixing accuracy can be achieved using linearization methods, such as the ratio derivative method. NL-FCLSM exhibits the best accuracy in gypsum abundance unmixing, making it suitable for complex mineral mixing scenarios [33]. Additionally, the systematic bias of CR-FCLSM may be attributed to its limited sensitivity to low-abundance signals. Therefore, CR-FCLSM needs to be optimized for specific abundance intervals to enhance the practicality of the model in various application scenarios. The mixing strategy of RDM reduces the extreme bias, but the stability still needs to be improved. The calculation process of RDM indicates that the model should select strongly linearly correlated bands for unmixing to achieve the best effect. This principle is not only applicable to the mixed mineral scenario, but also applies to other similar mixed scenarios. The linearization characteristics of NL-FCLSM significantly enhance the mineral unmixing accuracy in both medium-abundance and high-abundance regions.

3.4. Validation of the Applicability of the Improved Spectral Unmixing Model in Mineral Mixing Scenarios

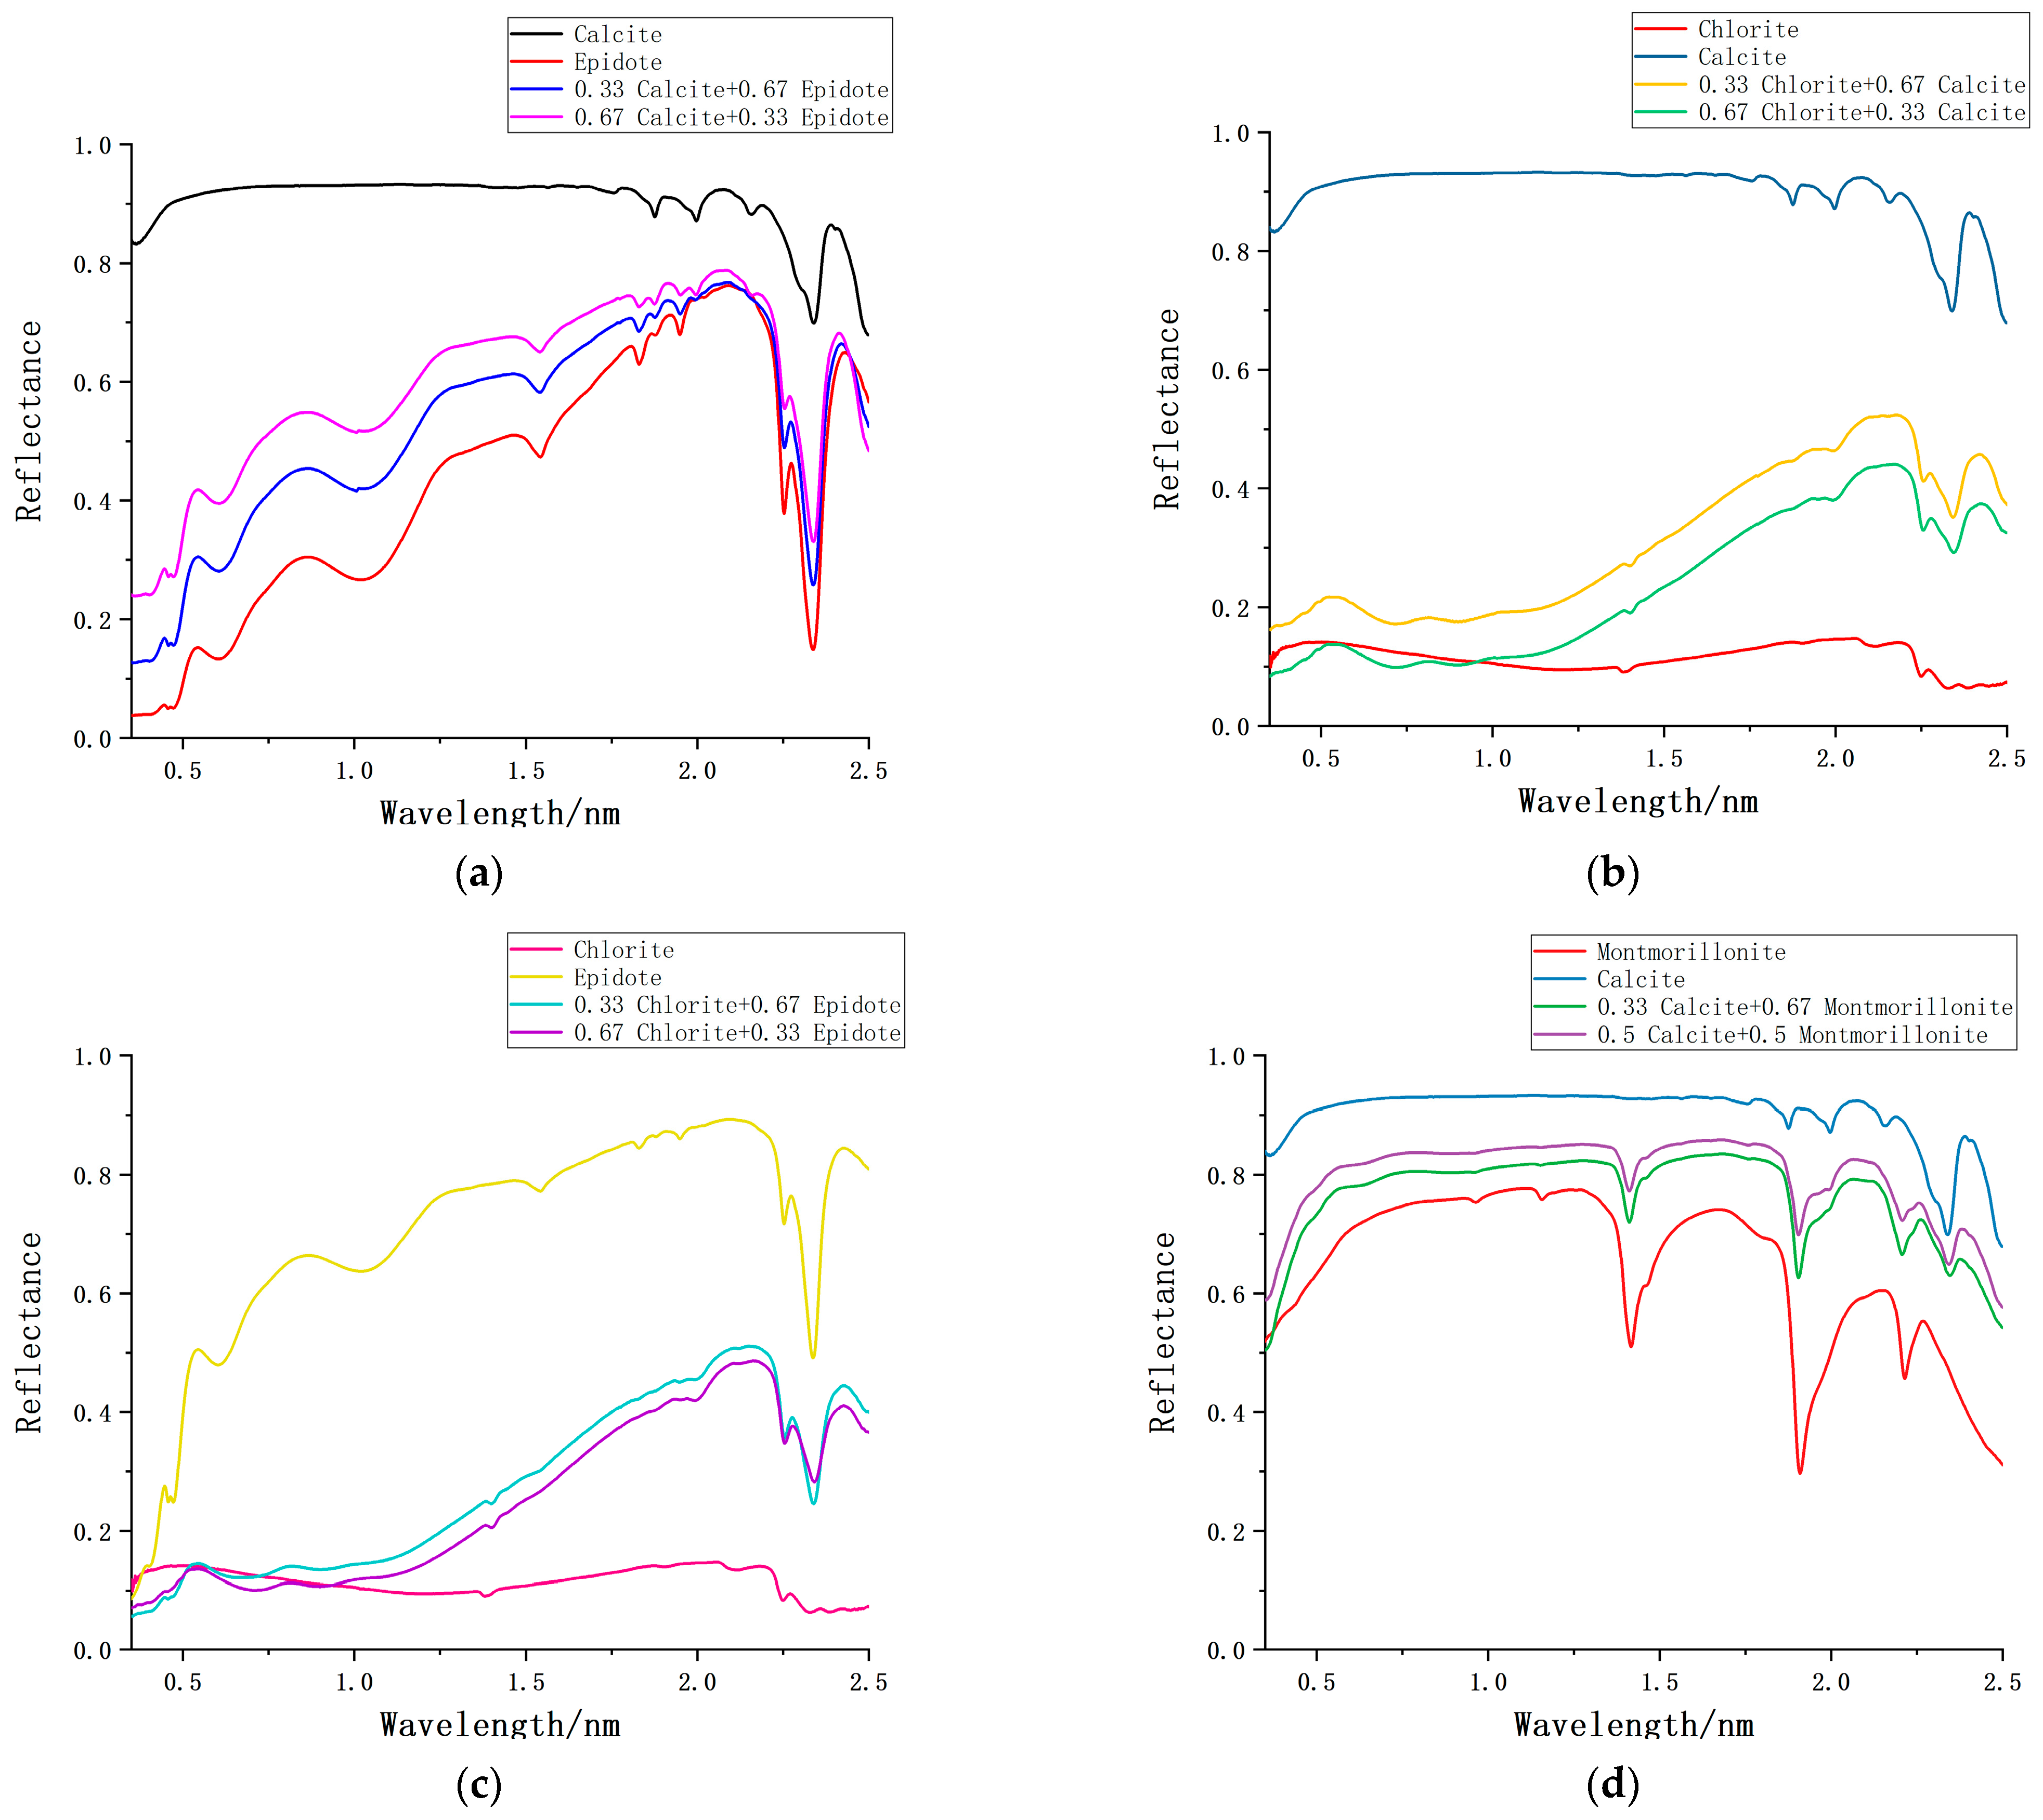
The unmixing experiment of binary mixtures (dolomite and gypsum) in a laboratory environment can avoid the interference of many uncontrollable factors on the mixed minerals. However, it also limits the applicability of the unmixing model [34]. To verify the performance of the improved linear unmixing model in more mineral scenarios, we introduced the mixed mineral Spectral data in the USGS Spectral Library. The United States Geological Survey established the USGS spectral database. It collects the reflectance spectra of minerals, rocks, soils, plants, and other objects measured by laboratory, field, and aerial spectrometers, and compiles the data from XRD, electron probe, and other analytical techniques of related samples into a comprehensive spectral database [35]. The spectral library dataset comprises a large amount of reflectance spectral data for pure and mixed minerals. Each spectrum has a purity index and a metadata description. The representative mixed mineral combinations selected are Calcite and Epidote, Chlorite and Calcite, Chlorite and Epidote, and Chlorite and Epidote. In the abundance inversion experiment of reflection spectra, these four groups of mixed mineral samples have significant geological indications. For instance, calcite and Epidote are commonly found in skarnization or the coexistence of medium and low-temperature hydrothermal alteration environments. Chlorite and calcite are often found in low-grade metamorphic rocks or hydrothermal veins. Chlorite and Epidote primarily form in medium- to low-temperature metamorphic rocks and hydrothermal alteration zones. Calcite and montmorillonite only coexist in surface weathering zones or the early stages of sedimentary diagenesis. The original spectra of these four groups of mixed minerals are shown in Figure 10.
The NL-FCLSM has excellent unmixing performance in the binary mixed mineral scenario of dolomite and gypsum. However, the applicability of the model in more mixed mineral scenarios needs to be further verified. We conducted reflectance abundance inversion experiments on eight mixed minerals using FCLSM and NL-FCLSM, and the results are shown in Table 4. For the four groups of mixed mineral verification samples, NL-FCLSM was significantly superior to the FCLSM method in the mineral spectral unmixing task, and the average abundance error decreased from 0.224 to 0.122. In a specific mixed mineral (0.67 Chlorite + 0.33 Calcite), the AE of FCLSM is as high as 0.524, while that of NL-FCLSM is only 0.0427. NL-FCLSM enhances understanding and mixing accuracy through linearization transformation, and exhibits stronger adaptability to scenarios with a high proportion of minerals and nonlinear spectral mixing. Whether using measured spectra or shared spectral database data, the results of the improved linear unmixing model are superior to those of the traditional linear unmixing model [36]. The spectral information of the mixed mineral powder retained after linearization processing is more consistent with linear spectral mixing theory. It exhibits better universality than the nonlinear model [37].
Additionally, the scene of the mixture of two real ground objects is widespread, including vegetation and soil, water bodies and artificial buildings, geological landslide bodies and non-landslide bodies, among others. The accurate extraction of area ratios and spatial distribution information of ground objects holds significant social and economic prospects for the application of spectral unmixing. The complexity and diversity of natural features, as well as changes in environmental conditions, are key factors affecting unmixing. It has been demonstrated to be feasible to extend physical mixing from indoor simulation mixing experiments to real-world scenes [38,39]. For the blending of real ground objects in the natural environment, the influence of internal and external factors on the mixed pixels during unmixing is still inevitable. Drawing on the relevant theoretical achievements of indoor spectral unmixing, ideas and methods can be provided to unmix real ground objects to a certain extent. Compared to the first two mixed scenarios, multiple scattering effects between ground objects are intensified by various factors, including light intensity, phase variation, atmospheric scattering, and surface undulation, resulting in a complex mixing mechanism of ground object spectra [40,41]. Most of the spectral mixtures of real ground objects do not meet the conditions of linear unmixing. Currently, the adoption of the linear unmixing model after function transformation can offer new insights for unmixing experiments.

4. Conclusions

This study was designed to create a set of mineral samples from dolomite and gypsum in various proportions. The applicability of three improved spectral decomposition models and the traditional linear spectral unmixing model was compared in the mixed mineral scene. Among the three improved unmixing models, in terms of accuracy ranking, NL-FCLSM is superior to CR-FCLSM and RDM. The results of the three improved linearized unmixing models are better than those of the traditional linear spectral unmixing model. We proved this point through multiple sets of mixed mineral data from the USGS spectral database. Whether using measured spectra or shared spectral database data, the results of the improved linear unmixing model are superior to those of the traditional linear unmixing model. The NL-FCLSM effectively enhanced the linear characteristic of the spectrum, making it more suitable for two mineral mixing scenarios. The systematic bias of CR-FCLSM may be due to its insufficient sensitivity to low-abundance signals. The stability of RDM depends on the selection of a strong linear band. Using the improved linear unmixing methods is considered suitable in a mixed mineral scenario, as they are more accurate than the traditional linear spectral model and simpler than the nonlinear spectral model, providing a new approach for unmixing hyperspectral images. The mineral mixing patterns in the natural environment are rather complex; multiple minerals usually coexist and form symbiotic relationships. The sample limits this experiment and cannot reflect the spectral mixing characteristics of heterogeneous rock samples in the natural environment. We will collect more mixed data on multiple ground objects in the following research, enabling the improved linear spectral unmixing model to contribute to the fields of mineral exploration and geological environment monitoring.

Author Contributions

Conceptualization, H.Z. and L.D.; methodology, H.Z. and D.L.; validation, H.Z. and H.L.; writing—original draft preparation, H.Z.; writing—review and editing, H.Z., D.L., H.L., Y.Z., and Y.L. handled data curation. All authors have read and agreed to the published version of the manuscript.

Funding

The study is supported by Yunnan Fundamental Research Projects (grant No. 202501AT070395, grant No. 202401AT071119, and grant No. 202201AU070029).

Institutional Review Board Statement

Not applicable.

Informed Consent Statement

Not applicable.

Data Availability Statement

The original contributions presented in this study are included in the article material. Further inquiries can be directed to the corresponding author.

Acknowledgments

We thank the RS and GIS doctoral innovation team of Qujing Normal University and the Pearl River Source ecological civilization construction research base of Qujing Normal University, which supported the study.

Conflicts of Interest

The authors declare no conflicts of interest.

Abbreviations

The following abbreviations are used in this manuscript:
FCLSMFully Constrained Linear Spectral Mode
CR-FCLSMContinuum Removal—Fully Constrained Linear Spectral Model
NL-FCLSMNatural Logarithm—Fully Constrained Linear Spectral Model
RDMRatio Derivative Model
AEAbundance Error

References

  1. Smith, M.O.; Johnson, P.E.; Adams, J.B. Quantitative determination of mineral types and abundances from reflectance spectra using principal components analysis. J. Geophys Res. Solid Earth. 1985, 90, 797–804. [Google Scholar] [CrossRef]
  2. Celik, B. QLSU (QGIS Linear Spectral Unmixing) Plugin: An open source linear spectral unmixing tool for hyperspectral & multispectral remote sensing imagery. Environ. Model. Softw. 2023, 168, 105782. [Google Scholar]
  3. Keshava, N.; Mustard, J.F. Spectral unmixing. IEEE Signal Process. Mag. 2002, 19, 44–57. [Google Scholar] [CrossRef]
  4. Ramakrishnan, D.; Bharti, R. Hyperspectral remote sensing and geological applications. Curr. Sci. 2015, 108, 879–891. [Google Scholar]
  5. Moghadam, H.J.; Oskouei, M.M.; Nouri, T. Unmixing of hyperspectral data for mineral detection using a hybrid method, Sar Chah-e Shur, Iran. Arab. J. Geosci. 2020, 13, 1–17. [Google Scholar] [CrossRef]
  6. Kopačková, V.; Hladíková, L. Applying spectral unmixing to determine surface water parameters in a mining environment. Remote Sens. 2014, 6, 11204–11224. [Google Scholar] [CrossRef]
  7. Ertürk, A.; Erten, E. Unmixing of pollution-associated sea snot in the near surface after its outbreak in the Sea of Marmara using hyperspectral PRISMA data. IEEE Geosci. Remote Sens. Lett. 2023, 20, 1–5. [Google Scholar] [CrossRef]
  8. Lin, H.; Zhang, X. Retrieving the hydrous minerals on Mars by sparse unmixing and the Hapke model using MRO/CRISM data. Icarus 2017, 288, 160–171. [Google Scholar] [CrossRef]
  9. Wang, Y.; Lyu, S.; Ning, B.; Yan, D.; Hou, M.; Sun, P.; Li, L. Spectral Unmixing of Pigments on Surface of Painted Artefacts Considering Spectral Variability. ISPRS Annals of the Photogrammetry. Remote Sens. Spat. Inf. Sci. 2024, 10, 403–409. [Google Scholar] [CrossRef]
  10. Clark, R.N.; Roush, T.L. Reflectance spectroscopy: Quantitative analysis techniques for remote sensing applications. J. Geophys. Res. Solid Earth 1984, 89, 6329–6340. [Google Scholar] [CrossRef]
  11. Hapke, B. Bidirectional reflectance spectroscopy: 1. Theory. J. Geophys. Res. Solid Earth 1981, 86, 3039–3054. [Google Scholar] [CrossRef]
  12. Mustard, J.F.; Murchie, S.L.; Pelkey, S.M.; Ehlmann, B.L.; Milliken, R.E.; Gendrin, A.; LeMoigne, J. Martian clay minerals formed by evaporitic processes. Nat. Geosci. 2012, 5, 398–402. [Google Scholar]
  13. Shipman, H.; Adams, J.B. Feasibility of detecting minerals in desert alluvial fans using reflection spectra. J. Geophys. Res. 1987, 92, 10391–10392. [Google Scholar] [CrossRef]
  14. Hapke, B. Bidirectional reflectance spectroscopy: 4. The extinction coefficient and the opposition effect. Icarus 1986, 67, 264–280. [Google Scholar] [CrossRef]
  15. Keshava, N. A survey of spectral unmixing algorithms. Linc. Lab. J. 2003, 14, 55–78. [Google Scholar]
  16. Hapke, B. Theory of Reflectance and Emittance Spectroscopy, 2nd ed.; Cambridge University Press: Cambridge, UK, 2012. [Google Scholar]
  17. Bioucas-Dias, J.M.; Plaza, A.; Camps-Valls, G.; Scheunders, P.; Nasrabadi, N.M.; Chanussot, J. Hyperspectral unmixing overview: Geometrical, statistical, and sparse regression-based approaches. IEEE J. Sel. Top. Appl. Earth Obs. Remote Sens. 2012, 5, 354–379. [Google Scholar] [CrossRef]
  18. Wan, L.; Chen, T.; Plaza, A.; Cai, H. Hyperspectral unmixing based on spectral and sparse deep convolutional neural networks. IEEE J. Sel. Top. Appl. Earth Obs. Remote Sens. 2021, 14, 11669–11682. [Google Scholar] [CrossRef]
  19. Heylen, R.; Parente, M.; Gader, P. A review of nonlinear hyperspectral unmixing methods. IEEE J. Sel. Top. Appl. Earth Obs. Remote Sens. 2014, 7, 1844–1868. [Google Scholar] [CrossRef]
  20. Faul, U.H. Permeability of partially molten upper mantle rocks from experiments and percolation theory. J. Geophys. Res. Solid Earth 1997, 102, 10299–10311. [Google Scholar] [CrossRef]
  21. Chen, K.; Bowler, J.M.; Magee, J.W. Hydrological evolution of the Lop Nur basin (China) during the Late Quaternary inferred from evaporite mineralogy and sedimentology. Quat. Sci. Rev. 2018, 199, 134–150. [Google Scholar]
  22. Li, M.; Zhang, X.; Liu, C. Origin of the Late Triassic evaporite deposits in the Sichuan Basin, China: Constraints from boron isotopes. Sediment. Geol. 2020, 406, 105725. [Google Scholar]
  23. Gu, X.; Zhang, Y.; Li, B. Fluid inclusion and stable isotope constraints on the genesis of fluorite deposits in southern Hunan, China. Ore Geol. Rev. 2019, 115, 103181. [Google Scholar]
  24. Beretka, J.; Crook, D.N.; King, G.A. Physico-chemical properties of by-product gypsum. J. Chem. Technol. Biotechnol. 1981, 31, 151–162. [Google Scholar] [CrossRef]
  25. Zhao, M.; Chen, J.; He, Z. A laboratory-created dataset with ground truth for hyperspectral unmixing evaluation. IEEE J. Sel. Top. Appl. Earth Obs. Remote Sens. 2019, 12, 2170–2183. [Google Scholar] [CrossRef]
  26. Thouvenin, P.A.; Dobigeon, N.; Tourneret, J.Y. Hyperspectral unmixing with spectral variability using a perturbed linear mixing model. IEEE Trans. Signal Process. 2015, 64, 525–538. [Google Scholar] [CrossRef]
  27. Poulet, F.; Erard, S. Nonlinear spectral mixing: Quantitative analysis of laboratory mineral mixtures. J. Geophys. Res. Planets 2004, 109, 1–12. [Google Scholar] [CrossRef]
  28. Liu, Y.; Li, X.R.; Chen, H. Linear estimation with transformed measurement for nonlinear estimation. IEEE Trans. Aerosp. Electron. Syst. 2016, 52, 221–236. [Google Scholar] [CrossRef]
  29. Miranker, W.L.; Van Veldhuizen, M. The method of envelopes. Math. Comput. 1978, 32, 453–496. [Google Scholar] [CrossRef]
  30. Fernández-González, A.; Montejo-Bernardo, J.M. Natural Logarithm Derivative Method: A novel and easy methodology for finding maximums in overlapping experimental peaks. Spectrochim. Acta Part A Mol. Biomol. Spectrosc. 2009, 74, 714–718. [Google Scholar] [CrossRef]
  31. Zhao, H.Q.; Zhang, L.F.; Wu, T.X.; Huang, C.P. Research on the model of spectral unmixing for minerals based on derivative of ratio spectroscopy. Spectrosc. Spectr. Anal. 2013, 33, 172–176. [Google Scholar]
  32. Yu, X.; Lin, W.; Wang, D.; Li, Y.; Sun, Y. Identification and characteristic analysis of urban vegetation spectra under different dust deposition. Environ. Sci. Pollut. Res. 2023, 30, 21299–21312. [Google Scholar] [CrossRef]
  33. Wu, B.; Wang, J.; Zhang, B.; Dong, Y. Influencing Factor Analysis of Spectral Unmixing Model for Solid Particle Mixtures. J. Mater. Sci. Eng. 2021, 39, 814–819. [Google Scholar]
  34. Zhang, H.; Yu, L.; Li, D. Characteristic band selection of hyperspectral unmixing based on pixel simulation experiment. Spectrosc. Lett. 2025, 2, 1–13. [Google Scholar] [CrossRef]
  35. Kokaly, R.F.; Clark, R.N.; Swayze, G.A.; Livo, K.E.; Hoefen, T.M.; Pearson, N.C.; Klein, A.J. USGS Spectral Library Version 7; USGS: Reston, VA, USA, 2017; p. 1035. [Google Scholar]
  36. Deville, Y.; Faury, G. Hyperspectral unmixing with spectral variability: Reducing sensitivity to learning parameters, by combining linear and nonlinear NMF algorithms. Digit. Signal Process. 2025, 163, 105241. [Google Scholar] [CrossRef]
  37. Campos-Delgado, D.U.; Mendoza-Chavarría, J.N.; Gutierrez-Navarro, O.; Quintana-Quintana, L.; Leon, R.; Ortega, S.; Callico, G.M. Robust and Unified Semi-Supervised Unmixing of Hyperspectral Imaging for Linear and Multilinear Models. IEEE Access. 2025, 13, 53140–53158. [Google Scholar] [CrossRef]
  38. Grillini, F.; Thomas, J.-B.; George, S. Comparison of Imaging Models for Spectral Unmixing in Oil Painting. Sensors 2021, 21, 2471. [Google Scholar] [CrossRef] [PubMed]
  39. Valero, E.M.; Martínez-Domingo, M.A.; López-Baldomero, A.B.; López-Montes, A.; Abad-Muñoz, D.; Vílchez-Quero, J.L. Unmixing and pigment identification using visible and short-wavelength infrared: Reflectance vs logarithm reflectance hyperspaces. J. Cult. Heritage. 2023, 64, 290–300. [Google Scholar] [CrossRef]
  40. Du, R.; Chen, J.; Xiang, Y.; Xiang, R.; Yang, X.; Wang, T.; Chen, Y. Timely monitoring of soil water-salt dynamics within cropland by hybrid spectral unmixing and machine learning models. Int. Soil Water Conserv. Res. 2024, 12, 726–740. [Google Scholar] [CrossRef]
  41. Jeong, S.W.; Lee, I.H.; Kim, Y.G.; Kang, K.S.; Shim, D.; Hurry, V.; Park, Y.I. Spectral unmixing of hyperspectral images revealed pine wilt disease sensitive endmembers. Physiol. Plant. 2025, 177, e70090. [Google Scholar] [CrossRef]
Figure 1. Mineral content detection results of XRD. (a) Dolomite; (b) Gypsum.
Minerals 15 00715 g001
Figure 2. Photos of mixed mineral samples. (a) Initial sample; (b) Packaged sample.
Minerals 15 00715 g002
Figure 3. Measurement result of spectral data of mixed minerals.
Minerals 15 00715 g003
Figure 4. Original (a) and Envelope removal (b) spectra of mixed minerals.
Minerals 15 00715 g004
Figure 5. Original (a) and natural logarithm (b) spectra of mixed minerals.
Minerals 15 00715 g005
Figure 6. Ratio spectra of mixed minerals. (a) Dolomite character removed; (b) Gypsum character removed.
Minerals 15 00715 g006
Figure 7. Ratio derivative spectra of mixed minerals. (a) Gypsum character retained; (b) Dolomite character retained.
Minerals 15 00715 g007
Figure 8. Abundance calculation of mixed mineral powder based on RDM.
Minerals 15 00715 g008
Figure 9. Comparison of abundance errors of the unmixing model in a mixed mineral scenario.
Minerals 15 00715 g009
Figure 10. The reflectance spectra of typical mixed minerals in the USGS spectral library. (a) Calcite and Epidote; (b) Chlorite and Calcite; (c) Chlorite and Epidote; (d) Calcite and Montmorillonite.
Minerals 15 00715 g010
Table 1. Mixing proportion of mixed mineral samples.
Sample NumberMixing RatioWeight of Dolomite (g)Weight of Gypsum (g)
kf15% Dolomite, 95% Gypsum2.0032.87
kf210% Dolomite, 90% Gypsum4.0031.14
kf315% Dolomite, 85% Gypsum6.0029.41
kf420% Dolomite, 80% Gypsum8.0027.68
kf525% Dolomite, 75% Gypsum10.0025.95
kf630% Dolomite, 70% Gypsum12.0024.22
kf735% Dolomite, 65% Gypsum14.0022.49
kf840% Dolomite, 60% Gypsum16.0020.76
kf945% Dolomite, 55% Gypsum18.0019.03
kf1050% Dolomite, 50% Gypsum20.0017.38
kf1155% Dolomite, 45% Gypsum22.0015.57
kf1260% Dolomite, 40% Gypsum24.0013.84
kf1365% Dolomite, 35% Gypsum26.0012.11
kf1470% Dolomite, 30% Gypsum28.0010.38
kf1575% Dolomite, 25% Gypsum30.008.65
kf1680% Dolomite, 20% Gypsum32.006.92
kf1785% Dolomite, 15% Gypsum34.005.19
kf1890% Dolomite, 10% Gypsum36.003.46
kf1995% Dolomite, 5% Gypsum38.001.73
Table 2. The results of the abundance unmixing of dolomite in mixed minerals.
SampleActual AbundanceCR-FCLSMNL-FCLSMRDM
Unmixing AbundanceAEUnmixing AbundanceAEUnmixing AbundanceAE
kf10.050.0070.0430.1400.0900.1070.057
kf20.10.0450.0550.0870.0130.1290.029
kf30.150.0800.0700.2190.0690.1740.024
kf40.20.1170.0830.2240.0240.2180.018
kf50.250.1370.1130.1200.1300.2630.013
kf60.30.1530.1470.2740.0260.2620.038
kf70.350.2020.1490.3190.0300.2870.063
kf80.40.2060.1940.3490.0510.3330.067
kf90.450.2620.1880.3910.0590.3680.082
kf100.50.2970.2040.4550.0450.3910.109
kf110.550.3610.1890.3940.1560.4580.092
kf120.60.3790.2210.5570.0430.4880.112
kf130.650.4120.2380.6020.0480.5470.103
kf140.70.4770.2230.6540.0460.5670.133
kf150.750.5160.2340.6910.0590.6150.135
kf160.80.5720.2280.7930.0070.6790.121
kf170.850.6500.2000.8710.0210.7440.106
kf180.90.7330.1670.9070.0070.8100.090
kf190.950.8370.1130.9060.0440.8680.082
Mean //0.161 /0.051 /0.078
Table 3. The results of the abundance unmixing of gypsum in mixed minerals.
SampleActual AbundanceCR-FCLSMNL-FCLSMRDM
Unmixing AbundanceAEUnmixing AbundanceAEUnmixing AbundanceAE
kf10.950.993 0.043 0.860 0.090 0.906 0.044
kf20.90.955 0.055 0.913 0.013 0.879 0.021
kf30.850.920 0.070 0.781 0.069 0.836 0.014
kf40.80.883 0.083 0.777 0.024 0.795 0.005
kf50.750.863 0.113 0.880 0.130 0.726 0.024
kf60.70.847 0.147 0.726 0.026 0.754 0.054
kf70.650.799 0.149 0.680 0.030 0.732 0.082
kf80.60.794 0.194 0.651 0.051 0.680 0.080
kf90.550.738 0.188 0.609 0.059 0.644 0.094
kf100.50.704 0.204 0.545 0.045 0.631 0.131
kf110.450.639 0.189 0.606 0.156 0.556 0.106
kf120.40.621 0.221 0.443 0.043 0.528 0.128
kf130.350.588 0.238 0.398 0.048 0.468 0.118
kf140.30.523 0.223 0.346 0.046 0.449 0.149
kf150.250.484 0.234 0.309 0.059 0.403 0.153
kf160.20.428 0.228 0.207 0.007 0.339 0.139
kf170.150.350 0.200 0.129 0.021 0.271 0.121
kf180.10.267 0.167 0.093 0.007 0.203 0.103
kf190.050.163 0.113 0.094 0.044 0.138 0.088
Mean//0.161 /0.051 /0.087
Table 4. Verification results of the unmixing applicability of NL-FCLSM.
Mixed MineralsFCLSMNL-FCLSM
Unmixing
Abundance/a1
Unmixing
Abundance/a2
AEUnmixing
Abundance/a1
Unmixing
Abundance/a2
AE
0.33 Calcite + 0.67 Epidote0.202 0.798 0.128 0.369 0.631 0.039
0.67 Calcite + 0.33 Epidote0.346 0.654 0.324 0.550 0.445 0.115
0.33 Chlorite + 0.67 Calcite0.245 0.755 0.085 0.545 0.455 0.215
0.67 Chlorite + 0.33 Calcite0.146 0.854 0.524 0.713 0.287 0.043
0.33 Chlorite + 0.67 Epidote0.698 0.302 0.368 0.539 0.462 0.209
0.67 Chlorite + 0.33 Epidote0.742 0.258 0.072 0.602 0.398 0.068
0.33 Calcite + 0.67 Montmorillonite0.495 0.505 0.165 0.421 0.580 0.091
0.5 Calcite + 0.5 Montmorillonite0.623 0.377 0.123 0.304 0.696 0.196
Mean \\0.224 \\0.122
Note: The a1 represents the abundance of the first mineral in the mixture, and a2 represents the abundance of the second mineral.
Disclaimer/Publisher’s Note: The statements, opinions and data contained in all publications are solely those of the individual author(s) and contributor(s) and not of MDPI and/or the editor(s). MDPI and/or the editor(s) disclaim responsibility for any injury to people or property resulting from any ideas, methods, instructions or products referred to in the content.