Article

A Predictive Geometallurgical Framework for Flotation Kinetics in Complexes Platinum Group Metal Orebodies: Mode of Occurrence-Based Modification of the Kelsall Model Using Particle Swarm Optimization

by
Alain M. Kabemba
1,
Kalenda Mutombo
2 and
Kristian E. Waters
1,*
1
Department of Mining and Materials Engineering, Faculty of Engineering, McGill University, 3610 University Street, Montreal, QC H3A 0C5, Canada
2
Advanced Materials Engineering, Manufacturing Cluster, Council for Scientific and Industrial Research (CSIR), Meiring Naudé Road, Brummeria, Pretoria 0184, South Africa
*
Author to whom correspondence should be addressed.
Minerals 2025, 15(7), 701; https://doi.org/10.3390/min15070701
Submission received: 23 May 2025 / Revised: 17 June 2025 / Accepted: 26 June 2025 / Published: 30 June 2025
(This article belongs to the Section Mineral Processing and Extractive Metallurgy)

Abstract

Mineralogical variability exerts a profound influence on the flotation performance of Platinum Group Metal (PGM) ores, particularly those from the Platreef deposit, where complex associations and textures influence recovery, grade, and kinetics. This study integrates the Mode of Occurrence (MOC) and mineral associations into a modified Kelsall flotation kinetics model, optimized using a Particle Swarm Optimization (PSO) algorithm, to improve prediction accuracy. Batch flotation tests were conducted on eight samples from two lithologies—Pegmatoidal Feldspathic Pyroxenite (P-FPX) and Feldspathic Pyroxenite (FPX)—with mineralogical characterization performed using MLA, QEMSCAN, and XRD. PGMs in liberated (L) and sulfide-associated (SL) forms accounted for up to 90.6% (FPX1), exhibiting high fast-floating fractions (θf = 0.77–0.84) and fast flotation rate constants (Kf = 1.45–1.78 min−1). In contrast, PGMs locked in silicates (G class) showed suppressed kinetics (Kf < 0.09 min−1, Ks anomalies up to 8.67 min−1) and were associated with lower recovery (P-FPX3 = 83.25%) and increased model error (P-FPX4 = 57.3). FPX lithologies achieved the highest cumulative recovery (FPX4 = 90.35%) and the best concentrate grades (FPX3 = 116.5 g/t at 1 min), while P-FPX1 had the highest gold content (10.45%) and peak recovery (94.37%). Grade-recovery profiles showed steep declines after 7 min, particularly in slow-floating types (e.g., P-FPX2, FPX2), with fast-floating lithologies stabilizing above 85% recovery at 20 min. The model yielded R2 values above 0.97 across all samples. This validates the predictive power of MOC-integrated flotation kinetics for complex PGM ores and supports its application in geometallurgical plant design. Model limitations in capturing complex locked ore textures (SAG, G classes) highlight the need for reclassification based on floatability indices and further integration of machine learning methods.

1. Introduction

The Platreef Platinum-Group Element (PGE) ore deposit, a significant component of South Africa’s Bushveld Complex, is recognized for its diverse mineralogy and complex geology. Processing Platinum Group Minerals (PGMs) from this deposit poses considerable challenges due to the variability in mineral associations, textures, and liberation characteristics. This complexity has direct implications for flotation kinetics, recovery rates, and consequently, the operational performance and design of metallurgical plants.
The Platreef orebody exhibits specific mineralogical complexities characterized by the presence of various PGM minerals, including arsenides and tellurides. Due to their unique mineralogical traits, minerals such as chalcopyrite and chalcocite display differential flotation behaviors. The textural variability further complicates flotation, as fine-grained PGMs exhibit slower flotation kinetics than their coarser counterparts. This necessitates fine grinding, yet finer particles risk entrainment of hydrophilic gangue minerals, negatively impacting the flotation process efficiency.
Mineralogical variability notably influences flotation kinetics, primarily through its impact on mineral liberation and association degree. PGMs that are closely associated with base metal sulfides (BMSs) tend to exhibit efficient flotation due to their hydrophobic nature [1,2]. Conversely, PGMs locked within gangue minerals or finely disseminated within silicates and oxides present significantly lower flotation recoveries [1,2].
Different PGMs, such as Pt, Pd, and additionally Au, exhibit distinct flotation behaviors, with Pt generally showing the fastest floatability, followed by Pd and Au [
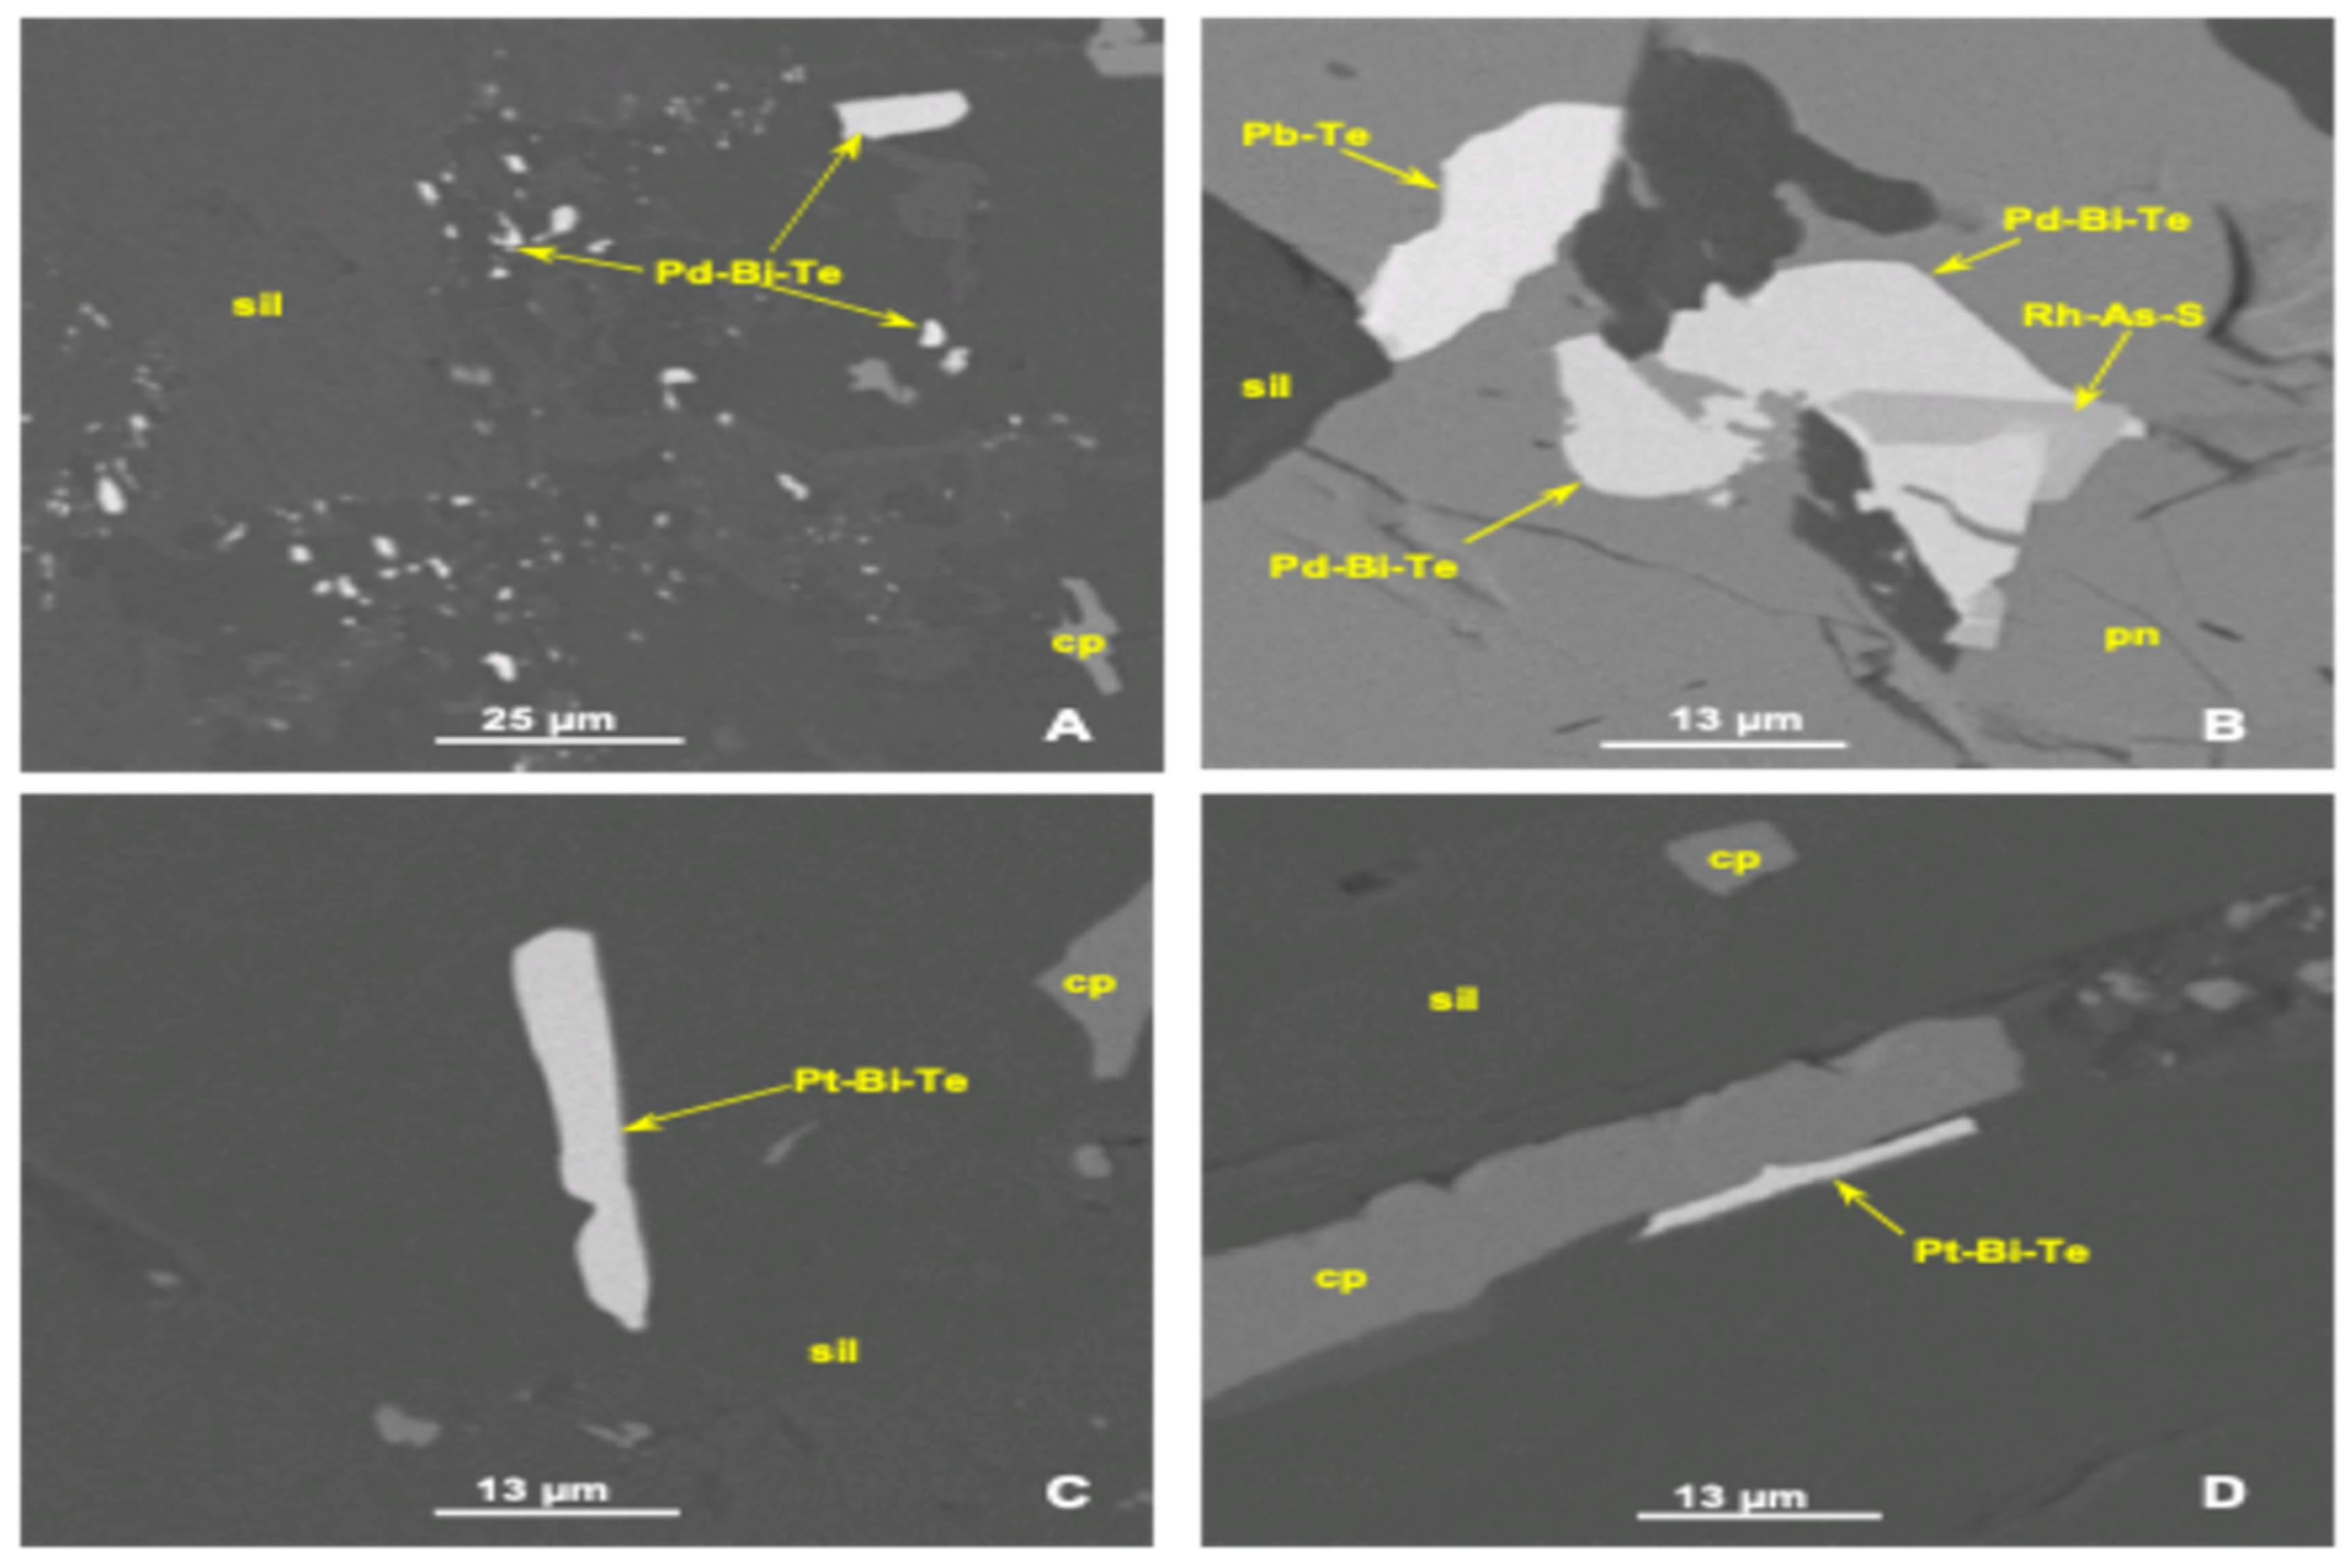
3]. The observed PGM mineral species are michenerite, merenskyite, kotulskite (Pd-Bi-Te), maslovite, moncheite (Pt-Bi-Te), sperrylite (Pt-As), platarsite (Pt-As-S), hollingworthite (Rh-As-S), isoferroplatinum (Pt-Fe), stibiopalladinite, mertieite, sudburyite (Pd-Sb), gold (Au > 90 mass%) (Au-Ag). Previous studies, such as those by Doubra et al. [3], confirm that flotation performance variability across PGMs such as Pt, Pd, and Au correlates strongly with their specific mineralogical associations, highlighting the criticality of understanding detailed mineralogical characteristics at the Mode of Occurrence (MOC) level.
Flotation remains the primary beneficiation method for recovering Platinum Group Metals (PGMs) from complex ores. Its efficiency, however, is governed not only by circuit configuration (e.g., rougher, scavenger, cleaner stages), reagent regimes, pulp density, and water chemistry, but also by the inherent mineralogical characteristics of the ore [4,5]. While operational parameters are commonly optimized to improve recovery, the integration of geometallurgical variables, such as mineral associations, grain size, liberation, and MOC, into flotation modelling remains limited.
Among kinetic models, the Kelsall model is widely used for characterizing flotation behavior due to its ability to distinguish between fast-floating and slow-floating mineral fractions. It has been applied extensively to sulfide ores, including copper, nickel, and PGMs, in studies seeking to model recovery curves and optimize flotation performance [6,7,8]. For instance, Kelsall-based models have been used to evaluate circuit configuration impacts (rougher-cleaner loops), reagent dosage strategies (xanthates, dithiophosphates, frothers), and varying pulp densities (typically between 25%–40%) on kinetic responses [9,10]. These applications commonly use empirical flotation data under well-controlled experimental conditions but tend to treat the ore as a bulk entity without discriminating based on mineralogical textures [11,12].
Past studies highlight the shortcomings of purely empirical or bulk-parameter models when applied to geologically complex deposits. Bahrami et al. [13] and O’Connor [14] demonstrated that textural characteristics such as intergrowth, mineral associations, and liberation significantly influence flotation rates and recovery trajectories, effects that are obscured when kinetic parameters are derived solely from bulk assay data. More recent work by Tijsseling [15] and Bahrami et al. [13] demonstrates that textural characteristics, such as liberation, association, and Mode of Occurrence, significantly influence flotation recovery trends, outcomes that are often overlooked when kinetic parameters are fitted using bulk assay data alone. Despite these insights, flotation models remain largely empirical in PGM systems, with limited incorporation of mineralogical constraints into parameter estimation frameworks. Despite this, few models incorporate these mineralogical constraints into parameter estimation, particularly in PGM systems where discrete particle tracking and textural classification remain underutilized.
This study addresses this gap by presenting a mineralogically informed adaptation of the Kelsall model, linking kinetic parameters directly to mineralogical classes defined by MOC and liberation. Flotation tests were performed on Platreef ore under standardized rougher flotation conditions (35% solids, pH~9, SIBX 120 g/t, Sendep 30E 300 g/t, and Senfroth 522 80 g/t) to isolate the effect of ore mineralogy. The model is calibrated using Particle Swarm Optimization (PSO), enabling robust kinetic parameter estimation across multiple lithologies and textures. This work aims to demonstrate that integrating mineralogical attributes into flotation models not only improves recovery prediction accuracy but also enhances their applicability in geometallurgical frameworks, circuit design, and strategic mine planning.
Traditionally, flotation kinetics have been modelled using several approaches, primarily based on first-order kinetics, rate constant distribution models, and graphical and computational methods. The Kelsall model is a well-known example that incorporates both fast- and slow-floating mineral fractions, each with its own rate constant [16,17]. Equation (1) is the unmodified Kelsall model with the basic assumption that the flotation process follows first-order kinetics, with the basic assumption that the mechanism of bubble–particle attachment recovers minerals and the recovery rate is proportional to the concentration of floatable particles. The Kelsall model incorporates fast- and slow-floating components that are the most widely used to describe the flotation kinetics.
R = 100 θ l × 1 e k f l × t + θ l × 1 e ( k s l × t )
where:
  • R is the maximum recovery at time, t
  • Kf is the fast-flotation rate
  • Ks is the slow-flotation rate
  • θ is the fraction of the slow-floating component
The unmodified Kelsall model constraints are given in Equations (2)–(4). Equation (2) represents the fast flotation rate constant constraints, a critical parameter that controls several aspects, such as recovery rate, cell design configuration, reagent dosage, and process control. This also includes the control of the liberated and locked particles of valuable minerals, respectively. Equation (3) represents the constraints of the slow flotation rate constant, which controls the extended residence time and influences the larger cell configuration, type, and reagent amount. Equation (4) represents the slow-floating fraction constraints. It represents a non-binding constraint that allows the slow fraction to satisfy a set of minimum and maximum values. Equation (5) represents the fast–slow flotation fraction constraints, while Equation (6) represents the non-negativity constraints.
T l b k f k f l t T u b k f l     1 , . . . , L ,   t     t , . . . , T
T l b k s k s l t T u b k s l     1 , . . . , L ,   t     t , . . . , T
T l b θ θ l t T u b θ l     1 , . . . , L ,   t     t , . . . , T
k s l k f l 0   l     1 , . . . , L ,   t     t , . . . , T
k f l t ,   k s l t ,   θ l t 0
However, the current models have limitations, primarily due to their inability to comprehensively integrate the complex mineralogical characteristics at the level of liberation classes based on the MOC for complex ore bodies. They simplify assumptions and assume that the rate constant for both fast-floating and slow-floating particles remains constant throughout the flotation process. They do not account for particle entrainment, which can occur due to water turbulence. Previous studies, such as Alvarez-Silva et al. [18], compared kinetic models using relatively simple mineral systems (e.g., pyrite and calcite). While it provides a good benchmark for model performance, it lacks validation against ores with heterogeneous mineralogy, intergrowths, or textural complexity. Such variability can lead to deviations in flotation behavior from model predictions, particularly when mineral associations influence surface chemistry or bubble–particle interactions. Bu et al. [16] explored a range of kinetic models and rate constant distributions; their work is largely based on batch flotation tests conducted under controlled conditions. These models often assume homogeneity in particle behavior, which does not hold in complex ores where liberation varies significantly across size fractions and mineral associations. Consequently, their models may not accurately capture the behavior of complex orebodies with variable liberation characteristics, leading to an over- or underestimation of recovery and rate constants. Vinnett et al. [19] introduce a useful method for analyzing flotation rate distributions across size classes; it does not explicitly integrate liberation data or mineralogical associations into the analysis. In complex ores, particle size alone is not a sufficient predictor of flotation behavior—liberation degree and mineral locking play a critical role. Without incorporating these factors, the model may misinterpret erratic performance as size-related rather than liberation-driven.
This leads to inadequate predictions of flotation kinetics for complex ore bodies exhibiting variability in the liberation classes.
The modified Kelsall model has demonstrated potential in capturing differential flotation kinetics by explicitly accounting for fast and slow flotation fractions of minerals. Previous research, such as Doubra et al., has noted its effectiveness [3]. Additional studies have reinforced its utility in modeling complex flotation systems, particularly in the recovery of Platinum Group Metals (PGMs). For instance, Chipise et al. applied the five-parameter modified Kelsall model to scavenger bank flotation data in a PGM concentrator and found that it provided the best fit for describing the kinetics of slow-floating mineral species [20]. Similarly, Ramlall and Loveday compared several kinetic models for UG2 platinum ore and concluded that the modified Kelsall model, especially when combined with entrainment modeling, offered superior predictive accuracy for both valuable and gangue minerals [21]. Furthermore, research on Platreef ore flotation has shown that the model can be used to develop empirical correlations for Pt, Pd, and Au recoveries, enhancing process optimization and control [20] and other studies examining PGM recovery. Despite this, a significant gap remains: the model’s limited capability to fully integrate detailed mineralogical attributes such as the MOC classifications, particularly for PGMs that do not precisely fall into the fast or slow flotation categories.
Advancements in flotation prediction increasingly emphasize integrating detailed mineralogical data, including liberation characteristics, mineral associations, and grain size distributions. Recent research, such as Vinnett et al. [19], highlights the importance of explicitly incorporating MOC classifications into kinetic models to enhance predictive accuracy. Previous studies have utilized SEM and Microsoft spreadsheets using Visual Basic Macros (VBMs) to classify each PGM bearing particle into one of the six predefined MOCs, as demonstrated in Table 1 [22,23].
The Positive Matrix Factorization (PMF) approach and machine learning techniques have shown promise. Yet, these methods often still rely on simplified mineralogical categorizations, not fully resolving the complexities inherent in Platreef-type mineralogical variability.
Optimization techniques, particularly Particle Swarm Optimization (PSO), hold significant promise for addressing the inherent complexities associated with flotation processes. In this study, the PSO was employed to calibrate flotation kinetic parameters. PSO is a population-based, metaheuristic optimization algorithm inspired by the collective social behavior observed in bird flocks and fish schools [24]. The method uses a set of candidate solutions called “particles” that explore the multidimensional parameter space by adjusting their positions based on their own experience and that of neighboring particles. Through iterative updates, PSO effectively balances exploration and exploitation to identify optimal or near-optimal solutions, making it well-suited for complex, nonlinear problems such as flotation kinetics parameter estimation. Its advantages include simplicity, computational efficiency, and a reduced tendency to become trapped in local minima compared to traditional gradient-based methods.
The capability of PSO to manage nonlinear and multidimensional optimization challenges has been extensively demonstrated, notably through its application in optimizing flotation parameters to enhance recoveries and concentrate grades [25]. Recent research further supports this, highlighting PSO’s efficiency in predictive modeling and optimization in flotation circuits [26,27,28]. Furthermore, the integration of machine learning with traditional flotation models has proven beneficial, enabling improved prediction accuracy and deeper understanding of flotation kinetics, particularly in ores exhibiting complex mineralogical characteristics [29,30]. Thus, PSO has emerged as a method suitable for predicting flotation kinetics, offering significant operational advantages for processing intricate mineralogical compositions.
Integrating flotation kinetics into the early stages of plant design is crucial for optimizing the flotation process and ensuring efficient mineral recovery and the scale-up of laboratory results to full-scale plant operation. Flotation kinetics, which describes the rate at which particles are recovered in the flotation process, is influenced by various factors such as particle size, bubble–particle interactions, liberation, and the hydrodynamic conditions within the flotation cell. By incorporating these kinetics into the design phase, engineers can make informed decisions about the configuration and operation of flotation circuits, ultimately enhancing the plant’s performance and economic viability.
Moreover, insights from studies such as those by Dunne et al. [31,32] and Ramlall et al. [33] demonstrate the necessity of tailoring flotation circuit designs to each orebody’s specific mineralogical and metallurgical characteristics. They also demonstrate that no one-size-fits-all approach exists for flotation plant design, especially when processing complex ore bodies. While substantial progress has been made, a notable gap remains in the literature regarding the dynamic interplay between mineralogical variability, flotation kinetics, and real-time operational parameters. Existing studies often fall short in simulating the complex effects of mineralogy, particularly MOC and liberation class, on flotation kinetics under variable plant conditions.
Given these gaps and challenges, this study seeks to comprehensively understand how detailed mineralogical characteristics influence flotation kinetics in complex PGM orebodies. By integrating precise mineralogical data into the modified Kelsall kinetic model and employing PSO for optimization, the research intends to significantly enhance the prediction accuracy and optimization efficiency of flotation processes for Platreef ores.
This study aims to do the following:
  • Assess the challenges posed by mineralogical variability in PGM flotation;
  • Evaluate the influence of mineralogical attributes on the flotation performance of PGM metals;
  • Integrating mineralogical attributes into the flotation kinetics model;
  • Predict the kinetics indices of PGM metals using the Modified Kelsall model.

2. Materials and Methods

This study specifically investigates two lithologies from the Akanani Platreef deposit due to their distinct mineralogical compositions—Pegmatoidal Feldspathic Pyroxenite (P-FPX) characterized by high-grade PGM content and feldspathic pyroxenite (FPX), which exhibits lower PGM concentrations. These rock types were subjected to rigorous geometallurgical characterization, including batch flotation testing, particle liberation assessment through MLA, and modal mineralogy evaluation.

2.1. Identifying Variability in Mineralogy

Mineralogical variability in PGM ores was assessed by sampling eight geometallurgical units from two lithologies, i.e., P-FPX and FPX, and characterizing them using automated mineralogy techniques (MLA and QEMSCAN). Key attributes such as PGM types (e.g., sperrylite, Pt-Fe alloy, tellurides), base metal sulfides (chalcopyrite, pentlandite, pyrrhotite), gangue minerals (silicates, oxides, chromite), and grain size distribution were analyzed. The MOC classification categorized PGMs into six classes, ranging from liberated to locked in gangue. Backscattered Electron (BSE) imaging and Energy-Dispersive X-Ray Spectroscopy (EDS) were used to confirm associations. X-Ray Diffraction (XRD) analysis complemented this by identifying major gangue phases and rock types based on mineral ratios. Grain size distribution was further evaluated using SEM/MLA data, revealing that finer PGMs were harder to recover, with textural relationships, such as PGM inclusions, boundary occurrences, or gangue interlocking, impacting flotation performance. This integrated analysis helped highlight significant mineralogical differences across lithologies that influence flotation recovery. The details of the mineralogy equipment are presented in Table 2.

2.2. Assessing the Influence of Geometallurgical Attributes on the Flotation Performance of PGM

The flotation performance of PGMs was evaluated using the Mill-Float-1 (MF1) circuit, where ore from P-FPX and FPX lithologies was milled to 80% passing 75 µm and subjected to batch rougher flotation tests at timed intervals (1, 3, 7, and 20 min). The process aimed to optimize PGM recovery by ensuring sufficient liberation during milling while preventing overgrinding. Table 3 shows the reagents, including SIBX (collector), Sendep 30E (depressant), and Senfroth 522 (frother), that were used to enhance flotation selectivity and stability. These reagents were selected based on prior plant practice and laboratory flotation test optimization for Platreef-type PGM ores. SIBX, a xanthate-based collector, effectively targets sulfide minerals and has demonstrated strong selectivity for PGM-bearing sulfides in previous studies [4,34]. Sendep 30E, a depressant, was applied at 300 g/t to suppress the flotation of gangue silicates such as feldspar and amphibole, which are abundant in the tested lithologies. Senfroth 522, a frother, was dosed at 80 g/t to promote stable bubble formation and optimize froth phase recovery. These dosages represent a balance between flotation performance and reagent consumption efficiency, established through preliminary bench-scale tests and consistent with industry practice in similar PGM flotation circuits [5,35].
All flotation tests were conducted under controlled pH conditions to ensure reproducibility and consistent flotation performance. The pH was maintained at 9.0 ± 0.2 throughout the experiments, as this range is known to optimize collector adsorption and maximize PGM recovery in similar ore systems [5,36,37]. The pH adjustment was achieved using dilute sodium hydroxide (NaOH) or sulfuric acid (H2SO4) solutions as required. This approach ensured stable flotation conditions and allowed the effects of mineralogy and reagent dosage on kinetics to be isolated.
All flotation tests were performed under constant rougher flotation conditions to isolate the effect of mineralogical variables. Reagent dosages, SIBX (120 g/t), Sendep 30E (300 g/t), and Senfroth 522 (80 g/t) were determined based on extensive internal screening tests and previous studies on Platreef-type ores [5]. These dosages were found to optimize sulfide recovery while maintaining froth stability and minimizing entrainment of gangue.
The flotation setup included a Denver D12 flotation cell, and performance was analyzed through recovery rates, concentrate grades, and kinetic responses of mineral fractions. Samples were further embedded and polished for SEM analysis to assess mineral associations post-flotation. Kinetic modeling using the modified Kelsall model was applied to estimate fast and slow flotation rate constants (Kf and Ks), allowing for a better understanding of how mineralogical features such as liberation and lithology affect flotation behavior and recovery efficiency. The Milling–Return Feed–Flotation process, shown in Figure 1, describes the step-by-step comminution and flotation strategy used to optimize the recovery of PGMs from different ore lithologies (P-FPX and FPX).
All flotation tests were conducted using tap water representative of the local laboratory supply. While this choice reflects realistic process water conditions, it is important to note that water quality parameters such as hardness, pH, and dissolved ion concentrations were not explicitly controlled or measured during the test work. Given that water chemistry can influence flotation performance by altering reagent speciation and mineral surface interactions [38,39,40], this contributes to some degree of variability in the observed flotation behavior and kinetic responses.

2.3. Integrating Mineralogy into the Modified Flotation Kinetic Model

For this study, the modified Kelsall model was adapted by integrating mineralogy in terms of Modes of Occurrence (MOC). Presented in Equation (7), this model predicts the kinetic performance of Platinum Group Metals (PGMs) by incorporating both fast- and slow-floating components to account for varying flotation behaviors. It differentiates between fast-floating (Kf) and slow-floating (Ks) components, as well as the fraction of slow-floating components (θ). This dual-rate system provides a more accurate representation of flotation kinetics for platinum (Pt), palladium (Pd), and gold (Au). The model was applied to P-FPX and FPX lithologies to analyze their flotation response using the modified Kelsall model developed for this study and implemented in SigmaPlot 15 and MATLAB R2025a. Mineralogy at the level of liberation classes was integrated into the modified Kelsall model. Table 4 describes this equation’s indices, notations and associated assumptions.
M a x   R   t = t T n = 1 N δ n θ n × 1 e k f n × t + θ n × 1 e ( k s n × t )
The constraints of the modified Kelsall model incorporating mineralogy are given in Equations (8)–(12). Equations (8) and (9) represent the fast and slow flotation rate constraints, as explained above, and Equation (10) represents the slow-floating fraction constraints. Equation (11) represents the fast–slow flotation interaction constraints, and Equation (12) represents the non-negativity constraints.
T l b k f k f l , n t T u b k f l     1 , . . . , L ,   t     t , . . . , T
T l b k s k s l , n t T u b k   s l     1 , . . . , L ,   t     t , . . . , T
T l b θ θ l , n t T u b θ l     1 , . . . , L ,   t     t , . . . , T
k s l , n t k f l , n t 0 l     1 , . . . , L ,   t     t , . . . , T
k f l , n t ,   k s l , n t ,   θ l , n t 0
The determination of the recovery, R, is a function of the liberation characteristics, the liberation category in the Mode of Occurrence, and the type of lithology in the mineral deposit. Table 4 describes the notations for the set of constraints, indices, parameters, and decision variables in the model framework.

2.4. The Particle Swarm Optimization (PSO) Algorithm to Optimize the Flotation Kinetics of PGM Minerals

Statistical and computational analysis was executed using multivariate statistical analysis and the PSO algorithm. The details of the PSO algorithm’s application in mineral processing have been detailed elsewhere (Kabemba et al. [20], He et al. [21], and Zhang et al. [41]). The PSO was used to optimize flotation parameters by linking mineralogy to kinetic models and evaluating how different lithologies affect model predictions, as shown in Equation (13).
R = R [ 100 θ l × 1 e k f × t + θ l × 1 e ( k s × t ) ]
where
R = Ultimate recovery [%]
R = Fraction recovery
θ l = Fraction of floating components with the slow rate constant
k f = Rate constant for fast-floating component min−1
k s = Rate constant for slow-floating component min−1
100 θ l = Fraction

3. Results

3.1. Variability in Mineralogy

Table 5 presents the PGM mineralogy (wt.%) across eight rock samples from two lithologies, revealing distinct compositional trends. P-FPX samples, particularly PFPX1 and PFPX3, are enriched in PtBiTe and PdBiTe, with PFPX3 uniquely containing high PdBi (12.99%) and no detectable gold, while PFPX2 shows notable PdSb (18.28%) and PtAs (2.93%) content. PFPX1 also has the highest gold concentration (10.45%) and significant PtFe (18.97%). On the other hand, FPX samples, especially FPX1 and FPX3, exhibit consistently high PtBiTe (over 60%) and moderate PdBiTe, with FPX3 also containing high PtAs and gold. FPX2 is characterized by high PdBiTe (31.29%) and no gold, whereas FPX4 shows a balanced distribution of gold (3.54%), PtBiTe (40.75%), and PdBiTe (30.81%). Overall, P-FPX samples display greater mineralogical variability, while FPX samples are dominated by telluride-type PGMs, particularly PtBiTe, suggesting higher flotation potential under telluride-targeted processing conditions.
Table 6 presents the BMS mineralogy (wt.%) across P-FPX and FPX rock types, highlighting the distribution of three key sulfide minerals: pentlandite, chalcopyrite, and pyrrhotite. In the P-FPX lithology, BMS compositions are relatively balanced. Pentlandite content ranges from 20.47% in PFPX3 to 35.71% in PFPX2, while chalcopyrite varies moderately between 17.29% and 19.51%. Pyrrhotite is dominant but less pronounced than in FPX samples, ranging from 45.14% (PFPX2) to 59.84% (PFPX3). Conversely, FPX samples are clearly dominated by pyrrhotite, which consistently exceeds 54%, peaking at 69.98% in FPX3. Pentlandite and chalcopyrite are present in lower but still significant amounts, with pentlandite ranging from 18.23% to 26.22%, and chalcopyrite from 10.34% to 18.67%. These results indicate that FPX lithologies are pyrrhotite-rich, whereas P-FPX samples have a more balanced BMS.
Table 7 presents the gangue mineralogy (wt.%) of different rock types from the P-FPX and FPX lithologies, highlighting significant variation in mineral composition. Orthopyroxene is the most abundant gangue mineral across all samples, with the highest concentrations found in FPX1 (66.39%) and consistently high values across FPX samples (31.02% to 66.39%). P-FPX samples also contain substantial orthopyroxene, ranging from 17.36% in PFPX3 to 34.58% in PFPX4. Feldspar content is markedly higher in FPX2 (23.34%) and FPX3 (37.96%) compared to P-FPX samples, where it ranges between 9.66% and 17.61%. Clinopyroxene is present in both lithologies in moderate amounts (11.75% to 23.5%), while alteration minerals such as serpentine, chlorite, and amphibole are more prominent in P-FPX samples. For example, serpentine reaches 19.15% in PFPX3, and amphibole peaks at 12.5% in PFPX4, indicating higher alteration levels in P-FPX rocks. In contrast, FPX samples generally show lower concentrations of these alteration minerals. These differences in gangue mineralogy suggest that FPX rocks are compositionally simpler and less altered. In contrast, P-FPX rocks have more complex and altered gangue assemblages, potentially impacting flotation performance through increased gangue.
Table 8 and Figure 2 show that the samples essentially comprise orthopyroxene (approximately 40 to 90% by mass) and/or plagioclase (up to ~20%), which are gangue minerals. Trace (<5%) to minor amounts (5 to 20%) of clinopyroxene are normally present, whereas talc and amphibole may be prominent (10 to 20%) in some samples, e.g., 1, 2, and 6. Other XRD-detectable minerals that are present in trace amounts include mica (biotite), chlorite, and secondary calcite in the form of cross-cutting veins. Grains of chromite [(Mg, Fe2+) (Cr, Al, Fe3+)2O4] occur sporadically. According to the mineralogical composition (pyroxene-to-plagioclase ratio), the rock types may basically be termed medium-to-coarse-grained orthopyroxenites (Samples 1, 3, and 4) or melanorites (Samples 2, 5, and 6). Samples 3, 4, and 5 appear relatively “fresh” or unaltered, whereas Samples 1 and 2 are slightly altered. Sample 6 is comparatively more altered than Samples 1 and 2. Thus, XRD analysis confirmed that the samples consist mainly of orthopyroxene and plagioclase, with trace amounts of talc, amphibole, and alteration minerals, with Sample 6 being the most altered.
Table 9 presents the PGM MOC data, showing that FPX had a higher proportion of liberated PGMs (L class), while P-FPX had more PGMs locked in gangue or BMS (SG and G classes), affecting flotation potential. Grain size analysis indicated that PGM grains associated with BMS were larger (~11 µm) than those locked in gangue (~9 µm) or along grain boundaries (~6 µm). PFPX samples generally had more coarse-grained PGMs compared to FPX. Micrographs (Figure 3) illustrate that PGMs occurred in various associations, locked in gangue, associated with BMS, or along silicate grain boundaries, while BMS minerals (Figure 4), especially larger grains, were predominantly located along silicate grain edges, enhancing liberation potential during milling. The total percentage of grains over 3 µm is consistently high across all samples, ranging from 86.1% to 96.5%, suggesting a coarse granular structure common to both rock types.
The observed PGM grains shown in Table 10 were classified according to their Mode of Occurrence into three groups: associated with grains of BMS, occurring between silicate-silicate grain edges, i.e., along grain boundaries and locked in gangue. Approximately 50% of the PGM grains found in the samples are associated with sulfides, whereas the other half are locked in silicate gangue. A small amount of the PGMs (<2%) occurred along silicate grain boundaries. Figure 3 shows numerous PGM grains of Pd-Bi-Te locked in gangue (sil) (Figure 3A). Figure 3B shows a PGM composite comprising hollingworthite (Rh-As-S) and Pd-Bi-Te associated with pentlandite (pn) containing a grain of altaite (Pb-Te). Figure 3C shows a Pt-Bi-Te grain locked in silicate with similar grains attached to chalcopyrite (cp) occurring along a silicate grain boundary (Figure 3D).
BMS grains form an estimated 8 to 12% (by volume) of the core sections examined. The main sulfide types are chalcopyrite, pentlandite, and pyrrhotite, which are present as small monomineralic grains less than 100 µm in size or as much larger composite aggregates up to 10 mm in length or more, with an average possibly in the region of 200 to 300 µm. These composites comprise pentlandite, pyrrhotite, and/or chalcopyrite, which can be the main sulfide type in the aggregate.
Pyrite, sphalerite, galena, and altaite are some of the accessory BMS types. The sulfides appear normal and unaltered, apart from a little violarite replacing the pentlandite at its grain edges. The smaller BMS grains are principally locked in gangue grains. These sulfide grains are mostly chalcopyrite with sizes < 100 µm, although a size of 450 µm for a locked BMS composite was measured. Small sulfide grains will most likely not be recovered during flotation because of their tendency to be locked in gangue, apart from entrainment.
The larger BMS grains and aggregates are, however, often found along the silicate grain edges, making them amenable to liberation during comminution and subsequent recovery by flotation. It is estimated that the proportion of BMS grains that occur along silicate grain boundaries in the sections examined is more than 95% by volume. Note that monomineralic pyrrhotite may possibly be lost during flotation because of its slow-floating nature. Although not abundant, the secondary sulfide violarite may also hamper the recovery of pentlandite, since violarite usually replaces the pentlandite from the outside inwards. Consequently, the violarite “coating” might influence the flotation of pentlandite. Any PGM grains associated with the sulfides ought to be recovered with relative ease.
The current investigation found a variety of sulfide composites, as shown in the optical micrographs in Figure 4. Composites of pentlandite (pn), pyrrhotite (po), and chalcopyrite (cp) formed along silicate (sil) grain boundaries can be seen in Figure 4A,B. Figure 4C shows a pyrrhotite and pentlandite aggregate with amphibole needles. Figure 4D shows chalcopyrite grains embedded in gangue (sil), with a tiny PGM grain visible. Figure 4E shows chalcopyrite between silicate grains, whereas Figure 4F reveals a chromite (cr) grain and several BMS composites embedded in the gangue.
The mineral association of the gangue minerals is shown in the optical micrographs in Figure 5. Orthopyroxene (OPX) and plagioclase (plag) constitute the fundamental makeup of the pyroxenites and melanorites in the core samples, as illustrated in Figure 5A,B. A clinopyroxene (CPX) grain is observable as examined under plane-polarized light (Figure 5A) and crossed polarizers (Figure 5B). Figure 5C,D resemble Figure 5A,B but exhibit apparent interstitial sulfide composite (BMS). Figure 5E illustrates orthopyroxene and plagioclase in a segment viewed under crossed polarizers, while Figure 5F exhibits amphibole (amps), clinopyroxene, and plagioclase in the segment observed under crossed polarizers.

3.2. The Influence of Mineralogical Attributes on the Flotation Performance of PGM Metals

Table 11 shows the recovery for P-FPX and FPX lithologies. As can be seen, the recovery generally increases with longer flotation times across all process variants. The FPX process variants show higher recovery than PFPX variants at most time points, suggesting a more efficient recovery process. By 20 min, most processes achieve significantly high recovery rates, with FPX4 showing the highest at 90.35%. There is notable variability in recovery values between different processes at the same time points, indicating that some processes are more effective than others for PGM recovery.
The results show that the concentrate grades generally decrease over time in both the P-FPX and FPX categories, as shown in Table 12. The highest grade recorded is 116.50 g/t in the FPX3 category at 1 min.
Higher head grades generally correlate with higher recovery percentages, particularly noticeable in rock types PFPX1 and FPX4, as shown in Table 13. PFPX1 shows the highest recovery for Au at 94.37% and a high combined concentrate grade of 14.51 g/t. FPX4, despite having a lower head grade for Au compared to PFPX1, shows a significant recovery rate of 90.35% and the highest combined concentrate grade of 18.78 g/t. The efficiency of metal recovery varies significantly across rock types, suggesting that the mineralogical characteristics of each rock type could influence the recovery process. This lithological variability is further visualized in Figure 6 and Figure 7, which graphically depict the differences in recovery and grade trends, reinforcing the influence of mineralogical heterogeneity on flotation performance.
Table 14 shows the floatability index of all rock types. PFPX1, PFPX3, and FPX1 show notably high floatability indices, suggesting they are more amenable to flotation processes. Particle size analysis shows that all rock types have more than 85% of their particles above 3 µm, with FPX1 having the highest at 96.3%.
P-FPX1 shows a generally decreasing trend in recovery as concentrate grade increases. P-FPX2 and P-FPX3 exhibit a steep decline in recovery after a certain grade threshold, suggesting a limit to efficient recovery at higher grades. P-FPX4 maintains a more stable recovery rate across varying grades, indicating a potentially more robust or differently optimized process. FPX1 exhibits the highest recovery at lower concentrate grades, indicating a more efficient initial recovery process. As the concentrate grade increases, the recovery for all FPX variants decreases. FPX4 demonstrates the steepest decline in recovery with increasing grade, suggesting less efficiency at higher concentrate grades compared to other variants.

3.3. Linking Mineralogy to the Flotation Kinetic Parameters Using the Modified Kelsall Model

Table 15 presents comprehensive flotation kinetics parameters for various rock types within the P-FPX lithology. P-FPX1 is predominantly classified within the L category (58.83%) within the MOC, with notable occurrences also in the AG (24.48%) and SAG (12.68%) categories. P-FPX2 is primarily located in the L category (47.54%), supplemented by significant occurrences in the SL (24.94%) and SAG (21.20%) categories. P-FPX3 is mainly classified in the L category (38.64%), with prominent occurrences in the AG (32.68%) and SAG (19.88%) categories. P-FPX4 predominantly occurs in the L category (78.80%), with relevant occurrences in the SL (3.28%) and AG (7.94%) categories. P-FPX1 exhibits the highest Kf in the SL category (5.0900), P-FPX2 in the L category (2.4315), and P-FPX3 in the G category (18.0892); this is an anomaly since this class is locked ore with gangue attached to it, and P-FPX4 in the SL category (4.8428).
In the slow-floating fraction (Ks), P-FPX1, P-FPX2, P-FPX3, and P-FPX4 consistently demonstrate lower values, save for anomalies in select categories. The slow-floating component (θ) has predominantly stable values across P-FPX1, P-FPX2, P-FPX3, and P-FPX4, apart from exceptions in specific categories. P-FPX1 exhibits high flotation kinetic constants in the SL category, suggesting a high flotation efficiency level. P-FPX2 possesses the highest flotation kinetic rate constant in the L category, indicating its efficient flotation characteristics within this liberated classification. P-FPX3 is observed to have the highest flotation kinetic rate constant in the G category, reflecting the swift ascent of this particular rock type among the P-FPX variants. P-FPX4 demonstrates significant flotation kinetics in the SL category, distinguishing itself from the other P-FPX types.
P-FPX1 shows a higher K value in SL mode (1.4871) compared to other modes, indicating faster flotation kinetics in this configuration. P-FPX4 in SAG mode has the highest slow-floating fraction (19.3940), suggesting a slower flotation response. Higher flotation kinetic rate constant values generally correlate with lower slow flotation fractions, indicating more efficient flotation processes. The flotation kinetic rate constants Kf and Ks vary significantly across different modes of occurrences and rock types, impacting the flotation efficiency. The negative values of Ks in some entries (e.g., −0.2691 for AG in P-FPX1) might indicate adverse conditions or inefficiencies in the flotation process for those specific occurrences.
The comprehensive flotation kinetics parameters for various rock types categorized within the Feldspathic Pyroxenite (FPX) lithology are presented in Table 16. FPX1 is predominantly observed in the L class, comprising 88.59%, with minor representations in alternative classifications. FPX2 is primarily associated with the L class at 61.17%, accompanied by substantial representations in the SG, SAG, and SL classes. FPX3 is chiefly found in the L class at 61.15%, with notable occurrences in the SL, SAG, and AG classes. FPX4 predominantly exists within the L class (36.32%), with significant representation in the SL, AG, and SAG classes. The flotation kinetics constant (Kf) denotes the rate at which particles ascend, with elevated values indicating swifter flotation rates. FPX1 possesses the highest Kf within the L class, recorded at 1.3006; FPX2 in the L class measures 1.5488; FPX3 in the L class reaches 1.9724; and FPX4 in the SL class registers at 0.7646. The slow flotation fraction (Ks) signifies the proportion of particles that ascend slowly, revealing generally low values for FPX1, FPX2, FPX3, and FPX4, with exceptions denoted in specific classes. Theta (θ) quantifies flotation efficiency, predominantly reflecting consistent values approximately at 0.7800 for FPX1, FPX2, FPX3, and FPX4, with anomalies noted in certain MOC classifications.

3.4. Predicting the Kinetics Performance of PGM Metals Using the Modified Kelsall Model

The flotation kinetics of the different P-FPX and FPX rock types are shown in Figure 8. All rock types show an increase in recovery percentage as time progresses, indicating a positive correlation between time and recovery. Figure 8a demonstrates that P-FPX1 achieves the highest recovery percentage, nearing 100%. The recovery values for P-FPX2 and P-FPX4 are similar, with P-FPX2 slightly outperforming P-FPX4. P-FPX3 shows the slowest increase in recovery, suggesting it might have different physical or chemical properties compared to the other types. Similarly, Figure 8b indicates that all FPX rock types approach their maximum recovery within the first 10 min. FPX3 shows the quickest initial recovery, reaching near maximum by approximately 2 min. FPX1 and FPX2 exhibit similar recovery patterns, with FPX2 slightly leading. FPX4, while starting slower, closely matches the recovery levels of FPX3 at approximately 6 min and surpasses all by the end of the period.
The fraction of flotation components and flotation rate constants, both fast and slow, along with error values and a floatability index, are shown in Table 17. P-FPX1 has the highest fraction of fast flotation components ∅f (Fast) at 0.8025. P-FPX2 and P-FPX3 show moderate ∅f (Fast) values of 0.6488 and 0.7091, respectively. P-FPX4 has a slightly lower ∅f(Fast) at 0.6791. For slow flotation components ∅s (Slow), P-FPX2 has the highest value at 0.3512. Regarding the flotation rate constant, P-FPX1 also leads to the fast flotation rate constant Kf (Fast) at 1.0986. The slow flotation rate constant Ks (Slow) is notably higher in P-FPX3 at 0.0455 compared to others.
Similarly, regarding the fraction of flotation components as shown in Table 18, FPX3 shows the highest ∅f (Fast) value at 0.8431. The ∅s (Slow) is highest in FPX4 at 0.3088. Regarding the flotation rate constant, FPX1 has the highest Kf (Fast) at 1.7772, and the lowest Ks (Slow) is observed in FPX3 at 0.0308. The floatability index categorizes rock types FPX2, FPX3, and FPX4 as “Slow” and FPX1 as “Fast”.
All four models achieve a high fitness level, approaching a value of 100, indicating excellent model performance. The time to reach near-maximal fitness varies slightly among the FPX rock types, with FPX4 showing quicker stabilization. The time-recovery data for PFPX and FPX rock types showing a sigmoidal curve fit are shown in Figure 9a–d and Figure 10a–d, respectively. It can be seen in Table 19 that the correlation coefficient for all rock types was above 95%, demonstrating the model’s accuracy.

4. Discussion

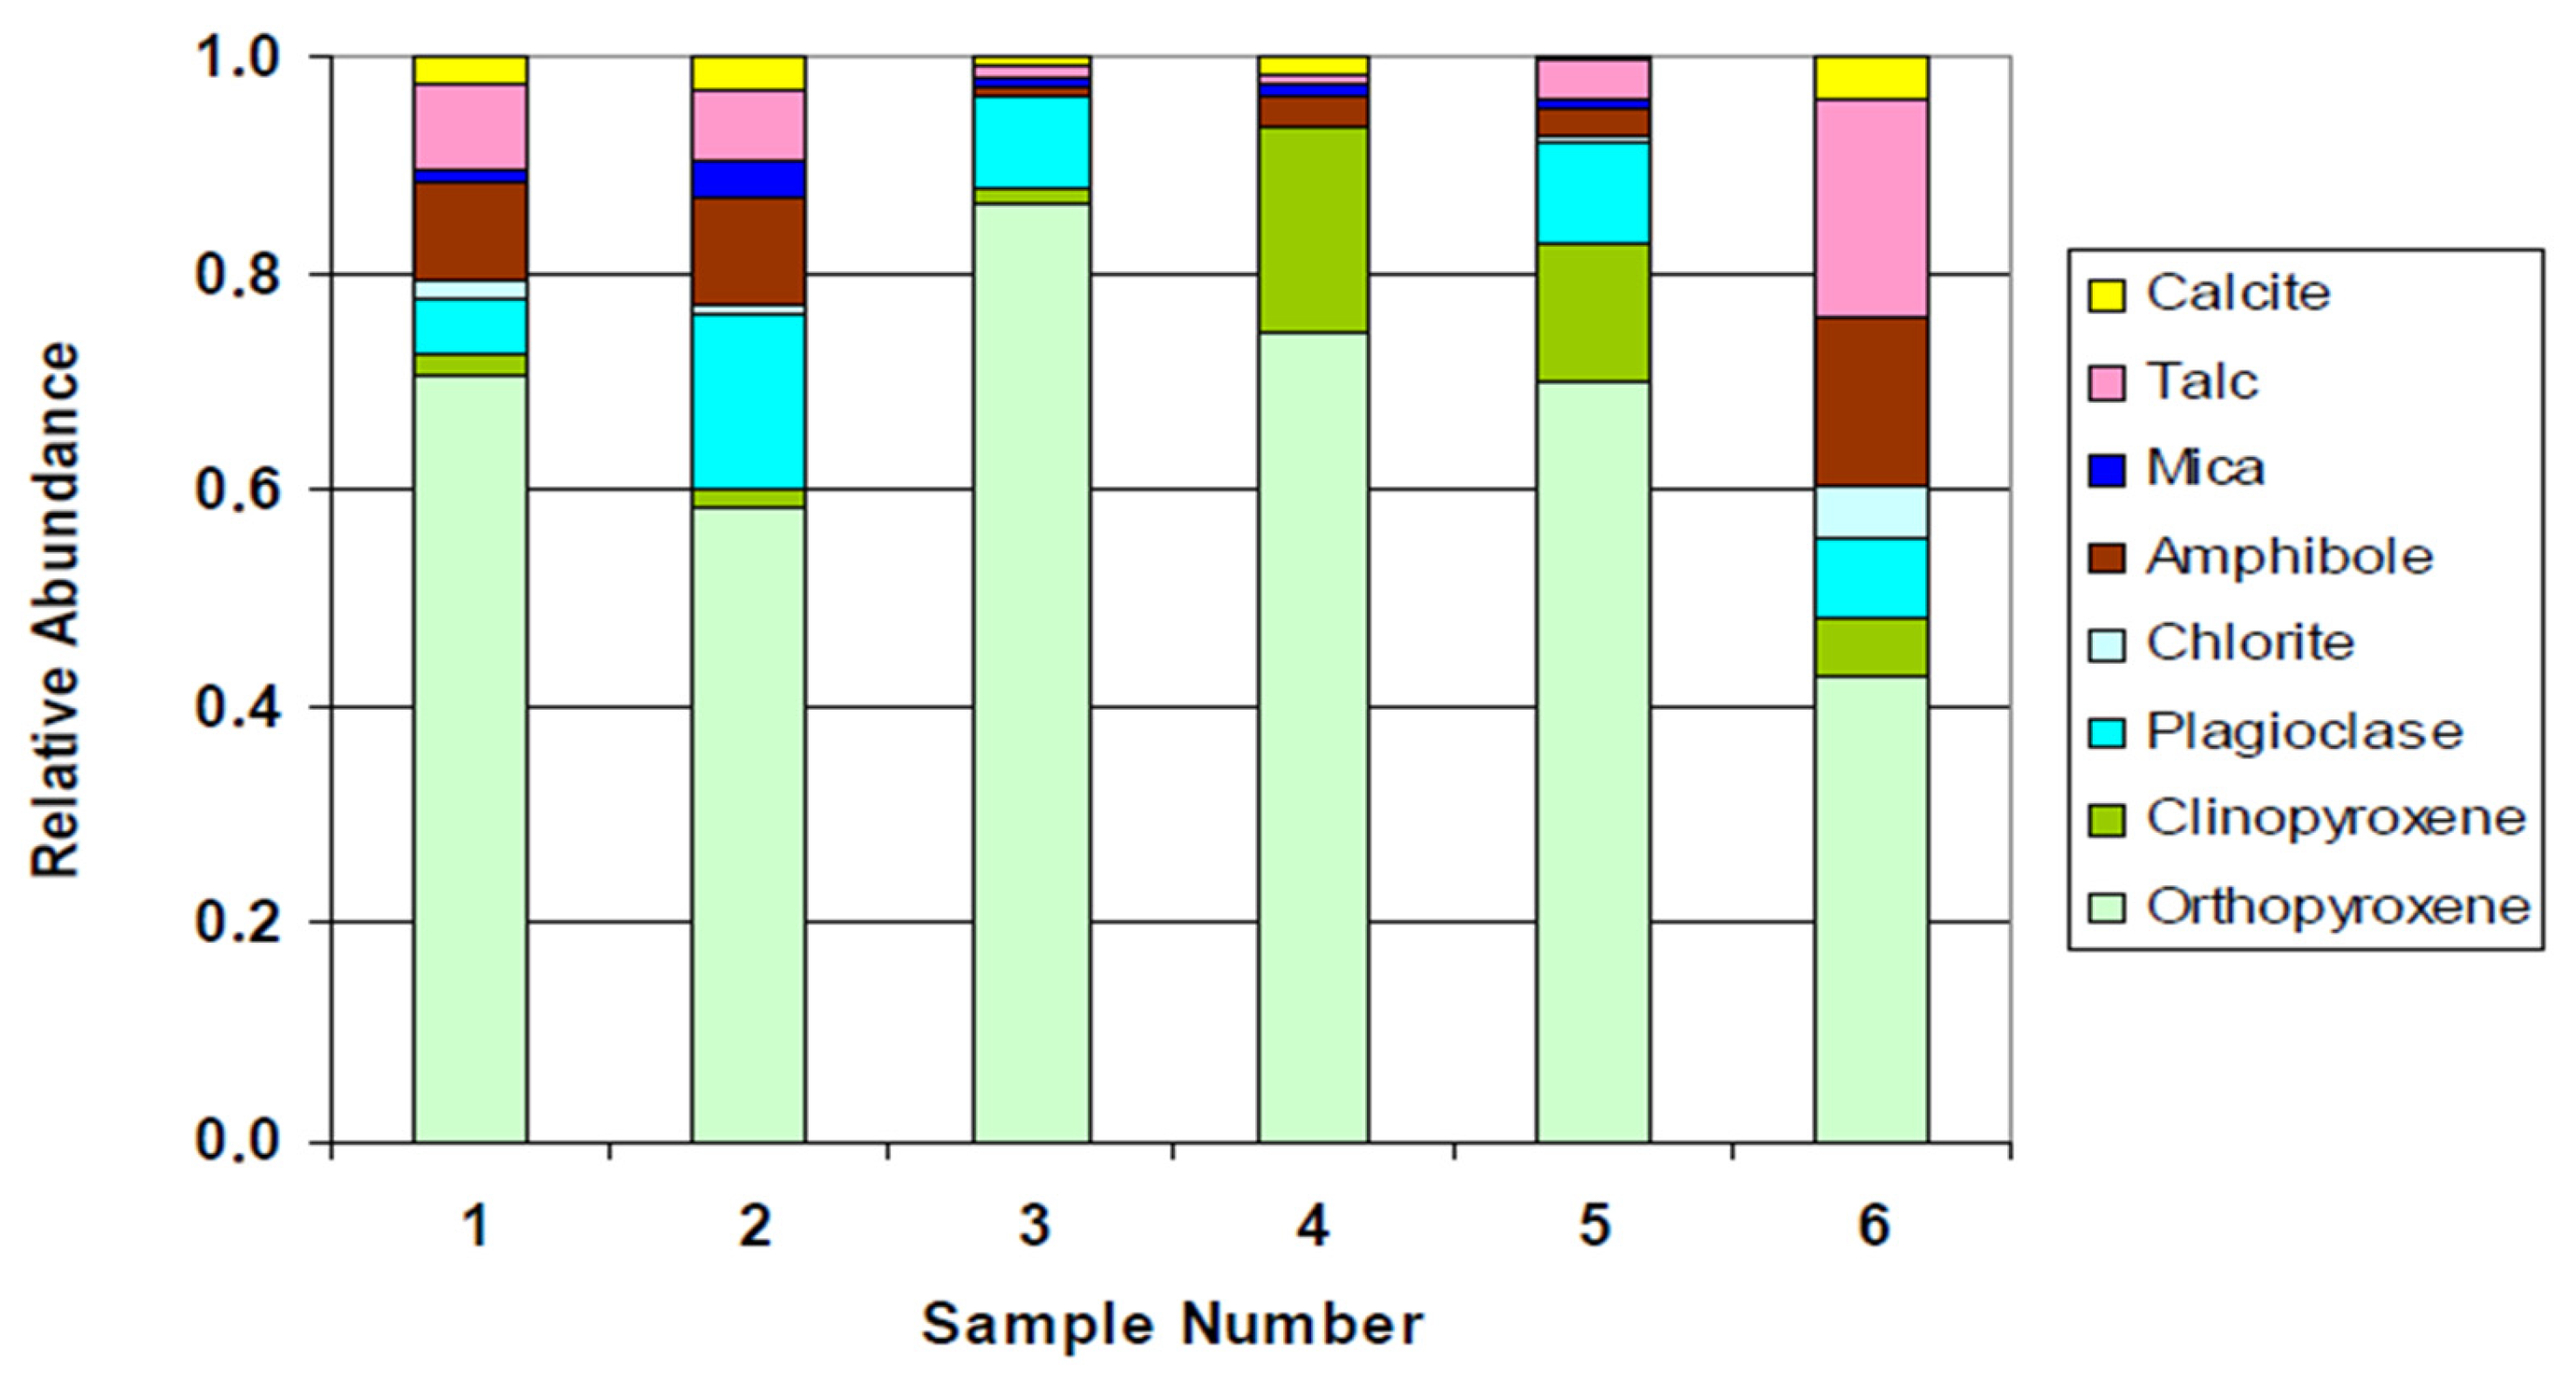
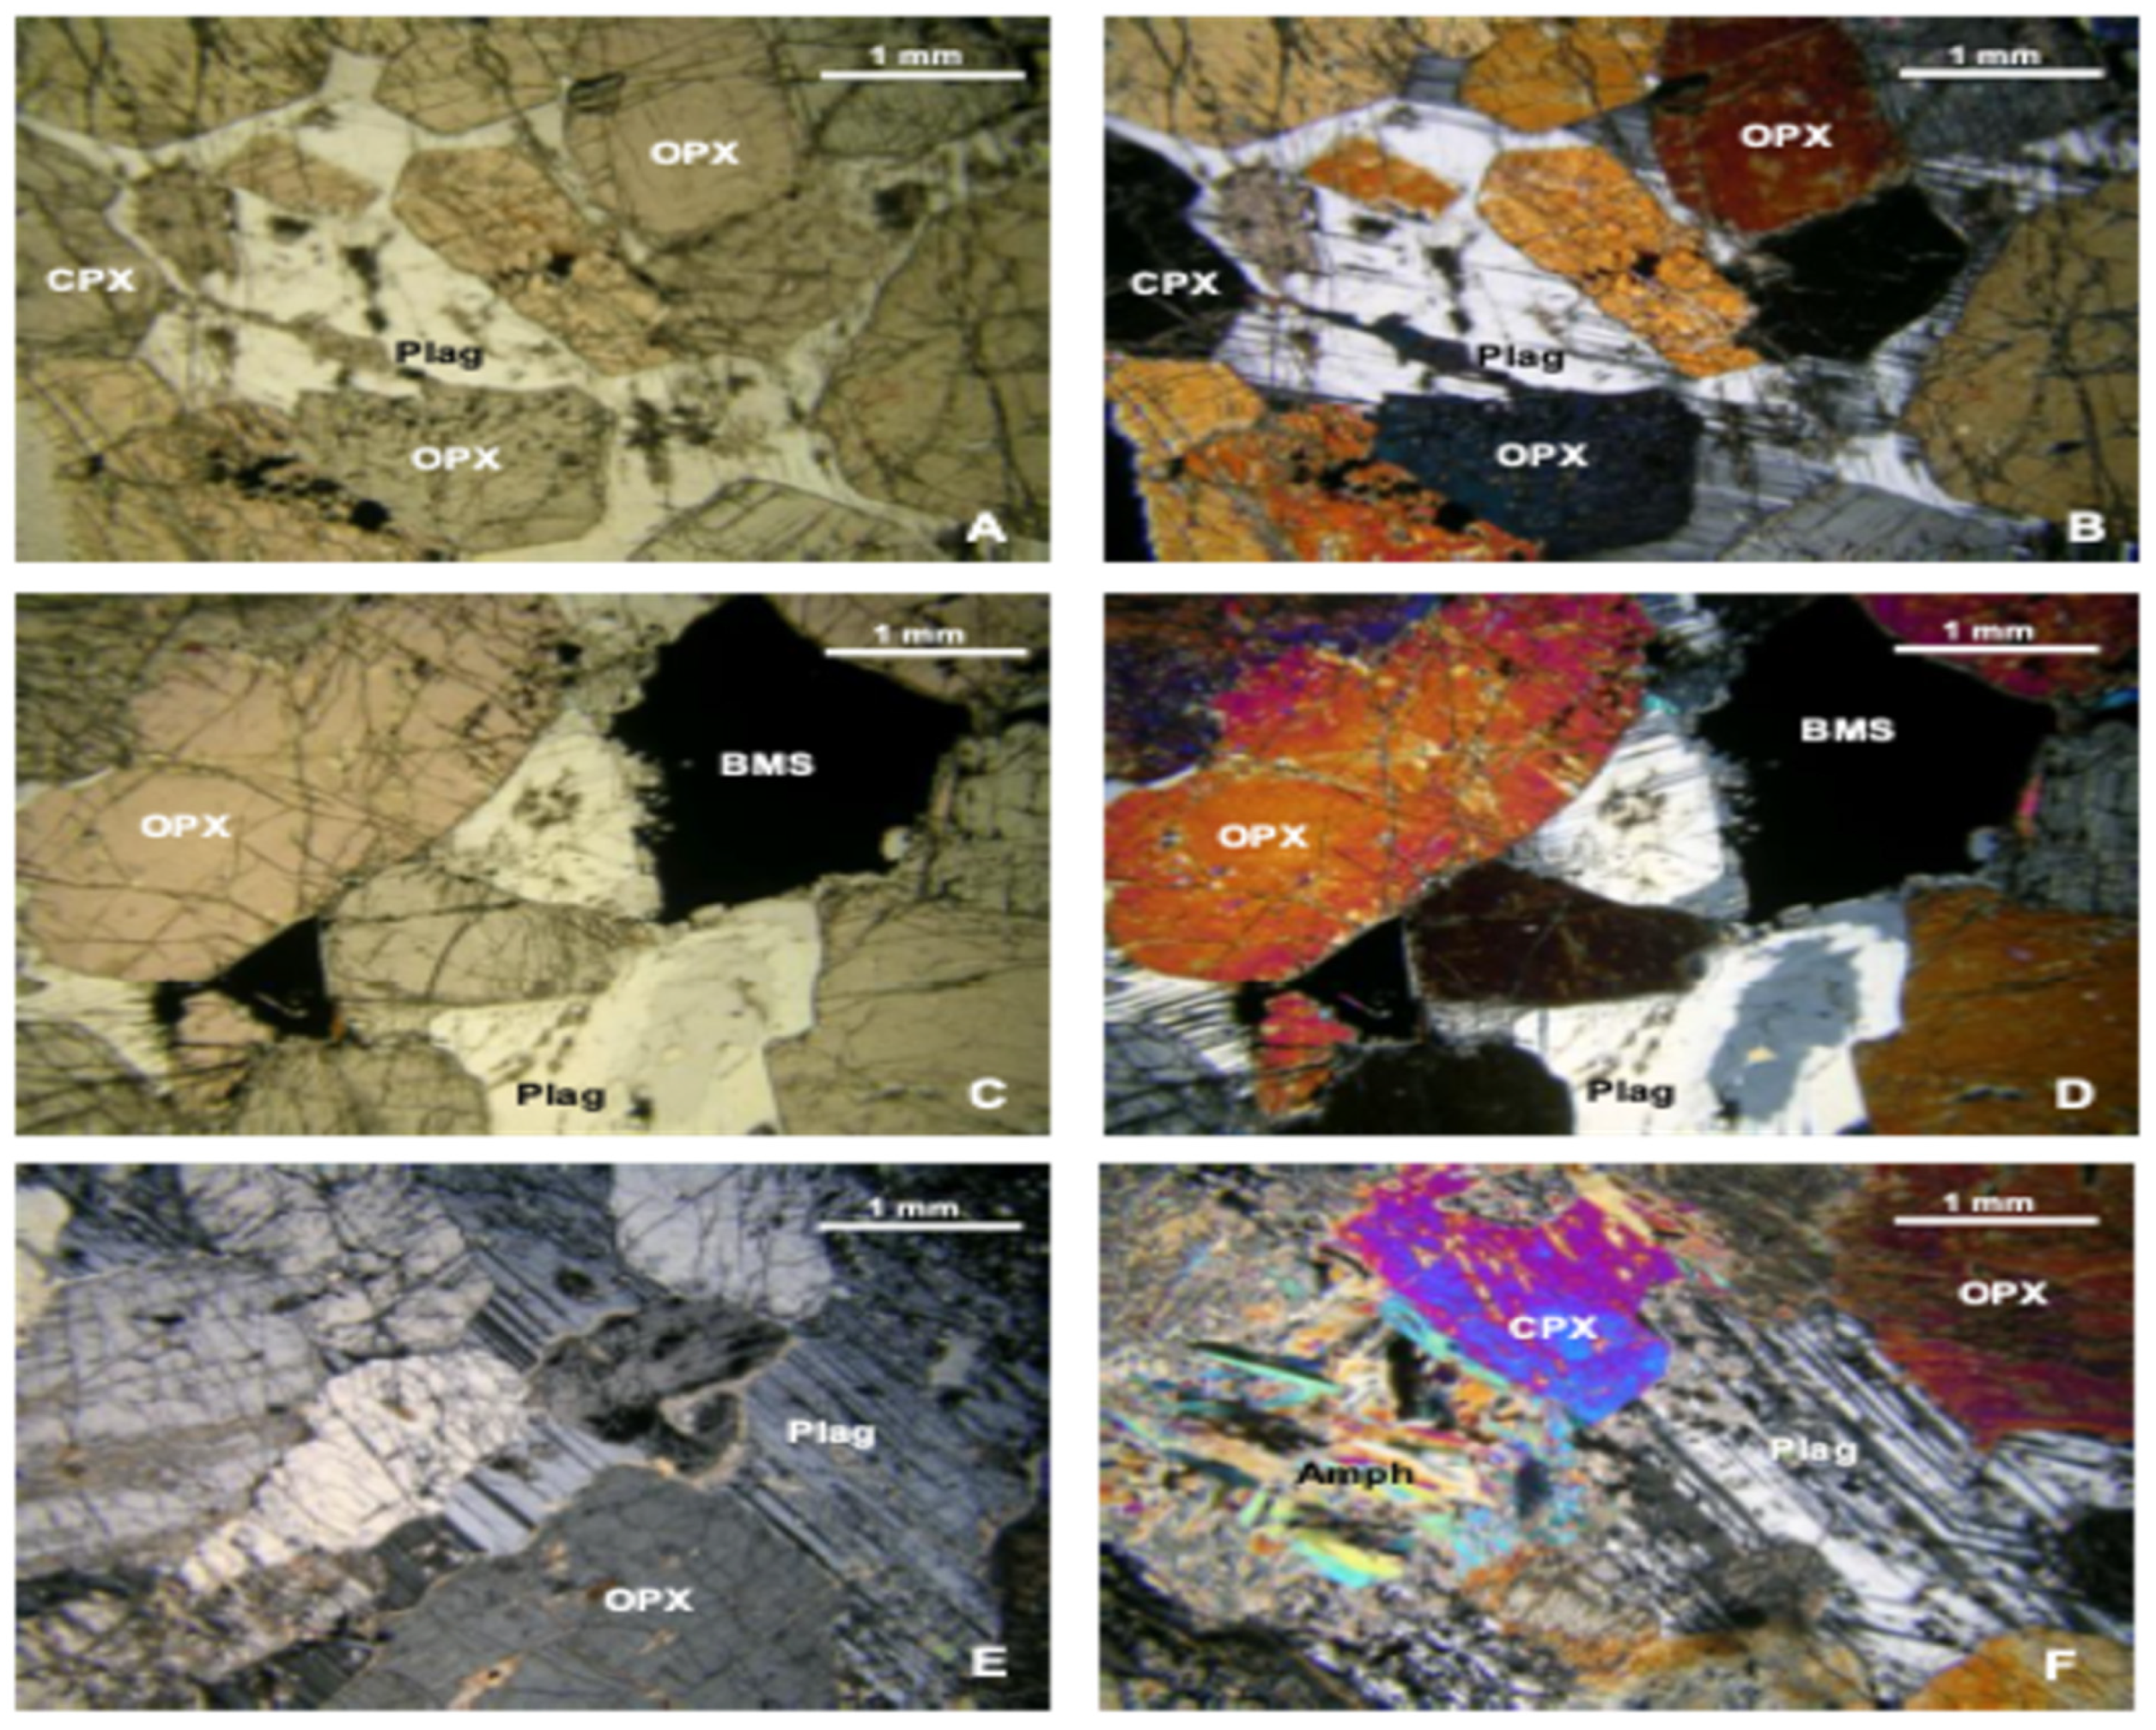
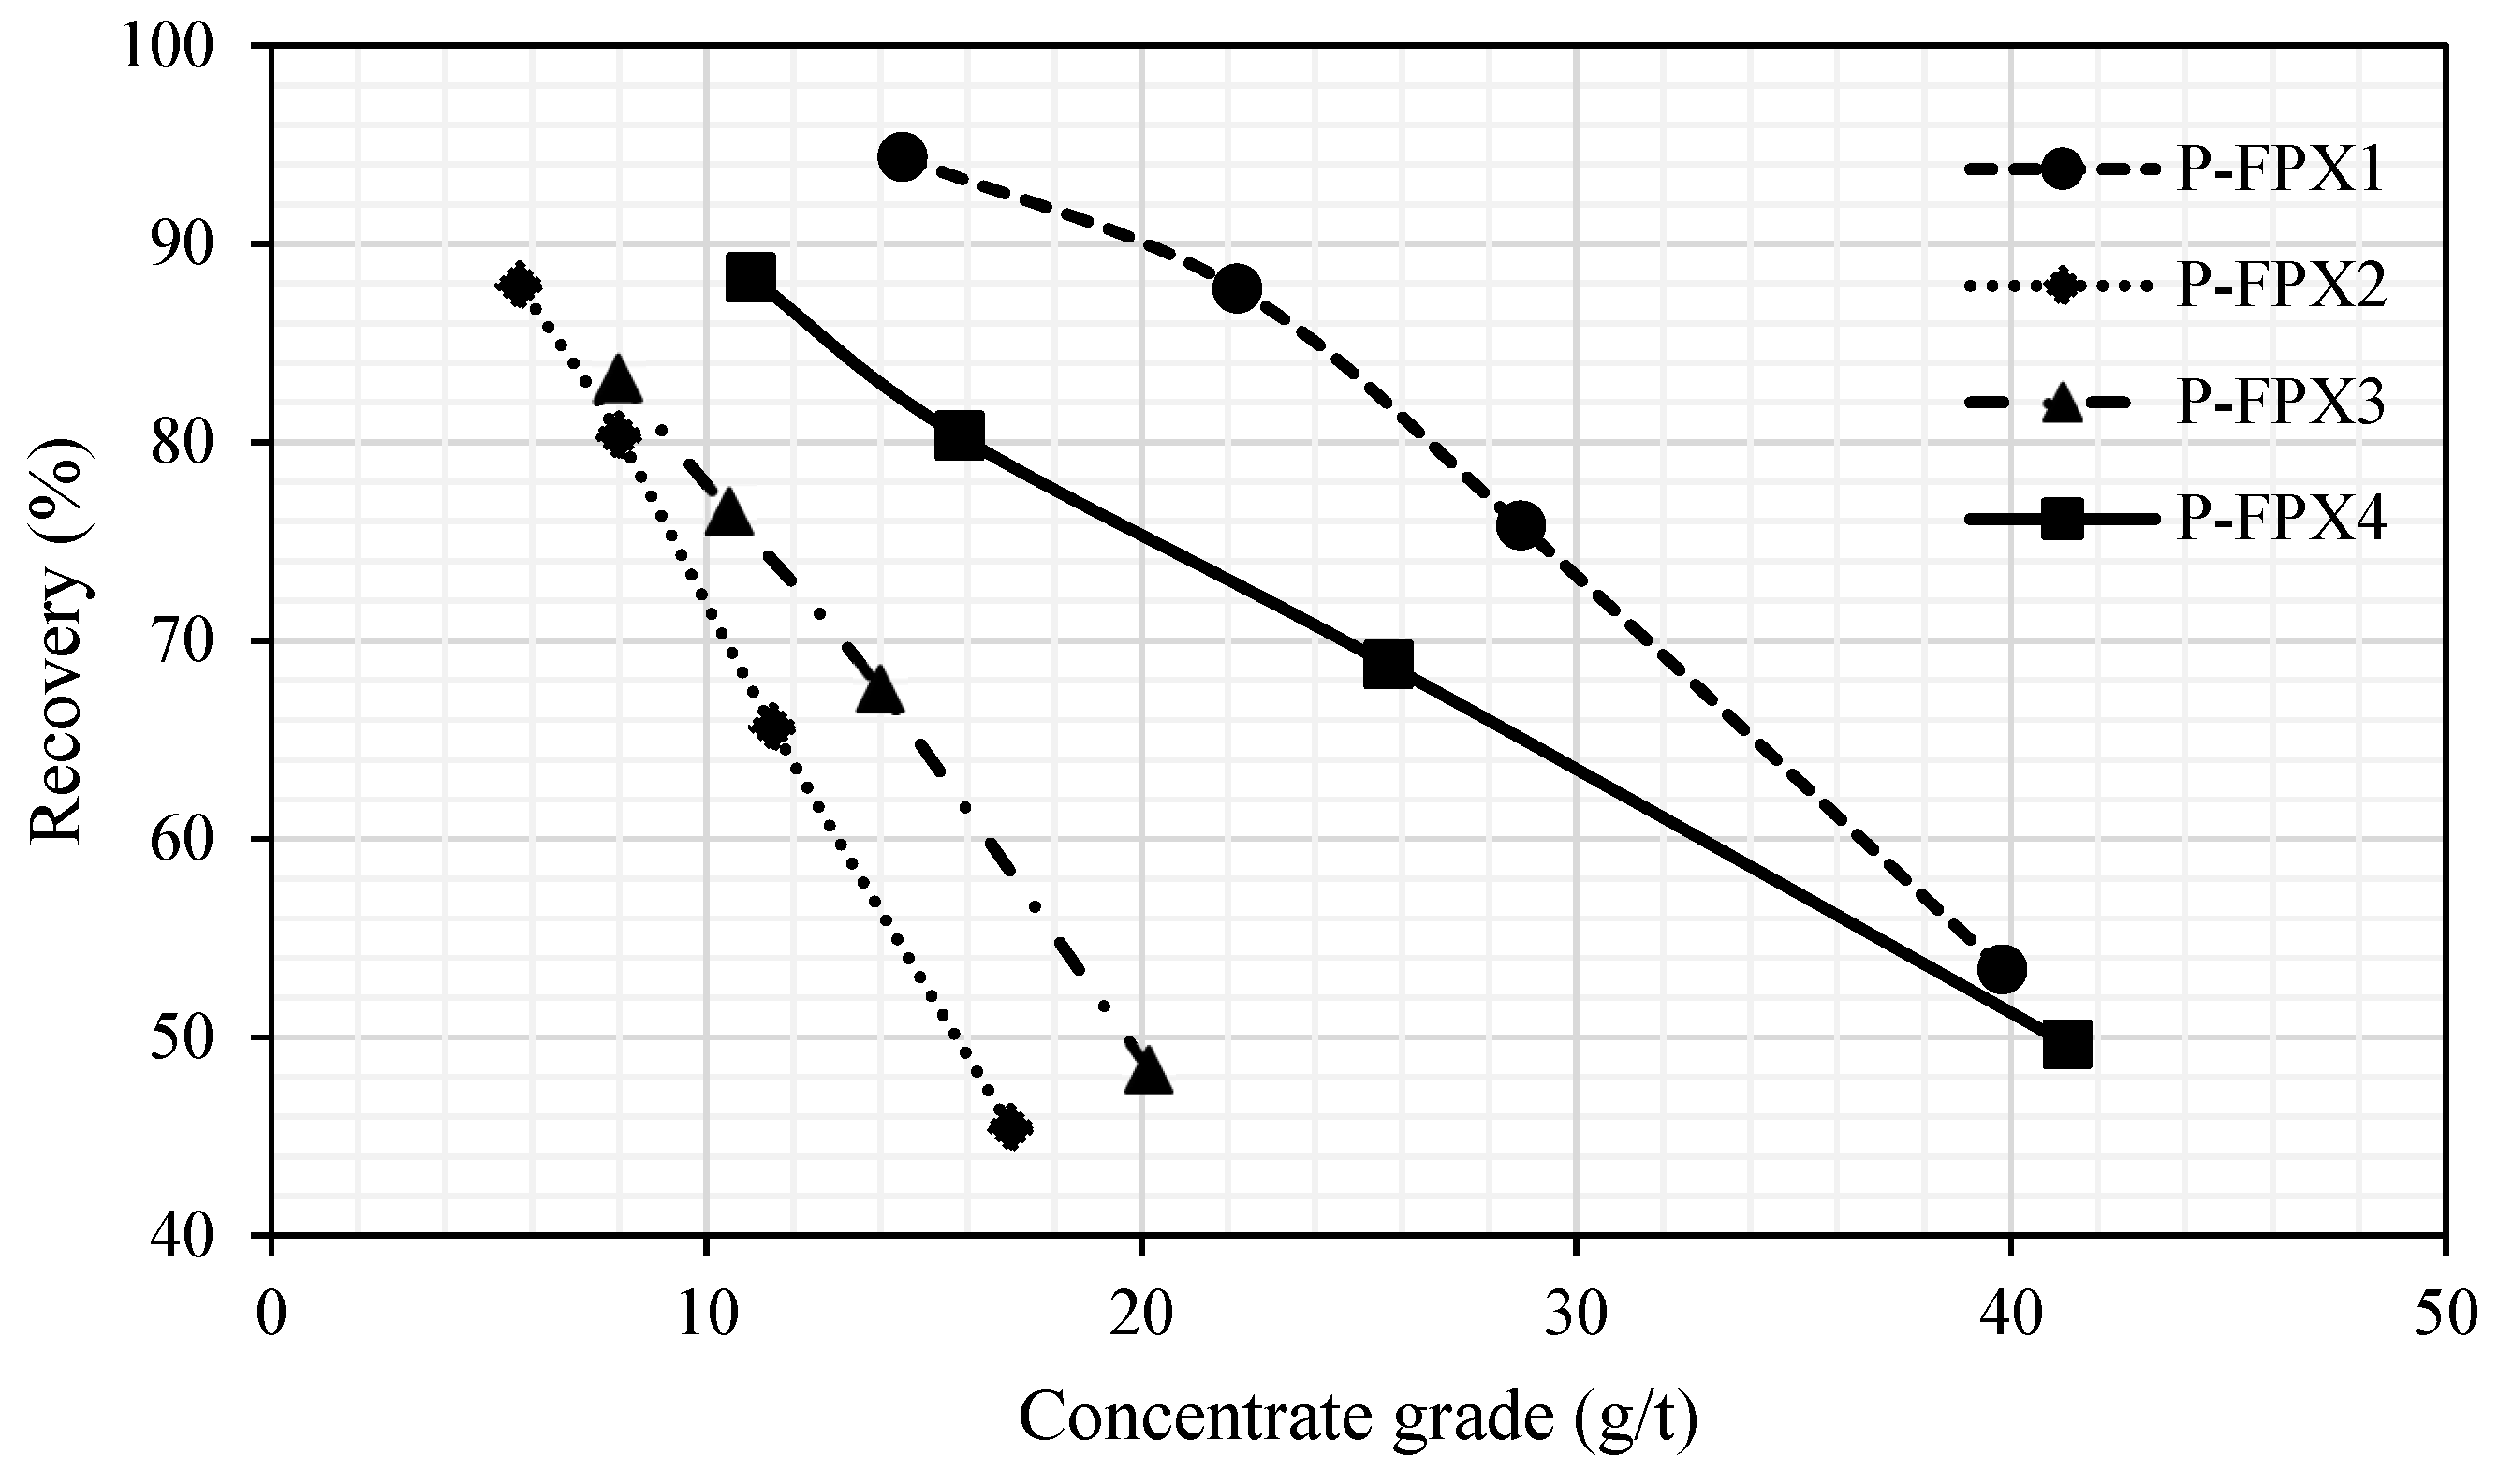
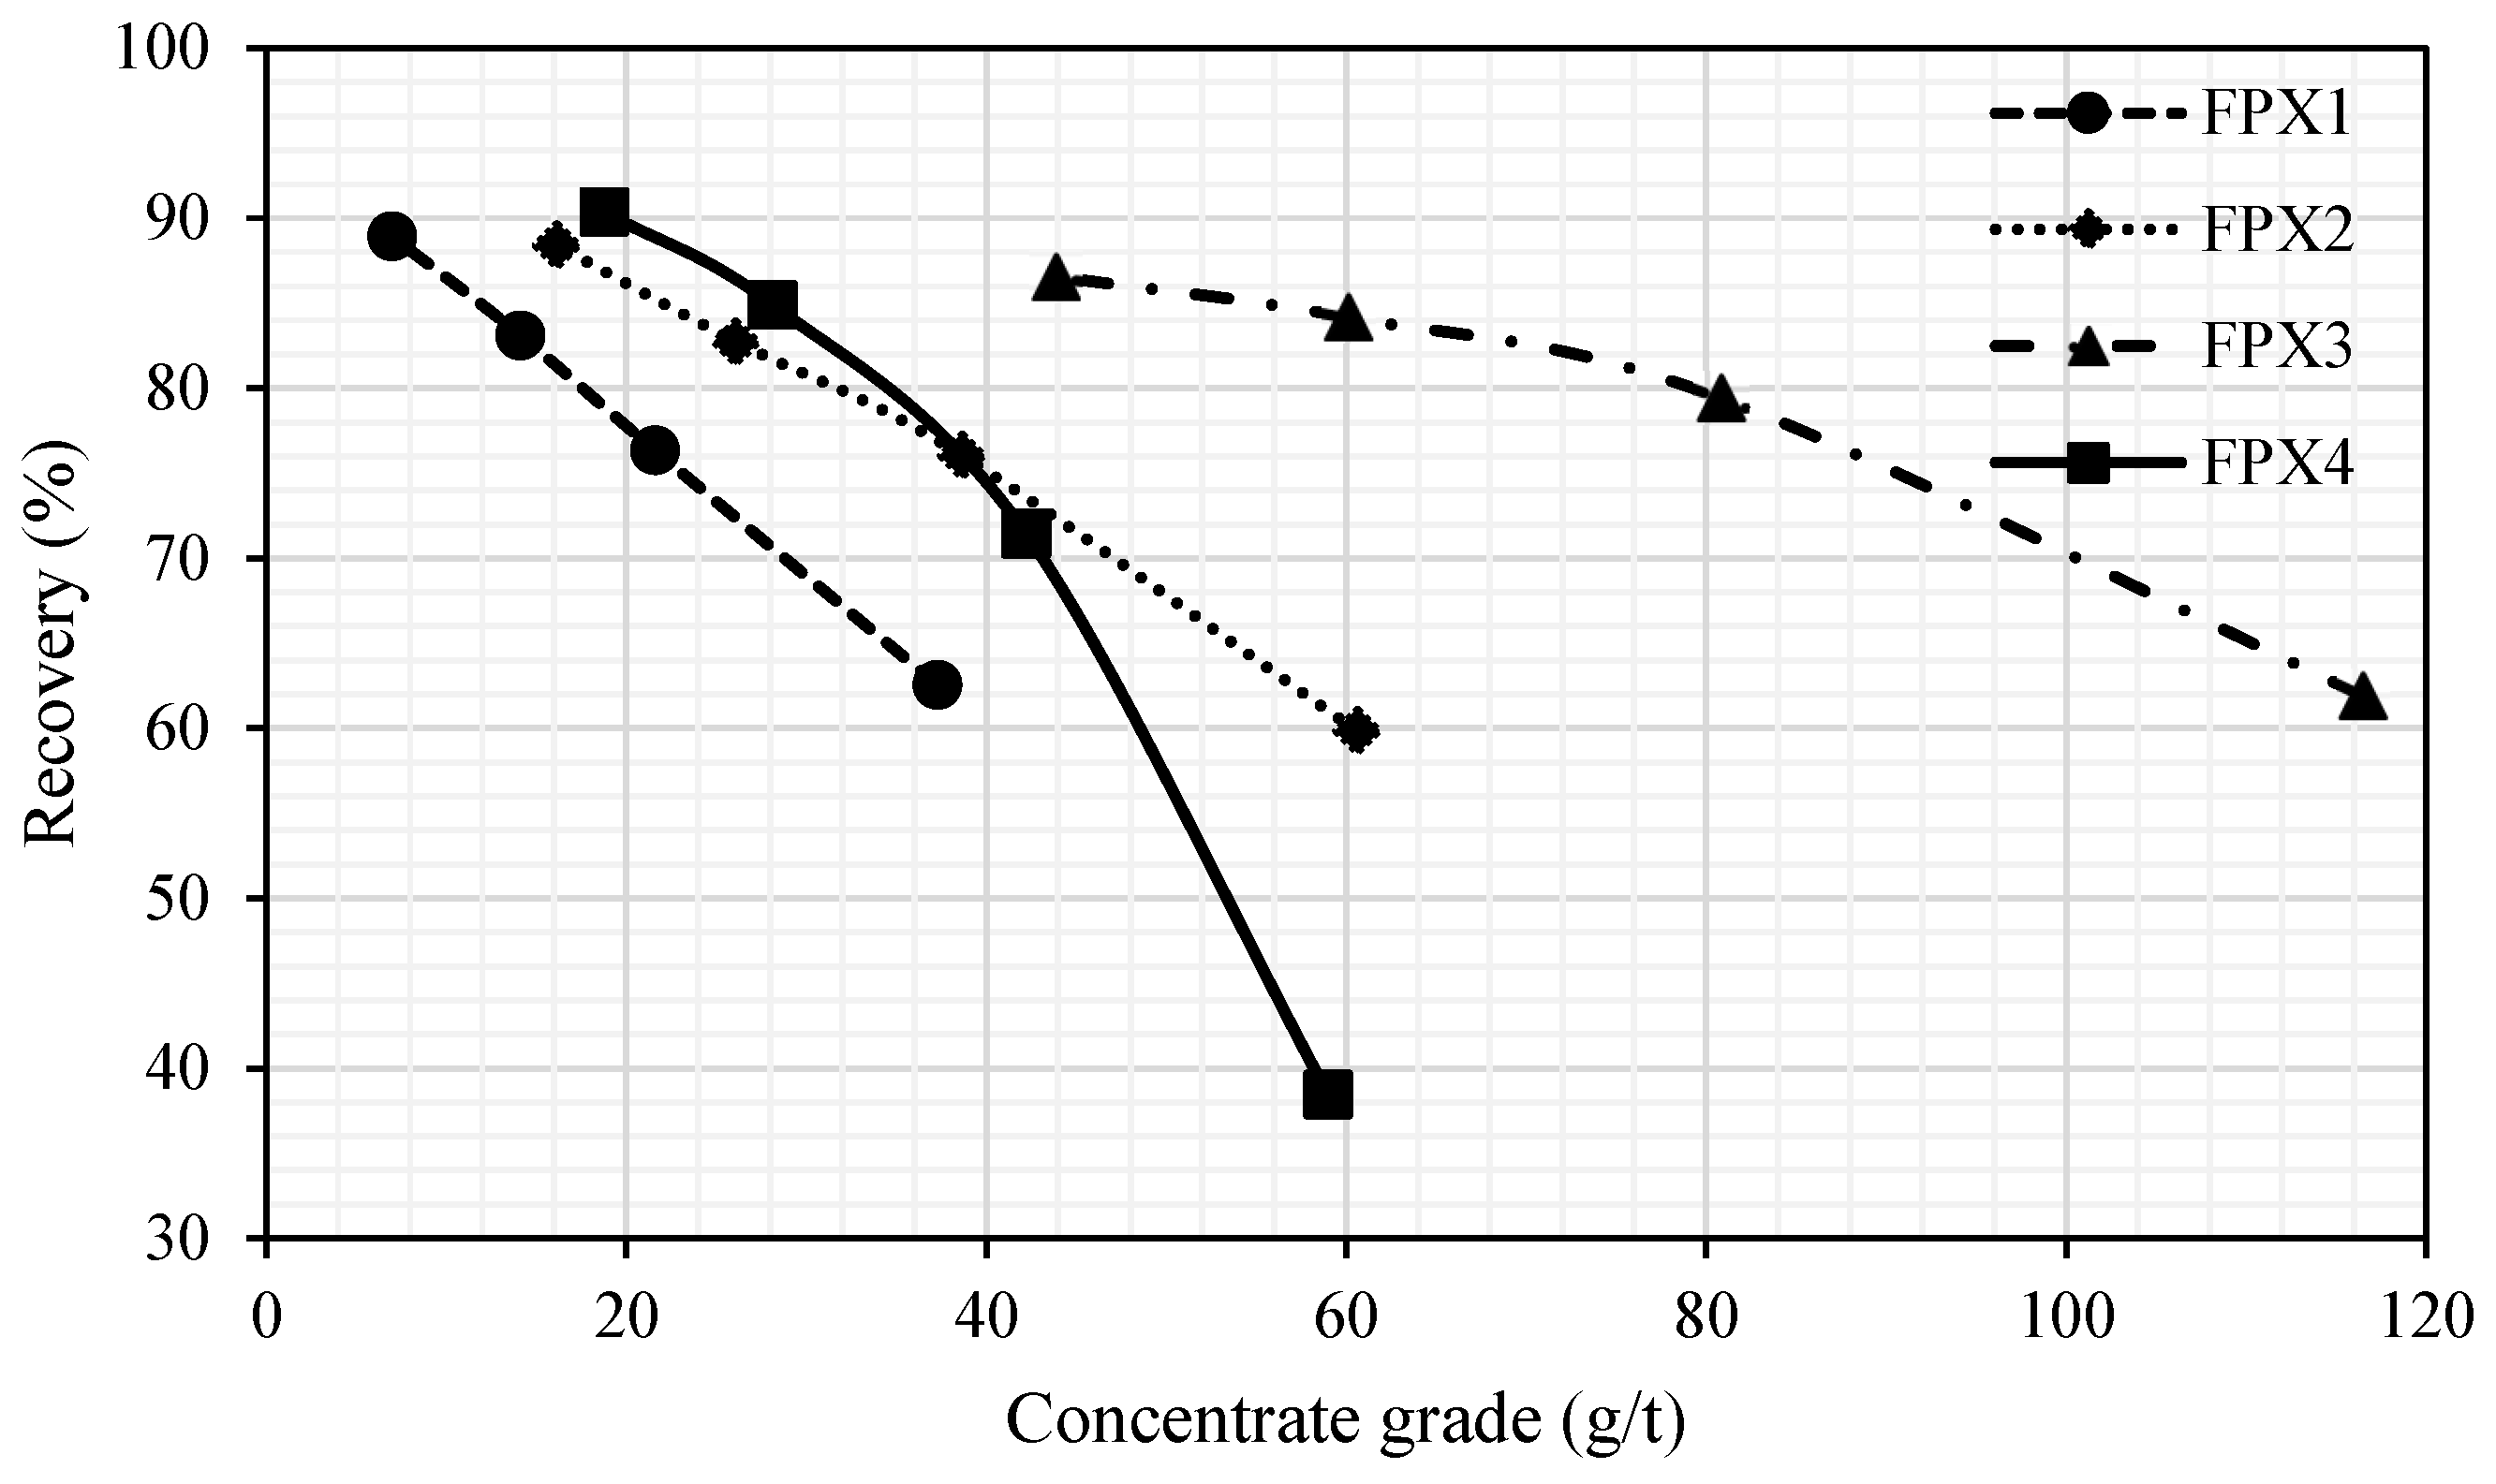
This study reveals substantial mineralogical variability between P-FPX and FPX lithologies and their direct influence on flotation performance. FPX samples consistently outperformed P-FPX in terms of cumulative recovery (e.g., FPX4 = 90.35%) and concentrate grade (FPX3 = 116.5 g/t at 1 min), attributable to higher proportions of liberated PGMs (up to 90.6% in FPX1) and simpler mineral associations. In contrast, P-FPX samples, particularly P-FPX2 and P-FPX3, contained a greater abundance of PGMs in locked or complex modes of occurrence (e.g., SAG, G classes), which showed suppressed flotation kinetics (Kf < 0.09 min−1) and anomalous slow-floating behavior (Ks up to 8.67 min−1).
Grain size distribution also contributed to flotation outcomes, with over 85% of PGMs across all samples being >3 μm, which is generally considered favorable for flotation [23]. Nonetheless, fine PGMs locked in silicates continued to pose recovery challenges, confirming that mineral association exerts a stronger control over floatability than grain size alone.
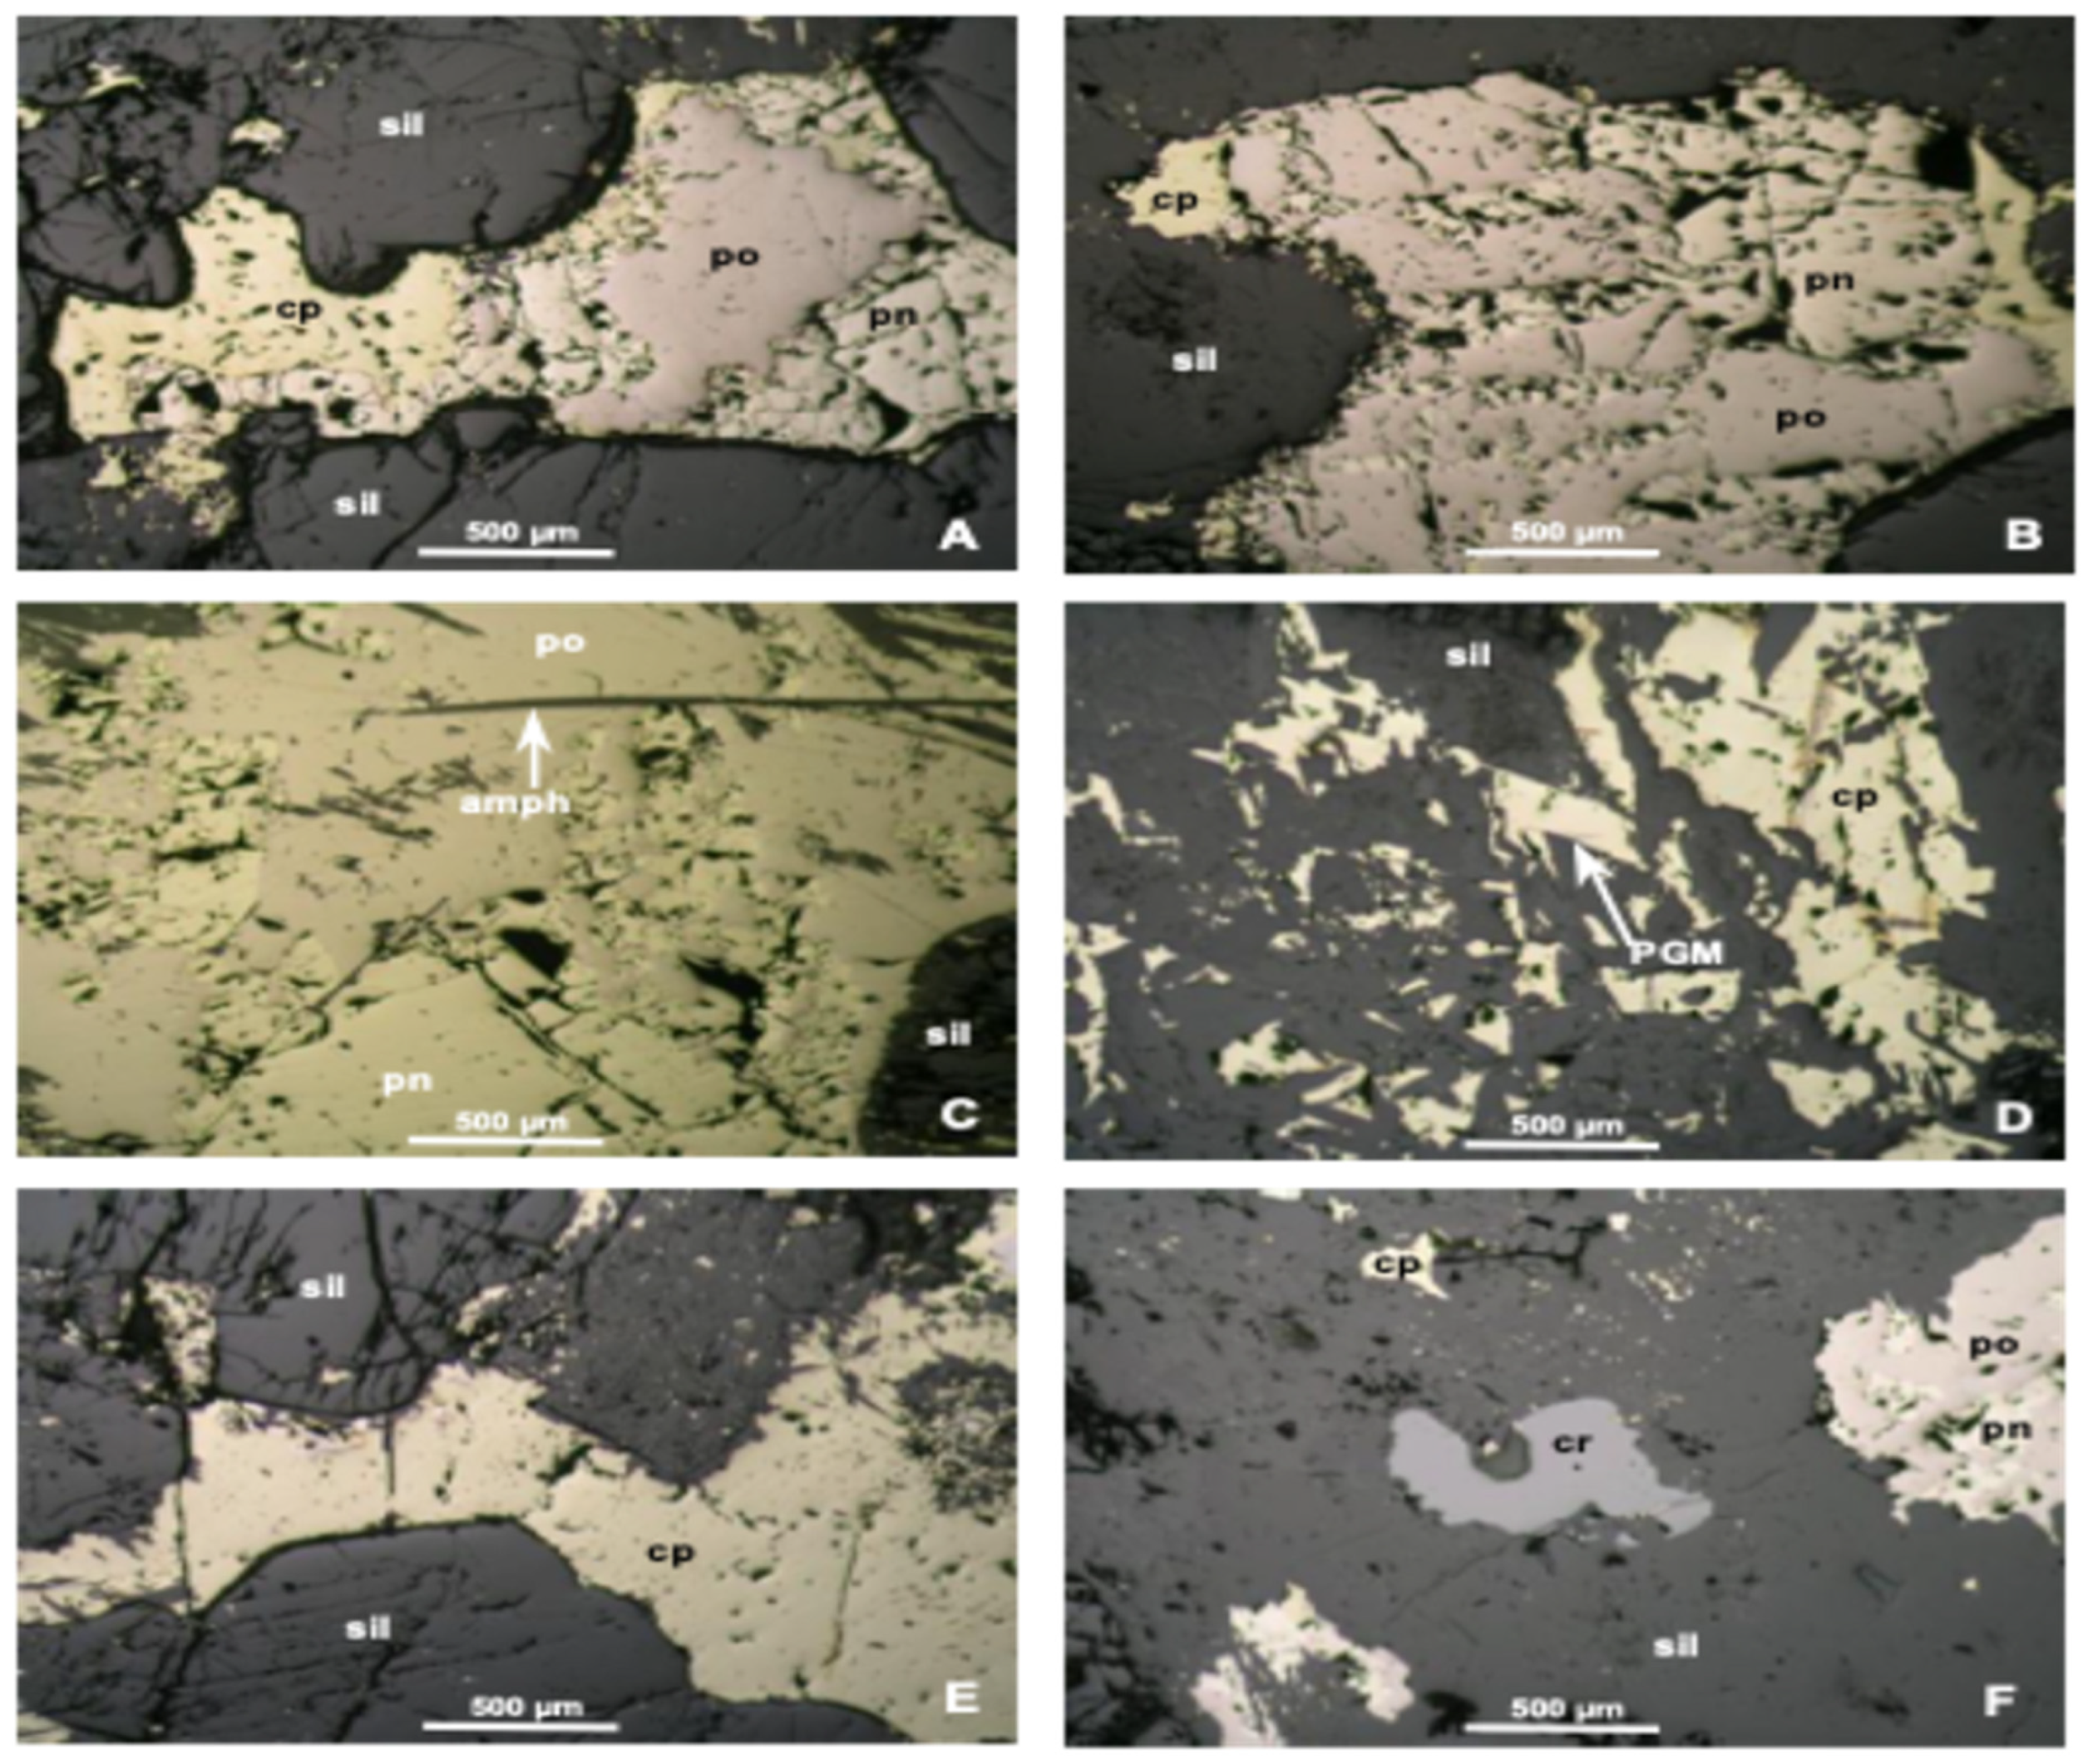
The variations in flotation kinetics observed between FPX and P-FPX lithologies can be partially explained by phenomenological factors rooted in mineral surface properties. Sulfide minerals, especially liberated base metal sulfides such as pentlandite and chalcopyrite, exhibit inherent hydrophobicity under typical flotation conditions due to their favorable electrochemical surface characteristics [24]. This contributes to their rapid attachment to air bubbles, yielding higher fast-floating fractions (∅f) and elevated Kf values in FPX samples. In contrast, PGMs locked within silicate or oxide gangue phases, as commonly seen in P-FPX samples, exhibit significantly lower surface hydrophobicity, often requiring prolonged flotation time or surface activation for recovery [42]. Furthermore, the presence of surface coatings, such as iron oxides or slimes, can passivate particle surfaces and hinder collector adsorption, as noted in previous studies on Bushveld ores [43,44,45]. These textural and mineral-chemical complexities provide a mechanistic basis for the suppressed kinetics observed in P-FPX samples and reinforce the need for tailored reagent regimes and conditioning protocols.
These findings align with prior work by Corin et al. [46], who demonstrated that mineral liberation and PGM association with sulfides are primary drivers of flotation efficiency in Bushveld-type ores. Similarly, (a) Becker et al. [11] and O’Connor et al. [12] noted that complex gangue interactions such as those with talc, feldspar, and amphibole can dilute concentrate grade and hinder bubble–particle attachment, as reflected here by the lower recovery observed in P-FPX3 (83.25%).
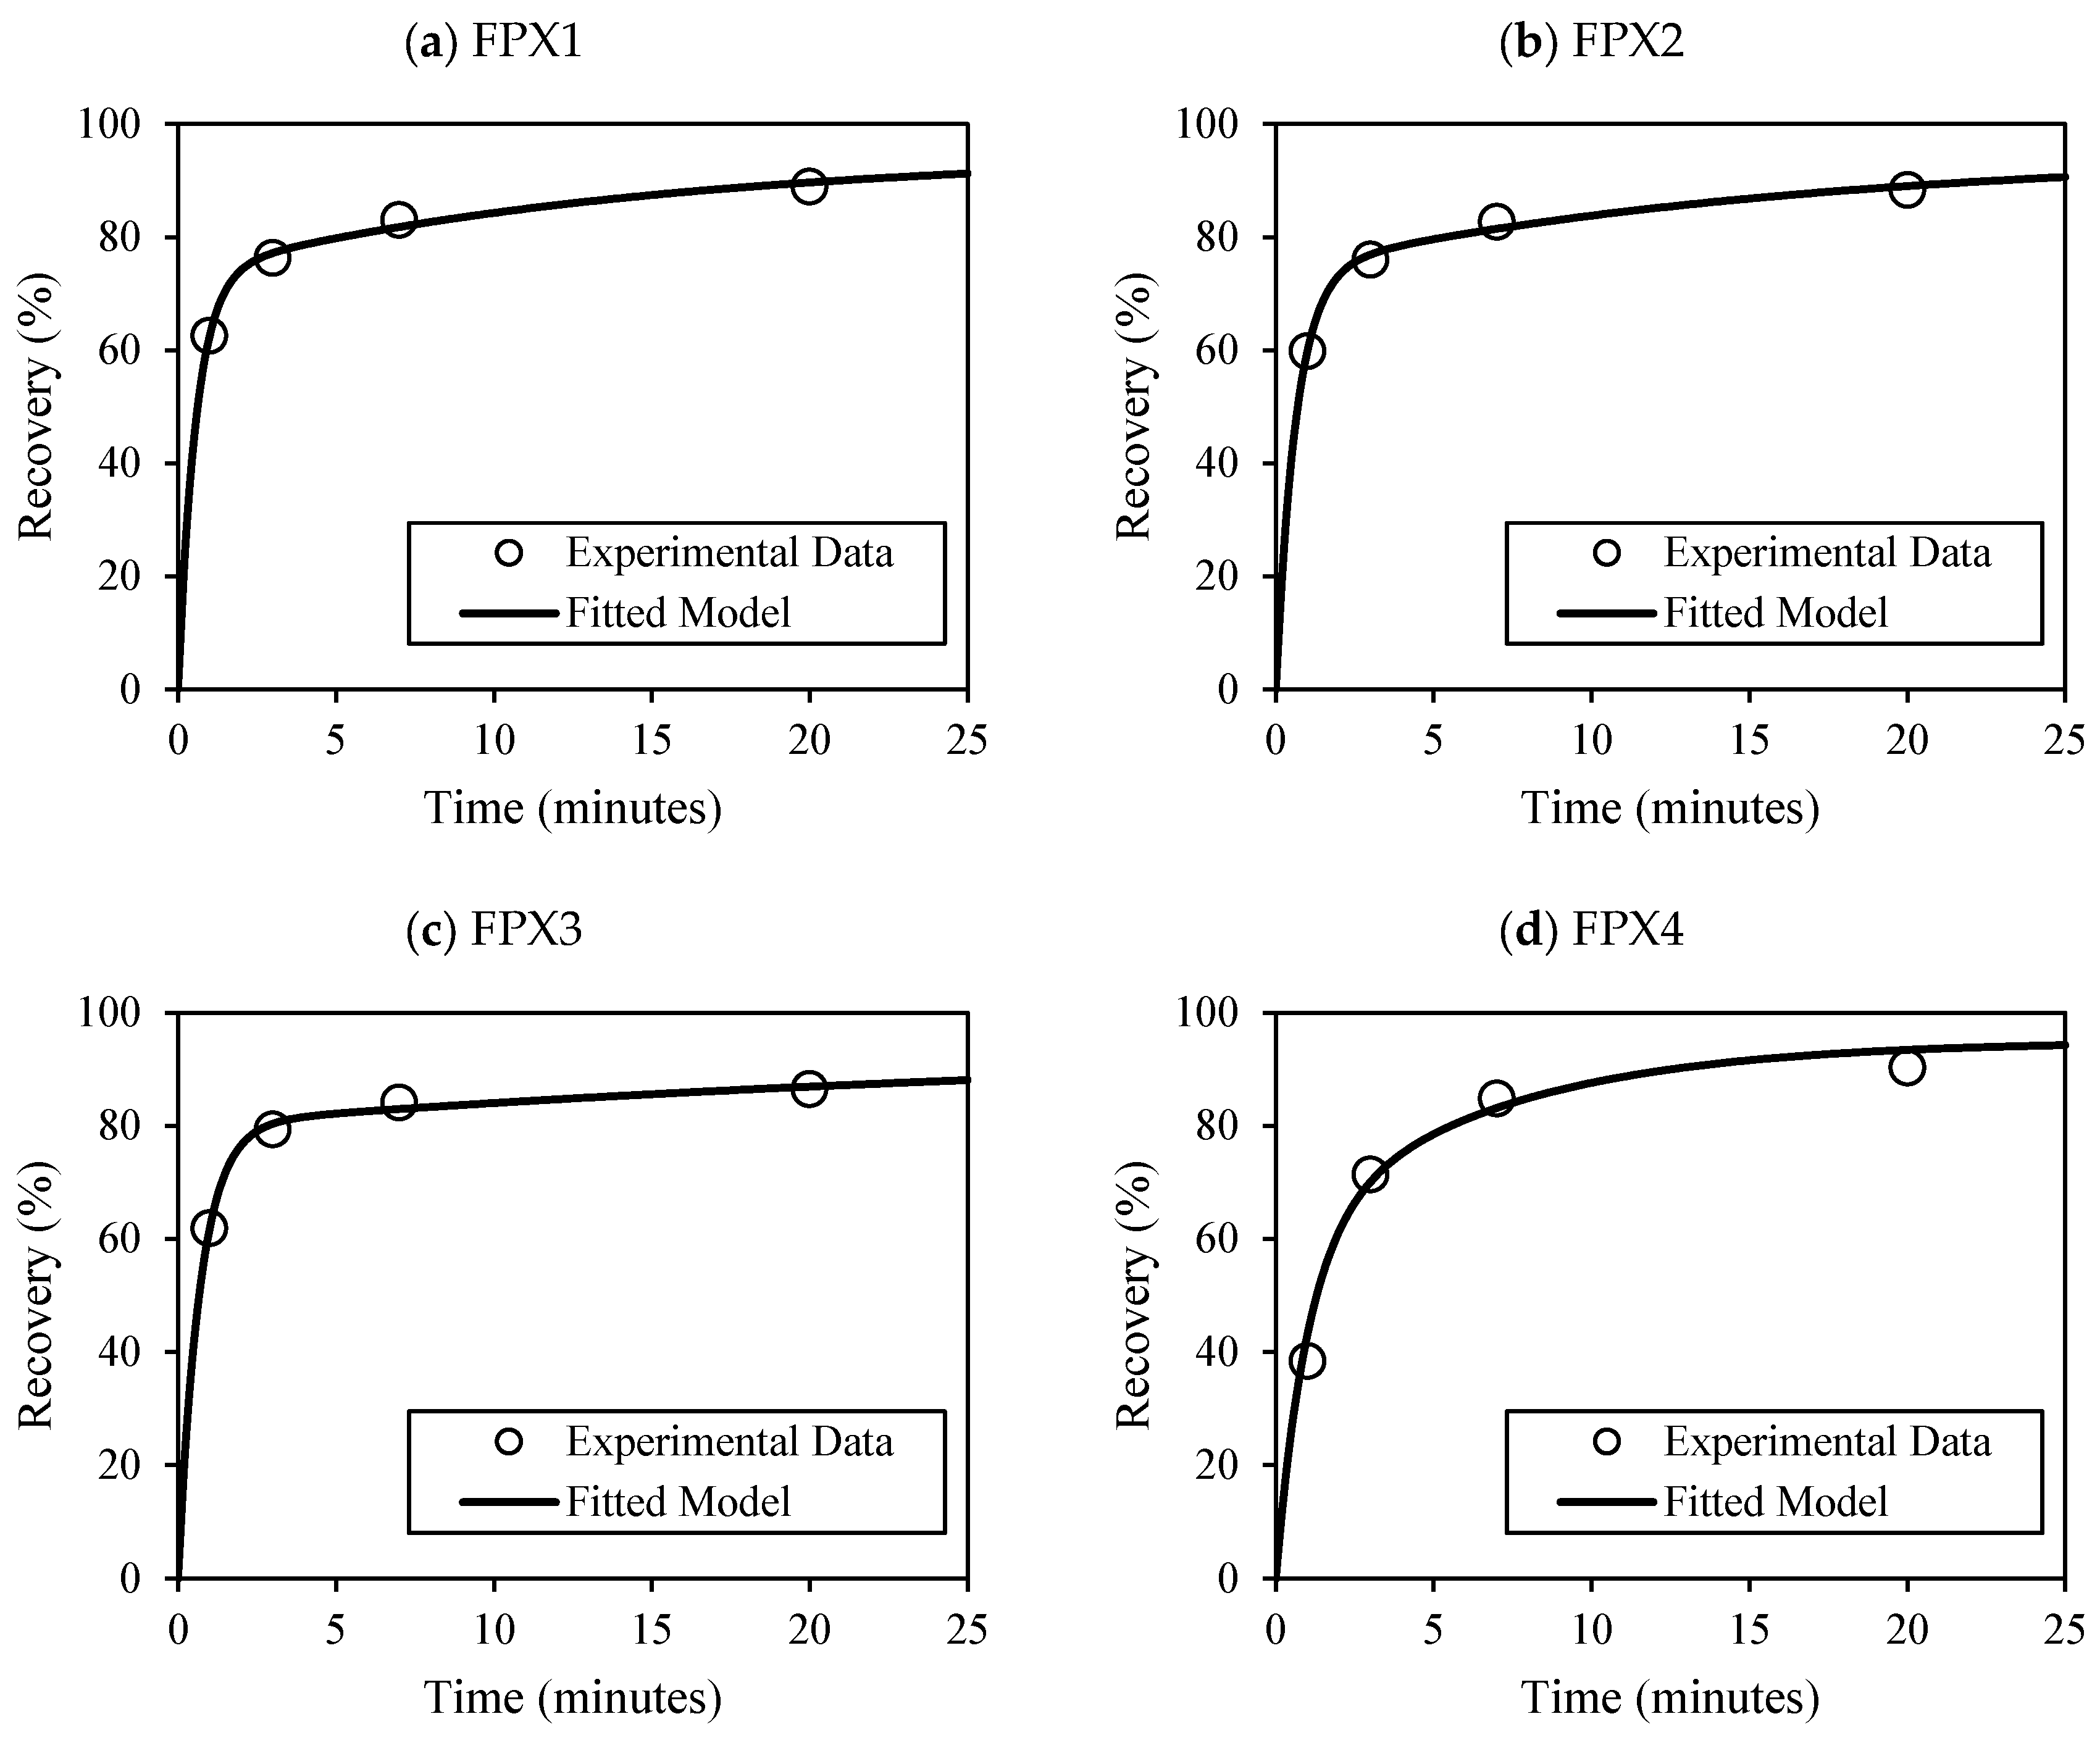
The modified Kelsall model, enhanced with MOC classes and optimized using PSO, successfully modeled dual-component flotation kinetics, achieving R2 values above 0.97 across all samples. Fast-floating fractions (∅f = 0.77–0.84) and high Kf values (1.45–1.78 min−1) were linked to L and SL MOC classes, corroborating earlier kinetic modeling studies by Ross [6] and Hay and Rule [7]. Conversely, samples dominated by G or SAG classes required longer flotation times and were associated with higher model error (e.g., P-FPX4 = 57.3), indicating the need for improved classification or advanced machine learning techniques to better capture complex textural effects [47,48].
Several flotation kinetics parameters derived in this study exhibited characteristics indicative of mathematical artefacts, which diminish their physical interpretability. This phenomenon can be attributed primarily to the intrinsic complexity and mineralogical variability of the ore, where multiple MOCs with diverse liberation and flotation behaviors complicate parameter estimation. Moreover, measurement noise and variability inherent in flotation test data contribute to parameter uncertainty, often leading the optimization routine to fit noise rather than true kinetic behavior.
From a practical plant perspective, the kinetic parameters derived in this study offer critical insight for tailoring flotation circuits to lithological domains. For instance, the significantly faster flotation kinetics and high fast-floating fractions observed in FPX samples (e.g., ∅f = 0.77–0.84; Kf = 1.45–1.78 min−1) suggest that these ores can be effectively treated using standard residence times and conventional reagent regimes. In contrast, P-FPX ores, characterized by slower kinetics and higher proportions of locked PGMs, may require circuit modifications such as increased flotation residence time, staged regrinding, or customized reagents targeting gangue depression and selective collector adsorption.
An important but often overlooked variable is water quality. In this study, tap water was used throughout flotation testing to reflect site-relevant operational conditions. While this introduces a realistic context, it also adds uncontrolled variability in parameters such as ionic strength, pH buffering, and hardness, all of which can influence collector adsorption, frother performance, and gangue depression [46,49]. Although no major inconsistencies were observed in replicate tests, future work should include water chemistry profiling and controlled experiments to isolate and quantify these effects for more robust kinetic modeling and improved plant predictability.
Importantly, the study demonstrates that lithology-specific flotation strategies are essential: P-FPX ores, due to their complex associations, may benefit from finer grinding and targeted reagents, while FPX ores can be efficiently processed using standard circuits. This geometallurgical insight supports the integration of mineralogical attributes into flotation kinetics for improved recovery prediction, process design, and dynamic plant control, particularly at the DFS stage.
In practice, flotation plant operators and metallurgists rarely have access to detailed mineralogical models in real time. However, this research emphasizes the strategic value of integrating mineralogical inputs at the design and geometallurgical modeling stages, especially when defining spatial domains, blending strategies, and flotation circuit configuration. For example, predicting the floatability index based on MOC distributions can support ore classification during mine planning or short-term stockpile management. In feasibility studies, the kinetic parameters derived can feed into dynamic simulation platforms like JKSimFloat or Outotec HSC Sim, enabling predictive evaluations of throughput, concentrate grade, and recovery under varying feed scenarios.
Overall, the integration of comprehensive mineralogical characterization, systematic flotation testing, and rigorous kinetic modeling provides a robust and quantitative framework to inform circuit design and optimize flotation performance across mineralogically diverse ore types. By directly correlating key mineralogical parameters, such as liberation size distributions, mineral associations, and modes of occurrence, with flotation kinetics and recovery metrics, this approach enables the development of predictive models that more accurately capture the complexity and variability of real-world ores. This methodology aligns with the principles of modern geometallurgy, as emphasized by Mwanga et al. [50] and Lois-Morales et al. [51] supports improved process design, control strategies, and long-term operational efficiency in the context of resource variability.
Such integration supports the rational design and optimization of flotation circuits by enabling targeted adjustments in grinding, reagent schemes, and operational conditions tailored to specific lithological domains. The use of advanced optimization algorithms, including PSO, further refines kinetic parameter estimation, enhancing model robustness and predictive capability.
This framework is consistent with contemporary geometallurgical paradigms, which advocate for the synergistic coupling of geological, mineralogical, and metallurgical datasets to drive data-informed process design and control. The application of this integrated methodology at the feasibility and design stages offers improved confidence in plant performance forecasting, facilitates dynamic circuit adjustments to accommodate ore variability, and ultimately contributes to enhanced recovery efficiency and concentrate quality.
The results presented demonstrate the necessity of incorporating mineralogical complexity into flotation kinetic models to capture the effects of heterogeneous mineral associations and surface properties. This integrated geometallurgical approach has broad applicability for optimizing flotation performance in a range of polymetallic and complex sulfide ore systems, thereby advancing process understanding and supporting more effective mineral processing operations.

5. Limitations and Future Work

While the integration of mineralogical MOC into the modified Kelsall model significantly enhanced flotation kinetics prediction, the use of PSO to fit multiple kinetic parameters across several MOC classes introduces a risk of overfitting. The model achieved high internal accuracy (R2 > 0.97), but the absence of external validation datasets limits the ability to assess generalization to other ore types or processing conditions. Furthermore, certain MOC categories, particularly SAG and G, exhibited anomalous or unstable kinetic parameter estimates, suggesting limited robustness in highly locked mineral systems. Future work should focus on implementing cross-validation strategies, constraining parameter search spaces, and evaluating model performance across independent datasets from other PGM deposits such as UG2 and the Great Dyke. Moreover, incorporating regularization techniques or hybrid machine learning–kinetic frameworks may improve the model’s predictive stability in the presence of mineralogical complexity.
This study focuses on developing and validating a detailed flotation kinetic model that accounts for mineralogical variability, but its direct integration into existing plant control systems or predictive control frameworks is beyond the current scope. The presented model lays the groundwork for future implementation efforts, which will involve addressing challenges such as real-time data integration, computational efficiency, and control algorithm design. Future research will investigate these aspects to facilitate embedding the model within advanced process control and digital twin platforms, ultimately enhancing flotation circuit performance.
Furthermore, this study successfully demonstrates the integration of mineralogical variability into flotation kinetic modeling through MOCs, but it does not explicitly quantify the relative impact of individual mineralogical attributes on kinetic performance. This omission reflects the study’s primary focus on developing and validating the geometallurgical modeling framework. Future research will address this by applying feature importance techniques and sensitivity analyses to identify the most influential mineralogical drivers, thereby supporting more targeted data collection strategies in industrial applications.

6. Conclusions

This study demonstrates the significant benefits of integrating mineralogical variability into flotation modeling for complex PGM orebodies. Specifically, key mineralogical attributes such as Mode of Occurrence (MOC), grain size distribution, gangue mineral composition, and mineral associations were shown to have a strong influence on flotation behavior and recovery trends across different lithologies. The modified Kelsall flotation model applied in this research effectively captured these relationships by linking kinetic response to the underlying geometallurgical characteristics of the ore.
The results showed that PGMs occurring in liberated form or associated with sulfide minerals generally exhibit faster flotation kinetics and higher recoveries, aligning with their favorable surface properties and hydrophobicity. In contrast, PGMs encapsulated within silicate gangue or complex multiphase associations tended to float more slowly or not at all, highlighting the physical and chemical constraints that affect their floatability.
The dual-rate model structure proved particularly effective in distinguishing fast- and slow-floating components within the ore, allowing for more accurate simulation of metallurgical performance under varying operational scenarios. This modeling approach not only improved the fit to experimental data but also offered practical insights into the recoverability of different PGM mineral populations, enhancing the interpretability and predictive capability of the flotation model.
These findings underscore the importance of geometallurgical integration in process modeling and design. By tailoring flotation strategies to the specific mineralogical features of an ore, operators can better optimize reagent schemes, grinding strategies, and circuit configurations, ultimately improving metallurgical efficiency and reducing losses. Future studies should continue to incorporate multi-scale mineralogical data and validate model predictions at pilot or plant scale, with the aim of advancing robust, predictive frameworks for process optimization in complex, polymetallic deposits.

Author Contributions

Conceptualization, A.M.K. and K.E.W.; methodology, A.M.K.; validation, A.M.K., K.E.W. and K.M.; formal analysis, A.M.K.; investigation, A.M.K. and K.E.W.; resources, A.M.K.; data curation, A.M.K.; writing—original draft preparation, A.M.K.; writing—review and editing, A.M.K., K.E.W. and K.M.; visualization, A.M.K.; supervision, K.E.W. All authors have read and agreed to the published version of the manuscript.

Funding

The authors acknowledge the Gerald Hatch Faculty Fellowship.

Data Availability Statement

The original contributions presented in this study are included in the article. Further inquiries can be directed to the corresponding author.

Conflicts of Interest

The authors declare no conflicts of interest.

References

  1. Sahu, P.; Dash, P.; Jena, M.S.; Mandre, N.R. Flotation of Platinum Group Elements Ores: A Review. Miner. Process. Extr. Metall. Rev. 2023, 44, 102–124. [Google Scholar] [CrossRef]
  2. Dzingai, T.; McFadzean, B.; Tadie, M.; Becker, M. Decoupling the effects of alteration on the mineralogy and flotation performance of Great Dyke PGE ores. J. S. Afr. Inst. Min. Met. 2021, 121, 475–486. [Google Scholar] [CrossRef] [PubMed]
  3. Doubra, P.; Carelse, C.; Chetty, D.; Manuel, M. Experimental and Modelling Study of Pt, Pd, and 2E+Au Flotation Kinetics for Platreef Ore by Exploring the Influence of Reagent Dosage Variations. Minerals 2023, 13, 1350. [Google Scholar] [CrossRef]
  4. Lotter, N.O. Modern Process Mineralogy: An integrated multi-disciplined approach to flowsheeting. Miner. Eng. 2011, 24, 1229–1237. [Google Scholar] [CrossRef]
  5. Corin, K.C.; Bezuidenhout, J.C.; O’Connor, C.T. The role of dithiophosphate as a co-collector in the flotation of a platinum group mineral ore. Miner. Eng. 2012, 36–38, 100–104. [Google Scholar] [CrossRef]
  6. Ross, V. Key aspects of bench flotation as a geometallurgical characterization tool. J. S. Afr. Inst. Min. Met. 2019, 119, 361–367. [Google Scholar] [CrossRef]
  7. Hay, M.P.; Rule, C.M. SUPASIM: A flotation plant design and analysis methodology. Miner. Eng. 2003, 16, 1103–1109. [Google Scholar] [CrossRef]
  8. Murhula, E.M.; Hashan, M.; Otsuki, A. Effect of Solid Concentration and Particle Size on the Flotation Kinetics and Entrainment of Quartz and Hematite. Metals 2022, 13, 53. [Google Scholar] [CrossRef]
  9. Silva, R.R.R. Flotation Circuit Optimization Using Modelling and Simulation. In Proceedings of the 16th International Conference on Mineral Processing and Geometallurgy, Virtual, 23–27 November 2021. [Google Scholar]
  10. Bai, L.; Liu, J.; Han, Y.; Jiang, K.; Zhao, W. Effects of Xanthate on Flotation Kinetics of Chalcopyrite and Talc. Minerals 2018, 8, 369. [Google Scholar] [CrossRef]
  11. Becker, M.; Wiese, J.; Ramonotsi, M. Investigation into the mineralogy and flotation performance of oxidised PGM ore. Miner. Eng. 2014, 65, 24–32. [Google Scholar] [CrossRef]
  12. O’Connor, C.; Wiese, J.; Corin, K.; Mcfadzean, B. A review of investigations into the management of gangue in the flotation of platinum group minerals. Physicochem. Probl. Miner. Process. 2018, 54, 1107–1115. [Google Scholar]
  13. Bahrami, A.; Mirmohammadi, M.; Ghorbani, Y.; Kazemi, F.; Abdollahi, M.; Danesh, A. Process mineralogy as a key factor affecting the flotation kinetics of copper sulfide minerals. Int. J. Miner. Metall. Mater. 2019, 26, 430–439. [Google Scholar] [CrossRef]
  14. O’Connor, C.T. Investigations into the Recovery of Platinum Group Minerals from the Platreef Ore of the Bushveld Complex of South Africa. Platin. Met. Rev. 2013, 57, 302–310. [Google Scholar] [CrossRef]
  15. Tijsseling, L.T.; Dehaine, Q.; Rollinson, G.K.; Glass, H.J. Mineralogical Prediction of Flotation Performance for a Sediment-Hosted Copper–Cobalt Sulphide Ore. Minerals 2020, 10, 474. [Google Scholar] [CrossRef]
  16. Bu, X.; Xie, G.; Peng, Y.; Ge, L.; Ni, C. Kinetics of flotation. Order of process, rate constant distribution and ultimate recovery. Physicochem. Probl. Miner. Process. 2017, 53, 342–365. [Google Scholar] [CrossRef]
  17. Vinnett, L.; Navarra, A.; Waters, K.E. Comparison of different methodologies to estimate the flotation rate distribution. Miner. Eng. 2019, 130, 67–75. [Google Scholar] [CrossRef]
  18. Alvarez-Silva, M.; Vinnett, L.; Langlois, R.; Waters, K.E. A comparison of the predictability of batch flotation kinetic models. Miner. Eng. 2016, 99, 142–150. [Google Scholar] [CrossRef]
  19. Vinnett, L.; Marion, C.; Grammatikopoulos, T.; Waters, K.E. Analysis of flotation rate distributions to assess erratic performances from size-by-size kinetic tests. Miner. Eng. 2020, 149, 106229. [Google Scholar] [CrossRef]
  20. Ramlall, N.V.; Loveday, B.K. A comparison of models for the recovery of minerals in a UG2 platinum ore by batch flotation. J. S. Afr. Inst. Min. Met. 2015, 115, 221–228. [Google Scholar] [CrossRef]
  21. Nakhaei, F.; Hassanzadeh, A.; Cisternas, L.A. Design, Modeling, Optimization and Control of Flotation Process; MDPI: Basel, Switzerland, 2024. [Google Scholar]
  22. Chetty, D.; Gryffenberg, L.; Lekgetho, T.B.; Molebale, I.J. Automated SEM study of PGM distribution across a UG2 flotation concentrate bank: Implications for understanding PGM floatability. J. S. Afr. Inst. Min. Met. 2009, 109, 587–593. [Google Scholar]
  23. Bushell, C. The PGM flotation predictor: Predicting PGM ore flotation performance using results from automated mineralogy systems. Miner. Eng. 2012, 36–38, 75–80. [Google Scholar] [CrossRef]
  24. Kennedy, J.; Eberhart, R. Particle swarm optimization. In Proceedings of the ICNN’95—International Conference on Neural Networks, Perth, WA, Australia, 27 November–1 December 1995; Volume 4, pp. 1942–1948. [Google Scholar]
  25. Wang, J.-S.; Han, S. Feed-Forward Neural Network Soft-Sensor Modeling of Flotation Process Based on Particle Swarm Optimization and Gravitational Search Algorithm. Comput. Intell. Neurosci. 2015, 2015, 147843. [Google Scholar] [CrossRef]
  26. Amankwaa-Kyeremeh, B.; McCamley, C.; Zanin, M.; Greet, C.; Ehrig, K.; Asamoah, R.K. Prediction and Optimisation of Copper Recovery in the Rougher Flotation Circuit. Minerals 2023, 14, 36. [Google Scholar] [CrossRef]
  27. Hasidi, O.; Abdelwahed, E.H.; El Alaoui-Chrifi, M.A.; Chahid, R.; Qazdar, A.; Qassimi, S.; Zaizi, F.Z.; Bourzeix, F.; Benzakour, I.; Bendaouia, A. Data-driven system for intelligent monitoring and optimization of froth flotation circuits using Artificial Neural Networks and Genetic Algorithms. J. Process Control 2024, 137, 103198. [Google Scholar] [CrossRef]
  28. Szmigiel, A.; Apel, D.B.; Skrzypkowski, K.; Wojtecki, L.; Pu, Y. Advancements in Machine Learning for Optimal Performance in Flotation Processes: A Review. Minerals 2024, 14, 331. [Google Scholar] [CrossRef]
  29. Carelse, C.; Manuel, M.; Chetty, D.; Taguta, J.; Safari, M.; Youlton, K. The flotation behaviour of liberated Platinum Group minerals in Platreef ore under reduced reagent conditions. Miner. Eng. 2022, 190, 107913. [Google Scholar] [CrossRef]
  30. Nasiri, M.; Iqbal, S.; Särkkä, S. Physics-Informed Machine Learning for Grade Prediction in Froth Flotation. Miner. Eng. 2025, 227, 109297. [Google Scholar] [CrossRef]
  31. Dunne, R.C.; Lane, G.S.; Richmond, G.D.; Dioses, J. Flotation data for the design of process plants Part 1—Testing and design procedures. Trans. Inst. Min. Metall. Sect. C Miner. Process. Extr. Metall. 2010, 119, 199–204. [Google Scholar] [CrossRef]
  32. Dunne, R.C.; Lane, G.S.; Richmond, G.D.; Dioses, J. Flotation data for the design of process plants Part 2—Case studies. Trans. Inst. Min. Metall. Sect. C Miner. Process. Extr. Metall. 2010, 119, 205–215. [Google Scholar] [CrossRef]
  33. Ramlall, V.; Bryson, M.A.W.; Loveday, B.K. UG2 metallurgical variability. In Proceedings of the 4th International Platinum Conference, Platinum in Transition ‘Boom or Bust’, Sun City, South Africa, 11–14 October 2010; Southern African Institute of Mining and Metallurgy: Johannesburg, South Africa, 2010. [Google Scholar]
  34. Lotter, N.O.; Bradshaw, D.J. The formulation and use of mixed collectors in sulphide flotation. Miner. Eng. 2010, 23, 945–951. [Google Scholar] [CrossRef]
  35. Corin, K.C.; Song, Z.G.; Wiese, J.G.; O’Connor, C.T. Effect of using different grinding media on the flotation of a base metal sulphide ore. Miner. Eng. 2018, 126, 24–27. [Google Scholar] [CrossRef]
  36. Muzenda, E.; Afolabi, A.S.; Abdulkareem, A.S.; Ntuli, F. Effect of pH on the Recovery and Grade of Base Metal Sulphides (PGMs) by Flotation. In Proceedings of the World Congress on Engineering and Computer Science, San Francisco, CA, USA, 19–21 October 2011; Volume II. [Google Scholar]
  37. Wali, A.; Filippov, L.; Fekry, A.M.; O’Connor, C.T.; McFadzean, B. An investigation into the effect of Eh and pH on the adsorption of a xanthate collector on sperrylite (PtAs2): A surface and solution characterization study. Miner. Eng. 2024, 217, 108949. [Google Scholar] [CrossRef]
  38. Manono, M.S.; Corin, K.C.; Wiese, J.G. The Behavior of Gangue During the Flotation of a Sulfidic PGM-Bearing Ore in Response to Various Monovalent and Divalent Ions in Process Water. Front. Chem. 2020, 8, 79. [Google Scholar] [CrossRef] [PubMed]
  39. Dzingai, M.; Manono, M.S.; Corin, K.C. Probing the Effect of Water Recycling on Flotation through Anion Spiking Using a Low-Grade Cu–Ni–PGM Ore: The Effect of NO3, SO42− and S2O32−. Minerals 2021, 11, 340. [Google Scholar] [CrossRef]
  40. Manono, M.S.; Matibidi, K.; Thubakgale, C.K.; Corin1, K.C.; Wiese, J.G. Water Quality in PGM Ore Flotation: The Effect of Ionic Strength and pH; International Mine Water Association: Lakewood, CO, USA, 2017. [Google Scholar]
  41. Zhang, Z.; Liu, Y.; Bo, L.; Yue, Y.; Wang, Y. Economic Optimal Allocation of Mine Water Based on Two-Stage Adaptive Genetic Algorithm and Particle Swarm Optimization. Sensors 2022, 22, 883. [Google Scholar] [CrossRef]
  42. Lotter, N.O.; Whiteman, E.; Bradshaw, D.J. Modern practice of laboratory flotation testing for flowsheet development—A review. Miner. Eng. 2014, 66–68, 2–12. [Google Scholar] [CrossRef]
  43. Miller, J.D.; Li, J.; Davidtz, J.C.; Vos, F. A review of pyrrhotite flotation chemistry in the processing of PGM ores. Miner. Eng. 2005, 18, 855–865. [Google Scholar] [CrossRef]
  44. Corin, K.; McFadzean, B.; Shackleton, N.; O’Connor, C. Challenges Related to the Processing of Fines in the Recovery of Platinum Group Minerals (PGMs). Minerals 2021, 11, 533. [Google Scholar] [CrossRef]
  45. Yao, W.; Li, M.; Zhang, M.; Cui, R.; Ning, J.; Shi, J. Effects and Mechanisms of Grinding Media on the Flotation Behavior of Scheelite. ACS Omega 2020, 5, 32076–32083. [Google Scholar] [CrossRef]
  46. Corin, K.C.; Reddy, A.; Miyen, L.; Wiese, J.G.; Harris, P.J. The effect of ionic strength of plant water on valuable mineral and gangue recovery in a platinum bearing ore from the Merensky reef. Miner. Eng. 2011, 24, 131–137. [Google Scholar] [CrossRef]
  47. Gharai, M.; Venugopal, R. Modeling of flotation process—An overview of different approaches. Miner. Process. Extr. Metall. Rev. 2015, 37, 120–133. [Google Scholar] [CrossRef]
  48. Jovanović, I.; Miljanović, I. Modelling of Flotation Processes by Classical Mathematical Methods—A Review. Arch. Min. Sci. 2015, 60, 905–919. [Google Scholar] [CrossRef]
  49. Taguta, J.; Teme, K.C.; Ngobeni, P. The Role of Gangue Mineralogy on Flowsheet Development in Fluorite Processing. Minerals 2020, 10, 237. [Google Scholar] [CrossRef]
  50. Mwanga, A.; Rosenkranz, J.; Lamberg, P. Testing of Ore Comminution Behavior in the Geometallurgical Context—A Review. Minerals 2015, 5, 276–297. [Google Scholar] [CrossRef]
  51. Lois Morales, P.; Barbosa, K.; Evans, C.; Yahyaei, M. A Geometallurgical Approach to Comminution Using Primary Breakage Properties of Ores. In Proceedings of the Procemin Geomet 2020, Santiago, Chile, 25–27 November 2020. [Google Scholar]
Figure 1. Flotation test work MF1.
Minerals 15 00701 g001
Figure 2. Statistical analysis results of geometallurgical attributes.
Minerals 15 00701 g002
Figure 3. Electron-micrographs of PGM grains.
Minerals 15 00701 g003
Figure 4. Optical micrographs of BMS minerals.
Minerals 15 00701 g004
Figure 5. Optical micrographs of gangue minerals.
Minerals 15 00701 g005
Figure 6. Cumulative recovery versus cumulative concentrate grade for P-FPX samples (Conditions: SIBX 120 g/t, Sendep 30E 300 g/t, Senfroth 522 80 g/t, 80%–75 um).
Minerals 15 00701 g006
Figure 7. Cumulative recovery versus cumulative concentrate grade for FPX samples (Conditions: SIBX 120 g/t, Sendep 30E 300 g/t, Senfroth 522 80 g/t, 80%–75 um).
Minerals 15 00701 g007
Figure 8. Time-recovery data; (a) P-FPX rock types, (b) FPX rock type.
Minerals 15 00701 g008
Figure 9. Model fitness for the P-FPX rock types.
Minerals 15 00701 g009
Figure 10. Model fitness for the FPX rock types.
Minerals 15 00701 g010
Table 1. Liberation categories based on MOC.
Mode of OccurrenceLiberation CategoriesLiberation CharacteristicsMode of Occurrence Images
L1Liberated PGMsMinerals 15 00701 i001
SL2PGMs associated with liberated BMS (base metal sulfides) PGMsMinerals 15 00701 i002
AG3PGMs attached to Silicate or Oxide gangue particlesMinerals 15 00701 i003
SAG4PGMs associated with BMS attached to Silicate or Oxide gangue particlesMinerals 15 00701 i004
SG5PGMs associated with BMS locked in Silicate or Oxide gangue particlesMinerals 15 00701 i005
G-6PGMs locked within Silicate or Oxide gangue particlesMinerals 15 00701 i006
Minerals 15 00701 i007 PGM Minerals 15 00701 i008 BMS Minerals 15 00701 i009 GANGUE
Table 2. Mineralogy Equipment.
EquipmentModelManufacturerKey Operating ParametersCompany Location
MLA (Mineral
Liberation Analyzer)
MLAFEI Company (now Thermo Fisher Scientific)20 kV beam, 10 µm resolution, iMeasure/iDiscover softwareHillsboro, OR, USA
QEMSCANQEMSCANFEI Company (now Thermo Fisher Scientific)20 kV beam, 10 µm resolution, 4× Bruker EDS detectorsHillsboro, OR, USA
SEMEVO 50ZEISS0.2–30 kV, high vacuum mode, magnification up to 1,000,000×Oberkochen, Baden-Württemberg, Germany
XRDX’Pert PROPANalytical40 kV, 30 mA, 10–60° 2θ scan rangeAlmelo, Overijssel, The Netherlands
BSE and EDS
(attached to SEM)
IntegratedZEISS (SEM)/
Bruker (EDS)
20–30 kV beam, Bruker XFlash EDSBillerica, MA, USA (Bruker)/Oberkochen, Germany (ZEISS)
Polishing MachineTegraPol-21Struers250 mm disc, 50–500 rpm speed, automatic/manual operationBallerup, Copenhagen, Denmark
Grinding Discs250 mm DiscsStruersVarious grit sizes (e.g., 120–600), for use with polishing systemsBallerup, Copenhagen, Denmark
Sieve Cleaning MachineUMC 20Not specifiedUltrasonic cleaning of test sievesN/A (Manufacturer not specified)
Table 3. Reagent supplier.
ReagentDosageFunctionOrder of AdditionConditioning TimeSupplier
SIBX120 g/tCollector (xanthate)1st2–3 minSenmin/Orica
Sendep 30E300 g/tDepressant (carboxymethyl cellulose or equivalent polymer)2nd2–3 minSenmin
Senfroth 52280 g/tFrother (alcohol-based or polyglycol ether blend)3rd1 min
(light agitation)
Senmin
Table 4. Modified Kelsall model notations and descriptions.
CategoryNotationDescription
Sets δ = ( 1 , . . . , δ ) Set of all liberation characteristics in terms of fractional liberation category in the Mode of Occurrence per lithology
θ = (1, …, θ) Set of all fractions of slow-floating components with the slow rate constant per lithology per liberation category
kf = (1, …, kf)A set of all fast flow rate constants
ks = (1, …, ks)A set of all slow flow rate constants
δ n = (1, …, δ n )A set of all predefined Mode of Occurrence classes
IndicesA general parameter f can take a maximum of three indices in the format of f l , n t . Where:
o = ( 1 , . . . , O ) An index for all rock types of the mineral deposit
l = ( 1 , . . . , L ) An index for all lithologies in each rock type, o, of the mineral deposit
n = ( 1 , . . . , N ) An index for all Modes of Occurrence in each lithology, l
t = ( t , . . . , T ) An index for flotation residence time
i = ( 1 , . . . , I ) An index for rock types
ParameterstNominal flotation residence time
k f l t A rate constant for fast-floating component per lithology, l
k s l t Rate constant for slow-floating component per lithology, l
θ l t A slow-floating fraction per lithology, l
k f l , n t Rate constant for fast-floating component per lithology, l, per liberation category, n
k s l , n t A rate constant for slow-floating component per lithology, l, per liberation category, n
θ l , n t A slow-floating fraction per lithology, l, per liberation category, n
T l b k f Lower bound on rate constant for fast-floating component per lithology per liberation category
T u b k f Upper bound on rate constant for fast-floating component per lithology per liberation category
T l b k s Lower bound on rate constant for slow-floating component per lithology per liberation category
T u b k s Upper bound on rate constant for slow-floating component per lithology per liberation category
T l b θ Lower bound on slow-floating fraction per lithology per liberation category
T u b θ Upper bound on slow-floating component per lithology per liberation category
o i Rock type
δ n Mode of Occurrence classes
Table 5. PGM mineralogy of different rock types (wt.%).
MineralRock Type
P-FPXFPX
PFPX1PFPX2PFPX3PFPX4FPX1FPX2FPX3FPX4
Gold10.451.807.455.190.892.783.54
PtS2.920.201.0702.040.8813.49
PtAs0.872.933.7819.5410.609.986.6
PdBi0012.990.166.234.882.520.08
PtBiTe23.1515.3317.11362.1150.4360.9140.75
PdBiTe35.6935.0560.231.029.5631.2910.930.81
PtPdBiTe6.230.3401.556.315.130.892.89
PdSb018.28018.620000
PtFe18.9716.1201.87003.440.59
Other
Total98.2890.0594.0794.2810094.6692.398.75
Table 6. BMS mineralogy of different rock types (wt%).
MineralRock Types
P-FPXFPX
PFPX1PFPX2PFPX3PFPX4FPX1FPX2FPX3FPX4
Pentlandite24.8535.7120.4732.2520.2425.3718.2326.22
Chalcopyrite17.9717.2919.5118.1218.6716.0910.3417.44
Pyrrhotite56.7445.1459.8449.1660.3257.4869.9854.88
Total99.5698.1499.8299.5399.2398.9498.5598.54
Table 7. Gangue mineralogy of different rock types (wt%).
MineralRock Types
P-FPXFPX
PFPX1PFPX2PFPX3PFPX4FPX1FPX2FPX3FPX4
Feldspar17.6110.2810.039.6611.7423.3437.9611.22
Clinopyroxene11.7517.3817.2019.1513.5017.7316.5323.50
Orthopyroxene33.8521.3817.3634.5866.3939.8231.0242.90
Olivine10.139.194.412.940.481.570.220.39
Serpentine7.3413.9619.154.230.020.960.361.60
Chlorite4.627.628.789.512.131.141.144.99
Amphibole5.625.819.8012.504.139.218.039.76
Total90.9285.6286.7392.5798.3993.7795.2694.36
Table 8. XRD analysis and chemical formulae of mineral phases.
MineralChemicalRelative Abundance
123456
Orthopyroxene (e.g., bronzite)(MgFe2+)2Si2O6PredPredPredPredPredMaj
Plagioclase (e.g., labradorite)(Na, Ca) Al (Al, Si) Si24O8MinMinMinNDMinMin
Clinopyroxene (e.g., diopside)Ca (Mg, Fe2+) Si2O6TrTrTrMinMinMin
Mica (e.g.,biotite)K (Mg, Fe)3(Al, Fe3+) Si3O10(OH, F)2TrTrTrTrTrND
Amphibole (e.g., hornblende)Ca2(Mg, Fe2+)4Al (Si7AI) O22(OH, F)2MinMinTrTrTrMin
CalciteCaCO3TrTrTrTrTrTr
TalcMg3Si4O10(OH)2MinMinTrTrTrMin
Chlorite(Mg, Fe2)5Al (Si3Al) O10(OH)8TrTrTrNDTrTr
Pred = Predominant (>50 Mass%); Maj = Major (20–50%); Min = Minor (5–20%); Tr = Trace (<5%); ND = Not detected by XRD).
Table 9. PGM MOC in the PFPX and FPX (vol %).
Mode of OccurrenceRock Types
PFPXFPX
PFPX1PFPX2PFPX3PFPX4FPX1FPX2FPX3FPX4
L58.8347.5438.6478.888.5961.1761.236.32
SL2.2524.942.293.282.035.6415.119.22
AG24.484.7732.687.9405.041.8120.37
SAG12.6821.219.886.937.6110.0318.914.18
SG0000015.2800.33
G1.761.566.513.041.762.833.049.57
Total10010010099.9999.9999.9910099.99
Table 10. Grain size distribution for the lithologies.
Grain Size (µm)Rock Types
P-FPXFPX
PFPX1PFPX2PFPX3PFPX4FPX1FPX2FPX3FPX4
>311.84.313.96.43.73.53.79.9
6–93716.634.932.236.123.69.822.4
9–1024.131.436.717.117.228.59.938.4
10–122730.114.521.915.35.721.215.2
12–15-17.6-6.927.78.726.514
15–18-----12.27.9-
18–21---15.4-17.88.3-
21–24 --12.6-
Total100100100100100100100100
Over 3 (µm)88.195.786.193.596.396.596.290
Table 11. PGM recovery (%) of rock types (Conditions: SIBX 120 g/t, Sendep 30E 300 g/t, Senfroth 522 80 g/t, 80%–75 um).
Flotation Time (min)Cumulative Recovery (%)
P-FPXFPX
P-FPX1P-FPX2P-FPX3P-FPX4FPX1FPX2FPX3FPX4
153.4245.4148.3849.6462.5659.8461.9138.44
375.7865.6167.5568.7776.3376.0579.4171.44
787.7380.3076.5280.3183.1182.7284.1784.89
2094.3787.9083.2588.3188.9388.4086.5590.35
Table 12. Concentrate grade (g/t of PGM) of rock types (Conditions: SIBX 120 g/t, Sendep 30E 300 g/t, Senfroth 522 80 g/t, 80%–75 um).
Flotation Time (min)P-FPXFPX
P-FPX1P-FPX2P-FPX3P-FPX4FPX1FPX2FPX3FPX4
139.8017.0020.1741.3037.3060.60116.5059.00
328.7311.5313.9925.6921.6038.6680.8342.21
722.217.9910.5215.8214.1226.1060.1228.15
2014.515.717.9711.036.9816.1343.9018.78
Table 13. Rock type, head grade, mass pull, and combined recovery.
Rock TypeHead Grade Mass Pull (%)Recovery (%)Combined Concentrate Grade (g/t)
3PGM + AuCuNiS
PFPX130.120.290.8319.5394.3714.51
PFPX21.160.0590.120.1916.0387.905.71
PFPX31.40.110.180.613.4983.257.97
PFPX44.010.140.270.6129.4888.3111.03
FPX11.490.050.110.1912.1488.936.98
FPX24.150.190.371.148.9488.4016.13
FPX32.670.150.261.2112.2586.5543.9
FPX42.540.110.240.3514.1990.3518.78
NB: 3PGM + Au refers to platinum, palladium, rhodium, and gold.
Table 14. Derived laboratory floatability index.
Rock TypesMode of OccurrenceLiberation
Index
Particle Size,
% (>3 μm)
Kelsall Floatability Index
L + SLAG + SAGSG + G
PFPX161.0837.161.760.98288.1Medium-Floating
PFPX272.4825.971.560.98495.7Slow-Floating
PFPX340.9352.566.510.93586.1Medium-Floating
PFPX482.0814.873.040.97093.5Fast-Floating
FPX190.627.611.760.98296.3Fast-Floating
FPX266.8115.0718.110.81996.5Slow-Floating
FPX376.2920.673.040.97096.2Slow-Floating
FPX455.5434.559.90.90190.0Medium-Floating
Table 15. Flotation kinetics parameters of P-FPX rock types.
LithologyRock
Type
Mode of
Occurrence Classes
Mode of
Occurrences (%)
Flotation Kinetic Rate Constant (min−1)Slow Flotation Fraction
KfKsθ
Pegmatoidal Feldspathic PyroxeniteP-FPX1L58.831.48710.09270.2922
SL2.255.09000.07110.3713
SG0.001.04840.04670.7800
AG24.480.1971−0.26910.1754
SAG12.680.2169−0.2281−0.2741
G1.760.1417−0.2512−0.0720
P-FPX2L47.542.43150.005612.3985
SL24.940.35350.01856.3820
SG0.000.00480.274826.8896
AG4.770.29560.86810.0000
SAG21.200.01790.004317.9415
G1.560.02380.00000.0000
P-FPX3L38.640.06440.06440.1055
SL2.292.74900.28000.1000
SG0.000.28000.28000.1000
AG32.682.480918.97500.7800
SAG19.881.36831.5835−1.0061
G6.5118.08928.67121.3154
P-FPX4L78.802.38120.02764.5297
SL3.284.84280.422913.2921
SG0.002.64720.298812.2588
AG7.940.08180.007115.1591
SAG6.934060.180.219812.9384
G3.040.08730.01748.4100
Table 16. Flotation kinetics parameters of FPX rock types.
LithologyRock
Type
Mode of
Occurrence Classes
Mode of
Occurrences (%)
Flotation Kinetic Rate Constant (min−1)Slow Flotation Fraction
KfKsθ
Feldspathic PyroxeniteFPX1L88.591.30060.03000.7800
SL2.030.05000.03000.7800
SG0.001.28850.03000.7800
AG0.001.2971952,797.820.7800
SAG7.610.0027−0.23262.4463
G1.761.2926−0.2733−1.0891
FPX2L61.171.54880.28000.1000
SL5.640.05000.03000.7800
SG15.280.08380.03000.7800
AG5.040.0500−0.18590.1869
SAG10.030.04571,293,548.254.9039
G2.83758.070.03017.5524
FPX3L61.151.97240.28000.1128
SL15.140.06810.06810.1028
SG0.000.12440.12440.7800
AG1.810.74620.54620.1553
SAG18.860.79230.08000.1493
G3.0430.4101−0.14130.2323
FPX4L36.320.73690.03000.7800
SL19.220.76460.03000.7800
SG0.330.26120.03000.7800
AG20.370.18910.02250.7800
SAG14.189514.910.768919.6074
G9.570.00490.88192.7938
Table 17. Kinetic parameters of the P-FPX rock types.
Kinetics ParametersRock Types
P-FPX1P-FPX2P-FPX3P-FPX4
Fraction of Flotation Componentsf (Fast)0.80250.64880.70910.6791
s (Slow)0.19750.35120.29090.3209
Flotation Rate ConstantKf (Fast)1.09861.13521.18491.2929
Ks (Slow)0.10000.09280.04550.0865
Error14.869315.84685.21277.4745
Floatability Index (Lab) SlowSlowSlowFast
Table 18. Kinetics parameters of the FPX rock types.
Kinetics ParametersRock Types
FPX1FPX2FPX3FPX4
Fraction of Flotation Componentsf (Fast)0.77320.77880.84310.6912
s (Slow)0.22680.22120.15690.3088
Flotation Rate ConstantKf (Fast)1.77721.56051.44981.0000
(min−1)Ks (Slow)0.06990.06290.03080.1000
Error3.01582.71812.52757.2816
Floatability Index (Lab) FastSlowSlowSlow
Table 19. Goodness of fit for all rock types.
PGM Rock Types
P-FPX1P-FPX2P-FPX3P-FPX4FPX1FPX2FPX3FPX4
Floatability indexMediumSlowMediumFastFastSlowSlowMedium
Goodness of fit0.970.990.991.001.001.001.000.97
Disclaimer/Publisher’s Note: The statements, opinions and data contained in all publications are solely those of the individual author(s) and contributor(s) and not of MDPI and/or the editor(s). MDPI and/or the editor(s) disclaim responsibility for any injury to people or property resulting from any ideas, methods, instructions or products referred to in the content.

