Article

Controlling Parameters of Acoustic Velocity in Organic-Rich Mudstones (Vaca Muerta Formation, Argentina)

by
Mustafa Kamil Yuksek
1,2,
Gregor P. Eberli
2,
Donald F. McNeill
2 and
Ralf J. Weger
2,*
1
Turkish Petroleum Corporation (TPAO), Cankaya, Ankara 06510, Turkey
2
CSL—Center for Carbonate Research, University of Miami, Miami, FL 33149, USA
*
Author to whom correspondence should be addressed.
Minerals 2025, 15(7), 694; https://doi.org/10.3390/min15070694
Submission received: 18 May 2025 / Revised: 25 June 2025 / Accepted: 26 June 2025 / Published: 28 June 2025
(This article belongs to the Section Mineral Exploration Methods and Applications)

Abstract

We conducted ultrasonic (1-MHz) laboratory measurements on 210 samples from the Vaca Muerta Formation (Neuquén Basin, Argentina) to determine the factors influencing acoustic velocities in siliciclastic–carbonate mudstone. We quantitatively assessed the calcium carbonate and total organic carbon (TOC) content and qualitatively identified the quartz and clay mineralogy. For brine-saturated samples, P-wave velocities ranged from 2826 to 6816 m/s, S-wave velocities ranged from 1474 to 3643 m/s, and porosity values ranged from 0.01 to 19.4%. Carbonate content percentages, found to be critically important, vary widely from 0.08 to 98.0%, while TOC ranged from 0 to 5.3%. Velocity was primarily controlled by carbonate content and, to a lesser extent, by the non-carbonate mineralogy of the rock (e.g., quartz, clay minerals). TOC content had little effect on the acoustic properties. Due to the low porosity of most samples, mineral composition had a stronger influence on velocity than porosity or pore geometry. The Vp/Vs ratio of dry samples ranged from 1.38 to 1.97 and decreased as porosity increased. In saturated samples, the Vp/Vs ratio ranged from 1.46 to 2.06 and appeared independent of porosity. A clear distinction between carbonate and mixed lithofacies under both saturated and dry conditions was observed in all samples.

1. Introduction

Unconventional reservoirs consist of highly diverse, mixed, multi-mineral rock combinations such as calcareous, argillaceous, siliceous, and mixed shales, which frequently display both significant vertical and lateral variation [1]. In addition to their intrinsic anisotropic properties due to lamination at various scales, many unconventional reservoir rocks exhibit large spatial heterogeneity, causing property variations in all directions [2]. As a result, most unconventional reservoir rocks display complex elastic properties. Understanding such highly variable rock properties is crucial for the subsurface characterization of both conventional and unconventional reservoirs. With the aim of reservoir characterization, researchers often utilize large-scale seismic data and well-log measurements and their correlations to understand the properties of the reservoir rock, but laboratory experiments are essential to validate large-scale investigations through a combination of rock physics theories and observable hand-sample description and analysis.
Experiments by Wyllie et al. [3,4,5] estimated the average velocity of rocks by separating the matrix velocity from the pore fluid velocity, which resulted in the Time Average Equation. Raymer et al. [6] put forward an alternative equation based on well-log data. Both approaches are log-derived and require knowledge of accurate mineralogical composition. The relationship between the compressional velocity and bulk density was first presented by Pickett [7] and later by Gardner et al. [8], both of whom highlighted the importance of the VP/VS ratio in characterizing rock properties while also assuming that adequate knowledge of fractional mineral composition is a prerequisite. Sayers and Dasgupta [1] presented a predictive rock physics model for unconventional shale reservoirs based on an extended Maxwell scheme that can be used as a framework for the characterization of the Vaca Muerta Formation samples used in this study.
Before the emergence of unconventional reservoirs, most petrophysical research activities focused on either siliciclastic or carbonate rock types, with less emphasis on mixed siliciclastic–carbonate systems. The Vaca Muerta Formation is a succession of clastic and carbonate-rich mudstones; it has a thickness of up to 700 m, with a high total organic carbon (TOC) content that makes it the largest unconventional reservoir in South America and among the largest in the world [9]. TOC and carbonate content vary laterally and up-section throughout the basin. Investigations to relate the TOC content to the impedance signals in seismic data have been promising [10]. However, the controlling effect of the variable mineralogy and TOC on the acoustic behavior has not been assessed in detail. The few existing previous studies have examined the relationship between elastic properties, porosity, and mineralogical content on log signatures and/or seismic data [2,11,12,13,14,15]. Laboratory experimental analyses of Vaca Muerta core samples, such as those presented in this study, are few and far between [12,16].
In this paper, we particularly strive to (1) establish an acoustic properties characterization, (2) expand the understanding of multi-mineralogical effects on the ultrasonic velocities, and (3) investigate the fluid effects on the mixed siliciclastic–carbonate mudstone from the Upper Jurassic to Lower Cretaceous (Tithonian—Valanginian) Vaca Muerta Formation in the Neuquén Basin in Argentina. To achieve these objectives, the acoustic properties are correlated with the carbonate content, total organic carbon (TOC), and mineralogical composition of the rock to identify the correlative parameters that might control acoustic velocities in the mixed carbonate–siliciclastic lithologies.
The equations proposed by the authors mentioned above are widely used to characterize the properties of rocks for exploration and production purposes. However, these equations can commonly either over- or under-estimate velocities. In carbonates, variations in the pore types can drastically modify the velocity at any given porosity [17,18].
One of the reasons for the shortcoming of equations that relate these variables is that the velocity is not only related to the porosity but is also dependent on the pore geometry, mineralogy, pore structure, cementation, confining pressure, and pore fluid composition. Sediment mineralogy influences the acoustic properties [17,18,19,20]. These equations are all independent of the multi-mineral composition of lithology and do not fully capture the variations of acoustic velocities at a given porosity, particularly in the mixed carbonate-siliciclastic systems [19].
This research reveals the following: (1) the velocity–porosity relationship of mixed siliciclastic–carbonate mudstones from the Vaca Muerta Formation under fully saturated and unsaturated conditions; (2) how carbonate content, non-carbonate fractions (clay minerals and other silicates), and TOC content affect the acoustic velocities in the Vaca Muerta Formation; and (3) the behavior of the acoustic velocities in the Vaca Muerta Formation at different effective pressures (EP).
The results of this research can be used to calibrate with the rock physics approach to improve the acoustic property estimation and better identification of the ductile and brittle zones of the Vaca Muerta Formation. Also, the outcomes of this research contribute to rock physics studies of the Vaca Muerta Formation and mixed siliciclastic–carbonate unconventional reservoirs.

2. Geologic Setting

The Neuquén Basin is located along the eastern flank of the Andes Mountains in western Argentina and eastern Chile (Figure 1A). The basin has a triangular shape and covers an area of over 120,000 km2 [21]. The Neuquén Basin developed as a retro-arc basin in Mesozoic times and was characterized by three main stages: (1) Late Triassic–Early Jurassic rifting stage, (2) Middle Jurassic–Early Cretaceous back-arc basin stage, and (3) Late Cretaceous–Cenozoic foreland basin stage [22]. The back-arc basin sediments consist of up to 4000 m of strata, and their primary sections are located in the Neuquén Andes to the west and the Neuquén Embayment [22]. The Vaca Muerta Formation (Figure 1B) is a result of the Early Tithonian–Early Valanginian succession of the basin to moderately deep carbonate ramp deposits of a time-transgressive prograding system, which is the main source rock of the Neuquén Basin that covers most of the Neuquén Province [23]. The combination of complex cyclic sea-level oscillations, tectonics, and thermal subsidence dominates the characteristics of Vaca Muerta mudstones [22,24]. Given the thick, continuous, organic-rich volume of the formation, it is a world-class source rock and one of the largest unconventional plays in the world [25,26]. The formation can be subdivided into three main sections, depending on the changes in the lithology and stratigraphic structure. The lower, middle, and upper Vaca Muerta sections represent different depositional environments—from basin to middle carbonate ramp—and they consist of black and dark gray shale, marls, volcanic ash layers, calcite veins, and limestone–mudstone [24,27]. The composition of the units indicates the fore sets and bottom sets of the prograding clinoforms, where the organic-rich mudstone is intercalated by more abundant carbonate-rich intervals and frequent bedding-parallel beefs (calcite veins) [28]. The litho-facies encountered in the measured sections in the Vaca Muerta Formation are described in detail by Rodriguez Blanco et al. [29].

3. Dataset

Mixed carbonate–siliciclastic outcrops are generally more susceptible to weathering than most carbonates or sandstones due to their relatively high clay content. Consequently, significant alterations are often observed at outcrop surfaces. Thus, collecting clean samples for analyses such as carbon and oxygen isotopic composition and total organic content that are representative of the formation is notoriously difficult in organic-rich mudstones. Furthermore, obtaining structurally stable hand samples from outcrop surfaces that are sufficiently large for petrophysical laboratory analysis is nearly impossible. Therefore, all chemical samples used in this study were collected 30–50 cm below the outcrop surface to ensure the acquisition of clean samples that remain unaltered by weathering processes.
We conducted numerous field campaigns in the Vaca Muerta Formation from 2013 to 2022, during which we created a complete reference section (Figure 2A) from over 3000 m of measured geological section. We also collected gamma-ray data and samples for a geochemical analysis at one-meter intervals. For most measured sections, we assessed mineral composition using near-infrared spectroscopy in the field. In the laboratory, we measured total organic content (TOC), carbonate content, and stable isotopes (both organic and inorganic) on over 3857 samples (see Refs. [10,28,29,31,32,33]).
To obtain samples suitable (unweathered, less friable) for the preparation of 1″ (2.54 cm) diameter core plugs, deeper penetration below the outcrop surface was required. We drilled over 100 short cores using a gasoline-motor-driven modified chainsaw with a 3.5″ (8.9 cm) diameter diamond core bit that could penetrate up to 1.5 m below the outcrop surface (Figure 2B–D). All cores were cut into halves, photo-documented, described, scanned using X-ray fluorescence (XRF), sampled for carbonate and organic carbon content, analyzed for organic and inorganic carbon isotopic composition, and used for the extraction of 1″ (2.54 cm) diameter core plugs for petrophysical analysis (Figure 2D).

4. Experimental Setup

We selected two hundred and ten (210) mixed siliciclastic–carbonate mudstone samples, including twelve (12) samples from concretions interbedded in the strata. We aimed to create sample sets of horizontal, vertical, and diagonal plugs from the same stratigraphic bedding planes to form the basis for future anisotropy analyses, but we could only extract a limited number of diagonal plug samples successfully. Due to the fragile nature of clay-rich carbonate–siliciclastic core material, we extracted plugs ranging from 2.54 cm to 5 cm in length from various lithofacies, limited only by the structural integrity of the cores. Plugs were cut and polished on each side to create a flat surface that maximizes the contact area between the sample and transducer. All plugs were dried in an oven for 24 h, and then placed in a desiccator for at least two days to eliminate any remaining moisture. For wet measurements, plugs were submerged in a 35 ppt brine under vacuum for at least 96 h to ensure full saturation of all pores.
Acoustic velocities (compressional and shear) were measured using the NER AutoLab 1000 system (NER, Olcott Drive, VT, USA), which consists of a core holder and a multifunctional pressure vessel that produces confining pressure up to 100 MPa (15,000 psi). Samples were placed in a rubber sleeve to seal them from the confining oil in the pressure vessel. The ultrasonic transmitter and receiver pair with the piezoelectric transducers were placed on the core holder and connected to the ends of the plug sample. The pulse transmission technique developed by Birch [34] uses a transducer that generates one compressional and two independent orthogonal polarized shear waves (VS1 and VS2) centered at 1 MHz frequency. Experimental errors for the velocity measurements are within 3%. Fractional porosity data were collected by acquiring the grain volume using a helium pycnometer instrument [35].
Effective pressure is defined as the difference between confining pressure and corrected pore pressure by the effective stress coefficient (Equation (1)). Many theoretical considerations indicate that the effective stress coefficient (η) is taken between 0≤ η ≤1 and may change according to the pore structure of the rock [36,37,38,39]. Because most mudstones do not have an apparent visible pore structure, we assume η = 1 for simplicity (Equation (2)).
PE = PC − ηPP
PE = PC − PP
where PE is the effective pressure, PC is the confining pressure, and PP is the pore pressure.
It is our goal to obtain acoustic velocity measurements that closely represent the actual reservoir conditions of contemporary hydrocarbon reservoirs in the Neuquén Basin. As reservoirs in the Neuquén Basin are primarily buried between 2000 m and 3000 m, with pore fluids ranging from brine to gas and oil, we designed an experiment utilizing both air and brine-saturated samples. To maintain the same maximum effective pressure for both saturation states, we measured velocity for the brine-saturated samples using a constant pore pressure of 3 MPa and varying confining pressure from 6 MPa to 43 MPa and back ([6,14,24,34,40]), generating an effective pressure (EP) ranging from 3 MPa to 40 MPa and back ([3,11,21,31,41]). For the air-saturated dry measurements, we measured velocity with a constant pore pressure of 1 ATM (0.101325 MPa) and varied the confining pressure between 3 MPa and 40 MPa to align with the effective pressure steps of the brine-saturated samples.
The mineralogical composition was determined qualitatively using the TerraSpec Halo from PANalytical Inc. (Westborough, MA, USA), a full-range VIS–NIR–SWIR spectrometer that measures visible, near-infrared, and short-wave infrared regions (350–2500 nm) to produce mineral identification results through non-destructive contact measurement.
The carbonate content was assessed by digesting soluble material and subsequently subtracting the weight of insoluble material from the total weight of the sample. The insoluble weight was determined by (1) weighing each beaker and then adding 1 g of finely powdered sample from the cut-off portion of each plug, then (2) adding a 10% HCl solution to each beaker to dissolve all carbonate material from the samples. Once the carbonate was completely dissolved, the samples were washed five times using deionized (DI) water to remove residual HCl from the insoluble remains. (3) The insoluble part was drained in an oven at 40 °C and weighed. The carbonate content of the samples was accurately assessed by subtracting the weight of the insoluble part from the total weight. The procedure for carbonate digestion is outlined in more detail by Blackwood et al. [42].
Total organic carbon content (TOC) values were measured using a Costech EA ECS 4010 (Costech Analytical Technologies, Inc., Valencia, CA, USA)following the protocol outlined by Tenaglia, Eberli, Weger, Blanco, Sánchez, and Swart [10]. In addition, we estimated the approximate percentage of clays and the approximate percentage of quarts and feldspars by solving the linear system given by:
ρ g = f c a r b × ρ c a r b + f t o c × ρ t o c + f c l a y × ρ c l a y + f q t z × ρ q t z
1 = f c a r b + f t o c + f c l a y + f q t z
where fcarb and ftoc were measured as described above, ρg was calculated from the pycnometer measured volume and measured weight, and ρcarb, ρtoc, ρclay, and ρqtz were assumed to be 2.72 g/cm3, 1.15 g/cm3, 2.35 g/cm3, and 2.65 g/cm3, respectively. Initial difficulties in fitting Equation (3) required lower density values. Since, as explained by Mavko et al. [41], the values for ρcarb and ρqtzy are well understood, we used the values provided by Mavko, Mukerji, and Dvorkin [41]. Consequently, we used slightly lower values for ρtoc and ρclay than those published by Dang [43] for ρtoc and by Osipov [44] for ρclay. The resulting fclay represents the fraction of all combined clays within the sample, and fqtz represents the fraction of both quartz and feldspars combined.
In this paper, we use the term “mudstone” as a general term to represent various fine-grained sedimentary lithologies (e.g., calcareous mudstone, siliceous mudstone, and argillaceous mudstone). Although, technically, all samples are composed of some form of carbonate–siliciclastic mudstone, we distinguish the compositional variations based on calcium carbonate percentage and insoluble minerals (clay and quartz) percentage.

5. Results

An analysis of 107 representative thin sections showed that the plug samples we measured in the Vaca Muerta Formation are primarily fine-grained mixed carbonate–siliciclastic mudstone. Based on carbonate content, the lithologies present consist of three different microporous mudstones: (a) siliciclastic, (b) carbonate, and (c) siliciclastic–carbonate mixed mudstones. The mudstones examined in this study do not exhibit visible pore structures in thin sections cut to approximately 27 µm thickness. As a result, macro pore structures have only a negligible influence on acoustic properties. The more significant factors controlling the acoustic velocities are carbonate content, clay mineralogy, siliciclastic content, grain size, and sedimentary structure (i.e., lamination and bioturbation).

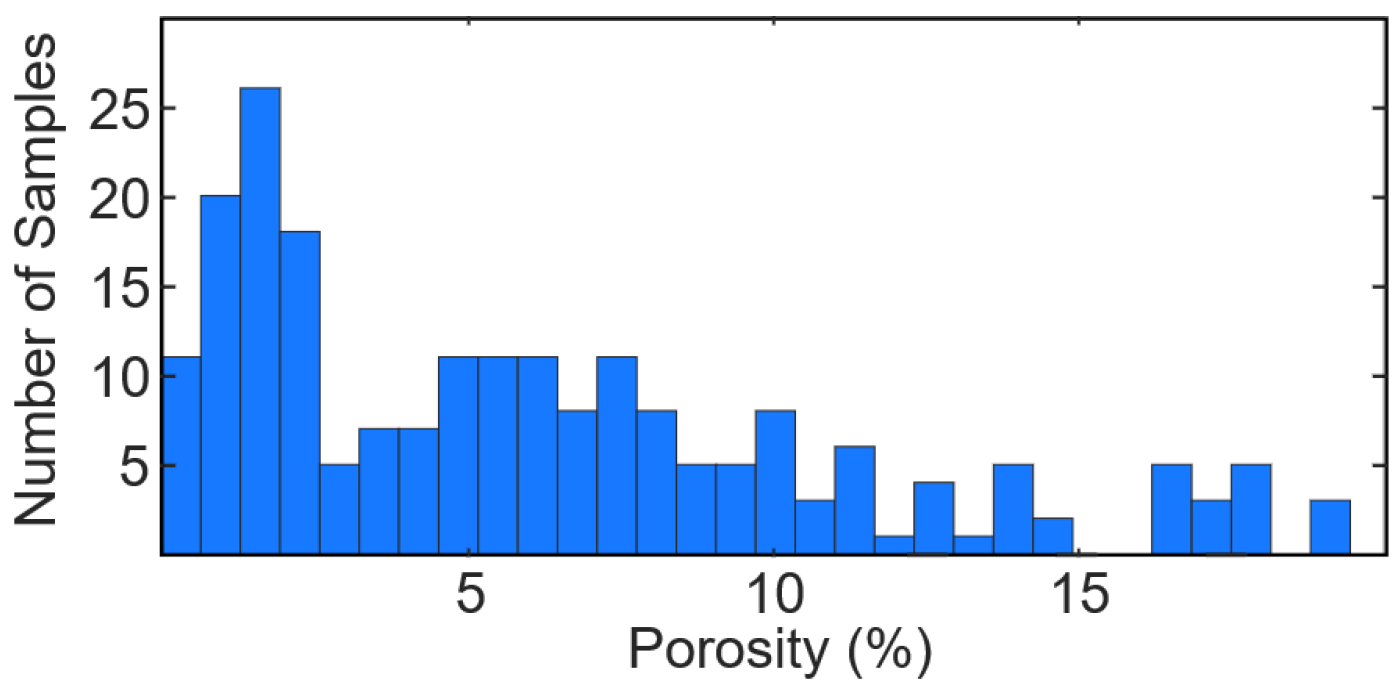
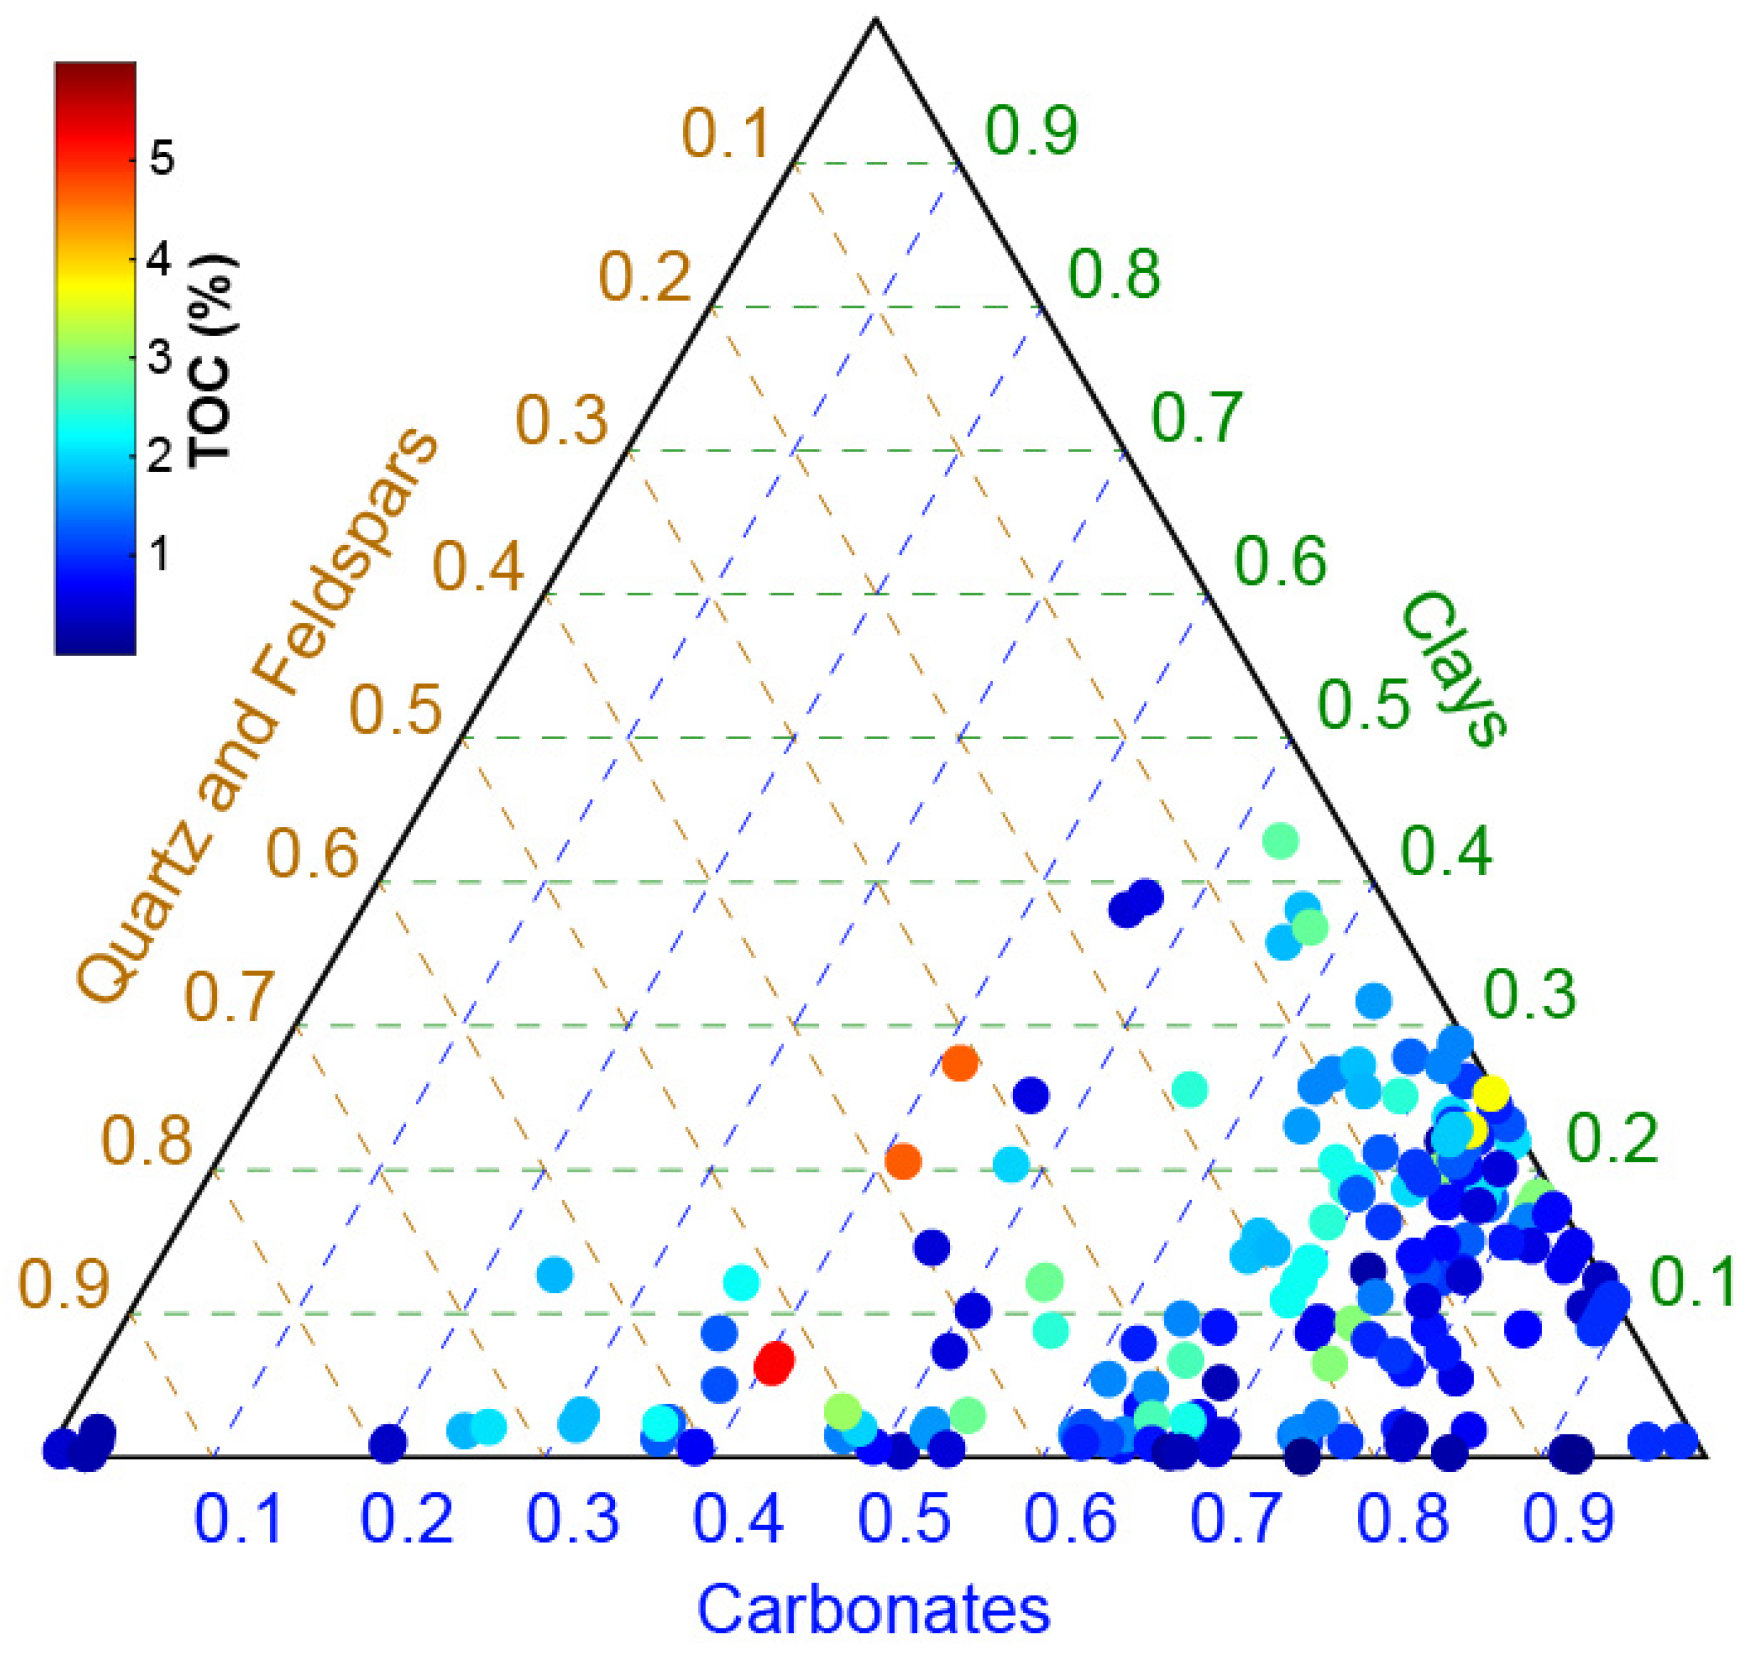
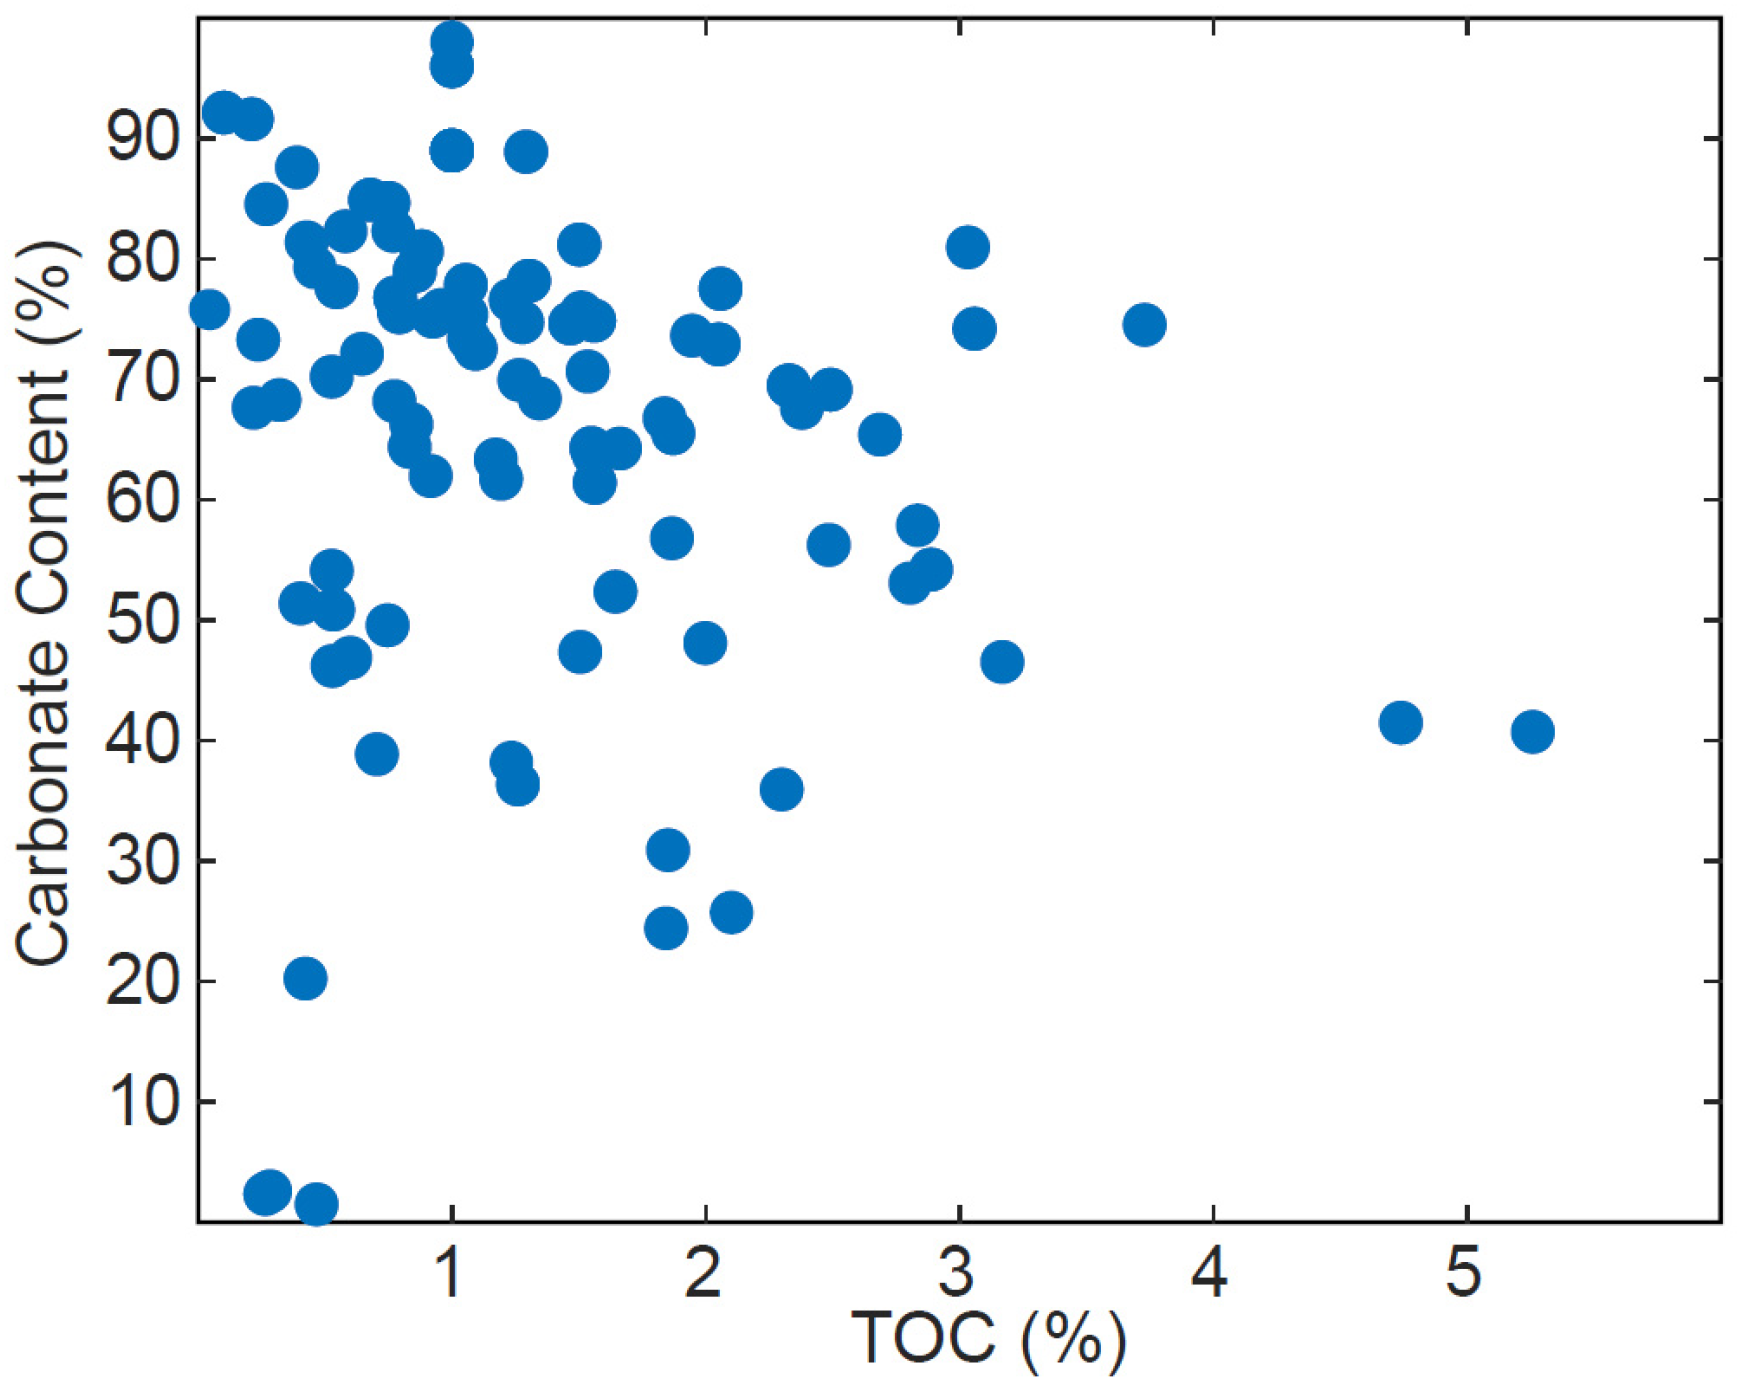
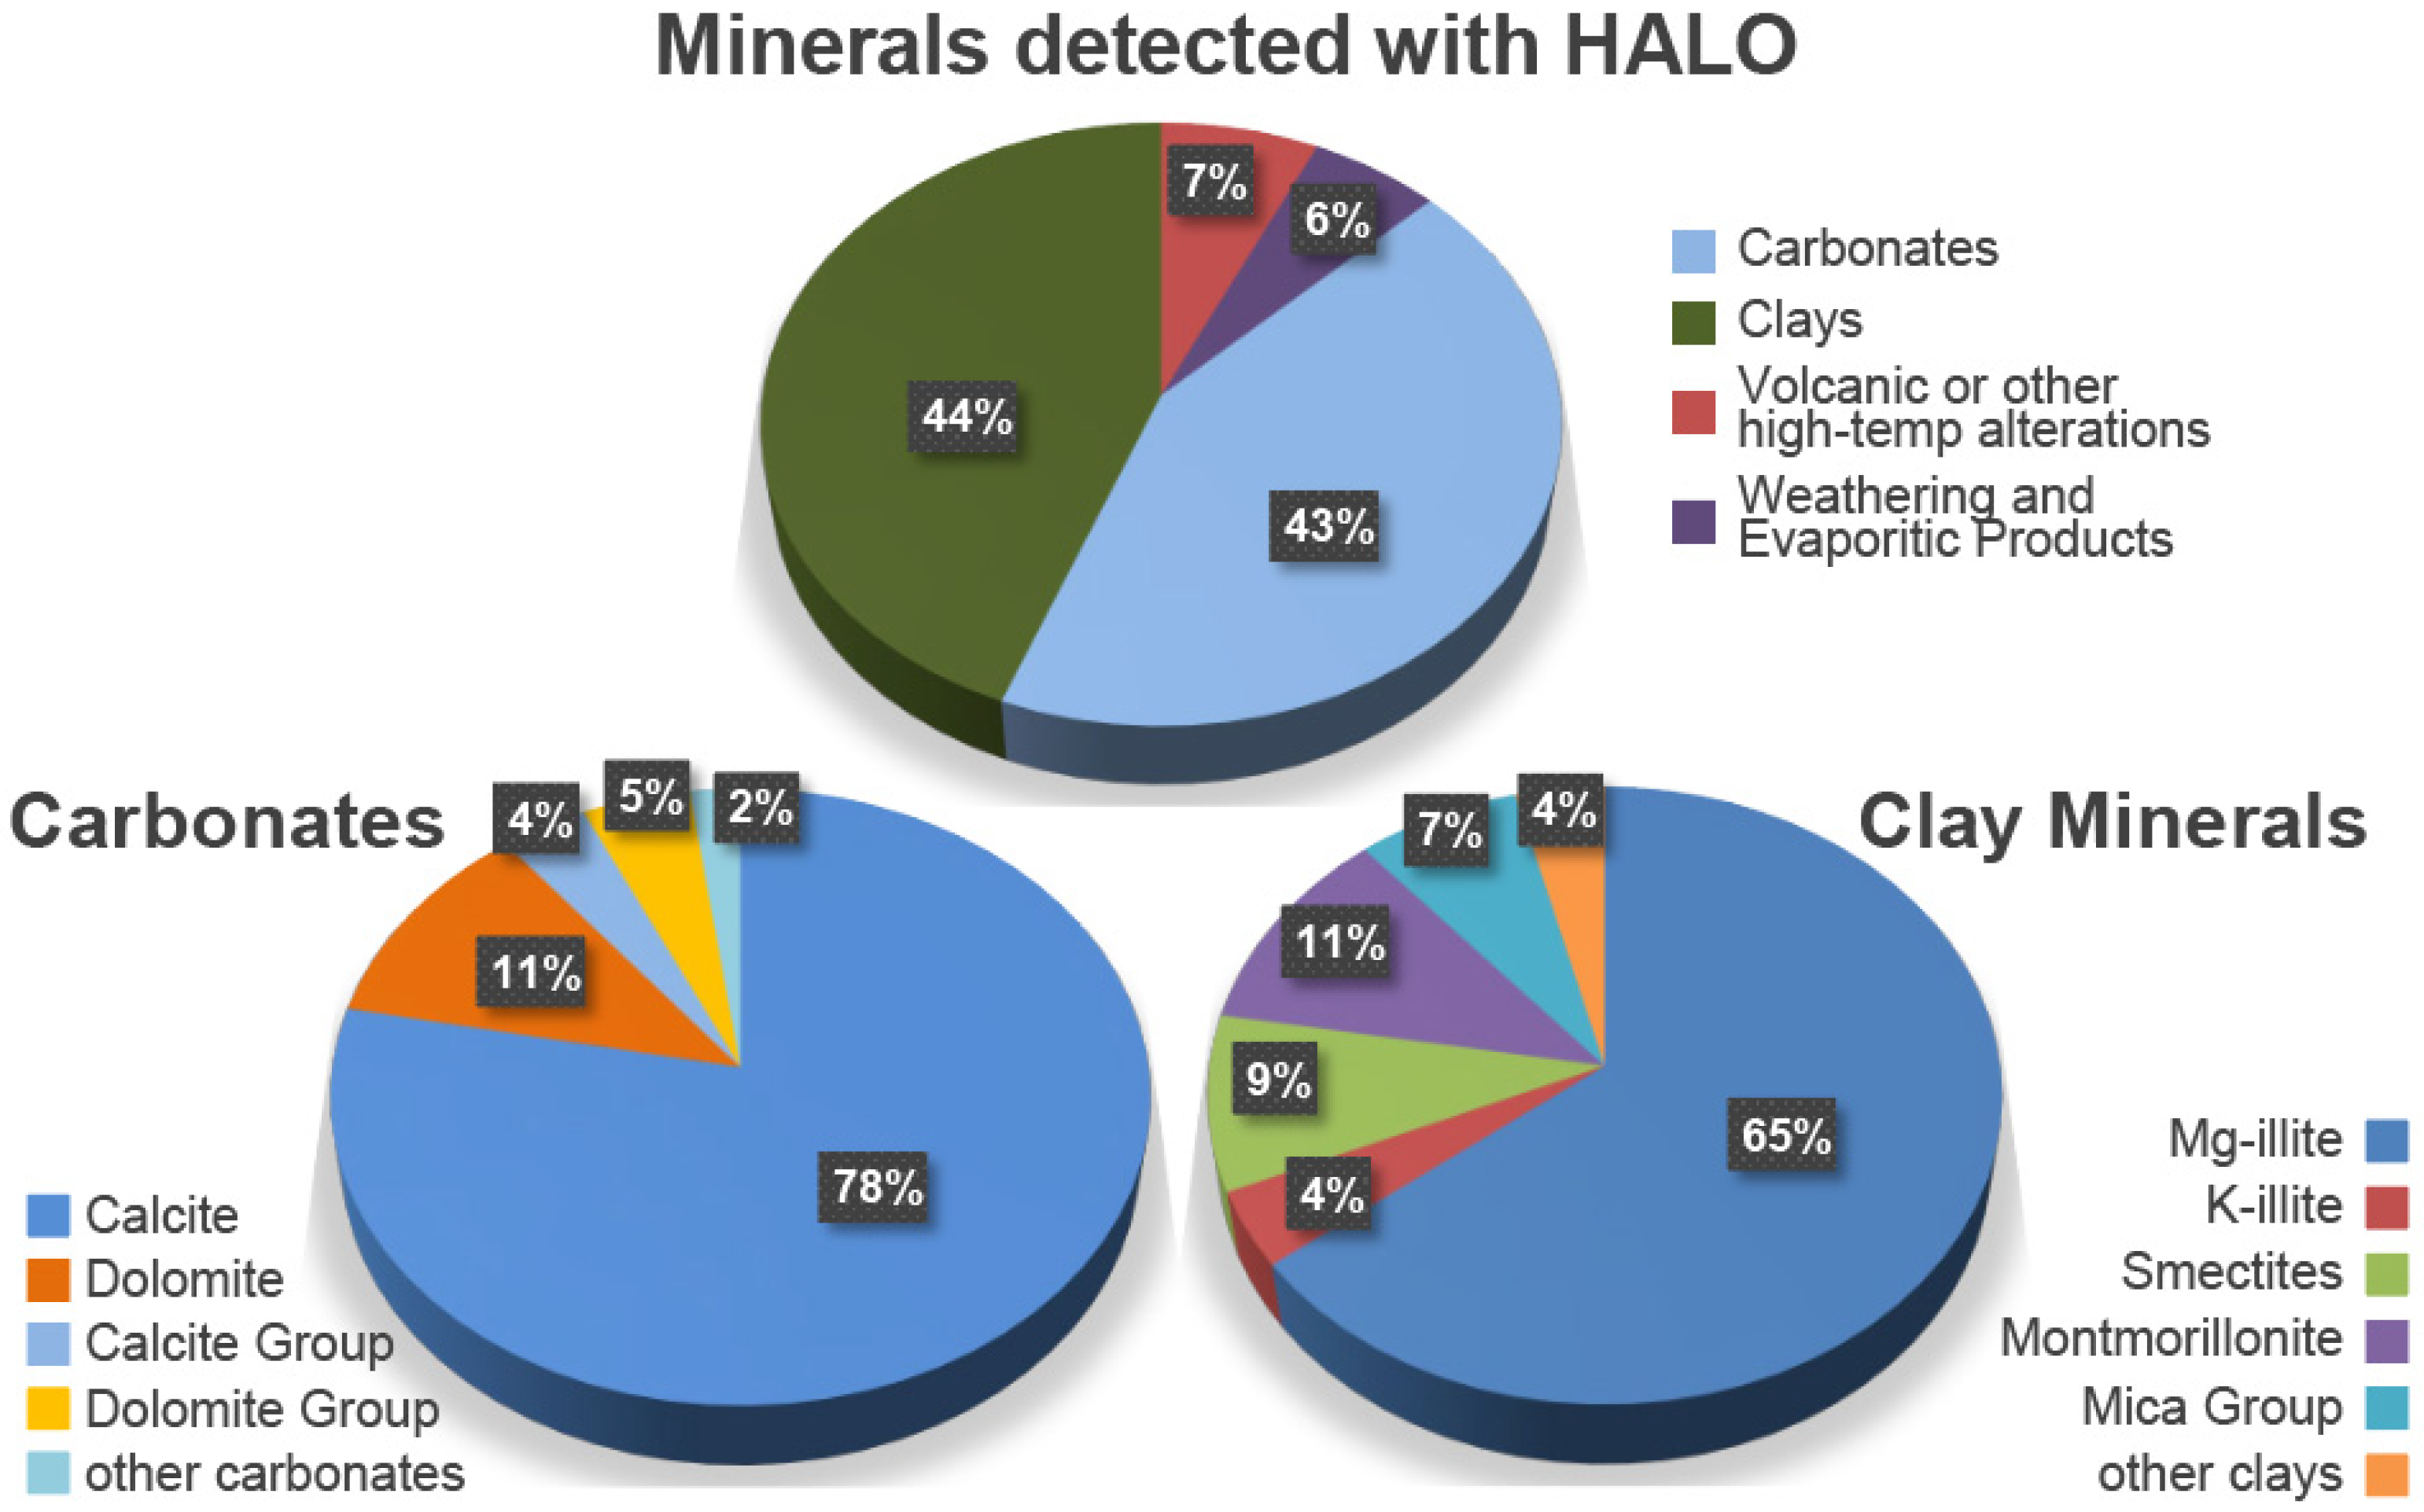
5.1. Porosity, Carbonate, TOC, and Mineral Composition

The porosity values of the measured dataset range from 0.0 to 19.44%, with an average of 6.08%. Only a few samples show a porosity greater than 15% (Figure 3 and Table 1). The carbonate content ranges from 0 to 92.15%, with a mean of 61.8% (Figure 4 and Table 1). The calculated percentages of quartz and feldspar appear to be inversely related to carbonate content, with most samples containing less than 50%, while clay content does not exceed 45% (Figure 4 and Table 1). Higher TOC values are predominantly found in samples with lower carbonate content, mid to low clay content, and a higher fraction of quartz and feldspars. The TOC values of the measured plug samples average 2.5%, with some containing no organic material and others reaching as high as 5.26% (Figure 4 and Table 1). While there is no statistically significant relationship between carbonate content and TOC, samples with higher carbonate content frequently show only mid-range to lower TOC values; it seems that carbonate content might act as a limiting factor for higher TOC values (Figure 5).
As determined by the Halo Mineral Identifier, samples in this study are largely composed of a mixture of carbonates and clays. Evaporitic components and minerals typically described as weathering byproducts (e.g., goethite, phengite, gypsum, or ferrihydrite) were detected in only 6% of the samples. Volcanic materials and other high-temperature alterations (e.g., epidote, chabazite, rectorite, or various minerals from the zeolite group) were found in only 7% of the samples. Clay minerals were detected in 44% of the samples, predominantly exhibiting the presence of Mg-illite (65% of all scans that detected clays). A significant but much smaller probability of occurrence for K-illite, smectite, montmorillonite, and other minerals from the mica group was observed in 4%, 9%, 11%, and 4% of scans, respectively (Figure 6).

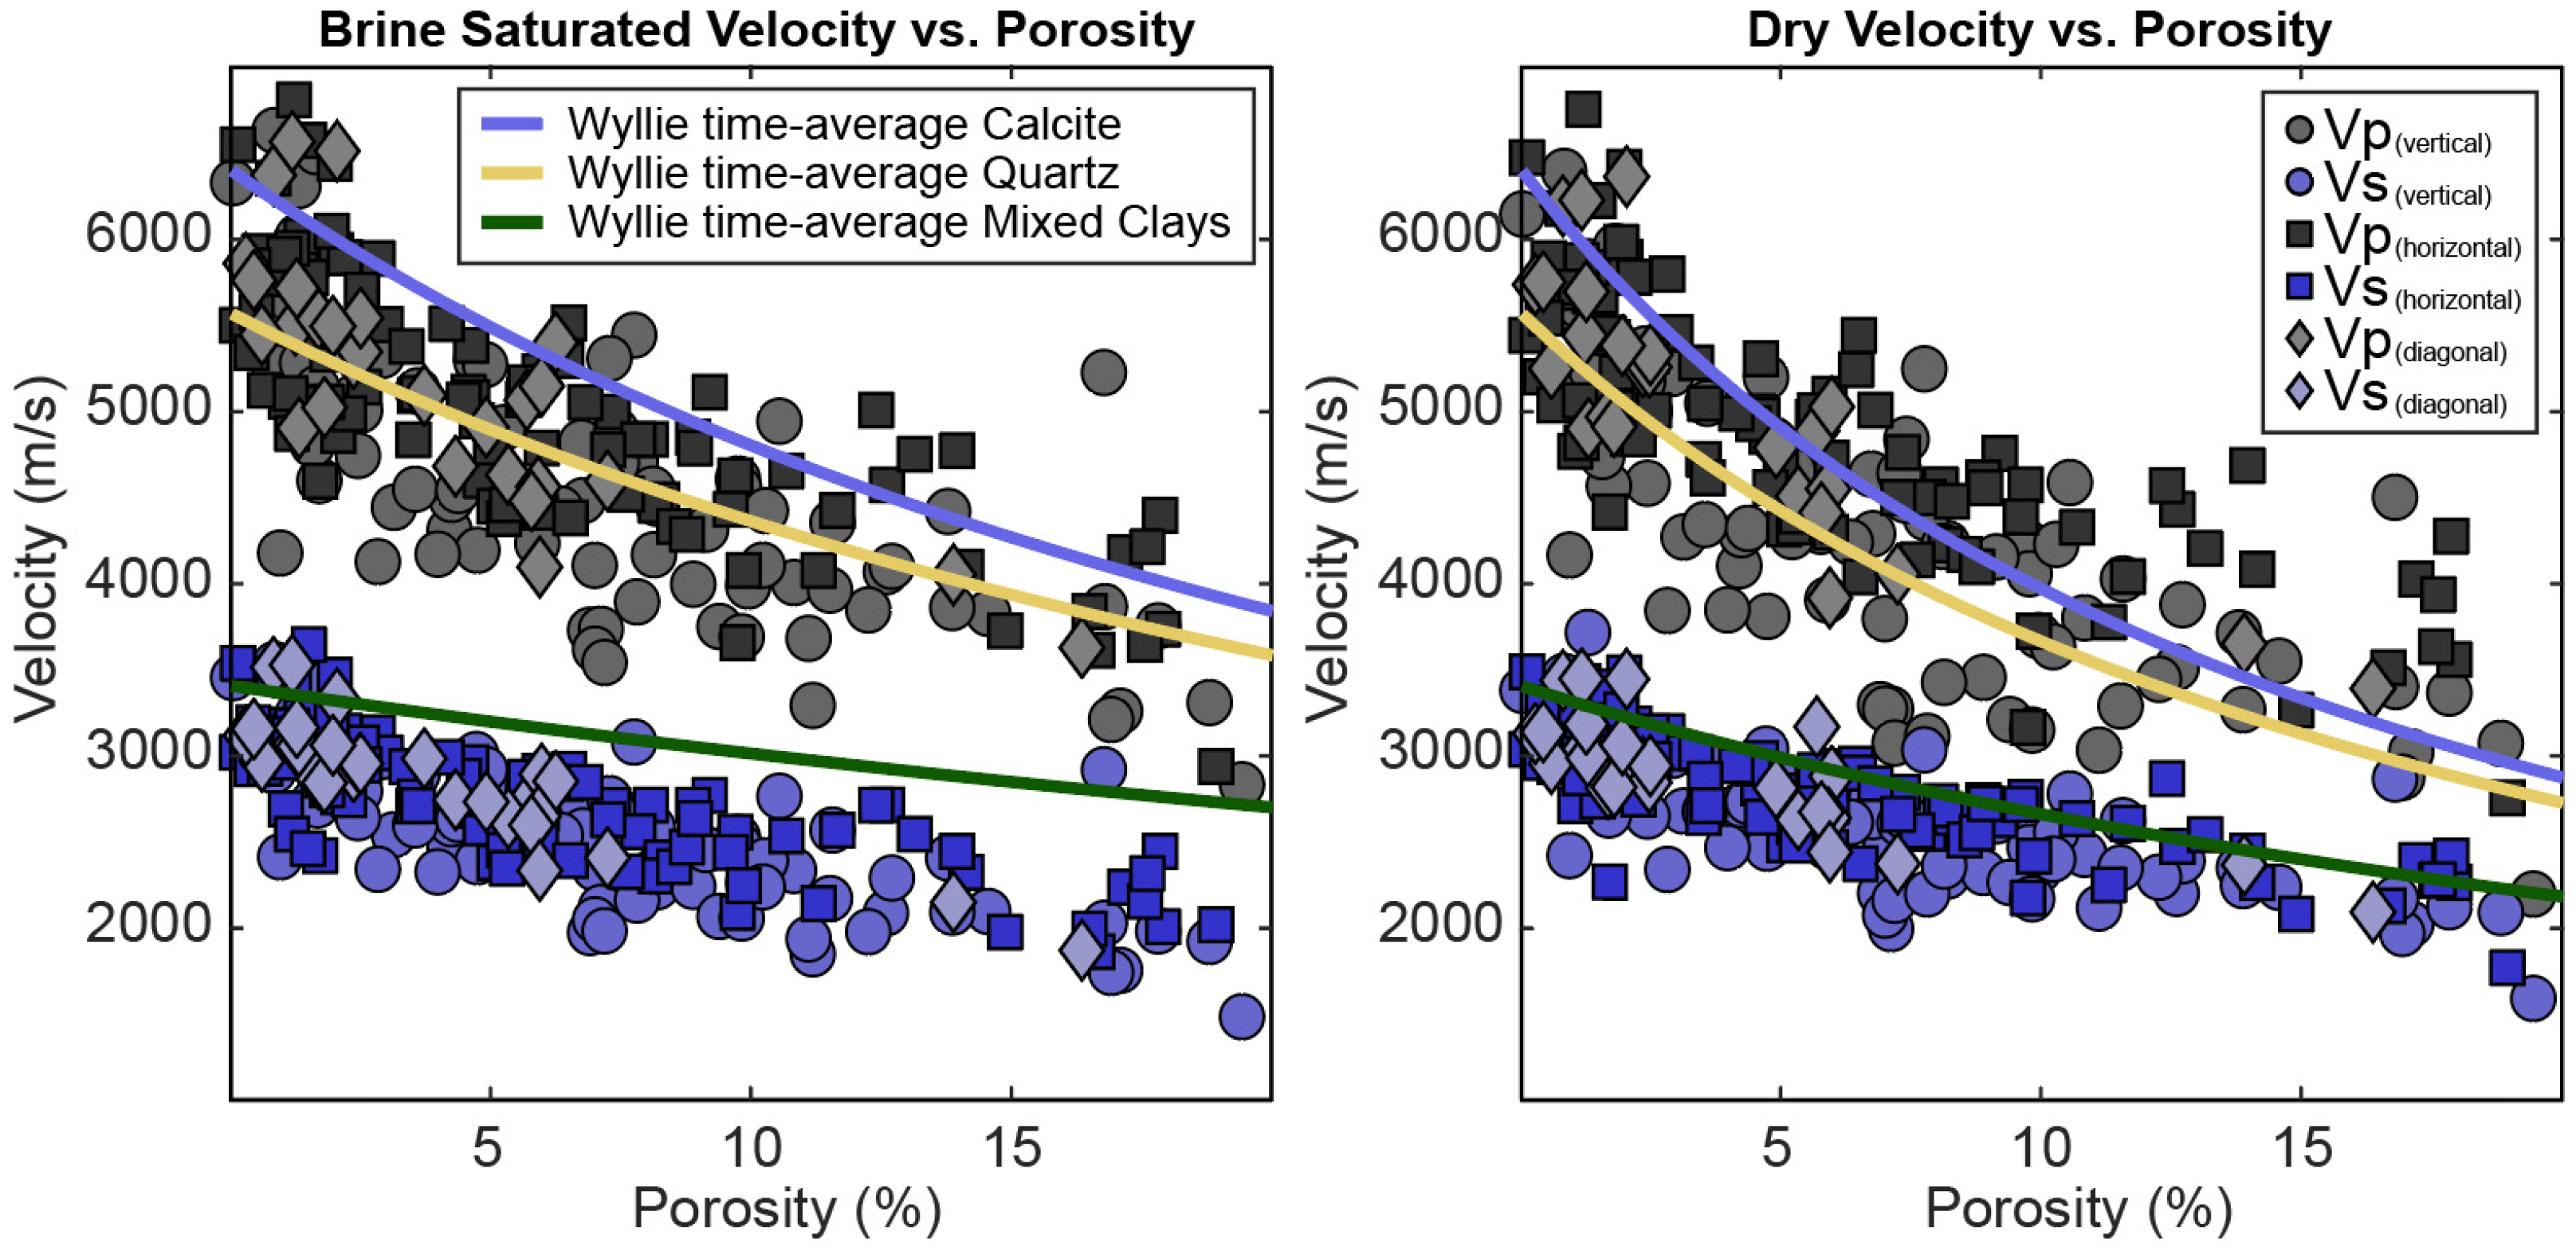
5.2. Compressional and Shear Wave Velocity
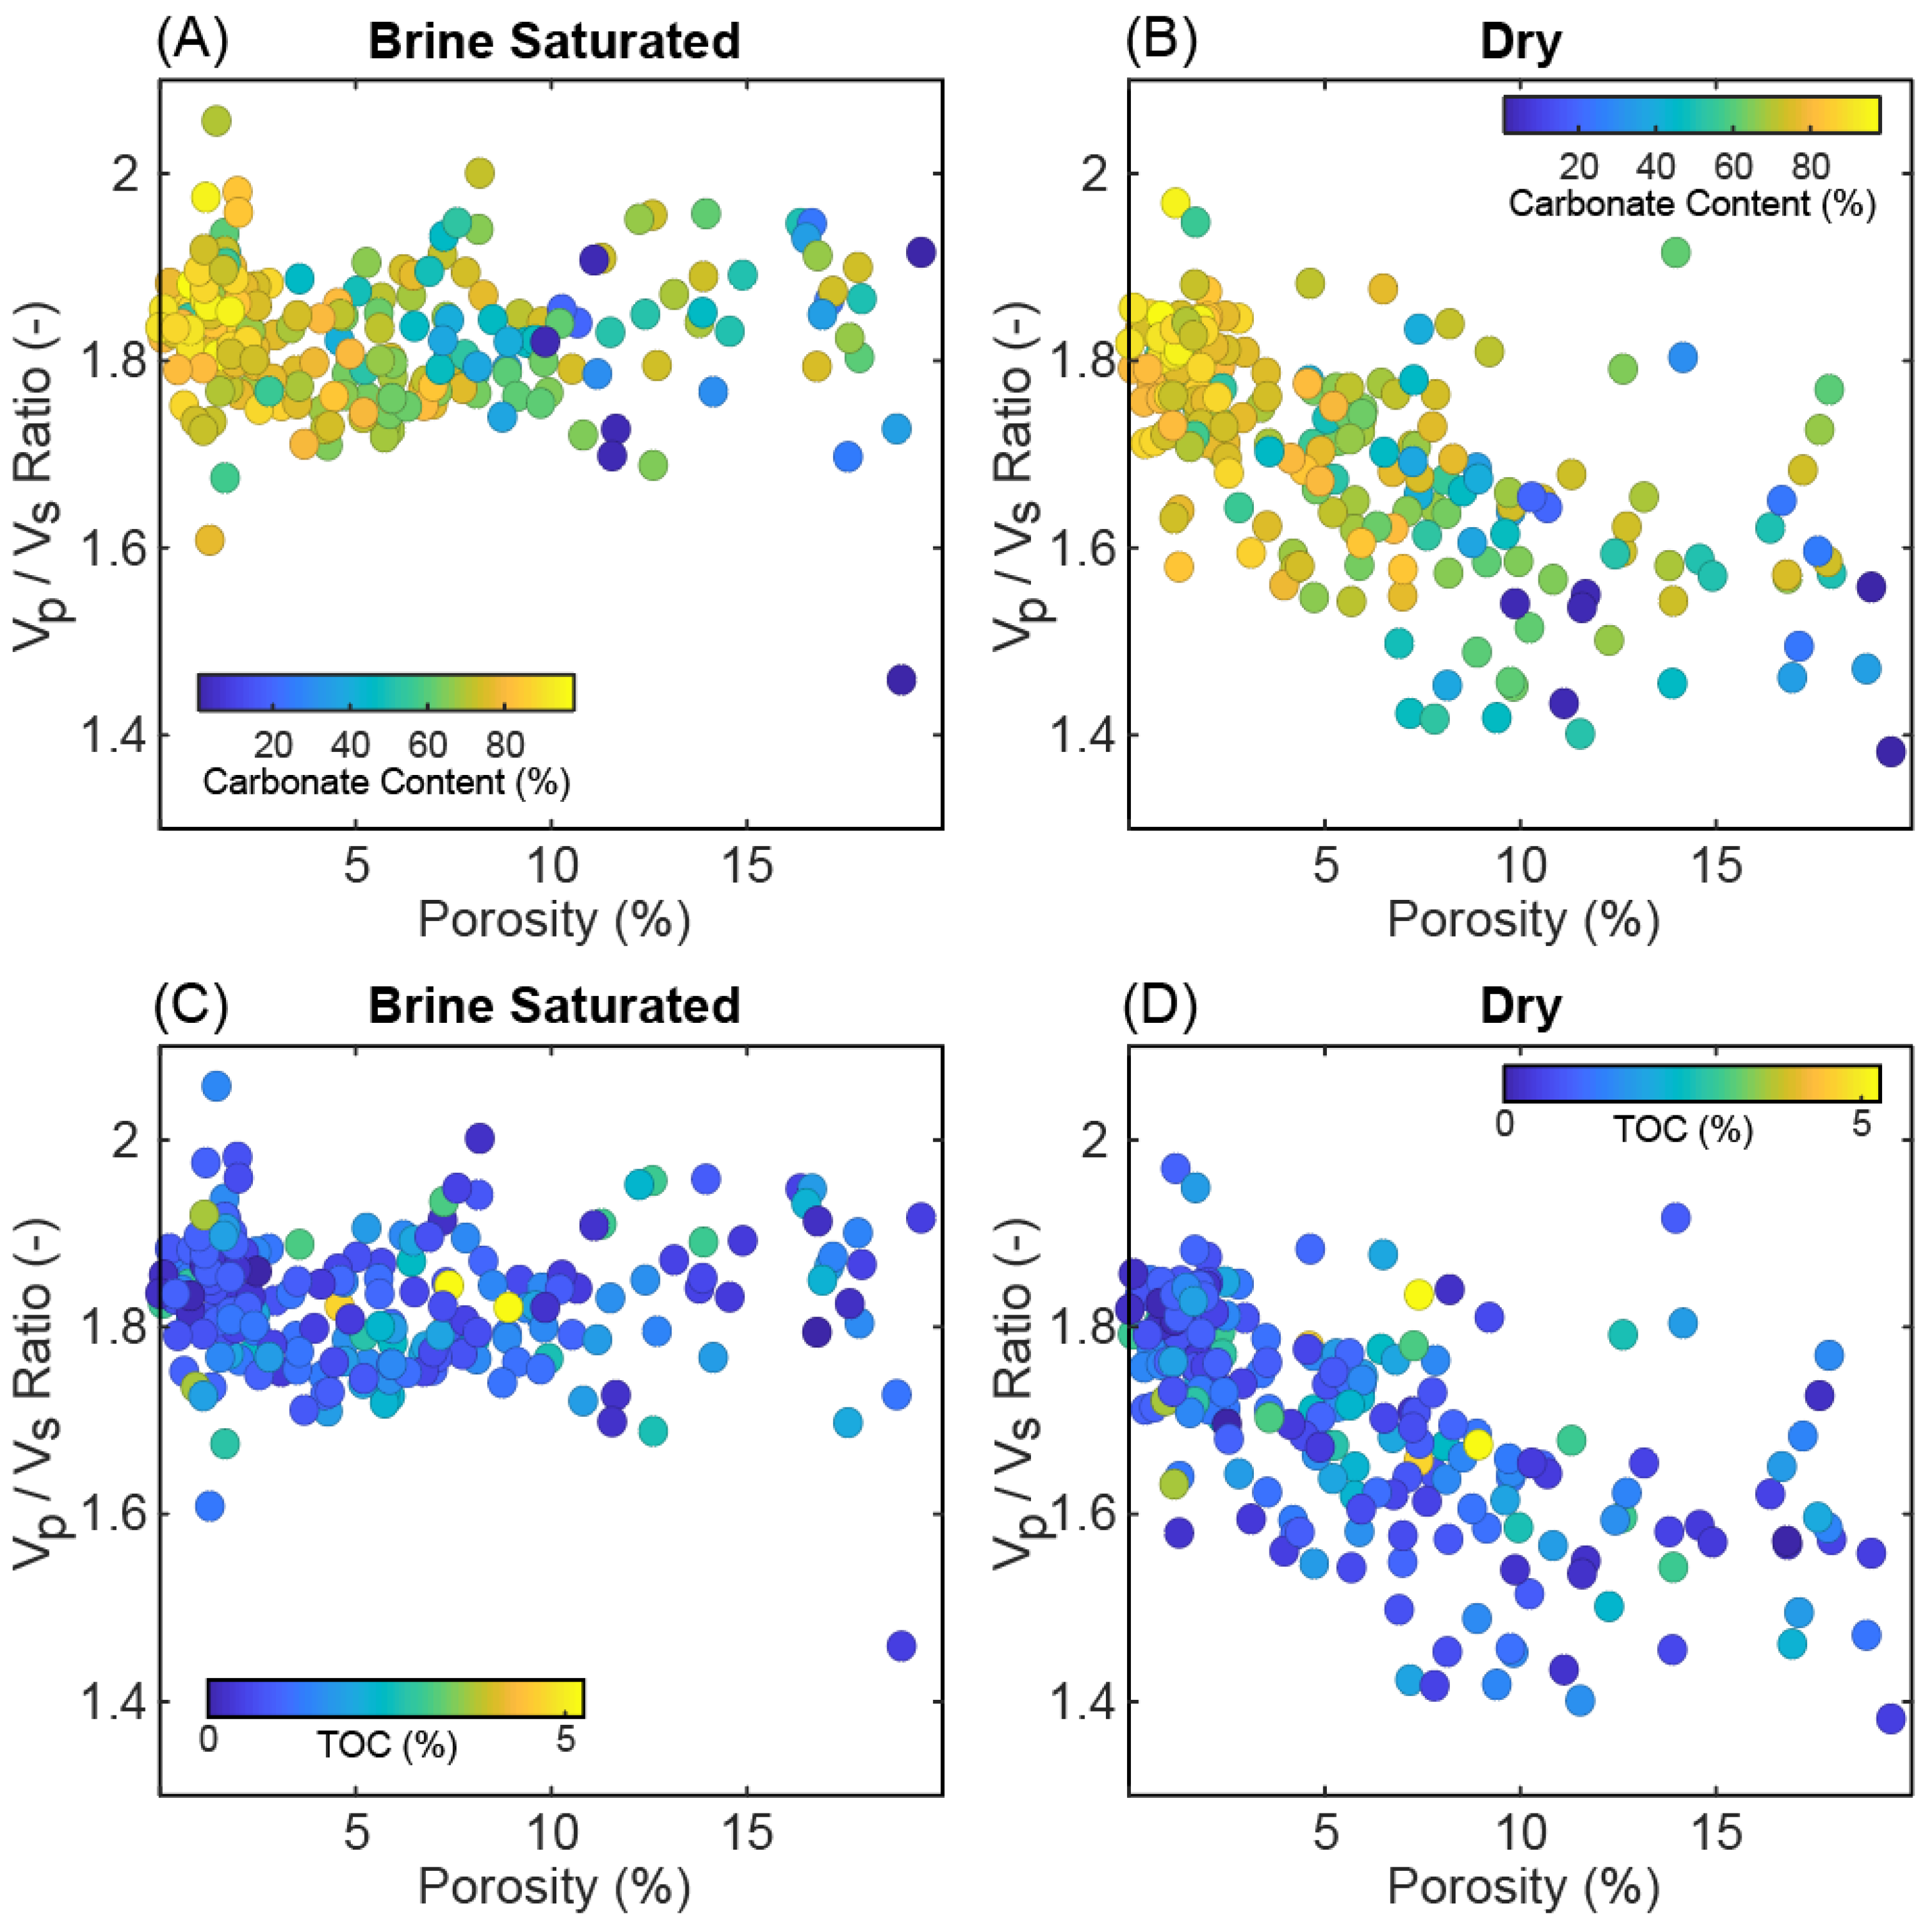
The petrophysical properties of the Vaca Muerta samples are summarized in velocity and velocity–porosity cross plots (Figure 7). Both compressional and shear wave velocities decrease with increasing porosity and display large velocity variations at any given porosity. Compressional velocity values vary from 2198 to 6772 m/s for dry samples (Figure 7 and Table 1), and saturated samples vary from 2826 to 6816 m/s (Figure 7 and Table 1). Velocity measurements from horizontal plugs are substantially higher than those from vertically oriented measurements (Table 1).
For reference and comparison, we use Wyllie’s time average equation [3], defined as
1 V p = 1 φ V p s + φ V p f
where φ is porosity, Vp is the measured P-wave velocity, and Vps and Vpf are the P-wave velocities in the solid and the pore-fluid phases, respectively. Some rearrangement leads to an explicit formulation of Wyllie’s velocity estimate (Vpw).
V p w = 1 φ V p s + φ V p f 1
Although the Wyllie time-average equation is critically limited in mixed-mineral systems due to its foundational assumption of a homogeneous mineral matrix with a single average velocity, we believe it does provide a useful reference framework. In rocks containing multiple minerals, the effective matrix velocity depends on the volumetric proportions and elastic properties of all mineral constituents, not a monolithic average. The equation also fails to account for mineral arrangement or pore geometry. Consequently, it systematically overpredicts porosity in rocks with soft minerals (e.g., clay or kerogen) by underestimating the matrix velocity reduction they cause. However, the Wyllie time-average equation remains pragmatically useful in specific scenarios due to its simplicity and speed. Its linear mixing approach provides a reasonable “first-pass” overview, making it a practical tool for initial log analysis before applying more advanced models. Using solid velocities for calcite, quartz, and mixed clays in Equation (6) leads to the three reference lines in Figure 7.
Shear velocities vary from 1591 to 3719 m/s and 1451 to 3643 m/s for the dry and saturated samples, respectively. Compressional velocities of dry samples are approximately 2%–6% slower than those of saturated samples. Although at first sight contradictory to the Gassmann Equation [40], the shear velocity of dry samples is 2%–5% faster than the saturated samples (Table 1). One possible explanation for this phenomenon is the occurrence of shear weakening in the carbonate phase of the rocks, as described by Baechle et al. [45].
All velocities, both compressional and shear, show an inverse correlation with porosity, where the velocity variation of the saturated samples has about 10% less variability (Table 1). At lower porosities (<5%), we observe compressional velocity variation larger than 2000 m/s and shear velocity variation exceeds 1500 m/s (Figure 7), while at higher porosities (>15%), those ranges decrease to ~1500 m/s and ~1000 m/s for compressional and shear velocity, respectively (Figure 7). Most measured samples show compressional velocities well below what would be predicted from Wyllie’s time-average equation for calcite and well above what would be predicted from Wyllie’s time-average equation for mixed clays, as described by Ref. [46]. Despite the overall low amounts of quartz in most of our samples, the Wyllie time-average equation for quartz appears to be the best fit for the measured compressional velocities of most Vaca Muerta samples.

5.3. VP/VS Ratios

Vp/Vs ratios of Vaca Muerta velocity measurements show distinct patterns for both wet and dry conditions (Figure 8). Saturated Vp/Vs ratios fall between 1.51 and 1.99 with an average value of 1.82, while dry Vp/Vs ratios show a much wider range, falling between 1.32 and 1.99 with an average value of 1.68 (Table 1). Saturated Vp/Vs ratios vary around their mean values and show only a minimal increase with increasing porosity. They appear to be less dependent on porosity than dry Vp/Vs ratios that decrease rather drastically with increasing porosity (Figure 8). Moreover, no clear relationship between the Vp/Vs ratio and either carbonate content or TOC could be determined (Figure 8).

5.4. Pressure Sensitivity of Compressional and Shear Wave Velocity

The pressure sensitivity of compressional and shear waves is critical in understanding the geomechanical properties of the Vaca Muerta Formation. The pressure sensitivity of the measured samples provides valuable insight into the geomechanical behavior of the Vaca Muerta Formation under different subsurface conditions. Understanding how mechanical properties are affected by factors such as pressure changes, mineralogy, and organic content can improve the ability to predict the mechanical behavior of Vaca Muerta Formation reservoirs under varying conditions.
Elevated effective pressure can create increased compaction and enhance grain-to-grain contact by closing micro fractures and thus often increases the velocity of the rock [8]. One way to analyze the pressure sensitivity of the measured samples is to illustrate the effect of changing effective pressure (EP) from 5 to 40 MPa on both compressional and shear velocities under both saturated and dry conditions. For this purpose, we chose three samples that represent horizontal, vertical, and diagonal orientations (Figure 9), and we would like to emphasize the effect of saturation of each of the three representable samples. Regardless of plug orientation and pressure, the measurements of saturated samples tend to show higher compressional velocities and lower or equal shear velocities than measurements of dry samples (Figure 9).
The analysis illustrated in Table 2 defines changes in the velocity that encompass compressional and shear velocities under three (3) pressure steps (5–40 MPa (Table 2A), 5–20 MPa (Table 2B), and 20–40 MPa (Table 2C)) for saturated and fully dry samples. Within each section, the data provide information on the number of samples (n), mean values, and median values for vertical, horizontal, diagonal, and all samples collectively.
For saturated samples, an increase in pressure from 5 to 40 MPa produces a discernible increase in compressional velocity with a mean percentage change of 4.04% and a median of 3.15%. Notably, saturated vertical samples exhibit a slightly higher velocity increment compared to horizontal and diagonal samples, with mean and median values of 4.79% and 3.92%, respectively. Corresponding changes in the mean and median values of horizontal and diagonal samples are 3.54%, 3.50%, and 2.70%, 2.72%, respectively. The same increase in the pressure of dry samples creates an even larger compressional velocity increase, with a mean percentage change of 5.86% and a median of 4.32%. Vertical samples manifest a higher mean (7.29%) and median (5.21%) than horizontal and diagonal samples. The mean values of horizontal and diagonal samples are 4.70% and 5.68%, and the median values are 3.45% and 4.08%, respectively (Table 2A).
Under the same pressure step, the mean and median values of shear velocity for all saturated samples are 5.09% and 3.87%, and the corresponding values for the dry samples are 5.02% and 4.16%. The mean values for saturated vertical, horizontal, and diagonal samples are 5.79%, 4.59%, and 4.70%, and the median values are 4.20%, 3.45%, and 3.37%, respectively. The corresponding mean values for dry samples are 5.48%, 4.56%, and 5.25%, and median values are 4.71%, 3.63%, and 4.18%, respectively (Table 2A).
A change in pressure from 5 to 20 MPa generates an increment in compressional velocity within all saturated samples, with a mean and median value of 2.40% and 1.87%, respectively. These changes in the mean values for vertical, horizontal, and diagonal saturated samples are 2.86%, 2.08%, and 2.10%, while the corresponding median values are 2.25%, 1.59%, and 1.61%, respectively. The same change in pressure for dry samples generates mean values for vertical, horizontal, and diagonal samples at 4.15%, 2.71%, and 3.70%, and the median values are 3.01%, 2.02%, and 2.82%, respectively (Table 2B).
The corresponding pressure steps for the mean and median values of shear velocity for all saturated samples are 3.06% and 2.37%. The mean values of shear velocity for vertical, horizontal, and diagonal samples are 3.32%, 2.84%, and 3.00%, and the median values are 2.64%, 2.19%, and 2.36%. The corresponding mean values for dry samples are 3.27%, 2.87%, and 3.39%, and the median values are 2.80%, 2.26%, and 2.69% (Table 2B).
Velocity changes from 20 to 40 MPA for saturated samples demonstrate an increase in velocity with a mean value of 1.62% and a median of 1.29%. The equivalent increase in the pressure of dry samples creates a higher mean (2.53%) and median (1.75%). The mean values for vertical, horizontal, and diagonal saturated samples are 1.92%, 1.41%, and 1.41%, and the median values are 1.61%, 1.07%, and 0.94%, respectively. The corresponding values for dry samples are 3.25%, 2.07%, and 1.92%, with median values of 2.38%, 1.54%, and 1.50%, respectively (Table 2C).
Under the equivalent pressure step, the mean and median values of shear velocity for all saturated samples are 1.87% and 1.42%, and the corresponding values for the dry samples are 1.97% and 1.50%. The mean values for saturated vertical, horizontal, and diagonal samples are 2.14%, 1.68%, and 1.68%, and the median values are 1.62%, 1.29%, and 1.34%, respectively. The corresponding mean values for dry samples are 2.26%, 1.76%, and 1.82%, and the median values are 1.78%, 1.31%, and 1.23%, respectively (Table 2C).
All samples demonstrate an overall increase in velocity with positive pressure changes. These velocity increases are not uniform. Samples with overall low initial velocity (<4000 m/s) at 5 MPa tend to have a larger velocity increase with each pressure step. Samples with high initial velocities (e.g., >4000 m/s) show the opposite behavior. For most of the samples, once a pressure of ~15–20 MPa is reached, the additional increase in velocity becomes minimal. Although high velocities exist in both vertical and horizontal samples, vertical plugs show lower overall velocities than horizontal samples (Table 1A). Overall, the compressional velocity pressure sensitivities of dry and saturated samples appear to be very similar.
In comparison to compressional velocities, the influence of the pressure on the shear velocity is more pronounced overall. Both vertical and horizontal samples show similar shear velocity increases as a function of pressure (Table 2B). In most of the samples, shear velocity increases gradually but levels off at around 20 MPa.

6. Discussion

The admixture of clay minerals into a rock matrix strongly influences the acoustic velocities of both coarse-grained sandstones and carbonates [47,48], complicating the analysis of unconventional rock formations. Several empirical relationships between acoustic properties, porosity, and clay content have been proposed in the literature by Tosaya and Nur [49], Castagna et al. [50], and Vernik and Nur [51], who all demonstrated that both clay content and mineralogy cause strong velocity variation. The mineral composition of the Vaca Muerta Formation ranges from almost pure carbonate to almost pure siliciclastic rocks (Figure 4) with highly variable amounts of a large variety of different clay minerals (Figure 6).

6.1. Mineralogy

According to Minear [47], increased clay content usually results in a significant decrease in velocity. However, laboratory experiments showed that an admixture of clay to sand-sized grains does not cause a simple one-directional change in velocity [17,52]. Initially, clay fills the pore space, reducing porosity, which causes a velocity increase, but when a critical porosity is reached, clays will be emplaced between grains, reducing coupling and thus reducing the velocity [17,52]. In fine-grained muddy carbonates, small amounts of clay and other insoluble minerals do not have an impact on acoustic velocities, but if the content exceeds a 5% threshold, the velocity is drastically reduced [53]. Fine-grained clastic mudstones with a relatively high porosity usually indicate a velocity decrease as the clay content increases [53,54].
In the Vaca Muerta Formation, a plethora of publications from different outcrops throughout the basin, such as Puerto Curaco, Chocay Melehue, Sierra de la Vaca Muerta, Yesera del Tromen, Picun Leufu, and Loncopue, have documented TOC and mineralogical composition, such as carbonate and clay content [10,29,55,56,57,58,59].
Capelli, Scasso, Cravero, Kietzmann, Vallejo, and Adatte [57] highlighted that the overall mineralogical composition of the measured samples in the studied sections is mostly calcite (58%–88%), clay minerals (13%–23%) (mainly chlorite and illite/smectite), quartz (0%–10%), dolomite (0%–27%), plagioclase (0%–16%), gypsum (0%–5%), and pyrite (0%–4%). TOC values derived from subsurface samples fluctuate from 0 to 12% and sometimes reach up to 16%, with porosities ranging from 0 to 29% [10,55,59,60,61]. As emphasized by Tenaglia, Eberli, Weger, Blanco, Sánchez, and Swart [10], in the measured sections where the plug samples for this study were drilled, no direct correlation was found between TOC and carbonate content, but samples with high carbonate content tended to have lower TOC because of the lack of space for insoluble matter (see Figure 5).
Using a full-range VIS–NIR–SWIR spectrometer that determined both TOC and carbonate content qualitatively, these data are consistent with the above-mentioned previous studies. We found that calcite is the most abundant mineral among our Vaca Muerta samples. Clay minerals were detected in 44% of all measured samples, and carbonate minerals were detected in 43% of all measured samples. In 78% of samples containing carbonate minerals, calcite was present, while only 11% contained dolomite. In 65% of samples that contained clay minerals, Mg-illite was detected, while montmorillonite was present in only 11%. Smectites and other clays were found only in much smaller quantities (Figure 6).
Although there is no direct correlation between the carbonate content and TOC, there is an observable trend of increasing TOC with decreasing carbonate content (see Figure 4). However, unlike the carbonate content porosity relation, there is no trend between TOC and porosity, suggesting that increasing porosity may create space for impurities that are filled by TOC, depending on availability. If there is not enough TOC available, all remaining space is filled with clay minerals (mainly illite, montmorillonite, and smectite).

6.2. Factors Controlling Velocity

A variety of different methods and rock physics frameworks illustrate the various variables affecting acoustic velocity and their importance to unconventional reservoir characterization [1,62,63,64,65]. Avseth and Carcione [66] presented a comprehensive perspective on the acoustic properties of source rocks, where carbonate content is not present. They illustrate the high sensitivity of acoustic velocity to changes in TOC, porosity, clay minerals, and effective stress. One amazingly simple empirical model valid for situations with relatively simple mineralogy, full fluid saturation, and high pressure is Wyllie’s time average equation [3,4,67]. Although our samples from the Vaca Murta Formation are of more complex mineralogical composition, Wyllie’s time average equations for different minerals provided an excellent reference for measured samples.
Most measured velocities from our samples (horizontal, vertical, and diagonal) fall between two porosity–velocity reference lines, the Wyllie time average equation for calcite and the Wyllie time average equation for mixed shales (Figure 7). The Wyllie time average equation for calcite forms an upper boundary and the Wyllie time average equation for mixed shales forms the lower boundary for the acoustic velocity of Vaca Muerta samples.
To analyze the parameters responsible for the variations and the exceptions, we evaluate both carbonate content and TOC as possible parameters influencing compressional velocity. A cross plot of compressional velocity versus porosity with color-coded carbonate percentage indicates that samples with higher carbonate content tend to have higher velocities than samples dominated by siliciclastic minerals (quartz, feldspar) (Figure 10). Variable carbonate content creates an extraordinarily wide range of velocities for the Vaca Muerta mixed siliciclastic–carbonate mudstones. In four samples with 1% porosity, the carbonate content ranges from 74.5% to 98%, and the corresponding velocity ranges from 4176 m/s to 6638 m/s. This 23.5% change in the carbonate content creates a velocity variation of 1562 m/s, giving strong evidence that the amount of carbonate is responsible for the velocity variation at this porosity (Figure 10).
The relationship between total organic carbon (TOC) content and acoustic velocity (primarily P-wave velocity, Vp) in sedimentary rocks, particularly organic-rich shales, is complex but often shows an inverse correlation. Higher TOC is expected to lead to lower acoustic velocities for several reasons. First, organic matter has a significantly lower density (typically 1.0–1.3 g/cm3) compared to common rock-forming minerals (e.g., quartz ~2.65 g/cm3, calcite ~2.72 g/cm3, and clay minerals ~2.3–2.8 g/cm3). Secondly, Organic matter is intrinsically softer and more compressible than most mineral grains, and it has a much lower intrinsic bulk and shear modulus. Increasing the TOC proportionally lowers the overall bulk density (ρ) of the rock. However, acoustic velocity is related to the square root of the ratio of elastic moduli to density. While lower density alone would tend to increase velocity, the effect of organic matter on the elastic moduli (especially bulk modulus) is the opposite. In principle, an overall decrease in acoustic velocity should be expected because of increasing organic content.
To illustrate the relationship between TOC and velocity in our dataset, each sample in the velocity–porosity plot is color-coded to reflect the amount of TOC (Figure 10). A weak correlation exists between TOC content and acoustic velocities. The fact that up to 5% TOC does not significantly influence the acoustic velocity of the Vaca Muerta Formation suggests that a structural framework supporting acoustic wave propagation is provided by sufficient diagenetic calcium carbonate that encapsulates siliciclastic particles, clays, and organic material alike.
Although a detailed analysis of Transverse Isotropy is beyond the scope of this paper, it is worth mentioning that organic-rich shales often exhibit strong laminar anisotropy caused by organic flakes and clay minerals that align parallel to bedding during deposition, compaction, and other diagenetic alteration. As a result, high-TOC shale velocity measured perpendicular to bedding (on vertical plug samples) is typically much lower than velocity measured parallel to bedding (on vertical plug samples) (see example in Figure 9). This is because the wave propagating perpendicularly must travel through soft clay layers with high organic content while the wave propagating parallel to bedding can advance at higher velocities, traveling only in the much faster carbonate or siliciclastic layers. Hence, the degree of velocity reduction due to high TOC is expected to be more pronounced in the direction normal to bedding.

6.3. VP/VS Ratio

The VP/VS ratio is a critical elastic parameter in rock physics used to characterize subsurface properties such as lithology, porosity, and fluid content. It reflects the mechanical behavior of rocks under stress and is highly sensitive to both the solid matrix and pore fluid characteristics. Empirical relationships derived from laboratory data show that the VP/VS ratio can be directly linked to lithology [68]. Pickett [7] associated VP/VS ratios of 1.9 and 1.8 with limestone and dolomite, respectively, while values below 1.7 are commonly observed in sandstones and shales. However, despite these empirical trends, the VP/VS ratio alone is not a fully reliable lithology indicator when derived solely from acoustic data [19,41,48,68,69,70].
Castagna, Batzle, and Eastwood [50] further proposed that in the absence of S-wave velocity data, the VP/VS ratio can be approximated using the “mudrock line” derived from well logs. Within the framework of rock physics templates (RPTs), Ødegaard and Avseth [71,72] showed cross plots of the VP/VS ratio versus acoustic impedance (IP) that are frequently used to discriminate between geological facies such as shales, wet sandstones, gas-bearing sandstones, and cemented sands. Typically, shales exhibit high VP/VS ratios and low IP, while gas-saturated sands are characterized by low VP/VS ratios and reduced impedances.
The VP/VS ratio is also essential in advanced rock physics models like LambdaMuRho (LMR) and FluidMuRho (FMR). In the LMR method, it is linked to Lamé parameters (λ and μ) independently of density, helping to separate rock stiffness (μρ) from fluid effects (λρ) in cross plots [73]. The FMR method [74] builds on this by adding a fluid modulus (f) and the squared dry VP/VS ratio (d), based on Biot–Gassmann theory [40,75]. This allows for better modeling of fluid and dry frame effects in complex reservoirs.
These insights align with contact theory, which predicts a decrease in the dry VP/VS ratio with increasing grain coupling and cementation. Accordingly, the VP/VS ratio serves as both a sensitive fluid indicator and a diagnostic tool to assess rock frame evolution, diagenesis, and mechanical compaction.
In this study, VP/VS ratios measured from Vaca Muerta samples show no clear relationship with mineralogy (Figure 8A and Figure 11). Saturated VP/VS ratios cluster around 1.84 (±0.18) and display a trend of increasing carbonate content with decreasing porosity. Under dry conditions (Figure 8B), there is a positive correlation between carbonate content and the VP/VS ratio. Samples with higher carbonate content (indicated by warmer colors) tend to exhibit lower porosity and higher VP/VS values, suggesting a stiffer and more consolidated rock framework. In contrast, samples with lower carbonate content show greater scatter and generally lower VP/VS ratios, indicating that carbonate minerals, particularly under dry conditions, significantly enhance elastic stiffness.
Under dry conditions (Figure 8B), VP/VS values range more widely and generally decrease with increasing porosity. Although samples with high carbonate content still exhibit relatively high VP/VS values, the trend is less pronounced than in the saturated case. This suggests that fluid saturation increases the elastic contribution of carbonate minerals, making their impact more evident when pores are brine-filled. In a dry state, VP/VS ratio values have no apparent association with carbonate content, yet they exhibit a clear inverse relationship with porosity (Figure 8B). This decrease is particularly evident in the 2.5%–10% porosity range, while values stabilize around ~1.6 for porosities between 10% and 20%.
These findings indicate that as the saturated VP/VS ratio is largely independent of porosity, the dry VP/VS ratio decreases systematically with increasing porosity. Carbonate content contributes to increased stiffness and higher VP/VS values. Altowairqi et al. [76] documented the effects of TOC content on the elastic properties of shales using synthetically manufactured samples. They illustrated how increased TOC content will result in lower compressional velocity and lower VP/VS ratios. However, in Altowairqi’s study, a ~10% change in TOC content, a rather large amount for normal unconventional reservoir conditions, produced only a 0.01 change in the VP/VS ratio. In our plug samples from the Vaca Muerta Formation, the TOC content does not exceed 5% and mostly remains well under 2.5%. As a result, any changes in the VP/VS ratio that variation in TOC content may induce will likely be too small to be noticed within the noise of measurement precision (Figure 8C,D). Thus, TOC content shows no discernible correlation. Porosity emerges as a key controlling factor under both conditions, with higher porosity generally associated with lower VP/VS ratios, regardless of mineralogical or organic content.
Overall, the VP/VS ratio remains a robust tool in both well-log analysis and seismic inversion workflows. When integrated into rock physics-based cross-plotting techniques, it supports lithology discrimination, fluid detection, and reservoir characterization, enhancing the reliability of quantitative interpretations. This study contributes to a better understanding of dry frame properties and fluid influences within the Vaca Muerta Formation. The presented dataset can assist in calibrating well logs, filling measurement gaps, and ultimately reducing exploration risk in unconventional resource development.

6.4. Pressure Sensitivity of Compressional and Shear Velocity

Samples from the Vaca Muerta Formation contain a wide range of mineral compositions, showing a variety of different clay minerals, a wide range of carbonate and TOC content, and a range of other impurities. Comparing the change in velocity as a function of effective pressure for both saturated and dry samples shows less velocity increase with increasing pressure for saturated compressional velocity than for dry compressional velocity (Table 2). We speculate that fluid saturation not only increases the overall stiffness of the bulk framework but also improves individual grain-to-grain contact. For both compressional and shear velocities, a pressure increase from 5 to 20 MPa creates a larger velocity variation than a pressure increase from 20 to 40 MPa. These differences might indicate that at an effective pressure of ~20 MPa, the closure of microfractures has been completed, and samples have reached maximum grain contact at ~30 MPa. Overall, both compressional and shear velocities indicate that all samples exhibit a change in velocity with increasing pressure, but samples with lower velocity at a low pressure tend to have a higher velocity increase resulting from the increase in pressure. In contrast, samples with high velocity at low pressure are less affected by increasing pressure, showing a relatively smaller velocity increase during pressurization.
Raj et al. [77] illustrated that the pressure-sensitivity of Mississippian-age mixed carbonate–siliciclastic rocks from the Meramec formation of the Sooner Trend Anadarko Canadian and Kingfisher (STACK) play in the Anadarko Basin depends on pore shape and size distribution. In samples with similar pore-shape distribution (in the nanopore range) from the same facies, a more rapid increase of VP with increasing confining pressure was observed in samples with a smaller dominant pore-size. They concluded that in the Meramec Formation, the likelihood of pores becoming isolated became higher as their size decreased, and that VP pressure sensitivity was a function of fluid behavior in isolated pores [77].
The high pressure sensitivity observed in the Vaca Muerta samples might be attributed to changes in the rock’s geometry, such as the closure of microfractures or improved grain-to-grain contacts, but it seems likely that the samples’ mineral compositions are at least partially responsible. Most Vaca Muerta samples with a high compressional velocity (>5000 m/s) are composed predominantly of carbonates and exhibit smaller velocity increases during pressurization. In contrast, most of our samples with lower velocity (<5000 m/s) contain higher proportions of clay minerals and show much larger relative velocity increases during pressurization. In other words, the Vaca Muerta Formation exhibits higher pressure sensitivity when the carbonate content is lower. High carbonate content and its inherent high stiffness result in less deformation and a smaller increase in velocity with increasing pressure, whereas high clay content allows for a larger volume reduction during pressurization that results in a more drastic change in the rock’s stiffness and its compressional velocity.

7. Conclusions

Ultrasonic (high-frequency, 1-MHz) P and S-wave velocity measurements on the 210 mixed siliciclastic–carbonate mudrock samples were performed under fully brine-saturated and dry conditions at effective pressure steps from 3 to 40 MPa. Quantitative and qualitative analysis of the mineralogical content of the Vaca Muerta samples and their correlation with the ultrasonic velocity elucidate the controlling parameters on the acoustic velocities of the mixed mudstone lithologies.
The main driver for velocity variation in samples with similar porosity in the Vaca Muerta is carbonate content. The percentage and type of clay minerals and quartz content are the secondary controlling parameters for the velocity variation of the samples with similar carbonate content. Although changes in acoustic velocity in samples with variable TOC content were expected, no quantifiable correlation between TOC content and acoustic velocities was observed; either 5% TOC content is not enough to produce consistent changes, or variations in mineral composition override the effects of TOC in our samples. The importance of layering in the Vaca Muerta Formation is exemplified by the observed substantial differences in acoustic velocity (both compressional and shear) between horizontal and vertical plug samples.
Although no link could be determined between Vp/Vs ratio and mineralogy, there is an observable relationship of a decreasing Vp/Vs ratio with increasing porosity in dry samples of the Vaca Muerta Formation. In contrast, Vp/Vs ratios of saturated samples appear to be porosity-independent. Brine saturation enhances the elastic response of carbonate content, making its influence on elastic properties more distinguishable. High pressure sensitivity has been observed predominantly in samples containing significant clay content. These samples, characterized by lower velocities at low pressure and low carbonate content, exhibit significant velocity increases during pressurization.

8. Declaration of Generative AI in Scientific Writing

During the preparation of this work, the authors used AI-assisted technologies such as Microsoft Copilot and Grammarly as editing tools to help improve grammar, spelling, punctuation, clarity, and style of the written text and to enhance the readability and flow of individual sections. All ideas, hypotheses, and workflows presented are solely the original creation of the authors. The authors reviewed and edited the content as needed and take full responsibility for the content of the publication.

Author Contributions

Conceptualization, R.J.W., M.K.Y. and G.P.E.; methodology, R.J.W., G.P.E. and D.F.M.; validation, R.J.W., M.K.Y. and D.F.M.; formal analysis, R.J.W. and M.K.Y.; investigation, R.J.W. and M.K.Y.; resources, G.P.E. and D.F.M.; data curation, R.J.W. and M.K.Y.; writing—original draft preparation, M.K.Y. and R.J.W.; writing—review and editing, R.J.W., M.K.Y. and G.P.E.; visualization, R.J.W. and M.K.Y.; funding acquisition, G.P.E. All authors have read and agreed to the published version of the manuscript.

Funding

This research was funded by the CSL—Center for Carbonate Research with financial support from its industrial associates.

Data Availability Statement

The raw data supporting the conclusions of this article will be made available by the authors on request.

Acknowledgments

This article constitutes a part of Mustafa Kamil Yuksek’s MSc thesis. The Turkiye Petrolleri Anonim Ortakligi (TPAO) and the Ministry of Education, Republic of Turkey, supported his education at the University of Miami. The Industrial Associates of the CSL—Center for Carbonate Research at the University of Miami provided funds for the thesis research. Mineralogical analysis, in addition to XRD, was performed using an ASD TerraSpec Halo mineral identifier, which was granted by the Malvern Panalytical Spectris plc—Students in Mining & Energy TerraSpec Instrument Program. We thank all members of the CSL—Vaca Muerta Team, Laura E. Rueda, Leticia Rodriguez-Blanco, and Max Tenaglia, for their help during the fieldwork, sample collection, and discussion of the results. We also thank Atila Aydemir for reviewing an earlier version of this paper.

Conflicts of Interest

All authors were employed by the University of Miami when the research was performed. This paper reflects the views of the authors and not those of the University. We declare that the research was conducted in the absence of any commercial or financial relationships that could be construed as potential conflicts of interest.

References

  1. Sayers, C.M.; Dasgupta, S. A predictive anisotropic rock-physics model for estimating elastic rock properties of unconventional shale reservoirs. Lead. Edge 2019, 38, 358–365. [Google Scholar] [CrossRef]
  2. Massaro, A.S.; Espinoza, D.N.; Frydman, M.; Barredo, S.; Cuervo, S. Analyzing a suitable elastic geomechanical model for Vaca Muerta Formation. J. South Am. Earth Sci. 2017, 79, 472–488. [Google Scholar] [CrossRef]
  3. Wyllie, M.; Gregory, A.; Gardner, L. Elastic wave velocities in heterogeneous and porous media. Geophysics 1956, 21, 41–70. [Google Scholar] [CrossRef]
  4. Wyllie, M.; Gregory, A.; Gardner, G. An experimental investigation of factors affecting elastic wave velocities in porous media. Geophysics 1958, 23, 459–493. [Google Scholar] [CrossRef]
  5. Wyllie, M.; Gardner, G.; Gregory, A. Studies of elastic wave attenuation in porous media. Geophysics 1962, 27, 569–589. [Google Scholar] [CrossRef]
  6. Raymer, L.; Hunt, E.; Gardner, J.S. An Improved Sonic Transit Time-to-Porosity Transform. In Proceedings of the SPWLA 21st Annual Logging Symposium, Lafayette, LA, USA, 8–11 July 1980. [Google Scholar]
  7. Pickett, G.R. Acoustic character logs and their applications in formation evaluation. J. Pet. Technol. 1963, 15, 659–667. [Google Scholar] [CrossRef]
  8. Gardner, G.; Gardner, L.; Gregory, A. Formation velocity and density—The diagnostic basics for stratigraphic traps. Geophysics 1974, 39, 770–780. [Google Scholar] [CrossRef]
  9. EIA. Shale Oil and Shale Gas Resources are Globally Abundant. 2014. Available online: www.eia.gov/todayinenergy/detail.php?id=14431 (accessed on 25 June 2025).
  10. Tenaglia, M.; Eberli, G.P.; Weger, R.J.; Blanco, L.R.; Sánchez, L.E.R.; Swart, P.K. Total organic carbon quantification from wireline logging techniques: A case study in the Vaca Muerta Formation, Argentina. J. Pet. Sci. Eng. 2020, 194, 107489. [Google Scholar] [CrossRef]
  11. Santana, T.; Alimonti, L.; Marino, J. Seismic Reservoir Characterization to Delineate Areas for Early Development, Vaca Muerta Formation, Argentina. In Proceedings of the AAPG Annual Convention and Exhibition, San Antonio, TX, USA, 19–22 May 2019. [Google Scholar]
  12. Zeller, M.; Reid, S.B.; Eberli, G.P.; Weger, R.J.; Massaferro, J.L. Sequence architecture and heterogeneities of a field–scale Vaca Muerta analog (Neuquén Basin, Argentina)–From outcrop to synthetic seismic. Mar. Pet. Geol. 2015, 66, 829–847. [Google Scholar] [CrossRef]
  13. Acevedo, H.; Bande, A. Characterization of lower Vaca Muerta at Fortín de Piedra in Neuquén Basin, Argentina. Lead. Edge 2018, 37, 255–260. [Google Scholar] [CrossRef]
  14. Ravazzoli, C.L.; Blanco, G. A rock physics analysis based on inversion of poroelastic Brown and Korringa parameters in Vaca Muerta shale: Theoretical aspects and applications. J. Pet. Sci. Eng. 2021, 203, 108615. [Google Scholar] [CrossRef]
  15. Cuervo, S.; Lombardo, E.; Vallejo, D.; Crousse, L.; Hernandez, C.; Mosse, L. Towards a Simplified Petrophysical Model for the Vaca Muerta Formation. In Proceedings of the Unconventional Resources Technology Conference, San Antonio, TX, USA, 1–3 August 2016; pp. 778–796. [Google Scholar]
  16. Yüksek, M.K.; Eberli, G.P.; Rueda, L.E.; Rodriguez-Blanco, L.; McNeill, D.F.; Weger, R.J. Mineralogical influences on acoustic velocities in the Vaca Muerta Formation, Neuquén Basin, Argentina: Insights from ultrasonic measurements. In Proceedings of the Asian Seismological Commission–15th General Assembly of the Asian Seismological Commission, Antalya, Turkey, 3–7 November 2024. [Google Scholar]
  17. Eberli, G.P.; Baechle, G.T.; Anselmetti, F.S.; Incze, M.L. Factors controlling elastic properties in carbonate sediments and rocks. Lead. Edge 2003, 22, 654–660. [Google Scholar] [CrossRef]
  18. Weger, R.J.; Eberli, G.P.; Baechle, G.T.; Massaferro, J.L.; Sun, Y.-F. Quantification of pore structure and its effect on sonic velocity and permeability in carbonates. AAPG Bull. 2009, 93, 1297–1317. [Google Scholar] [CrossRef]
  19. Kenter, J.A.; Podladchikov, F.; Reinders, M.; Van der Gaast, S.J.; Fouke, B.W.; Sonnenfeld, M.D. Parameters controlling sonic velocities in a mixed carbonate-siliciclastics Permian shelf-margin (upper San Andres formation, Last Chance Canyon, New Mexico). Geophysics 1997, 62, 505–520. [Google Scholar] [CrossRef]
  20. Baechle, G.T.; Eberli, G.P.; Weger, R.J.; Massaferro, J.L. Changes in dynamic shear moduli of carbonate rocks with fluid substitution. Geophysics 2009, 74, E135–E147. [Google Scholar] [CrossRef]
  21. Yrigoyen, M. Hydrocarbon Resources of Argentina. In Proceedings of the World Petroleum Congress, Buenos Aires, Petrotecnia, 20–25 October 1991; pp. 38–54. [Google Scholar]
  22. Howell, J.A.; Schwarz, E.; Spalletti, L.A.; Veiga, G.D. The Neuquén Basin: An Overview. Geol. Soc. Lond. Spec. Publ. 2005, 252, 1–14. [Google Scholar] [CrossRef]
  23. Di Benedetto, M.; Biscayart, P.; Zunino, J.; Soldo, J. Geological Setting of the Vaca Muerta Fm, Neuquen Basin-A World class Shale Play. In Proceedings of the 76th EAGE Conference and Exhibition-Workshops, Amsterdam, The Netherlands, 16–19 June 2014; p. cp–401-00051. [Google Scholar]
  24. Kietzmann, D.A.; Palma, R.M.; Riccardi, A.C.; Martín-Chivelet, J.; López-Gómez, J. Sedimentology and sequence stratigraphy of a Tithonian–Valanginian carbonate ramp (Vaca Muerta Formation): A misunderstood exceptional source rock in the Southern Mendoza area of the Neuquén Basin, Argentina. Sediment. Geol. 2014, 302, 64–86. [Google Scholar] [CrossRef]
  25. Wang, H.; Feng, M.; Xiaoguang, T.; Zuodong, L.; Zhang, X.; Zhenzhen, W.; Denghua, L.; Bo, W.; Yinfu, X.; Liuyan, Y. Assessment of global unconventional oil and gas resources. Pet. Explor. Dev. 2016, 43, 925–940. [Google Scholar] [CrossRef]
  26. Fantin, M.; Crousse, L.; Cuervo, S.; Vallejo, D.; Gonzalez Tomassini, F.; Reijenstein, H.; Lipinski, C. Vaca Muerta Stratigraphy in central Neuquén Basin: Impact on emergent unconventional project. In Proceedings of the Unconventional Resources Technology Conference, Denver, CO, USA, 25–27 August 2014; p. URTEC–1923793-MS. [Google Scholar]
  27. Garcia, M.N.; Sorenson, F.; Bonapace, J.C.; Motta, F.; Bajuk, C.; Stockman, H. Vaca Muerta Shale Reservoir Characterization and Description: The Starting Point for Development of a Shale Play with very Good Possibilities for a Successful Project. In Proceedings of the Unconventional Resources Technology Conference, Denver, CO, USA, 12–14 August, 2013. [Google Scholar]
  28. Weger, R.J.; Murray, S.T.; McNeill, D.F.; Swart, P.K.; Eberli, G.P.; Blanco, L.R.; Tenaglia, M.; Rueda, L.E. Paleothermometry and distribution of calcite beef in the Vaca Muerta Formation, Neuquen Basin, Argentina. AAPG Bull. 2019, 103, 931–950. [Google Scholar] [CrossRef]
  29. Rodriguez Blanco, L.; Eberli, G.P.; Weger, R.J.; Swart, P.K.; Tenaglia, M.; Sanchez, L.E.R.; McNeill, D.F. Periplatform ooze in a mixed siliciclastic-carbonate system-Vaca Muerta Formation, Argentina. Sediment. Geol. 2020, 396, 105521. [Google Scholar] [CrossRef]
  30. Zeller, M. Facies, Geometries and Sequence Stratigraphy of the Mixed Carbonate–Siliciclastic Quintuco–Vaca Muerta System in the Neuquén Basin, Argentina: An Integrated Approach; University of Miami: Coral Gables, FL, USA, 2013. [Google Scholar]
  31. Weger, R.J.; Eberli, G.P.; Rodriguez Blanco, L.; Tenaglia, M.; Swart, P.K. Finding a VOICE in the Southern Hemisphere: A New Record of global organic carbon? GSA Bull. 2023, 135, 2107–2120. [Google Scholar] [CrossRef]
  32. Rodriguez Blanco, L. Distribution and Source of Carbonate-Rich Intervals within the Vaca Muerta-Quintuco Mixed System, Neuquén Basin, Argentina. University of Miami: Coral Gables, FL, USA, 2016. [Google Scholar]
  33. Eberli, G.P.; Weger, R.J.; Tenaglia, M.; Rueda, L.; Rodriguez, L.; Zeller, M.; McNeill, D.; Murray, S.; Swart, P.K. The Unconventional Play in the Neuquén Basin, Argentina–Insights from the Outcrop for the Subsurface. In Proceedings of the Unconventional Resources Technology Conference, Austin, TX, USA, 24–26 July 2017; pp. 2208–2219. [Google Scholar]
  34. Birch, F. The velocity of compressional waves in rocks to 10 kilobars: 1. J. Geophys. Res. 1960, 65, 1083–1102. [Google Scholar] [CrossRef]
  35. Keng, E.Y. Air and belium pycnometer. Powder Technol. 1969, 3, 179–180. [Google Scholar] [CrossRef]
  36. Biot, M.A. Theory of propagation of elastic waves in a fluid-saturated porous solid. II. Higher frequency range. J. Acoust. Soc. Am. 1956, 28, 179–191. [Google Scholar] [CrossRef]
  37. Gurevich, B. A simple derivation of the effective stress coefficient for seismic velocities in porous rocks. Geophysics 2004, 69, 393–397. [Google Scholar] [CrossRef]
  38. Grana, D. Pressure–velocity relations in reservoir rocks: Modified MacBeth’s equation. J. Appl. Geophys. 2016, 132, 234–241. [Google Scholar] [CrossRef]
  39. Zimmerman, R.W.; Somerton, W.H.; King, M.S. Compressibility of porous rocks. J. Geophys. Res. Solid Earth 1986, 91, 12765–12777. [Google Scholar] [CrossRef]
  40. Gassmann, F. Elastic waves through a packing of spheres. Geophysics 1951, 16, 673–685. [Google Scholar] [CrossRef]
  41. Mavko, G.; Mukerji, T.; Dvorkin, J. The Rock Physics Handbook; Tools for Seismic Analysis in Porous Media; Cambridge University Press: Cambridge, UK, 1998; Volume 1, p. 329. [Google Scholar]
  42. Blackwood, D.; Hathaway, J.; Paskevich, V.; Poppe, L. A Laboratory Manual for X-Ray Powder Diffraction. Acetic Acid Treat. Remov. Carbonates 2001, 1, 1–88. Available online: https://pubs.usgs.gov/of/2001/of01-041/index.htm (accessed on 25 June 2025).
  43. Dang, S.T.; Sondergeld, C.H.; Rai, C.S. A New Approach to Measure Organic Density. In Proceedings of the Unconventional Resources Technology Conference (URTEC), Denver, CO, USA, 25–27 August 2014. [Google Scholar]
  44. Osipov, V. Density of clay minerals. Soil Mech. Found. Eng. 2011, 48, 231. [Google Scholar] [CrossRef]
  45. Baechle, G.T.; Weger, R.J.; Eberli, G.P.; Massaferro, J.L.; Sun, Y.-F. Changes of shear moduli in carbonate rocks: Implications for Gassmann applicability. Lead. Edge 2005, 24, 507–510. [Google Scholar] [CrossRef]
  46. Castagna, J.P. AVO Analysis-Tutorial and Review. In Offset Dependent Reflectivity-Theory and Practice of AVO; Castagna, J.P., Backus, M.M., Eds.; Investigations in Geophysics; Society of Exploration Geophysicists: Tulsa, OK, USA, 1993; pp. 3–36. [Google Scholar]
  47. Minear, J.W. Clay Models and Acoustic Velocities. In Proceedings of the SPE Annual Technical Conference and Exhibition, New Orleans, LA, USA, 26 September 1982. [Google Scholar]
  48. Han, D.-h.; Nur, A.; Morgan, D. Effects of Porosity and Clay Content on Wave Velocities in Sandstones. Geophysics 1986, 51, 2093–2107. [Google Scholar] [CrossRef]
  49. Tosaya, C.; Nur, A. Effects of diagenesis and clays on compressional velocities in rocks. Geophys. Res. Lett. 1982, 9, 5–8. [Google Scholar] [CrossRef]
  50. Castagna, J.P.; Batzle, M.L.; Eastwood, R.L. Relationships between compressional-wave and shear-wave velocities in clastic silicate rocks. Geophysics 1985, 50, 571–581. [Google Scholar] [CrossRef]
  51. Vernik, L.; Nur, A. Ultrasonic velocity and anisotropy of hydrocarbon source rocks. Geophysics 1992, 57, 727–735. [Google Scholar] [CrossRef]
  52. Marion, D.; Nur, A.; Yin, H.; Han, D.-H. Compressional velocity and porosity in sand-clay mixtures. Geophysics 1992, 57, 554–563. [Google Scholar] [CrossRef]
  53. Kenter, J.; Anselmetti, F.; Kramer, P.; Westphal, H.; Vandamme, M. Acoustic properties of "young" carbonate rocks, ODP leg 166 and boreholes Clino and Unda, western Great Bahama Bank. J. Sediment. Res. 2002, 72, 129–137. [Google Scholar] [CrossRef]
  54. Christensen, N.I.; Szymanski, D.L. Seismic properties and the origin of reflectivity from a classic Paleozoic sedimentary sequence, Valley and Ridge province, southern Appalachians. Geol. Soc. Am. Bull. 1991, 103, 277–289. [Google Scholar] [CrossRef]
  55. Craddock, P.R.; Mossé, L.; Bernhardt, C.; Ortiz, A.C.; Tomassini, F.G.; Saldungaray, P.; Pomerantz, A.E. Characterization and range of kerogen properties in the Vaca Muerta Formation, Neuquén Basin, Argentina. Org. Geochem. 2019, 129, 42–44. [Google Scholar] [CrossRef]
  56. Capelli, I.A.; Scasso, R.A.; Spangenberg, J.E.; Kietzmann, D.A.; Cravero, F.; Duperron, M.; Adatte, T. Mineralogy and geochemistry of deeply-buried marine sediments of the Vaca Muerta-Quintuco system in the Neuquen Basin (Chacay Melehue section), Argentina: Paleoclimatic and paleoenvironmental implications for the global Tithonian-Valanginian reconstructions. J. South Am. Earth Sci. 2021, 107, 103103. [Google Scholar] [CrossRef]
  57. Capelli, I.A.; Scasso, R.A.; Cravero, F.; Kietzmann, D.A.; Vallejo, D.; Adatte, T. Late-diagenetic clay mineral assemblages in carbonatized ash beds of the Vaca Muerta Formation (Neuquén Basin, Argentina): Insights into the diagenetic formation of chlorite. Mar. Pet. Geol. 2021, 132, 105207. [Google Scholar] [CrossRef]
  58. Reijenstein, H.M.; Dominguez, R.F.; Bande, A.; Vallejo, M.D.; Notta, R.; Guerberoff, D.; Lanusse, I.; Kohler, G.; Borgnia, M.; Benoit, S.; et al. Transecta Sísmica Regional del Sistema Vaca Muerta–Quintuco: Interpretación de Facies Sísmicas Basada en Impedancia Acústica y Litofacies Dominantes. In Proceedings of the Geología de la Formación Vaca Muerta, XX Congreso Geológico Argentino, San Miguel de Tucumán, Argentina, 7–11 August 2017. [Google Scholar]
  59. Kietzmann, D.A.; Ambrosio, A.L.; Suriano, J.; Alonso, M.S.; Tomassini, F.G.; Depine, G.; Repol, D. The Vaca Muerta–Quintuco system (Tithonian–Valanginian) in the Neuquén Basin, Argentina: A view from the outcrops in the Chos Malal fold and thrust belt. AAPG Bull. 2016, 100, 743–771. [Google Scholar] [CrossRef]
  60. Dominguez, R.F.; Lanusse-Noguera, I.; Continanzia, M.J.; Mykietiuk, K.; Ponce, C.; Pérez, G.; Guerello, R.; Caneva, M.; Di Benedetto, M.; Catuneanu, O.; et al. Organic-Rich Stratigraphic Units in the Vaca Muerta Formation, and Their Distribution and Characterization in the Neuquen Basin (Argentina). In Proceedings of the Unconventional Resources Technology Conference, San Antonio, TX, USA, 1–3 August 2016; pp. 1439–1450. [Google Scholar]
  61. Buijs, H.; Ponce, J. An Engineered Approach to Hydraulically Fracture the Vaca Muerta shale. In Proceedings of the SPE Hydraulic Fracturing Technology Conference and Exhibition, The Woodlands, TX, USA, 23–25 January 2018; p. D021S005R002. [Google Scholar]
  62. Khadeeva, Y.; Vernik, L. Rock-physics model for unconventional shales. Lead. Edge 2014, 33, 318–322. [Google Scholar] [CrossRef]
  63. Sayers, C.M.; Fisher, K.; Walsh, J.J. Sensitivity of P-and S-impedance to the presence of kerogen in the Eagle Ford Shale. Lead. Edge 2015, 34, 1482–1486. [Google Scholar] [CrossRef]
  64. Vernik, L.; Castagna, J.; Omovie, S.J. S-wave velocity prediction in unconventional shale reservoirs. Geophysics 2018, 83, MR35–MR45. [Google Scholar] [CrossRef]
  65. Vernik, L.; Milovac, J. Rock physics of organic shales. Lead. Edge 2011, 30, 318–323. [Google Scholar] [CrossRef]
  66. Avseth, P.; Carcione, J.M. Rock-physics analysis of clay-rich source rocks on the Norwegian Shelf. Lead. Edge 2015, 34, 1340–1348. [Google Scholar] [CrossRef]
  67. Wyllie, M.R.J. The Fundamentals of Well Log Interpretation, 3d ed., rev. and reset. ed.; Academic Press: New York, NY, USA, 1963. [Google Scholar]
  68. Castagna, J.P.; Batzle, M.L.; Kan, T.K. Rock Physics-The link Between Rock Properties and AVO Response. In Offset Dependent Reflectivity-Theory and Practice of AVO; Castagna, J.P., Backus, M.M., Eds.; Investigations in Geophysics; Society of Exploration Geophysicists: Tulsa, OK, USA, 1993; pp. 135–171. [Google Scholar]
  69. Tatham, R.H. Vp/Vs and lithology. Geophysics 1982, 47, 336–344. [Google Scholar] [CrossRef]
  70. Mavko, G.; Mukerji, T. Comparison of the Krief and critical porosity models for prediction of porosity and V-P/V-S. Geophysics 1998, 63, 925–927. [Google Scholar] [CrossRef]
  71. Ødegaard, E.; Avseth, P. Interpretation of Elastic Inversion Results using Rock Physics Templates. In Proceedings of the 65th EAGE Conference & Exhibition, Stavanger, Norway, 2–5 June 2003; p. cp–6-00337. [Google Scholar]
  72. Ødegaard, E.; Avseth, P. Well log and seismic data analysis using rock physics templates. First Break 2004, 22, 37–44. [Google Scholar]
  73. Goodway, B.; Chen, T.; Downton, J. Improved AVO Fluid Detection and Lithology Discrimination using Lamé Petrophysical Parameters; “λρ”, “μρ”, and “λ/μ Fluid Stack”, from P and S Inversions. In SEG Technical Program Expanded Abstracts 1997; Society of Exploration Geophysicists: Houston, TX, USA, 1997; pp. 183–186. [Google Scholar]
  74. Russell, B.; Goodway, B.; Avseth, P. Poroelasticity and rock-physics templates. Interpretation 2025, 13, T139–T152. [Google Scholar] [CrossRef]
  75. Biot, M.A. General theory of three-dimensional consolidation. J. Appl. Phys. 1941, 12, 155–164. [Google Scholar] [CrossRef]
  76. Altowairqi, Y.; Rezaee, R.; Evans, B.; Urosevic, M. Shale elastic property relationships as a function of total organic carbon content using synthetic samples. J. Pet. Sci. Eng. 2015, 133, 392–400. [Google Scholar] [CrossRef]
  77. Raj, R.; Jaiswal, P.; Wang, Y.; Grammer, G.M.; Weger, R.J. How Nanopores Influence Dry-Frame VP Pressure Sensitivity. Front. Earth Sci. 2021, 9, 641815. [Google Scholar] [CrossRef]
Figure 1. (A) Location map of the Neuquén Basin in Argentina [22]. (B) Late Jurassic to Early Cretaceous stratigraphic subdivision in the Neuquén Basin [30].
Minerals 15 00694 g001
Figure 2. (A) Reference section composed of 11 subsections measured through the Vaca Muerta Formation at the Puerta Curaco (PC) outcrops (modified from Ref. [32]). Red crosses indicate locations of 1–1.5 m-long short cores. (B) Drilling operation photograph showing modified motorized chainsaw with 3.5″ drill barrel during drill extraction. (C) Example of polished and described core slab from PC at 496.6 m above the base of Vaca Muerta. (D) Representative thin section of facies in the lower part of the core and plugs extracted at ~90 cm in the core.
Minerals 15 00694 g002
Figure 3. Porosity histogram of all measured samples.
Minerals 15 00694 g003
Figure 4. Ternary diagram of mineralogical composition of all measured samples. TOC content is superimposed in color.
Minerals 15 00694 g004
Figure 5. Cross plot of carbonate content vs. TOC. Although no statistically significant relation exists between the two measured parameters, higher carbonate content appears to be a limiting factor for higher TOC values.
Minerals 15 00694 g005
Figure 6. Summary of the qualitative mineral composition obtained from the optical analysis using the HALO mineral scanner. The dominant detected mineral groups are clays (44%), carbonates (43%), and other minerals commonly found in volcanic or high-temperature products (7%), alongside minerals related to either weathering or evaporitic processes (6%). Carbonates are predominantly composed of calcites (78% plus 4% of others within the calcite group), dolomites (11% plus 5% of others within the dolomite group), and other minor carbonates (2%). The clays are dominated by Mg-illite (65%), montmorillonite (11%), smectite (9%), K-illite (4%), and other minor quantities of micas and/or clays (11%).
Minerals 15 00694 g006
Figure 7. Brine-saturated and dry compressional and shear wave velocities of vertical, horizontal, and diagonal samples at 20 MPa effective pressure as a function of porosity. Wyllie’s time-average equations for calcite, quartz, and mixed clay are superimposed for reference.
Minerals 15 00694 g007
Figure 8. (A,B) Vp/Vs ratio of dry and brine-saturated samples at 20 MPa effective pressure as a function of porosity, color-coded with calcium carbonate content. (C,D) Vp/Vs ratio of dry and brine-saturated samples at 20 MPa effective pressure as a function of porosity, color-coded with TOC content.
Minerals 15 00694 g008
Figure 9. Representative sample measurements of the mixed carbonate–siliciclastic background sediment from this study. (A) Compressional wave velocity evolution at increasing effective pressure under both wet (diamonds) and dry conditions (stars) of three representative samples. (B) Shear wave velocity evolution at increasing effective pressure under both wet (diamonds) and dry conditions (stars) of three representative samples.
Minerals 15 00694 g009
Figure 10. (A) Brine-saturated compressional velocity at 20 MPa effective pressure as a function of porosity and color-coded by carbonate content. (B) Brine-saturated compressional velocity at 20 MPa effective pressure as a function of porosity and color-coded by TOC content.
Minerals 15 00694 g010
Figure 11. Ternary diagram of mineralogical composition with Vp/Vs ratio from brine-saturated measurements, superimposed in color. No apparent relationship exists between the mineral composition and the Vp/Vs ratio.
Minerals 15 00694 g011
Table 1. (A) Mean and range (min and max) of the compressional velocity, shear velocity, and Vp/Vs ratio of measured saturated plug samples. (B) Mean and range (min and max) of the compressional velocity, shear velocity, and Vp/Vs ratio of measured dry plug samples. (C) Mean and range (min and max) of porosity, grain density, and bulk density of all measured plug samples. (D) Mean and range (min and max) of carbonate, total organic carbon, and clay content of all measured plug samples.
(A)# ofVpwet (m/s)Vswet (m/s)Vpwet/Vswet (-)
SamplesMean [Min–Max]Mean [Min–Max]Mean [Min–Max]
Horizontal965022 [2933–6816]2729 [1854–3643]1.84 [1.46–2.06]
Diagonal285188 [3625–6572]2854 [1862–3524]1.84 [1.46–2.06]
Vertical864610 [2826–6638]2548 [1475–3527]1.82 [1.61–1.96]
Total2104875 [2826–6816]2672 [1475–3643]1.81 [1.67–2]
(B)# ofVpdry (m/s)Vsdry (m/s)Vpdry/Vsdry (-)
SamplesMean [Min–Max]Mean [Min–Max]Mean [Min–Max]
Horizontal954873 [2757–6762]2792 [1770–3490]1.74 [1.46–1.97]
Diagonal255039 [3393–6370]2892 [2093–3450]1.74 [1.46–1.97]
Vertical844313 [2198–6400]2617 [1591–3719]1.74 [1.54–1.85]
Total2044663 [2198–6762]2732 [1591–3719]1.64 [1.38–1.85]
(C)# ofPorosity (%)ρg (g/cm3)ρb (g/cm3)
SamplesMean [Min–Max]Mean [Min–Max]Mean [Min–Max]
Horizontal965.9 [0.1–18.9]2.65 [2.49–2.87]2.56 [2.33–2.81]
Diagonal284.0 [0.3–16.4]2.66 [2.56–2.98]2.59 [2.38–2.84]
Vertical866.0 [0.0–19.4]2.66 [2.47–2.91]2.54 [2.32–2.82]
Total2106.1 [0–19.4]2.66 [2.47–2.98]2.56 [2.32–2.84]
(D)# ofCarbonate Content (%)TOC (%)Clay Content (%)
SamplesMean [Min–Max]Mean [Min–Max]Mean [Min–Max]
Horizontal9666.3 [0.8–96]1.3 [0–5.3]9.3 [0–40.1]
Diagonal2874.6 [50.9–92.1]1.4 [0.1–3.1]11 [0.1–25.1]
Vertical8664.8 [0.8–98]1.3 [0–5.3]9.5 [0–38.4]
Total21066.6 [0.8–98]1.3 [0–5.3]9.5 [0–40.1]
Table 2. (A) Mean and median velocity changes (compressional and shear) resulting from a pressure increase (5–40 MPa) for the vertical, horizontal, and diagonal plug samples. (B) Mean and median velocity changes (compressional and shear) resulting from a pressure increase (5–20 MPa) for the vertical, horizontal, and diagonal plug samples. (C) Mean and median velocity changes (compressional and shear) resulting from a pressure increase (20–40 MPa) for the vertical, horizontal, and diagonal plug samples.
(A)5 MPa to 40 MPa
Saturated Dry
nMeanMediannMeanMedian
VpVertical844.79%3.92%697.29%5.21%
Horizontal973.54%2.70%804.70%3.45%
Diagonal273.50%2.72%255.68%4.08%
All Samples2084.04%3.15%1725.86%4.32%
VsVertical845.79%4.20%695.48%4.71%
Horizontal974.59%3.45%804.56%3.63%
Diagonal274.70%3.37%255.25%4.18%
All Samples2085.09%3.87%1725.02%4.16%
(B)5 MPa to 20 MPa
Saturated Dry
nMeanMediannMeanMedian
VpVertical852.86%2.25%684.15%3.01%
Horizontal972.08%1.59%802.71%2.02%
Diagonal282.10%1.61%253.70%2.82%
All Samples2102.40%1.87%1733.42%2.52%
VsVertical853.32%2.64%683.27%2.80%
Horizontal972.84%2.19%802.87%2.26%
Diagonal283.00%2.36%253.39%2.69%
All Samples2103.06%2.37%1733.10%2.40%
(C)20 MPa to 40 MPa
Saturated Dry
nMeanMediannMeanMedian
VpVertical841.92%1.61%843.25%2.38%
Horizontal971.41%1.07%962.07%1.54%
Diagonal271.41%0.94%251.92%1.50%
All Samples2081.62%1.29%2032.53%1.75%
VsVertical842.14%1.62%842.26%1.78%
Horizontal971.68%1.29%961.76%1.31%
Diagonal271.68%1.34%251.82%1.23%
All Samples2081.87%1.42%2031.97%1.50%
Disclaimer/Publisher’s Note: The statements, opinions and data contained in all publications are solely those of the individual author(s) and contributor(s) and not of MDPI and/or the editor(s). MDPI and/or the editor(s) disclaim responsibility for any injury to people or property resulting from any ideas, methods, instructions or products referred to in the content.

