
The Co-Evolution of Paleoclimate, Paleoceanography, and Sedimentation in the Yanshan Basin, North China: Records from the Yangzhuang Formation of the Jixian Section
Abstract
1. Introduction
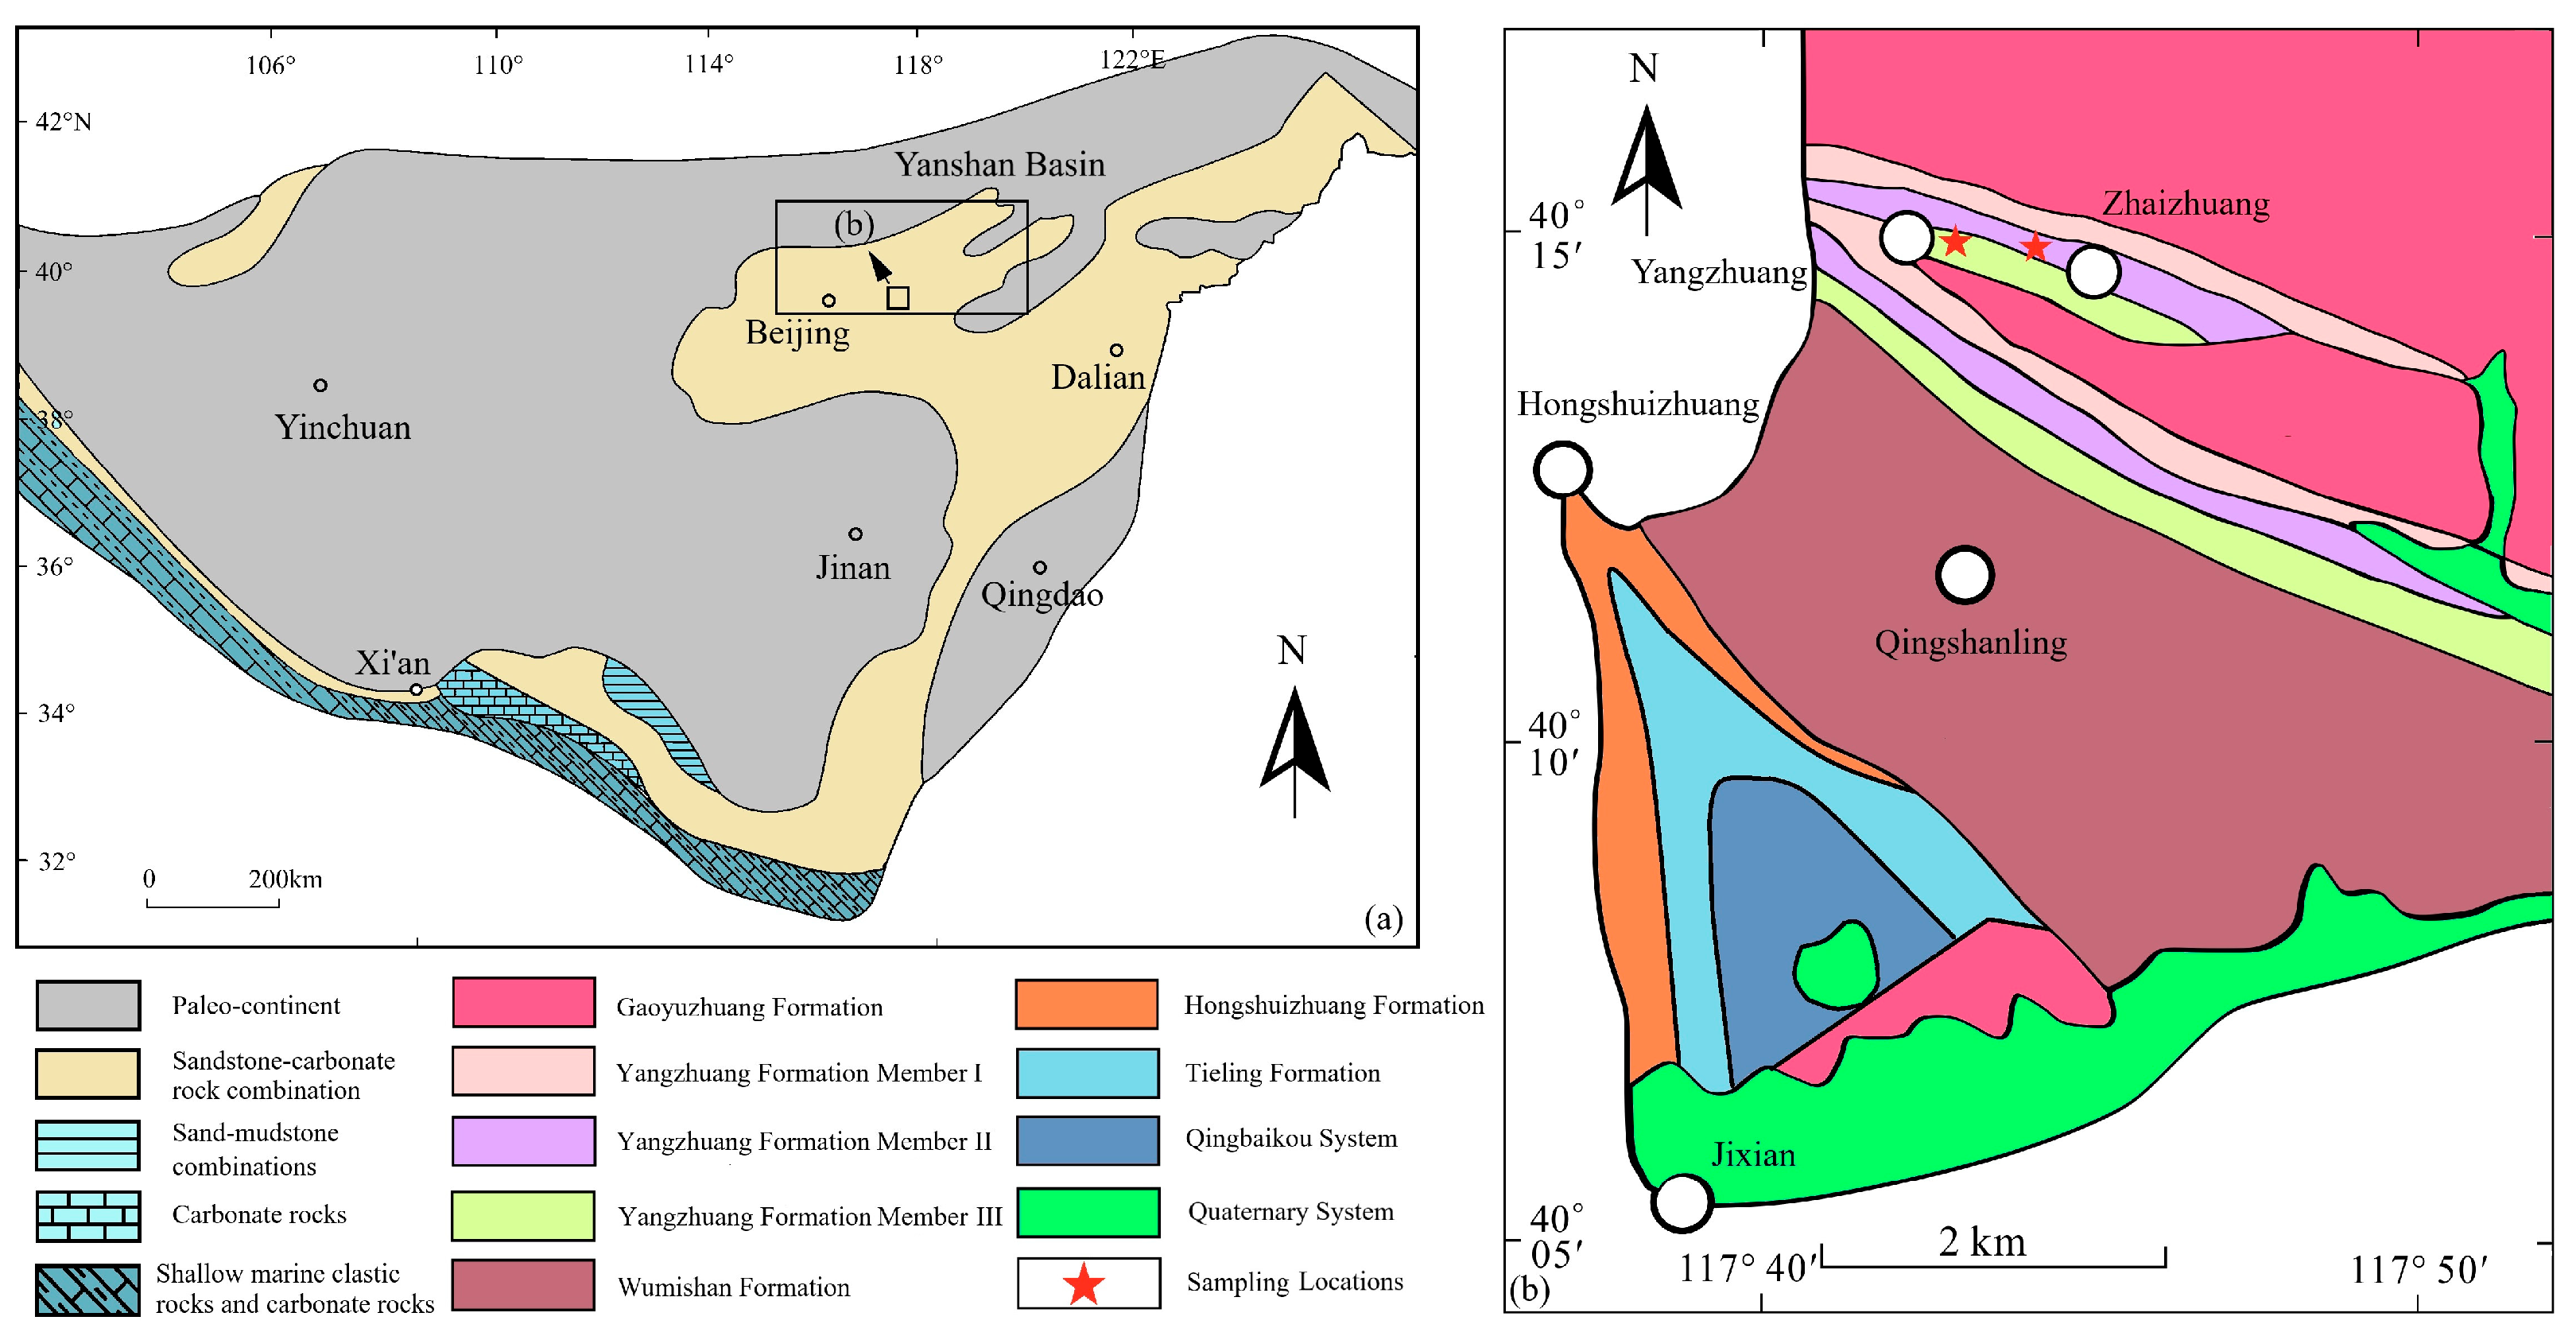
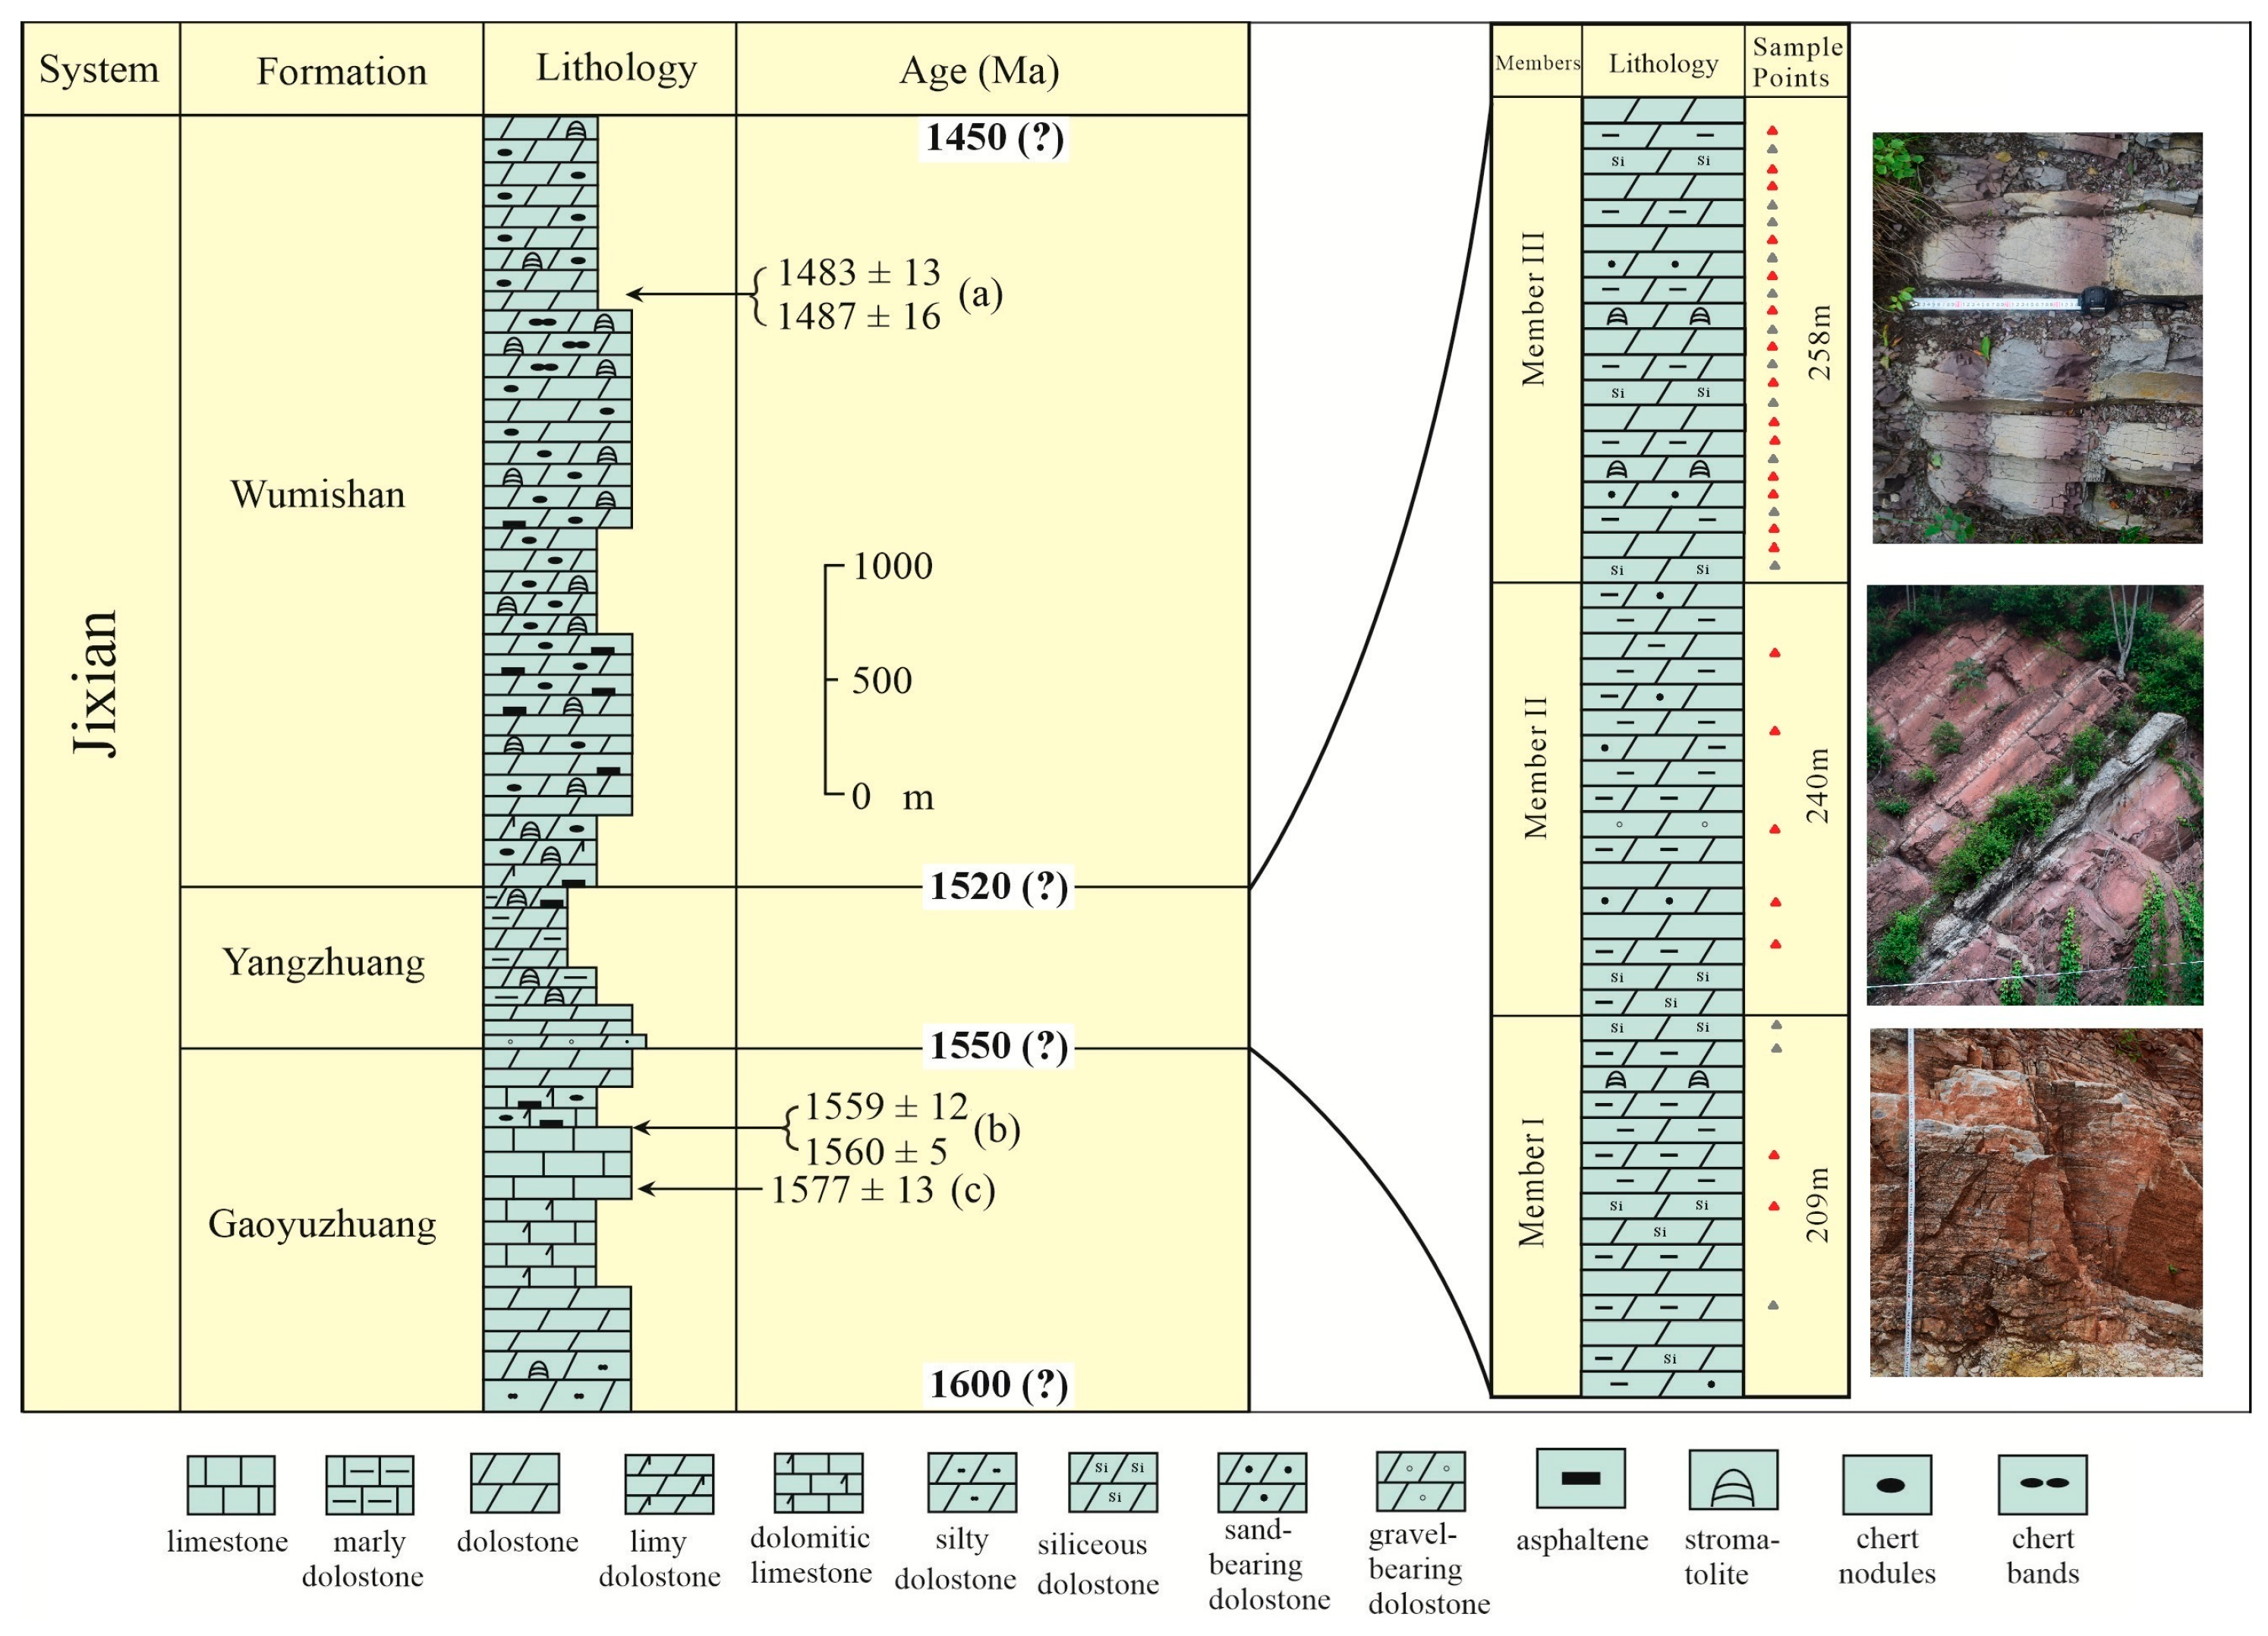
2. Geological Setting
3. Samples and Methods
4. Results
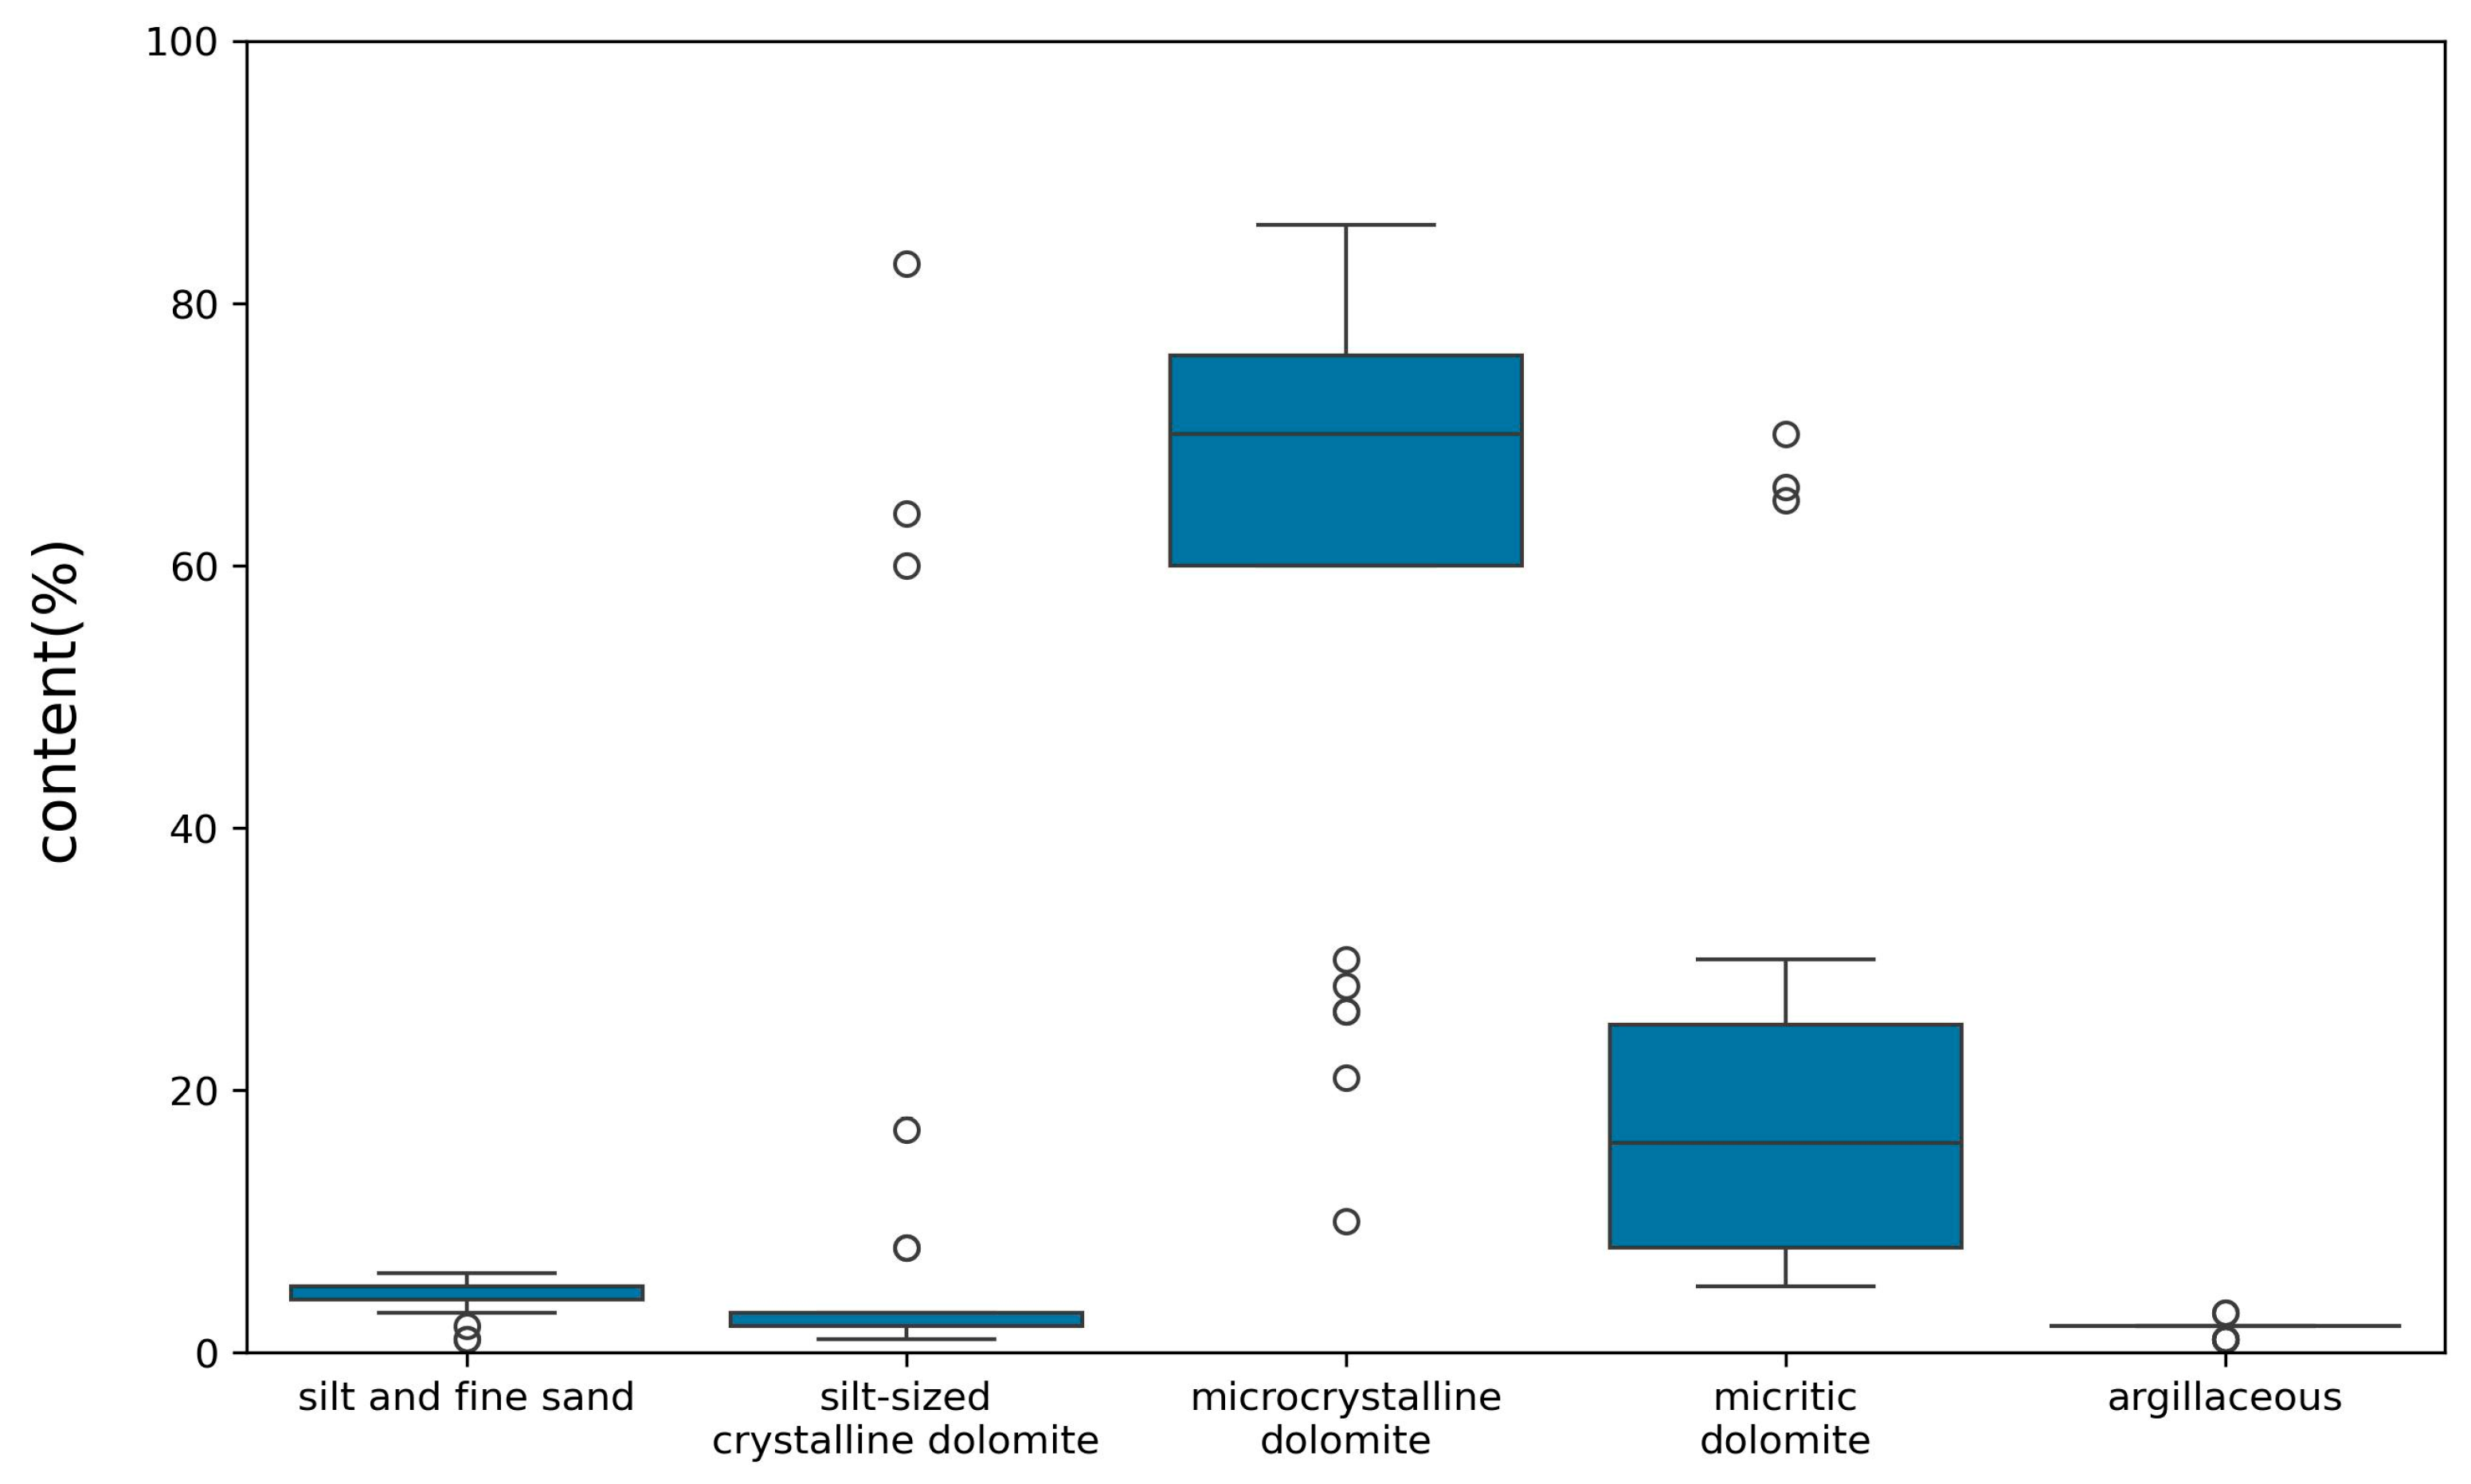
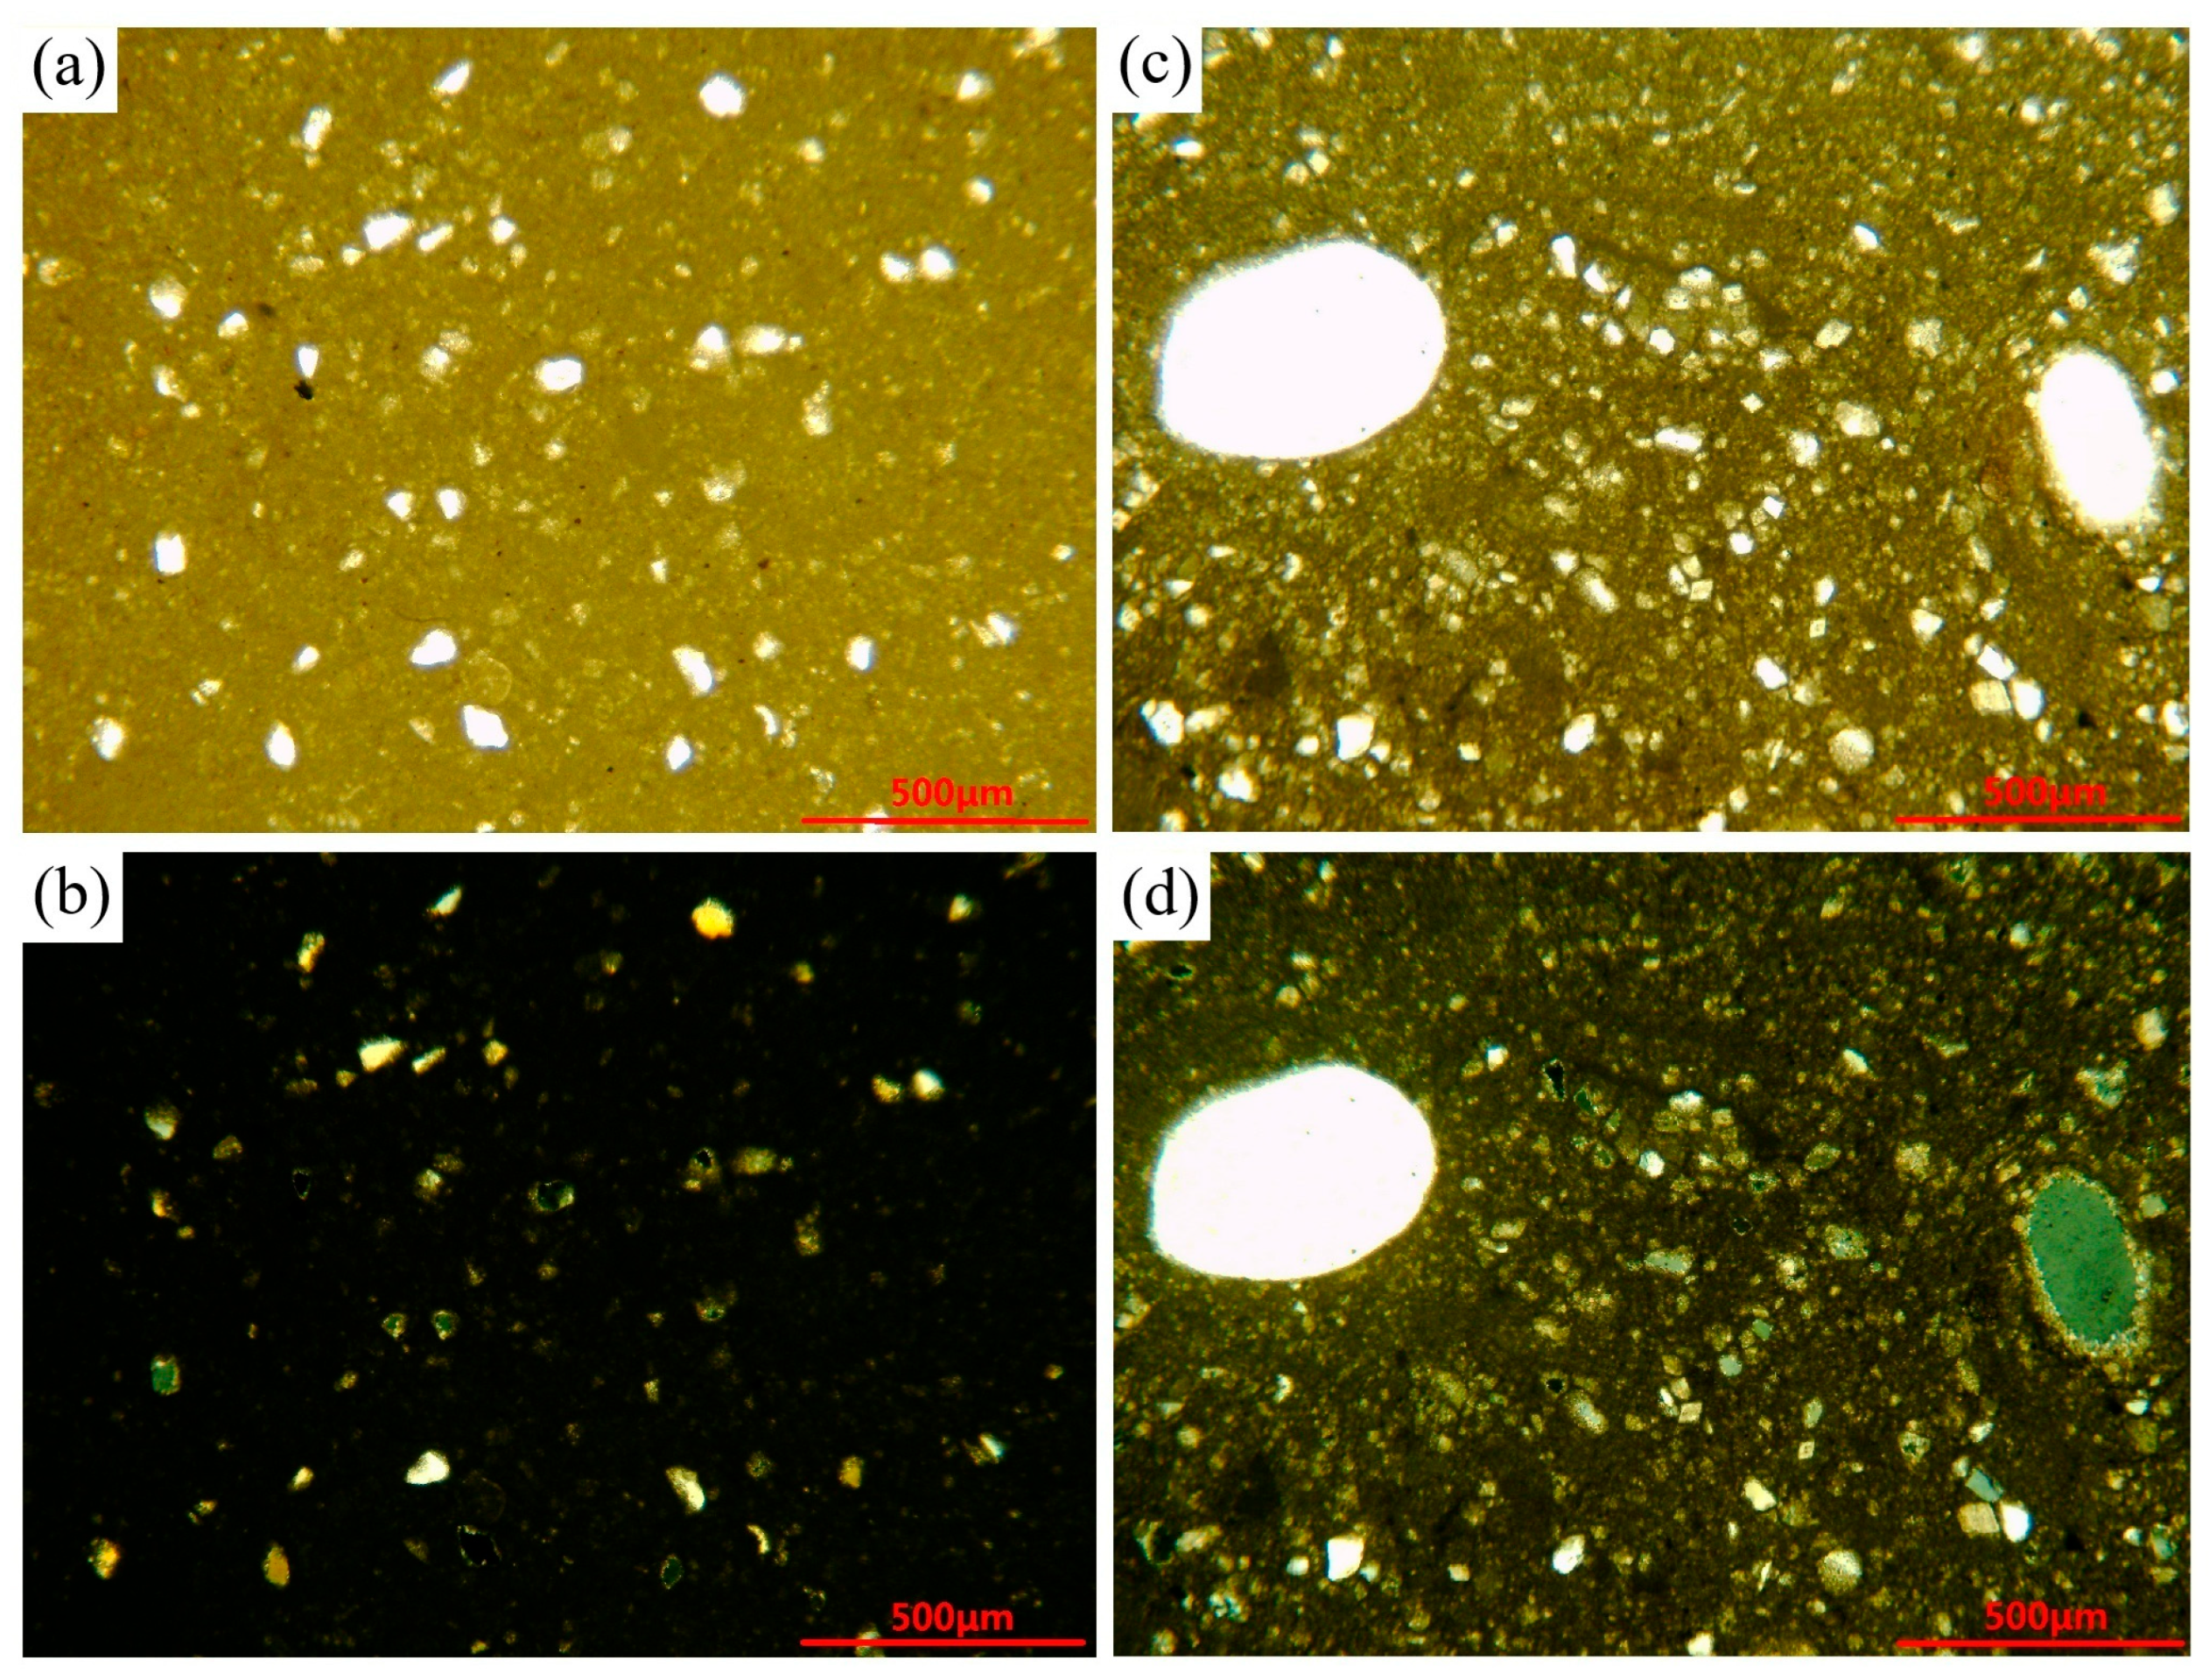
4.1. Lithology
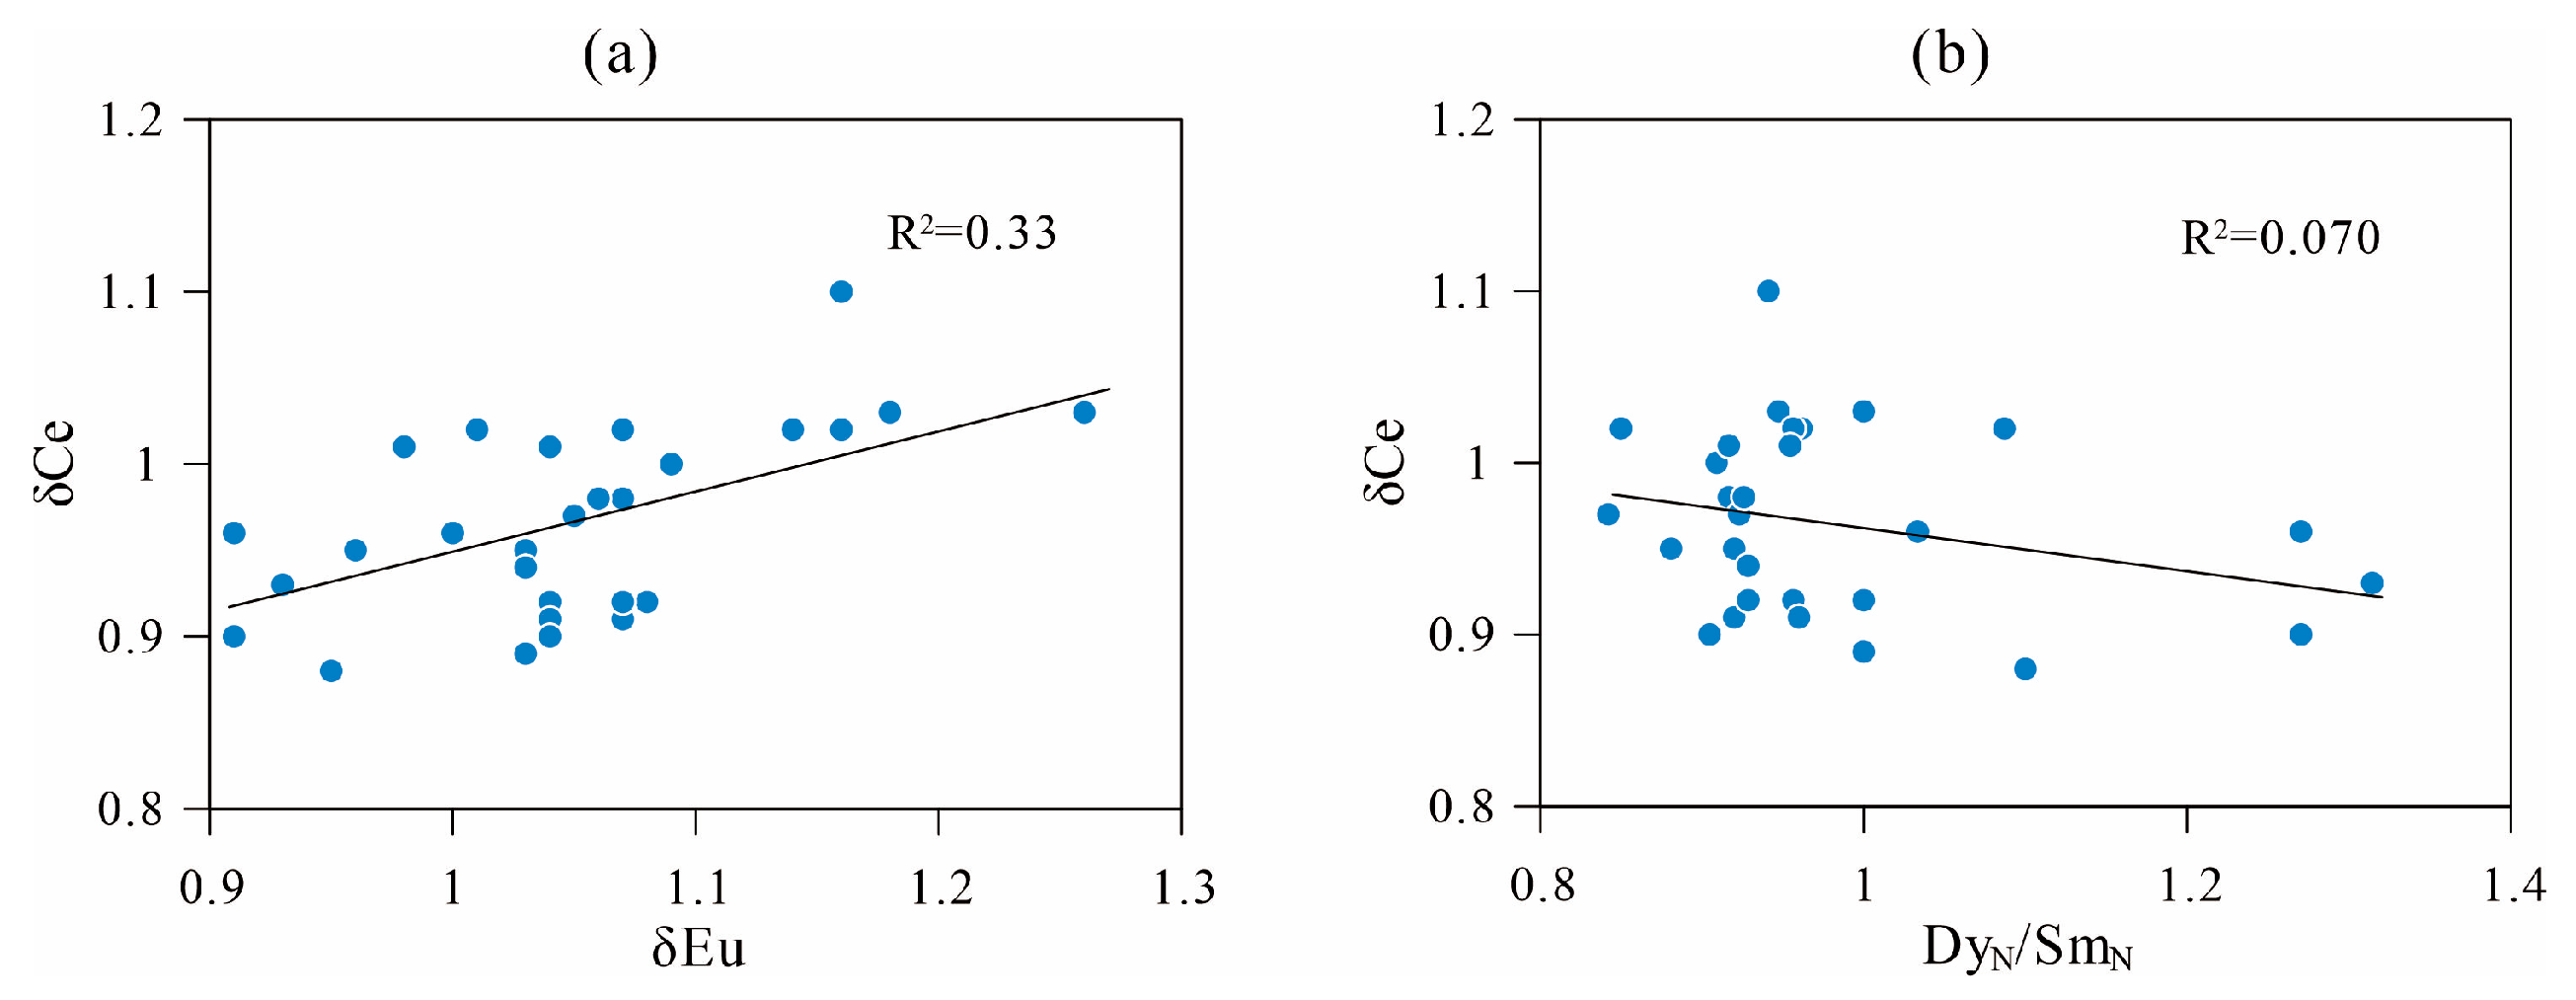
4.2. Post-Diagenetic Processes
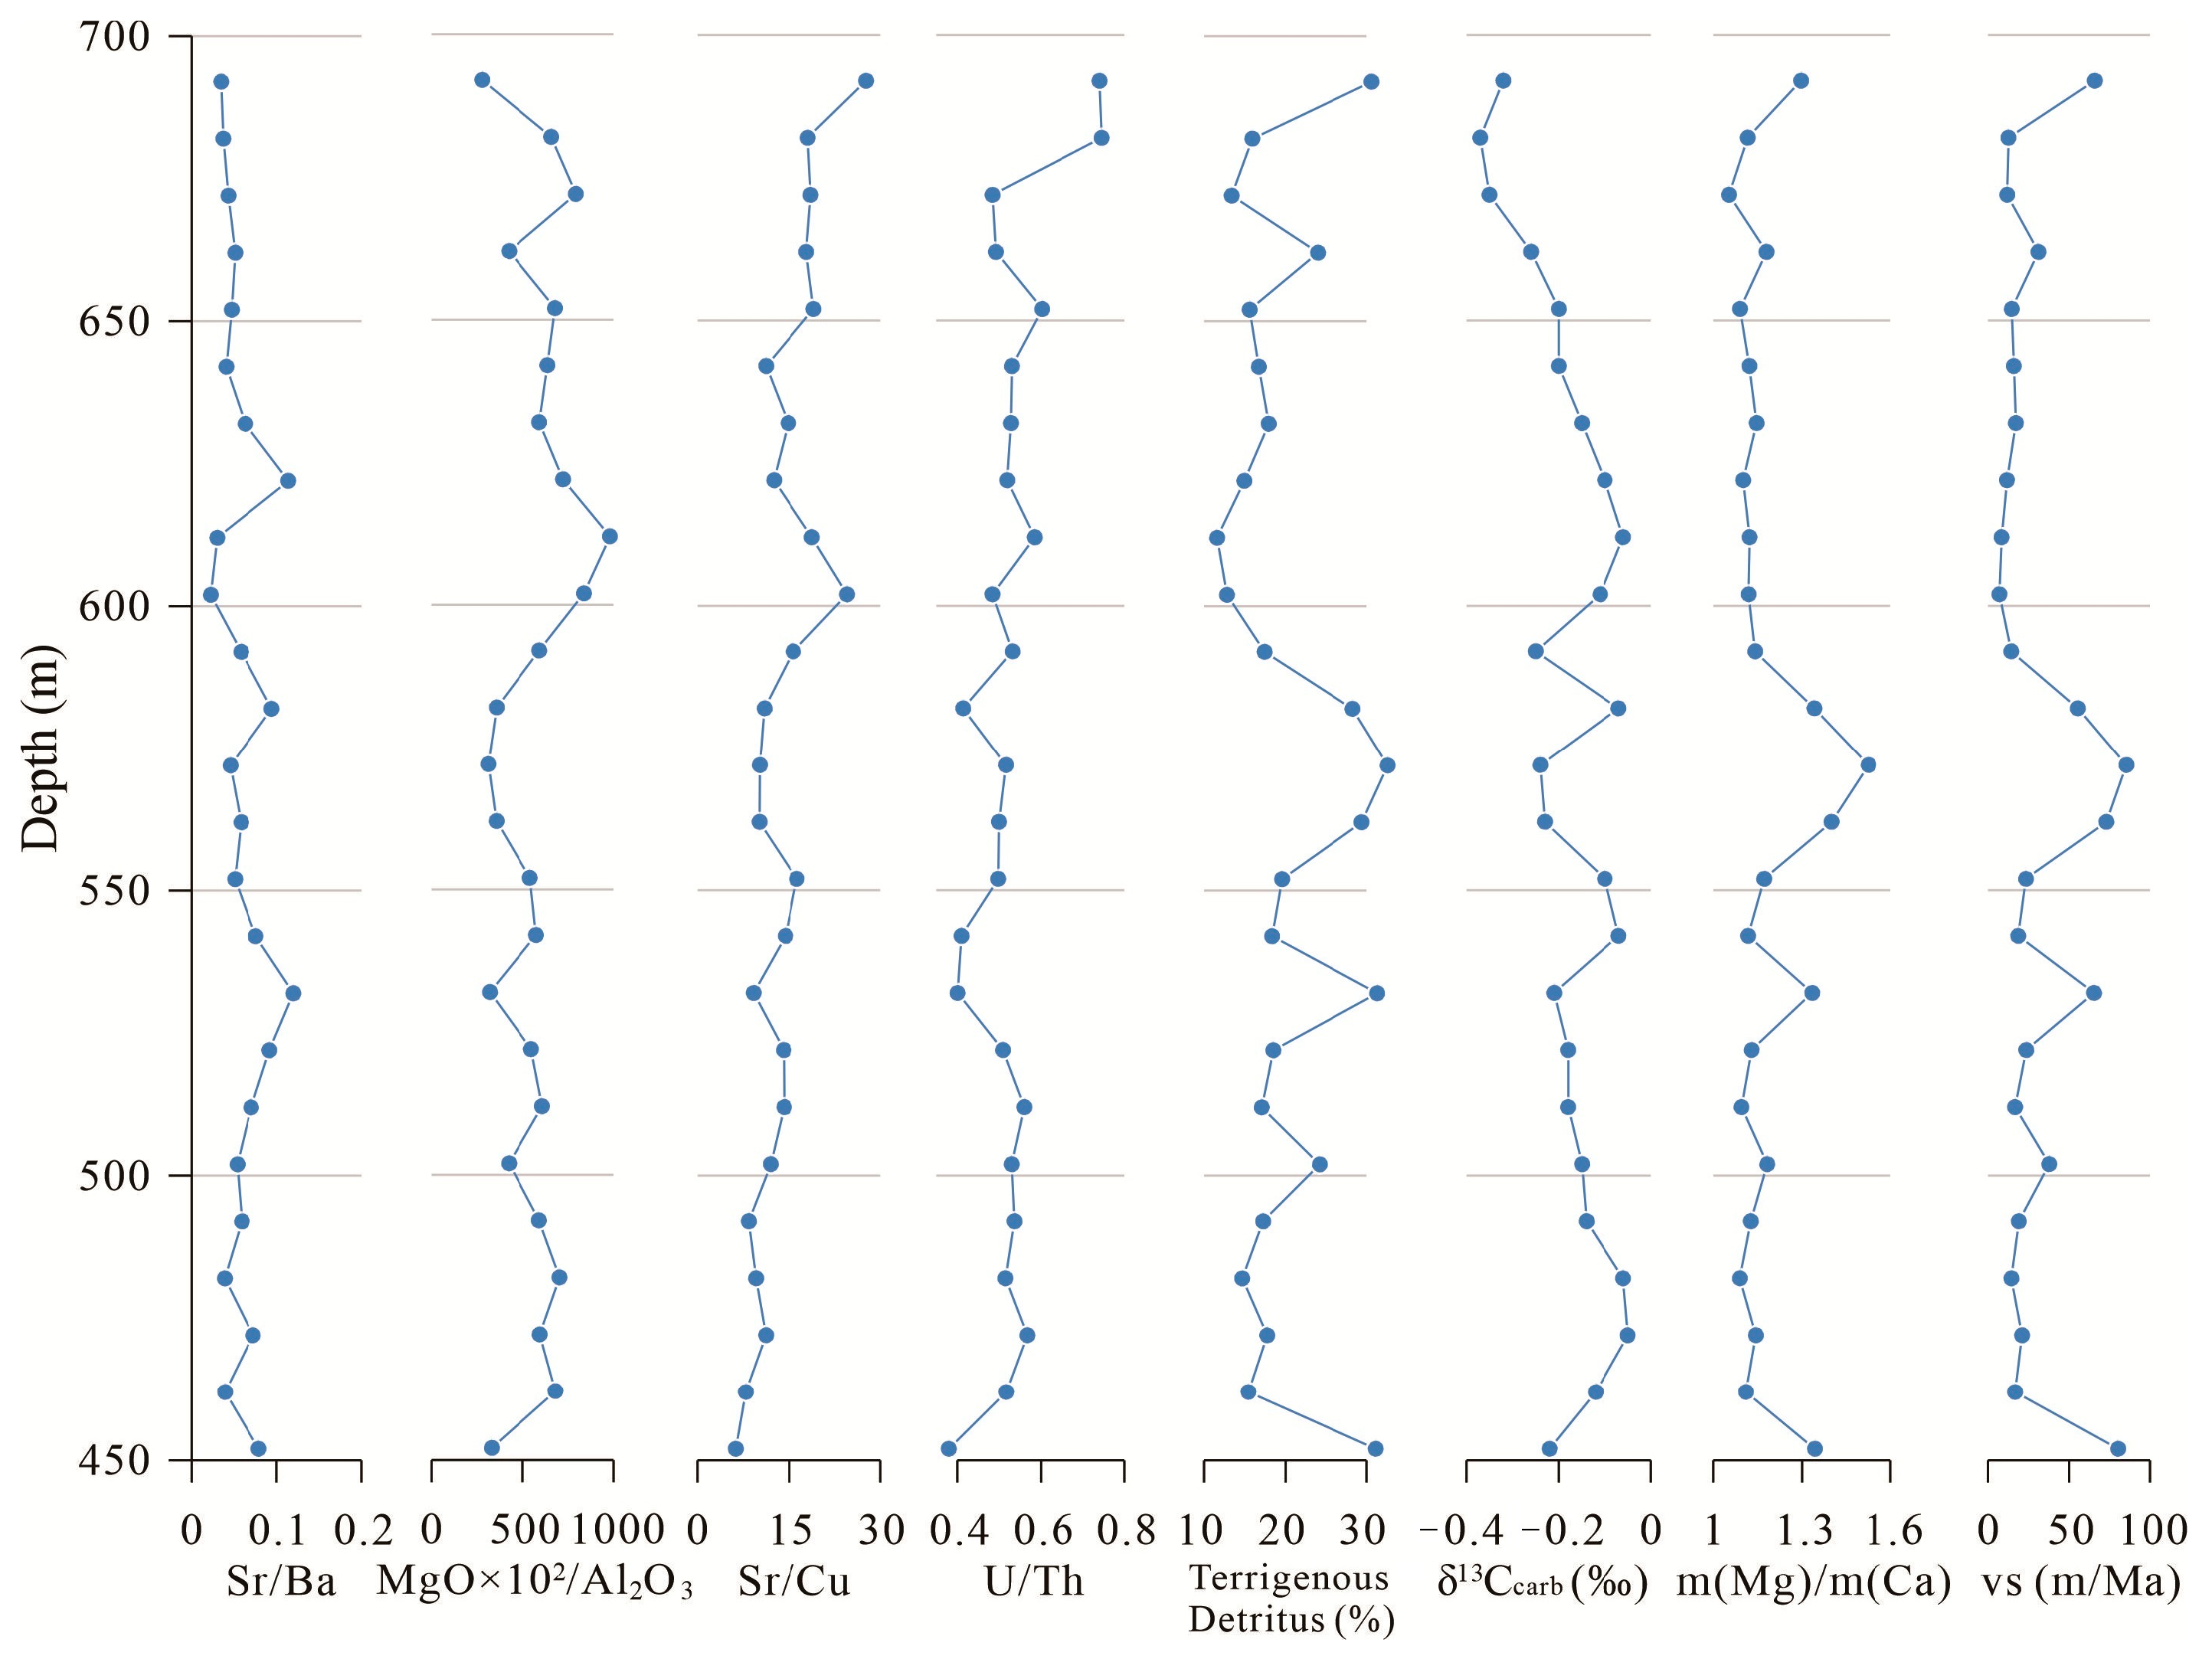
4.3. Paleoenvironments
4.4. Terrigenous Clastics
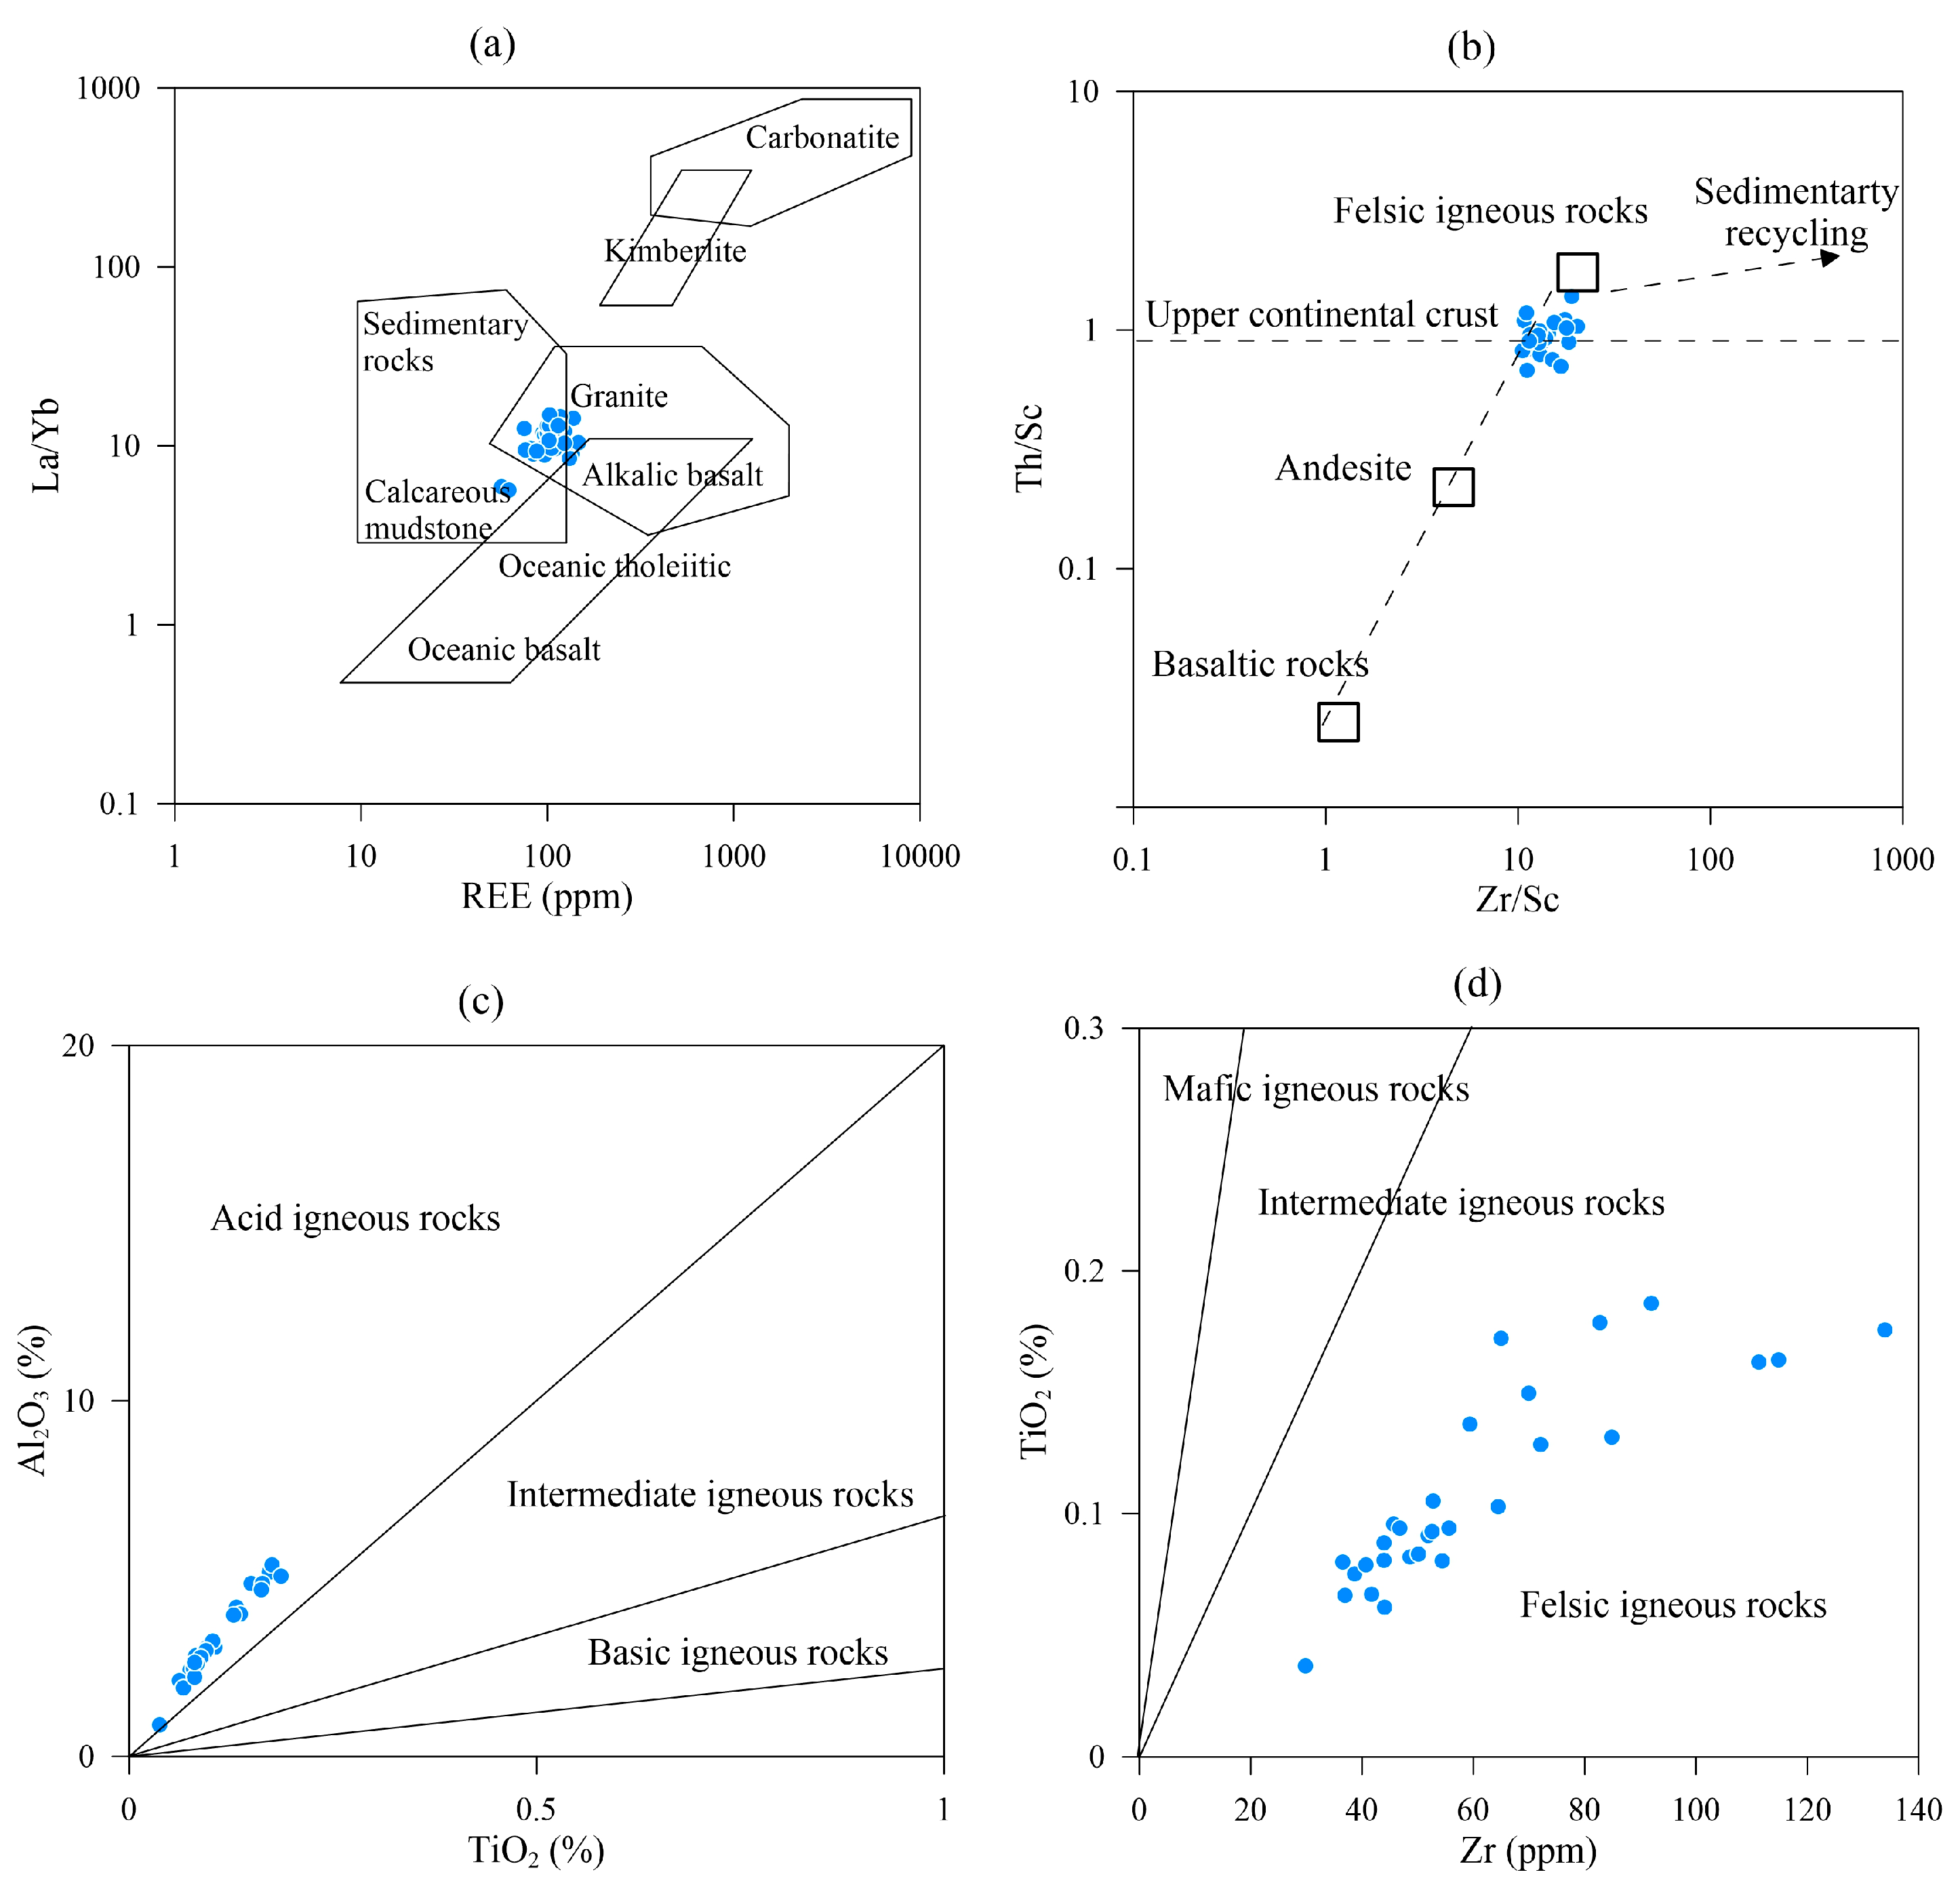
4.4.1. Stability of Terrigenous Clastics
4.4.2. Terrigenous Clastic Material
4.5. The Inorganic Carbon Isotopes Analysis
4.6. Rare Earth Element Analysis
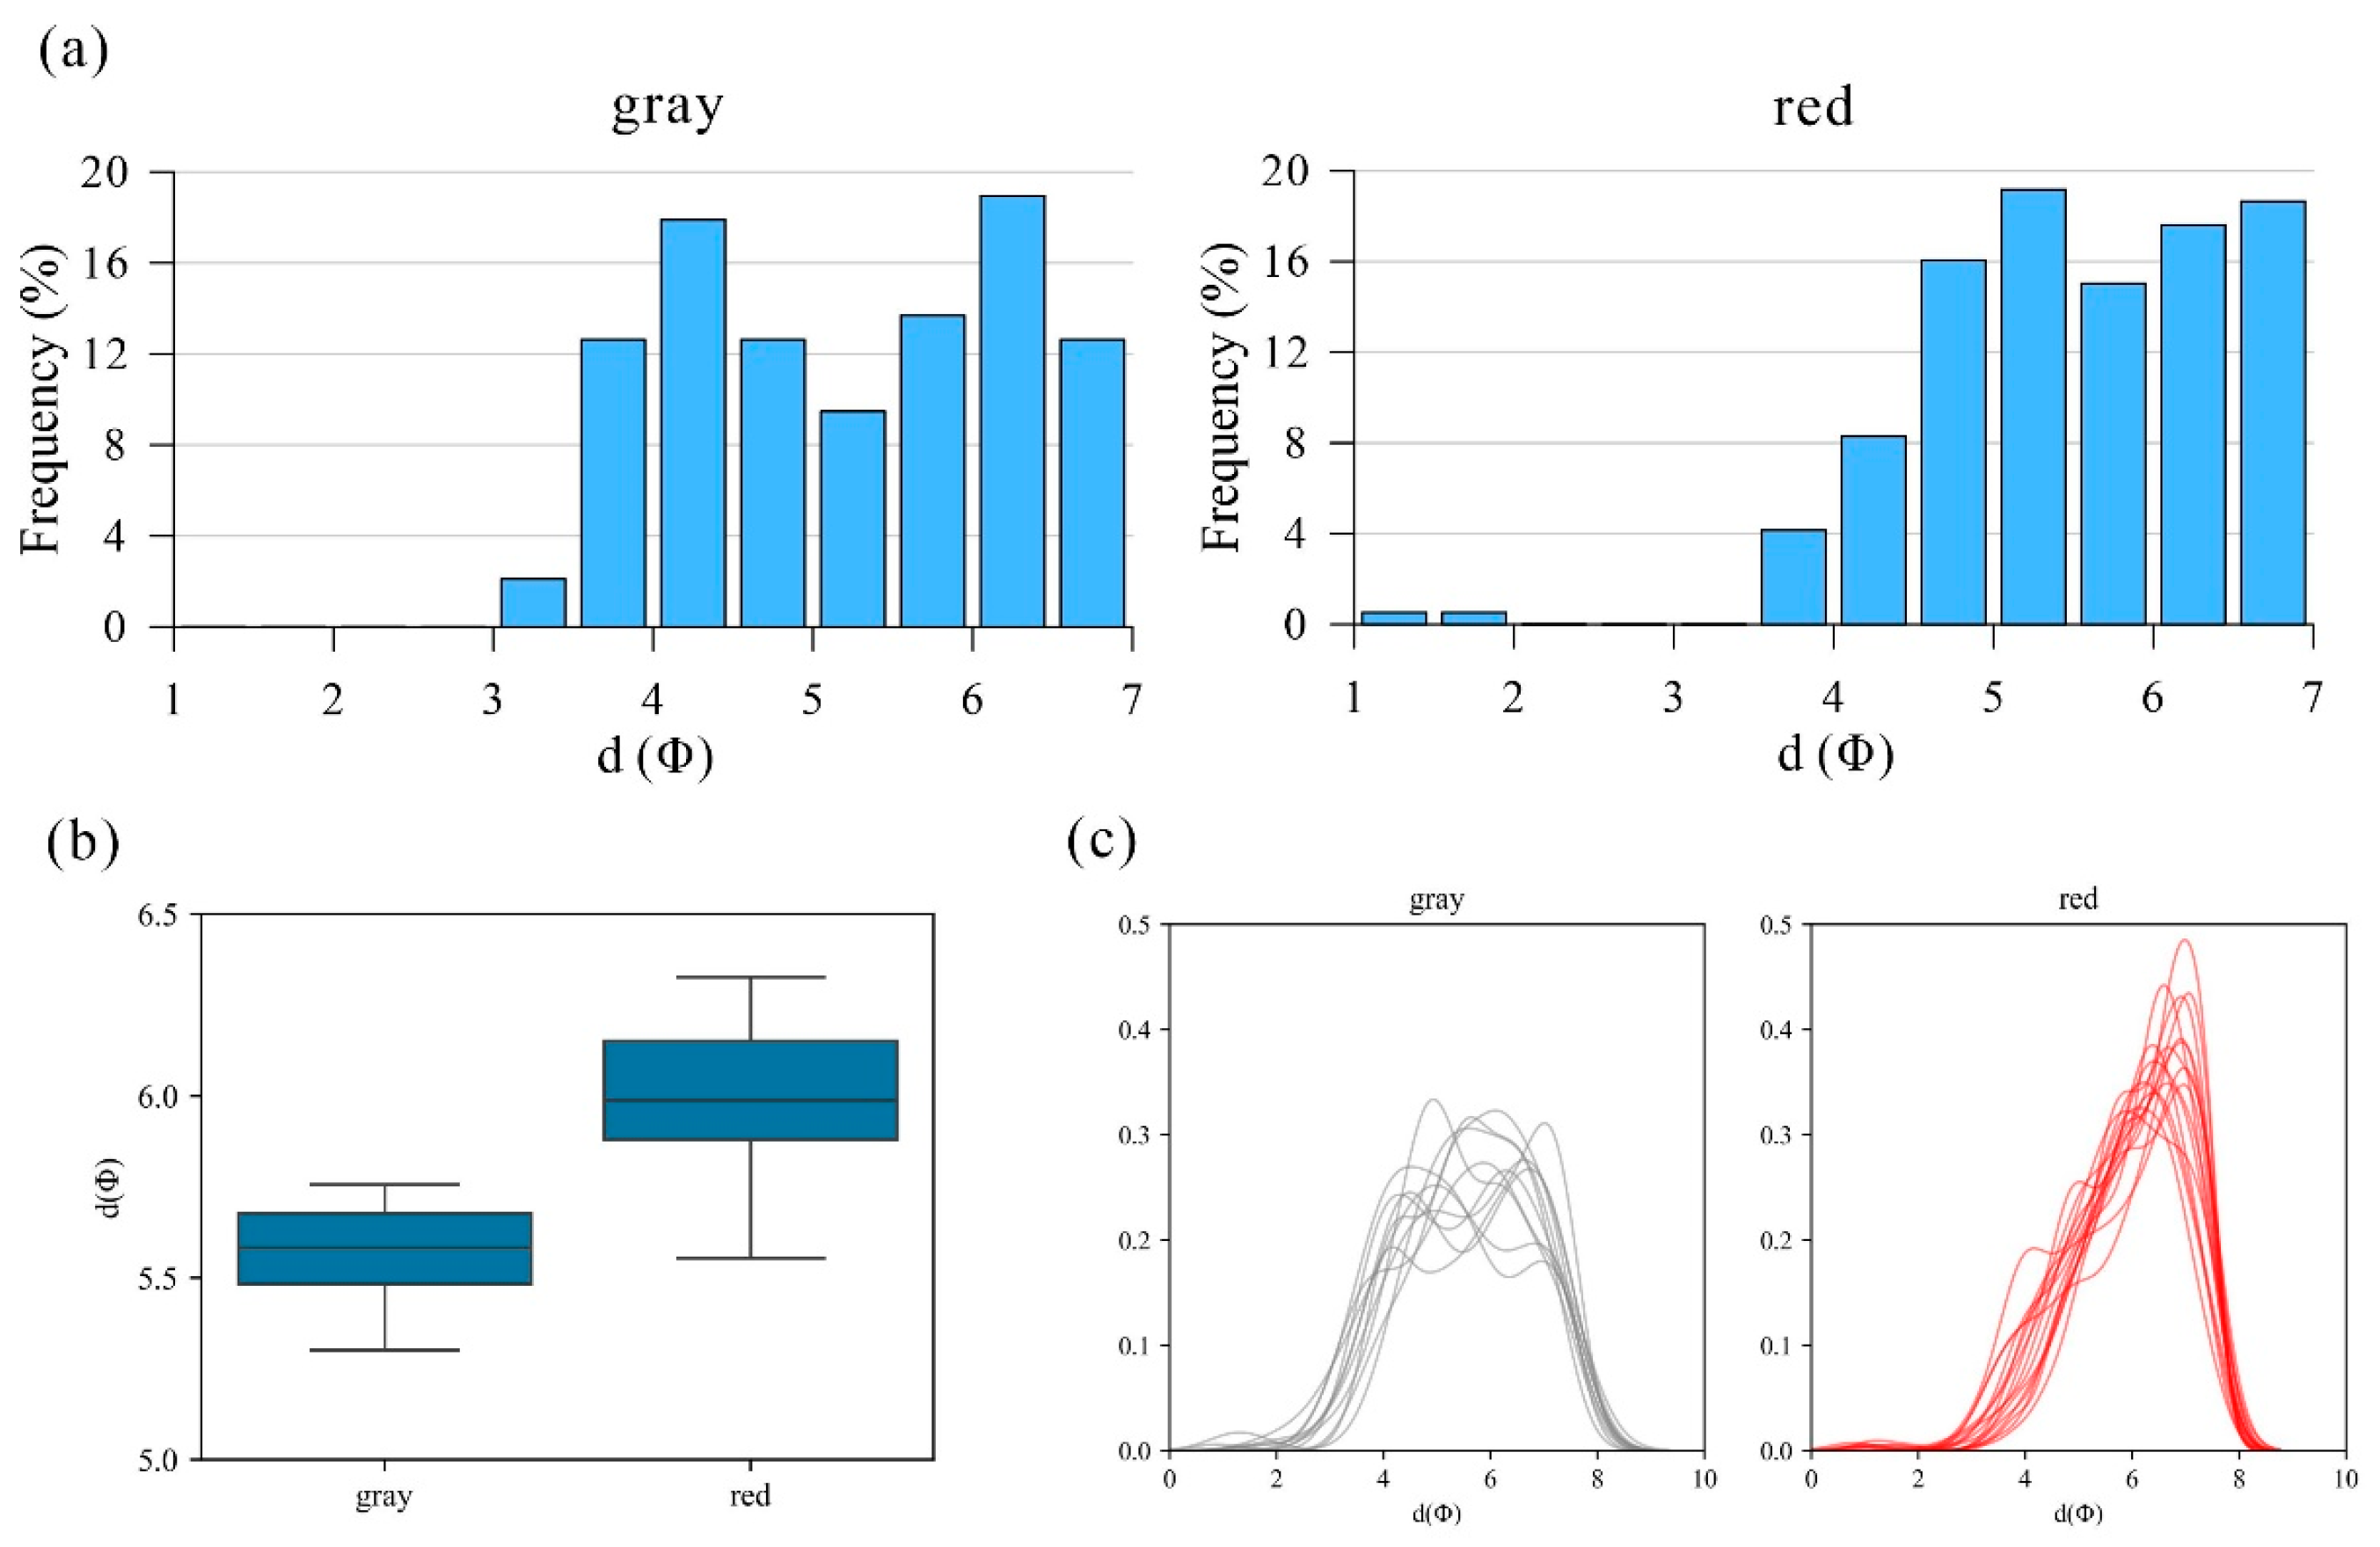
4.7. Granulometric Analysis of Red and Gray Layers
5. Discussion
5.1. Paleoceanographic Fluctuations
5.2. Milankovitch Cycles
6. Conclusions
Author Contributions
Funding
Data Availability Statement
Acknowledgments
Conflicts of Interest
References
- Liu, P.J.; Wang, C.W.; Sun, Y.W.; Zhang, B.F.; Wang, L.H.; Yue, S.F. The geochemical characters of the Gaoyuzhuang and Yangzhuang formations of mesoproterozoic in Pingquan County, Hebei Province. J. Jilin Univ. (Earth Sci. Ed.) 2005, 35, 1–6. [Google Scholar] [CrossRef]
- Mei, M.X.; Li, Z.Z.; Bai, Z.D.; Xu, D.B. Preliminary study on the middle and upper Proterozoic cyclic-sequences in Xinlong County, Hebei. J. Stratigr. 1998, 22, 102–108. [Google Scholar] [CrossRef]
- Liu, B.; Zhang, X.L. Petrology of Yangzhuang formation and its geological significance, Middle Proterozoic Jixian System from Jixian, Tianjin, North China. Acta Sci. Nat. Univ. Pekin. 2004, 40, 601–610. [Google Scholar] [CrossRef]
- Wang, K.M.; Luo, S.S. Geochemical characteristics and environmental significance of Gaoyuzhuang and Yangzhuang formations in Yanshan region. Bull. Mineral. Petrol. Geochem. 2009, 28, 356–364. [Google Scholar] [CrossRef]
- Li, J.H.; Kuang, H.W.; Peng, N.; Du, Y.M.; Yao, J.R. Geochemical characteristics of Mesoproterozoic Yangzhuang formation in Kuancheng county, northern Hebei province. Acta Petrol. Mineral 2010, 29, 289–297. [Google Scholar] [CrossRef]
- Yang, J.D.; Zhao, F.H.; Qin, S.F.; Zou, Y.; Song, C.G.; Sun, Y.X. Geochemical characteristics and geological significance of carbonate rocks in the Middle Mesoproterozoic Yangzhuang Formation of northern margin of North China Craton. Nat. Gas. Geosci. 2019, 31, 268–281. [Google Scholar] [CrossRef]
- Zou, Y.; Liu, D.N.; Zhao, F.H.; Kuang, H.W.; Song, C.G.; Sun, Y.X.; Zhou, R.; Cheng, J.B. Reconstruction of nearshore chemical conditions in the Mesoproterozoic: Evidence from red and grey beds of the Yangzhuang formation, North China Craton. Int. Geol. Rev. 2020, 62, 1433–1449. [Google Scholar] [CrossRef]
- Hu, X.M.; Scott, R.W.; Cai, Y.F.; Wang, C.S.; Melinte-Dobrinescu, M.C. Cretaceous oceanic red beds (CORBs): Different time scales and models of origin. Earth-Sci. Rev. 2012, 115, 217–248. [Google Scholar] [CrossRef]
- Guo, H.; Du, Y.S.; Kah, L.C.; Huang, J.H.; Hu, C.Y.; Huang, H.; Yu, W.C. Isotopic composition of organic and inorganic carbon from the Mesoproterozoic Jixian Group, North China: Implications for biological and oceanic evolution. Precambrian Res. 2013, 224, 169–183. [Google Scholar] [CrossRef]
- Wu, H.C.; Zhang, S.H.; Li, Z.X.; Li, H.Y.; Dong, J. New result of Paleomagnetism and its tectonic significance in the Yangzhuang Formation of North China platform. Chin. Sci. Bull. 2005, 50, 1370–1376. [Google Scholar] [CrossRef]
- Lv, Q.Q.; Luo, S.S. Sedimentary characteristics and sequence stratigraphy of the Mesozoic Proterozoic Yangzhuang Formation in the northern Hebei depression, Yanshan. Geol. Sci. Technol. Inf. 2012, 31, 41–46. [Google Scholar] [CrossRef]
- Zhang, S.H.; Zhao, Y.; Pei, J.L.; Yang, Z.Y.; Hu, G.H.; Zhang, Q.Q. From the Yanliao sill swarms in the North China Craton to the large-scale continental rift system in the Columbia supercontinent: A review and new perspectives on 20 years of research on the Yanliao large igneous province. Acta Geol. Sin. 2024, 98, 783–798. [Google Scholar] [CrossRef]
- Duan, Y.; Duan, J.Y. Sub-abysmal algal biosediments and environmental analysis of the Mesoproterozoic Yanshan aulacogen, north China. J. Jilin Univ. 2011, 41, 154–161. [Google Scholar] [CrossRef]
- Pei, J.; Yang, Z.; Zhao, Y. New Mesoproterozoic paleomagnetic results in north China and its implication for the Columbia supercontinent. Geol. Bull. China 2005, 24, 496–498. [Google Scholar] [CrossRef]
- Chu, X.L.; Zhang, T.G.; Zhang, Q.R.; Feng, L.J.; Zhang, F.S. Carbon isotopic variations of Proterozoic carbonates in Jixian, Tianjin, China. Sci. China Ser. D-Earth Sci. 2004, 47, 160–170. [Google Scholar] [CrossRef]
- Meng, Q.R.; Wei, H.H.; Qu, Y.Q.; Ma, S.X. Stratigraphic and sedimentary records of the rift to drift evolution of the northern North China craton at the Paleo-to Mesoproterozoic transition. Gondwana Res. 2011, 20, 205–218. [Google Scholar] [CrossRef]
- Mei, M.X.; Gao, J.H.; Meng, Q.F.; Liu, Z.R. Sedimentary features and their implications of microdigital stromatolites from the Mesoproterozoic Wumishan Formation at the Jixian section in North China. Acta Geol. Sin.-Engl. Ed. 2010, 84, 483–496. [Google Scholar] [CrossRef]
- Chu, X.L.; Zhang, T.G.; Zhang, Q.R.; Lyons, T.W. Sulfur and carbon isotope records from 1700 to 800 Ma carbonates of the Jixian section, northern China: Implications for secular isotope variations in Proterozoic seawater and relationships to global supercontinental events. Geochim. Cosmochim. Acta 2007, 71, 4668–4692. [Google Scholar] [CrossRef]
- Shi, J.Y.; Fan, T.L.; Jin, Z.J.; Liu, Q.Y.; Zhang, T.; Jiang, M.; Wang, B. Astronomical forcing of sea-level changes and the history of the solar system 1,640 million years ago. J. Geophys. Res.-Solid Earth 2023, 128. [Google Scholar] [CrossRef]
- Cheng, D.W.; Zhang, S.C.; Zhang, Z.J.; Zhou, C.M.; Wang, H.J.; Yuan, X.J.; Chen, X.Y. An astronomically calibrated stratigraphy of the Mesoproterozoic Hongshuizhuang Formation, North China: Implications for pre-Phanerozoic changes in Milankovitch orbital parameters. J. Asian Earth Sci. 2020, 199, 104408. [Google Scholar] [CrossRef]
- Lu, S.N.; Yang, C.L.; Li, H.K.; Chen, Z.H. North China continent and Columbia supercontinent. Earth Sci. Front. 2002, 9, 225–233. [Google Scholar] [CrossRef]
- Yan, Y.Z.; Liu, Z.L. On the relationship between biocommunities and palaeoenvironments in Changcheng period of the Yanshan basin, north China. Acta Micropaleontol. Sin. 1998, 15, 3–5. [Google Scholar] [CrossRef]
- Li, R.W.; Chen, J.S.; Zang, S.K.; Chen, Z.M. Secular variations in carbon isotopic compositions of carbonates from Proterozoic successions in the ming tombs section of the north China platform. J. Asian Earth Sci. 2004, 22, 329–341. [Google Scholar] [CrossRef]
- Wang, S.S.; Sang, H.Q.; Qiu, J.; Chen, M.E.; Li, M.R. The forming ages of Yangzhuang and Wumishan formations in Jixian section, northern China. Chin. J. Geol. 1995, 30, 166–173. Available online: http://www.dzkx.org/en/article/id/geology_10045 (accessed on 13 March 2025).
- Li, H.K.; Su, W.B.; Zhou, H.Y.; Xiang, Z.Q.; Tian, H.; Yang, L.G.; Warren, D.H.; Frank, R.E. The first precise age constraints on the Jixian System of the Meso-toNeoproterozoic Standard Section of China: SHRlMP zircon U-Pb dating ofbentonites from the Wumishan and Tieling formations in the Jixian Section, North China Craton. Acta Petrol. Sin. 2014, 30, 2999–3012. Available online: http://www.ysxb.ac.cn/article/id/aps_20141015 (accessed on 20 March 2025).
- Li, H.K.; Zhu, S.X.; Xiang, Z.Q.; Su, W.B.; Lu, S.N.; Zhou, H.Y.; Geng, J.Z.; Li, S.; Yang, F.J. Zircon U-Pb dating on tuff bed from Gaoyuzhuang formation in Yanqing, Beijing: Further constraints on the new subdivision of the Mesoproterozoic stratigraphy in the northern North China Craton. Acta Petrol. Sin. 2010, 26, 2131–2140. Available online: http://www.ysxb.ac.cn/article/id/aps_20100715 (accessed on 9 March 2025).
- Tian, H.; Zhang, J.; Li, H.K.; Su, W.B.; Zhou, H.Y.; Yang, L.G.; Xiang, Z.Q.; Geng, J.Z.; Liu, H.; Zhu, S.J.; et al. Zircon LA-MC-ICPMS U-Pb dating of tuff from Mesoproterozoic Gaoyuzhuang Formation in Jixian County of North China and its geological significance. Acta Geosci. Sin. 2015, 36, 647–658. [Google Scholar] [CrossRef]
- Fang, H.; Tang, D.J.; Shi, X.Y.; Zhou, L.M.; Zhou, X.Q.; Wu, M.T.; Song, H.Y.; Riding, R. Early Mesoproterozoic Ca-carbonate precipitates record fluctuations in shallow marine oxygenation. Precambrian Res. 2022, 373, 106630. [Google Scholar] [CrossRef]
- GB/T 14506.28-2010; General Administration of Quality Supervision, Inspection Quarantine of the People’s Republic of ChinaStandardization Administration of the People’s Republic of China. Methods for Chemical Analysis of Silicate Rocks—Part 28: Determination of 16 Major and Minor Elements Content. China Standards Press: Beijing, China, 2010. (In Chinese)
- Bankole, S.A.; Buckman, J.; Stow, D.; Lever, H. Grain-size analysis of mudrocks: A new semi-automated method from SEM images. J. Pet. Sci. Eng. 2019, 174, 244–256. [Google Scholar] [CrossRef]
- Shields, G.; Stille, P. Diagenetic constraints on the use of cerium anomalies as palaeoseawater redox proxies: An isotopic and REE study of Cambrian phosphorites. Chem. Geol. 2001, 175, 29–48. [Google Scholar] [CrossRef]
- Abedini, A.; Calagari, A.A. REEs geochemical characteristics of lower Cambrian phosphatic rocks in the Gorgan-Rasht Zone, northern Iran: Implications for diagenetic effects and depositional conditions. J. Afr. Earth Sci. 2017, 135, 115–124. [Google Scholar] [CrossRef]
- Wang, P.W.; Chen, Z.; Li, X.J.; Cheng, G.; He, X.Y.; Xu, Z.Y.; Ma, L.Q.; Dong, Y.; Huang, L. Geochemical characteristics and environmental significance of dengying formation of upper Sinian in Qiannan depression. Geophysics 2011, 25, 1059–1065. [Google Scholar] [CrossRef]
- Wen, X.D. Lithofacies-palaeogeography and their evolution of the middle-upper Proterozoic in North China. J. China Univ. Pet. (Nat. Sci. Ed.) 1989, 13, 13–21. Available online: https://www.researchgate.net/publication/303106031 (accessed on 13 March 2025).
- Hu, J.J.; Li, Q.; Li, J.; Huang, J.; Ge, D.S. Geochemical characteristics and depositional environment of the Middle Permian mudstones from central Qiangtang Basin, northern Tibet. Geol. J. 2016, 51, 560–571. [Google Scholar] [CrossRef]
- Wu, M.T.; Fang, H.; Sun, L.F.; Shi, X.Y.; Tang, D.J. Variations in precipitation pathways of Mesoproterozoic shallow seawater carbonates from North China Platform: Response in seawater redox fluctuations. J. Palaeogeogr. 2021, 23, 703–722. [Google Scholar] [CrossRef]
- Wang, H.L.; Zhang, Z.H.; Liang, J.T.; Liu, H.M.; Shi, S.G. Application of elemental geochemistry in high-frequency sequence-Stratigraphic analysis of lacustrine shale. Minerals 2021, 11, 657. [Google Scholar] [CrossRef]
- Peng, N.; Li, J.H.; Chen, M.P. Geochemical characters and depositional environment of the Mesoproterozoic Gaoyuzhuang formation in Kuancheng county, Hebei province. Geol. Resour. 2009, 18, 298–303+255. [Google Scholar] [CrossRef]
- Kumari, V.; Tandon, S.; Kumar, N.; Ghatak, A. Implications of a geochemical approach to reconstruct the Maastrichtian–Danian seaways of central India: The planktic foraminifera-bearing Jhilmili intertrappean revisited. Cretac. Res. 2023, 151, 105627. [Google Scholar] [CrossRef]
- Chen, H.F.; Yeh, P.Y.; Song, S.R.; Hsu, S.C.; Yang, T.N.; Wang, Y.; Chi, Z.Q.; Lee, T.Q.; Chen, M.T.; Cheng, C.L.; et al. The Ti/Al molar ratio as a new proxy for tracing sediment transportation processes and its application in aeolian events and sea level change in East Asia. J. Asian Earth Sci. 2013, 73, 31–38. [Google Scholar] [CrossRef]
- Shi, H.; Li, Z.X.; Peng, B.; Sun, Y.Q.; Zhang, H.; Yang, Y.J.; Hu, J.J.; Fang, X.X.; Wei, X.J. The tectonic setting, material source and paleoenvironment of the Upper Carboniferous Keluke Formation in the Ounan Depression of the eastern Qaidam Basin: Evidence from element geochemistry of fine-grained sedimentary rocks. Nat. Gas. Geosci. 2022, 33, 1554–1570. Available online: http://www.nggs.ac.cn/EN/abstract/article/1672-1926/5475 (accessed on 13 March 2025).
- Borg, L.E.; Banner, J.L. Neodymium and strontium isotopic constraints on soil sources in Barbados, West Indies. Geochim. Cosmochim. Acta 1996, 60, 4193–4206. [Google Scholar] [CrossRef]
- Allegre, C.J.; Minster, J.F. Quantitative models of trace element behavior in magmatic processes. Earth Planet. Sci. Lett. 1978, 38, 1–25. [Google Scholar] [CrossRef]
- McLennan, S.M.; Hemming, S.; McDaniel, D.K.; Hanson, G.N. Geochemical approaches to sedimentation, provenance, and tectonics. In Processes Controlling the Composition of Clastic Sediments; Geological Society of America: Boulder, CO, USA, 1993. [Google Scholar] [CrossRef]
- Ganeshram, R.S.; Calvert, S.E.; Pedersen, T.F.; Cowie, G.L. Factors controlling the burial of organic carbon in laminated and bioturbated sediments off NW Mexico: Implications for hydrocarbon preservation. Geochim. Cosmochim. Acta 1999, 63, 1723–1734. [Google Scholar] [CrossRef]
- Taylor, S.R.; McLennan, S.M. The Continental Crust: Its Composition and Evolution. 1985. Available online: https://commons.library.stonybrook.edu/geo-articles/12 (accessed on 13 March 2025).
- Verma, M.; Kanhaiya, S.; Singh, B.P.; Singh, S. Signatures of provenance, tectonics and chemical weathering in the Tawi River sediments of the western Himalayan Foreland, India. J. Sediment. Environ. 2022, 7, 425–441. [Google Scholar] [CrossRef]
- Zhang, K. Redox Evolution in the Early Mesoproterozoic Yanliao Seaand its Relationship with the Eukaryote Evolution. Chin. Acad. Geol. Sci. 2018. [Google Scholar] [CrossRef]
- Li, R.W.; Chen, J.S.; Zhang, S.K. Stable carbon and oxygen isotopic compositions of carbonates in middle Mesoproterozoic Wumishan Formation and sea-level change. Chin. Sci. Bull. 1999, 44, 2130–2136. [Google Scholar] [CrossRef]
- Kuang, H.W.; Liu, Y.Q.; Li, J.H.; Peng, N.; Luo, S.S.; Cen, C. Carbon and oxygen isotopic stratigraphy of Mesoproterozoic carbonate sequences (1.6–1.4 Ga) from Yanshan in North China. Int. J. Oceanogr. 2011, 410621. [Google Scholar] [CrossRef]
- Nothdurft, L.D.; Webb, G.E.; Kamber, B.S. Rare earth element geochemistry of Late Devonian reefal carbonates, Canning Basin, Western Australia: Confirmation of a seawater REE proxy in ancient limestones. Geochim. Cosmochim. Acta 2004, 68, 263–283. [Google Scholar] [CrossRef]
- Li, H.; Li, F.; Gong, Q.L.; Zeng, K.; Deng, J.T.; Wang, H.Z.; Su, C.P. Morphological characteristics and provenance significance of heavy minerals in the mixed siliciclastic-carbonate sedimentation: A case study from the Xiannüdong Formation, Cambrian (Series 2), northern Sichuan. Acta Sedimentol. Sin. 2021, 39, 525–539. [Google Scholar] [CrossRef]
- Xu, H.; Liu, Y.Q.; Kuang, H.W.; Peng, N.; Ding, J.X.; Du, Y.; Yuan, T.Y. Theoretical System and Research Progress of Eolian Deposits. Acta Sedimentol. Sin. 2023, 41, 1681–1713. [Google Scholar] [CrossRef]
- Xiao, C.H.; Wang, Y.H.; Lin, J. Provenance and paleoclimate of sediments in the Parece Vela Basin in past 1 Ma: Inferences from grain-size and clay mineral distribution. Acta Sedimentol. Sin. 2022, 40, 508–524. [Google Scholar] [CrossRef]
- Zhu, X.; Jiang, F.Q.; Feng, X.G.; Dong, J.; Liu, C.T.; Wang, H.L.; Li, A.C. The provenance and transportation of quartz in the Philippines Sea. Oceanol. Limnol. Sin. 2018, 49, 1190–1202. [Google Scholar] [CrossRef]
- Deng, J.F.; Wu, Z.X.; Zhao, G.C.; Zhao, H.L.; Luo, Z.H.; Mo, X.X. Precambrian granitic rocks, continental crustal evolution and craton formation of the North China Platform. Acta Petrol. Sin. 1999, 15, 190–198. [Google Scholar] [CrossRef]
- Geng, Y.S.; Kuang, H.W.; Du, L.L.; Liu, Y.Q. The characteristics of Meso-Neoproterozoic magmatic rocks in North China, South China and Tarim blocks and their significance of geological correlation. Acta Petrol. Sin. 2020, 36, 2276–2312. [Google Scholar] [CrossRef]
- Wang, G.H.; Wang, Z.Z.; Yan, C.M. A survey of the genesis classification and geochemical diagram discrimination of granite. Yunnan Geol. 2019, 38, 28–37. [Google Scholar] [CrossRef]
- Shi, C.Y.; Yan, M.C.; Chi, Q.H. Abundances of chemical elements of the granitoids in different geotectonic units of China and their characteristics. Front. Earth Sci. China 2007, 1, 309–321. [Google Scholar] [CrossRef]
- Zhou, Y.Q.; Wu, Z.P.; Shi, B.Q. Applications of neutron activation analysis in sequence stratigraphy. Earth Sci. Front. 1998, 5, 143–149. Available online: https://www.earthsciencefrontiers.net.cn/CN/Y1998/V5/I1/0 (accessed on 9 March 2025).
- Cheng, H.D.; Ma, H.Z. Seawater Composition Constraints on the Marine Potash Evaporites During the Phanerozoic. Bull. Mineral. Petrol. Geochem. 2013, 32, 609–618. Available online: https://www.researchgate.net/publication/318787801 (accessed on 13 March 2025).
- Berner, R.A. A model for calcium, magnesium and sulfate in seawater over Phanerozoic time. Am. J. Sci. 2004, 304, 438–453. Available online: https://ajsonline.org/article/61724.pdf (accessed on 13 March 2025). [CrossRef]
- Hardie, L.A. Secular variation in seawater chemistry: An explanation for the coupled secular variation in the mineralogies of marine limestones and potash evaporites over the past 600my. Geology 1996, 24, 279–283. Available online: https://pubs.geoscienceworld.org/gsa/geology/article-abstract/24/3/279/206498 (accessed on 13 March 2025). [CrossRef]
- Shen, R.P.; Hu, C.Y.; Ma, Z.W.; Li, N.; Yan, J.X. Biogeochemical interpretation of the permian of Tieqiao section in Laibin, Guangxi. J. Palaeogeogr. 2010, 12, 194–201. Available online: http://www.gdlxb.cn/CN/10.7605/gdlxb.2010.02.007 (accessed on 9 March 2025).
- Piper, J.D.A. Continental velocity through Precambrian times: The link to magmatism, crustal accretion and episodes of global cooling. Geosci. Front. 2013, 4, 7–36. [Google Scholar] [CrossRef]
- Ripperdan, R.L. Stratigraphic variation in marine carbonate carbon isotope ratios. Rev. Mineral. Geochem. 2001, 43, 637–662. [Google Scholar] [CrossRef]
- Meyer, E.E.; Quicksall, A.N.; Landis, J.D.; Link, P.K.; Bostick, B.C. Trace and rare earth elemental investigation of a Sturtian cap carbonate, Pocatello, Idaho: Evidence for ocean redox conditions before and during carbonate deposition. Precambrian Res. 2012, 192, 89–106. [Google Scholar] [CrossRef]
- Grotzinger, J.P.; James, N.P. Precambrian carbonates: Evolution of understanding. In Carbonate Sedimentation and Diagenesis in the Evolving Precambrian World; SEPM Special Publication: Tulsa, Oklahoma, 2000. [Google Scholar]
- Fischer, A.G. The two Phanerozoic supercycles. In Predicting Coastal Variations in Non-Storm Conditions with Machine Learning; Princeton University: Princeton, NJ, USA, 1984; pp. 129–150. [Google Scholar] [CrossRef]
- Beckmann, B.; Flögel, S.; Hofmann, P.; Schulz, M.; Wagner, T. Orbital forcing of Cretaceous river discharge in tropical Africa and ocean response. Nature 2005, 437, 241–244. [Google Scholar] [CrossRef]
- Zhang, S.C.; Wang, X.M.; Hammarlund, E.U.; Wang, H.J.; Costa, M.M.; Bjerrum, C.J.; Connelly, J.N.; Zhang, B.M.; Bian, L.Z.; Canfield, D.E. Orbital forcing of climate 1.4 billion years ago. Proc. Natl. Acad. Sci. USA 2015, 112, E1406–E1413. [Google Scholar] [CrossRef]
- Ma, Q.; Zhou, Y.Q.; Cao, M.C.; Yin, X.C. Records and Research Progress of Earth’s Orbital Parameters in Precambrian Strata. Geol. Rev. 2022, 68, 293–308. [Google Scholar] [CrossRef]
- Berger, A.; Loutre, M.F. Astronomical forcing through geological time. In Orbital Forcing and Cyclic Sequences; de Boer, P.L., Smith, D.G., Eds.; Wiley: Hoboken, NJ, USA, 1994; pp. 15–24. [Google Scholar] [CrossRef]
- Muller, R.A.; MacDonald, G.J. Ice Ages and Astronomical Causes: Data, Spectral Analysis and Mechanisms; Springer Science & Business Media: Berlin/Heidelberg, Germany, 2002. [Google Scholar] [CrossRef]
- Pardo-Iguzquiza, E.; Rodríguez-Tovar, F.J. Implemented Lomb-Scargle periodogram: A valuable tool for improving cyclostratigraphic research on unevenly sampled deep-sea stratigraphic sequences. Geo-Mar. Lett. 2011, 31, 537–545. [Google Scholar] [CrossRef]
- Bezverkhnii, V.A. Earth’s obliquity oscillations can influence climate change by driving global volcanic activity. Geosci. Res. 2017, 2, 22–26. [Google Scholar] [CrossRef]
- Schwarzacher, W. Milankovitch cycles in the pre-Pleistocene stratigraphic record: A review. Geol. Soc. Lond. Spec. Publ. 1993, 70, 187–194. [Google Scholar] [CrossRef]
- Pei, J.L.; Yang, Z.Y.; Zhao, Y. A Mesoproterozoic paleomagnetic pole from the Yangzhuang Formation, North China and its tectonics implications. Precambrian Res. 2006, 151, 1–13. [Google Scholar] [CrossRef]


| Depth (m) | (‰) | (%) | (%) | (%) | (%) | (%) | (%) | (%) | (%) | (%) | (%) | Zr (ppm) | V (ppm) | Sc (ppm) | Sr (ppm) | Ba (ppm) | |||
| Yz1-1 | 45 | −0.23 | 0.88 | 15.47 | 0.01 | 0.40 | 0.04 | 19.10 | 24.80 | 0.43 | 0.42 | 0.014 | 29.87 | 8.32 | 1.71 | 44.00 | 457 | ||
| Yz1-2 | 95 | −0.32 | |||||||||||||||||
| Yz1-3 | 145 | −0.13 | 2.13 | 18.87 | 0.01 | 0.76 | 0.07 | 18.14 | 22.92 | 0.57 | 0.94 | 0.019 | 41.72 | 17.20 | 2.90 | 66.46 | 1612 | ||
| Yz1-4 | 195 | −0.14 | |||||||||||||||||
| Yz1-5 | 205 | −0.11 | |||||||||||||||||
| Yz2-1 | 257 | −1.30 | 4.18 | 29.13 | 0.05 | 2.40 | 0.13 | 16.28 | 17.91 | 0.43 | 1.45 | 0.022 | 84.91 | 22.28 | 4.64 | 102.23 | 2361 | ||
| Yz2-2 | 285 | −1.30 | |||||||||||||||||
| Yz2-3 | 320 | −1.32 | |||||||||||||||||
| Yz2-4 | 373 | −1.24 | 4.86 | 29.67 | 0.04 | 2.81 | 0.15 | 16.46 | 16.41 | 0.43 | 2.34 | 0.020 | 69.98 | 25.10 | 5.74 | 79.48 | 1225 | ||
| Yz2-5 | 425 | −1.28 | |||||||||||||||||
| Yz3-1 | 452 | −0.22 | 5.15 | 26.88 | 0.01 | 2.75 | 0.18 | 16.99 | 17.58 | 0.86 | 1.74 | 0.016 | 82.69 | 22.42 | 7.69 | 47.62 | 603 | ||
| Yz3-2 | 462 | −0.12 | 2.55 | 24.57 | 0.04 | 1.32 | 0.08 | 17.39 | 21.77 | 0.57 | 0.95 | 0.016 | 43.94 | 17.48 | 3.30 | 70.97 | 1812 | ||
| Yz3-3 | 472 | −0.05 | 2.94 | 21.47 | 0.04 | 1.48 | 0.10 | 17.47 | 21.23 | 0.57 | 1.47 | 0.016 | 45.66 | 20.30 | 3.92 | 58.86 | 816 | ||
| Yz3-4 | 482 | −0.06 | 2.43 | 22.33 | 0.05 | 1.27 | 0.08 | 17.08 | 21.79 | 0.43 | 0.88 | 0.016 | 38.63 | 15.51 | 3.43 | 69.35 | 1782 | ||
| Yz3-5 | 492 | −0.14 | 2.85 | 23.40 | 0.05 | 1.49 | 0.09 | 16.85 | 20.79 | 0.57 | 1.25 | 0.016 | 51.84 | 16.07 | 3.77 | 66.18 | 1116 | ||
| Yz3-6 | 502 | −0.15 | 4.00 | 23.35 | 0.10 | 2.04 | 0.14 | 16.99 | 19.98 | 0.72 | 1.32 | 0.017 | 59.36 | 19.88 | 5.14 | 59.31 | 1103 | ||
| Yz3-7 | 512 | −0.18 | 2.82 | 21.65 | 0.09 | 1.45 | 0.08 | 17.15 | 21.77 | 0.72 | 0.96 | 0.016 | 48.63 | 17.34 | 3.50 | 63.57 | 907 | ||
| Yz3-8 | 522 | −0.18 | 3.06 | 23.23 | 0.10 | 1.54 | 0.11 | 16.74 | 20.60 | 0.57 | 1.45 | 0.017 | 52.82 | 17.62 | 4.08 | 65.96 | 719 | ||
| Yz3-9 | 532 | −0.21 | 5.17 | 27.65 | 0.00 | 2.96 | 0.17 | 16.54 | 17.23 | 0.86 | 1.62 | 0.016 | 64.92 | 21.99 | 5.88 | 42.95 | 358 | ||
| Yz3-10 | 542 | −0.07 | 3.03 | 21.17 | 0.02 | 1.79 | 0.09 | 17.43 | 21.68 | 0.57 | 0.96 | 0.017 | 55.66 | 17.48 | 4.90 | 68.65 | 910 | ||
| Yz3-11 | 552 | −0.10 | 3.24 | 22.88 | 0.01 | 1.81 | 0.10 | 17.48 | 20.73 | 0.66 | 1.29 | 0.016 | 64.42 | 19.60 | 4.95 | 80.84 | 1584 | ||
| Yz3-12 | 562 | −0.23 | 4.86 | 27.53 | 0.04 | 2.66 | 0.16 | 17.30 | 17.18 | 0.78 | 1.65 | 0.015 | 114.78 | 20.73 | 6.52 | 69.22 | 1185 | ||
| Yz3-13 | 572 | −0.24 | 5.39 | 30.78 | 0.03 | 2.83 | 0.18 | 16.77 | 15.28 | 0.86 | 2.26 | 0.015 | 133.91 | 26.08 | 6.59 | 96.20 | 2103 | ||
| Yz3-14 | 582 | −0.07 | 4.68 | 28.12 | 0.06 | 2.54 | 0.16 | 16.70 | 17.30 | 0.86 | 1.55 | 0.016 | 111.32 | 18.33 | 5.84 | 52.48 | 557 | ||
| Yz3-15 | 592 | −0.25 | 2.88 | 22.89 | 0.06 | 1.58 | 0.09 | 17.08 | 20.8 | 0.43 | 1.4 | 0.020 | 52.58 | 17.06 | 3.42 | 65.34 | 1120 | ||
| Yz3-16 | 602 | −0.11 | 2.12 | 22.11 | 0.07 | 0.71 | 0.06 | 17.75 | 22.04 | 0.43 | 0.8 | 0.022 | 44.06 | 20.73 | 2.47 | 90.34 | 4037 | ||
| Yz3-17 | 612 | −0.06 | 1.92 | 18.17 | 0.01 | 0.68 | 0.07 | 18.82 | 23.31 | 0.57 | 1.03 | 0.021 | 36.9 | 17.34 | 2.87 | 73.70 | 2456 | ||
| Yz3-18 | 622 | −0.1 | 2.47 | 19.14 | 0.01 | 1.42 | 0.08 | 17.87 | 22.56 | 0.57 | 0.88 | 0.020 | 40.73 | 14.95 | 3.43 | 53.53 | 469 | ||
| Yz3-19 | 632 | −0.15 | 2.96 | 21.23 | 0.01 | 1.69 | 0.09 | 17.55 | 21.28 | 0.57 | 1.29 | 0.018 | 46.78 | 20.02 | 4.06 | 68.92 | 1089 | ||
| Yz3-20 | 642 | −0.2 | 2.76 | 20.26 | 0.03 | 1.54 | 0.09 | 17.62 | 21.83 | 0.72 | 0.92 | 0.018 | 43.94 | 19.46 | 4.18 | 83.11 | 2040 | ||
| Yz3-21 | 652 | −0.2 | 2.58 | 19.84 | 0.03 | 1.42 | 0.08 | 17.52 | 22.34 | 0.57 | 1.17 | 0.018 | 50.11 | 21.15 | 4.49 | 84.53 | 1797 | ||
| Yz3-22 | 662 | −0.26 | 3.96 | 23.46 | 0.06 | 2.36 | 0.13 | 16.88 | 19.89 | 0.66 | 1.14 | 0.017 | 72.08 | 20.73 | 5.65 | 86.77 | 1696 | ||
| Yz3-23 | 672 | −0.35 | 2.21 | 18.94 | 0.06 | 1.07 | 0.08 | 17.57 | 23.19 | 0.57 | 0.94 | 0.020 | 36.53 | 18.47 | 3.19 | 74.09 | 1719 | ||
| Yz3-24 | 682 | −0.37 | 2.63 | 22.12 | 0.07 | 1.45 | 0.08 | 17.34 | 21.59 | 0.92 | 1.28 | 0.019 | 54.43 | 21.57 | 3.61 | 80.47 | 2178 | ||
| Yz3-25 | 692 | −0.32 | 5.06 | 36.94 | 0.01 | 3.11 | 0.19 | 14.04 | 15.05 | 0.86 | 1.36 | 0.018 | 91.95 | 29.33 | 5.49 | 134.24 | 3879 | ||
| La (ppm) | Ce (ppm) | Pr (ppm) | Nd (ppm) | Sm (ppm) | Eu (ppm) | Gd (ppm) | Tb (ppm) | Dy (ppm) | Ho (ppm) | Er (ppm) | Tm (ppm) | Yb (ppm) | Lu (ppm) | Y (ppm) | Rb (ppm) | U (ppm) | Th (ppm) | Cu (ppm) | |
| Yz1-1 | 4.72 | 10.41 | 1.15 | 4.14 | 0.75 | 0.19 | 0.69 | 0.12 | 0.66 | 0.12 | 0.36 | 0.06 | 0.38 | 0.06 | 3.63 | 14.64 | 0.67 | 1.89 | 7.36 |
| Yz1-3 | 4.96 | 12.32 | 1.49 | 5.72 | 1.05 | 0.24 | 0.89 | 0.15 | 0.82 | 0.16 | 0.46 | 0.08 | 0.51 | 0.08 | 4.55 | 27.47 | 1.54 | 2.80 | 5.11 |
| Yz2-1 | 8.45 | 20.69 | 2.77 | 10.83 | 2.12 | 0.42 | 1.69 | 0.28 | 1.49 | 0.29 | 0.84 | 0.14 | 0.88 | 0.14 | 8.04 | 60.35 | 1.31 | 4.13 | 4.97 |
| Yz2-4 | 13.93 | 28.71 | 3.49 | 13.04 | 2.35 | 0.47 | 1.94 | 0.31 | 1.75 | 0.34 | 0.96 | 0.16 | 0.98 | 0.15 | 9.29 | 79.14 | 1.63 | 5.02 | 5.72 |
| Yz3-1 | 13.66 | 23.65 | 2.84 | 9.91 | 1.67 | 0.32 | 1.54 | 0.26 | 1.53 | 0.31 | 0.96 | 0.18 | 1.13 | 0.18 | 8.53 | 87.47 | 3.20 | 8.41 | 7.63 |
| Yz3-2 | 7.51 | 16.15 | 2.05 | 7.60 | 1.40 | 0.26 | 1.18 | 0.20 | 1.06 | 0.21 | 0.57 | 0.10 | 0.64 | 0.11 | 5.80 | 38.53 | 1.52 | 2.94 | 8.98 |
| Yz3-3 | 9.43 | 17.52 | 2.08 | 7.43 | 1.37 | 0.29 | 1.17 | 0.19 | 1.07 | 0.21 | 0.60 | 0.11 | 0.68 | 0.11 | 5.99 | 50.71 | 2.09 | 3.69 | 5.25 |
| Yz3-4 | 5.36 | 13.11 | 1.68 | 6.45 | 1.20 | 0.26 | 1.07 | 0.18 | 0.95 | 0.18 | 0.54 | 0.10 | 0.60 | 0.09 | 5.30 | 39.33 | 1.47 | 2.86 | 7.25 |
| Yz3-5 | 7.65 | 16.52 | 1.98 | 7.24 | 1.31 | 0.28 | 1.12 | 0.18 | 1.04 | 0.21 | 0.58 | 0.11 | 0.67 | 0.11 | 5.53 | 46.97 | 1.88 | 3.50 | 7.89 |
| Yz3-6 | 9.07 | 17.41 | 2.09 | 7.45 | 1.33 | 0.29 | 1.19 | 0.20 | 1.13 | 0.23 | 0.67 | 0.12 | 0.77 | 0.13 | 6.29 | 65.60 | 2.39 | 4.51 | 4.95 |
| Yz3-7 | 8.15 | 15.89 | 1.94 | 7.11 | 1.29 | 0.27 | 1.12 | 0.18 | 1.02 | 0.20 | 0.58 | 0.10 | 0.63 | 0.11 | 5.67 | 45.88 | 1.82 | 3.25 | 4.47 |
| Yz3-8 | 9.66 | 18.47 | 2.24 | 8.41 | 1.56 | 0.31 | 1.30 | 0.21 | 1.20 | 0.23 | 0.69 | 0.12 | 0.75 | 0.12 | 6.45 | 50.40 | 2.07 | 4.06 | 4.67 |
| Yz3-9 | 13.94 | 23.82 | 2.69 | 9.24 | 1.53 | 0.32 | 1.38 | 0.22 | 1.30 | 0.26 | 0.81 | 0.15 | 0.96 | 0.15 | 7.09 | 79.85 | 2.79 | 6.95 | 4.68 |
| Yz3-10 | 9.40 | 19.17 | 2.34 | 8.65 | 1.55 | 0.31 | 1.32 | 0.22 | 1.22 | 0.23 | 0.69 | 0.12 | 0.72 | 0.12 | 6.49 | 50.64 | 1.85 | 4.51 | 4.76 |
| Yz3-11 | 7.27 | 16.80 | 1.97 | 7.32 | 1.42 | 0.28 | 1.21 | 0.21 | 1.15 | 0.23 | 0.66 | 0.12 | 0.72 | 0.12 | 6.42 | 51.25 | 1.94 | 3.90 | 4.96 |
| Yz3-12 | 13.24 | 25.30 | 2.97 | 10.51 | 1.95 | 0.38 | 1.85 | 0.35 | 2.17 | 0.45 | 1.36 | 0.23 | 1.47 | 0.23 | 11.84 | 69.30 | 3.37 | 6.74 | 6.83 |
| Yz3-13 | 13.17 | 26.72 | 3.16 | 11.12 | 2.03 | 0.38 | 1.91 | 0.36 | 2.22 | 0.46 | 1.37 | 0.25 | 1.54 | 0.24 | 12.09 | 77.00 | 3.53 | 6.83 | 9.43 |
| Yz3-14 | 15.49 | 27.20 | 3.15 | 11.22 | 2.04 | 0.39 | 1.95 | 0.37 | 2.18 | 0.45 | 1.35 | 0.24 | 1.49 | 0.23 | 11.70 | 69.64 | 3.35 | 8.08 | 4.78 |
| Yz3-15 | 8.98 | 17.12 | 2.09 | 7.61 | 1.41 | 0.29 | 1.20 | 0.19 | 1.13 | 0.22 | 0.64 | 0.11 | 0.69 | 0.11 | 6.07 | 41.67 | 1.95 | 3.67 | 4.16 |
| Yz3-16 | 2.68 | 8.54 | 1.11 | 4.54 | 0.94 | 0.21 | 0.78 | 0.13 | 0.74 | 0.14 | 0.42 | 0.07 | 0.45 | 0.08 | 4.06 | 24.21 | 1.22 | 2.52 | 3.68 |
| Yz3-17 | 4.45 | 11.24 | 1.42 | 5.44 | 1.09 | 0.24 | 0.86 | 0.14 | 0.79 | 0.15 | 0.44 | 0.08 | 0.47 | 0.08 | 4.30 | 24.58 | 1.49 | 2.54 | 3.93 |
| Yz3-18 | 8.86 | 15.85 | 1.85 | 6.59 | 1.15 | 0.24 | 1.04 | 0.16 | 0.89 | 0.17 | 0.51 | 0.10 | 0.59 | 0.10 | 5.09 | 41.71 | 1.73 | 3.32 | 4.27 |
| Yz3-19 | 9.35 | 19.41 | 2.28 | 8.20 | 1.43 | 0.30 | 1.23 | 0.20 | 1.15 | 0.22 | 0.67 | 0.12 | 0.72 | 0.12 | 6.18 | 50.27 | 2.05 | 3.89 | 4.63 |
| Yz3-20 | 6.15 | 15.44 | 1.97 | 7.35 | 1.34 | 0.25 | 1.06 | 0.18 | 1.04 | 0.20 | 0.60 | 0.11 | 0.69 | 0.11 | 5.72 | 46.82 | 1.82 | 3.43 | 7.40 |
| Yz3-21 | 6.94 | 16.11 | 2.02 | 7.64 | 1.48 | 0.30 | 1.24 | 0.20 | 1.18 | 0.23 | 0.66 | 0.12 | 0.72 | 0.11 | 6.50 | 45.67 | 1.84 | 3.05 | 4.44 |
| Yz3-22 | 10.58 | 21.72 | 2.59 | 9.25 | 1.68 | 0.33 | 1.44 | 0.25 | 1.46 | 0.30 | 0.89 | 0.16 | 1.02 | 0.16 | 8.03 | 63.70 | 2.64 | 5.36 | 4.86 |
| Yz3-23 | 6.43 | 15.49 | 1.87 | 7.04 | 1.30 | 0.28 | 1.14 | 0.18 | 1.03 | 0.19 | 0.56 | 0.09 | 0.60 | 0.09 | 5.63 | 30.47 | 1.39 | 2.86 | 3.99 |
| Yz3-24 | 6.30 | 14.28 | 1.69 | 6.35 | 1.21 | 0.25 | 1.03 | 0.18 | 1.00 | 0.20 | 0.57 | 0.10 | 0.67 | 0.11 | 5.68 | 41.99 | 2.03 | 2.72 | 4.45 |
| Yz3-25 | 4.87 | 12.35 | 1.56 | 6.15 | 1.26 | 0.28 | 1.05 | 0.19 | 1.16 | 0.24 | 0.73 | 0.13 | 0.86 | 0.14 | 6.85 | 69.12 | 2.87 | 3.87 | 4.85 |
| (%) | (%) | (%) | (%) | (%) | |
|---|---|---|---|---|---|
| (%) | 1 | ||||
| (%) | 0.84 | 1 | |||
| (%) | 0.87 | 0.70 | 1 | ||
| (%) | 0.98 | 0.84 | 0.81 | 1 | |
| (%) | 0.99 | 0.86 | 0.85 | 0.97 | 1 |
Disclaimer/Publisher’s Note: The statements, opinions and data contained in all publications are solely those of the individual author(s) and contributor(s) and not of MDPI and/or the editor(s). MDPI and/or the editor(s) disclaim responsibility for any injury to people or property resulting from any ideas, methods, instructions or products referred to in the content. |
© 2025 by the authors. Licensee MDPI, Basel, Switzerland. This article is an open access article distributed under the terms and conditions of the Creative Commons Attribution (CC BY) license (https://creativecommons.org/licenses/by/4.0/).
Share and Cite
Zhang, Y.; Zhou, Y.; Cao, M.; Tian, H.; Yin, X. The Co-Evolution of Paleoclimate, Paleoceanography, and Sedimentation in the Yanshan Basin, North China: Records from the Yangzhuang Formation of the Jixian Section. Minerals 2025, 15, 633. https://doi.org/10.3390/min15060633
Zhang Y, Zhou Y, Cao M, Tian H, Yin X. The Co-Evolution of Paleoclimate, Paleoceanography, and Sedimentation in the Yanshan Basin, North China: Records from the Yangzhuang Formation of the Jixian Section. Minerals. 2025; 15(6):633. https://doi.org/10.3390/min15060633
Chicago/Turabian StyleZhang, Yan, Yaoqi Zhou, Mengchun Cao, Hui Tian, and Xingcheng Yin. 2025. "The Co-Evolution of Paleoclimate, Paleoceanography, and Sedimentation in the Yanshan Basin, North China: Records from the Yangzhuang Formation of the Jixian Section" Minerals 15, no. 6: 633. https://doi.org/10.3390/min15060633
APA StyleZhang, Y., Zhou, Y., Cao, M., Tian, H., & Yin, X. (2025). The Co-Evolution of Paleoclimate, Paleoceanography, and Sedimentation in the Yanshan Basin, North China: Records from the Yangzhuang Formation of the Jixian Section. Minerals, 15(6), 633. https://doi.org/10.3390/min15060633