Article

Enrichment Mechanism and Development Technology of Deep Marine Shale Gas near Denudation Area, SW CHINA: Insights from Petrology, Mineralogy and Seismic Interpretation

1
Chongqing Shale Gas Exploration and Development Co., Ltd., Chongqing 408400, China
2
Gabelli School of Business, Fordham University, Bronx, NY 10458, USA
3
Dongfang Geophysical Exploration Co., Ltd., China National Petroleum Corporation, Zhuozhou 072751, China
4
Geology Exploration and Development Research Institute, Chuanqing Drilling Engineering Co., Ltd., China National Petroleum Corporation, Chengdu 610051, China
*
Author to whom correspondence should be addressed.
Minerals 2025, 15(6), 619; https://doi.org/10.3390/min15060619
Submission received: 10 February 2025 / Revised: 31 March 2025 / Accepted: 8 May 2025 / Published: 9 June 2025
(This article belongs to the Special Issue Element Enrichment and Gas Accumulation in Black Rock Series)

Abstract

As an important target for deep marine shale gas exploration, shale reservoirs near denudation areas have enormous resource potential. Based on the impression method, the sedimentary paleogeomorphology near the denudation area is identified as three units: the first terrace, the second terrace, and the third terrace. At the second terrace where Well Z212 is located, the thickness of the Longmaxi Formation first section is only 0.8 m, and the continuous thickness of the target interval is only 4.3 m, making it a typical thin shale reservoir. By integrating petrology, mineralogy and the seismic method, the thin shale reservoir is characterized. Compared to shale reservoirs far away from the denudation area, the Well Z212 (near denudation area) production interval (Wufeng Formation first section) has high porosity (6%–10%), moderate TOC (3%–4%), a high carbonate mineral content (10%–35%), and a high gas content (>7 m3/t). The correlation between the total porosity of shale and the density of high-frequency laminations is the strongest, indicating that the silt laminations have a positive effect on pore preservation. There is a significant positive correlation between carbonate content and the volume of mesopores and macropores, as well as the porosity of inorganic pores. It is suggested that carbonate minerals are the main carrier of inorganic pores in Well Z212, and the pores are mainly composed of mesopores and macropores. Under the condition of being far away from the fault zone, even near the denudation area, it has good shale gas preservation characteristics. The key development technologies consist of integrated geo-steering technology, acidification, and volume fracking technology. Based on geological characteristics, the fracturing process optimization of Well Z212 has achieved shale reservoir stimulation.

1. Introduction

According to the environment in which shale is formed, the academic community generally divides global shale gas resources into three types: marine, transitional, and terrestrial shale gas [1,2]. The statistical results show that globally, marine shale gas occupies an absolute dominant position in total shale gas production [3,4]. The marine shale gas in North America has many favorable geological conditions, including large continuous thickness, stable distribution, suitable burial depth, and good structural preservation conditions [1,2]. Based on the above conditions, the industrial development of marine shale gas has achieved scale and profitability in the Sichuan Basin of South China, and the supporting key technologies and geological theories are also becoming increasingly satisfactory [5,6]. However, up to now, marine shale gas in southern China has only come from marine shale with a burial depth of less than 3500 m and far from denudation areas [7,8]. The latest geological resource evaluation results indicate that the vast majority of shale gas resources in SW China belong to deep shale gas buried at depths exceeding 3500 m, with an exploration area of 1.2 × 10⁴ km2 and a geological resource volume of 6.6 × 10¹² m3 [9,10,11]. But deep shale gas exploration faces many unfavorable conditions such as proximity to denudation areas and complex structures [9,10,11]. There are few reports on shale gas research under these conditions, and there is a lack of corresponding exploration practices.
Previous studies suggest that shale near denudation zones experiences significant pressure relief, which is detrimental to pore preservation and results in very low gas content [12,13]. In addition, the marine shale in SW China belongs to an old geological age and is buried at a large depth, which can lead to high geostress and large horizontal stress differences. These objective conditions make it difficult to deploy horizontal wells, increase the difficulty of improving drilling encounter rates, and make it difficult to fully transform shale reservoirs. It is urgent to explore corresponding technical systems. In 2023, Chongqing Shale Gas Exploration and Development Co., Ltd. completed the horizontal drilling and subsequent segmented fracturing of Well Z212 near the marine shale denudation area. On 9 March 2024, the well was opened and the draining process started. The pressure was 60.53 MPa. On 21st March, the well began producing shale gas. As of May 30th, a total of 1.44 × 10⁴ m3 of liquid has been discharged, with a backflow rate of 13.82%. The accumulated gas production is 1.72 million cubic meters. Well Z212 has a daily gas production of 12.2 × 10⁴ m3 at a maximum nozzle of 6.5 mm. As of 29th April (3 mm nozzle, pressure controlled production), the daily gas production has stabilized, with an average gas production of 2.61 × 10⁴ m3/d. The casing pressure shows an upward trend, and the geological energy is sufficient, highlighting the potential for high productivity. The success of Well Z212 marks an industrial breakthrough in deep shale gas near the denudation zone, which is expected to develop a large-scale production capacity and become a new exploration field. As a high-yield well, the exploration process and technical system of Well Z212 deserve to be fully summarized.

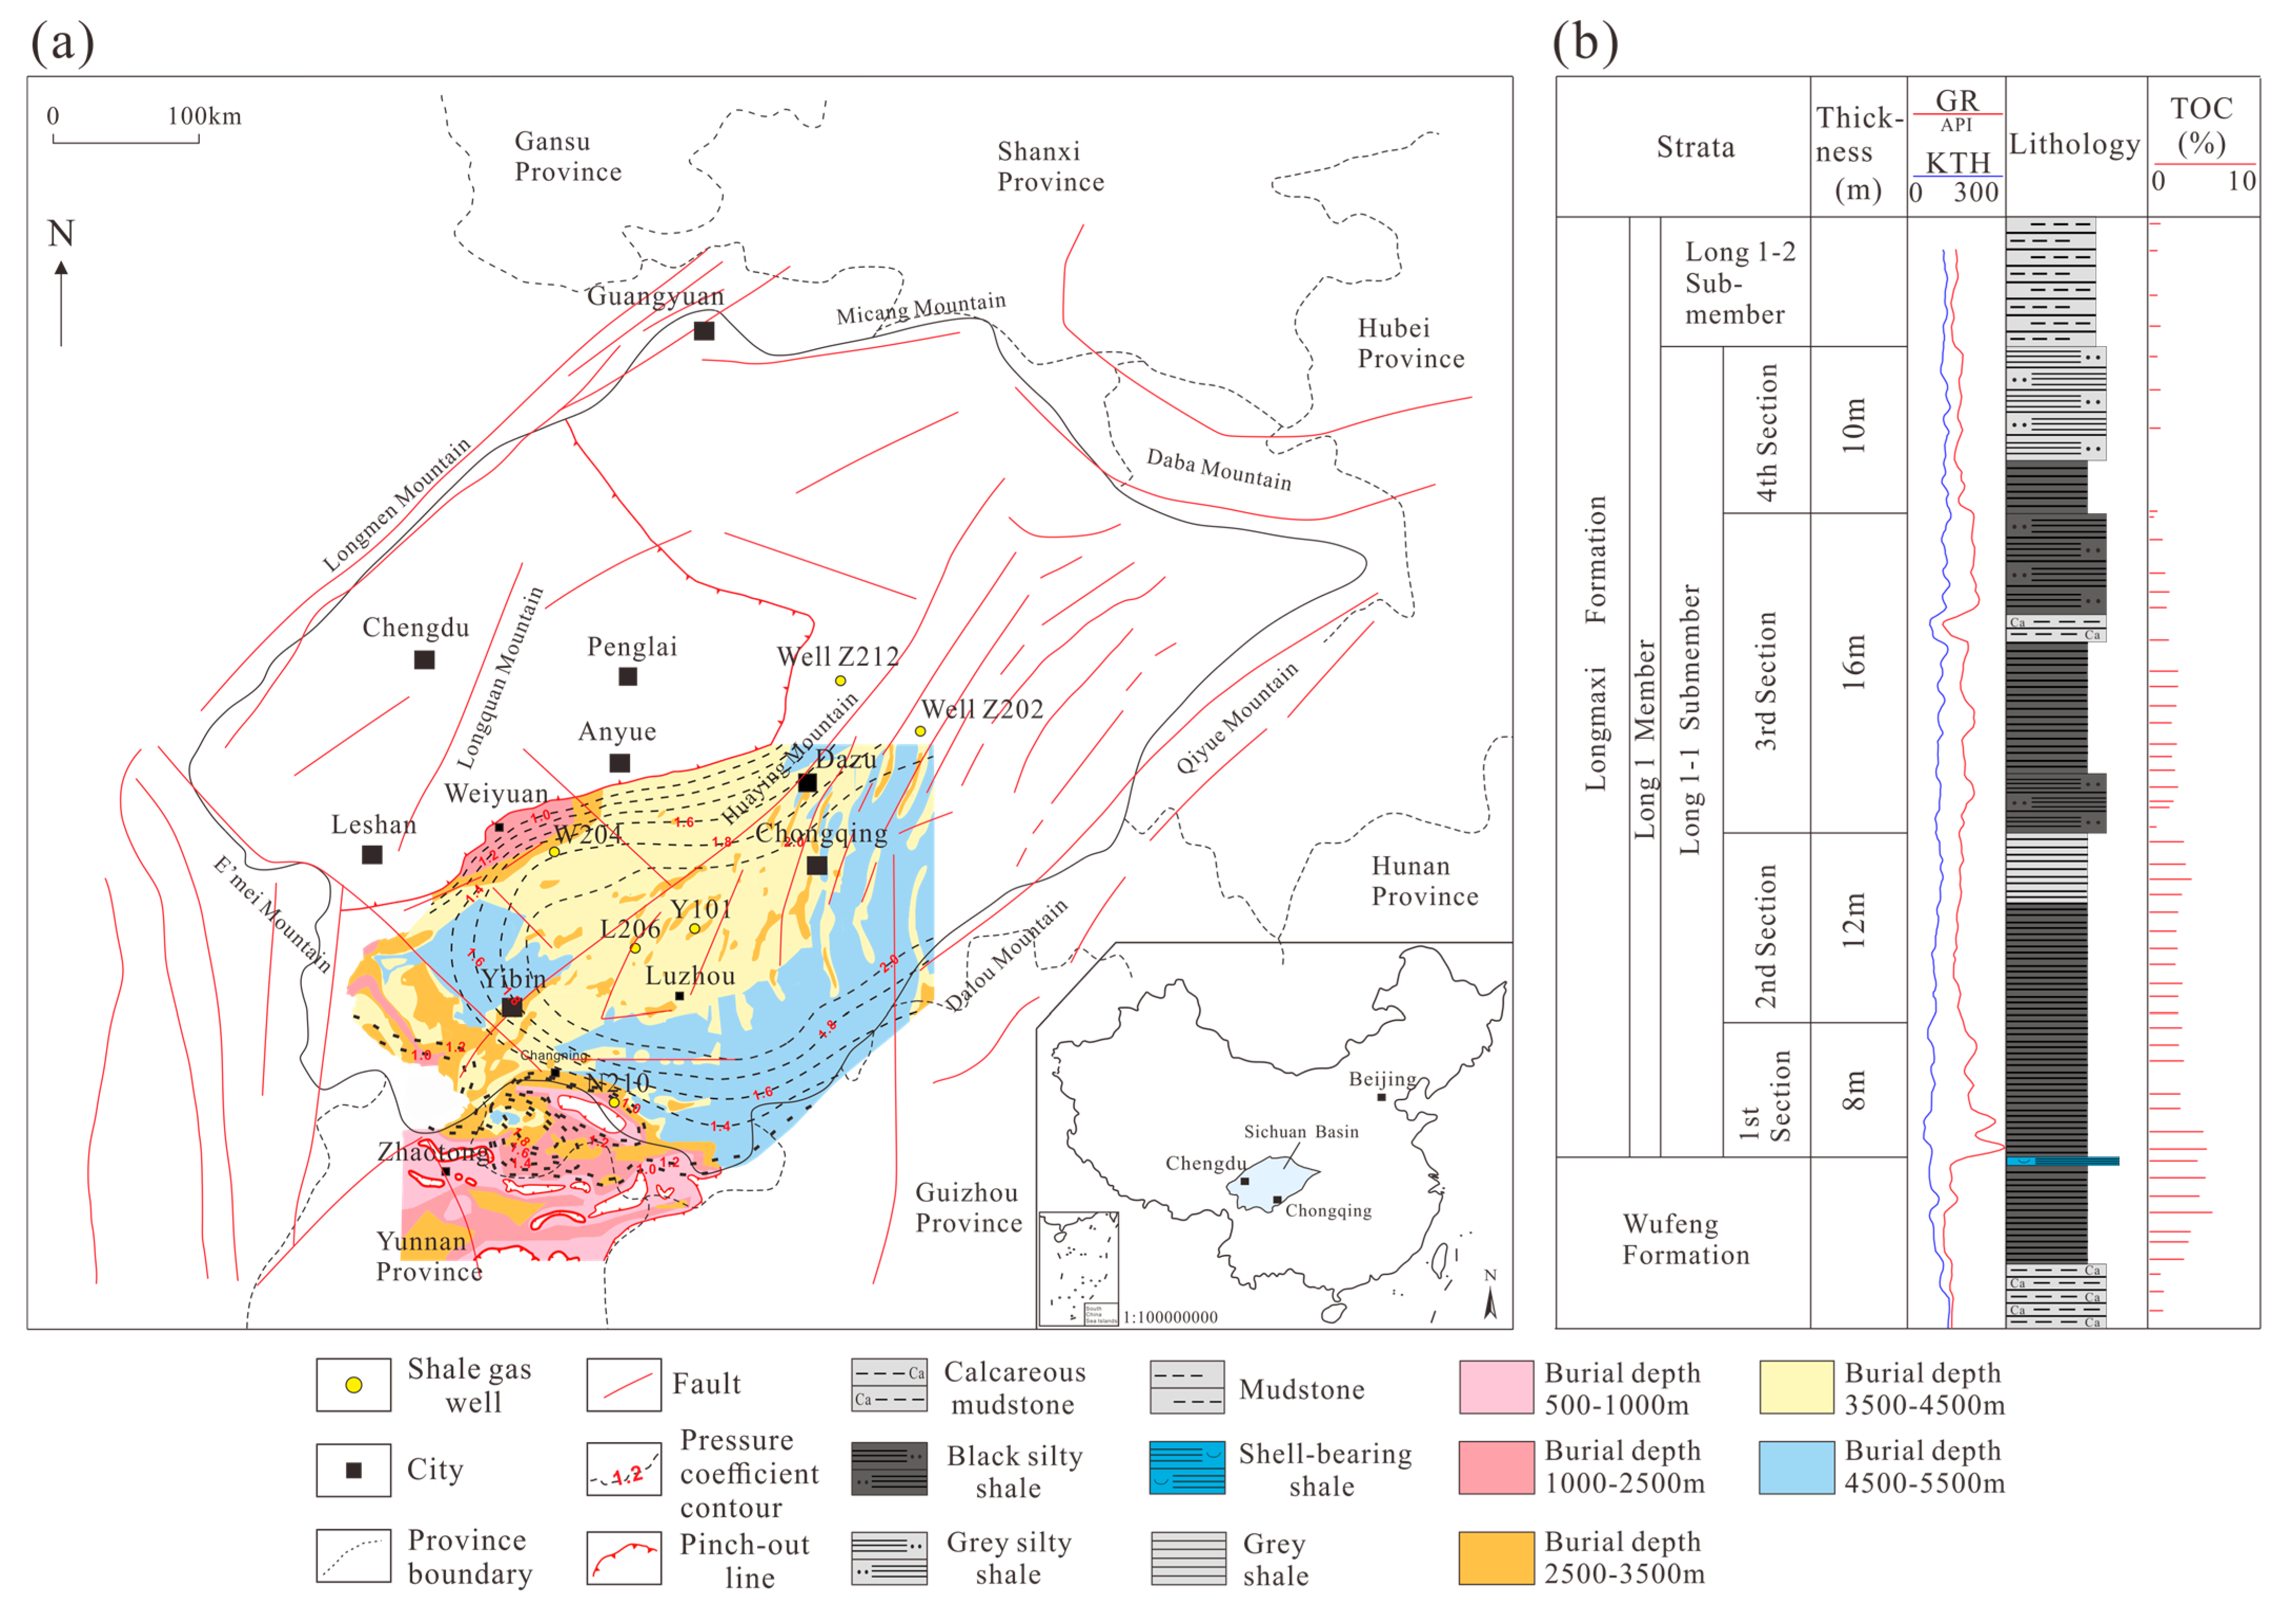
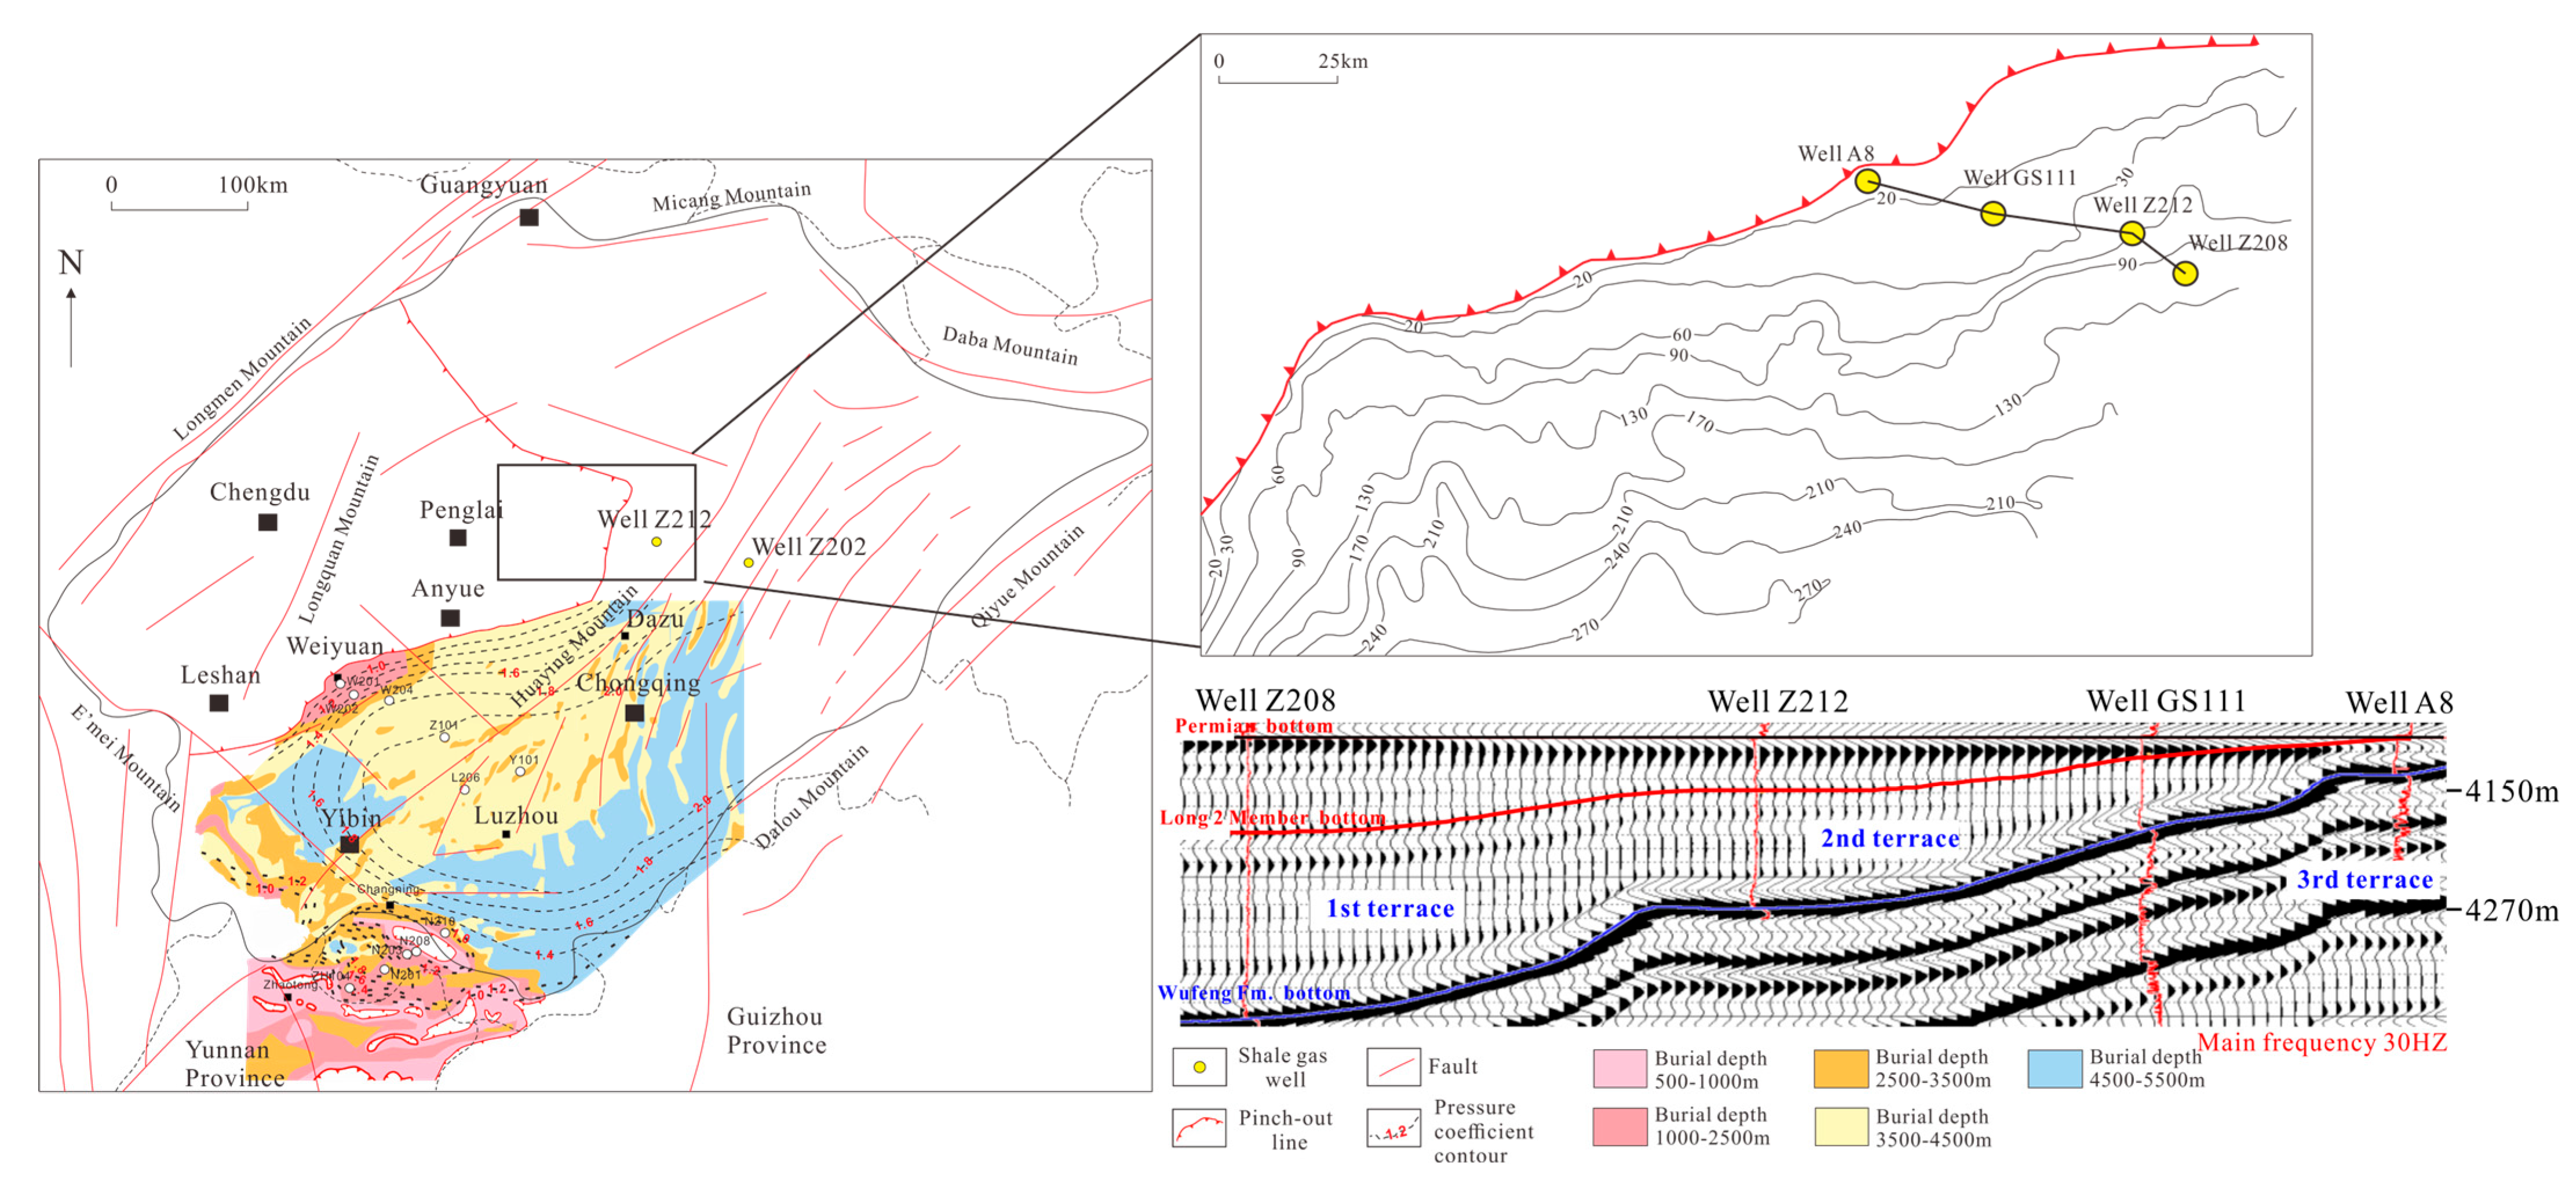
2. Geological Setting

The study area is located in the Sichuan Basin of SW China (Figure 1a). During the Late Ordovician–Early Silurian period, the southern and eastern parts of the Sichuan Basin were dominated by a deep-water shelf environment [1,2]. Against this sedimentary background, the organic-rich shale of Wufeng–Longmaxi Formation was deposited; this is the main target interval for shale gas exploitation in South China. Affected by different tectonic processes [14], heterogeneity was documented in the burial depths of Longmaxi organic-rich shale in the three areas of Zhaotong (<2000 m), Weiyuan (2000–3500 m), and Luzhou (>3500 m) (Figure 1a). Based on the sedimentary cycle, the Longmaxi Formation can be divided into two members from bottom to top: Long 1 Member and Long 2 Member. Among these, Long 1 Member is a progradational reverse cycle of continuous regression and is composed of the Long 1–1 Submember and the Long 1–2 Submember from bottom to top based on lithologic characteristics and the sedimentary cycle. According to the demands of shale gas exploration and exploitation, it is divided into four sections based on petrological characteristics and logging characteristics (Figure 1b).
Under the influence of multiple tectonic movements, there were a series of underwater paleo uplifts during the sedimentary period of organic-rich shale [14]. In order to explore the controlling effect of sedimentary paleogeomorphology on shale reservoirs, two-dimensional and three-dimensional seismic data, as well as shale gas well logging, logging, and coring data, were fully utilized in this study. Based on the impression method for calculating the thickness of the strata, the paleogeomorphology has been restored. Due to the complete identification of the paleogeomorphology in the early stage of the Long 2 Member, the bottom of the Long 2 Member was selected as the overlying marker bed for the impression method. The impression method was the main method used for restoring karst palaeogeomorphology in this study. Additional methods that could be used for palaeogeomorphological restoration include residual-thickness, back-stripping, geophysical, and sedimentological methods [15].
The results show that before the deposition of the Longmaxi Formation, it presented a stepped paleogeomorphology distribution of “high in the north and low in the south”. Based on the thickness and seismic reflection characteristics of the Wufeng Formation–Long 1 Member, three paleogeomorphological units have been identified (Figure 2): the area north of Well GS111 belongs to the third terrace, where the thickness of the Wufeng Formation–Long 1 Member is less than 60 m. The location of Well Z212 belongs to the second terrace, with a thickness of 60–240 m between the Wufeng Formation and Long 1 Member. The sedimentary paleogeomorphology results in a cumulative shale thickness of only 40 m between the Wufeng Formation and Long 1 Member, and the first section of the Longmaxi Formation is only 0.8 m thick, making it a typical thin shale reservoir. The location of Well Z208 is the first terrace, which is the lowest paleogeomorphic unit. The thickness of the Wufeng Formation–Long 1 Member ranges from 240 to 480 m.

3. Materials and Methods

A total of 20 samples of deep marine shale were acquired from drilling cores for SEM analysis, X-ray diffraction and TOC testing. All experiments and measurements were performed in the PetroChina Exploration and Development Research Institute. The whole-rock and clay mineral X-ray diffraction measurements were carried out using a MRD X-ray diffractometer (model X’Pert3, Malvern Panalytical Corporation, Amsterdam, The Netherlands). TOC testing was conducted through a LECO CS230 Series Carbon and Sulfur Analyzer (model CS230, LECO Corporation, San Jose, CA, USA). For scanning electron microscopy (SEM), the samples were first prepared into cubes measuring 20 mm × 20 mm × 10 mm, and then mechanical polishing, argon ion polishing, and short-time gold spraying were carried out successively. The experimental instrument used was an FEI Quanta 650 FEG SEM (FEI Corporation, Hillsboro, OR, USA). In this study, the saturated liquid method was used to measure porosity. The saturated medium was oil (dodecane) and water (deionized water), with high precision (less than 0). We measured the mass of the rock core, the saturated mass of the rock core in air, and the saturated mass of the rock core in a saturated medium using a 1 mg balance. We calculated the total volume and pore volume of the rock core, and then calculated the porosity. Currently, the evaluation of gas content in shale reservoirs is often studied considering two aspects: adsorbed gas and free gas. There have been three main methods for testing shale gas content: the desorption method, isothermal adsorption method, and logging interpretation method. Among them, the desorption method has been the most direct, simple, and convenient to use. The gas content of shale in the desorption method mainly includes desorption gas, residual gas, and loss gas, and the gas content of shale is the sum of the three. The data for analyzing the gas-bearing characteristics of shale in this study come from the desorption method. The formula for calculating the brittleness index is as follows:
Brittleness   index = W ( q u a r t z ) W ( q u a r t z ) + W ( C a r b o n a t e ) + W ( C l a y ) × 100 %
The mercury intrusion capillary pressure (MICP) was measured through a Quantachrome Poremaster (model YG-23A, Antonpaar Quantate Corporation, Boynton Beach, FL, USA). Samples were prepared with an approximate size of 20 × 20 mm2 and weighed out to 10–20 g, and then, the samples were dried at 110 °C for at least 24 h under a vacuum in an oven. The MICP ranged from 0 Mpa to 215 Mpa during this measurement. N2 adsorption experiments (LTNA) were carried out by crushing the sample into a 60–80 mesh, drying it in an oven at 110 °C for 12 h, and then placing it in the Autosorb-IQ3 specific surface and pore size distribution analyzer (model Autosorb-IQ3, Antonpaar Quantate Corporation, Boynton Beach, FL, USA). The pretreatment was completed by degassing at 110 °C for 12 h under vacuum conditions, and then nitrogen adsorption was carried out. After the experiment, the Brunauer–Emmett–Teller (BET) model was used to calculate the specific surface area, and the Barrett–Joyner–Halenda (BJH) model was employed to obtain the pore size distribution and volume. The pore size was divided into three categories according to the pore size classification scheme [16], namely micropores (<2 nm), mesopores (2–50 nm), and macropores (>50 nm).

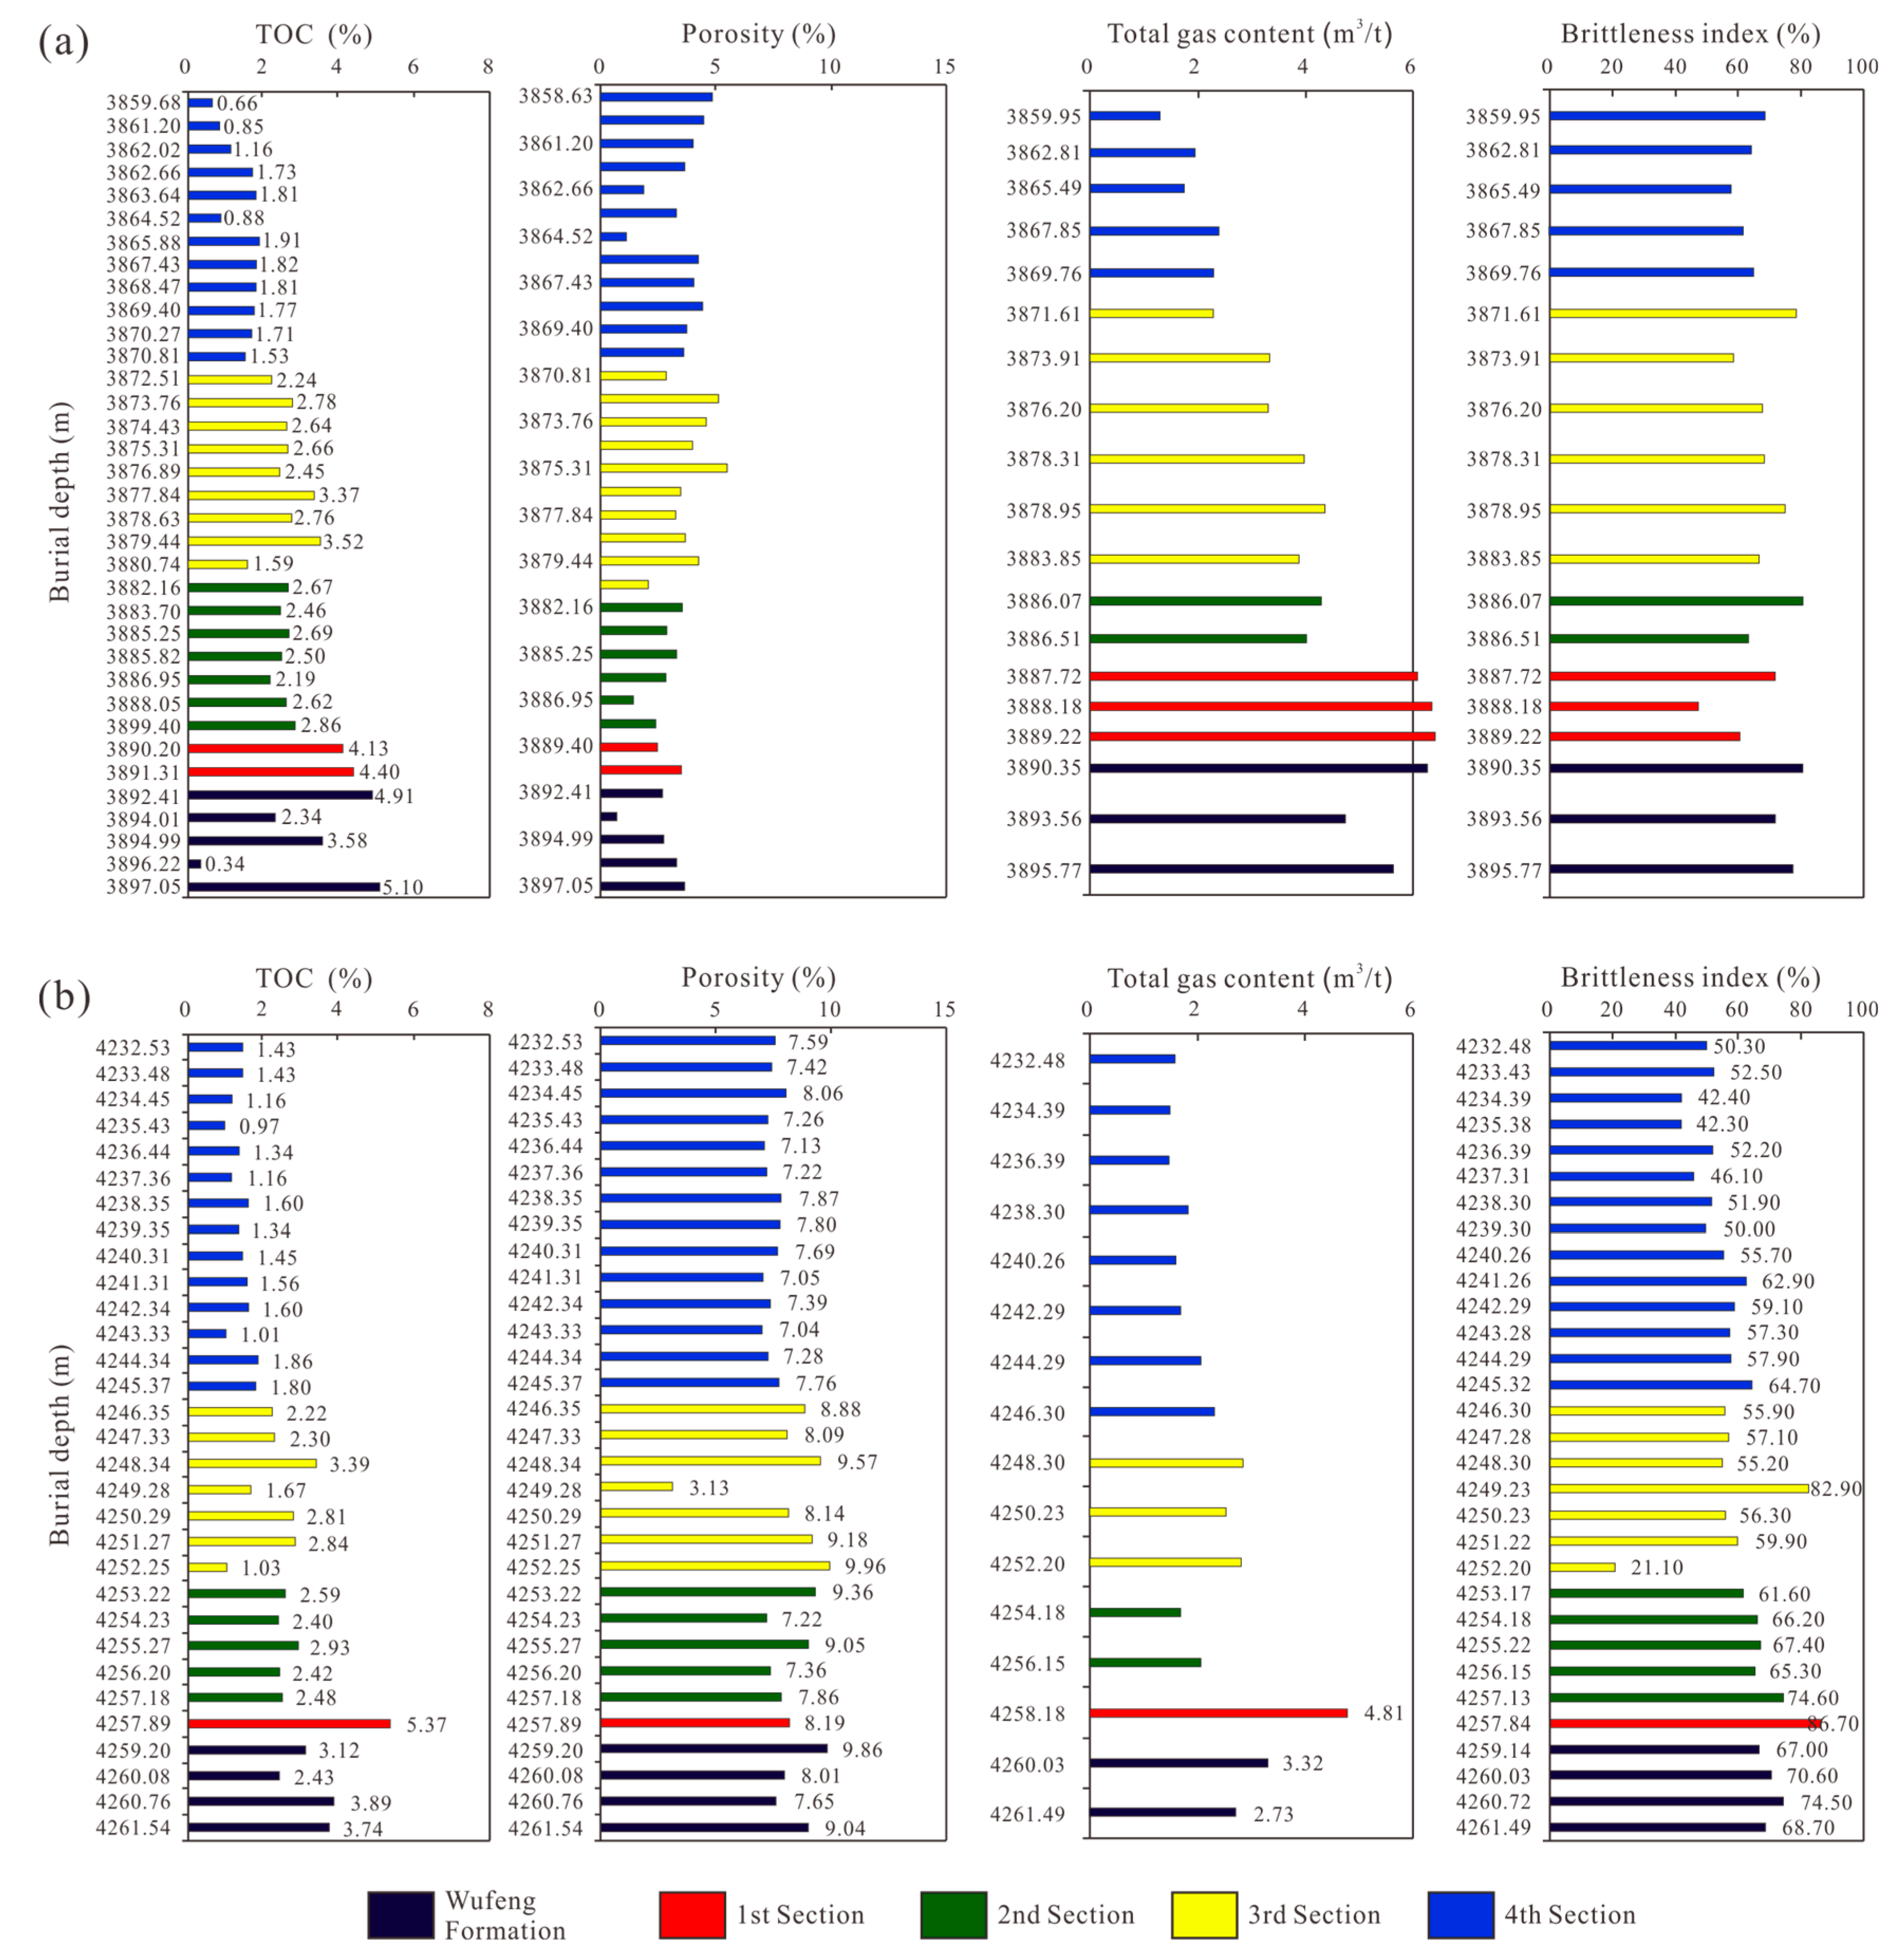
4. Shale Gas Reservoir Characteristics

Porosity is a key parameter that characterizes the storage capacity of a reservoir, while TOC is a key parameter that reflects the shale gas generation and adsorption capacity. The gas content and brittleness index directly reflect the key parameters of shale gas content and hydraulic fracturing ability in shale reservoirs. In order to reflect the characteristics of shale reservoirs near denudation areas, shale gas reservoir parameters far from the denudation area, represented by Well Z202, were used to compare the corresponding parameters near the denudation area (taking Well Z212 as an example). The results indicate that the TOC value of Well Z202 (far from the denudation area) has a gradually decreasing trend in the vertical direction. The 1st section has the highest TOC value, ranging from 2.88% to 5.31%, with an average value greater than 4%. The TOC content of the 2nd section ranges from 1.29% to 4.31%, with an average value greater than 2%. The TOC content of the 3rd section ranges from 0.43% to 3.66%, with an average value close to 2.5%. The fourth section has the lowest TOC content, with a TOC content ranging from 0.28% to 1.92%, with an average value less than 2% (Figure 3). The vertical variation trend of TOC in Well Z212 is the same as that in Well Z202, with the highest TOC value in the first section, reaching an average of 3.93% (Figure 3), reflecting the same trend for sedimentary environment and environmental conditions. The distribution range of denudation areas has no effect on the enrichment of organic matter.
In Well Z202 (far from the denudation area), the porosity of the 1st section is the highest, ranging from 1.77% to 6.12%, with an average value greater than 4%. The porosity of the 2nd section ranges from 1.47% to 5.46%, with an average of 3% to 4%. The porosity of the 3rd section ranges from 1.84% to 6.46% (with an average value greater than 4%). The porosity of the 4th section ranges from 1.17% to 6.48%, with an average of 3.5% to 4%. There is a significant difference in porosity between the upper and lower parts of the Wufeng Formation, ranging from 0.74% to 6.42% overall, with an average value greater than 2%. The porosity of the shale reservoir in Well Z212 ranges from 3.13% to 9.96%. The porosity of the Wufeng Formation 1st section is the highest, with an average value of 8.55%, and the porosity slightly decreases upwards. But overall, the porosity is greater than 6% (Figure 3), which is higher than the parameters of shale gas wells far away from the denudation area, demonstrating superior reservoir quality. In Well Z202 (far from the denudation area), the 1st section has the highest gas content, followed by the 3rd section and 4th section, and the bottom of the Wufeng Formation has the lowest gas content (Figure 3). The total gas content of the 1st section ranges from 3.5 m3/t to 18.86 m3/t, with an average value greater than 6 m3/t. The total gas content of the 2nd section ranges from 2.2 m3/t to 10.23 m3/t, with an average value between 3 m3/t and 6 m3/t. The total gas content of the three layers ranges from 2.19 m3/t to 13.68 m3/t, with an average of 4 m3/t to 6 m3/t. The total gas content of the 4th section ranges from 1.08 m3/t to 7.50 m3/t, with an average value between 2 m3/t and 4 m3/t. In Well Z212, near the denudation area, the overall gas content of the shale reservoir in the Wufeng Formation-Long 1-1 Submember is greater than 7 m3/t, with an average gas content of 12.7 m3/t. The 1st section has the highest gas content, with an average gas content of 19.45 m3/t (Figure 3).
Overall, the brittleness index of each section far away from the denudation area does not show significant changes. The average brittleness index of the 1st section is greater than 60.00%. The average brittleness index of the second section ranges from 47.29% to 69.60%. The average brittleness index of the third section ranges from 37.47% to 69.40%. The average brittleness index of the 4th section ranges from 38.34% to 60.70%. Overall, the brittleness index is relatively high, and vertically from bottom to top, the brittleness index shows an increasing trend (Figure 3). In contrast, the average quartz content in the near-denudation area is 42.7%, the average clay mineral content is 36.9%, and the average carbonate mineral content is 10.2%. The difference in the brittleness index between shale reservoir and Well Z202 is very small. Overall, the Well Z212 (near-denudation area) production interval (Wufeng Formation first section) has high porosity (6%–10%), a moderate TOC content (3%–4%), a high carbonate mineral content (10%–35%), and a high gas content (>7 m3/t).

5. Enrichment Mechanism of Shale Gas

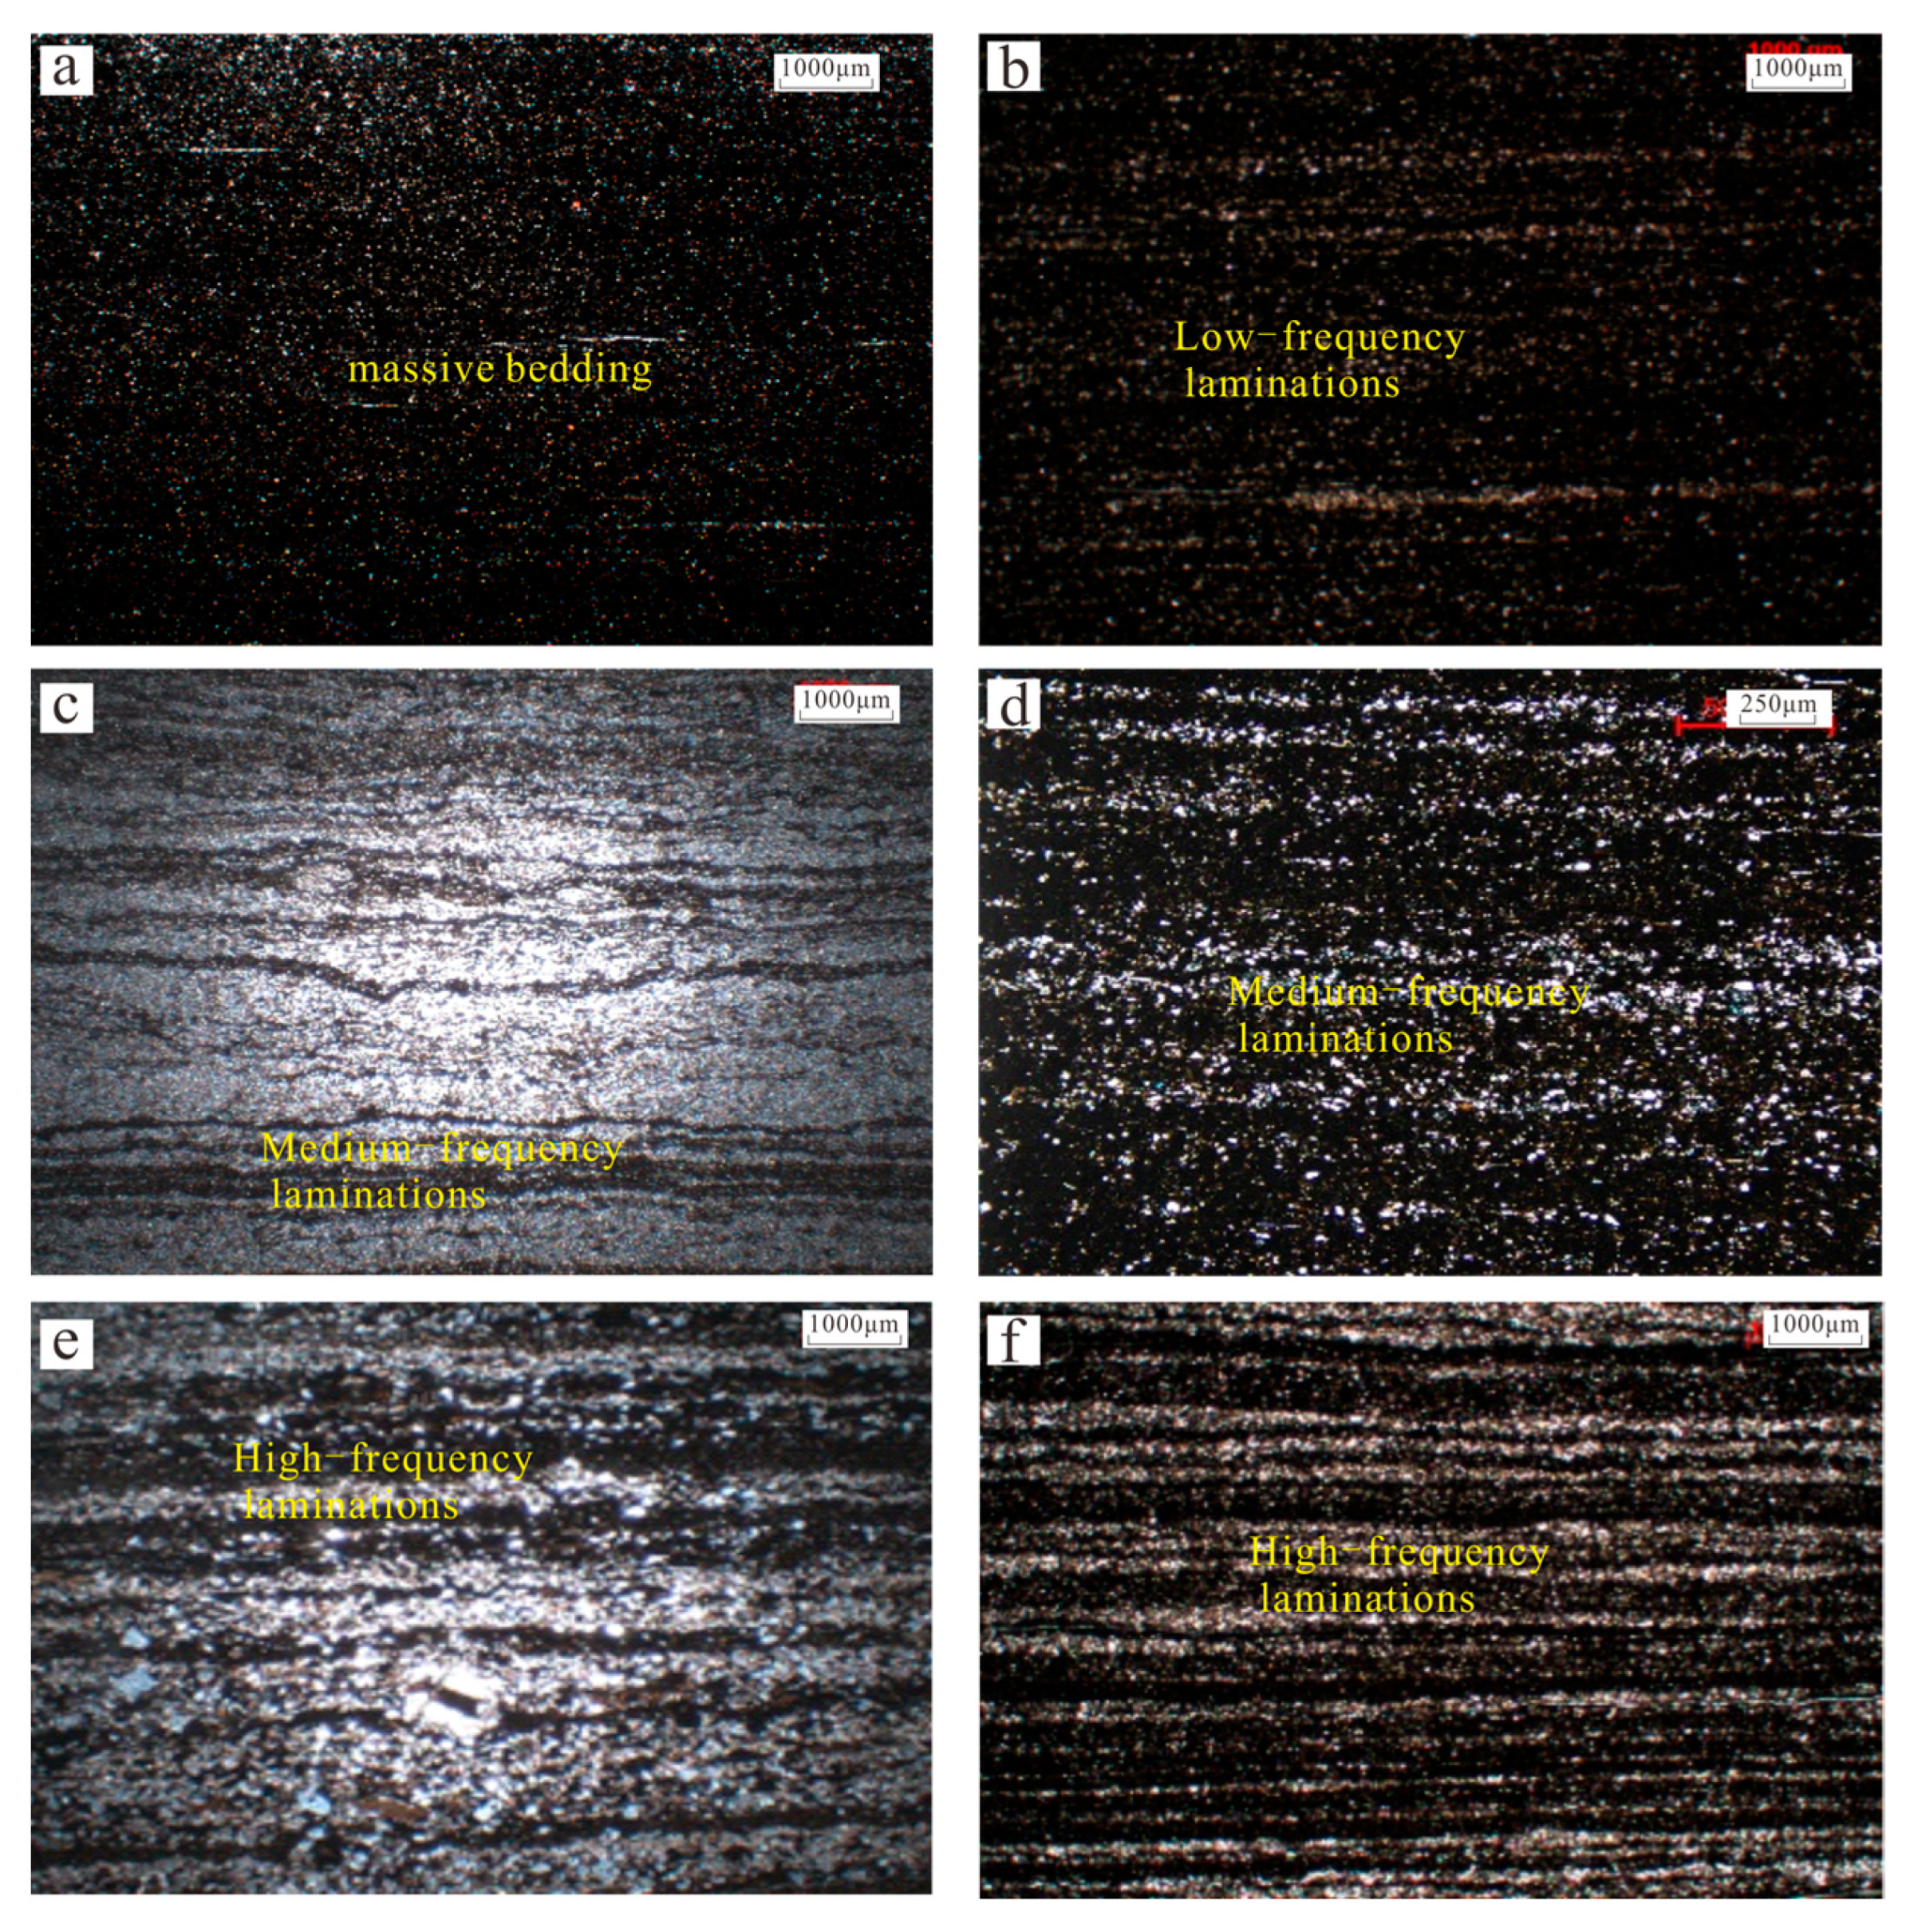
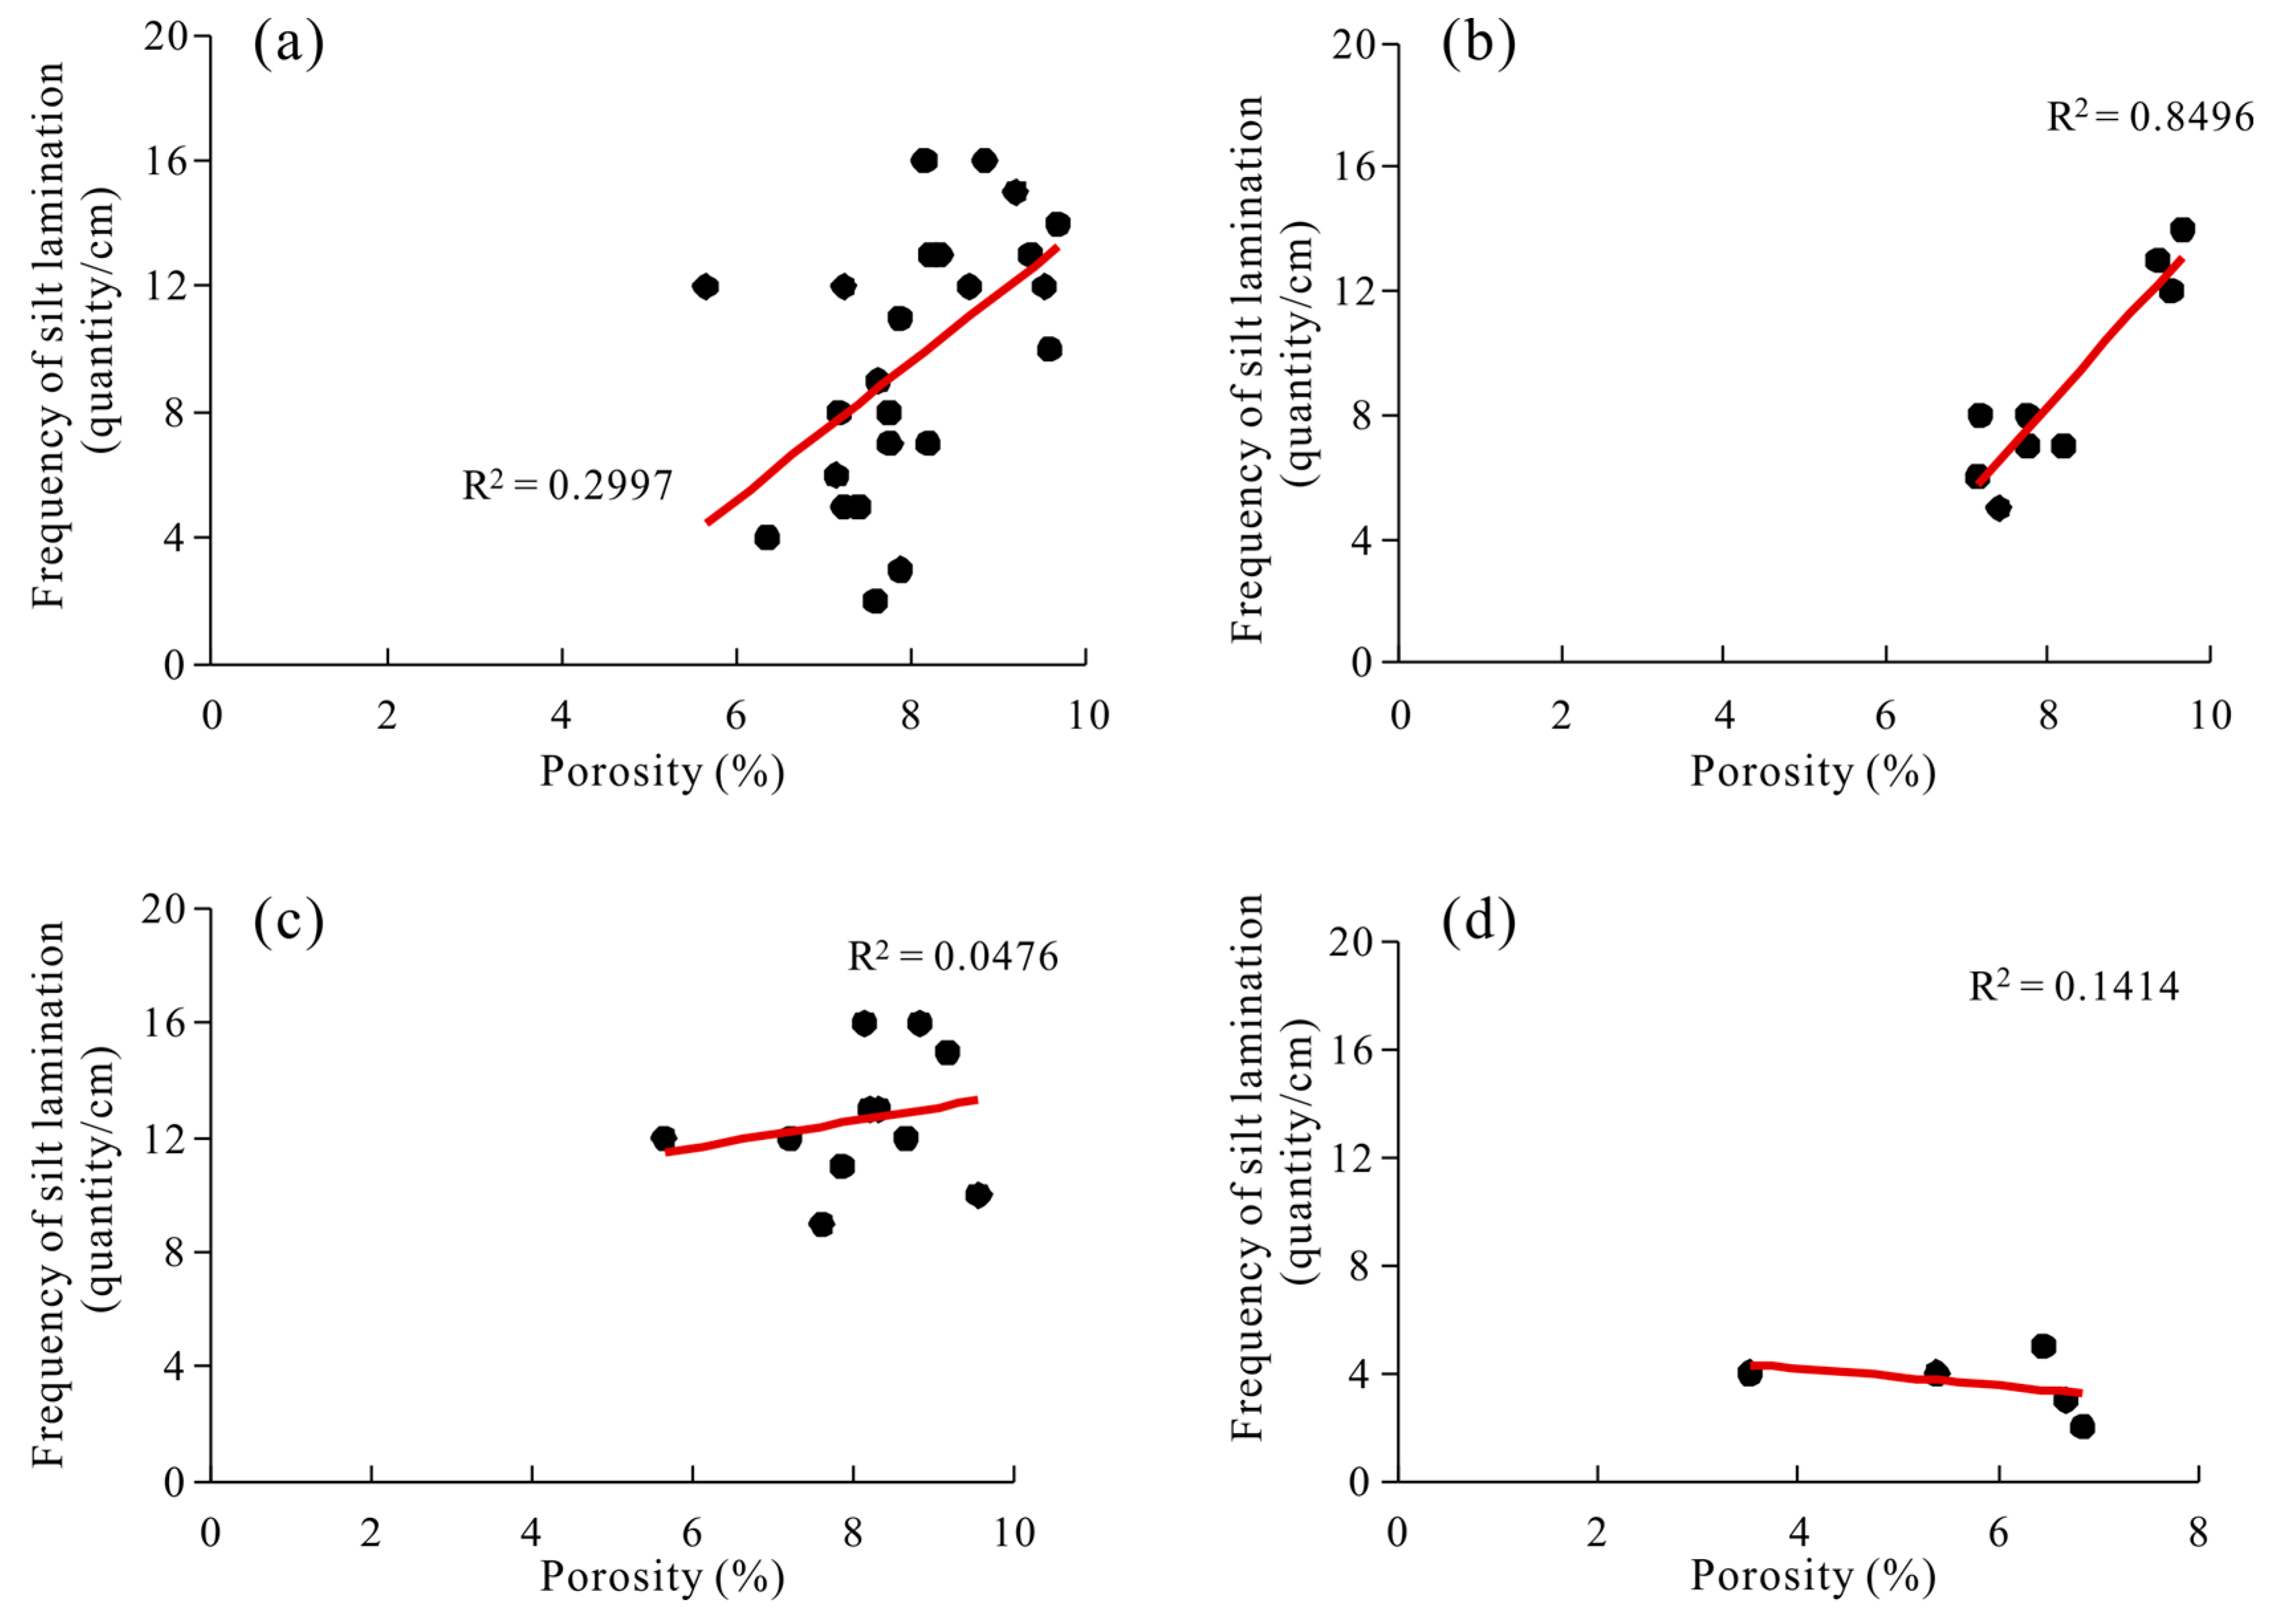
5.1. Controlling Effect of Shale Lamination on Porosity

When hydrodynamic and debris inputs are stable, shale does not have laminations inside, but is composed of blocky bedding (Figure 4a). When environmental conditions such as hydrodynamics and debris input change, shale reservoirs form laminations inside. The development characteristics of shale laminations greatly affect the reservoir quality of shale. According to the composition of the laminations, they can be divided into mud laminations (with a mud content greater than 50%) and silt laminations (with a silt particle content greater than 50%) [17]. According to the combination characteristics of mud and silt laminations, they can be further divided into three types, including low-frequency lamination (with sand laminations accounting for less than 25%) (Figure 4b), medium-frequency lamination (with sand laminations accounting for 25% to 75%) (Figure 4c,d), and high-frequency lamination (with sand laminations accounting for more than 75%) [18].
The 2nd terrace where Well Z212 is located has strong sedimentary dynamics during the sedimentation period of the Wufeng Formation-1st section, with a high content of silt particles with large particle sizes, and a high frequency of silt laminations, belonging to high-frequency lamination (Figure 4e,f). Towards the direction of the 1st terrace, the thickness of the mud lamination gradually increases, and the frequency of the lamination gradually becomes a low, even, massive bedding (Figure 4a,b). Based on thin-section identification, the key relationship between lamination frequency and porosity was statistically analyzed. The results showed a positive correlation between the density of silt laminations and porosity (Figure 5a), and the density of silt laminations in high-frequency laminations was most significantly correlated with porosity (Figure 5b), while the density of silt laminations in medium-frequency lamination combinations was not correlated with porosity (Figure 5c). This indicates that the large-sized silt particles in the silt lamination can serve as a supporting framework, giving shale reservoirs stronger resistance to compaction and a significant positive effect on pore preservation.

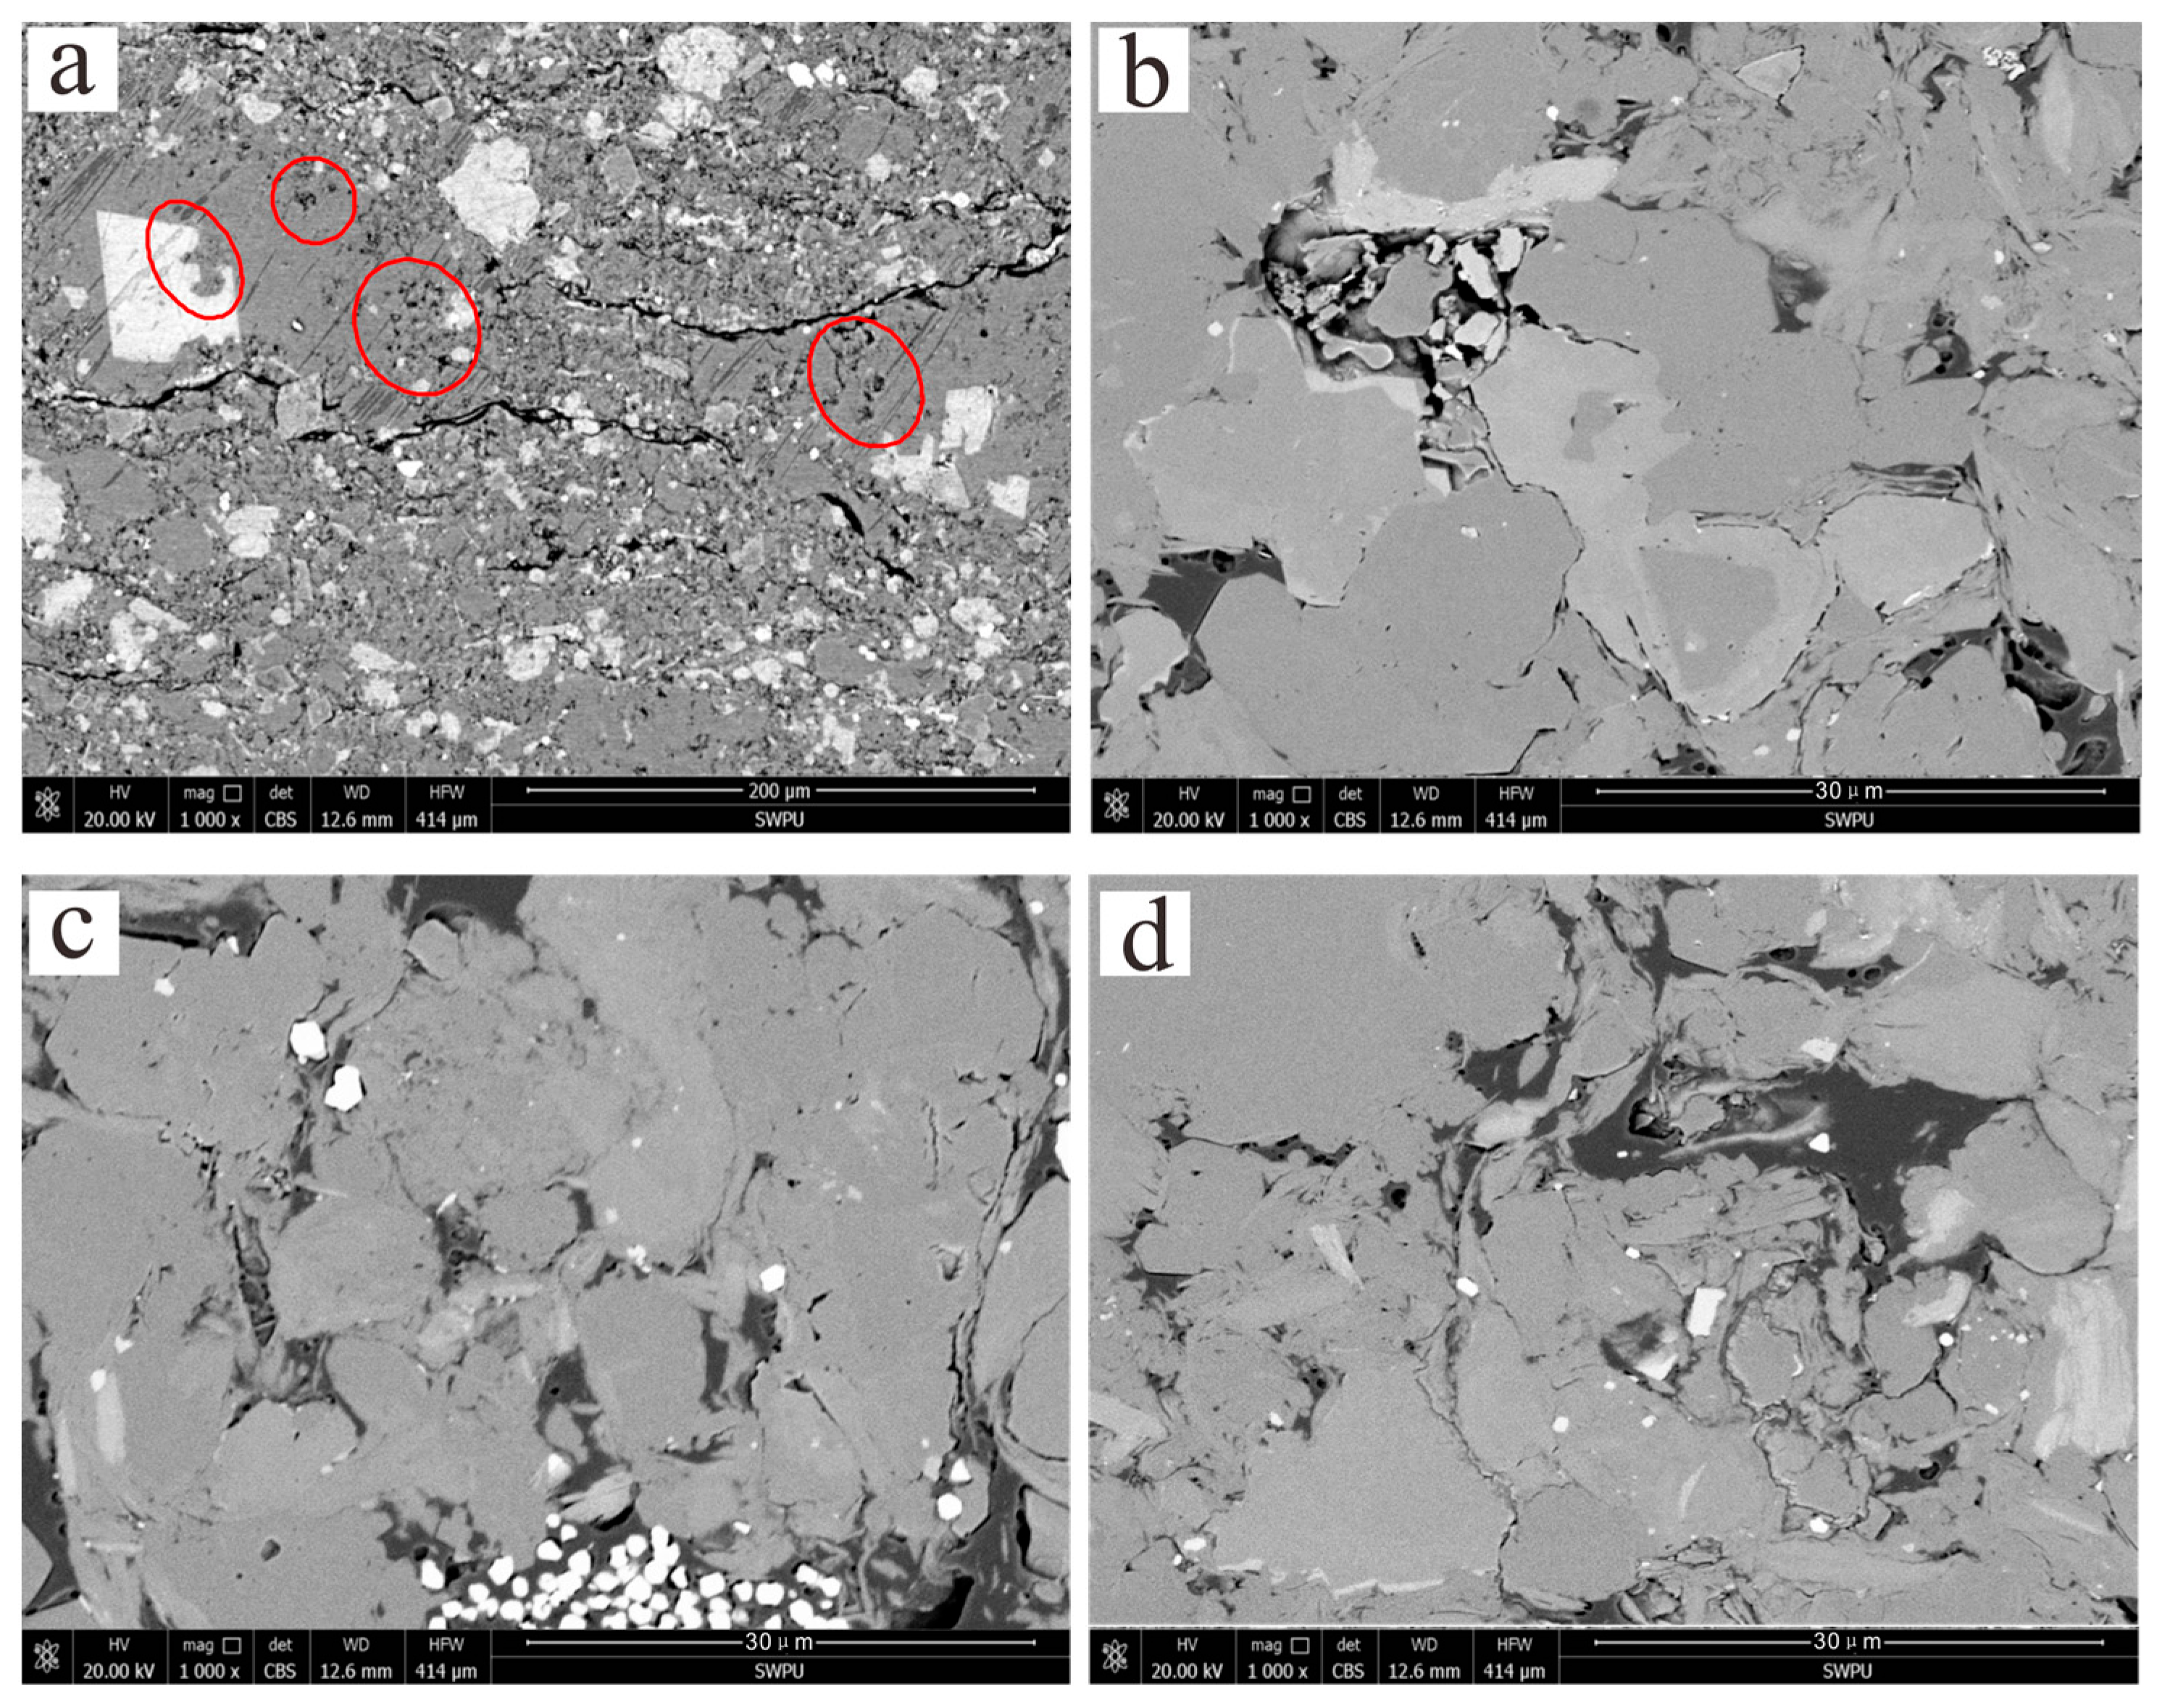
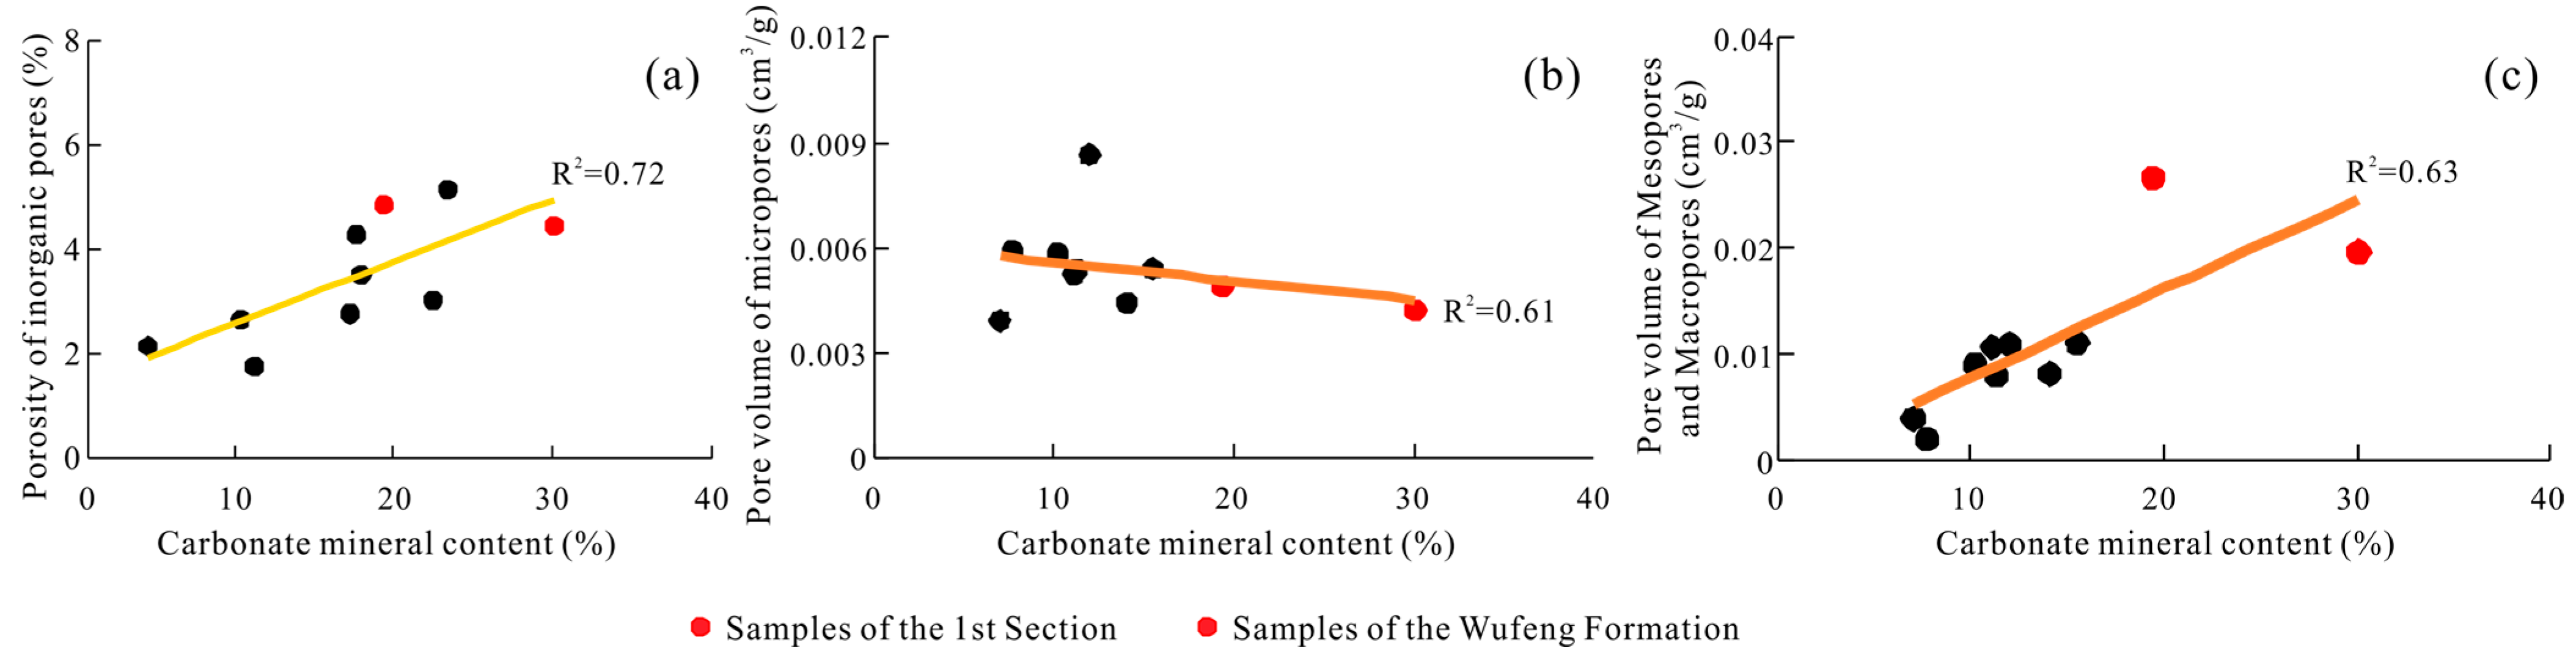
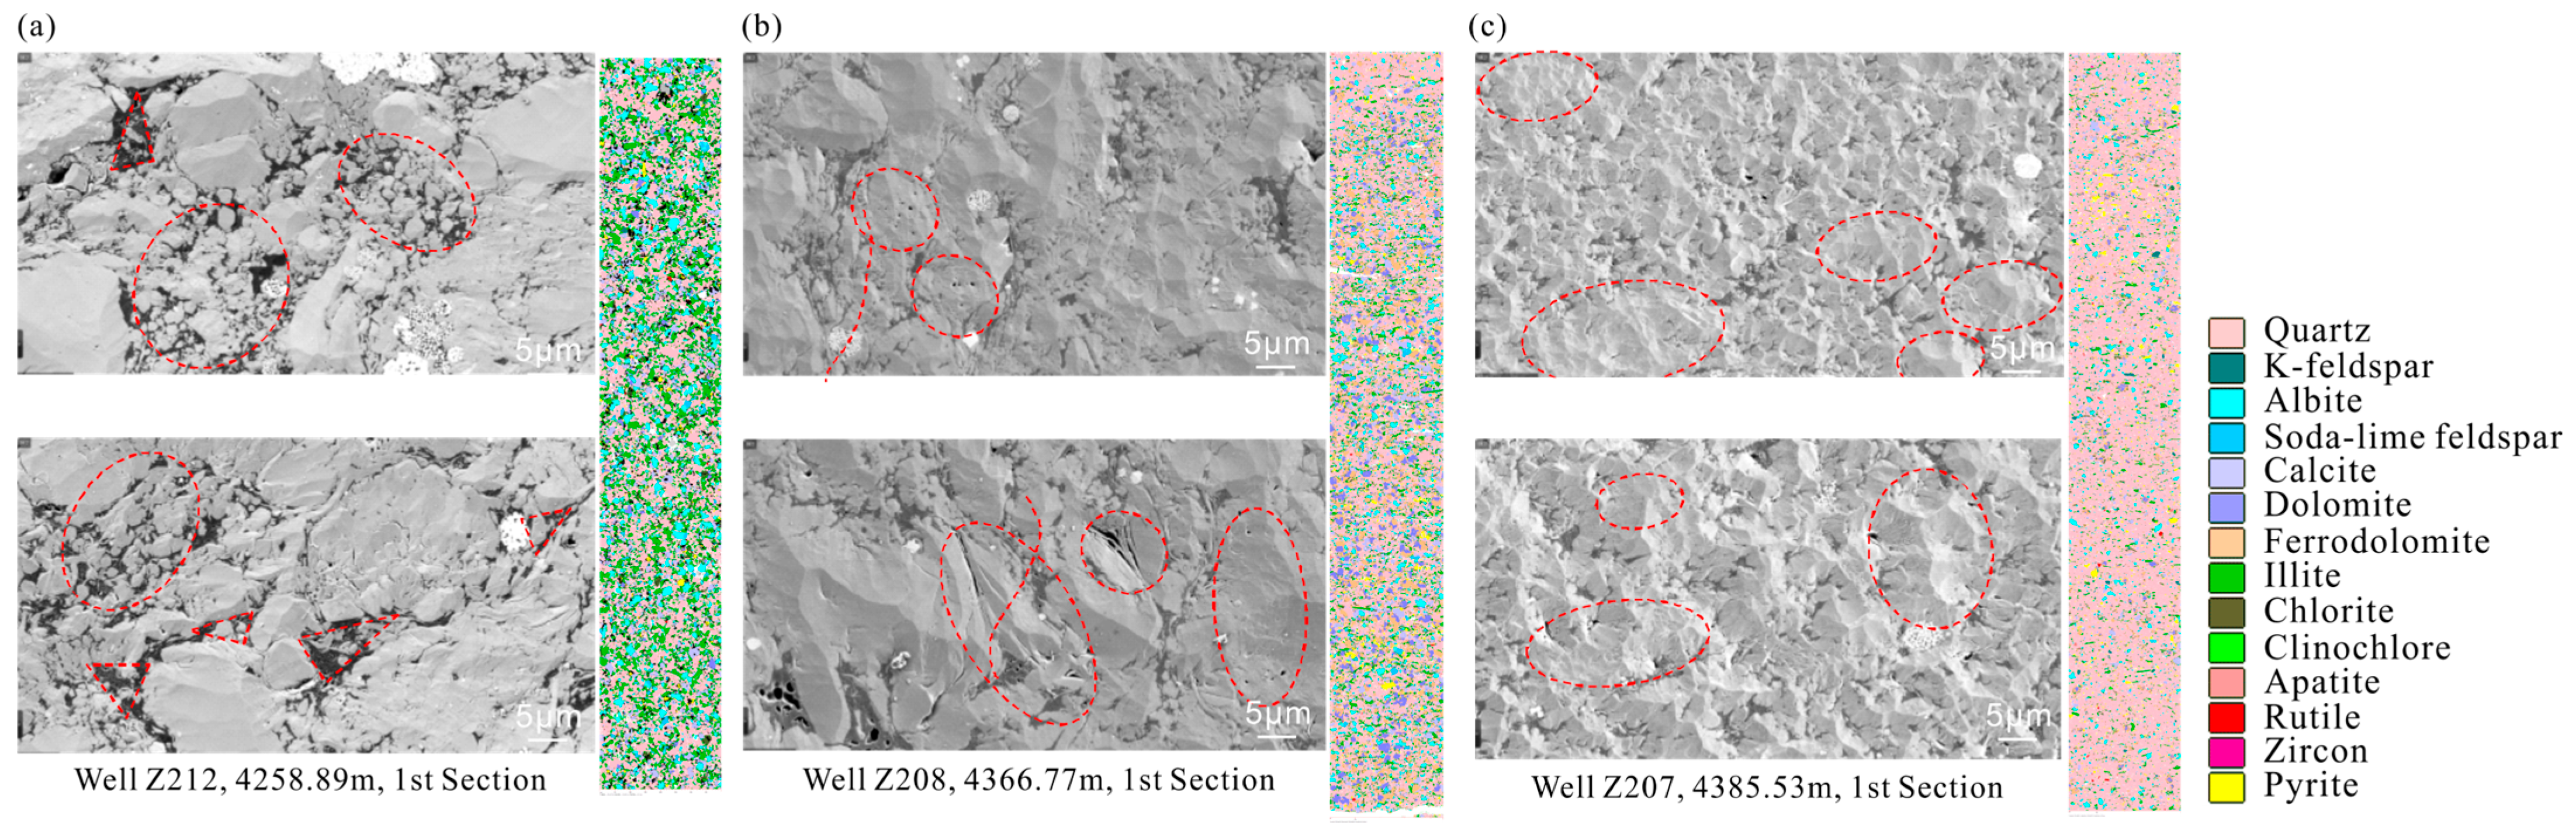
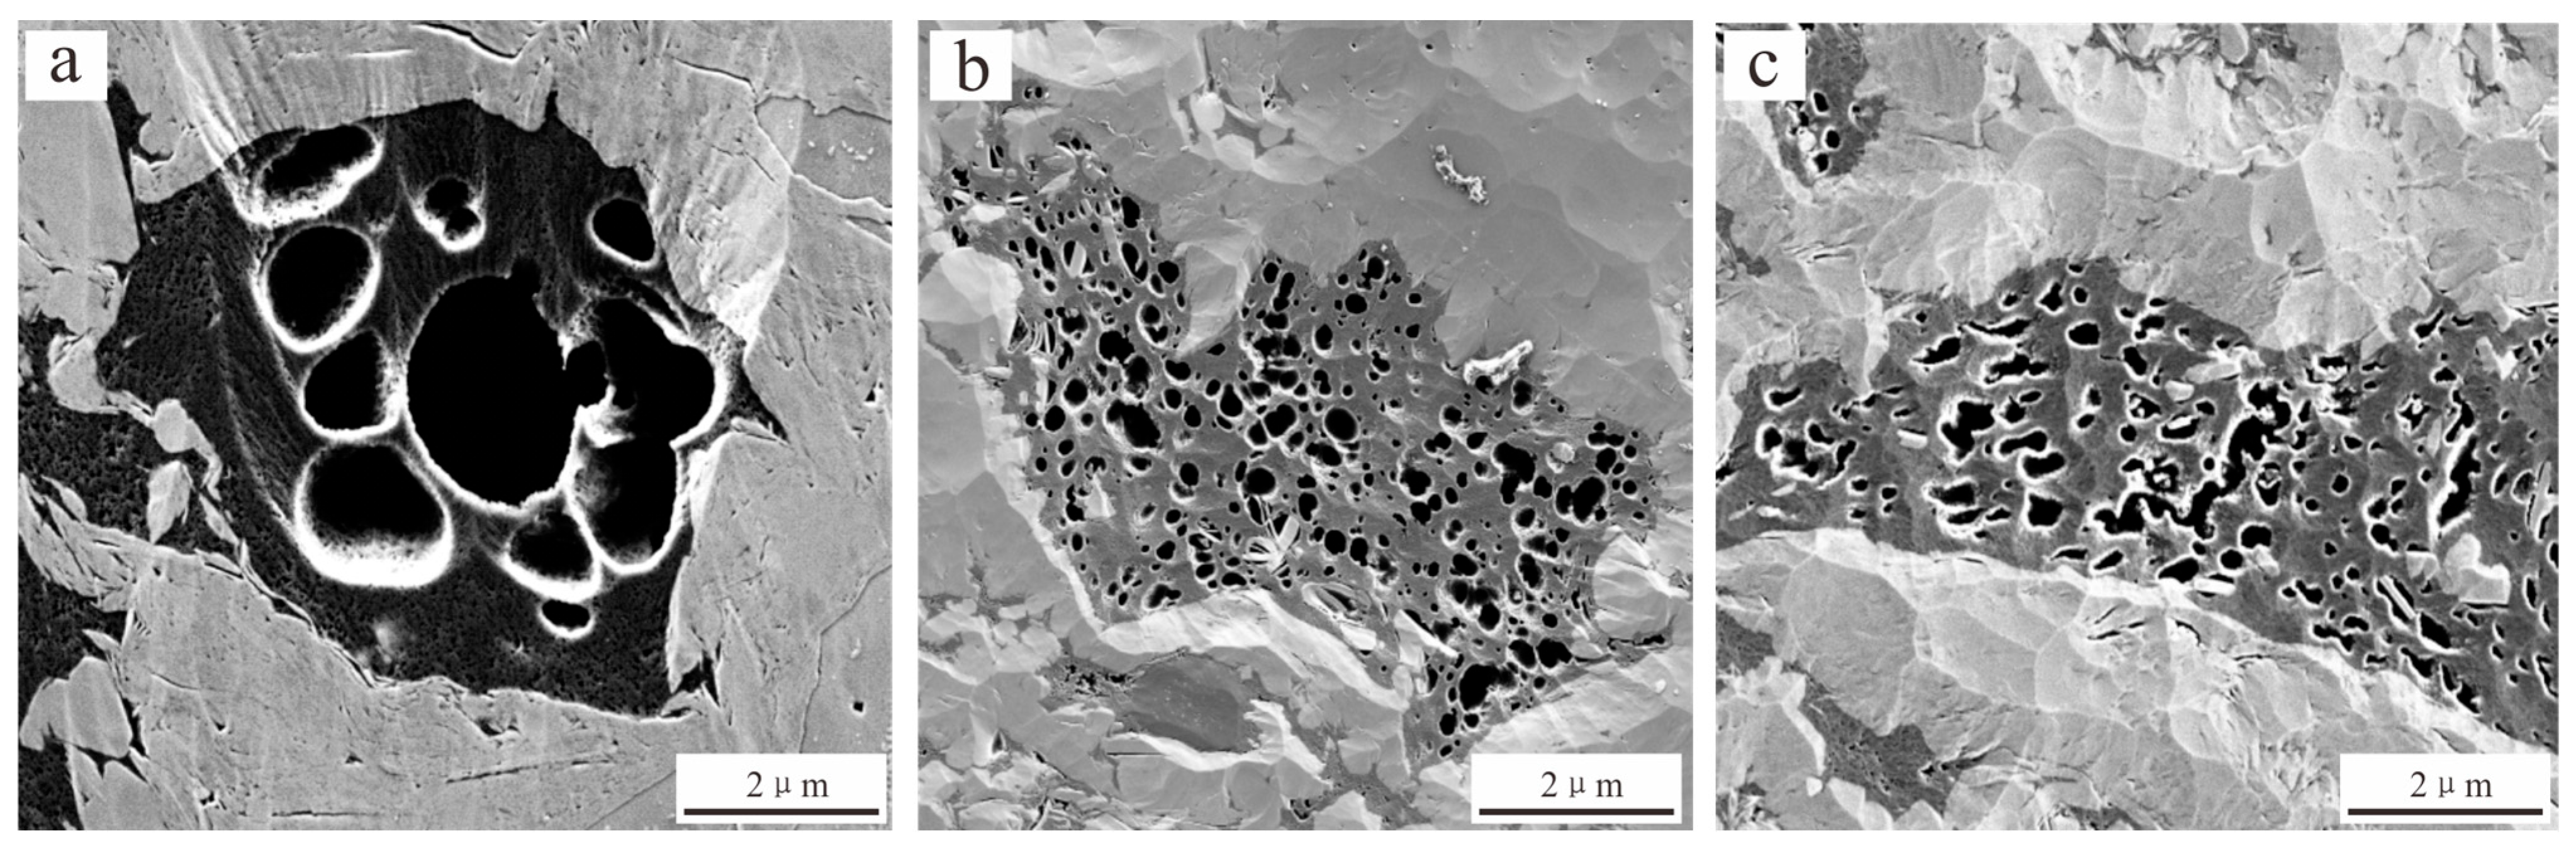
5.2. Controlling Effect of Inorganic Minerals on Porosity

During the shale depositional period, the paleogeomorphology where Well Z212 is located was relatively high, with a small water depth and a higher carbonate mineral content compared to those of neighboring wells (Figure 6a). During diagenesis, carbonate minerals are easily dissolved by acidic fluids to form a large number of dissolved pores (Figure 6b). SEM observation shows that a large number of intragranular dissolution pores and intergranular pores related to carbonate minerals are developed in the shale reservoir of Well Z212 (Figure 6c,d). There is a significant positive correlation between the carbonate mineral content and porosity in the shale of the Wufeng Formation first section of Well Z212, indicating that high carbonate mineral content is one of the influencing factors of high porosity (Figure 7a). Moreover, the correlation between different pore sizes and carbonate mineral content was statistically analyzed through N2 adsorption and mercury intrusion experiments. The results showed that the correlation between micropore pore volume and carbonate mineral content was not significant, while the pore volume of mesopores and macropores had a significant positive correlation with carbonate mineral content (Figure 7b,c), indicating that the pores related to carbonate minerals were mainly mesopores and macropores. In summary, carbonate minerals promote the process of dissolution, producing a large number of secondary, large-diameter inorganic pores, which in turn give Well Z212 a higher porosity.

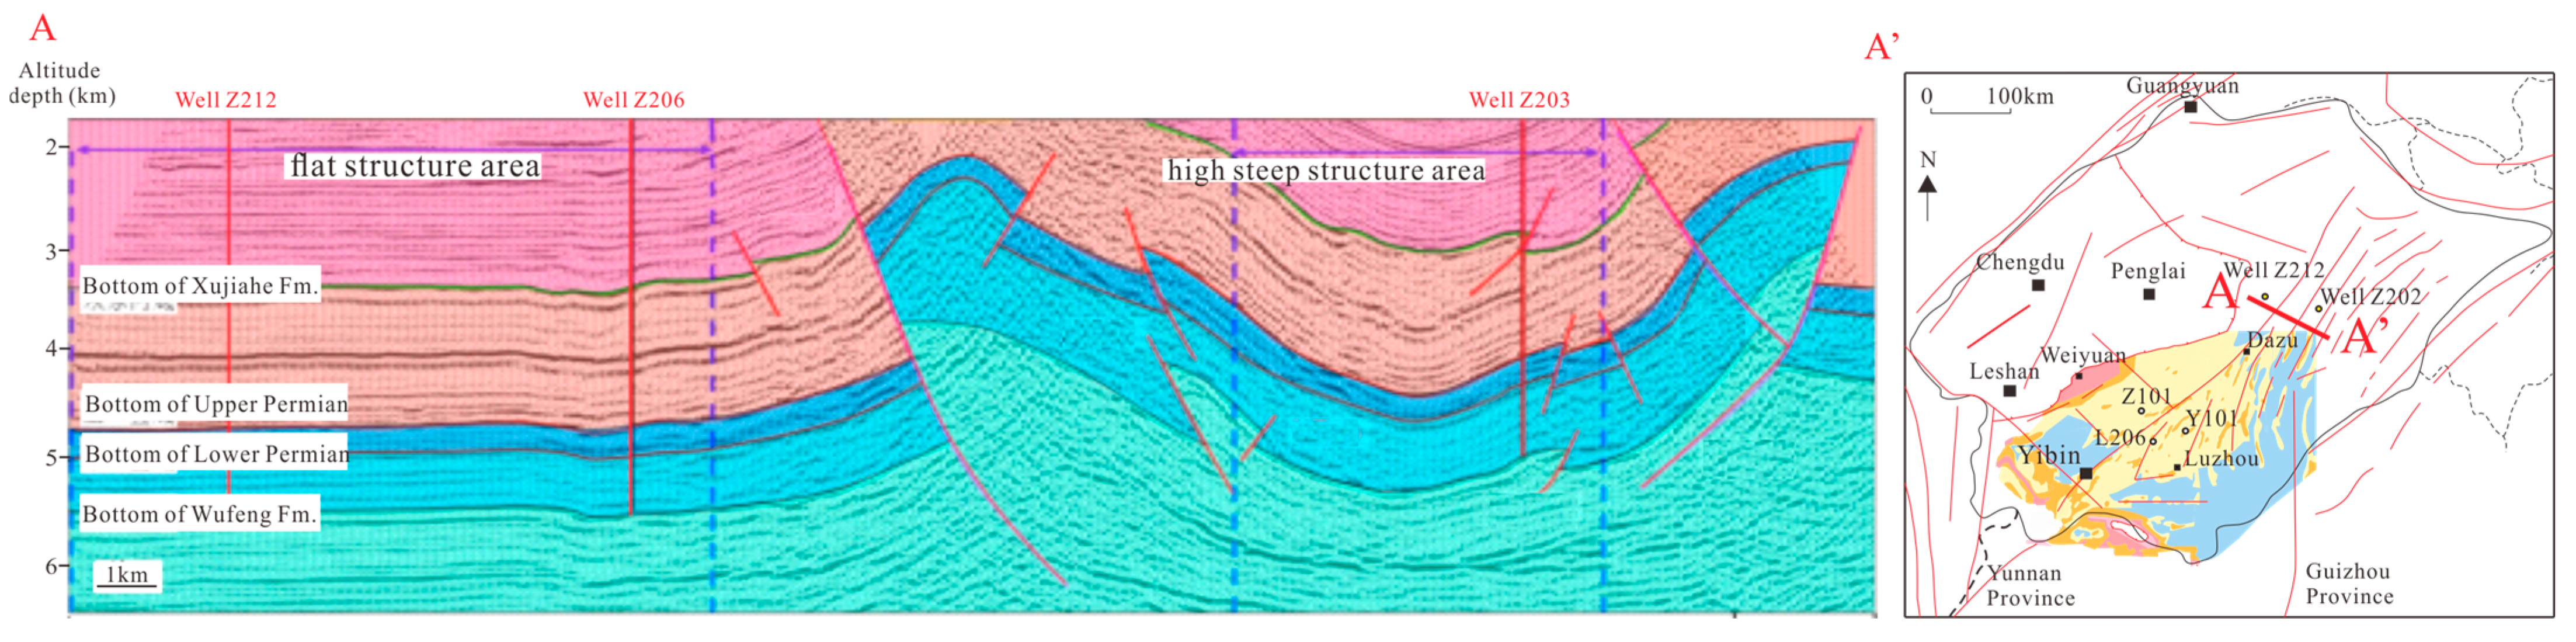
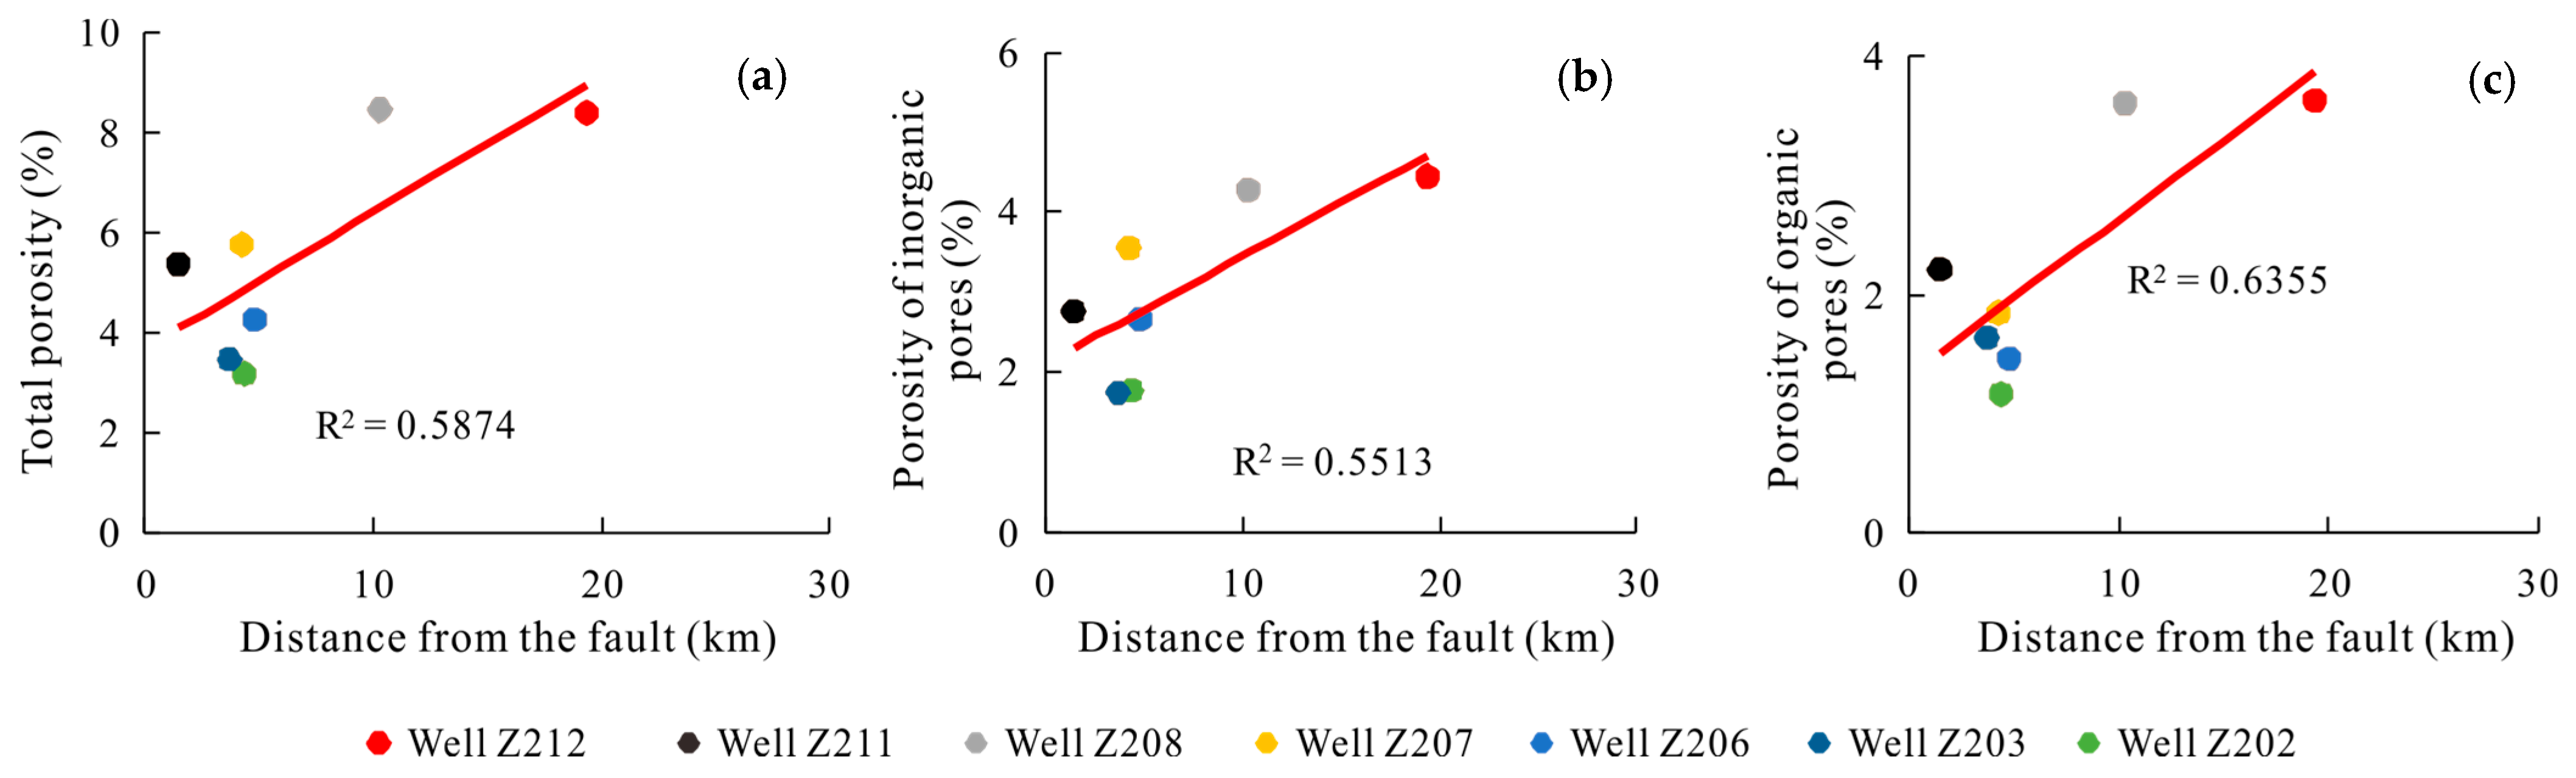
5.3. Controlling Effect of Structural Preservation

Tectonic movement has multiple impacts on shale reservoirs. In active tectonic zones, faults and structural fractures are likely to disrupt the sealing of shale reservoirs, affecting the preservation of shale gas and organic pores [19,20]. Meanwhile, structural compression can cause the deformation of plastic minerals such as clay minerals, resulting in fewer inorganic pores [21,22]. It is generally believed that the weaker the strength of structural deformation, the more favorable it is for the preservation of pores and shale gas [23]. Well Z212 is located in a syncline near the denudation area. Within this syncline, the structure is gentle, and the degree of fault and fracture development is low (Figure 8). Against this structural background, the degree of compression of shale is low, and the strength of compaction and cementation is low (Figure 9a). The particle size is large, and there is often a basal point line contact relationship between particles. The inorganic plane porosity is high, and a large number of intergranular pores are developed (Figure 9b). To the east, towards the syncline where Well Z203 is located, the intensity of tectonic activity increases, and a large number of faults are developed in the area, resulting in poorer conditions for shale gas preservation. The shale reservoir of Well Z207 is structurally compacted and strongly cemented. The phenomenon of intergranular pressure dissolution is obvious, with very few intergranular pores and only a small number of intragranular dissolution pores visible (Figure 9c). In the syncline where the Well Z212 is located, the organic pores are honeycomb-shaped and bubble-shaped. Organic pores have high roundness, with pore sizes ranging from 50 nm to 200 nm, and the maximum pore size can reach the micrometer level (Figure 10a). The closer to the fault, the lower the degree of organic pore development, the more obvious the deformation of organic pores, and the smaller the pore size, mainly ranging from 5 nm to 100 nm (Figure 10b,c).
Overall, the structure where Well Z212 is located is flat, and the structure becomes flatter in the direction of the denudation area. Meanwhile, as the distance from the fault increases, the total porosity of the shale reservoir gradually increases (Figure 11a). The development degree of organic and inorganic pores increases (Figure 11b,c), with the inorganic pore surface rate increasing from 0.27% to 0.64% and the organic pore surface rate increasing from 0.59% to 0.77%. The favorable structural location near the denudation area enables the shale pores (especially inorganic pores) to be well preserved, thereby forming high-porosity reservoirs.

6. Development Technology of Shale Gas

6.1. Integrated Geo-Steering Technology

There are no 3D seismic data available at the location of Well Z212. Although there are two-dimensional seismic data near the well, there is no two-dimensional seismic line along the horizontal well trajectory direction, which makes it impossible to accurately predict the vertical depth of the target point, the occurrence of the horizontal strata, and the micro-amplitude structure through geophysical means. A 3D geological guidance model cannot be established. Due to the proximity of the well to the denudation area, the overall thickness of the Longmaxi Formation in the well area has decreased by about 140 m, resulting in insufficient vertical thickness when entering the target. As a result, the designed trajectory needs to penetrate the Ordovician strata for about 255 m before forming a “spoon shape” back into the target.
But the drilling efficiency is low and the implementation of the engineering trajectory is difficult. Meanwhile, the gamma and spectral values of the Ordovician strata do not show significant changes, making it difficult to determine the specific vertical thickness entering the Ordovician and adjust the trajectory accurately. The production layer consists of the first section and the upper part of the Wufeng Formation, but the drillability of the Wufeng Formation is relatively poor. In order to improve the mechanical drilling speed and save drilling cycles, the team responsible for geo-steering conducted multiple discussions on the plan and ultimately decided to control the horizontal well trajectory within the first section (vertical thickness of 0.9 m). The trend of horizontal stratigraphic changes and micro-structures cannot be predicted, making it easy to drill a small layer, thus greatly increasing the difficulty of geological guidance. During the drilling process in the horizontal interval, there are situations such as high temperature in the formation and large vibration of downhole instruments.
Firstly, based on the vertical depth of Well Z212, the velocity field of the 2D seismic survey lines within a 10 km radius of the well will be recalibrated, and the vertical depth of each survey line will be updated. Then, by projecting the elevations of the wellhead, point A, and point B onto the surrounding survey lines, the contour lines of the structural lines are corrected to accurately predict the trend of the horizontal strata. Through the above measures, with a distance of up to 500 m from the target, the difference between the predicted vertical depth of the earthquake entering the target and the actual drilling results is only 1 m. The team responsible for geo-steering conducted repeated analysis on the elements and gamma spectra of other surrounding wells and the Z212 pilot well, and thoroughly compared the elemental signature characteristics within the Ordovician strata. Based on the changes in special elements, we accurately determined the trajectory position of the drill bit in the Ordovician strata, and achieved precise target insertion 100 m in advance while ensuring a smooth trajectory.
Based on the variation trend of the GR value, obtained by logging, the strata encountered by the drilling bit was predicted and adjusted in time. When encountering local deflection during drilling, based on the integration of geological engineering, trajectory simulation and big data analysis were used to establish multiple sets of geological guidance models. Different models were quantitatively compared, and the optimal model was selected. The most advanced high-temperature resistant drill bit ATC Pro and its rotating geological guidance tool in the industry were adopted, while strengthening the standardized use and systematic management of cooling equipment. The average mechanical drilling speed in the horizontal interval was stabilized at 7.89 m/h. A total of 141-fine tuned geological guidance instructions were issued in the horizontal interval with a vertical thickness of only 0.6 m and a length of 2200 m, ensuring a smooth trajectory and fast mechanical drilling speed under the premise of a 100% target penetration rate.

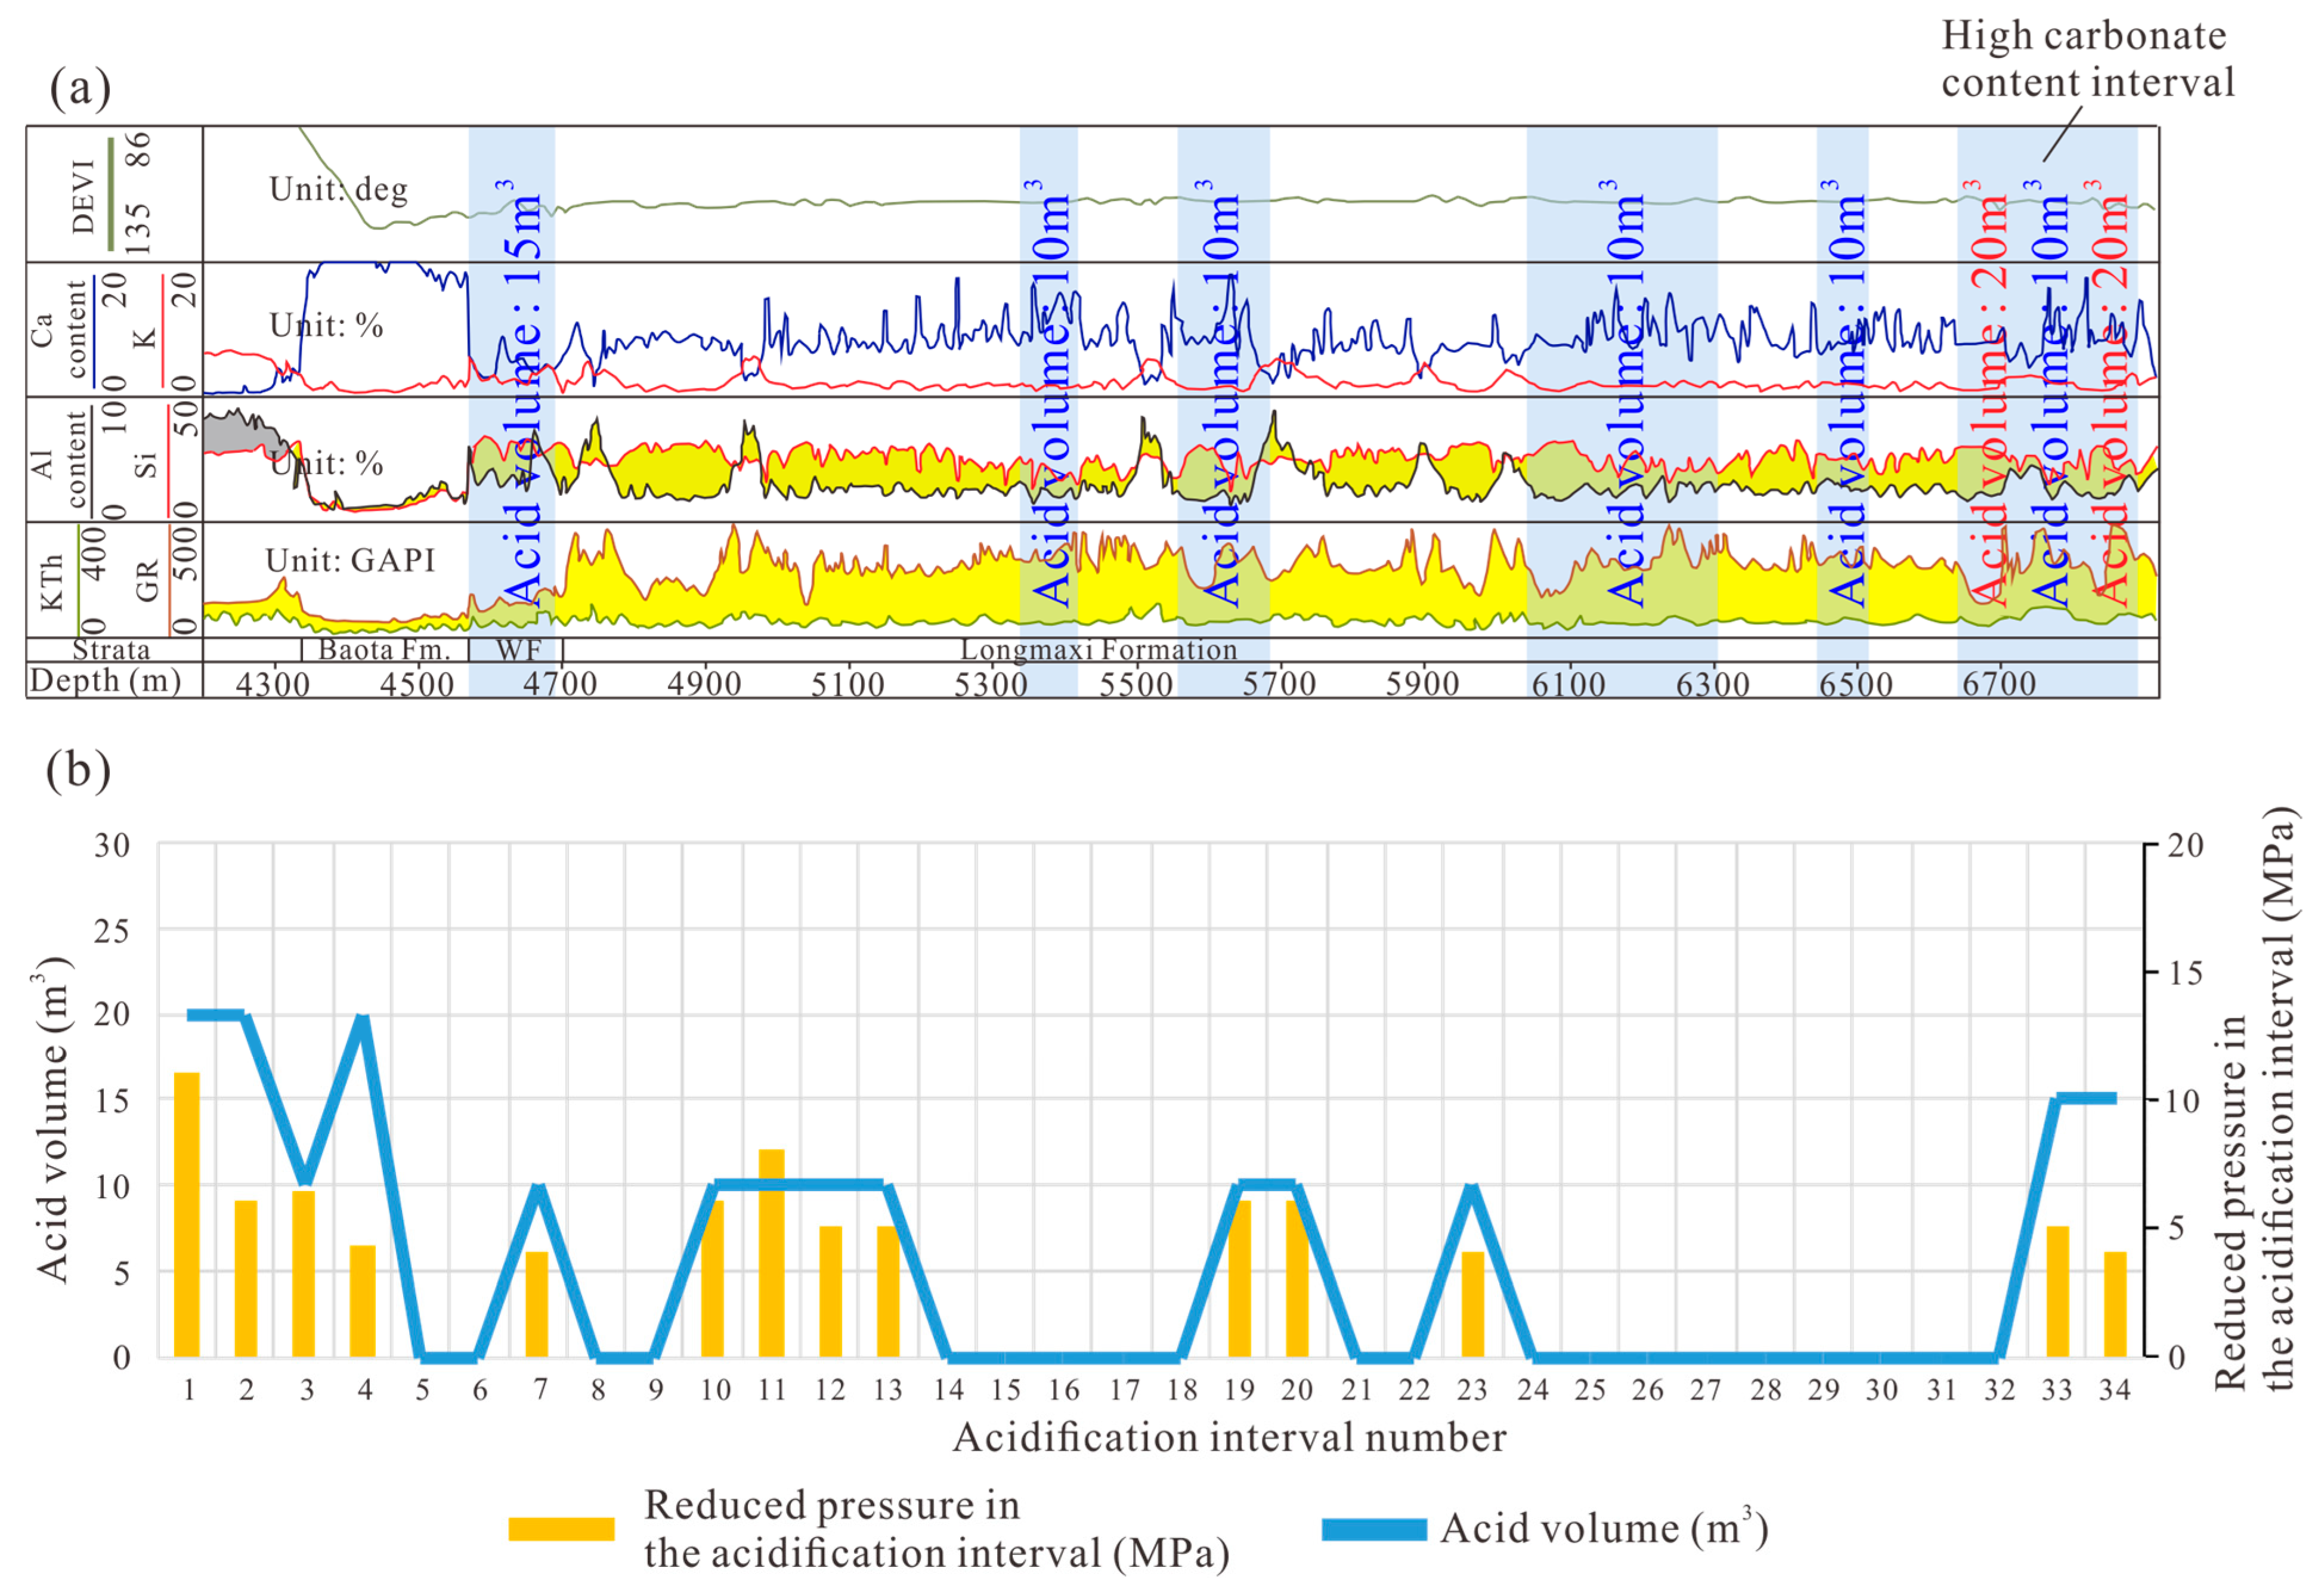
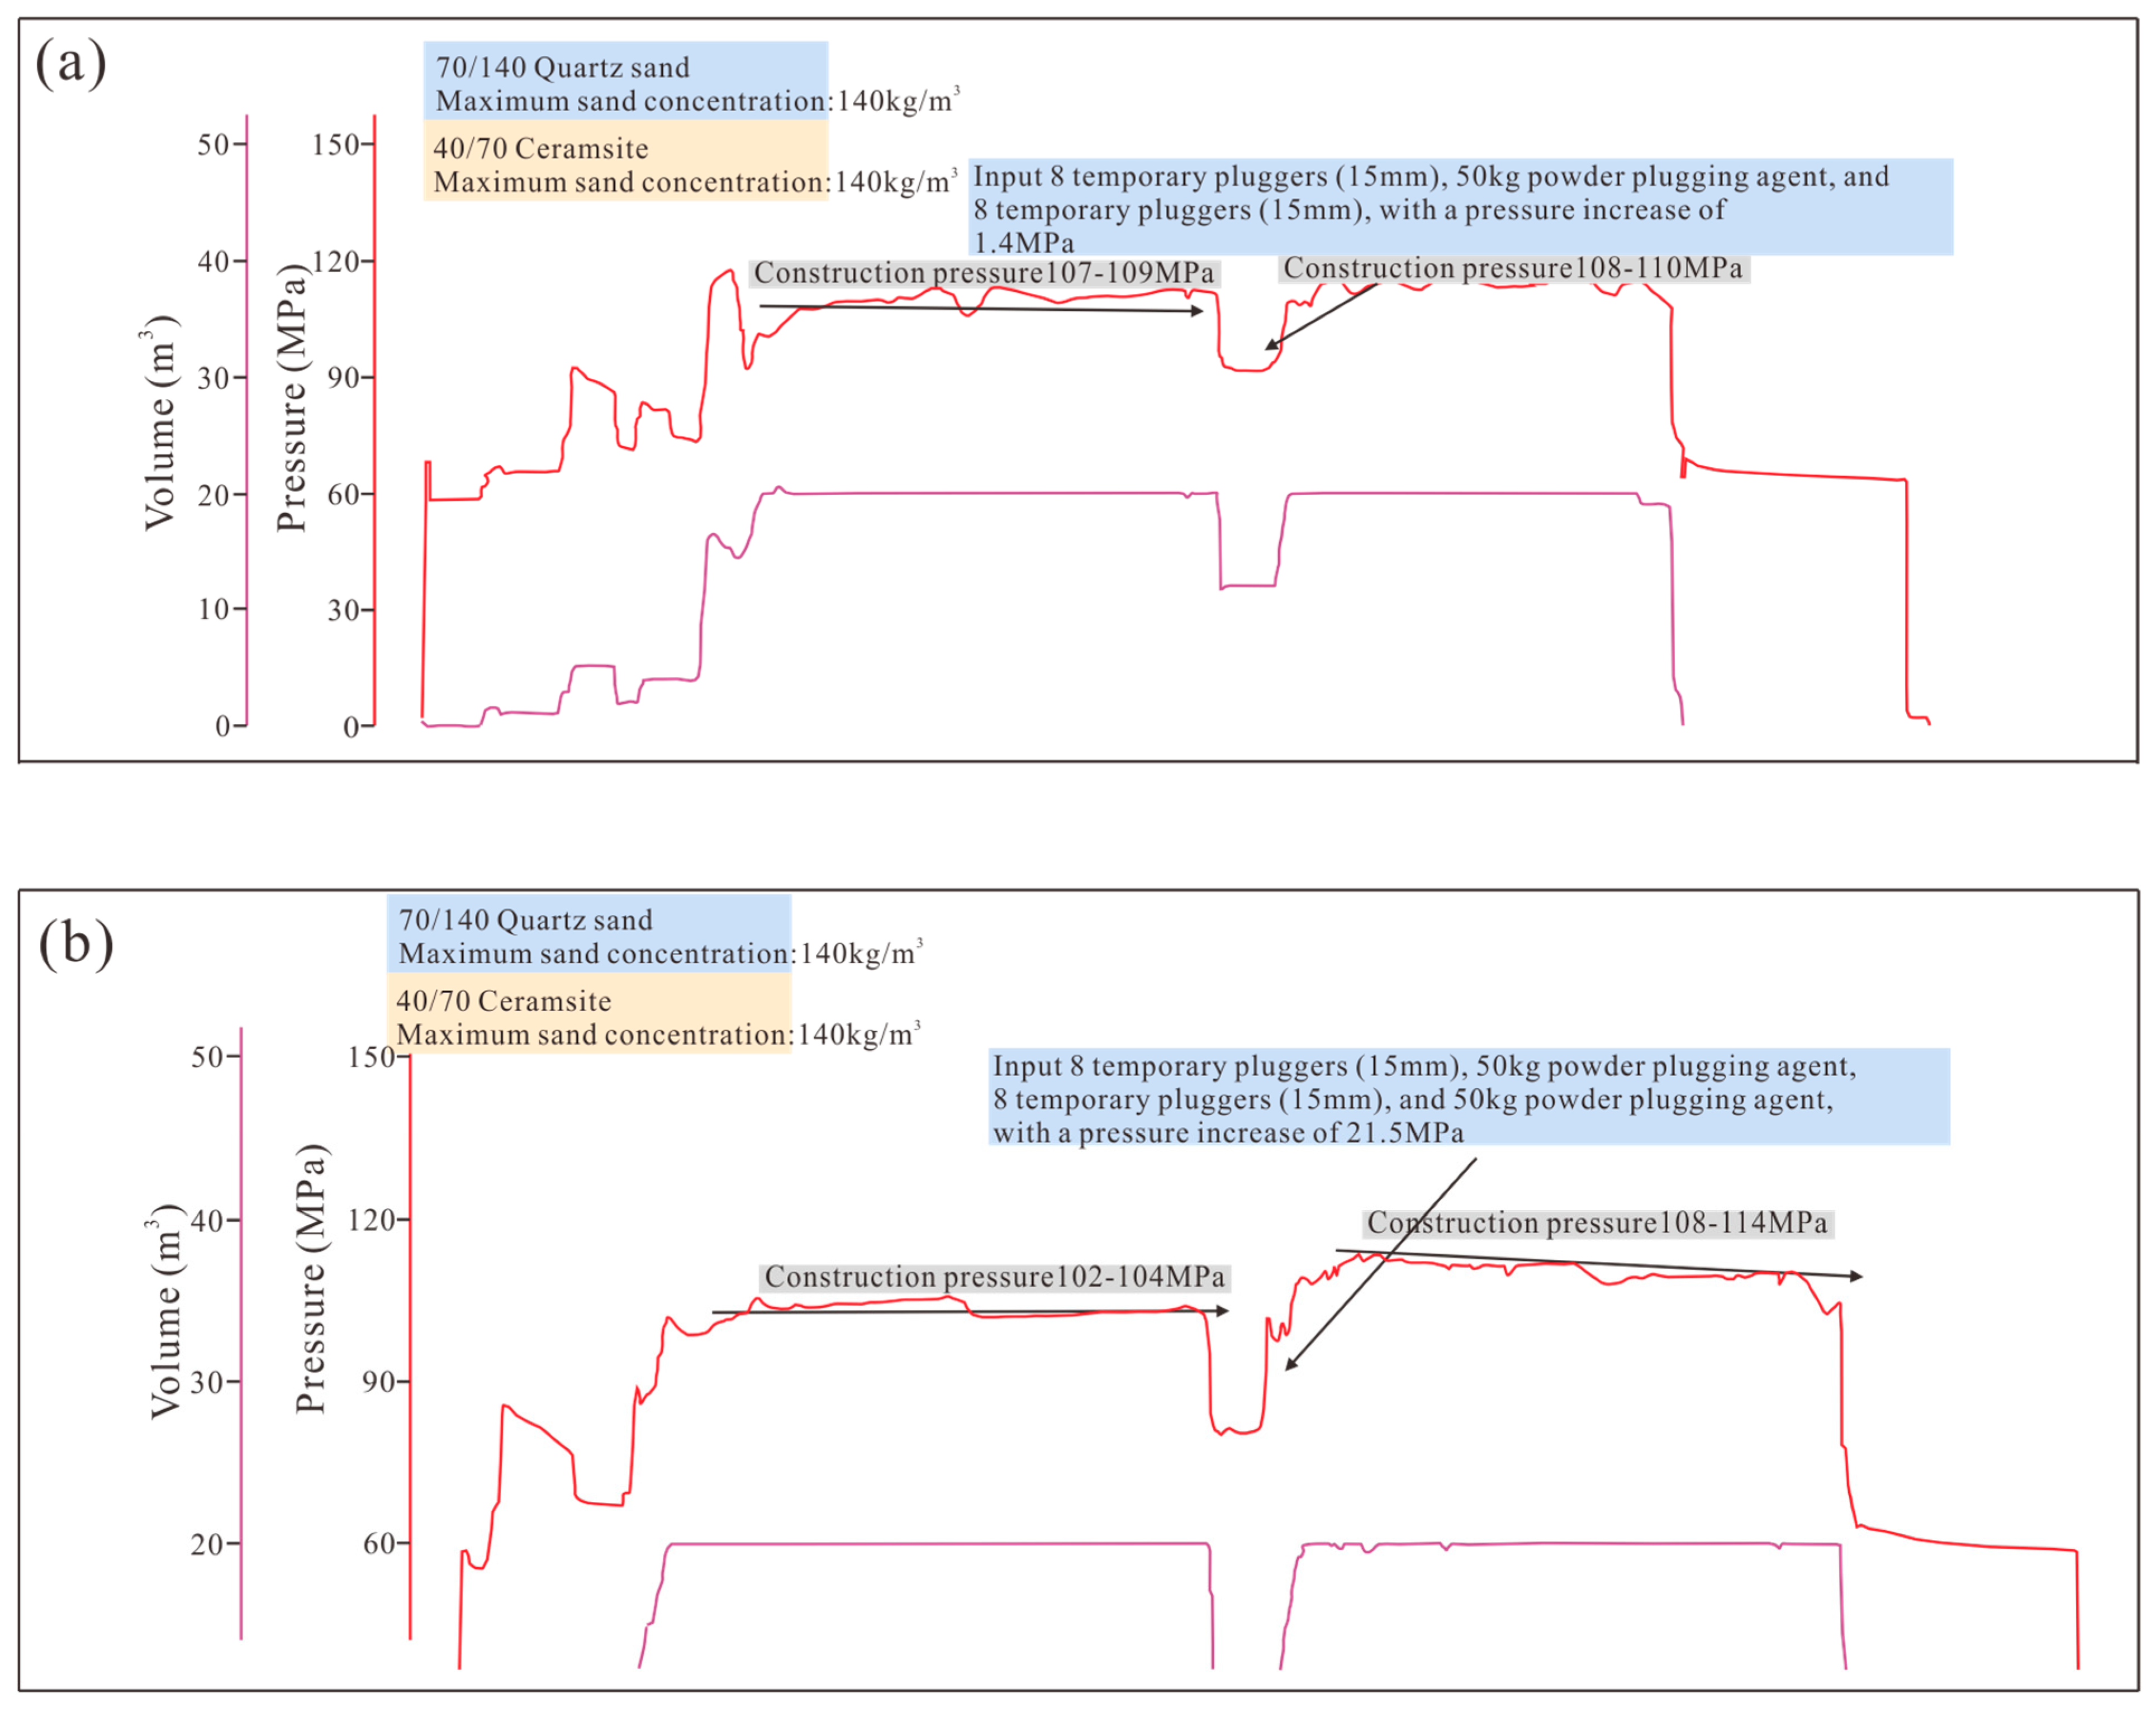
6.2. Acidification and Volume Fracturing Technology

Shale reservoirs in the near denudation area are characterized by high carbonate content. The average content of carbonate minerals is greater than 15%. The horizontal stress difference of shale in the Wufeng Formation-Long 1-1 Submember is 14.3 MPa, Young’s modulus is 28.5–32.7 GPa, and Poisson’s ratio is 0.19–0.21. The mechanical parameters are relatively close in the longitudinal direction, and have little effect on the expansion of fracture width. However, due to the high calcite content, the fracture pressure is relatively high. The east side of Well Z212 is close to the denudation area, with strong heterogeneity on the east and west sides, which may lead to the uneven expansion of the fracture network.
In response to the high content and strong heterogeneity of carbonate minerals in shale reservoirs, the fracturing construction process of Well Z212 was optimized. In response to the characteristics of high carbonate mineral content, the amount of pre-acid solution was increased to 20 m3, and a further 10–20 m3 of acid was applied to the high carbonate interval (Figure 12a). These processes promote the dissolution of carbonates, increase the complexity of the fracture network, enhance the flow conductivity of the fracture network, and reduce the pressure of the acidified interval by 4–11 MPa (Figure 12b). In response to the strong heterogeneity on the east and west sides, 16 temporary pluggers (15 mm) were used, and the powder plugging agent was replaced with a particle plugging agent to improve the efficiency of multi-cluster opening. The optimized temporary blocking pressure increased from 1.4 MPa to 21.5 MPa (Figure 13), further extending the length and height of the fracture. Based on geological characteristics, the fracturing process optimization of Well Z212 achieved shale reservoir stimulation, providing a reference for the efficient development of thin-shale reservoirs in near-denudation areas.

7. Conclusions

Petrology, mineralogy and seismic interpretation suggest that the sedimentary paleogeomorphology near the denudation area is composed of three terraces. Well Z212 located in the second terrace is characterized by a thin-shale reservoir interval (only 4.3 m). The thin-shale reservoir is characterized by high porosity (6%–10%), moderate TOC (3%–4%), a high carbonate mineral content (10%–35%), and a high gas content (>7 m3/t). Petrological, mineralogical and statistical results suggest that the silt lamination enhance the reservoir’s resistance to compaction, having a positive effect on pore preservation. Carbonate minerals are the main carrier of inorganic pores in thin-shale reservoir, and the pores are mainly composed of mesopores and macropores. Even though the thin shale reservoir is close to the denudation area, the structural condition is conducive to the preservation of shale gas and pores. The key development technologies of thin-shale reservoirs are composed of integrated geo-steering technology, acidification, and volume fracking technology. The fracturing process optimization of Well Z212 has achieved shale reservoir stimulation.

Author Contributions

Conceptualization, H.Z. and Z.S.; methodology, L.J.; validation, W.C.; formal analysis, T.L.; investigation, L.Q. and Z.S.; data curation, L.J.; writing—original draft preparation, H.Z. and Z.S.; writing—review and editing, L.J. and L.Q.; visualization, T.L.; supervision, W.C.; project administration, L.J. All authors have read and agreed to the published version of the manuscript.

Funding

The research was supported by the National Natural Science Foundation of China (No. 42272171), and the National Natural Science Foundation of China (No. 42302166).

Data Availability Statement

Data are contained within the article.

Conflicts of Interest

Author Haijie Zhang and Weiming Chen were employed by the Chongqing Shale Gas Exploration and Development Co., Ltd. Author Lin Jiang was employed by the Dongfang Geophysical Exploration Co., Ltd. Author Tongtong Luo and Lin Qi were employed by the Chuanqing Drilling Engineering Co., Ltd. The remaining authors declare that the research was conducted in the absence of any commercial or financial relationships that could be construed as a potential conflict of interest.

References

  1. Zhang, X.; Zhang, T.; Zhao, X.; Zhu, H.; Mihai, E.P.; Chen, L.; Yong, J.; Xiao, Q.; Li, H. Effects of astronomical orbital cycle and volcanic activity on organic carbon accumulation during Late Ordovician–Early Silurian in the Upper Yangtze area, South China. Pet. Explor. Dev. 2021, 48, 850–863. [Google Scholar] [CrossRef]
  2. Zou, C.; Dong, D.; Wang, Y.; Li, X.; Huang, J.; Wang, S.; Guan, Q.; Zhang, C.; Wang, H.; Liu, H.; et al. Shale gas in China: Characteristics, challenges and prospects (II). Pet. Explor. Dev. 2016, 43, 166–178. [Google Scholar] [CrossRef]
  3. Jiang, Y.; Chen, L.; Qi, L.; Luo, M.; Chen, X.; Tao, Y.; Wang, Z. Characterization of the Lower Silurian Longmaxi marine shale in Changning area in the south Sichuan Basin, China. Geol. J. 2018, 53, 1656–1664. [Google Scholar] [CrossRef]
  4. Li, H.; Zhou, J.; Mou, X.; Guo, H.; Wang, X.; An, H.; Mo, Q.; Long, H.; Dang, C.; Wu, J.; et al. Pore structure and fractal characteristics of the marine shale of the Longmaxi Formation in the Changning Area, Southern Sichuan Basin, China. Front. Earth Sci. 2022, 10, 1018274. [Google Scholar] [CrossRef]
  5. Li, J.; Li, H.; Yang, C.; Wu, Y.; Gao, Z.; Jiang, S. Geological characteristics and controlling factors of deep shale gas enrichment of the Wufeng-Longmaxi Formation in the southern Sichuan Basin, China. Lithosphere 2022, 12, 4737801. [Google Scholar] [CrossRef]
  6. Li, H. Research progress on evaluation methods and factors influencing shale brittleness: A review. Energy Rep. 2022, 8, 4344–4358. [Google Scholar] [CrossRef]
  7. Jiang, Y.; Liu, X.; Fu, Y.; Chen, H.; Zhang, H.; Yan, J.; Chen, C.; Gu, Y. Evaluation of effective porosity in marine shale reservoir, western Chongqing. Acta Pet. Sin. 2019, 40, 1233–1243. [Google Scholar]
  8. Liu, S.; Jiao, K.; Zhang, J.; Ye, Y.; Xie, G.; Deng, B.; Ran, B.; Li, Z.; Wu, J.; Li, J.; et al. Research progress on the pore characteristics of deep shale gas reservoirs: An example from the Lower Paleozoic marine shale in the Sichuan Basin. Nat. Gas Ind. 2021, 41, 29–41. [Google Scholar]
  9. Jiang, C.; Zhang, H.; Zhou, Y.; Gan, H.; Pu, J.; Jiang, Y.; Fu, Y.; Gu, Y.; Li, M.; Wang, Z.; et al. Paleogeomorphic characteristics of Wufeng-Longmaxi formation and its influence on development of high-quality shale in Dazu area, Western Chongqing. J. Cent. South Univ. (Sci. Technol.) 2022, 53, 3628–3640. [Google Scholar]
  10. Ma, X.; Xie, J. The progress and prospects of shale gas exploration and exploitation in southern Sichuan Basin, NW China. Pet. Explor. Dev. 2018, 45, 161–169. [Google Scholar] [CrossRef]
  11. Long, S.; Lu, T.; Li, Q.; Yang, G.; Li, D. Discussion on China’s shale gas development ideas and goals during the 14th Five-Year Plan. Nat. Gas Ind. 2021, 41, 1–10. [Google Scholar]
  12. Nie, H.; Li, P.; Dang, W.; Ding, J.; Sun, C.; Liu, M.; Wang, J.; Du, W.; Zhang, P.; Li, D. Enrichment characteristics and exploration directions of deep shale gas of Ordovician-Silurian in the Sichuan Basin and its surrounding areas, China. Pet. Explor. Dev. 2022, 49, 648–659. [Google Scholar] [CrossRef]
  13. Chen, Z.; Liang, X.; Zhang, J.; Wang, G.; Liu, C.; Li, Z.; Zou, C. Genesis analysis of shale reservoir over-pressure of Longmaxi Formation in Zhaotong Demonstration Area, Dianqianbei Depression. Nat. Gas Geosci. 2016, 27, 442–448. [Google Scholar]
  14. Dong, D.; Liang, F.; Guan, Q.; Jiang, Y.; Zhou, S.; Yu, R.; Gu, Y.; Zhang, S.; Qi, L.; Liu, Y. Development model and identification evaluation technology of Wufeng-Longmaxi Formation quality shale gas reservoirs in the Sichuan Basin. Nat. Gas Ind. 2022, 42, 96–111. [Google Scholar] [CrossRef]
  15. Yu, T.; Liu, H.; Liu, B.W.; Tang, S.; Tang, Y.Z.; Yin, C. Restoration of karst paleogeomorphology and its significance in petroleum geology—Using the top of the Middle Triassic Leikoupo Formation in the northwestern Sichuan Basin as an example. J. Petrol. Sci. Eng. 2022, 208, 109638. [Google Scholar] [CrossRef]
  16. Loucks, R.G.; Reed, R.M.; Ruppel, S.C.; Hammes, U. Spectrum of pore types and networks in mudrocks and a descriptive classification for matrix related pores. AAPG Bull. 2012, 96, 1071–1098. [Google Scholar] [CrossRef]
  17. Shi, Z.; Dong, D.; Wang, H.; Sun, S.; Wu, J. Reservoir characteristics and genetic mechanisms of gas-bearing shales with different laminae and laminae combinations: A case study of Member 1 of the Lower Silurian Longmaxi shale in Sichuan Basin, SW China. Pet. Explor. Dev. 2020, 47, 829–840. [Google Scholar] [CrossRef]
  18. Shi, Z.; Zhao, S.; Zhou, T.; Sun, S.; Yuan, Y.; Zhang, C.; Li, B.; Qi, L. Types and genesis of horizontal bedding of marine gas-bearing shale and its significance for shale gas: A case study of the Wufeng-Longmaxi shale in southern Sichuan Basin, China. Oil Gas Geol. 2023, 44, 1499–1514. [Google Scholar]
  19. Hou, H.; Yang, W.; Du, W.; Feng, X.; Jiang, Z.; Shi, F.; Lin, R.; Wang, Y.; Zhang, D.; Chen, Y.; et al. Implications of multi-stage deformation on the differential preservation of Lower Paleozoic shale gas in tectonically complex regions: New structural and kinematic constraints from the Upper Yangtze Platform, South China. Mar. Pet. Geol. 2024, 160, 106629. [Google Scholar] [CrossRef]
  20. Tan, R.; Wang, R.; Huang, Y.; Yang, R.; Li, H.; Lu, K. Mechanism of the enrichment and loss progress of deep shale gas: Evidence from fracture veins of the Wufeng-Longmaxi formations in the southern Sichuan Basin. Minerals 2022, 12, 897. [Google Scholar] [CrossRef]
  21. Xiang, J.; Zhu, Y.; Wang, Y.; Chen, S.; Jiang, Z. Effect of faults on shale pore fracture and shale gas preservation: A case study of the Wufeng-Longmaxi Formation in the Northeast Yunnan area. Energy Fuels 2022, 36, 8238–8255. [Google Scholar] [CrossRef]
  22. Yang, W.; Wang, Y.; Du, W.; Song, Y.; Jiang, Z.; Wang, Q.; Xu, L.; Zhao, F.; Chen, Y.; Shi, F. Behavior of organic matter-hosted pores within shale gas reservoirs in response to differential tectonic deformation: Potential mechanisms and innovative conceptual models. J. Nat. Gas Sci. Eng. 2022, 102, 104571. [Google Scholar] [CrossRef]
  23. Tang, H.; Liu, X.; Chen, Y.; Yu, W.; Zhao, N.; Shi, X.; Wang, M.; Liao, J. Pore structure difference of shale in different structural units and its petroleum geological implications: A case study on deep shale in the Luzhou area, southern Sichuan Basin. Nat. Gas Ind. 2024, 44, 16–28. [Google Scholar]
Figure 1. (a) Location of Sichuan Basin, Well Z212 and other shale gas wells (modified from [1,2]). (b) Stratigraphic column of Silurian Longmaxi Formation.
Minerals 15 00619 g001
Figure 2. Thickness contour map of Wufeng Formation–Long 1 Member and seismic section of cross-wells.
Minerals 15 00619 g002
Figure 3. (a) Key parameters of shale reservoir in Well Z202 (far away from denudation area). (b) Key parameters of shale reservoir in Well Z212 (near denudation area).
Minerals 15 00619 g003
Figure 4. Petrological characteristics of shale reservoir laminations in the study area. (a) Well Z207, 1st section, 4385.94 m. (b) Well Z208, 1st Section, 4366.95 m. (c) Well Z212, 3rd section, 4252.68 m. (d) Well Z201, 3rd section, 4355.12 m. (e) Well Z212, 1st section, 4257.7 m. (f) Well Z208, 3rd section, 4354.35 m.
Minerals 15 00619 g004
Figure 5. Correlation between frequency and porosity of silt laminations in Wufeng formation–Longmaxi formation. (a) Correlation between frequency and porosity of silt laminations. (b) Correlation between high-frequency silt laminations and porosity. (c) Correlation between medium-frequency silt laminations and porosity. (d) Correlation between low-frequency silt laminations and porosity.
Minerals 15 00619 g005
Figure 6. SEM photographs showing the carbonate minerals and inorganic pores. (a) The dissolution of carbonate minerals is marked by red circles; Well Z212, 1st section, 4258.2 m. (b) Well Z212, Wufeng Formation, 4260.7 m. (c) Well Z212, 3rd section, 4251.2 m. (d) Well Z212, 2nd section, 4256.5 m.
Minerals 15 00619 g006
Figure 7. Correlation between carbonate minerals and pore development. (a) Carbonate minerals vs. inorganic pore porosity. (b) Carbonate minerals vs. pore volume of micropores. (c) Carbonate minerals vs. pore volume of mesopores and macropores.
Minerals 15 00619 g007
Figure 8. Seismic section of structural characteristics of Well Z212.
Minerals 15 00619 g008
Figure 9. Surface scanning characteristics of inorganic minerals at different distances from faults. (a) The inorganic and organic pores are marked by red circles; Well Z212, 4258.89 m, 1st section, 17.7 km away from the secondary fault. (b) The inorganic pores are marked by red circles; Well Z208, 4366.77 m, 1st section, 10.3 km away from the secondary fault. (c) The inorganic pores are marked by red circles; Well Z207, 4385.53 m, 1st section, 4.2 km away from the secondary fault.
Minerals 15 00619 g009
Figure 10. SEM photographs showing the organic pores at different distances from the secondary fault. (a) Well Z212, 4258.89 m, 1st section, 17.7 km away from the secondary fault. (b) Well Z208, 4366.77 m, 1st section, 10.3 km away from the secondary fault. (c) Well Z207, 4385.53 m, 1st section, 4.2 km away from the secondary fault.
Minerals 15 00619 g010
Figure 11. Correlation between distance from fault and porosity. (a) Distance from the fault vs. total porosity. (b) Distance from the fault vs. porosity of inorganic pores. (c) Distance from the fault vs. porosity of organic pores.
Minerals 15 00619 g011
Figure 12. Optimization characteristics of Well Z212 acid solution. (a) Acidification interval and acid volume (DEVI, deviation logging; KTh, gamma ray without uranium logging; GR, gamma ray logging). (b) Statistics of acid volume and reduced pressure in each interval of Well Z212.
Minerals 15 00619 g012
Figure 13. Optimization characteristics of Well Z212 temporary plugging. (a) Construction curve of sand fracturing in 3rd interval of Well Z212 (powder plugging agent). (b) Construction curve of sand fracturing in 14th interval of Well Z212 (particle temporary plugging agent).
Minerals 15 00619 g013
Disclaimer/Publisher’s Note: The statements, opinions and data contained in all publications are solely those of the individual author(s) and contributor(s) and not of MDPI and/or the editor(s). MDPI and/or the editor(s) disclaim responsibility for any injury to people or property resulting from any ideas, methods, instructions or products referred to in the content.

