Article

A Novel Pulsation Reflux Classifier Used for Enhanced Preconcentration Efficiency of Antimony Oxide Ore

School of Minerals Processing & Bioengineering, Central South University, Changsha 410083, China
*
Author to whom correspondence should be addressed.
Minerals 2025, 15(6), 605; https://doi.org/10.3390/min15060605
Submission received: 10 May 2025 / Revised: 30 May 2025 / Accepted: 1 June 2025 / Published: 4 June 2025
(This article belongs to the Section Mineral Processing and Extractive Metallurgy)

Abstract

This study developed a novel pulsation-fluidized bed system, and the device was integrated into a reflux classifier to enhance the preconcentration of antimony oxide ore. The diaphragm-based pulsation device converts a stable upward water flow into a vertically alternating pulsation flow. By precisely controlling the pulsation parameters and optimizing operational conditions, the density-based stratification of particles can be significantly enhanced, thereby improving bed layering and effectively reducing entrainment. An antimony oxide ore from flotation tailings with an Sb grade of 0.8% was used as the feed material to evaluate the performance of the pulsation reflux classifier (PRC). Under optimized conditions, the PRC produced a concentrate with an Sb grade of 5.48% and a recovery of 81.68%, corresponding to a high separation efficiency of 70.97%. The response surface statistical model revealed that the interaction between the fluidization rate and pulsation frequency significantly enhanced the Sb grade of the concentrate, while pulsation stroke was identified as the key factor influencing separation efficiency. Furthermore, the variation in bed profile parameters with changing pulsation characteristics elucidates the interplay between particle suspension, stratification, and fluid disturbances. This study demonstrates that pulsation fluidization significantly enhances the separation performance of the reflux classifier, offering a new approach for the efficient preconcentration of complex fine-grained minerals.

1. Introduction

Gravity separation is one of the oldest mineral processing techniques [1,2]. Common gravity separation technologies exhibit distinct flow characteristics and separation mechanisms. Shaking tables rely on the combined effect of water flow and mechanical vibration to stratify particles on an inclined surface based on differences in density and particle size [3,4,5]. Spiral chutes utilize helical channels, where particles move under the influence of centrifugal and gravitational forces, allowing for separation according to specific gravity [6,7,8]. Dense media separation (DMS) employs a high-density suspension (such as magnetite or ferrosilicon) to create a medium of tunable density, enabling the separation of light and heavy particles through sink–float behavior [9,10,11]. Fluidized bed classifiers establish a stable fluidized zone using upward water flow, where particles either settle or remain suspended depending on their size and density [12,13,14,15,16]. In essence, all these methods exploit the density differences among particles for separation, causing them to experience varying magnitudes of gravity and fluid dynamic forces in a moving medium. These differences result in stratification based on particle density [17,18]. During the separation process, particle groups typically undergo three stages: suspension, stratification, and separation [1]. In a fluid medium, particles are dispersed via mechanical forces such as buoyancy and drag. Due to differences in their motion states, such as direction and velocity, particles begin to migrate along different paths, which leads to stratification based on density or particle size. By selectively discharging material from the different layers, effective particle separation can be achieved [19,20,21].
During the motion of particle assemblies in a fluid medium, interactions between solid particles and the surrounding fluid cause the settling velocity of individual particles to be affected by the presence of other particles [22]. In 1954, Richardson and Zaki [23] proposed an empirical formula to describe hindered settling velocity. According to their formula, the ratio of hindered to free settling velocity is positively correlated with the particle volume fraction. As the volume fraction increases, stratification based on density becomes more pronounced. The core of this theoretical framework is represented by Equation (1):
e g = d v 1 d v 2 = e 0 1 λ 2 1 λ 1 n
where e g represents the ratio of hindered to free settling velocity. d v 1 and d v 2 are the particle diameters of two particles with different densities that exhibit the same hindered settling velocity, with d v 1 > d v 2 . λ 1 and λ 2 represent the volume fractions of the two types of particles with different densities in the medium, respectively. The exponent n is typically taken as 2.39 in the inertial (vortex-dominated) regime and 4.78 in the viscous (friction-dominated) regime. The term e 0 refers to the ratio of free settling velocities, with its calculation given in Equation (2):
e 0 = χ 2 χ 1 k δ 2 ρ δ 1 ρ m
where χ1 and χ2 are the sphericity coefficients of the two types of particles, while δ1 and δ2 are the densities of the two types of particles, with δ1 > δ2. The values of k and m are provided in Table 1.
When particle groups move along inclined channels or surfaces, they are subjected not only to all the aforementioned mechanical forces but also to interlayer repulsive forces. This additional force is caused by differences in the velocity at both ends of the particles due to the distribution of water flow velocity with depth. This theory was first proposed by Bagnold [26], with its core equations represented by Equations (3) and (4).
T a d = 2.2 β 1 3 μ d u d z
T i n = 0.013 δ β d 2 d u d z 2
Here, T i n and T a d denote the inertial shear and viscous shear stress, respectively, expressed in N/m2. The parameter β represents the linear concentration of the suspension, defined as the ratio of the total between the total linear length of solid particles within a per unit volume and the loosened interstitial length. The term d u d z corresponds to the velocity gradient along the thickness direction of the fluid layer. The linear concentration β can be further calculated using the volumetric concentration, as described in Equation (5):
β = λ 1 / 3 λ 0 1 / 3 λ 1 / 3
where λ 0 and λ represent the volumetric concentrations of the bed in its loosened and naturally settled states, respectively.
Driven by the above-mentioned theories, reflux classifiers designed for various application scenarios have experienced rapid development. Among these, the liquid–solid fluidized bed separator, which is commonly used in coal beneficiation and also referred to as the teetered bed separator (TBS), is a typical device based on hindered settling theory [27,28,29]. Representative gravity separation equipment mainly based on inclined flow theory includes shaking tables [30,31,32] and inclined plate settler [33,34]. A novel gravity separation device, the reflux classifier, combines the liquid–solid fluidized bed separator with an inclined plate thickener [35,36], incorporating the application of both theoretical principles within a single apparatus. However, in separation devices based on these theories, there exist challenging issues that are difficult to resolve. From the hindered settling equivalence ratio formula, we know that the higher the volumetric concentration of solids in the suspension, the greater the e g value, and the less influence the particle size will have during separation. Yet, as the solid volume fraction increases, the looseness or dispersion of the particle bed decreases, which negatively impacts particle stratification and separation. This creates a contradiction in the system between enhancing density-based particle separation through an increased volume fraction and maintaining sufficient loosening of the particle bed. When the volume fraction of the particles becomes too high, the degree of suspension in the particle bed diminishes, which affects the dispersion of particles prior to separation. Therefore, in fluidized bed separation, achieving adequate suspension of the particle bed requires increasing the fluidization water velocity, whereas achieving a high-volume fraction necessitates reducing the fluidization water velocity. These two objectives are inherently contradictory, and thus, a compromise and balance must be struck during operation.
To address the aforementioned issues, external energy can be introduced into the fluidized bed to enhance particle movement and improve the fluidization state [37,38]. Academicians Guo Musun and Li Hongzhong summarized this in the Handbook of Fluidization, stating that energy can be introduced into the fluidized bed through methods such as jetting, impact, vibration, agitation, pulsation, magnetic fields, and centrifugal forces [39]. The essence of these methods is to enhance the loosening state of particles by introducing additional energy beyond the fluidizing water flow.
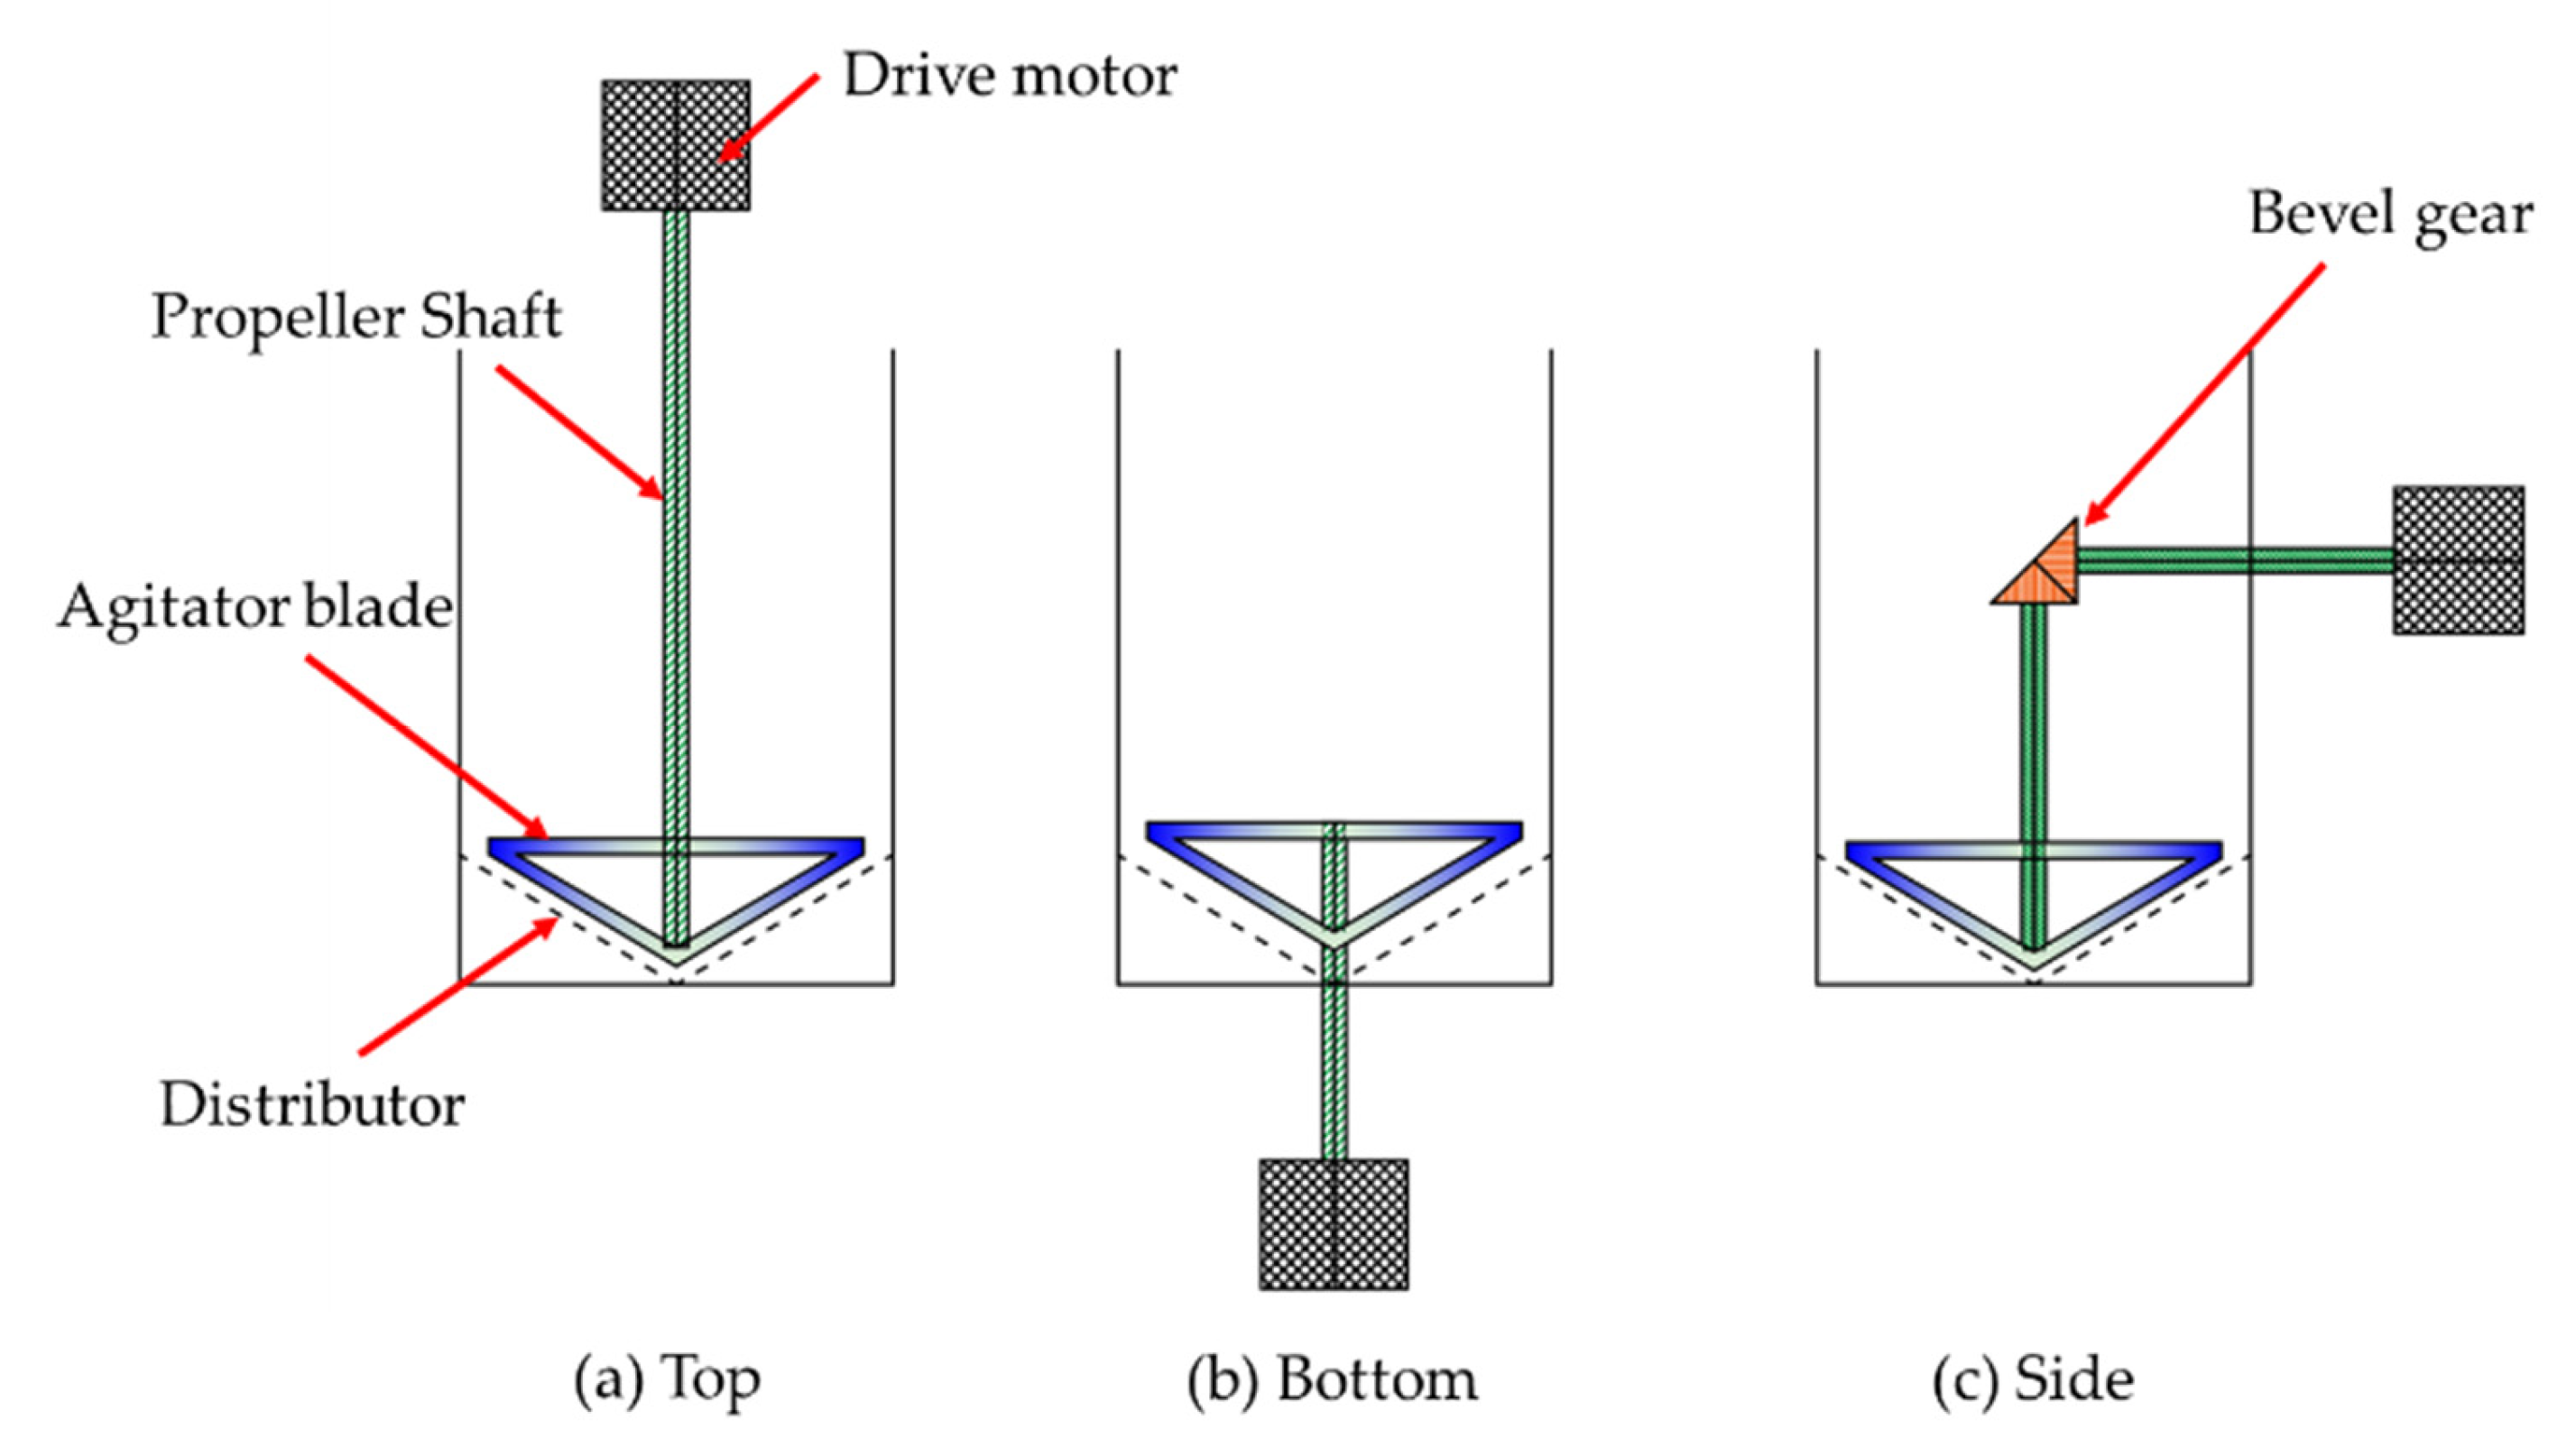
One approach involves installing an agitator within the fluidized bed, where particles are kept in suspension under the combined effects of fluid drag force and the mechanical action of the agitator blades. Such a bed is referred to as a stirred fluidized bed [37]. There are various structural forms of agitators, with impeller designs including strip-type, frame-type, blade-type, and anchor-type configurations. Multiple impellers can be installed on the same stirring shaft, and the drive mechanism for the stirring shaft can be mounted either at the top of the bed or below the distributor [39], as shown in Figure 1.
Stirred fluidized beds improve the quality of fluidization, making the fluidization between particles more uniform and enabling particles within the bed to reach critical fluidization velocity at lower fluid velocities. This effect is particularly pronounced when dealing with materials that have a wide particle size distribution [40].
The earliest experiment involving the installation of stirring devices below inclined channels was proposed by Lu Dongfang in 2011 [41], aimed at enhancing the separation of silica minerals from bauxite. His research found that stirring devices facilitate slurry dispersion, reduce particle intermingling, and enhance particle separation. In the same year, Huang Peng used computational fluid dynamics (CFD) to study the influence of agitator blades on the flow field and optimized the design of the impeller.
This discovery was soon applied to the improvement of reflux classifiers(RCs). In 2020, Chu Haoran et al. [42]. used a stirred counter-current RC to enrich fine-grained low-grade antimony (Sb) ore. They added rectangular-shaped stirring blades with a rotation radius of about 1 cm at the bottom of the vertical section of the RC, which is referred to as an agitated gravity separation column (AGC) in China. Their study revealed that mechanical stirring diluted the fluidized bed, enhanced particle dispersion, and reduced mechanical entrainment. Particles at the bottom of the device were lifted to upper regions through mechanical stirring, increasing the bed density in this area where particles are typically separated based on density rather than size. Thus, appropriate stirring improved the Sb grade of the concentrate.
In 2022, Chu Haoran [43] utilized response surface methodology to investigate the specific impact of stirring on separation efficiency. It was found that the stirring effect could partially replace traditional factors, improving the Sb grade of the concentrate at a relatively low cost in terms of Sb recovery loss. By introducing a stirring speed of 350 rpm and reducing the fluidization rate from 16 L/h to 14 L/h, an Sb grade of 2.33% with a recovery rate of 79.51% was achieved. Notably, the increase in grade due to stirring did not increase water consumption, which benefits subsequent tailings processing. Furthermore, by combining fluidized bed analysis with sieve analysis of pre-treated products, it was shown that stirring reduces the suspension density in high-concentration zones (conical sections), enhancing particle dispersion. Meanwhile, stirring also increased the bed density in low-concentration zones (vertical sections), promoting particle separation. Therefore, the stirring effect demonstrated better performance for fine particle separation compared to fluidization rates, especially advantageous for handling coarse particles relative to the feed concentration.
Besides its application in treating oxidized antimony tailings [44,45], this novel gravity separation equipment has been proven effective for preconcentration and classification of lateritic nickel ores [46], ilmenite [47,
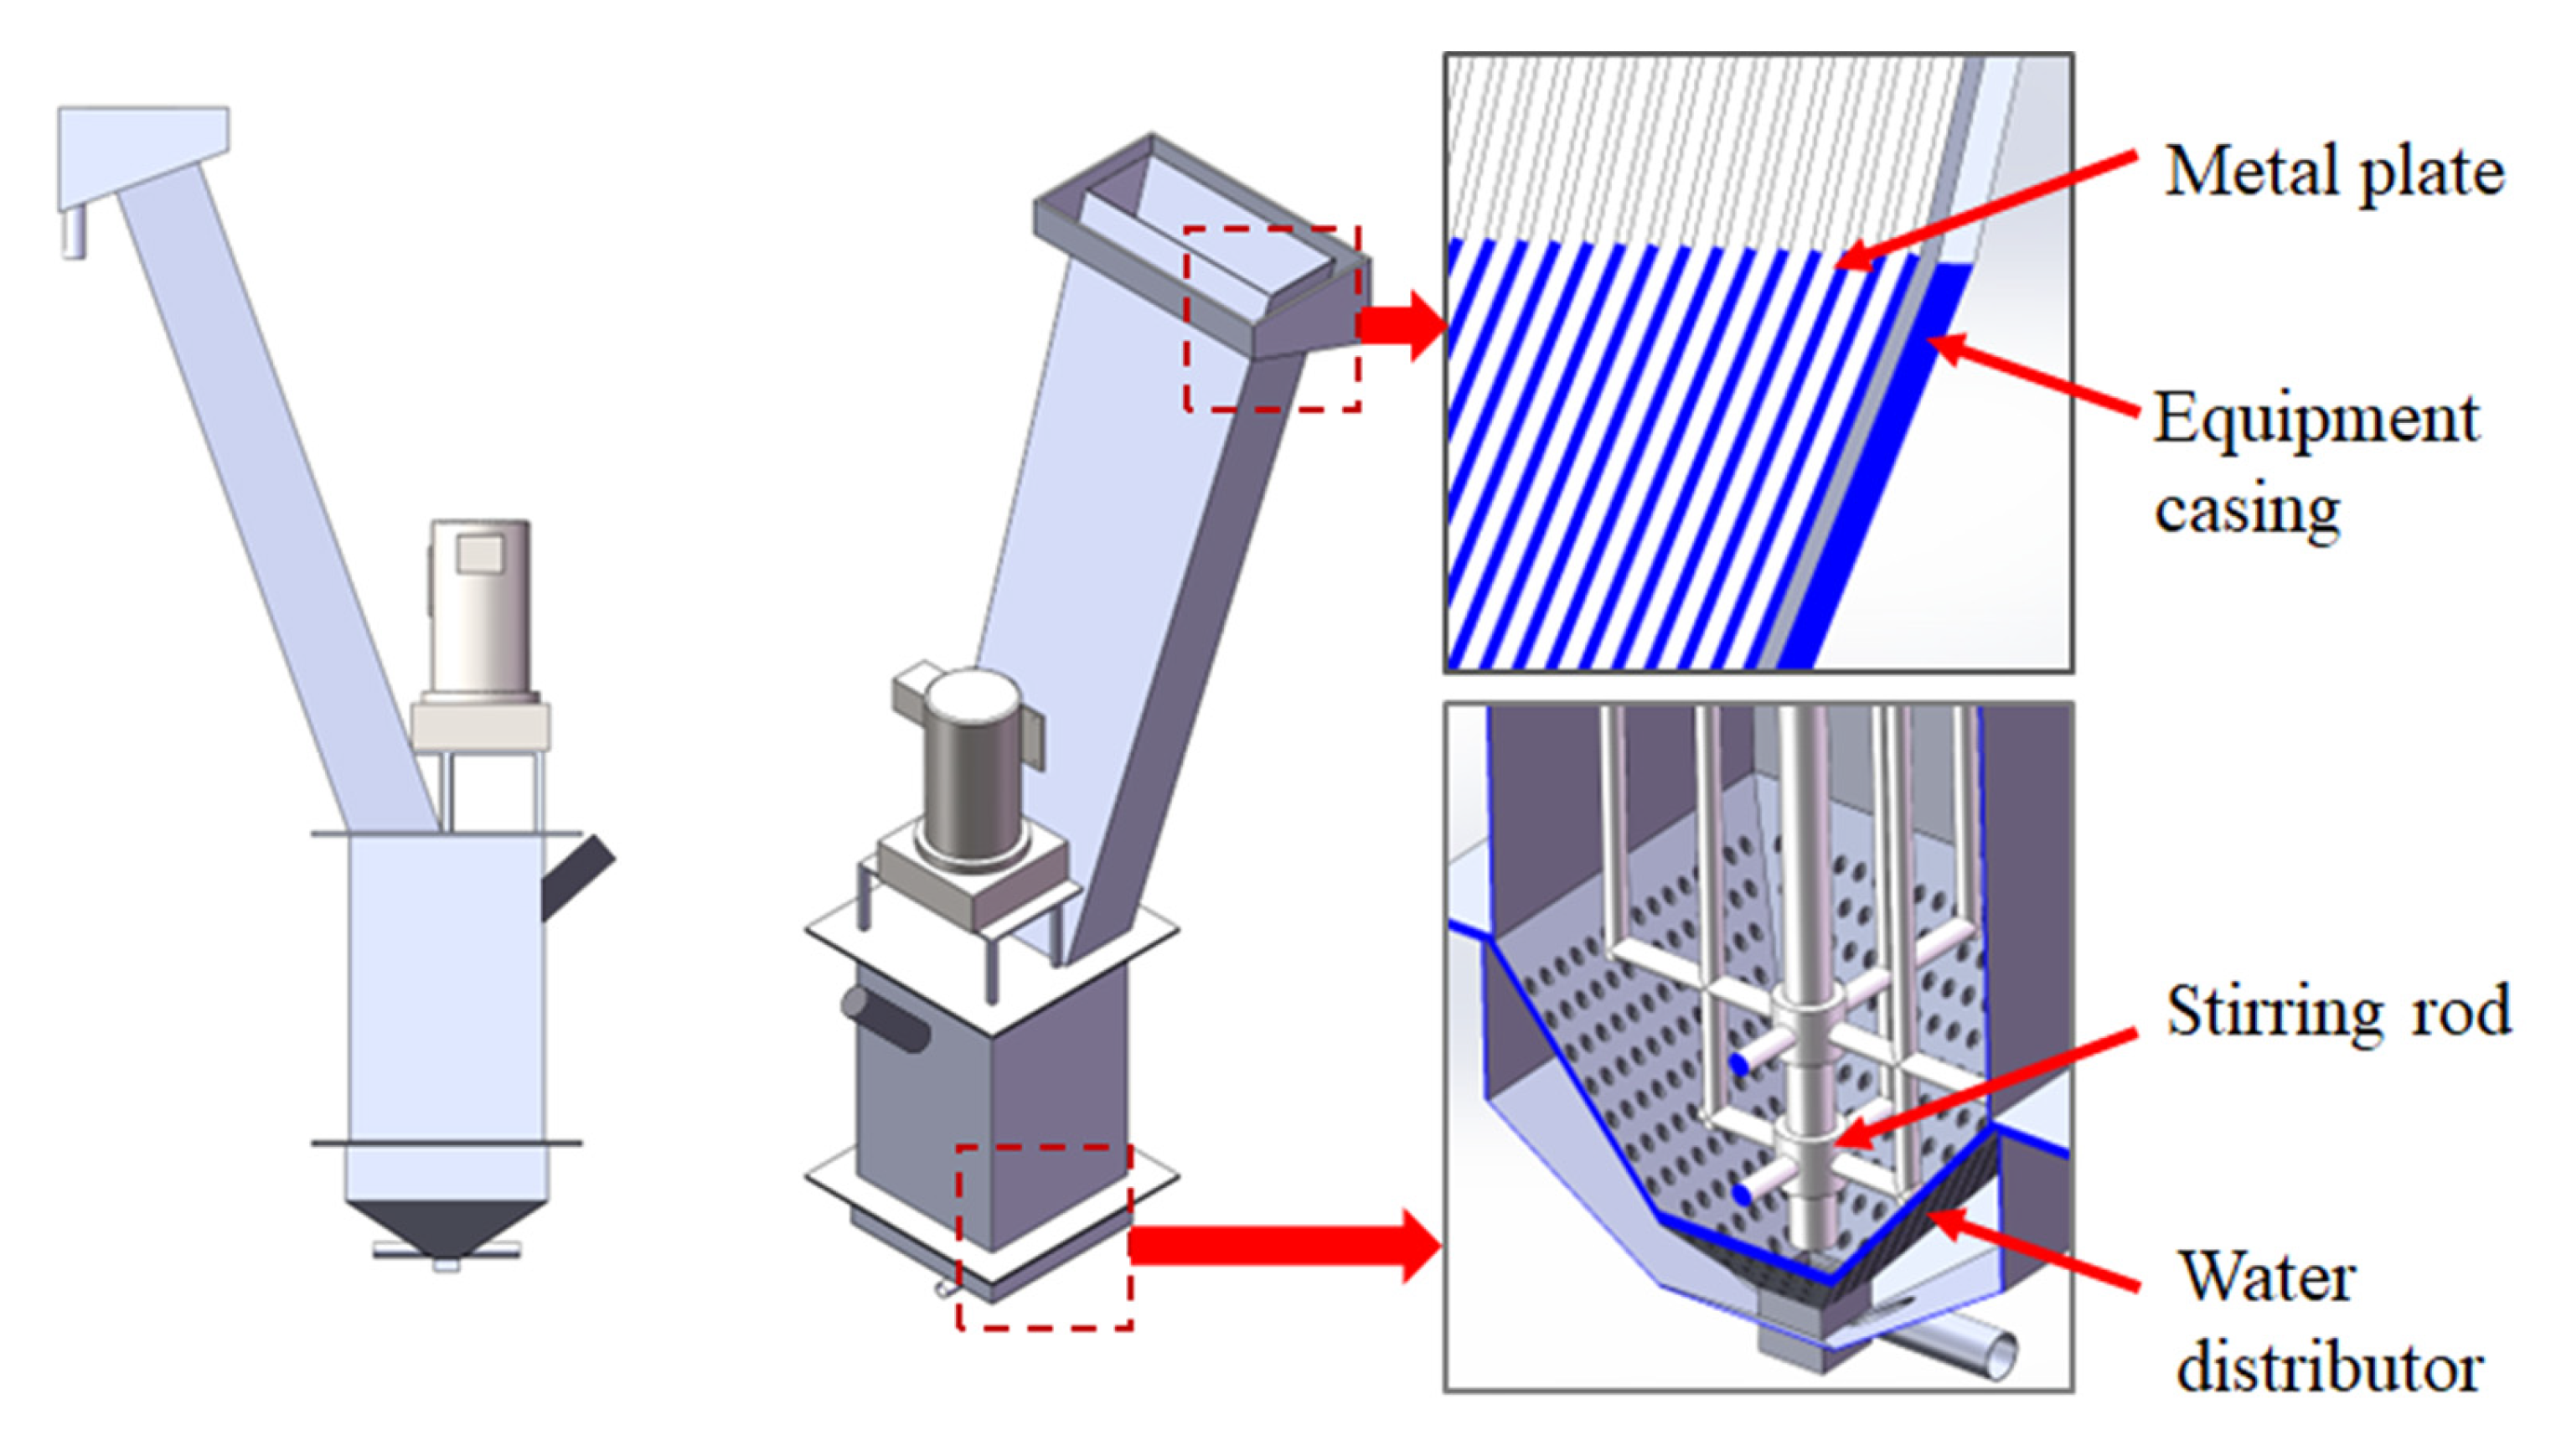
48], and others. Introducing external energy input to enhance loosening in the separation field appears beneficial for particle separation. In addition to laboratory-scale experiments, this gravity separation equipment has been successfully used in pilot-scale trials to process barite and pyrite in lead–zinc flotation tailings, achieving excellent results. The schematic of a pilot-scale ARC is shown in Figure 2 [49].
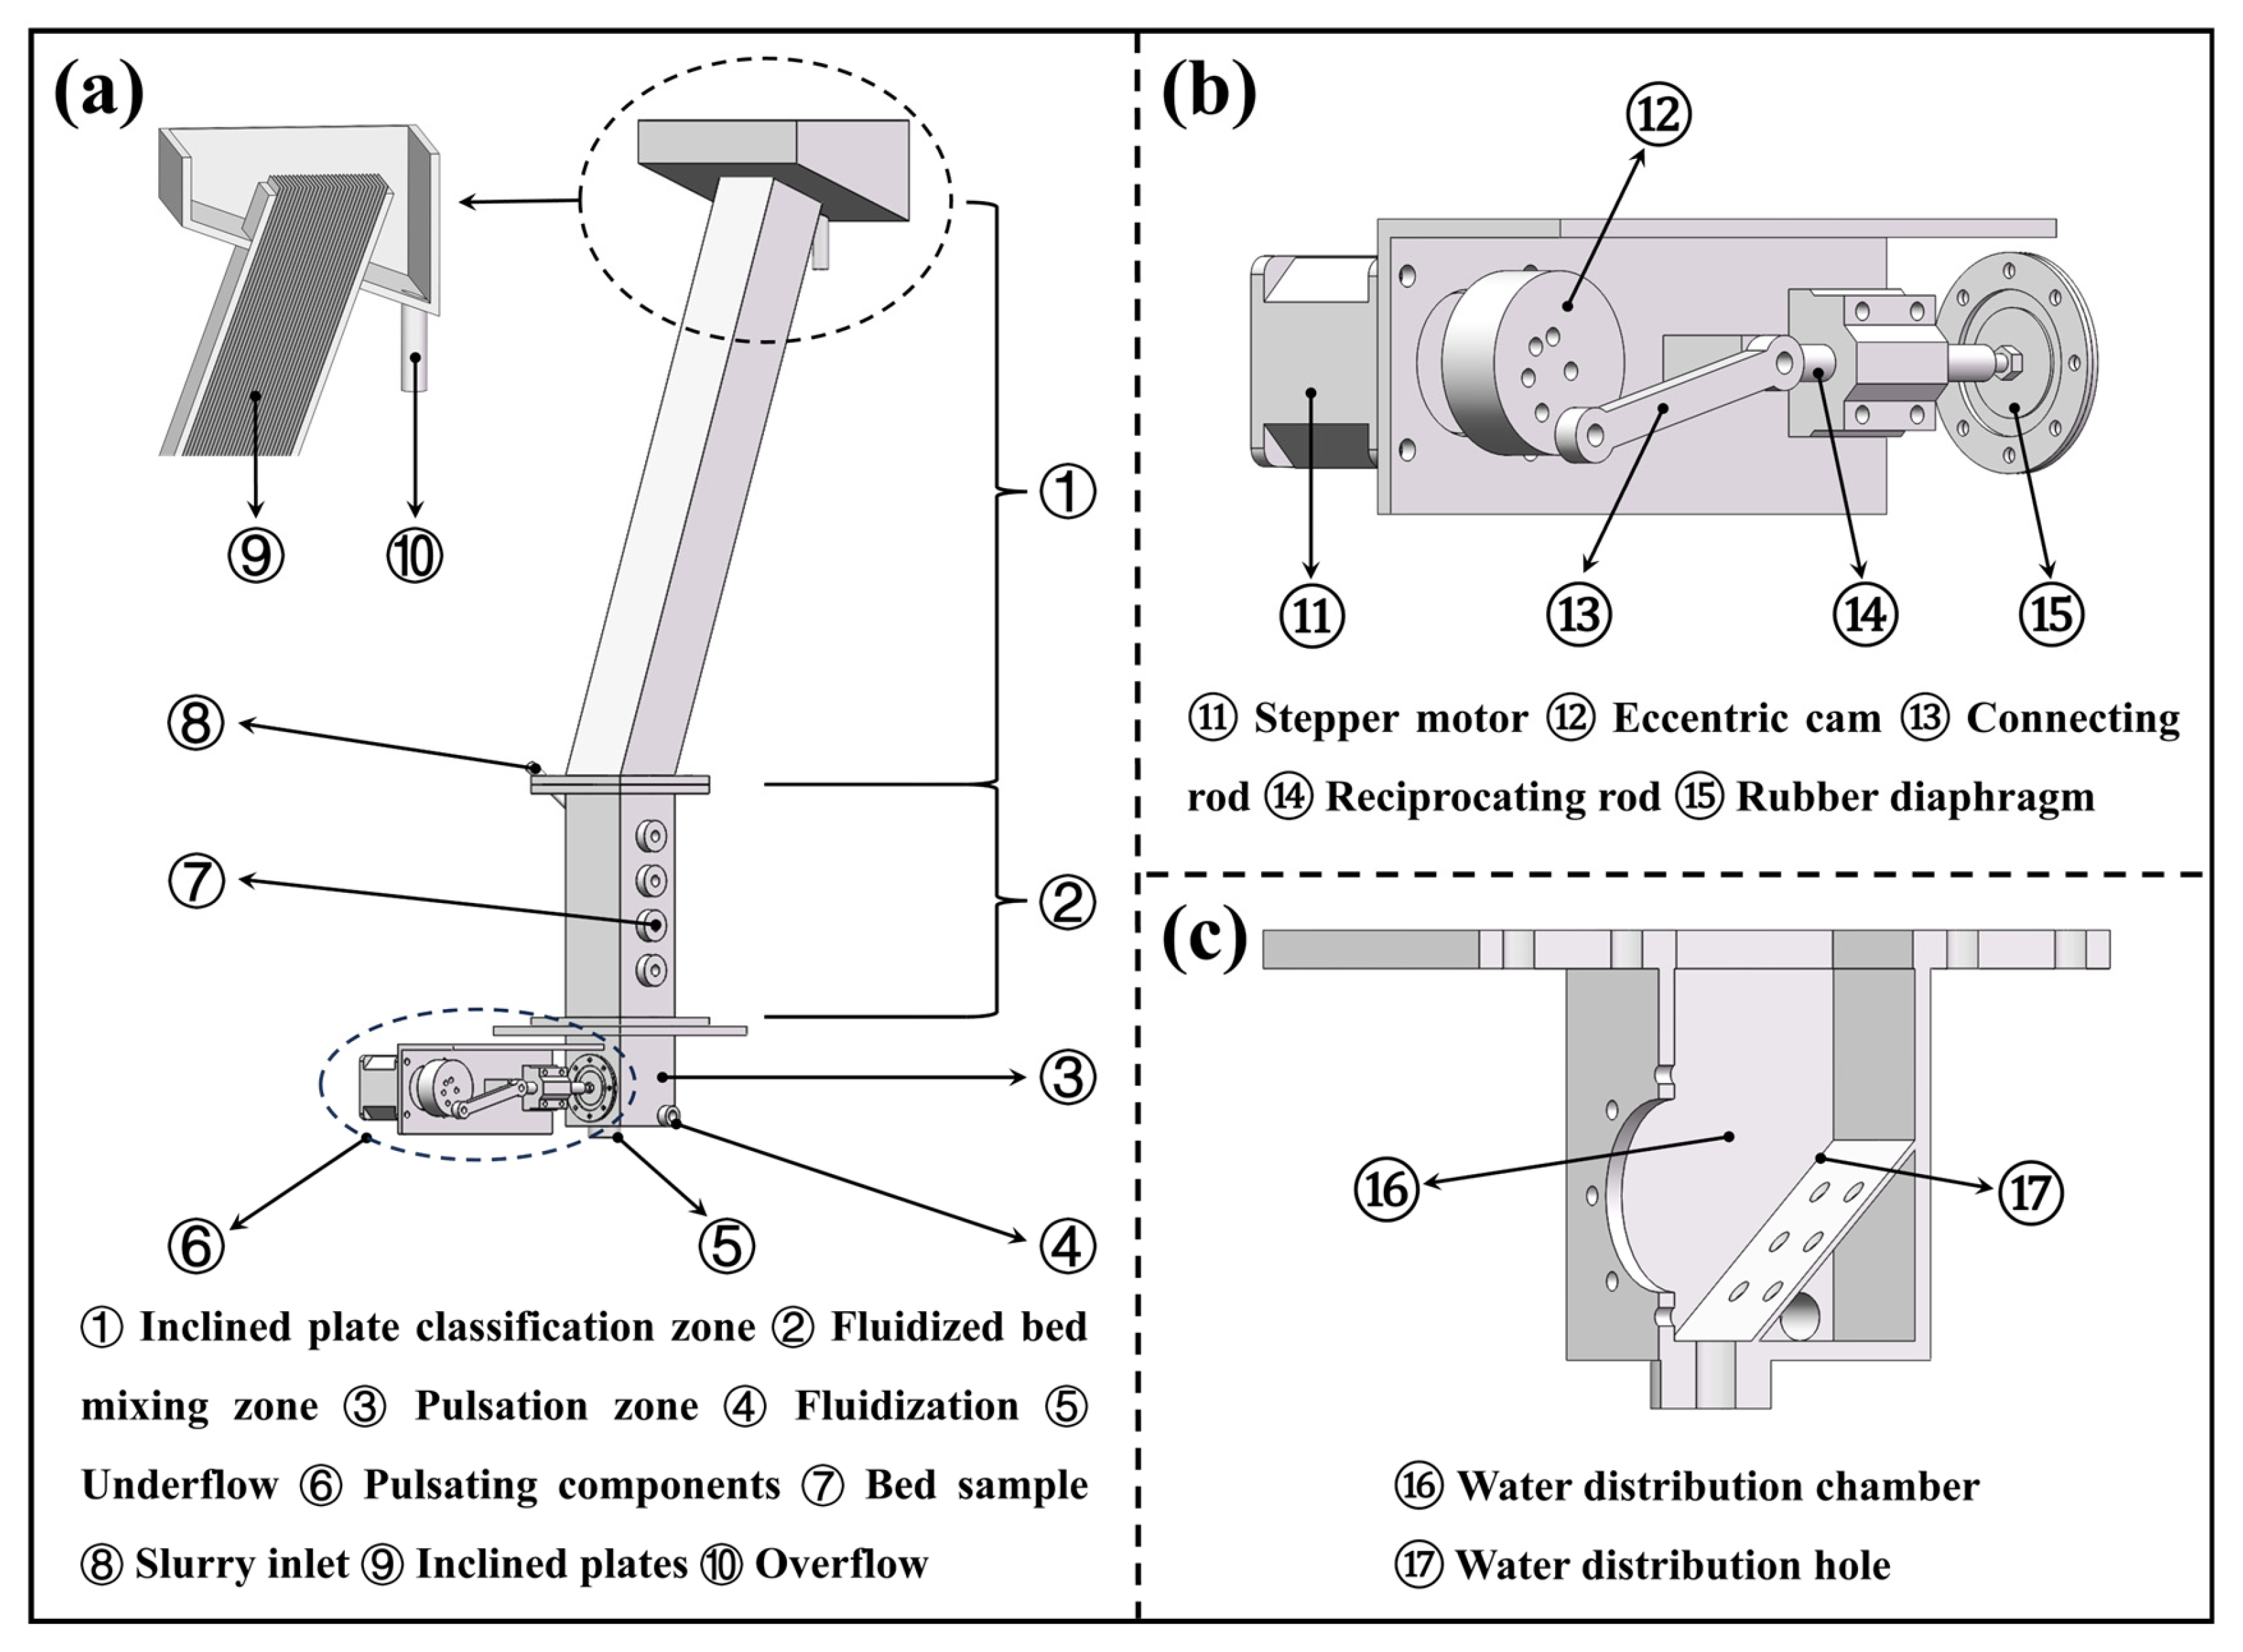
This study will continue along these lines: A pulsation fluid will be employed as the fluidizing medium to explore the potential for using pulsation devices to enhance fluidized bed loosening. Theoretically, the pulsation device, compared to the stirring device, places greater emphasis on enhancing the suspension degree of particles in the vertical direction while reducing the uniform mixing of particles in the horizontal direction. In this paper, we will also compare the final separation indices of both methods.

2. Materials and Methods

2.1. Experimental Equipment

The structure of the pulsation reflux classifier (PRC) used in the laboratory is shown in Figure 3a. This design was based on the previously developed and well-established laboratory prototype of an agitated reflux classifier [43], in which pulsation fluidization was introduced as a replacement for mechanical stirring. The apparatus consisted of a fluidized bed mixing zone, an inclined plate classification zone, a pulsation unit, and an upward-flow water distribution chamber. The fluidized bed mixing zone was a rectangular prism with a height of 200 mm. The slurry inlet was located on the left side, through which the slurry, after being uniformly mixed in the slurry stirring tank, flowed into the column for separation, with the flow rate controlled with a peristaltic pump. Four sampling ports were evenly spaced along the right side of the column chamber at different heights to monitor the bed characteristics. The inclined plate classification section comprised multiple layers of plates arranged at fixed intervals. Specifically, the inclined plate angle in the classification section was 70°, and the plates spacing was 1.5 mm. Slurry entered from the bottom of this section and exits at the top, producing the overflow product. The pulsation unit, detailed in Figure 3b, was mounted on one side of the water distribution chamber. It generated vertically alternating pulsation flow within the fluidized bed mixing zone via a rubber diaphragm driven in reciprocating motion by a motor. At the bottom of the device was the upward-flow water distribution chamber (Figure 3c). A side fluidization inlet allowed water to enter, with its flow rate regulated with a flow meter. This chamber was connected to the bottom of the column, and its surface was evenly distributed with water distribution holes of uniform size, allowing water to enter the fluidized bed uniformly. An outlet at the bottom served as the underflow discharge, with its flow rate controlled with a peristaltic pump.

2.2. Method

Figure 4 shows the flow diagram of the PRC experiment. Before the experiment began, the slurry was prepared to the required concentration, thoroughly mixed, and then poured into the slurry stirring tank. The pulsation frequency was then determined, and the stepping motor speed was set via the pulse control program. After powering on the system, the pulsation unit was activated. Subsequently, the feed rate of the feed peristaltic pump and the underflow rate of the discharge peristaltic pump were configured according to experimental requirements. The flow meter was adjusted to set the fluidization rate, and finally, the feed peristaltic pump was started to introduce the slurry into the system. The internal slurry flow field within the PRC took a long time to reach a steady state. Therefore, all mineral samples were collected 40 min after the experiment began. Underflow and overflow samples were taken simultaneously with the same sampling duration. A duration of 2 min, as commonly used in the laboratory, was sufficient to ensure an adequate amount of ore for subsequent analysis. Afterward, the valves of the four sampling ports on the right side of the fluidized bed mixing zone were opened to collect fluidized bed samples. After filtration, drying, sample preparation, and analysis, data such as the mass and Sb grade of each sample were obtained for experimental analysis. These data were then used to calculate parameters including the yield, recovery, separation efficiency, fluidized bed concentration, etc.

2.3. Sample Preparation

The ore samples used in the experiment were obtained from the flotation tailings of a mixed antimony ore at a beneficiation plant in Hunan, China [42,50]. Dried antimony oxide ore samples were subjected to laser particle size analysis, with the results shown in Figure 5. The results indicated that the average particle size of the oxidized antimony ore was 75.01 μm, with a size D50 of 70.13 μm. Furthermore, X-ray diffraction (XRD) and multi-element chemical analysis of the samples were conducted, respectively, and the results are presented in Table 2. and Figure 6a. The Sb content in the raw ore sample was 0.8%, while the Si and O contents were 42.43% and 51.41%, respectively. The combined content of Si and O approached 94%, indicating that other metal elements, aside from antimony, were present in low concentrations and held no recovery value. The primary gangue mineral in the sample was identified as quartz. The raw ore sample also contained small amounts of mica, kaolinite, calcite, and montmorillonite. Due to the low Sb grade in the raw ore, approximately 0.80%, antimony-bearing minerals were difficult to detect. After gravity concentration using a shaking table, the concentrate was analyzed via XRD. As shown in Figure 6b, the primary antimony-bearing mineral in the raw ore was identified as cervantite [50].

2.4. Evaluation of Experimental Results

The concentrate and tailing products from the PRC were analyzed for their quality and Sb grade. Each set of test conditions was repeated three times, and the average values were used for analysis. Experimental errors were expressed using the standard deviation. The concentrate yield ( γ ), metal recovery ( ε ), and separation efficiency ( E ) were determined based on the formulations provided in Equations (6), (7), and (8), respectively [51]:
γ = m k m x + m k
ε = γ β α
E = α θ / β α α β θ 1 α / β m
where m k and m x represent the mass weights of the concentrate and tailings, respectively. α , β ,  and θ denote the grades of the raw ore, concentrate, and tailings, respectively, and β m is the theoretical grade of the pure mineral.

3. Experimental Results

3.1. Effects of Pulsation Parameters on the Separation of Particles

Condition tests on the pulsation parameters and fluidization rate were conducted to evaluate their effects on the preconcentration and tailing discard performance. Based on previous laboratory studies, the other operational parameters were fixed during condition tests: feed flow rate at 250 mL/min, underflow rate at 20 mL/min, and feed concentration at 35%.

3.1.1. Effect of Pulsation Frequency

By adjusting the speed of the stepper motor, the pulsation frequency was controlled. The pulsation stroke was set to 2 mm and the fluidization rate to 24 L/h. A series of pulsation frequency experiments were then conducted to investigate the effect of the pulsation frequency on the separation performance. The results are shown in Figure 7. As indicated by the concentrate grade curve in the figure, compared with the case without pulsation (0 times/s), the introduction of pulsation significantly improved the concentrate grade and overall separation performance. Both the concentrate grade and tailing discard rate increased with a higher pulsation frequency, which can be attributed to the increased kinetic energy of the mineral particles at a higher frequency, thereby influencing the settling behavior of fine particles on the inclined plates. As the pulsation frequency increased, the concentrate recovery first increased and then decreased, reaching its maximum at a frequency of 2 times/s. Similarly, the separation efficiency also showed a rising-then-falling trend with an increasing pulsation frequency, peaking at 4 times/s. Therefore, it can be concluded that the optimal separation performance was achieved at a pulsation frequency of 4 times/s, with a maximum separation efficiency of 67.7%.
As shown in Figure 7, compared with the case without pulsation, the introduction of the pulsation device improves separation performance primarily by enhancing the concentrate grade. Appropriate pulsation parameters can significantly increase the concentrate grade. This improvement is closely related to the stratification behavior within the fluidized bed. When density-based stratification of particles within the fluidized bed is more pronounced, the concentrate grade in the underflow increases accordingly. This indicates that a suitable pulsation frequency promotes effective bed stratification. However, an excessively high pulsation frequency may lead to an increased tailing discard rate and the loss of valuable minerals, resulting in a slight increase in the tailings grade.

3.1.2. Effect of Pulsation Stroke

The pulsation stroke was controlled by adjusting the eccentricity on the surface of the eccentric cam. When the eccentricity was set to 1 mm, the maximum stroke of the pulsation water flow inside the fluidized bed mixing zone reached 2 mm. By varying the eccentricity, the pulsation stroke could be effectively regulated. With the pulsation frequency fixed at 4 times/s and a fluidization rate of 24 L/h, separation performance was investigated at pulsation strokes of 2 mm, 4 mm, 6 mm, and 8 mm. The results of the pulsation stroke tests are presented in Figure 8. As shown in the figure, the tailing discard rate increases continuously with rising pulsation stroke. When the stroke is below 4 mm, the recovery remains relatively stable, while the concentrate grade increases. A moderate increase in pulsation stroke helps reduce the tailings grade and improve the separation efficiency. However, when the stroke exceeds 4 mm, the recovery drops sharply, and the separation efficiency begins to decline, primarily due to the simultaneous increase in both the tailing discard rate and tailing grade. At higher strokes, the concentrate grade also begins to decrease while the tailing grade remains elevated, indicating that excessive pulsation stroke disrupts bed stability and deteriorates separation performance. The separation efficiency reached its maximum at a pulsation stroke of 4 mm, indicating optimal separation performance under this condition.
At larger pulsation strokes, fine particles travel excessively across the inclined plate layers and are carried into the overflow before they have time to settle, resulting in increased tailings yield and tailings grade, as well as reduced recovery. Consequently, the overall separation efficiency gradually decreases. Therefore, when processing fine-grained antimony oxide ores, an excessively large pulsation stroke should be avoided.

3.1.3. Effect of Fluidization Rate

Based on the results of the pulsation parameter experiments, the optimal separation performance was achieved under a pulsation frequency of 4 times/s and a pulsation stroke of 4 mm. Under the optimal pulsation parameters, the separation performance was investigated at fluidization rates of 16 L/h, 24 L/h, 32 L/h, and 40 L/h. The experimental results are shown in Figure 9. The experimental results indicated that both the concentrate grade and tailing grade increased with a higher fluidization rate. As the flow rate increased from 16 L/h to 32 L/h, the concentrate grade rose from 3.53% to 4.20%, while the tailing grade also increased slightly. However, the tailing discard rate increased significantly, leading to a gradual decline in recovery rate. When the fluidization rate reached 32 L/h, the recovery rate dropped to 80.84%, approximately 5 percentage points lower than at 16 L/h. The influence of the fluidization rate on the separation efficiency was relatively minor, but the highest separation efficiency was observed at 24 L/h, indicating the best overall separation performance under this condition.
Under the action of the pulsation system, the upward flow transformed into a vertically alternating pulsation stream. The stable upflow water velocity and the additional pulsation velocity have a longer upward effect duration within one cycle. Therefore, if the upflow water velocity inside the equipment is increased, the duration of the upward effect of the pulsation water flow gradually increases. Fine-grained antimony oxide ores in the fluidized bed mixing zone are difficult to settle, leading to their entry into the overflow and an increase in the tailings grade. However, the upflow water also aids in washing the concentrate particles, which improves the concentrate grade. As the tailings yield and tailings grade increase, the overall Sb recovery and separation efficiency gradually decrease.

3.1.4. Comparison of Separation Performance Under Pulsation and Non-Pulsation Conditions

Based on the parametric experiments, the optimal separation performance was achieved under the following conditions: pulsation frequency of 4 times/s, pulsation stroke of 4 mm, and fluidization rate of 24 L/h. To evaluate the influence of pulsation, a comparative test was conducted under the same operational conditions but with the pulsation system turned off. The separation performance comparison is shown in Table 3. Effective separation was achieved even without pulsation. The concentrate grade reached 4.66%, and the separation efficiency was 68.58%. However, the introduction of the pulsation system further enhanced the separation performance. Both the Sb concentrate grade and recovery improved, resulting in an increase in overall separation efficiency from 68.58% to 70.53%.

3.2. Statistical Modeling of the Preconcentration Process

A statistical model was developed to analyze the effects of three main variables, specifically the pulsation frequency (times/s), pulsation stroke (mm), and fluidization rate (L/h), on the separation performance index. These three experimental factors were arranged according to a three-level Box–Behnken Design (BBD). The Sb grade, recovery, and separation efficiency of the concentrate were selected as the response variables. When the number of center point repetitions was set to 3, a three-factor, three-level BBD required 15 experimental runs. The coding and levels of the independent variables in the BBD are listed in Table 4. The experimental results of pulsation reflux classifier are summarized in Table 5. Based on the three independent variables, the classical second-order response surface model was expressed as Equation (9) [52]:
y =   α 0 + α 1 x 1 + α 2 x 2 + α 3 x 3 + α 11 x 1 2 + α 22 x 2 2 + α 33 x 3 2 + α 12 x 1 x 2 + α 13 x 1 x 3 + α 23 x 2 x 3
where y represents the predicted response value, and α is the model constant. x , x , and x are the controllable independent variables, respectively. α , α 2 , and α are the linear coefficients, α , α , and α are the interaction coefficients, and α , α 22 , and α are the quadratic coefficients.
In this study, the experimental data were processed using Design Expert 13.0 software for statistical design and mathematical analysis. The coefficients in Equation (9) were determined using the least squares method, and functional models describing the relationships between the independent variables and response values were established. The concentrate Sb grade ( y ), recovery ( y ), and separation efficiency ( y ) were expressed as second-order polynomial functions of the pulsation frequency ( x ), pulsation stroke ( x ), and fluidization rate ( x ). The corresponding models are presented as Equations (10)–(12).
y 1 = 0.4654 + 0.6765 x 1 + 0.6118 x 2 + 0.1752 x 3 0.0016 x 1 x 2 + 0.0091 x 1 x 3 0.0025 x 2 x 3 0.1082 x 1 2 0.0573 x 2 2 0.0029 x 3 2
y 2 = 72.05 0.9406 x 1 + 1.379 x 2 + 1.0499 x 3 0.2679 x 1 x 2 + 0.0635 x 1 x 3 + 0.0613 x 2 x 3 0.1429 x 1 2 0.4883 x 2 2 0.0264 x 3 2
y 3 = 45.27 + 2.6683 x 1 + 2.9667 x 2 + 1.2069 x 3 0.2627 x 1 x 2 + 0.0431 x 1 x 3 + 0.0443 x 2 x 3 0.4354 x 1 2 0.5675 x 2 2 0.0257 x 3 2
The analysis of variance (ANOVA) for the model of y 1 (Sb grade of the concentrate) is shown in Table 6. The results indicate that the model has an F-value of 29.09, which is greater than the critical value F0.01(9, 5) = 10.02, suggesting that the regression model performs well. The p-value of the model is much less than 0.0500, indicating that the model is statistically significant, and there is a highly significant relationship between the response variable y 1  and the independent variables. Furthermore, the lack-of-fit p-value for the regression model of y 1 is greater than 0.05, showing that the lack of fit is not significant, indicating that the proportion of unexplained error in the regression model is relatively small. This suggests that the regression equation for y 1 fits the experimental data well and that the model is stable.
The analysis of variance (ANOVA) for the model of y 2 (Sb recovery rate) is presented in Table 7. The results show that the model has an F-value of 131.82, indicating a strong regression performance. The p-value of the model is much less than 0.0500, demonstrating that the regression equation for y 2 has a highly significant relationship with the independent variables. The lack-of-fit p-value for the y 2 model is 0.1969, which is greater than 0.05, indicating that the lack of fit is not significant. Therefore, the regression model fits well and is considered stable.
The analysis of variance of the y 3 (separation efficiency) model is shown in Table 8. As shown by the ANOVA results, the model has an F-value of 178.7, indicating a strong regression performance. The p-value is much smaller than 0.0500, demonstrating that the model is statistically significant. In contrast, the lack-of-fit term has a p-value greater than 0.05, suggesting that the lack of fit is not significant. Therefore, the regression equation provides a good fit to the experimental data, and the model is considered stable.

3.2.1. Effects of Factors on the Concentrate Grade

Based on Equation (10) and Table 6, it is evident that the variables x 1 (pulsation frequency), x 2 (pulsation stroke), and x 3 (fluidization rate) all have significant effects on the Sb concentrate grade. This suggests that increasing all the variables contributes to an improvement in the concentrate grade. Moreover, all three independent variables have positive coefficients in the regression equation, indicating positive effects. Among the three interaction terms, only the x 1 x 3 term is statistically significant. Its positive coefficient indicates that the interaction between the pulsation frequency and fluidization rate contributes positively to the improvement of the concentrate grade. All three quadratic terms have a significant effect on the grade. In the regression equation for y 1 , the coefficients of x 1 2 , x 2 2 , and x 3 2 are all negative, suggesting negative quadratic effects. This implies that an excessively high pulsation frequency, pulsation stroke, and fluidization rate can reduce the concentrate grade. Under such conditions, fine high-grade antimony oxide particles may be carried into the overflow by the intensified upflow, resulting in the loss of valuable minerals and a decrease in the Sb grade in the concentrate.
The regression equation for y 1 was used to plot response surfaces and contour maps, as shown in Figure 10. When analyzing the interaction between two variables, the third variable was held at its midpoint value.
Figure 10a illustrates the interaction effect of the pulsation frequency and stroke on the concentrate grade. From the response surface and contour plots, it can be seen that when the pulsation stroke is fixed, the concentrate grade is more sensitive to changes in the pulsation frequency. At higher pulsation strokes, the increase in the concentrate grade with a rising pulsation frequency is more pronounced. In contrast, when the pulsation frequency is fixed, the effect of stroke variation on the concentrate grade is relatively minor. This indicates that the pulsation frequency has a more significant impact on the concentrate grade than the stroke. When the pulsation frequency ranges from 4 times/s to 5 times/s, the Sb concentrate grade is generally higher, reaching a peak of over 5.4% at a stroke around 5 mm.
Figure 10b shows the interaction between the pulsation frequency and fluidization rate. When the fluidization rate is constant, the concentrate grade is again more strongly affected by the pulsation frequency. At a higher fluidization rate (32–40 L/h), the concentrate grade increases more significantly with an increasing pulsation frequency. When the pulsation frequency is between 2 times/s and 3.5 times/s, changes in the fluidization rate have little impact on the concentrate grade. However, when the pulsation frequency is in the range of 4–5 times/s, the concentrate grade increases with an increasing fluidization rate. Under these conditions (pulsation frequency of 4–5 times/s and fluidization rate of 32–40 L/h), the Sb concentrate grade remains consistently high, exceeding 5.43%.
Figure 10c depicts the interaction between pulsation stroke and the fluidization rate. According to the response surface and contour plots, the concentrate grade increases with both pulsation stroke and the fluidization rate. The contour spacing indicates that the influence of pulsation stroke on the concentrate grade is more significant than that of fluidization rate, as a larger stroke leads to a greater improvement in the concentrate grade.

3.2.2. Effects of Factors on the Concentrate Recovery

According to Equation (11) and Table 7, the variables x 1 (pulsation frequency), x 2 (pulsation stroke), and x 3 (fluidization rate) all have significant effects on the recovery. In the regression model, the coefficient of x 1 is negative, indicating that increasing the pulsation frequency tends to reduce the recovery. Conversely, the coefficients of x 2 and x 3 are positive, suggesting that increasing pulsation stroke and fluidization rate is beneficial for enhancing recovery. All three interaction terms are statistically significant, among which the interaction term x 1 x 2 has a negative coefficient, implying that the combined effect of a higher pulsation frequency and stroke can reduce recovery.
The quadratic terms also have significant influences on recovery. In the regression model for y 2 , the coefficients of x 1 2 , x 2 2 , and x 3 2 are all negative, indicating diminishing returns, meaning that an excessively high pulsation frequency, stroke, and fluidization rate adversely affect the recovery. Based on the regression equation for y 2 (Equation (11)), response surface plots were generated, as shown in Figure 11.
Figure 11a illustrates the interaction effect of the pulsation frequency and pulsation stroke on recovery. As shown in the response surface and contour plots, the recovery increases as both the pulsation frequency and amplitude decrease. The contour lines are approximately symmetric about the diagonal, indicating that the influence of the pulsation frequency and stroke on recovery is similarly significant. The highest recovery is achieved when the pulsation frequency ranges from 2 to 4 times/s and the amplitude is between 2 mm and 4 mm.
Figure 11b shows the interaction between the pulsation frequency and fluidization rate on recovery. When the pulsation frequency is below 3 times/s, the recovery increases with a decreasing fluidization rate. When the frequency exceeds 3 times/s, the fluidization rate has a minimal effect on recovery. At a constant fluidization rate, the recovery is more sensitive to changes in the pulsation frequency. The highest recovery, reaching up to 83.4%, occurs at a lower pulsation frequency and when the fluidization rate is below 32 L/h.
Figure 11c depicts the interaction between the fluidization rate and pulsation stroke. When the pulsation stroke exceeds 4 mm, the fluidization rate has little impact on the recovery. At a fixed fluidization rate, the recovery increases as the stroke decreases, particularly when the fluidization rate is below 36 L/h. Overall, the recovery is more significantly influenced by pulsation stroke. Higher recovery levels are achieved when the fluidization rate is below 32 L/h and the pulsation stroke is relatively small.

3.2.3. Effects of Factors on the Separation Efficiency

According to Equation (12) and Table 8, all three independent variables have significant and positive effects on the separation efficiency, indicating that increasing any of these variables contributes to improved separation performance. The interaction terms also show a notable impact on the recovery rate. Specifically, the negative coefficient of the x 1 x 2 term suggests that the interaction between the pulsation frequency and stroke tends to reduce the separation efficiency. All three quadratic terms significantly affect the separation efficiency as well. In the regression model for y 3 , the negative coefficients of the quadratic terms indicate that an excessively high pulsation frequency, stroke, or fluidization rate can lead to a decline in separation efficiency. Response surface plots based on the regression equation for y 3 are shown in Figure 12.
Figure 12a illustrates the interaction between the pulsation frequency and stroke on separation efficiency. Both the response surface and contour plots indicate that when the pulsation stroke exceeds 5 mm, the impact of the pulsation frequency on the separation efficiency becomes minimal. However, when the stroke is less than 5 mm, the separation efficiency increases with a decreasing pulsation frequency. The influence of pulsation stroke on separation efficiency is more pronounced. The highest separation efficiency of 70.6% is achieved when the pulsation stroke is below 4 mm and the pulsation frequency is between 3 times/s and 5 times/s.
Figure 12b presents the interaction between the pulsation frequency and fluidization rate. The contour plots show symmetry along the diagonal, indicating that the pulsation frequency and fluidization rate have a similar degree of influence on the separation efficiency. The separation efficiency increases as both the pulsation frequency and fluidization rate decrease.
Figure 12c shows the interaction between the fluidization rate and pulsation stroke. Similar to the effect of the pulsation frequency, the influence of the fluidization rate is significant. The contour plots reveal that pulsation stroke has a more prominent effect on separation efficiency. The highest separation efficiency, reaching 71%, occurs when the pulsation stroke is less than 4 mm and the fluidization rate is below 32 L/h.

3.2.4. Optimization of the Preconcentration Process

Based on the regression equations for y 1 , y 2 , and y 3 , considering the concentrate grade, recovery, and separation efficiency comprehensively, the optimal solution was explored under the condition where all three response values were maximized. According to the results from Design Expert 13.0 software, the predicted values and corresponding separation conditions for the maximized response values are shown in Table 9.
To validate this optimization, experimental verification was conducted. Due to the insufficient precision in the manufacturing of the eccentric wheel, the pulsation amplitude was adjusted to 4 mm, and the fluidization rate was approximated to 32 L/h for the experimental verification. The experimental results are shown in Table 10.
From Table 10, it can be observed that after the response surface optimization, the concentrate grade reached 5.48%, while 88.57% of the tailings, with a grade of 0.16%, were removed before shaking table separation. The separation efficiency of the equipment was calculated to be 70.97%. A comparison of the optimized results from the response surface experiment with the best separation effect from the conditions tested in Section 3.1, through the response surface optimization experiment, showed that increasing the fluidization rate further improved the concentrate grade, with the separation efficiency rising from 70.53% to 70.97%, while the loss in the recovery rate was minimal. Therefore, appropriate pulsation parameters can effectively enhance both the concentrate grade and the separation efficiency of the equipment.

4. Analysis of the Fluidized Bed Characteristics

To investigate the changes in the bed characteristics under different pulsation water flow conditions, selected separation indicators and bed layer samples from the conditional experiments in Section 3.1 were analyzed to assess the effects of pulsation flow on bed parameters, including the concentration, density, and Sb grade. The bed concentration and suspension density were derived from the volume and mass of the obtained bed slurry. Based on the variation characteristics of bed parameters, the changes in bed looseness were analyzed to further demonstrate the effects of pulsation water flow on bed suspension and stratification and to explain the particle separation behavior within the bed layer. The primary focus was on the influence of pulsation parameters and fluidization on the bed characteristics, as these factors significantly affect the motion characteristics of the pulsation water flow. To determine the bed parameters at various heights within the bed, a coordinate system was established, as shown in Figure 13.

4.1. Effect of Pulsation Frequency on Fluidized Bed Characteristics

Samples of the bed layer were collected from sampling holes on the side of the column at heights of 40 mm, 80 mm, 120 mm, and 160 mm above the water distribution chamber. The sample taken at −40 mm was the underflow sample. The variation in bed parameters with the pulsation frequency is shown in Figure 14.
As shown in Figure 14, within the height range from 40 mm to −40 mm, the abrupt increase in the three bed parameters is attributed to the settling of particles at the bottom of the bed, followed by their discharge through the underflow outlet. From Figure 14a, it can be observed that the Sb grade of the entire fluidized bed increases as the pulsation frequency increases. At a higher pulsation frequency, the Sb grade varies significantly at different heights, while at non-pulsation or low-pulsation conditions, the Sb grades at different heights are relatively similar. Between 40 mm and 120 mm, the Sb grade of the bed layer under pulsation conditions is generally higher than under non-pulsation conditions, resulting in a higher concentr ate grade under pulsation conditions. From 120 mm to 160 mm, the trend of change in the Sb grade at different heights is the same. Since the bed at 160 mm is close to the bottom of the slanted plate region, a larger number of particles from the slanted plate area flow back. At a higher pulsation frequency, the Sb grade at 160 mm is higher than at 120 mm, indicating that a higher pulsation frequency helps to return useful minerals. From Figure 14b,c, it can be seen that compared to the non-pulsation condition, at certain pulsation frequencies, both the bed concentration and the slurry density are relatively higher, while at the underflow port, the bed concentration and slurry density are lower. This suggests that under non-pulsation conditions, high-density particles tend to accumulate more in the conical section of the column after undergoing hindered settling, resulting in a higher density and mass concentration at the underflow port. In contrast, under the pulsation conditions, the vertical alternating flow generated by the pulsation device helps bring particles from the cone region back to the bed layer area of the column. As a result, the bed concentration and slurry density between 40 mm and 160 mm are generally higher, and particle suspension within the bed is more favorable for separation. However, as the pulsation frequency increases, the number of high-density particles in the underflow decreases, and an excessively high pulsation frequency may hinder high-density particles from entering the underflow. Furthermore, under pulsation conditions, the slurry density of the bed increases as the height decreases, indicating that the pulsation water flow aids in the stratification of particles by density, with high-density particles concentrated in the lower layers and low-density particles in the upper layers.

4.2. Effect of Pulsation Stroke on Fluidized Bed Characteristics

The pulsation stroke is closely related to the velocity and acceleration of the pulsation water flow. Therefore, changes in the stroke have a significant impact on the bed parameters. When the pulsation frequency is set at 4 times/s, the variations in bed parameters with respect to different pulsation stroke conditions are shown in Figure 15.
From Figure 15a, it can be observed that the Sb grade in the bed increases as the pulsation stroke increases. When the pulsation stroke is 2 mm and 4 mm, the Sb grade in the bed and the underflow grade are relatively low, with little variation in the Sb grade at different heights. However, when the pulsation stroke is 6 mm and 8 mm, the Sb grade in the bed increases to higher levels, with greater fluctuations. Due to the larger stroke at 8 mm, more valuable mineral particles are suspended in the bed layer, resulting in a slightly lower underflow grade compared to the 6 mm stroke. At higher pulsation strokes, the Sb grade in the bed from the 40 mm to 80 mm height range is higher than that from 120 mm to 160 mm. This is due to the enhanced suction effect of the pulsation water flow during its descending phase, which increases the descent speed of valuable mineral particles, causing them to be suspended near the bottom of the bed. As seen in Figure 15b, the bed concentration increases with the pulsation stroke. As the stroke increases, the upward velocity of the particles also increases, the number of particles in the bed increases, and the underflow concentration decreases. When the pulsation stroke is 8 mm, the underflow concentration becomes similar to the bed concentration at all heights. From Figure 15c, it is evident that the bed slurry density increases with the pulsation stroke, while the underflow density decreases. When the pulsation stroke is 2 mm or 4 mm, the bed slurry density is relatively low, and the underflow density is higher. The bed density increases as the height decreases, indicating that under lower pulsation stroke conditions, particles tend to layer according to density. When the pulsation stroke is 6 mm, high-density particles are located at higher heights, and the density near the bed bottom is slightly lower. When the pulsation stroke is 8 mm, the underflow density is similar to the bed density, and the slurry density at all bed heights fluctuates significantly. However, it is still evident that the slurry density decreases with height, suggesting that higher pulsation stroke facilitate the downward movement of more low-density particles.

4.3. Effect of Fluidization Rate on Fluidized Bed Characteristics

The rising fluidization rate determines the magnitude of the stable rising water velocity u d , which, in turn, affects the duration of the pulsation water flow’s rising phase. The larger ud is, the longer the duration of the pulsation water flow’s rising phase, and the relative velocity of particle movement will also increase. The variation in bed parameters with a rising fluidization rate under different fluidization rate conditions is shown in Figure 16.
As shown in Figure 16a, the Sb grade of both the bed and the underflow increases as the fluidization rate increases. At a lower fluidization rate, the Sb grades in both the bed and underflow are relatively low. When the fluidization rate exceeds 24 L/h, the Sb grade at 160 mm is generally higher than that at 120 mm. In the height range from 80 mm to 120 mm, the fluidization rate has little effect on the bed’s Sb grade, and the Sb grade in this section remains relatively constant, all higher than the grade at 40 mm. Figure 16b illustrates that at higher fluidization rates, the bed concentration is lower, and the concentration in the 80 mm to 120 mm height range is lower than that at both the bed’s bottom and top. At lower fluidization rates, the bed concentration at the 120 mm to 160 mm height range is similar, and as the fluidization rate decreases, the bed concentration gradually increases. From Figure 16c, the bed’s suspension density decreases as the fluidization rate increases. At lower fluidization rates, the density differences across different heights are more pronounced. Lower fluidization rates are more favorable for particle stratification based on density. Therefore, increasing the fluidization rate extends the duration of the pulsation water’s rising phase, leading to little change in the bed’s suspension density and negating the stratification effect. Under the action of fluidization water, the number of particles per unit volume decreases, and the higher Sb grade in the bed indicates that the rising water has a mineral washing effect.

5. Conclusions

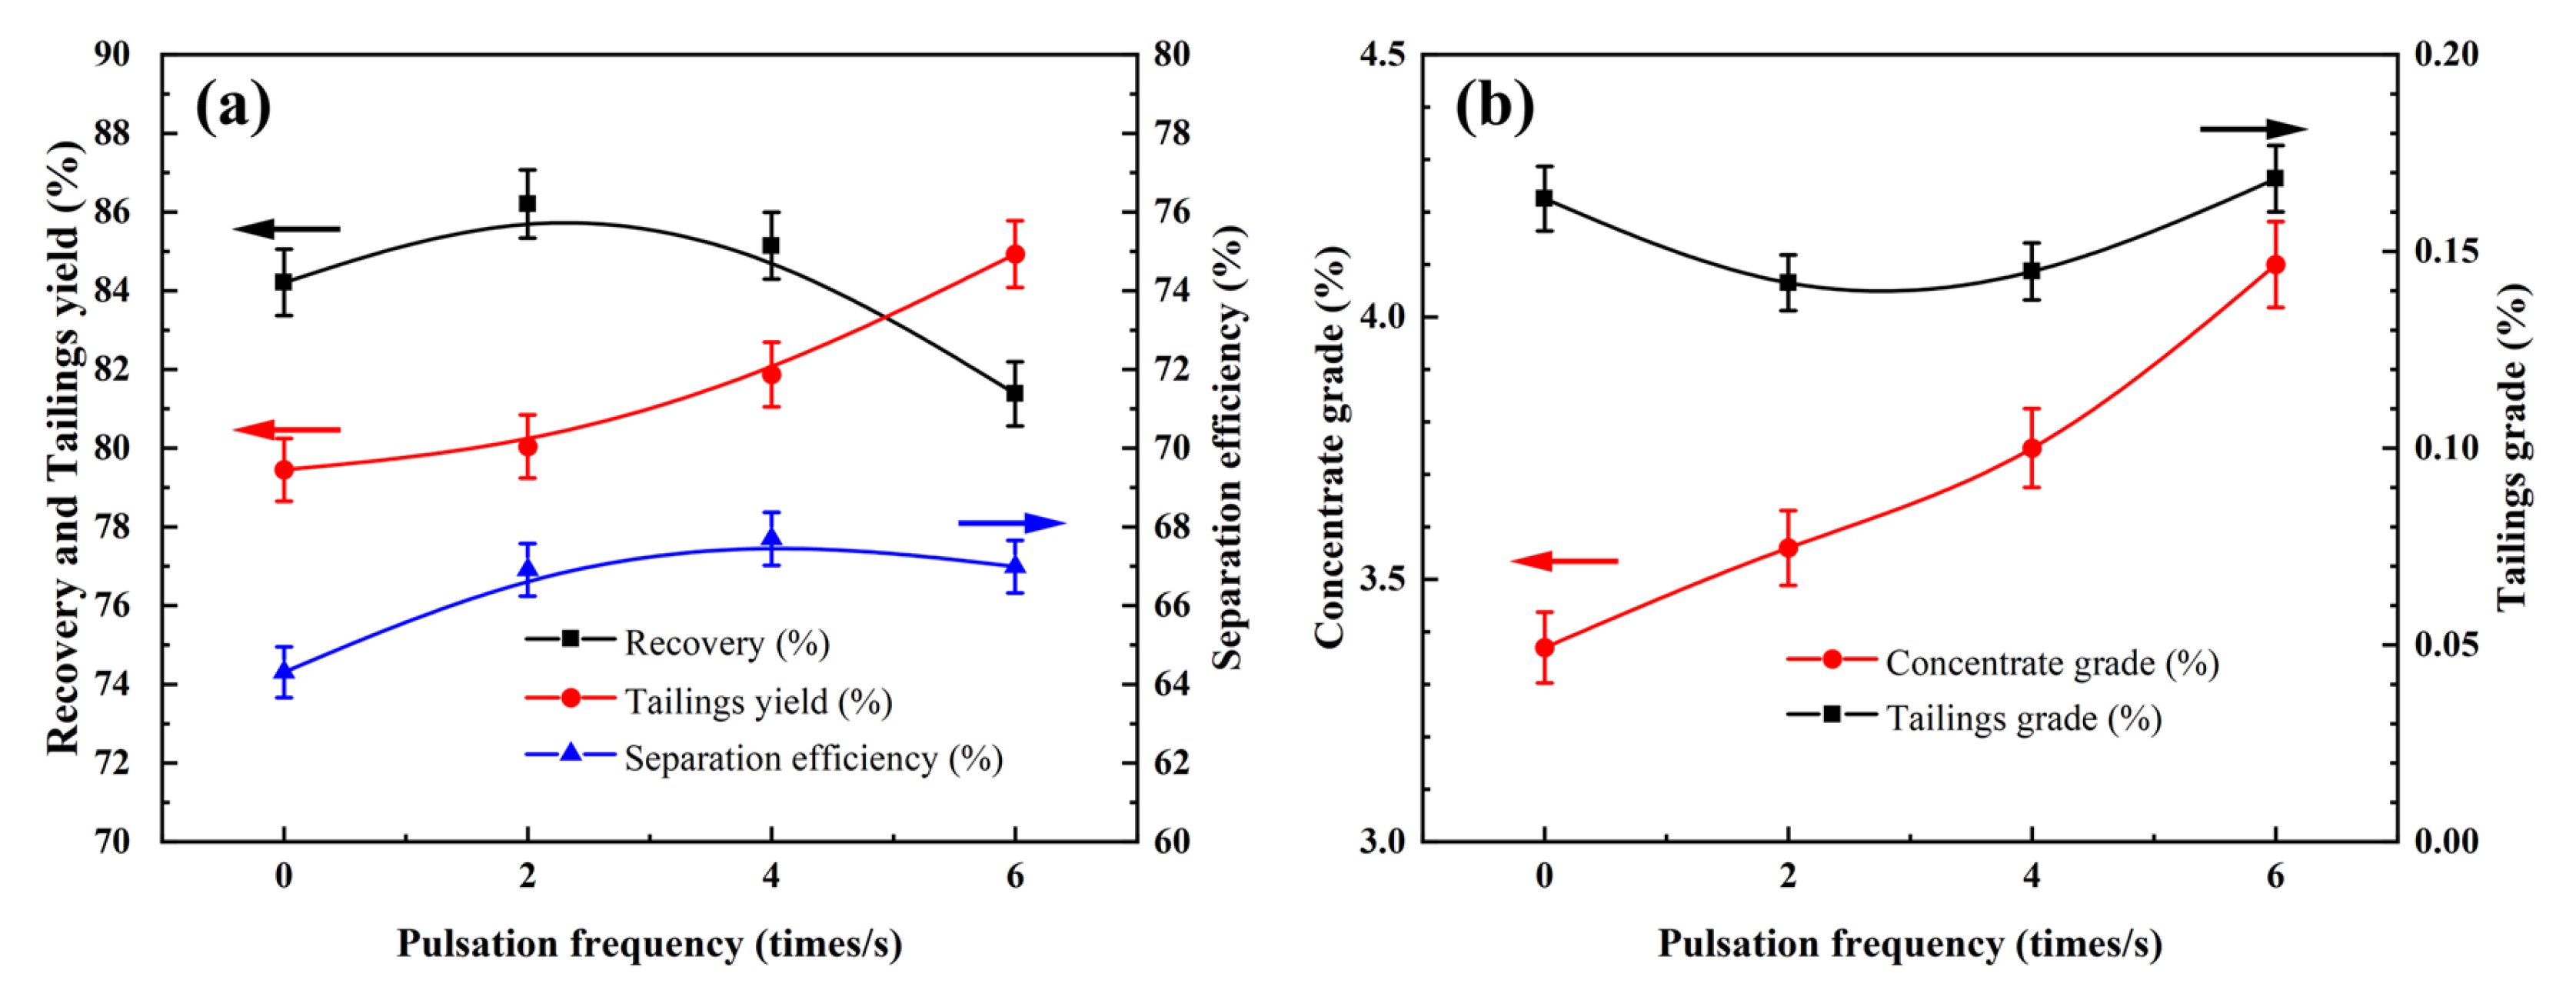
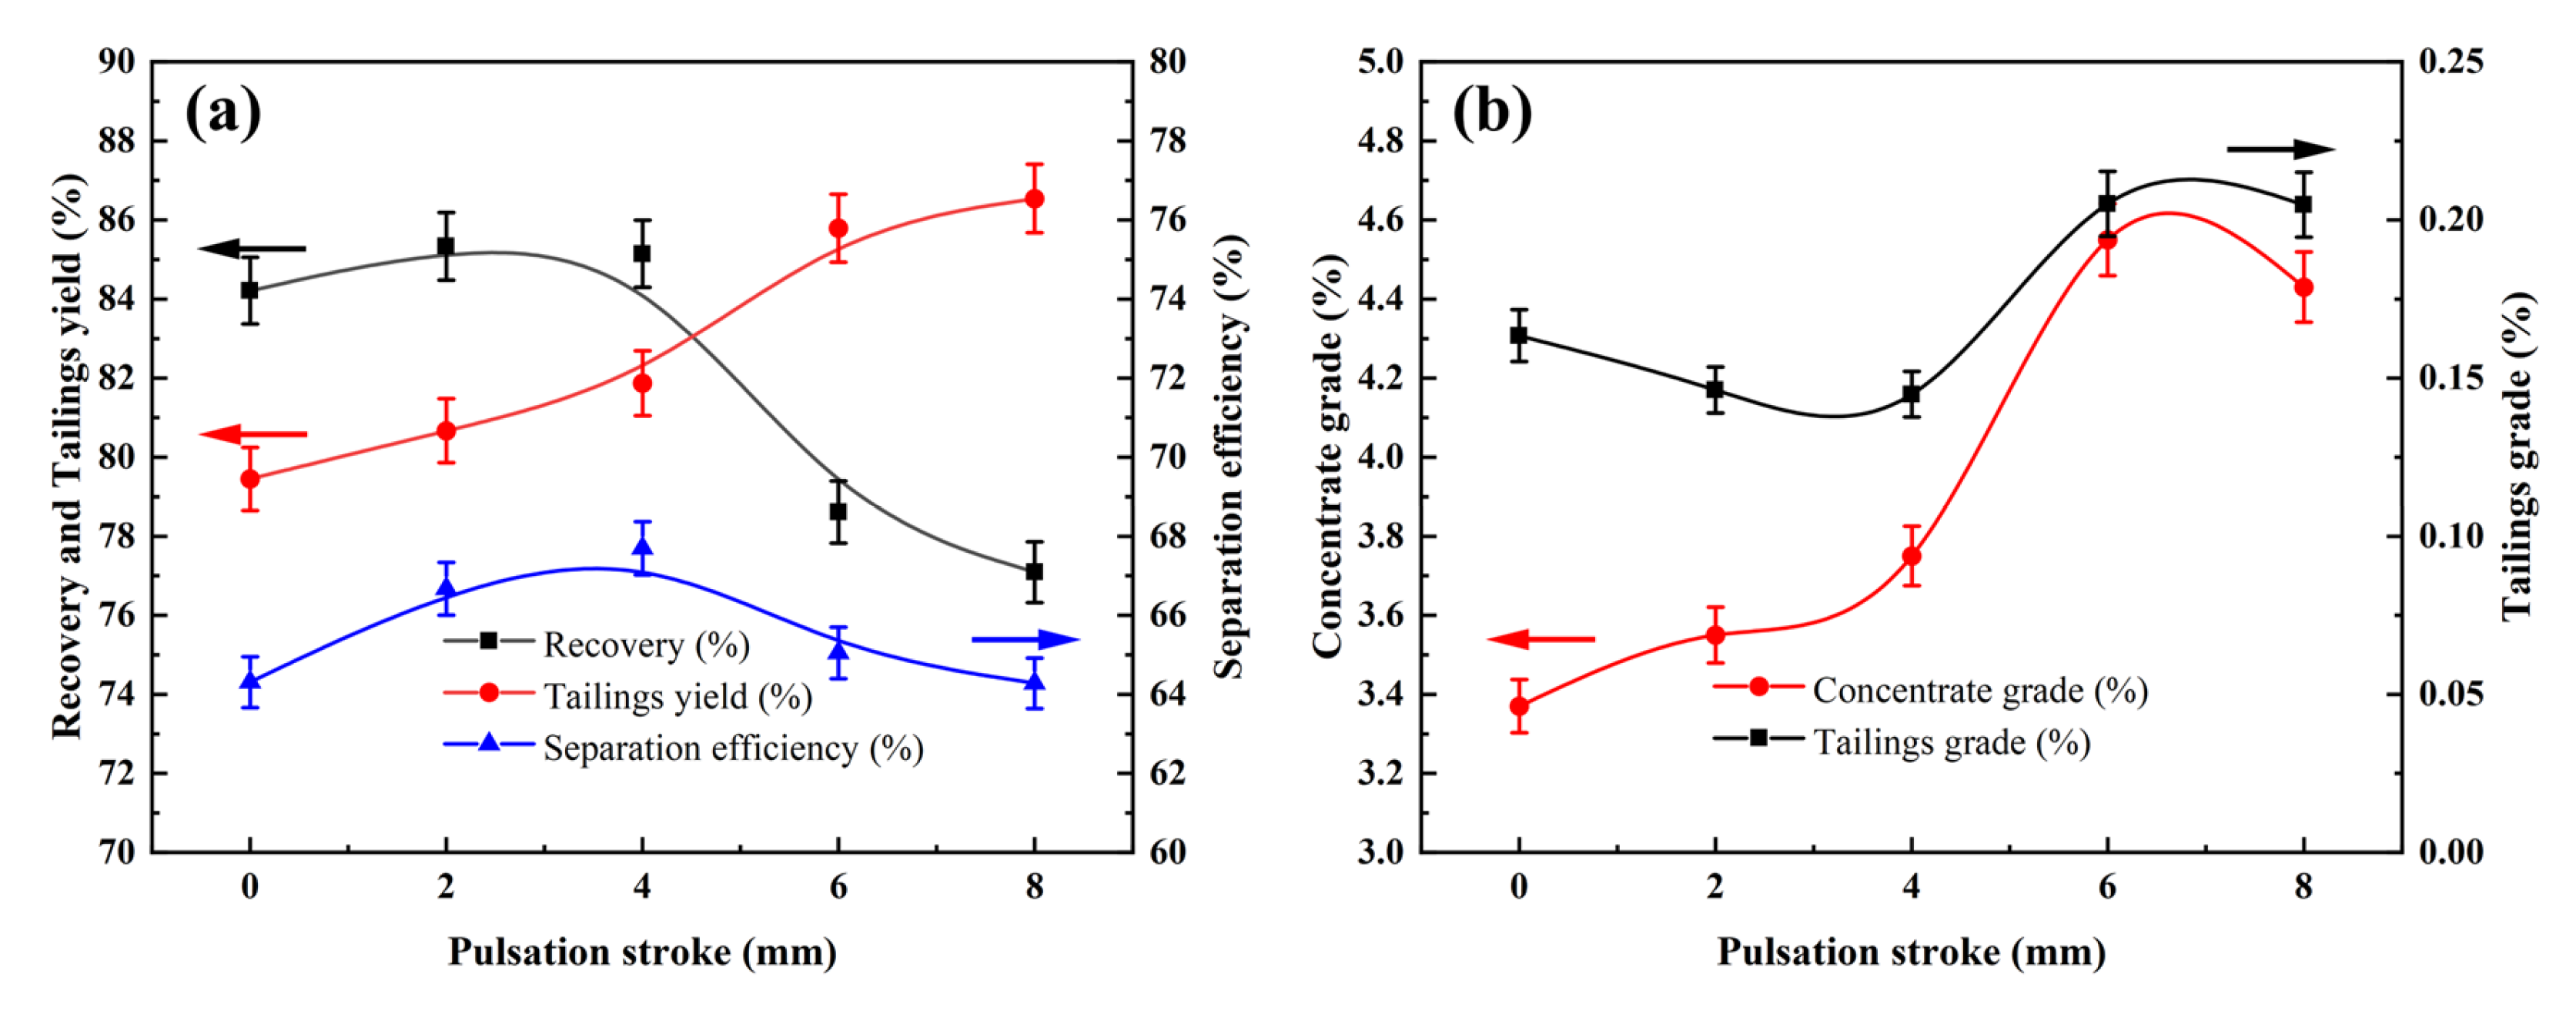
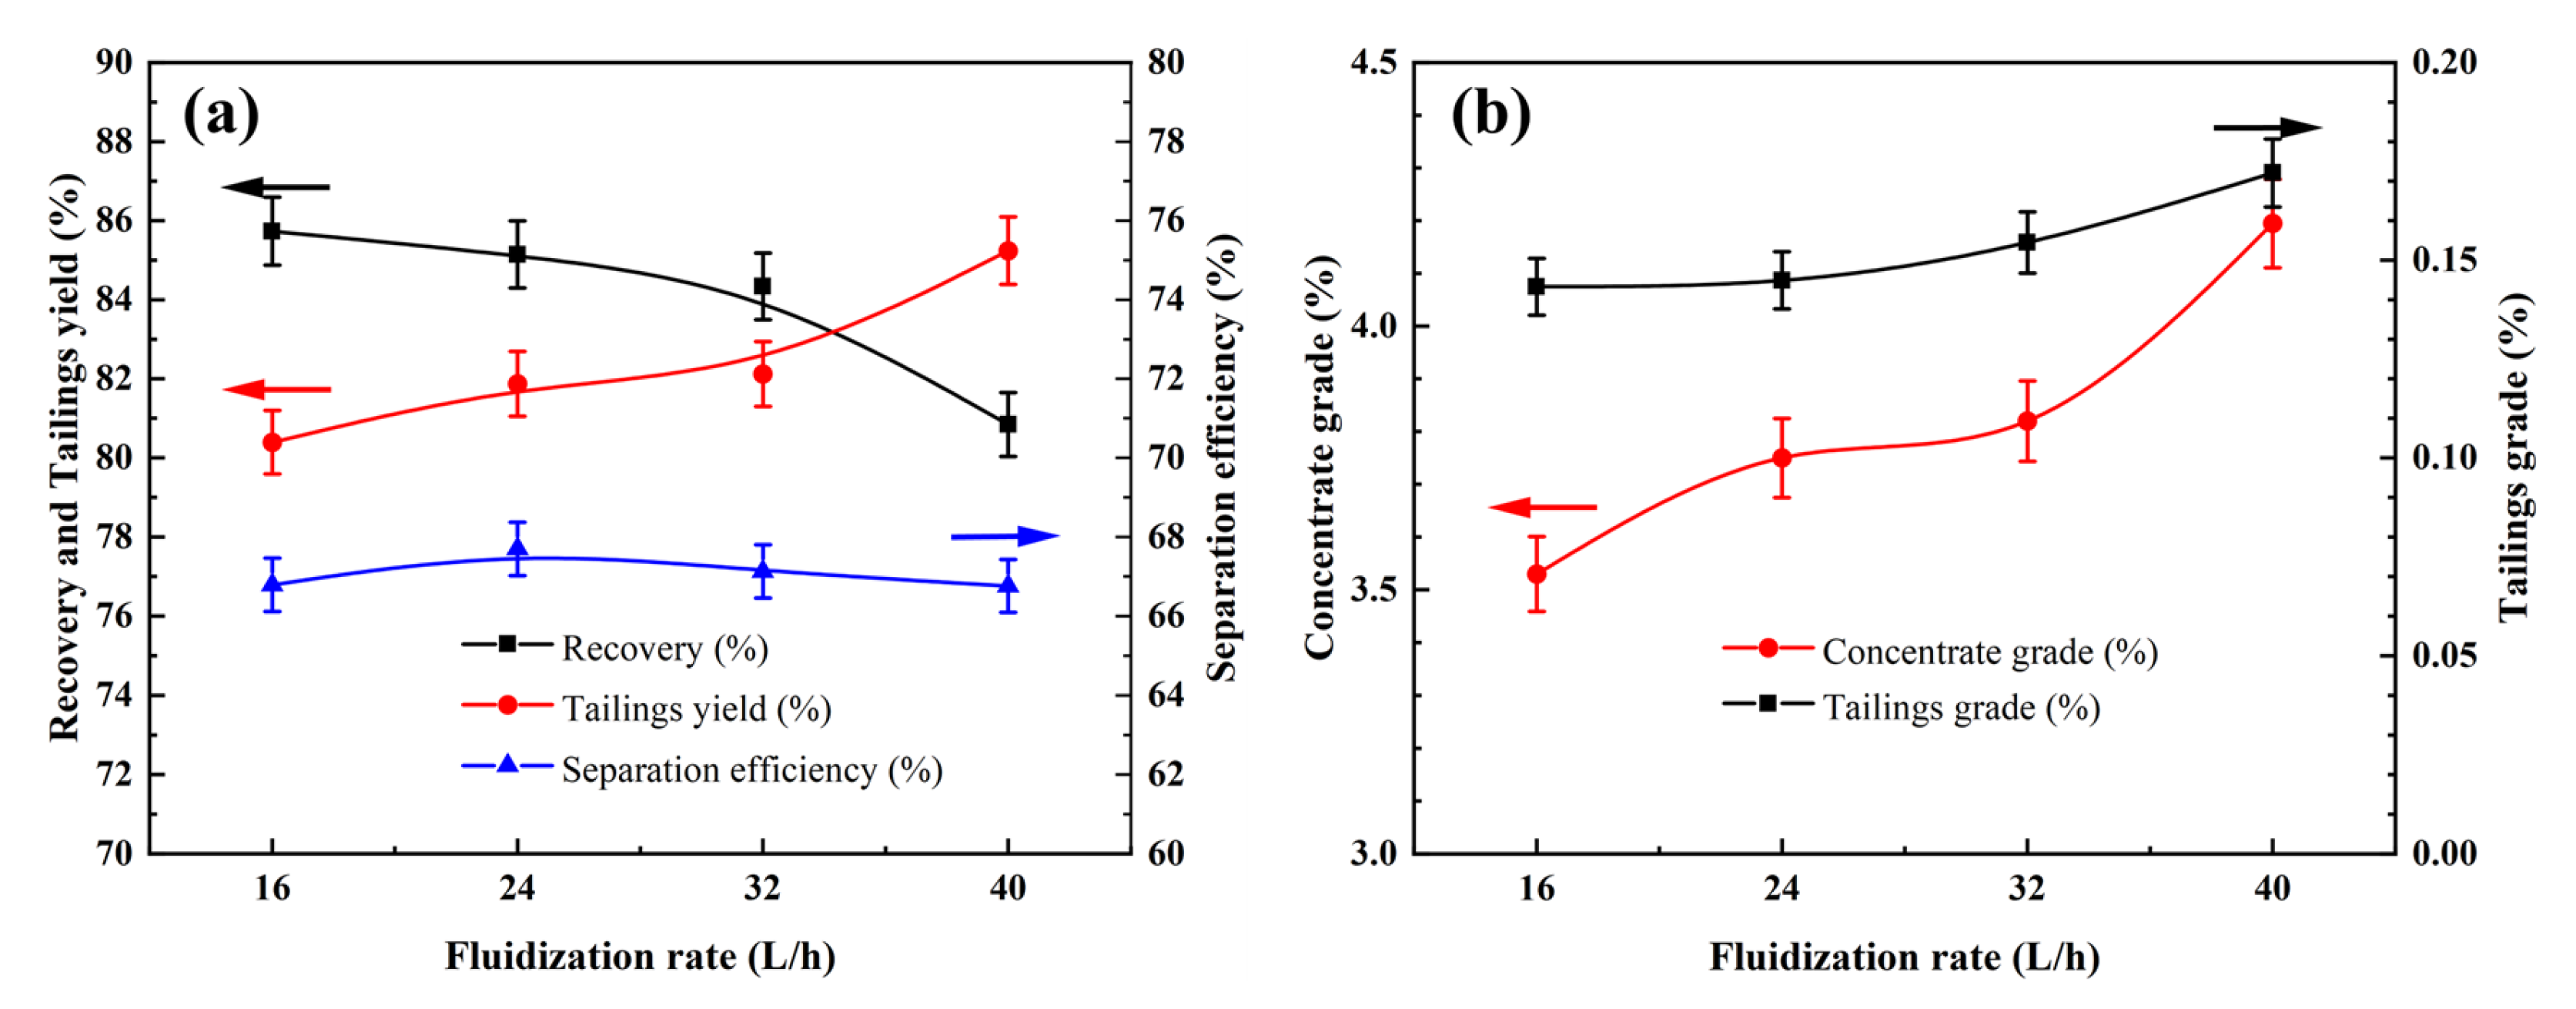
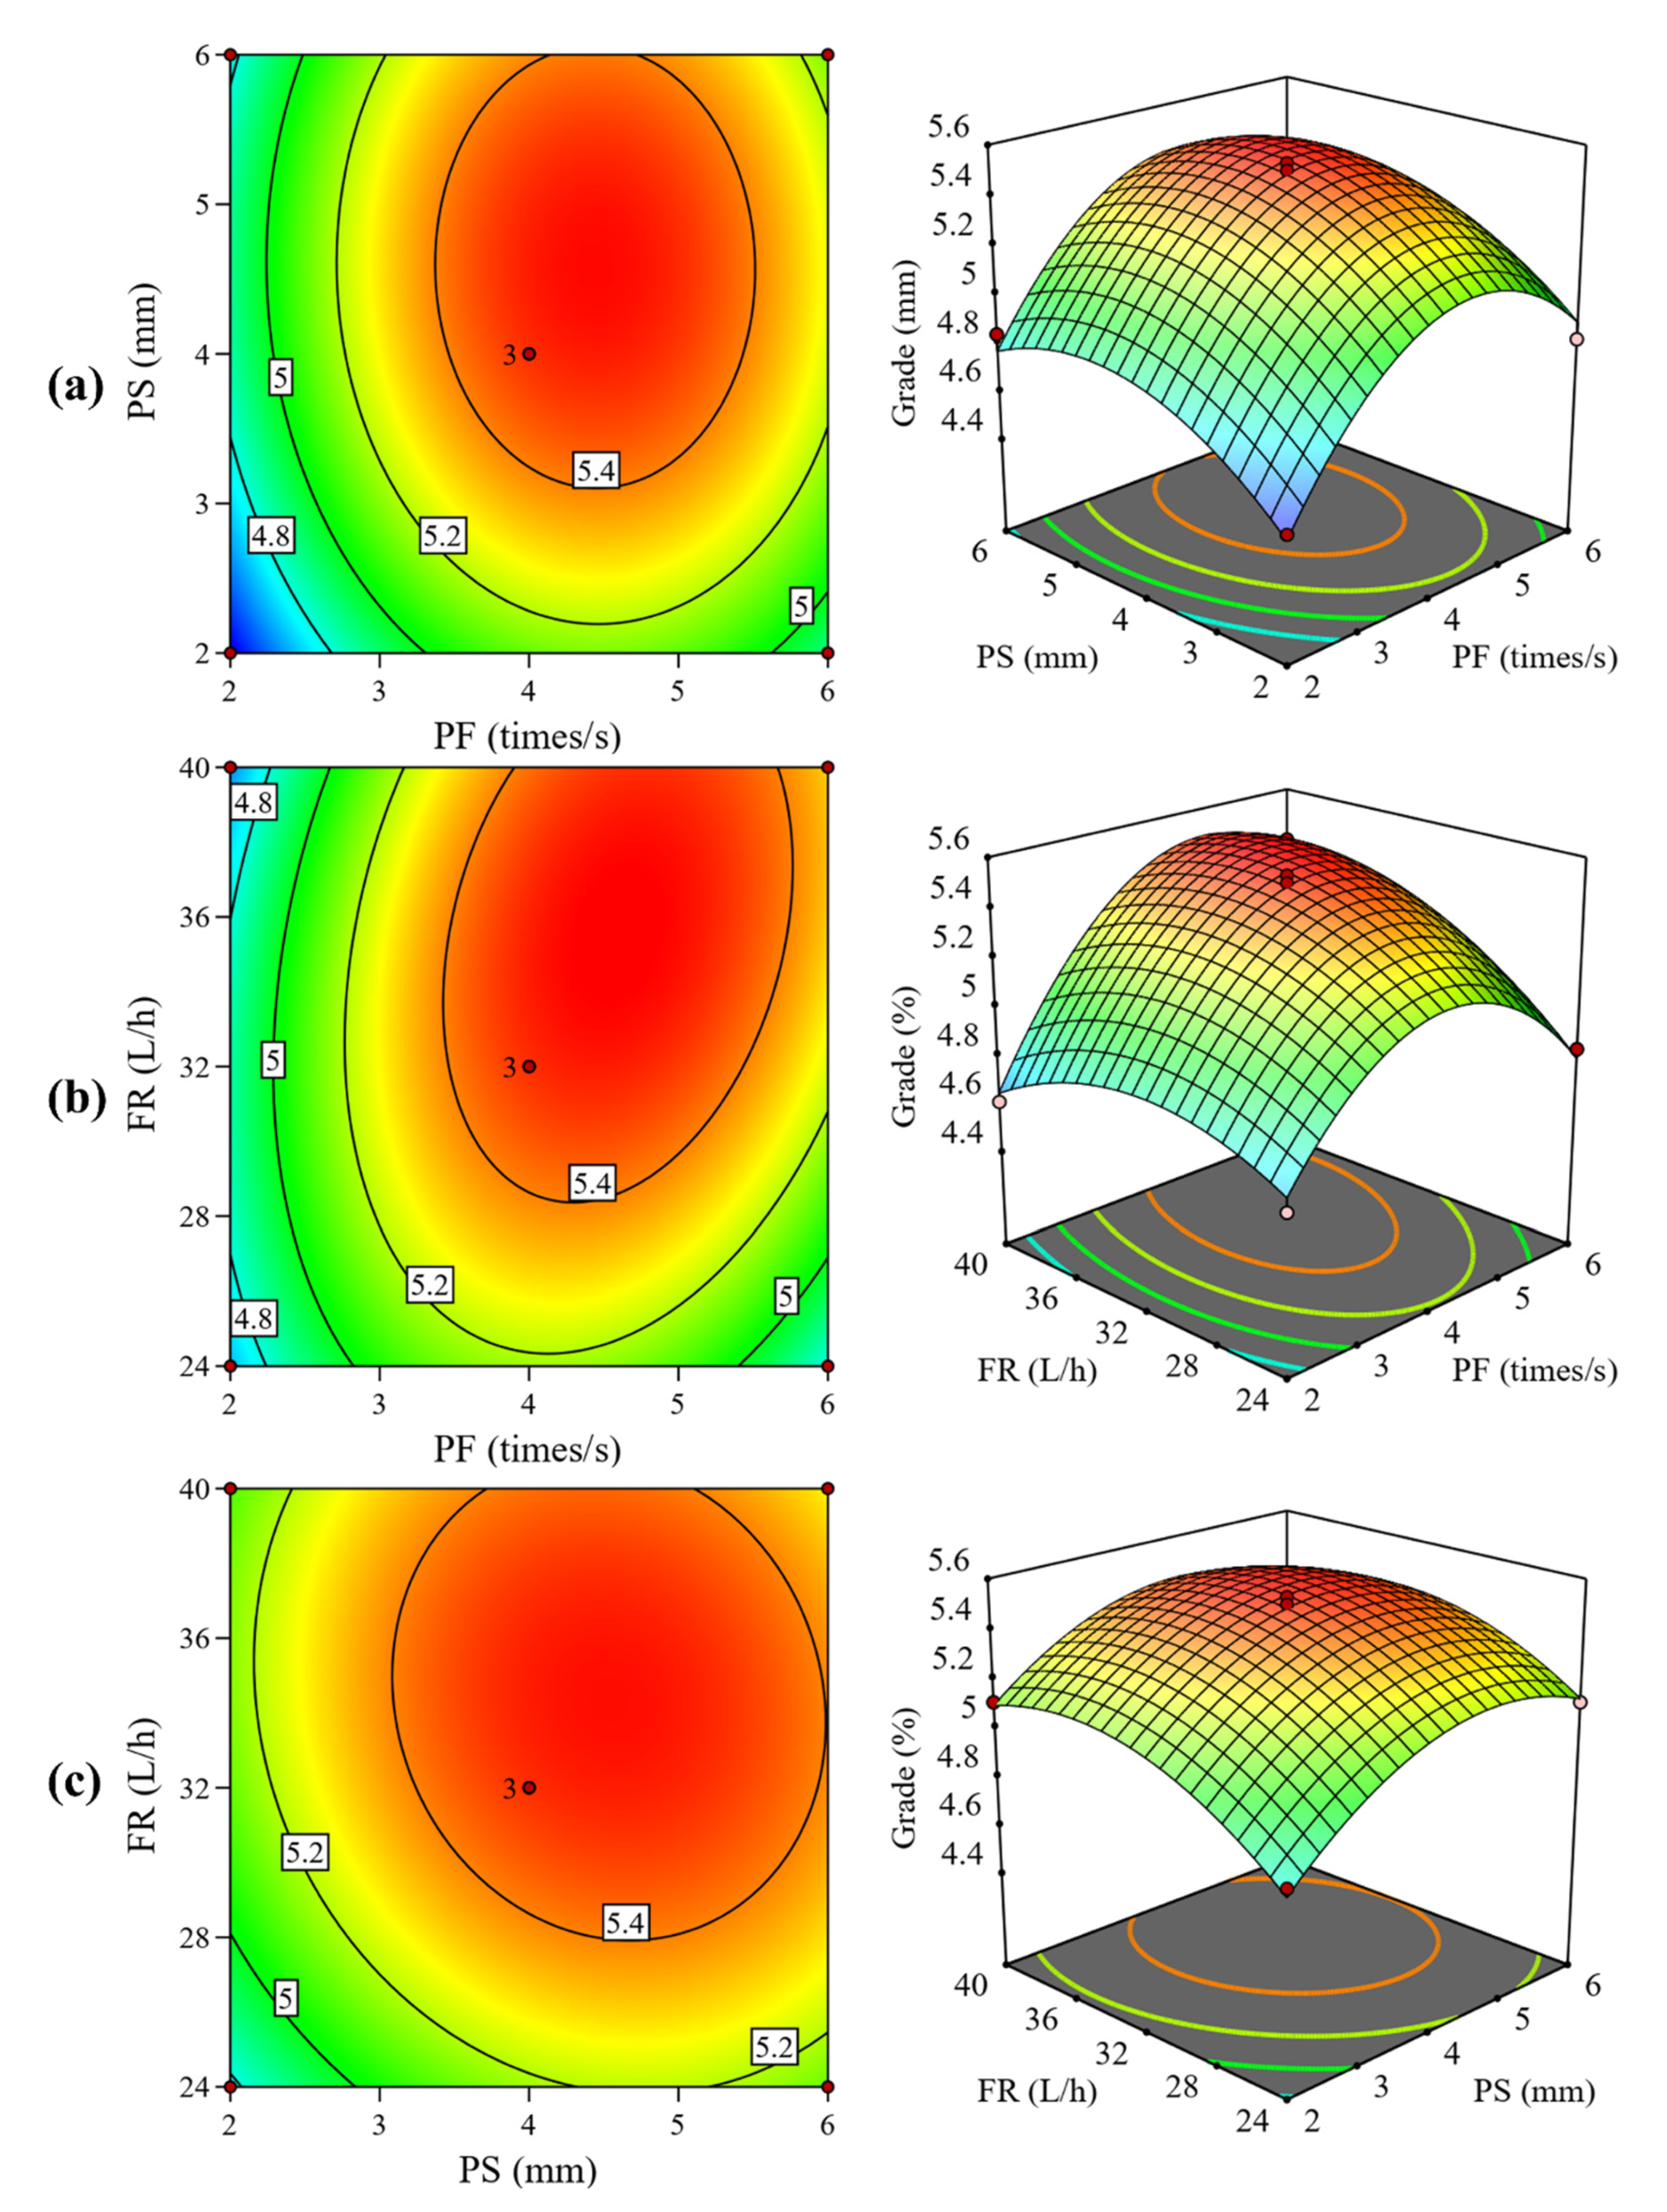
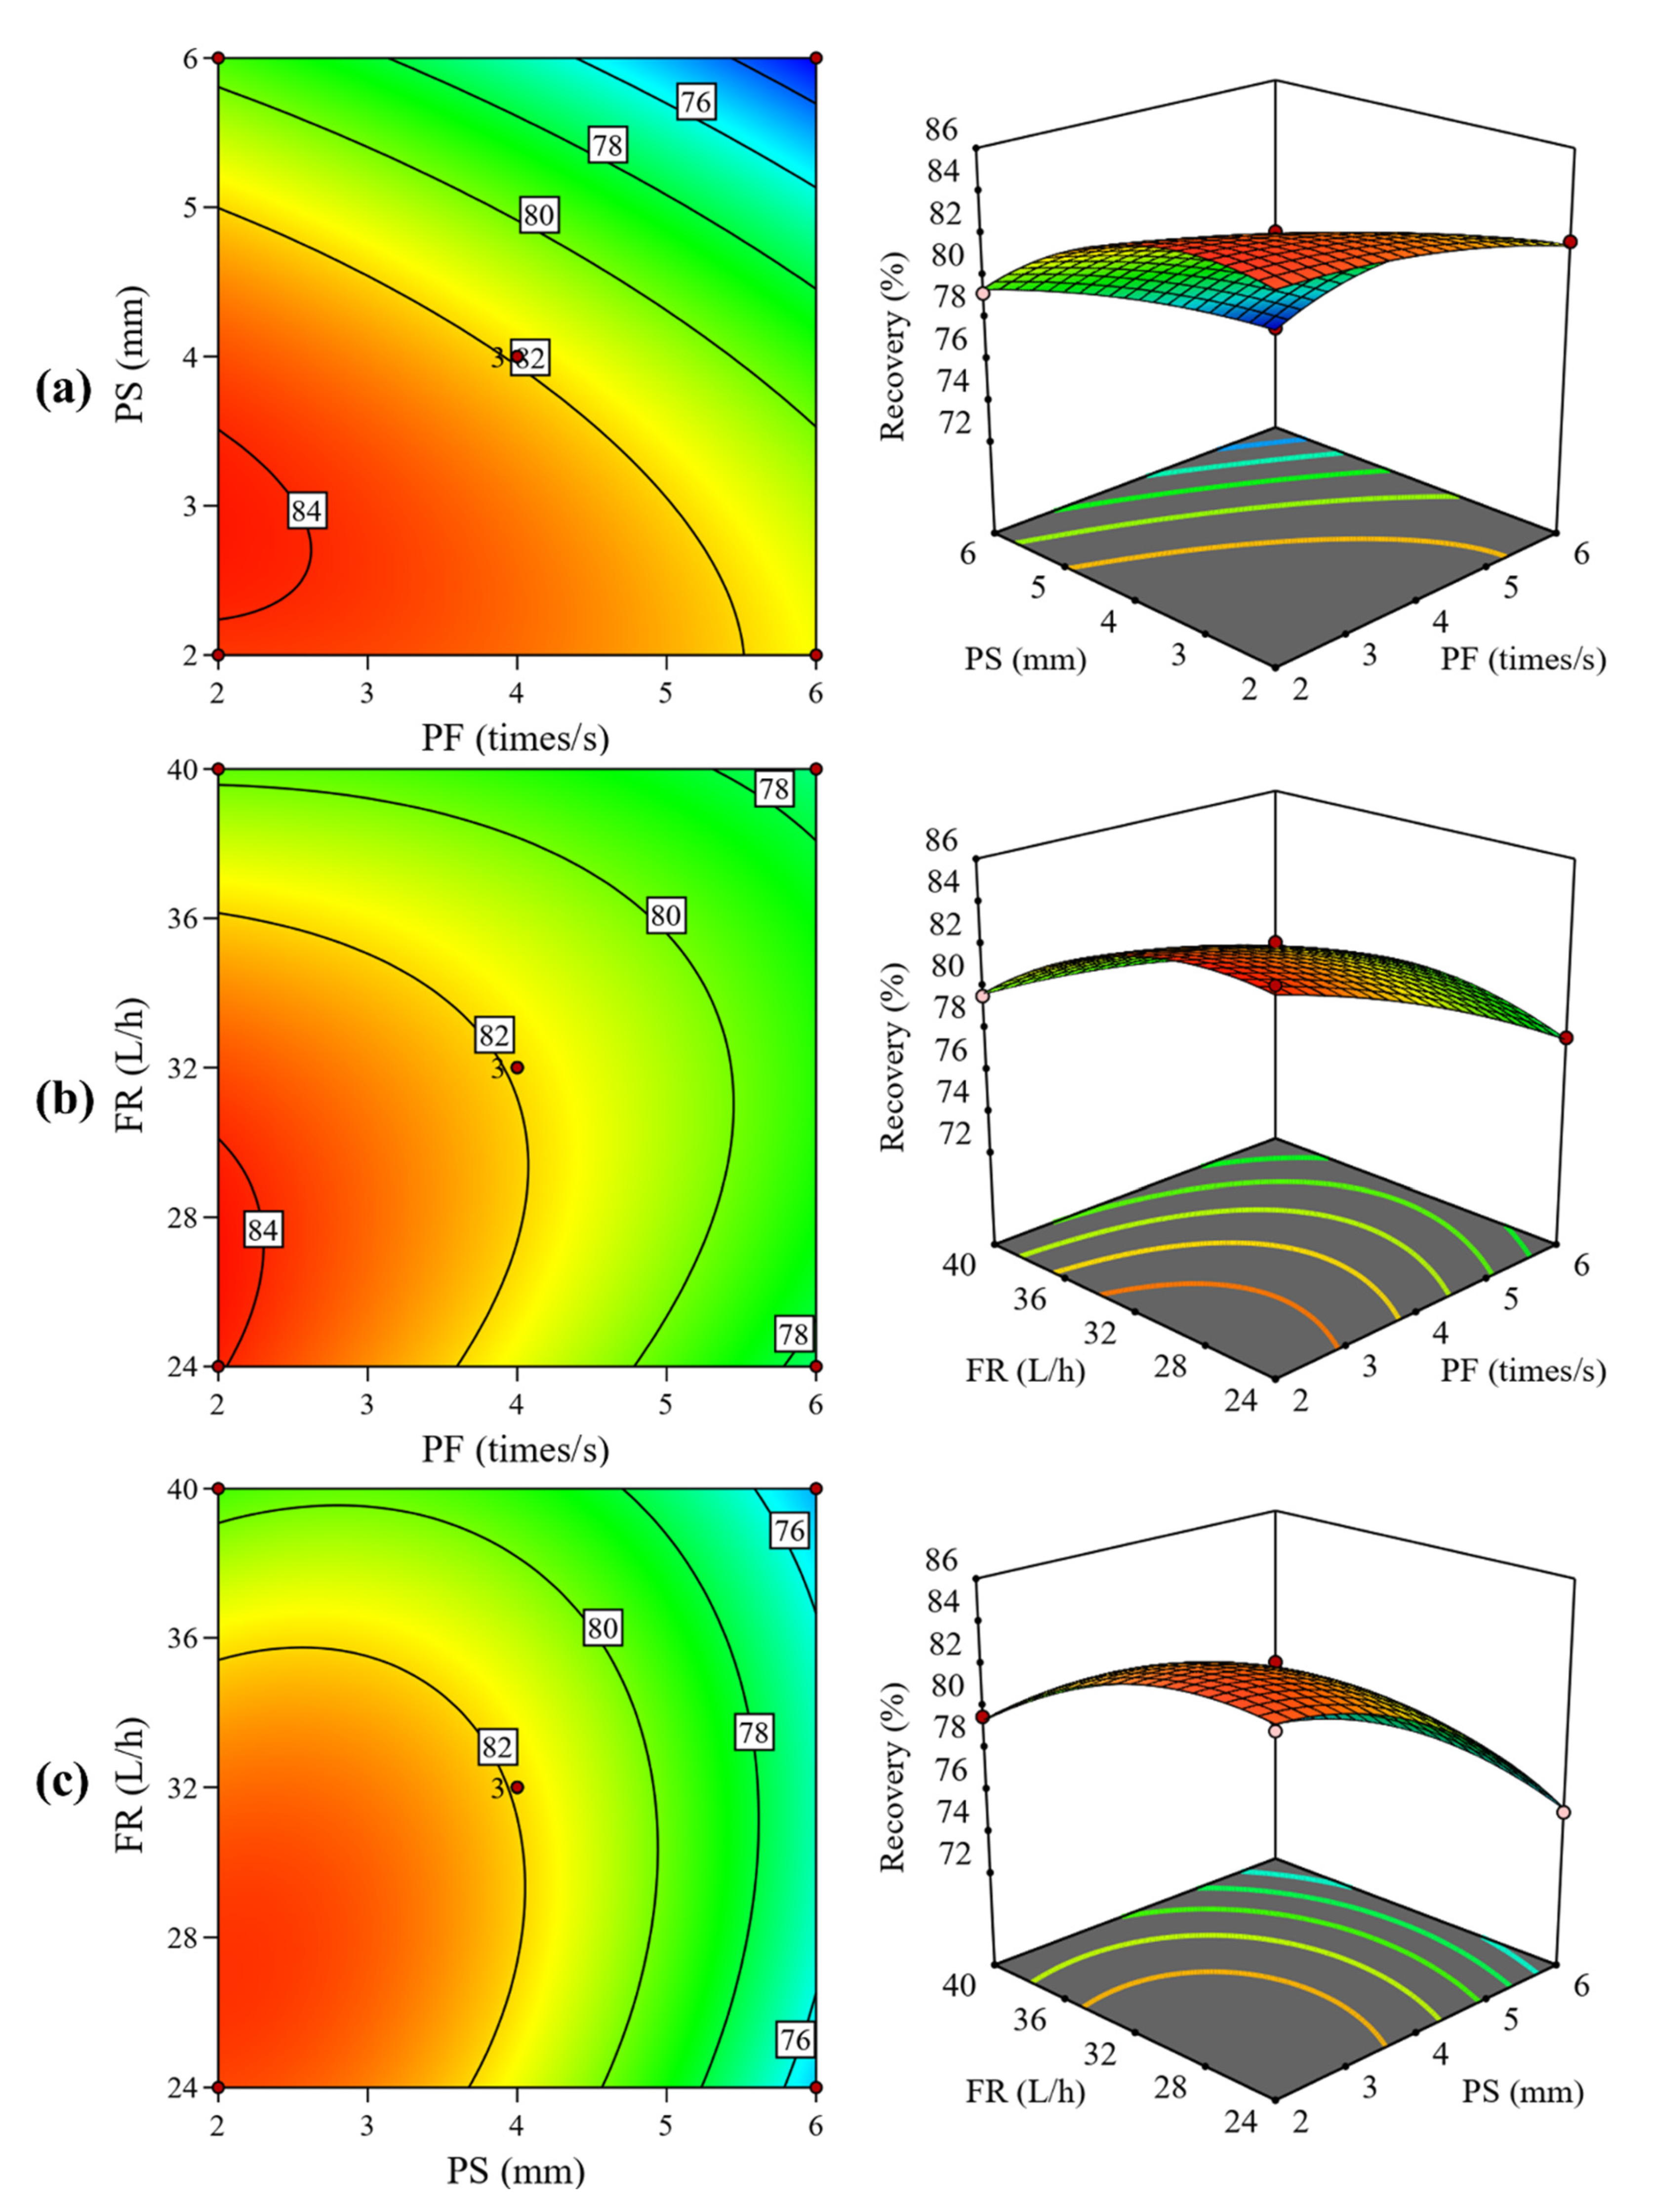
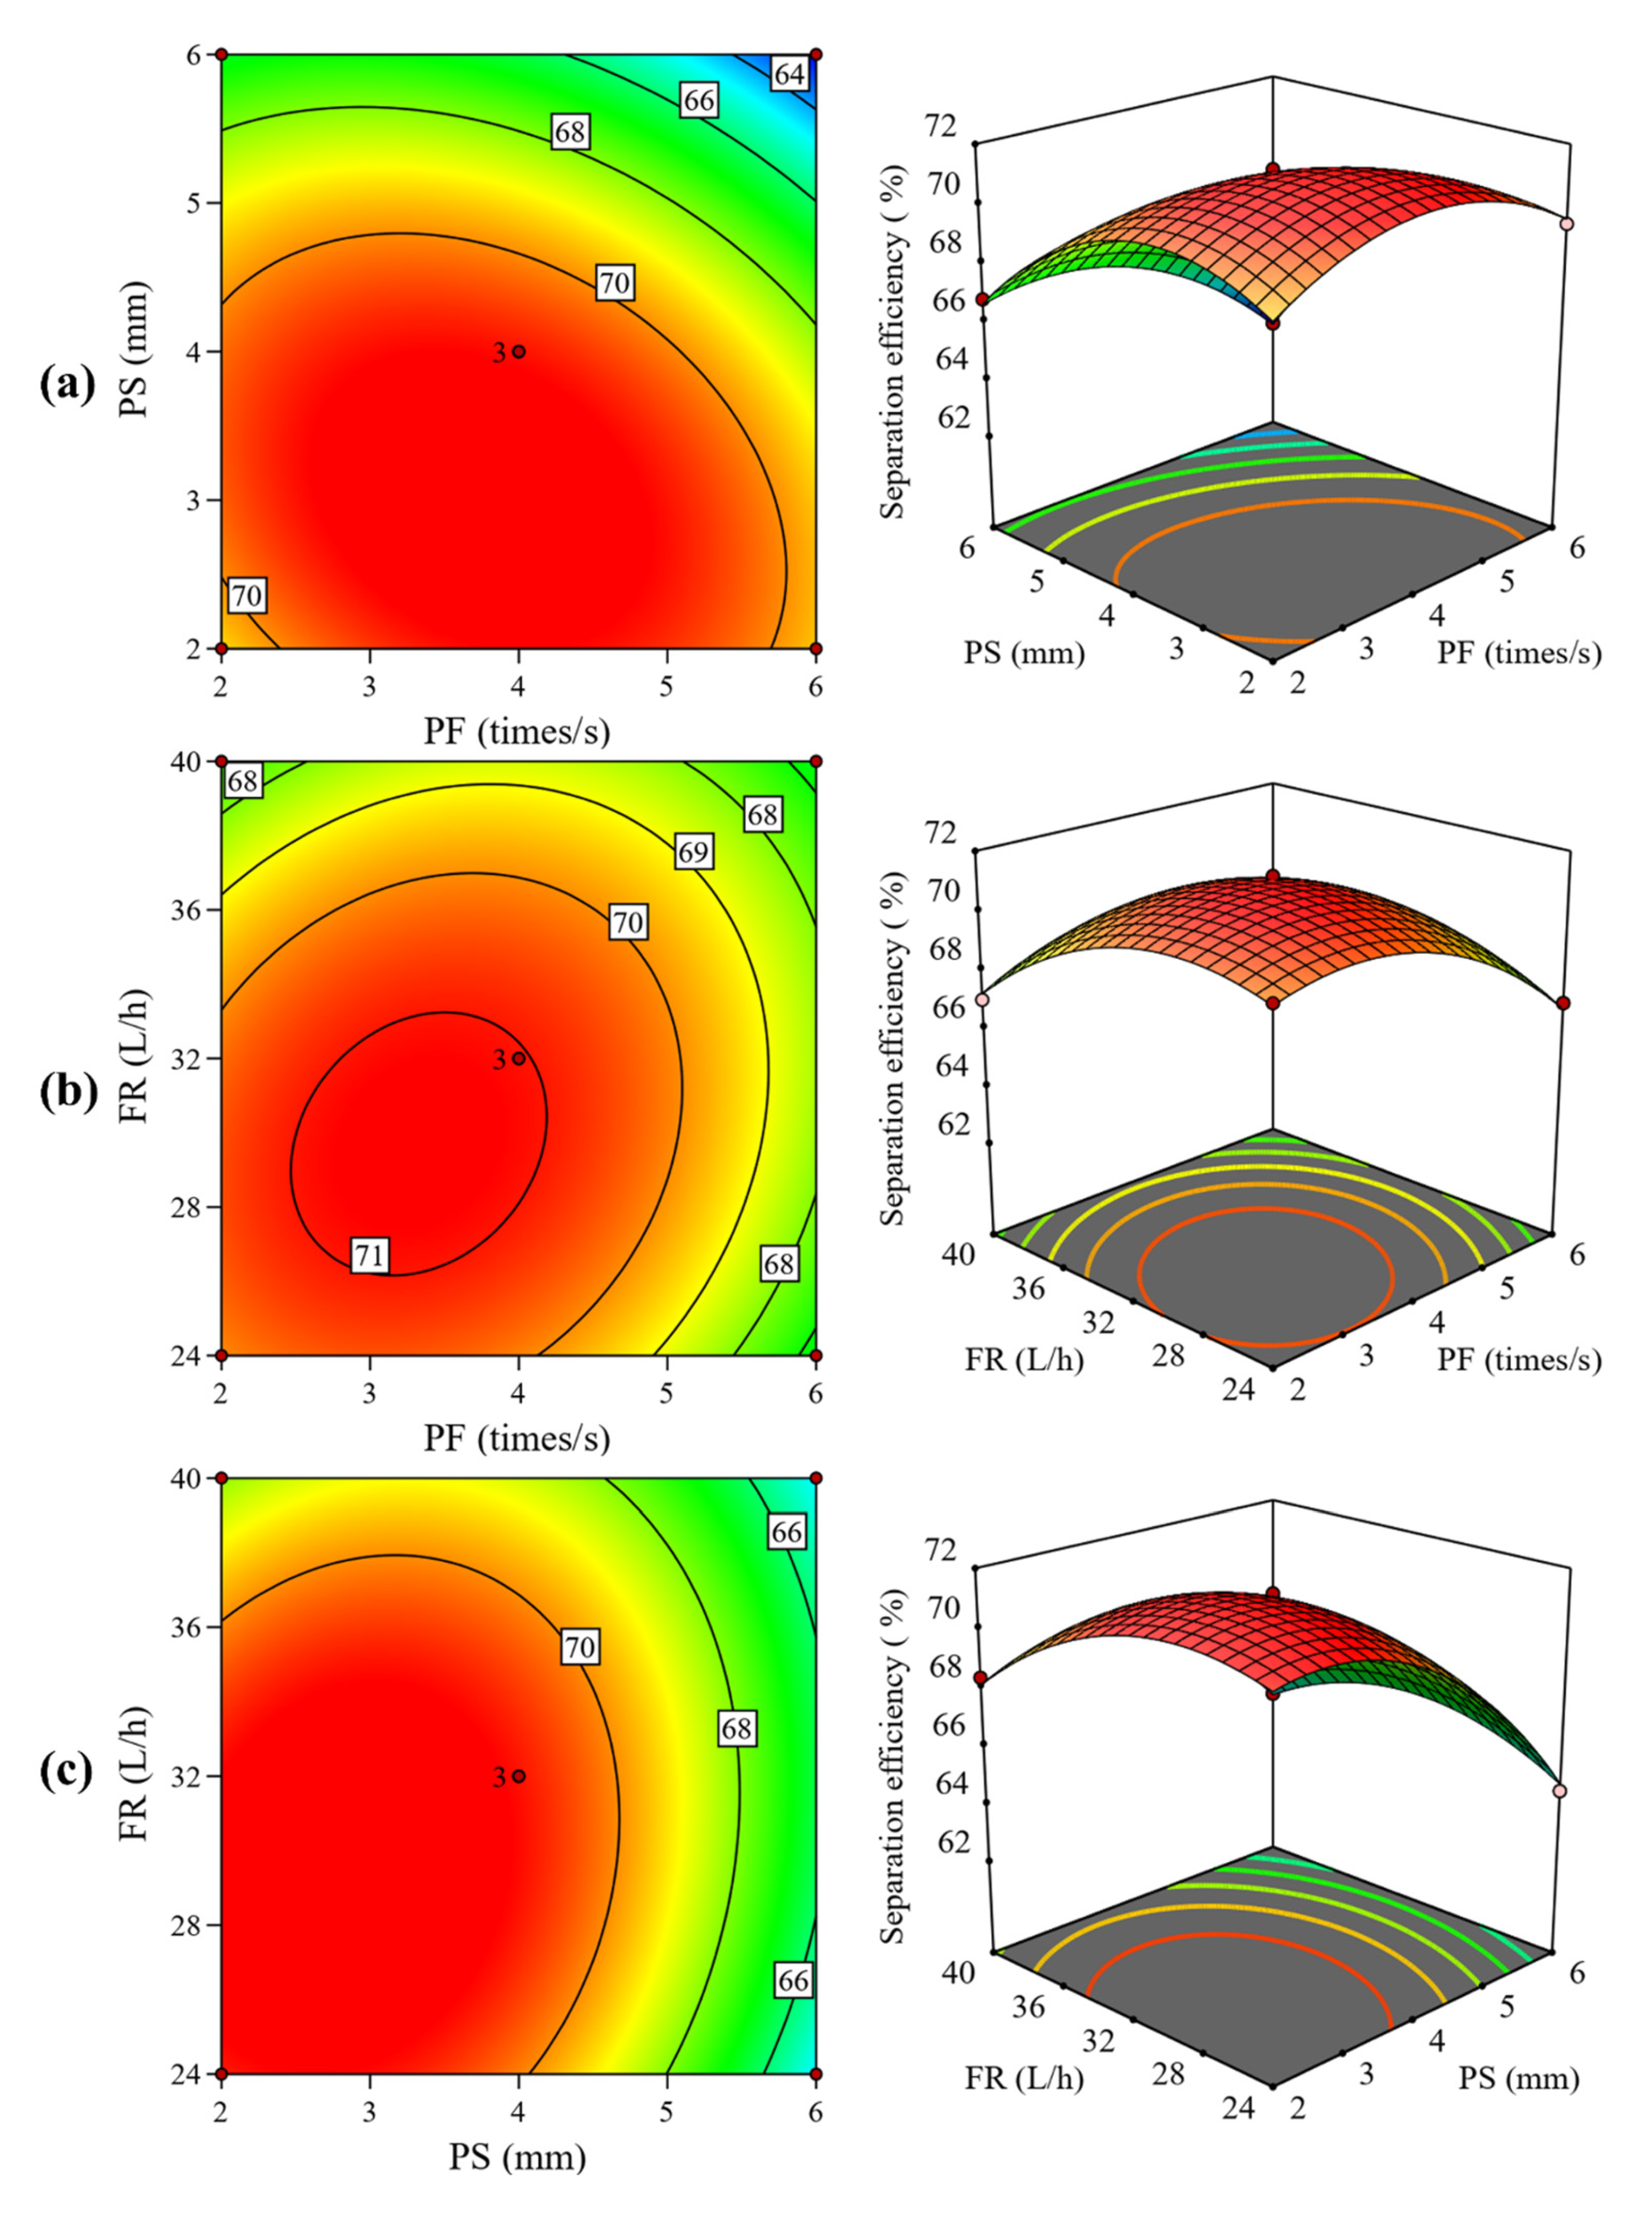
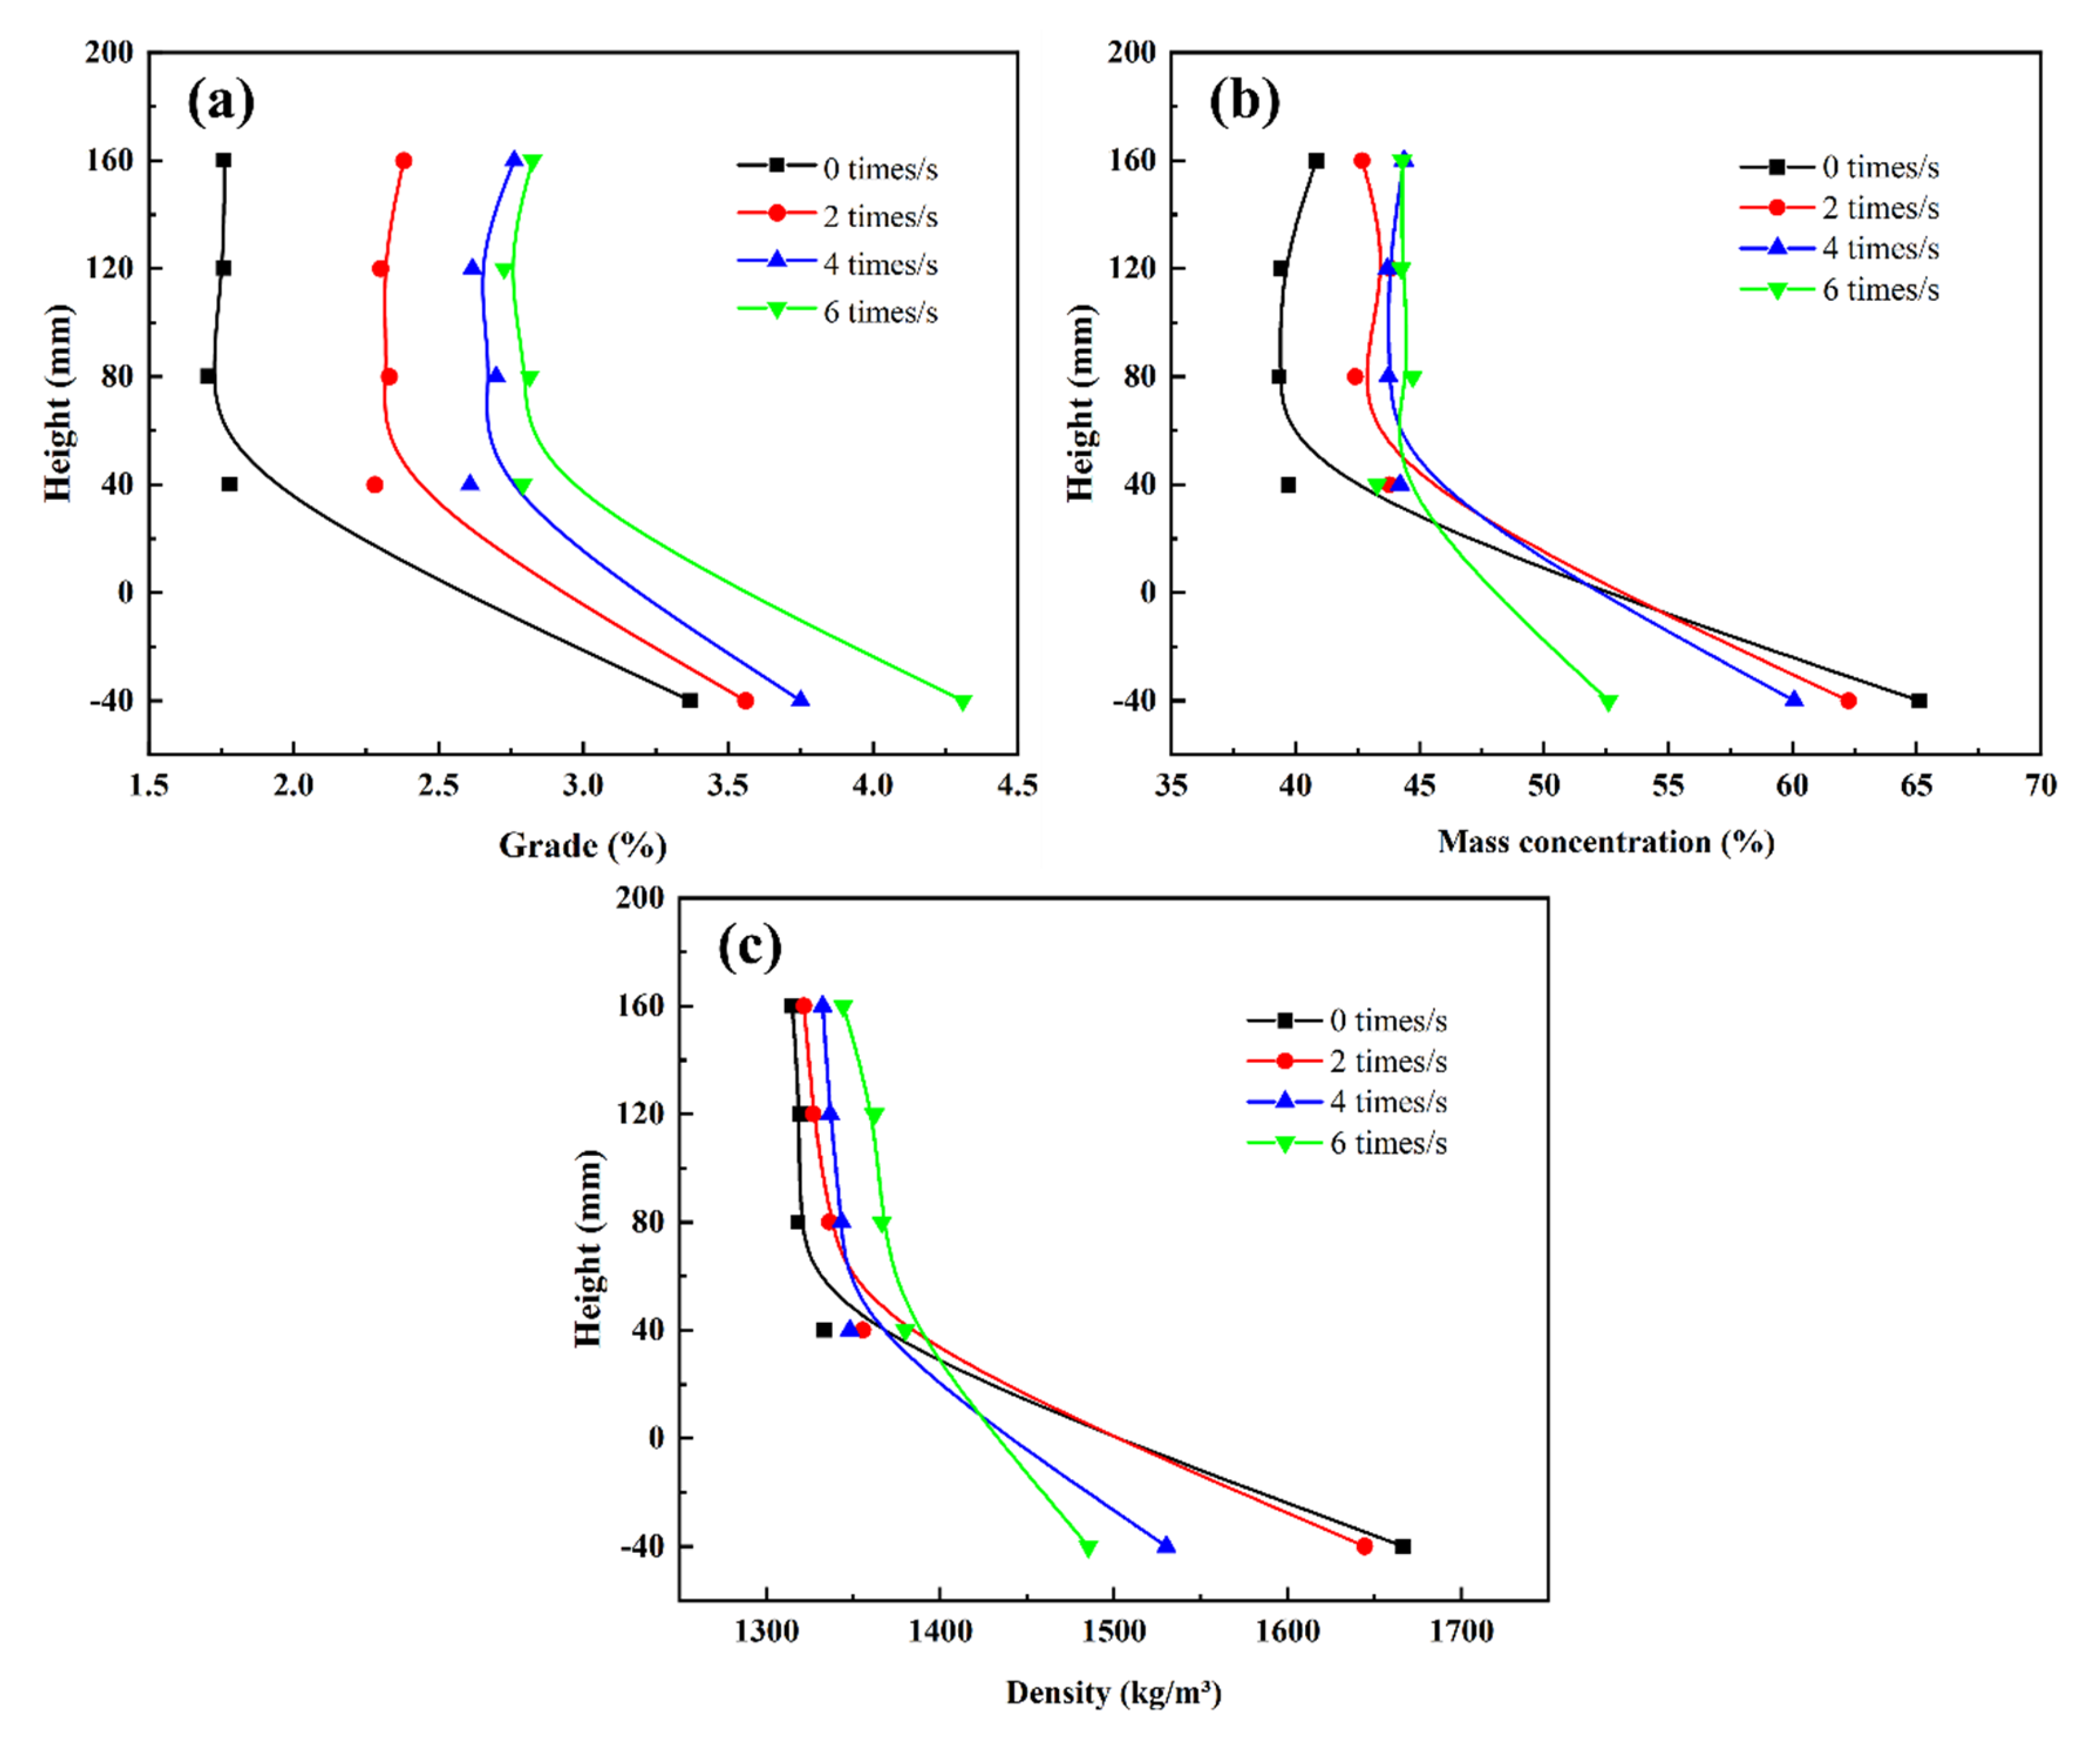
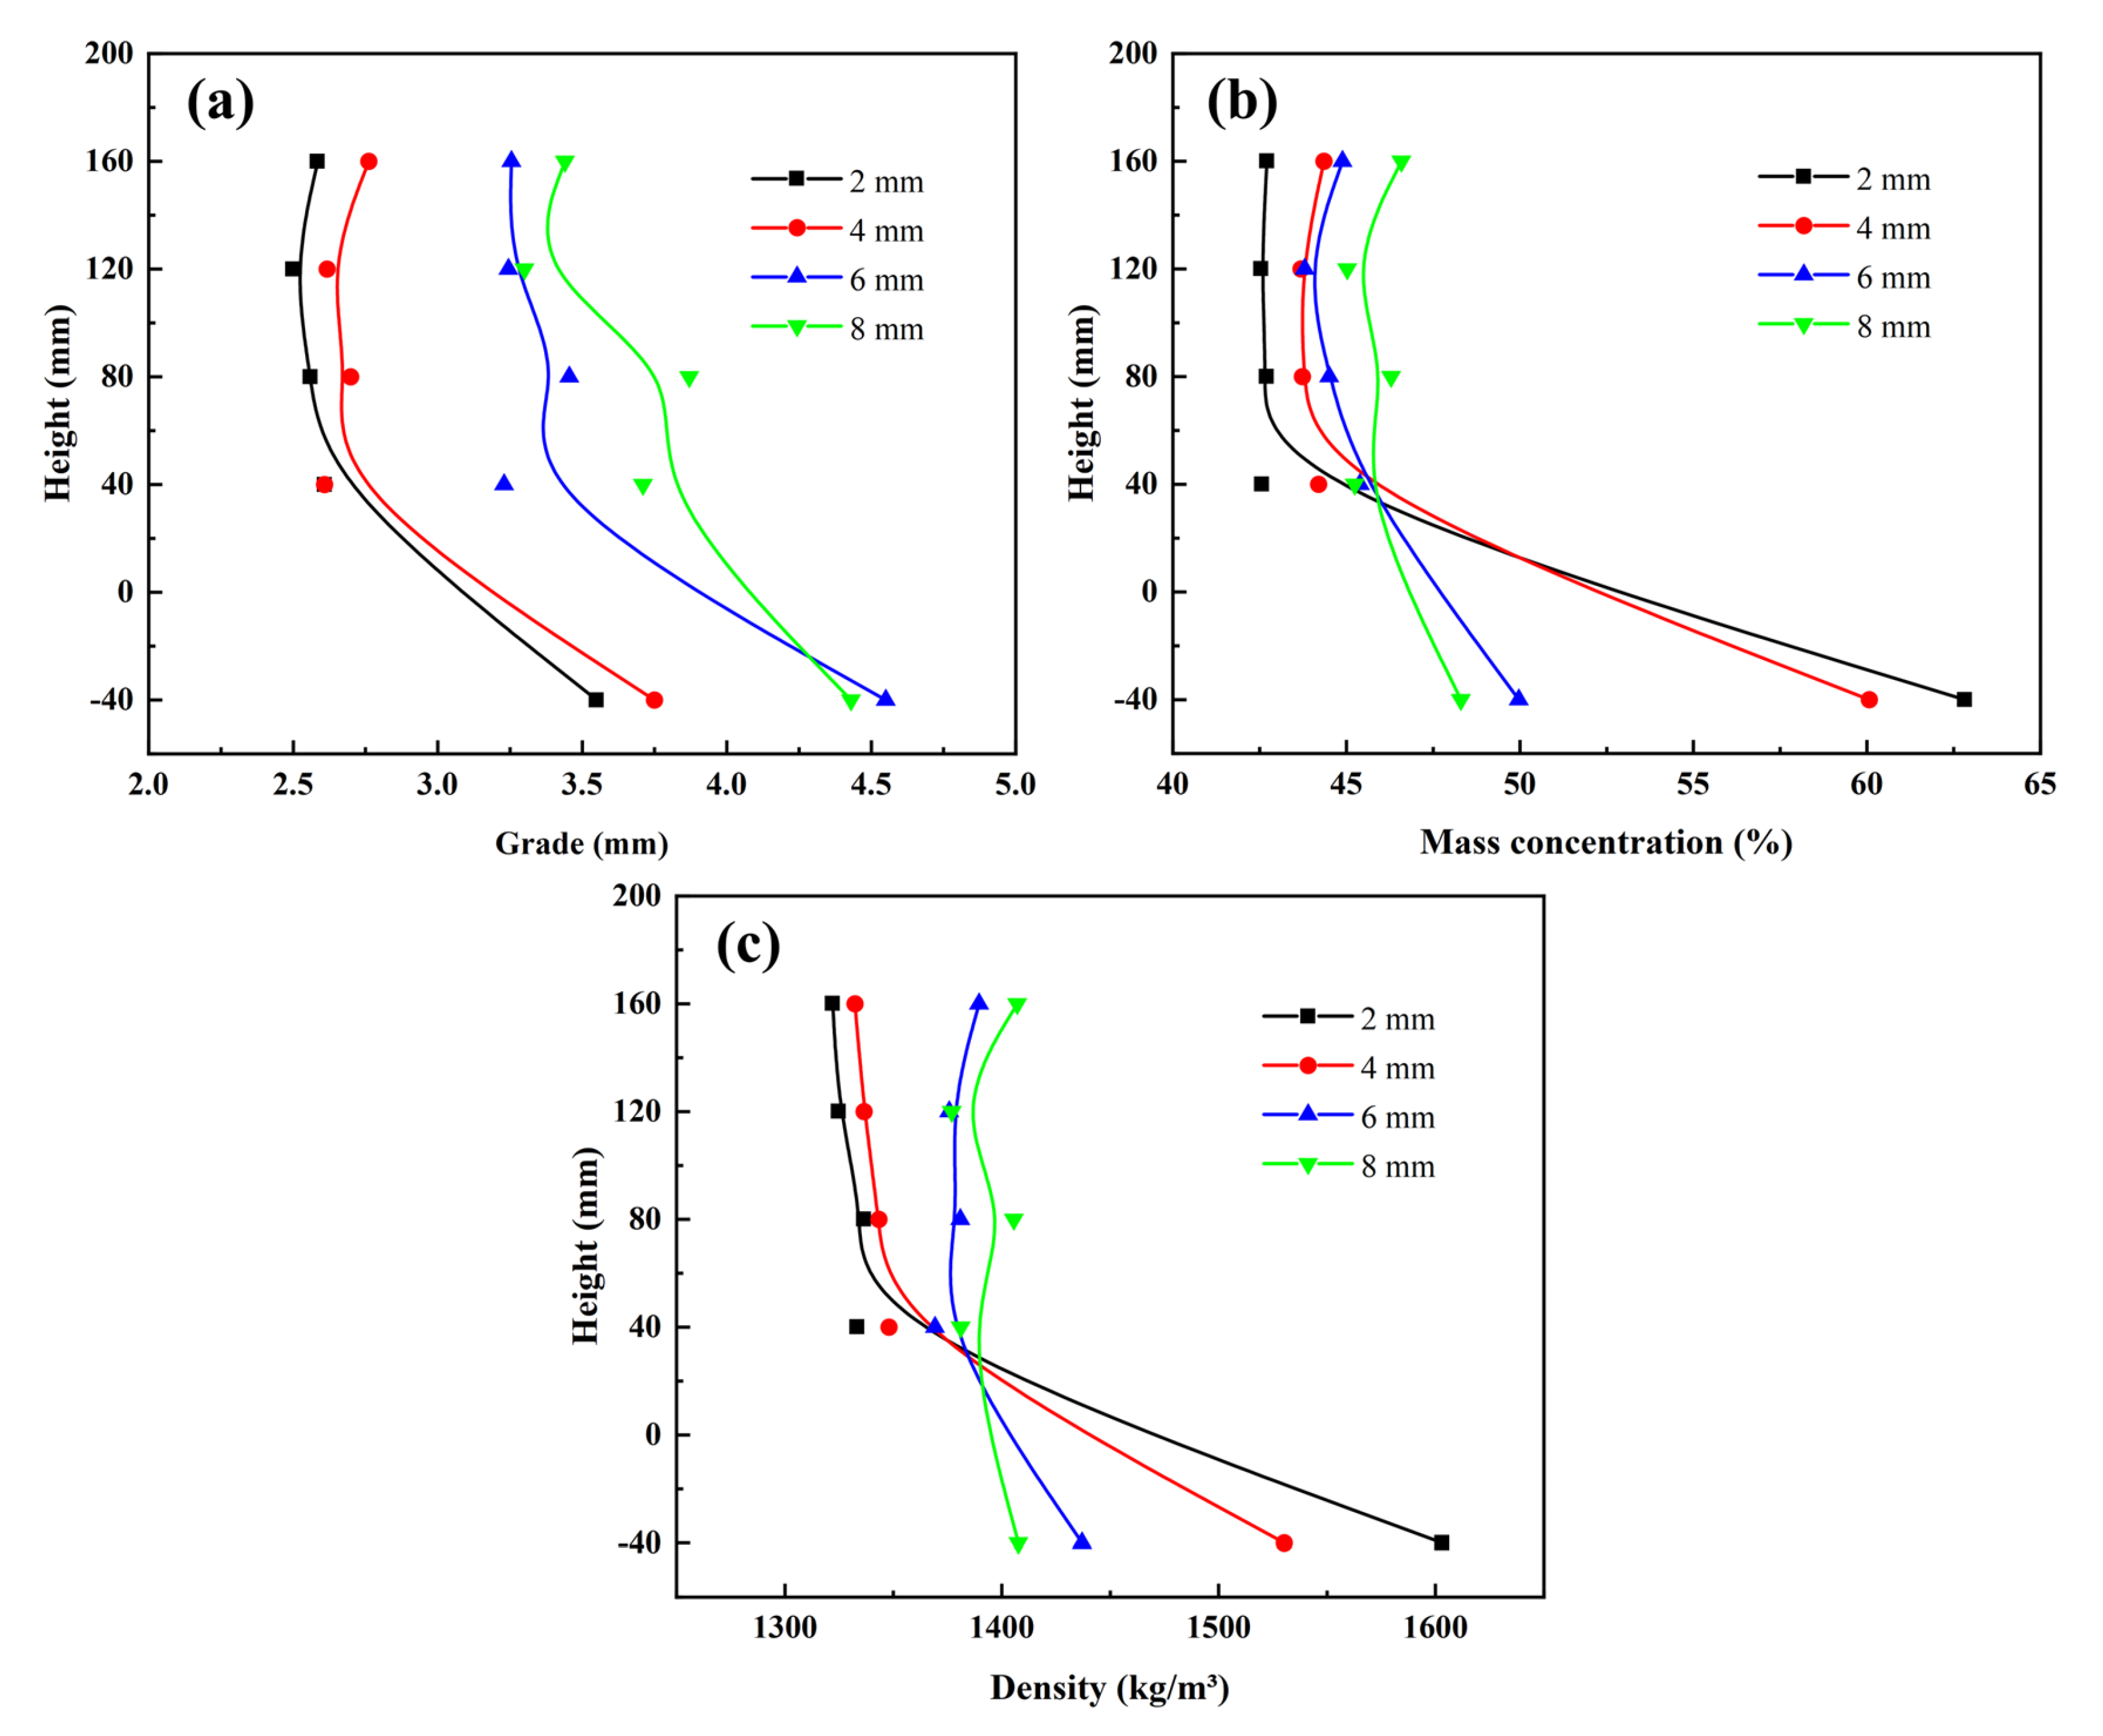
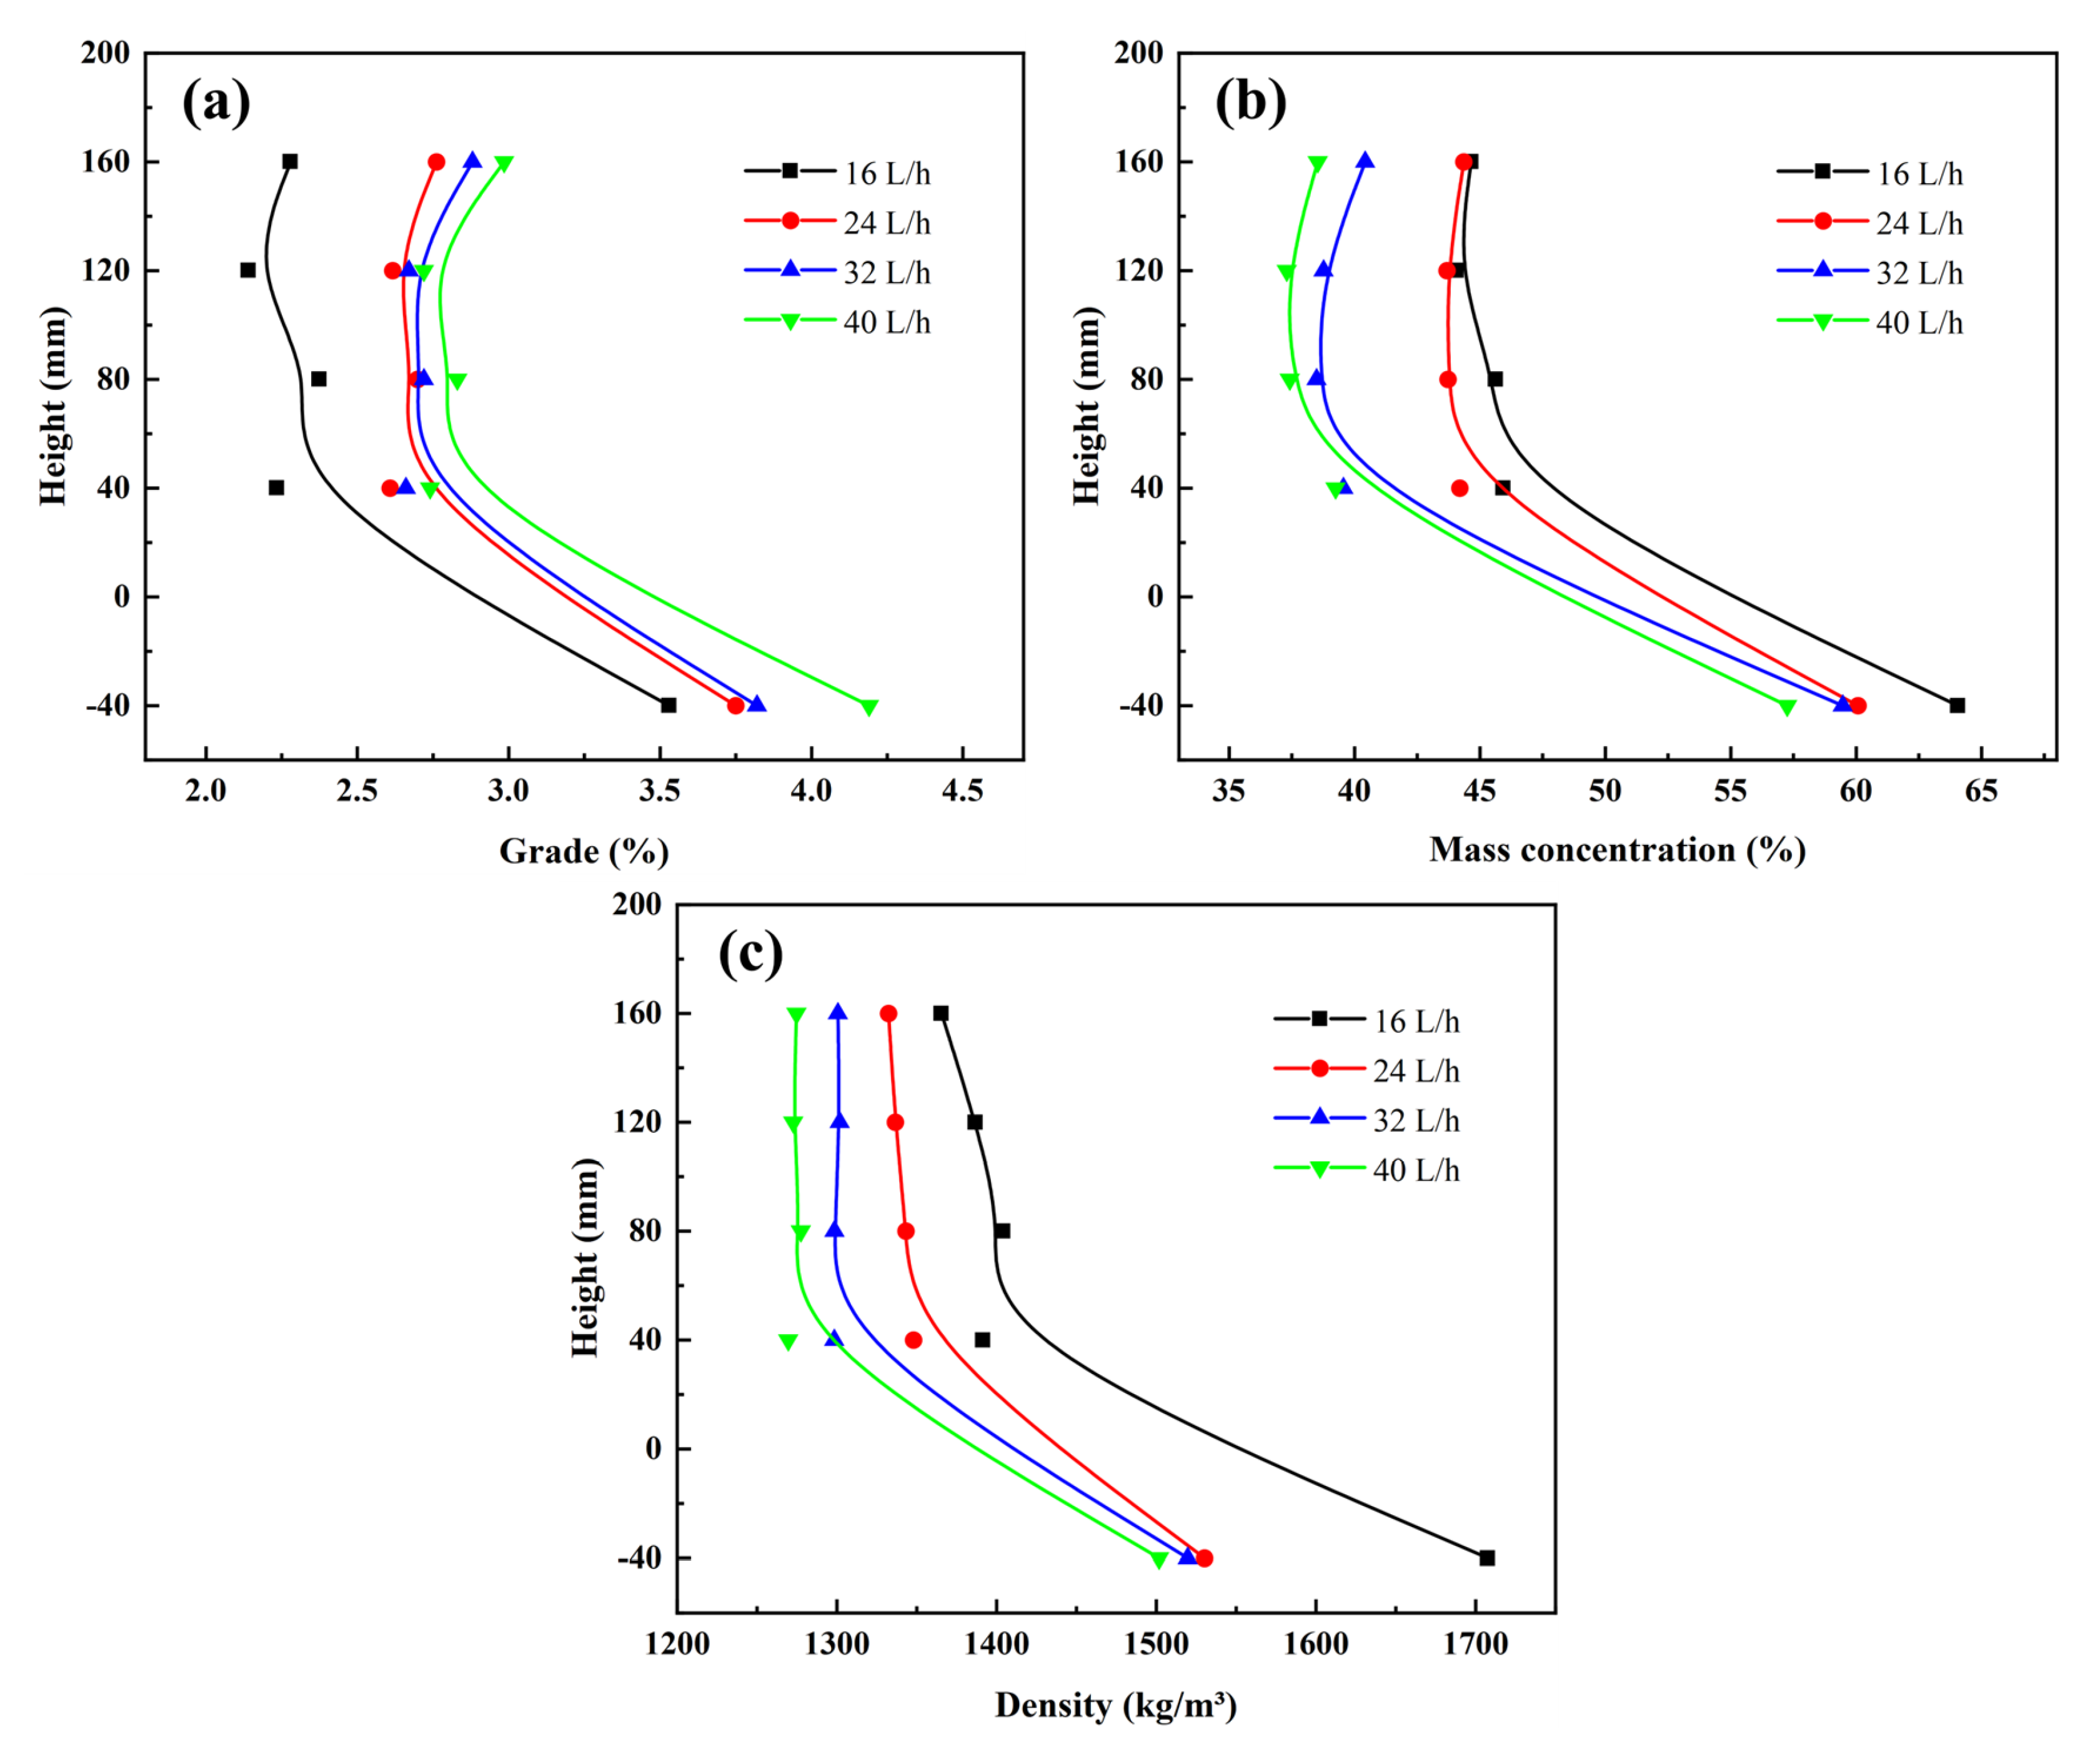
The introduction of a pulsation device transforms the stable rising water flow into a vertically alternating pulsation water flow, providing additional momentum for particle movement. The pulsation water flow enhances the stratification of particles based on density. The effects of the pulsation frequency and stroke on the Sb grade and recovery rate of the concentrate are more significant than the effect of the fluidization rate. For the separation efficiency, the influence of the pulsation stroke is more pronounced. A higher pulsation frequency and stroke can significantly improve the Sb grade of the concentrate, but they may cause a significant decrease in the recovery rate and separation efficiency. Therefore, the pulsation parameters should be optimized to a moderate level to facilitate the preconcentration of fine particles in antimony oxide ores. As the pulsation frequency increases, the particle stratification based on density in the bed becomes more refined, and the quantity of particles in the underflow decreases, leading to a reduction in the concentrate yield. Therefore, a higher pulsation frequency hinders the entry of some high-density particles into the underflow. The effect of pulsation stroke on particle stratification in the bed is significant. When the pulsation stroke is large, the stratification effect in the bed is poor, and the quantity of high-density particles in the underflow decreases, thus lowering the concentrate yield. At higher fluidization rates, the suspension density at different heights in the bed is similar, and the stratification effect is poor. The lower the fluidization rate, the more apparent the stratification of particles based on density in the bed. Response surface optimization results show that when the pulsation frequency is 4 times/s, the pulsation stroke is 4 mm, and the fluidization rate is 32 L/h; the optimal indicators are as follows: Sb grade of 5.48%, recovery rate of 81.68%, and separation efficiency of 70.97%. The impact of pulsation water flow on bed characteristics further illustrates the relationship between the pulsation water flow’s motion characteristics and the suspension and stratification of particles in the bed. A pulsation reflux classifier, as an innovative device, still offers considerable scope for structural optimization. By optimizing the equipment parameters, particle velocities, pressure drop in the column bed, volume fraction of different particles, and other aspects, the pulsation reflux classifier could further enhance its separation precision. This technique holds significant potential for practical applications, owing to its modular design and adjustable operating parameters, as the device can be readily scaled up and integrated into existing mineral processing circuits. This is particularly valuable in the preconcentration of low-grade ores, tailings reprocessing, and secondary resource recovery, where efficient and selective separation is crucial. With further scale-up and integration, the PRC could contribute to more efficient and sustainable mineral processing practices.

Author Contributions

D.L.: Methodology, Writing—review and editing, Project administration, and Funding acquisition. Y.Z.: Methodology, Validation, Investigation, Data curation, and Writing—original draft. Z.L.: Writing—original draft and Writing—review and editing. X.Z.: Writing—review and editing. Y.W.: Writing—review and editing. Y.L.: Software. All authors have read and agreed to the published version of the manuscript.

Funding

The authors gratefully acknowledge the financial support of the National Key Research and Development Program of China (No. 2021YFC2903202), the Research on Fundamental Theories and Utilization Technologies for the Efficient Separation of Low-Grade Vanadium-Titanium Magnetite (FTGZ2024-01), and the National Natural Science Foundation of China (No. 52174270 and No. 51974366).

Data Availability Statement

Data are contained within the article.

Conflicts of Interest

The authors declare that they have no known competing financial interests or personal relationships that could have appeared to influence the work reported in this paper.

References

  1. Wills, B.A.; Finch, J.A. Chapter 10—Gravity Concentration. In Wills’ Mineral Processing Technology (Eighth Edition); Wills, B.A., Finch, J.A., Eds.; Butterworth-Heinemann: Boston, MA, USA, 2016; pp. 223–244. [Google Scholar]
  2. Burt, R. Gravity concentration methods. In Mineral Processing Design; Springer: Berlin/Heidelberg, Germany, 1987; pp. 106–137. [Google Scholar]
  3. Keshun, Y.; Chengyu, W.; Huizhong, L. Research on intelligent implementation of the beneficiation process of shaking table. Miner. Eng. 2023, 199, 108108. [Google Scholar] [CrossRef]
  4. Razali, R.; Veasey, T.J. Statistical modelling of a shaking table separator part one. Miner. Eng. 1990, 3, 287–294. [Google Scholar] [CrossRef]
  5. Manser, R.J.; Barley, R.W.; Wills, B.A. The shaking table concentrator—The influence of operating conditions and table parameters on mineral separation—The development of a mathematical model for normal operating conditions. Miner. Eng. 1991, 4, 369–381. [Google Scholar] [CrossRef]
  6. Zeilinger, J.E.; Deurbrouck, A. Physical Desulfurization of Fine-Size Coals on a Spiral Concentrator; US Department of the Interior, Bureau of Mines: Washington, DC, USA, 1976; Volume 8152. [Google Scholar]
  7. Palmer, M.; Vadeikis, C. New developments in spirals and spiral plant operations. In Proceedings of the International Mineral Processing Congress, Brisbane, Australia, 6–10 September 2010; pp. 1099–1108. [Google Scholar]
  8. Boucher, D.; Deng, Z.; Leadbeater, T.W.; Langlois, R.; Waters, K.E. Speed analysis of quartz and hematite particles in a spiral concentrator by PEPT. Miner. Eng. 2016, 91, 86–91. [Google Scholar] [CrossRef]
  9. Li, D.H.; Wang, X.; Cao, Z.; Rong, L.K.; Wang, A.Q. Rheological properties of dense medium suspension for coal preparation and its influence on separation process. Int. J. Coal Prep. Util. 2025, 1–17. [Google Scholar] [CrossRef]
  10. Zhou, C.; Zhao, Y.; Liu, C.; Li, Y.; Gao, Z.; Fan, X.; Aleksandrova, T.; Duan, C. Fluidization expansion of novel generation dense medium and flow regime transition in gas-solid separation fluidized bed. Fundam. Res. 2025, 5, 756–766. [Google Scholar] [CrossRef]
  11. Phengsaart, T.; Srichonphaisan, P.; Kertbundit, C.; Soonthornwiphat, N.; Sinthugoot, S.; Phumkokrux, N.; Juntarasakul, O.; Maneeintr, K.; Numprasanthai, A.; Park, I.; et al. Conventional and recent advances in gravity separation technologies for coal cleaning: A systematic and critical review. Heliyon 2023, 9, e13083. [Google Scholar] [CrossRef]
  12. Amosah, M.E.; Zhou, J.; Galvin, K.P. Fourth generation gravity separation using the Reflux Classifier. Miner. Eng. 2025, 224, 109216. [Google Scholar] [CrossRef]
  13. Rodrigues, A.F.d.V.; Delboni Junior, H.; Zhou, J.; Galvin, K.P. Gravity separation of fine itabirite iron ore using the Reflux Classifier—Part II—Establishing the underpinning partition surface. Miner. Eng. 2024, 210, 108641. [Google Scholar] [CrossRef]
  14. Zhang, Z.; Gui, D.; Chen, P.; Li, Y.; Han, N.; Li, Y. The effect of inclined plate motion on the classification efficiency of quartz sand in the Reflux Classifier. Miner. Eng. 2025, 230, 109400. [Google Scholar] [CrossRef]
  15. Li, Y.F.; Li, Y.; Xia, W.C.; He, C.Y.; Zhu, R.T. A novel particulate sedimentation model in inclined channels of liquid-solid fluidized bed. Powder Technol. 2017, 305, 764–770. [Google Scholar] [CrossRef]
  16. Fan, R.; Guo, Z.; Guo, Z.; Zhang, R.; Wang, Y.; Xiong, S. Study on the separation and mixing laws of wide-grained dense medium in vibration separation fluidized bed. Chem. Eng. Res. Des. 2024, 204, 624–635. [Google Scholar] [CrossRef]
  17. Bulayani, M.M.; Raghupatruni, P.; Mamvura, T.; Danha, G. Exploring low-grade iron ore beneficiation techniques: A comprehensive review. Minerals 2024, 14, 796. [Google Scholar] [CrossRef]
  18. Nzeh, N.S.; Popoola, A.P. Physical beneficiation of heavy minerals–Part 2: A state of the art literature review on magnetic and electrostatic concentration techniques. Heliyon 2024, 10, e32201. [Google Scholar] [CrossRef] [PubMed]
  19. Raposo, F.L.Q.; Petter, C.O.; Ambrós, W.M. Unraveling Dry Jigging: Insights into Pulsation, Energy Consumption, and Stratification Dynamics. Minerals 2024, 14, 678. [Google Scholar] [CrossRef]
  20. Corchado-Albelo, J.L.; Alagha, L. Tellurium Enrichment in Copper Tailings: A Mineralogical and Processing Study. Minerals 2024, 14, 761. [Google Scholar] [CrossRef]
  21. Das, A.; Sarkar, B. Advanced gravity concentration of fine particles: A review. Miner. Process. Extr. Metall. Rev. 2018, 39, 359–394. [Google Scholar] [CrossRef]
  22. Moys, S. Sedimentation of Polydisperse Particles at Low Reynolds Numbers in Inclined Geometries. Ph.D. Thesis, Repositorio Academico—Universidad de Chile, Santiago de Chile, Chile, 2016. [Google Scholar]
  23. Richardson, J.; Zaki, W. Sedimentation and fluidisation: Part I. Chem. Eng. Res. Des. 1997, 75, S82–S100. [Google Scholar] [CrossRef]
  24. Stokes, G.G. On the effect of the internal friction of fluids on the motion of pendulums. Math. Phys. Pap. 1851, 1–10. [Google Scholar] [CrossRef]
  25. Voisin, C.F. Coastal restoration USING Pipeline-Conveyed Sediments; Louisiana State University and Agricultural & Mechanical College: Baton Rouge, LA, USA, 1997. [Google Scholar]
  26. Bagnold, R.A. Experiments on a gravity-free dispersion of large solid spheres in a Newtonian fluid under shear. Proc. R. Soc. Lond. Ser. A. Math. Phys. Sci. 1954, 225, 49–63. [Google Scholar]
  27. Shi, H. Application of TBS in Xinyang Coal Preparation Plant. Clean Coal Technol. 2014, 20, 110–112. [Google Scholar] [CrossRef]
  28. Zhang, L.; Duan, F.; Xie, G.; Gao, W.; Su, D.; Ni, C.; Fu, X. Comparison of Performance of TPS and TBS in Separation of Coarse Coal Slime. Coal Prep. Technol. 2024, 52, 47–53. [Google Scholar] [CrossRef]
  29. Fu, D. Three-Product Teetered Bed Separator—A New Design for Coal Slime Separation. In Proceedings of the XVIII International Coal Preparation Congress, Saint-Petersburg, Russia, 28 June–1 July 2016; pp. 377–382. [Google Scholar]
  30. Marion, C.; Paris, J.; Grammatikopoulos, T.; Li, R.; Kökkılıç, O.; Langlois, R.; Rowson, N.A.; Waters, K.E. Physical separations for rare-earth beneficiation of the nechalacho deposit. Minerals 2023, 13, 1521. [Google Scholar] [CrossRef]
  31. Li, Y.; Lv, J.; Li, Z.; Zhou, Y.; Qin, L. A Novel Technology for the Recovery and Separation of Cassiterite-and Iron-Containing Minerals from Tin-Containing Tailing. Minerals 2024, 14, 1058. [Google Scholar] [CrossRef]
  32. Sixhuta, I.; Singh, A.; Khangale, P.; Meijboom, R.; Raphulu, M. Characterization and Processing of Low-Grade Middle Group 2 Chromite Ore by Gravity Shaking Table and a Comparative SLon Magnetic Separation: A Case Study. Minerals 2024, 14, 1201. [Google Scholar] [CrossRef]
  33. Takata, K.; Kurose, R. Influence of density flow on treated water turbidity in a sedimentation basin with inclined plate settler. Water Sci. Technol. Water Supply 2017, 17, 1140–1148. [Google Scholar] [CrossRef]
  34. Saleh, A.M.; Hamoda, M.F. Upgrading of secondary clarifiers by inclined plate settlers. Water Sci. Technol. 1999, 40, 141–149. [Google Scholar] [CrossRef]
  35. Galvin, K.; Zhou, J.; Sutherland, J.; Iveson, S. Enhanced recovery of zircon using a REFLUX™ Classifier with an inclined channel spacing of 3 mm. Miner. Eng. 2020, 147, 106148. [Google Scholar] [CrossRef]
  36. Orupold, T.; Starr, D.; Kenefick, T. The lamella high shear rate REFLUX™ classifier. J. South. Afr. Inst. Min. Metall. 2014, 114, 511–518. [Google Scholar] [CrossRef]
  37. Wang, J.J.; Han, Y.; Gu, X.P.; Feng, L.F.; Hu, G.H. Effect of agitation on the fluidization behavior of a gas–solid fluidized bed with a frame impeller. Aiche J. 2013, 59, 1066–1074. [Google Scholar] [CrossRef]
  38. Li, X.; Liu, Y.; Wang, T.; Li, N.; Zhang, T. Experimental and numerical investigations on the hydrodynamics of gas-solid fluidized bed with an inclined agitator. Powder Technol. 2021, 380, 26–38. [Google Scholar] [CrossRef]
  39. Guo, M.; Li, H. Handbook of Fluidization, 1st ed.; Chemical Industry Press: Beijing, China, 2008. [Google Scholar]
  40. Dong, K.; Zhou, Y.; Huang, Z.; Wang, J.; Yang, Y. Gas bubble behaviors in a gas–solid fluidized bed with an arch agitator. Powder Technol. 2014, 266, 38–44. [Google Scholar] [CrossRef]
  41. Lu, D.; Wang, Y.; Huang, P.; Hu, Y. Flow Field Simulation and Experimental Study of Self-Made Hydraulicclassification Equipment for Bauxite Desiliconization. Chin. J. Nonferrous Met. 2011, 21, 1713–1718. [Google Scholar]
  42. Chu, H.; Wang, Y.; Lu, D.; Liu, Z.; Zheng, X. Pre-concentration of fine antimony oxide tailings using an agitated reflux classifier. Powder Technol. 2020, 376, 565–572. [Google Scholar] [CrossRef]
  43. Chu, H.; Liu, Z.; Wang, Y.; Lu, D.; Zheng, X.; Zhao, Y. Agitation effect on particle dispersion and separation in an agitated reflux classifier. Miner. Eng. 2022, 187, 107804. [Google Scholar] [CrossRef]
  44. Liu, Z.; Lu, D.; Wang, Y.; Zhang, Y.; Liu, Y. Processing of Fine-Grained Low-Grade Antimony Oxide Tailings Using a Trapezoidal Inclined Channel Agitated Reflux Classifier. Min. Metall. Explor. 2025, 42, 421–432. [Google Scholar] [CrossRef]
  45. Liu, Z.; Lu, D.; Wang, Y.; Gao, Y.; Zhao, Y.; Zheng, X.; Chen, F. Enhancing Pre-Concentration Efficiency of Antimony Oxide by Controllingthe Inclined Flow of Reflux Classifier. J. China Univ. Min. Technol. 2023, 52, 1002–1013. [Google Scholar] [CrossRef]
  46. Zeng, F.; Wang, Y.; Lu, D.; Li, X.; Zheng, X. Application of self-made reflux classifier in gravity preconcentration of lateritic nickel and flow field simulation thereof. Min. Metall. Eng 2017, 37, 52–56. [Google Scholar]
  47. Chen, F.; Gao, Y.; Lu, D.; Liu, Z.; Zhao, Y. Study on the Application of a Reflux Classifier in the Classification of Ultrafine Ilmenite. Minerals 2023, 13, 304. [Google Scholar] [CrossRef]
  48. Liu, Z.; Su, Z.; Liu, B.; Wang, Y.; Zhang, Y.; Zhong, X.; Chen, K.; Hu, X.; Lu, D. Preconcentrating Ultrafine Ilmenite Tailings Using a Laboratory-Scale Reflux Classifier. Minerals 2024, 14, 1125. [Google Scholar] [CrossRef]
  49. Liu, Z.; Lu, D.; Wang, Y.; Zhang, Y.; Liu, Y. A Pilot Scale Study of Recovery Ultra-Fine and Low-Grade Barite Using the Agitated Reflux Classifier. Min. Metall. Explor. 2025, 1–16. [Google Scholar] [CrossRef]
  50. Liu, Z.-q.; Lu, D.-f.; Wang, Y.-h.; Chu, H.-r.; Zheng, X.-y.; Chen, F.-l. Application of reflux classifier with closely spaced inclined channels in pre-concentrate process of fine antimony oxide particles. J. Cent. South Univ. 2020, 27, 3290–3301. [Google Scholar] [CrossRef]
  51. Wills, B.A.; Finch, J. Wills’ Mineral Processing Technology: An Introduction to the Practical Aspects of Ore Treatment and Mineral Recovery; Butterworth-Heinemann: Oxford, UK, 2015. [Google Scholar]
  52. Box, G.E.P.; Wilson, K.B. On the Experimental Attainment of Optimum Conditions. J. R. Stat. Soc. Ser. B (Methodol.) 2018, 13, 1–38. [Google Scholar] [CrossRef]
Figure 1. The method of introducing the drive shaft into a stirred fluidized bed.
Minerals 15 00605 g001
Figure 2. Schematic of the pilot-scale agitated reflux classifier unit used for testing.
Minerals 15 00605 g002
Figure 3. Structural schematic diagram of the pulsation reflux classifier (PRC): (a) overall structure of PRC; (b) pulsation components; (c) water distribution chamber.
Minerals 15 00605 g003
Figure 4. Flowsheet of the preconcentration test.
Minerals 15 00605 g004
Figure 5. Ore particle size analysis.
Minerals 15 00605 g005
Figure 6. Raw ore XRD analysis results: (a) raw ore; (b) analysis after shaking table.
Minerals 15 00605 g006
Figure 7. Experimental results of pulsation frequency conditions. (a) Recovery, Tailings yield and Separation efficiency; (b) Concentrate grade and Tailings grade.
Minerals 15 00605 g007
Figure 8. Experimental results of pulsation stroke conditions. (a) Recovery, Tailings yield and Separation efficiency; (b) Concentrate grade and Tailings grade.
Minerals 15 00605 g008
Figure 9. Experimental results of fluidization rate conditions. (a) Recovery, Tailings yield and Separation efficiency; (b) Concentrate grade and Tailings grade.
Minerals 15 00605 g009
Figure 10. Sb grade response surface diagram. (a) Interaction of pulsation frequency and stroke; (b) interaction of pulsation frequency and fluidization rate; (c) interaction of fluidization rate and stroke.
Minerals 15 00605 g010
Figure 11. Recovery response surface. (a) Interaction of pulsation frequency and stroke; (b) interaction of pulsation frequency and fluidization rate; (c) interaction of fluidization rate and stroke.
Minerals 15 00605 g011
Figure 12. Separation efficiency response surface diagram. (a) Interaction of pulsation frequency and stroke; (b) interaction of pulsation frequency and fluidization rate; (c) interaction of fluidization rate and stroke.
Minerals 15 00605 g012
Figure 13. Schematic diagram of axial coordinate system.
Minerals 15 00605 g013
Figure 14. Characteristic diagram of the bed at different pulsation frequencies: (a) bed Sb grade; (b) bed mass concentration; (c) bed density.
Minerals 15 00605 g014
Figure 15. Characteristic diagram of the bed at different pulsation strokes: (a) bed Sb grade; (b) bed mass concentration; (c) bed density.
Minerals 15 00605 g015
Figure 16. Characteristic diagram of the bed at different fluidization water flux: (a) bed Sb grade; (b) bed mass concentration; (c) bed density.
Minerals 15 00605 g016
Table 1. Relationship between k-m values and Reynolds number (Re).
Rekm
Re ≤ 1 [24]0.500.50
1 < Re ≤ 500 [25]1.002/3
500 < Re ≤ 2 × 10⁵ [25]2.001.00
Table 2. The multi-element analysis results of raw antimony oxide ore (mass fraction, %).
ElementsSbOSiAlCaFeKSMgTiWNa
Content0.851.4142.432.051.300.940.340.280.140.090.090.04
Table 3. Comparison of the separation effect between the pulsation condition and non-pulsation condition.
Fluidization MethodConcentrate Grade (%)Recovery (%)Separation Efficiency (%)Tailings Yield (%)Tailing Grade (%)
Pulsation4.9383.5470.5386.280.152
Non-pulsation4.6681.9668.5785.930.168
Table 4. Coding and levels of the independent variables.
VariablesSymbolCoded Variable Level
LowCenterHigh
−10+1
Pulsation frequency (PF), times/s x 246
Pulsation stroke (PS), mm x 246
Fluidization rate (FR), L/h x 243240
Table 5. Experimental result of pulsation reflux classifier.
RunCoded Variable LevelResponse
x x x Grade (%)Recovery (%)Separation Efficiency (%)
1−1−104.5183.7369.32
2+1−104.8281.6769.36
3−1+104.8479.2366.80
4+1+105.1272.8862.64
5−10−14.6484.4470.12
6+10−14.8377.6266.91
7−10+14.6179.6267.02
8+10+15.3876.8766.58
90−1−14.8183.3870.92
100+1−15.1174.9764.47
110−1+15.1179.5768.37
120+1+15.2575.0964.75
130005.4281.8170.91
140005.5382.1571.18
150005.5081.7471.04
Table 6. Variance analysis of regression equation for y 1 (Sb grade of concentrate).
SourceSequential Sums of SquaresAdjusted Mean SquaresFp-ValueSignificance
Model1.560.173429.090.0009significant
x 1 0.30030.300350.390.0009
x 2 0.14450.144524.240.0044
x 3 0.11640.116419.530.0069
x 1 x 2 0.00020.00020.0260.8777
x 1 x 3 0.08560.085614.360.0128
x 2 x 3 0.00640.00641.0700.3476
x 1 2 0.69200.6920116.10.0001
x 2 2 0.19390.193932.540.0023
x 3 2 0.12870.128721.590.0056
Residual0.02980.0060
Lack of fit0.02330.00782.4100.3072not significant
Pure rrror0.00650.0032
Total1.59
Table 7. Variance analysis of regression equation for y 2 (recovery of concentrate).
SourceSequential Sums of SquaresAdjusted Mean SquaresFp-ValueSignificance
Model172.719.18131.8<0.0001significant
x 1 40.3940.39277.5<0.0001
x 2 85.6785.67588.7<0.0001
x 3 10.7110.7173.570.0004
x 1 x 2 4.6004.60031.580.0025
x 1 x 3 4.1304.13028.390.0031
x 2 x 3 3.8503.85026.480.0036
x 1 2 1.2101.2108.3000.0346
x 2 2 14.0914.0996.820.0002
x 3 2 10.6010.6072.810.0004
Residual0.72770.1455
Lack of fit0.62870.20964.2300.1969not significant
Pure rrror0.09900.0495
Total173.38
Table 8. Variance analysis of regression equation for y 3 (separation efficiency of concentrate).
SourceSequential Sums of SquaresAdjusted Mean SquaresFp-ValueSignificance
Model101.611.29178.7<0.0001significant
x 1 7.5307.530119.30.0001
x 2 46.6046.60737.8<0.0001
x 3 4.0704.07064.370.0005
x 1 x 2 4.4204.42069.940.0004
x 1 x 3 1.9101.91030.170.0027
x 2 x 3 2.0102.01031.820.0024
x 1 2 11.2011.20177.3<0.0001
x 2 2 19.0319.03301.3<0.0001
x 3 2 10.0010.00158.4<0.0001
Residual0.31580.0632
Lack of fit0.27980.09335.1800.1660not significant
Pure error0.03600.0180
Total101.9
Table 9. Predicted value of optimal solution and separation conditions.
Pulsation Frequency (times/s)Pulsation Stroke (mm)Fluidization Rate (L/h)Concentrate
Grade (%)
Recovery (%)Separation Efficiency (%)
43.5631.965.4482.5371.47
Table 10. Validation response surface optimization test results.
ProductYield (%)Sb grade (%)Recovery (%)Separation Efficiency (%)
Concentrate11.485.4881.6870.97
Tailings88.520.1616.32
Disclaimer/Publisher’s Note: The statements, opinions and data contained in all publications are solely those of the individual author(s) and contributor(s) and not of MDPI and/or the editor(s). MDPI and/or the editor(s) disclaim responsibility for any injury to people or property resulting from any ideas, methods, instructions or products referred to in the content.

