Article

Magmatic Telescoping as a Reflection of the Shift in Geodynamic Circumstances and Patterns of Formation of Gold Ore Manifestations in the Example of the Uskalin Granitoid Massif (Russia)

Institute of Geology and Nature Management, Russian Academy of Sciences, Far Eastern Branch, 675000 Blagoveshchensk, Amur region, Russia
Minerals 2025, 15(6), 592; https://doi.org/10.3390/min15060592
Submission received: 17 April 2025 / Revised: 8 May 2025 / Accepted: 28 May 2025 / Published: 1 June 2025
(This article belongs to the Section Mineral Deposits)

Abstract

:
This paper considers the spatial distribution of gold occurrences, their geochemical anomalies, and late Mesozoic igneous complexes within the framing of the eastern flank of the Mongol–Okhotsk orogenic belt (EF MOOB). It is established that elevated gold concentrations are associated with telescoped igneous complexes formed in different geodynamic regimes. The southern framing of the EF MOOB (Russia) was chosen as the key study area due to its well-preserved superposition of multi-stage igneous events. These stages are considered using the example of the Uskalin intrusive massif. It is a representative example where three geodynamic phases are recorded, namely initial supra-subduction (149–138 Ma), subduction (140–122 Ma), and collision (119–97 Ma). It is shown that the massif is composed of granitoids aged 145 Ma, 129 Ma, and 112 Ma, which correspond to the distinguished geodynamic stages. Geochemical characteristics of the rocks of the first two stages completely coincide with those of the rocks corresponding to the geodynamic stages. The exception is the formations from the collision process. At this stage, differences appear in the rocks, which are manifested in the Sr/Y ratio. These values are comparable with those in the granitoids of the adakite series. Such differences were established only within gold-bearing areas. The formation of the Uskalin massif was accompanied by extensive mineralization zones with gold-bearing veins. Gold concentrations in granitoids of the adakite series (145 Ma) exceed the crustal Clarke value by 2.25 times, which directly links mineralization with magmatic processes. It is assumed that the presence of collision-stage rocks with signs of the adakite signature may be one of the signs of detection of epithermal gold ore objects in the zones of magmatic telescoping. Taking into account the evolution of the MOOB associated with the closure of the MOB and with the accompanying magmatic events, an analog of which is considered using the example of the southern framing of the EF MOOB, it is possible to assume the use of the obtained results in conducting exploration work for ore gold in this region.

1. Introduction

The uniqueness of the metallogeny of the Mongol–Okhotsk orogenic belt (MOOB) (Figure 1a) has been known since almost the middle of the 19th century.
I.A. Poletika called this region “gold-bearing mountains” [5]. Since that time (the second half of the 19th century), not only did the development of the riches of this geological object begin, but also its active study. By now, it has been established that the MOOB was finally formed by the end of the Early Cretaceous, as a result of the closure of the basin of the same name [6,7,8,9,10,11,12,13]. However, as a result of Cenozoic tectonic events, the belt was divided into two flanks: western and eastern [14]. Within the western flank, the geodynamic processes accompanying the closure of the Mongol–Okhotsk Basin (MOB) are significantly obscured by late tectonic and magmatic events. Within the eastern flank, these processes are almost undistorted. Therefore, it is an excellent testing ground for studying the sequence of geological events and associated ore processes.
The eastern flank of the Mongol–Okhotsk orogenic belt (EFO MOOB) is located entirely in the Amur region (Russia). This Amur region is one of the leading regions of Russia in terms of gold mining. Hundreds of thousands of kilograms of gold have been extracted from its depths [15]. The ore objects identified to date are not large or unique deposits. The relationship between gold mineralization and late Mesozoic magmatism has been mentioned since the 1960s [16]. In the 2000s, precision data on the geochronology and material composition of igneous rocks in the region were accumulated. This made it possible to study in detail the likelihood of a relationship between late Mesozoic magmatism and gold mineralization, and to answer the question surrounding the spatial distribution of igneous complexes which should be taken into account in the further forecasting of gold deposits.
The general idea of the features of gold distribution in the frame of the EF MOOB is indicated by their behavior in the bottom sediments of watercourses. To obtain this information, mono-element maps of element concentrations were analyzed based on the materials from the primary data of lithochemical surveys along dispersion flows [2,3,4]. Analysis of the distribution of geochemical fields of gold mineralization showed their confinement to the areas of development of rocks of volcano–plutonic complexes of the late Mesozoic (Figure 1b,c).
The study of the formations of these complexes during mapping was complicated by the fact that several types of rock are found within one massif. This led to the identification of up to seven phases of one complex within some massifs. The accumulated statistics on geochronology and material geochemistry composition have shown the following: within one massif, rocks of various complexes were formed, accompanying different geodynamic settings. It was established that subduction processes began in the region around 150 Ma, which were accompanied by the formation of volcano plutonic complexes of the adakite series with an age of 149–138 Ma [17,18]. The active phase of subduction (140–122 Ma) is marked by the formation of rocks of the differentiated calk–alkaline series. About 120 Ma, subduction processes gave way to collisional ones. These events were reflected in the formation of rocks of bimodal complexes (119–97 million years) [9,19]. The change in geodynamic settings and the formation of magmatic complexes accompanying these geodynamic scenarios are well illustrated by the following diagram (Figure 2).
All magmatic processes occurred synchronously in the northern and southern frames. In the north, due to Cenozoic tectonic events, the territory was subjected to intense destruction (Figure 1c). The volcanic structures here are significantly eroded. In the south, they are better preserved (Figure 1b,c).
To solve the aforementioned problems, the Uskalin massif was chosen as one of the most controversial and complexly constructed objects (Figure 3). The massif is located in the upper reaches of the Uskali River, on the left bank of the Amur River. The area of the outcrop of this laccolithic intrusive body is about 60 km2, but it is believed that it represents only the upper part of a large pluton. Determinations of the age of the rocks are very contradictory. According to [21], they were formed 129.6 ± 0.64 Ma. In the work [22], the formation time of the massif was given as 145 ± 5 Ma. According to the age of formation of this intrusive body, in the first case they were attributed to the Early Cretaceous, and in the second case they were attributed to the Late Jurassic. At the same time, all researchers divide the rocks of the Uskalin massif into several phases. In the structure of the massif, granosyenite porphyry, granosyenite, and subalkaline granites are distinguished. The authors of [21,22] attributed these rocks to formations of the first phase. Subalkaline granites, making up the southwestern part of the massif, are attributed to the second phase. Some of the subalkaline granite porphyry and granite porphyry were identified in local areas of the marginal zones of the intrusion. In the work of [22], these rocks are stated to belong to the endocontact facies. In the work of [21], they are described as apical areas. As a result, both authors believe that the Uskalin massif is composed of a single two-phase complex and that the rocks of this complex were formed in an intraplate setting, synchronously with normal alkalinity granitoids and A-type granites. We have studied the southeastern part of the Uskalin massif: petrographic profile d2010 − d2010-6 (Figure 3).

2. Materials and Methods
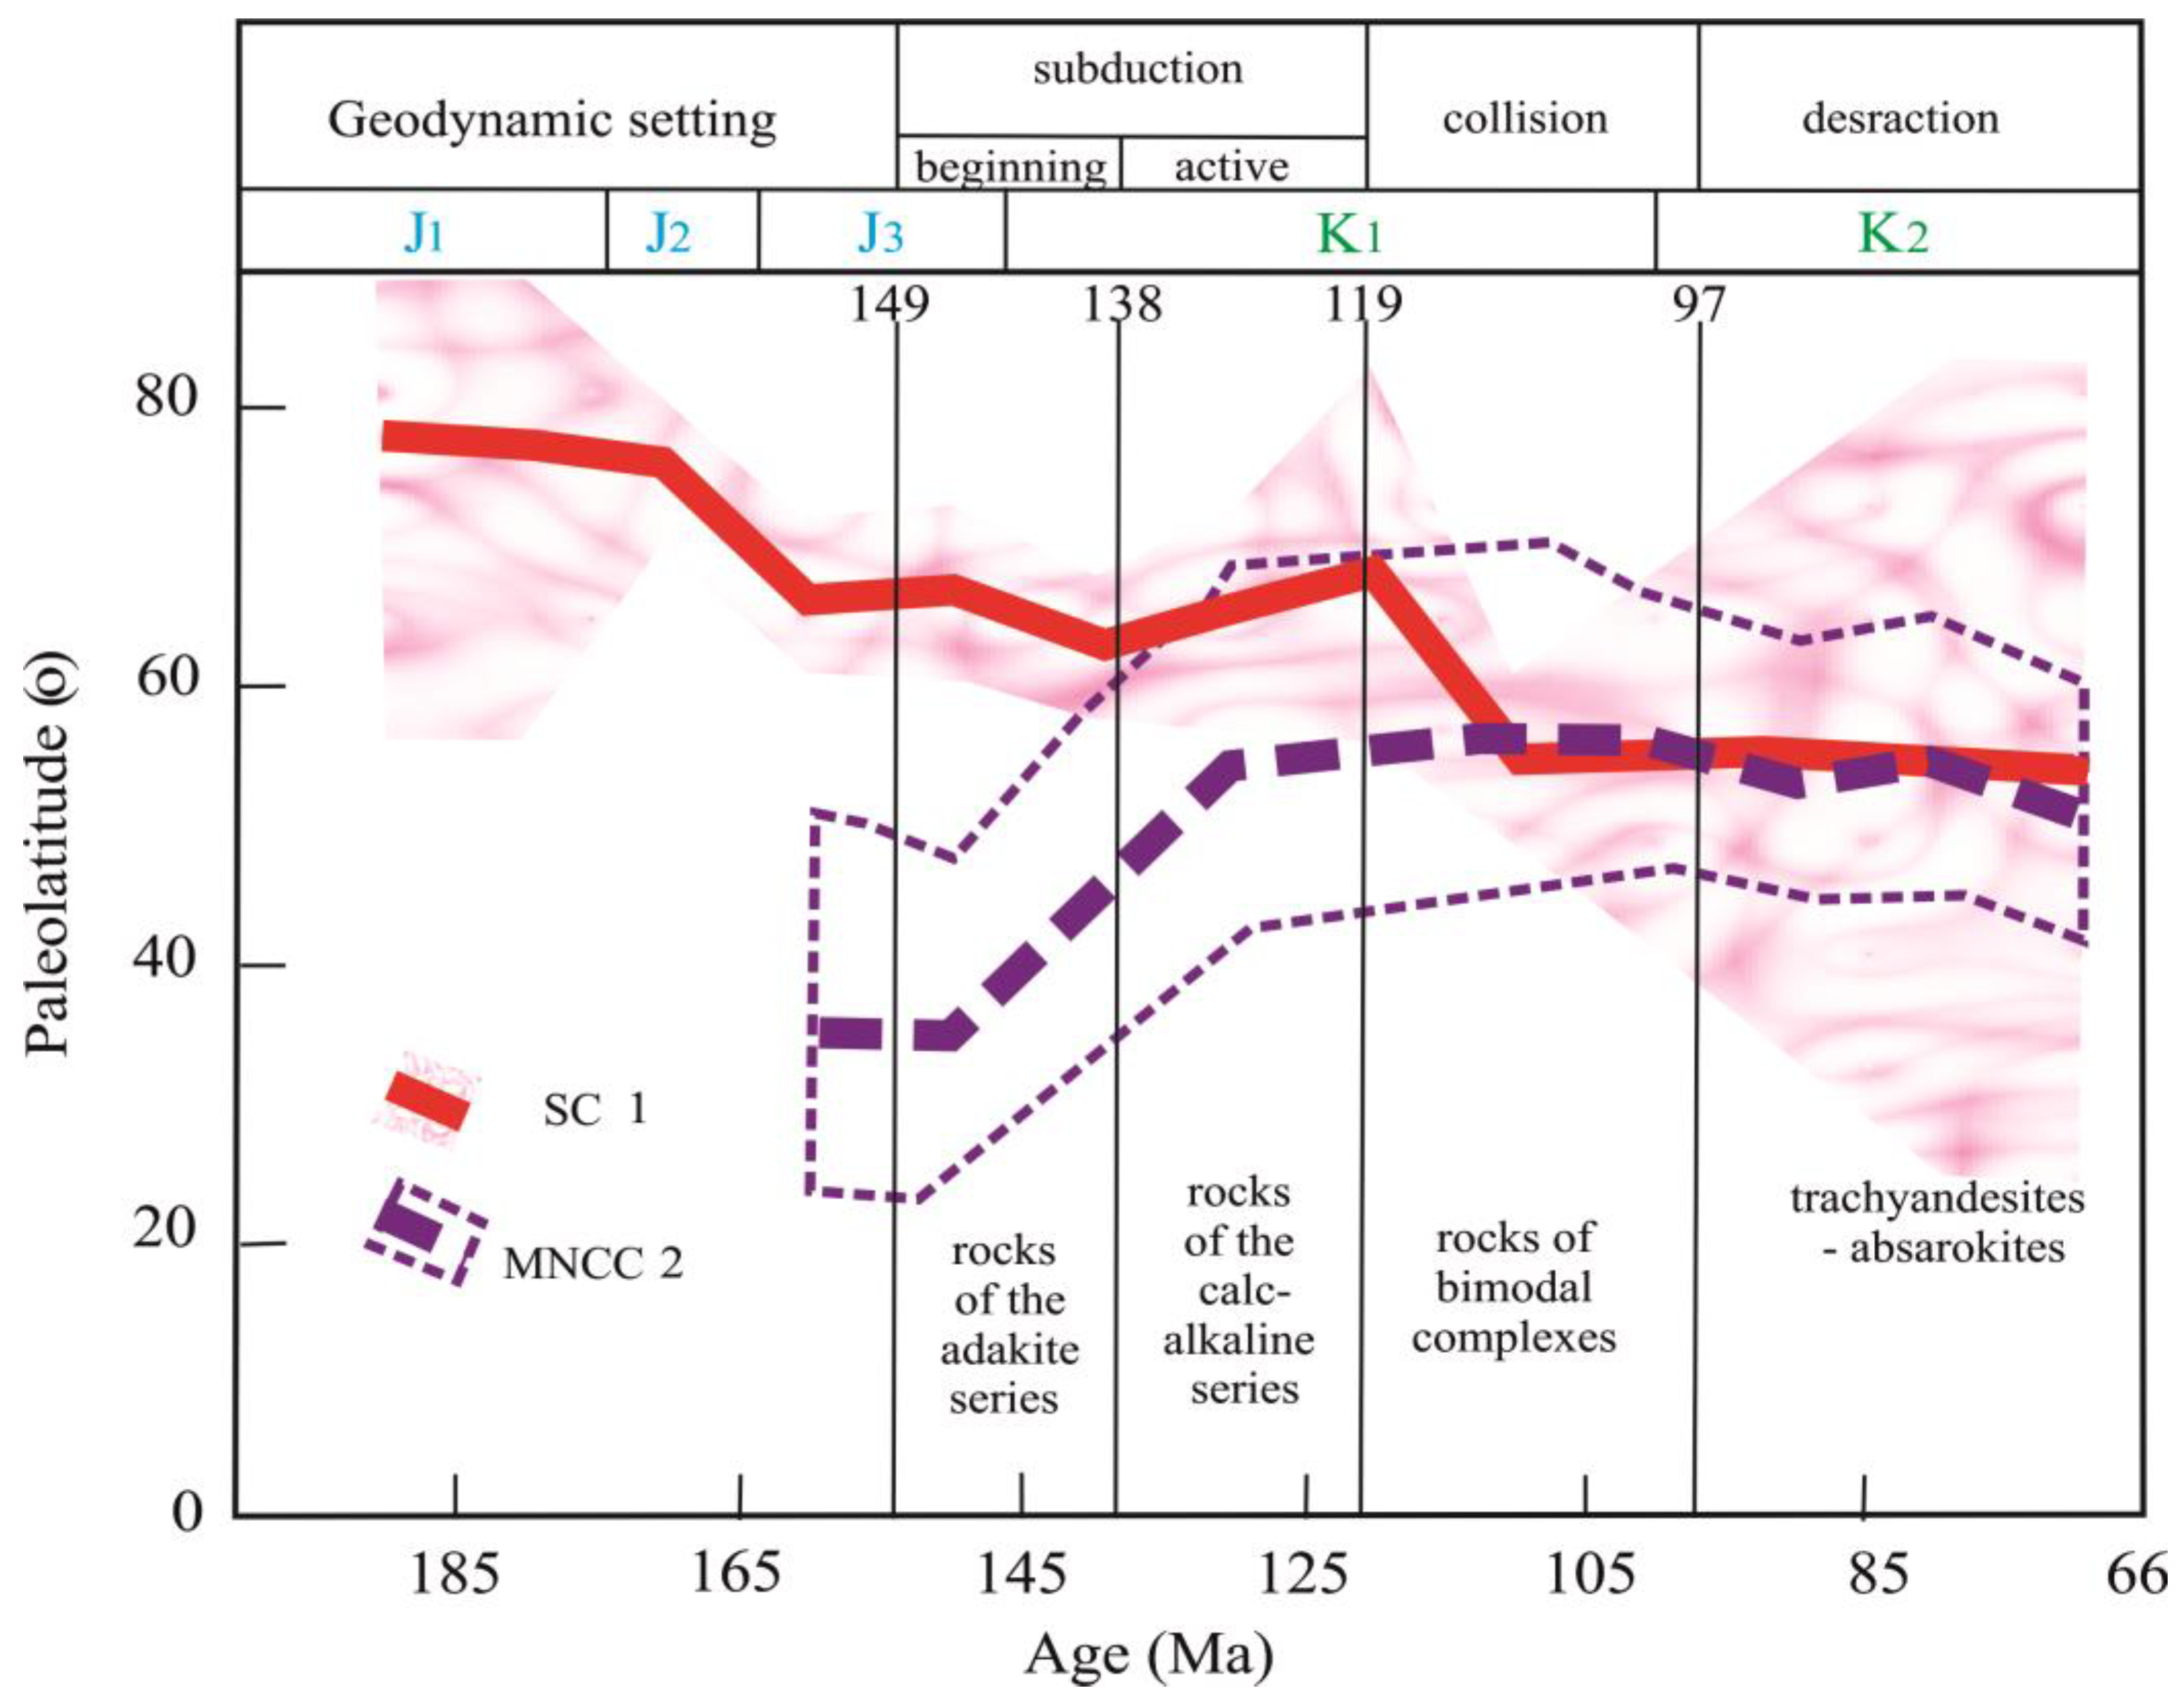
Mineralogical and petrographic characteristics of 12 representative samples of granitoids were studied using an Axio Scope A1 polarizing microscope. Determination of the contents of rock-forming elements and some trace elements (V, Cr, Co, Ni, Cu, Zn, Rb, Sr, Y, Nb, Zr, and Ba) in granitoids was performed by the X-ray fluorescence method at the Institute of Geology and Nature Management, Far Eastern Branch of the Russian Academy of Sciences (Blagoveshchensk, Russia) on a Pioneer 4S X-ray spectrometer. Concentrations of trace elements using the ICP-MS method were determined at the A.P. Vinogradov Institute of Geochemistry, Siberian Branch of the Russian Academy of Sciences (Irkutsk, Russia) on a NexION 300D ICP mass spectrometer. The following microelements were determined by the ICP-MS method: Ga, Ge, Rb, Cs, Sr, Ba, Pb, La, Ce, Pr, Nd, Sm, Eu, Gd, Tb, Dy, Ho, Er, Tm, Yb, Lu, Y, Th, U, Zr, Hf, Nb, Ta, and Sc.
Zircon grains for U-Pb geochronological studies were isolated in the mineralogical laboratory of the Institute of Geology and Nature Management FEB RAS (Blagoveshchensk, Russia) using heavy liquids.
U-Pb geochronological studies on the differentiated series granitoids (sample d2010–1) and rocks that were assigned by predecessors to the endocontact facies (sample d2010–2) were carried out at the Geospectrum Collective Use Center of the Geological Institute SB RAS (Ulan-Ude, Russia) using an Element XR single-collector magnetic sector mass spectrometer with inductively coupled plasma (Termo Scientific, “Thermo Fisher Scientific”, Waltham, MA, USA). The mass spectrometer was equipped with a UP-213 laser ablation device (New Wave Research, California, CA, USA). A detailed description of the analytical procedures is presented in the publication [23]. The obtained results were processed using the Glitter [24] and Isoplot v. 3.6 [25] programs.

3. Results

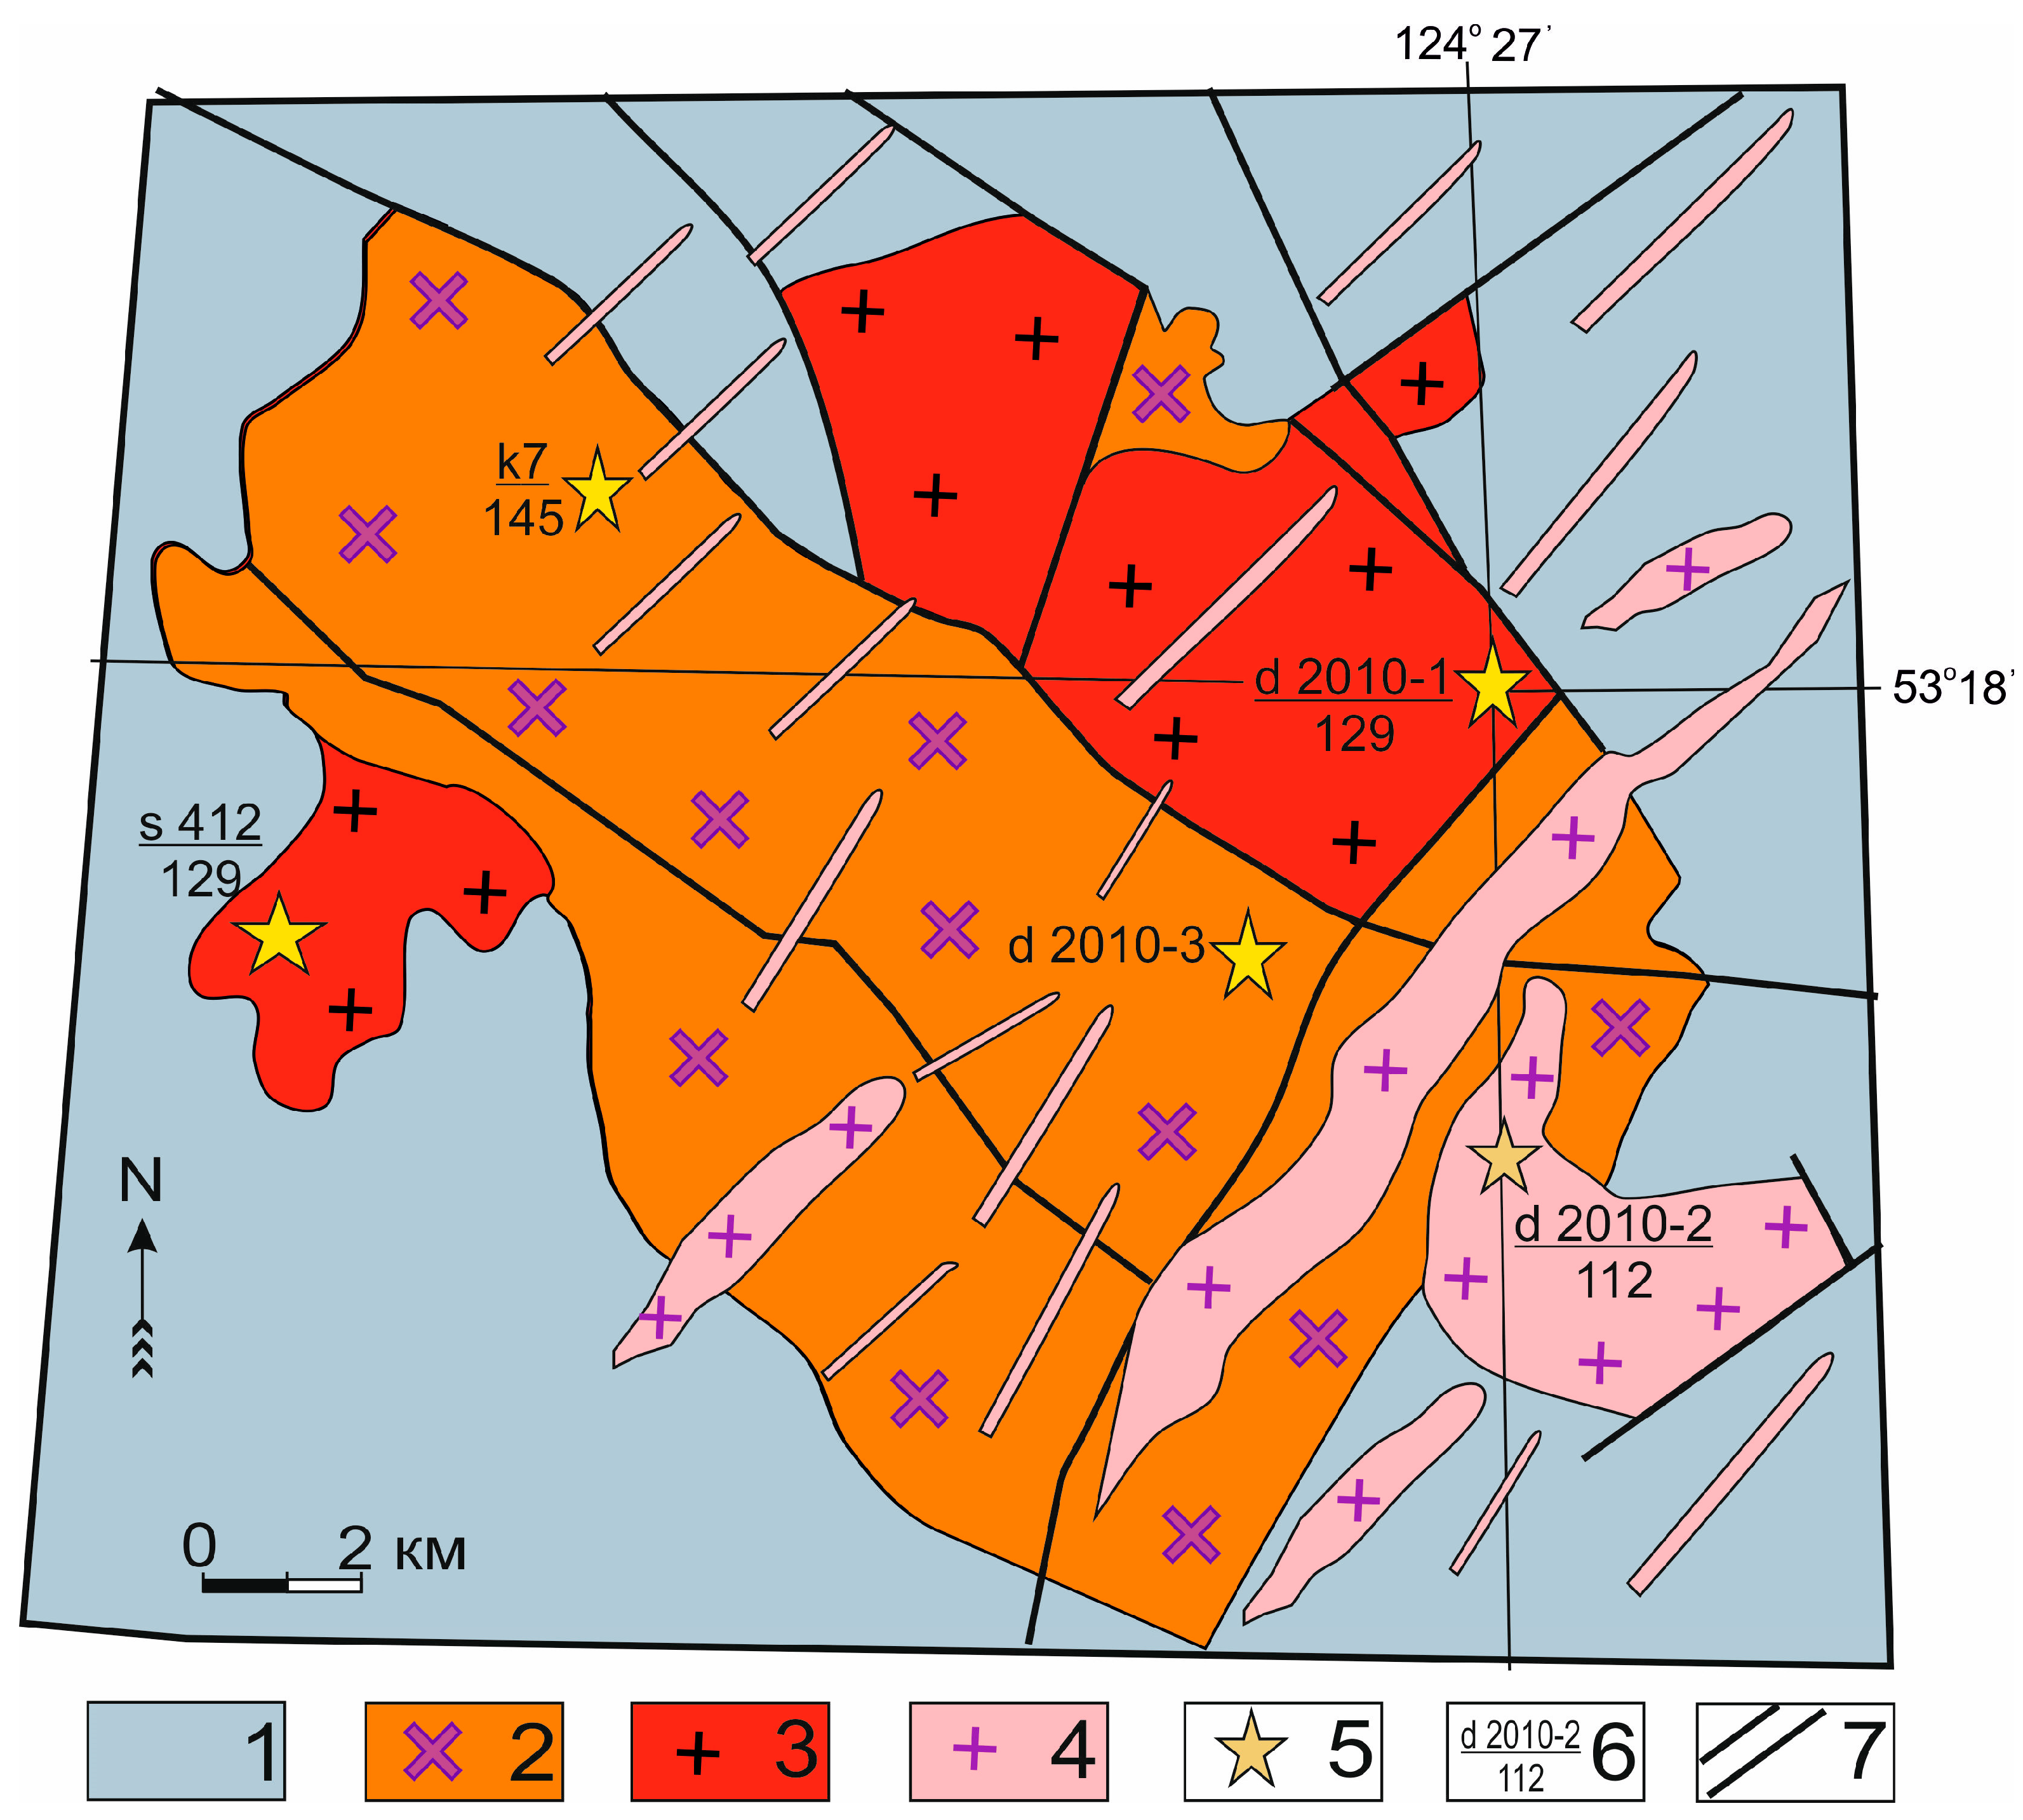
3.1. Petrographic Features of the Uskalin Massif

The structure of the Uskalin massif includes syenites, granosyenites, subalkaline granites and granite porphyries, normal series granite porphyries, granodiorite porphyries, quartz diorite porphyrites, and granites. All rocks (except granites) are characterized by porphyry structures.
The main mass of syenites and granosyenites is made up of feldspars, quartz, and amphibole, and is blue–green to brownish in the center of the grains. Phenocrysts segregations are formed by microcline perthite, plagioclase No. 23–27, and quartz. Among the accessory minerals, sphene predominates (up to 2%); zircon, apatite, and an ore mineral are also present (Figure 4a).
The groundmass in subalkaline granites is represented by quartz, plagioclase No. 25–28, orthoclase, greenish–brown biotite, and blue-green amphibole. Porphyries are formed by microcline and quartz. Accessory minerals include zircon, sphene, apatite, magnetite, and hematite. Subalkaline granite porphyries differ from subalkaline granites only in the structure of the groundmass. They develop a crown structure, as small quartz grains are overgrown with plagioclase. Granite porphyries are characterized by a fine-grained groundmass. It is represented by quartz, feldspars, and brown biotite. Porphyry segregations are formed by plagioclase No. 26–33, quartz, brown biotite, and potassic feldspar. Accessory minerals include sphene, apatite, zircon, and ore mineral (Figure 4b). Granodiorite porphyrites are similar in composition to granite porphyries, but rare grains of green amphibole appear in them.
Quartz diorite porphyrites contain plagioclase No. 33–40, green amphibole, brownish–brown biotite, potassic feldspar, and quartz. Sometimes, relics of volcanic glass are preserved. The glass is intensively devitrified and replaced by secondary minerals, including chlorite, hydromica, and earthy aggregates of epidote (Figure 4c).
Holocrystalline rocks are rare. They are represented by granites with a hypidiomorphic granular structure. They are composed of quartz, plagioclase No. 26–28, microcline, and orange–brown biotite. Accessory minerals include zircon, sphene, and ore mineral.
Among the secondary formations in all rocks, pelitic matter, chlorite, sericite, calcite, epidote, and saussurite predominate.
Jurassic sedimentary rocks enclosing granitoids of the Uskalin massif underwent intensive contact metamorphism. The contour of the intrusion influence on the host rocks sometimes reaches 2 km. Within these limits, new formations of granoblastic quartz and rosette accumulations of finely flaked biotite and sericite appear in terrigenous deposits. Sericite sometimes changes into small muscovite leaflets. In isolated cases, actinolite appears. At the contact with granites, terrigenous rocks are hornfelsed or altered to quartzite. Quartz veins with gold were found in the near-contact part of the massif in the north (summary of [22]).

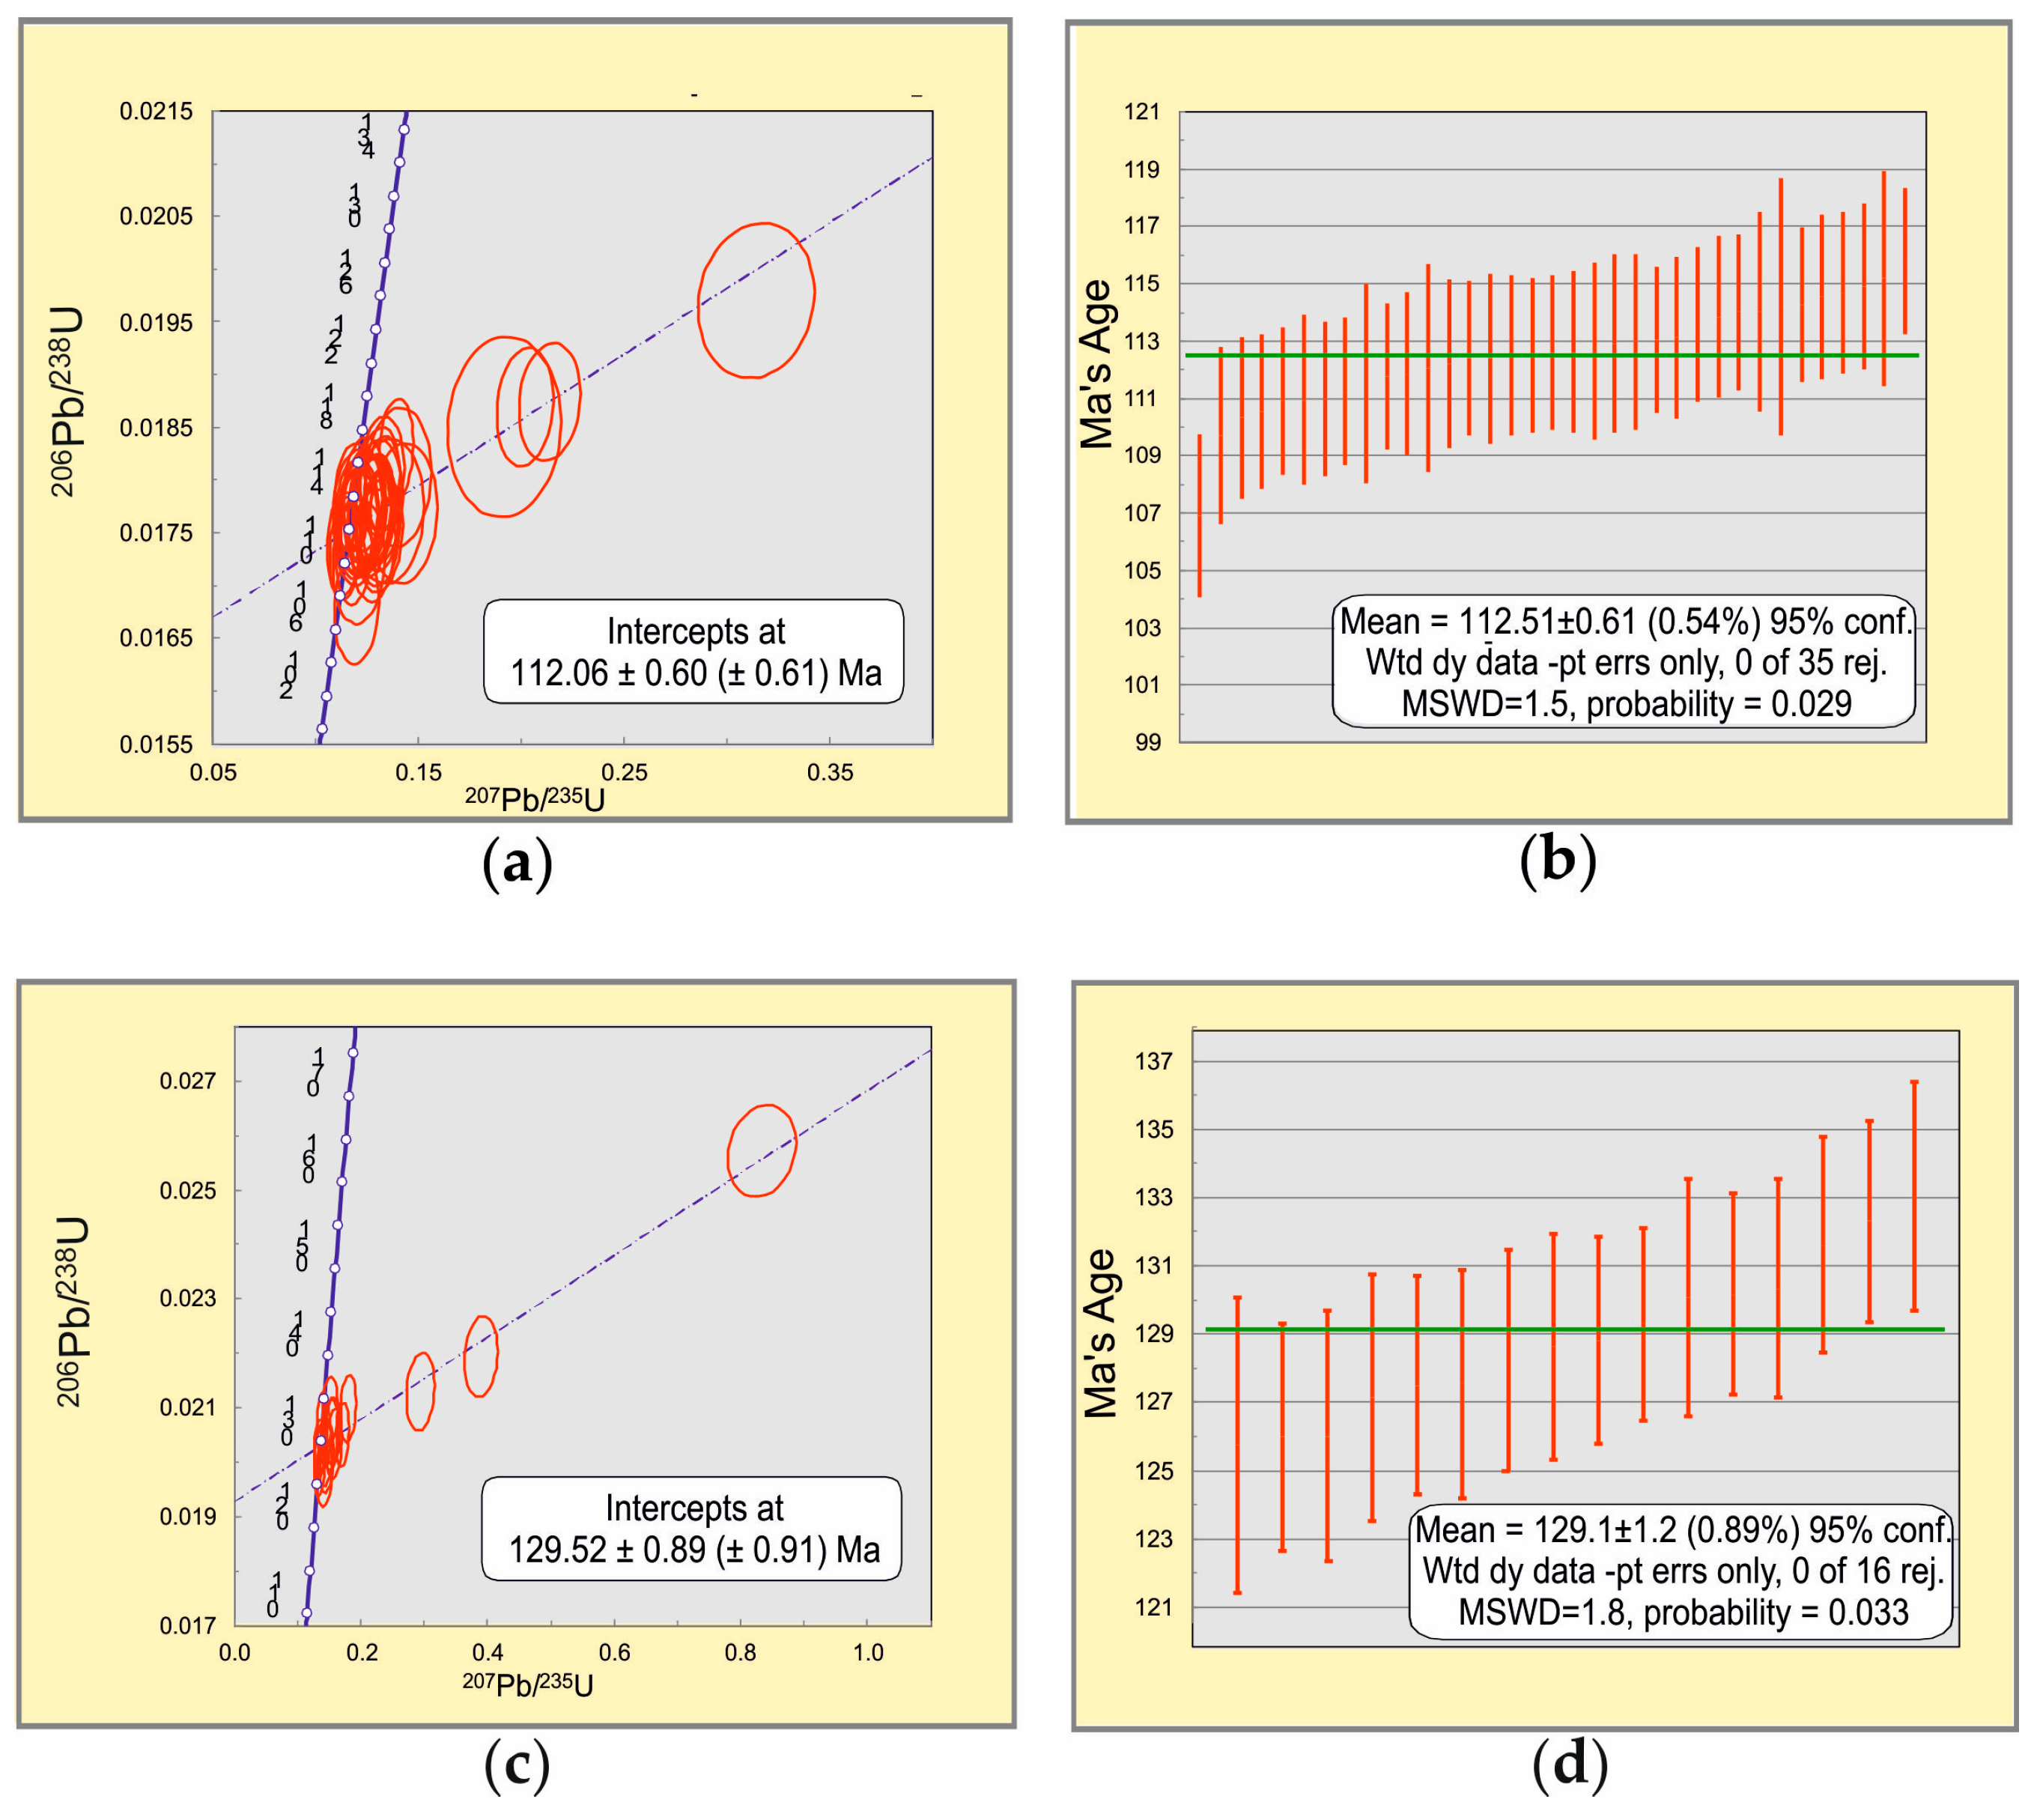
3.2. Age of Granitoids of the Uskalin Massif

Zircons extracted from the Uskalin massif granitoids for geochronological studies by the U-Pb method are represented by short- and long prismatic transparent and translucent crystals of a slightly yellowish color of subhedral or idiomorphic shape. In the cathodoluminescence image they are characterized by concentric and sectorial zonality of growth. Of all the listed varieties of granitoids, quartz diorite porphyrites are the most clearly mapped. They form small bodies and dikes that break through the rocks of the Uskalin massif and the terrigenous formations enclosing it. The structure of small bodies shows petrographic zoning, typical of the structure of subvolcanic intrusions: a well-crystallized central part gradually passes to less crystalline areas. In this case, the marginal part is represented by andesites. These rocks (sample d2010–2) were selected for age determination (Figure 3). The age of quartz diorite porphyrites was 112 Ma ± 0.60 (Figure 5a,b; Table 1 and Table 2), which is comparable in time with the stage of collisional events in the region under consideration, when the formation of bimodal complex formations took place over a period of about 20 Ma (Figure 2).
The situation is more complicated when mapping plutonic complexes that formed under subduction conditions. At the initial stage of subduction, granitoids of the adakite series were formed, which are often comparable in appearance to subalkaline granitoids of the main stage of subduction. They are also partially superimposed in the time of formation (Figure 2) [17,18].
Geochronological studies by our predecessors [21] were carried out for granitoids of the western flank of the massif (Figure 3, s412). The concordant age of the subalkaline granite here was 129.60 ± 0.64 Ma (MSWD = 0.034, probability = 0.85).
We collected a sample from similar subalkaline granites on the eastern flank of the massif (Figure 3, d2010-1). The concordant age of the subalkaline granite here was 129.52 ± 0.89 Ma (Figure 5c,d; Table 1 and Table 2).
The age of these formations corresponds to the age of rocks formed in supra-subduction conditions (Figure 2). During this time period, the formation of rocks of differentiated calc–alkaline igneous complexes took place, which in their material characteristics are comparable to igneous formations of active continental margin zones [17]. Analysis of the geochemical characteristics of the granitoids of the Uskalin massif showed that its main components are syenites, granosyenites and subalkaline granites of the adakite series. They form the central part of the massif. A distinctive mineralogical feature of these rocks is the presence of blue-green amphibole in the composition, which is absent in the granitoids of the calk–alkaline series. The age of these subalkaline granites was determined by the K-Ar method for three rock-forming minerals (amphibole, biotite, and potassium feldspar) from one sample. It was 145 ± 5 Ma [25]. The age of these formations corresponds to the age of rocks formed under the conditions of the initial stage of subduction (Figure 2)—adakites. This is the time period when the eastern flank of the Mongol–Okhotsk basin, having experienced uplift, began to subduct, in this case, under the formations of the northern framing of the North China Craton [17,18].

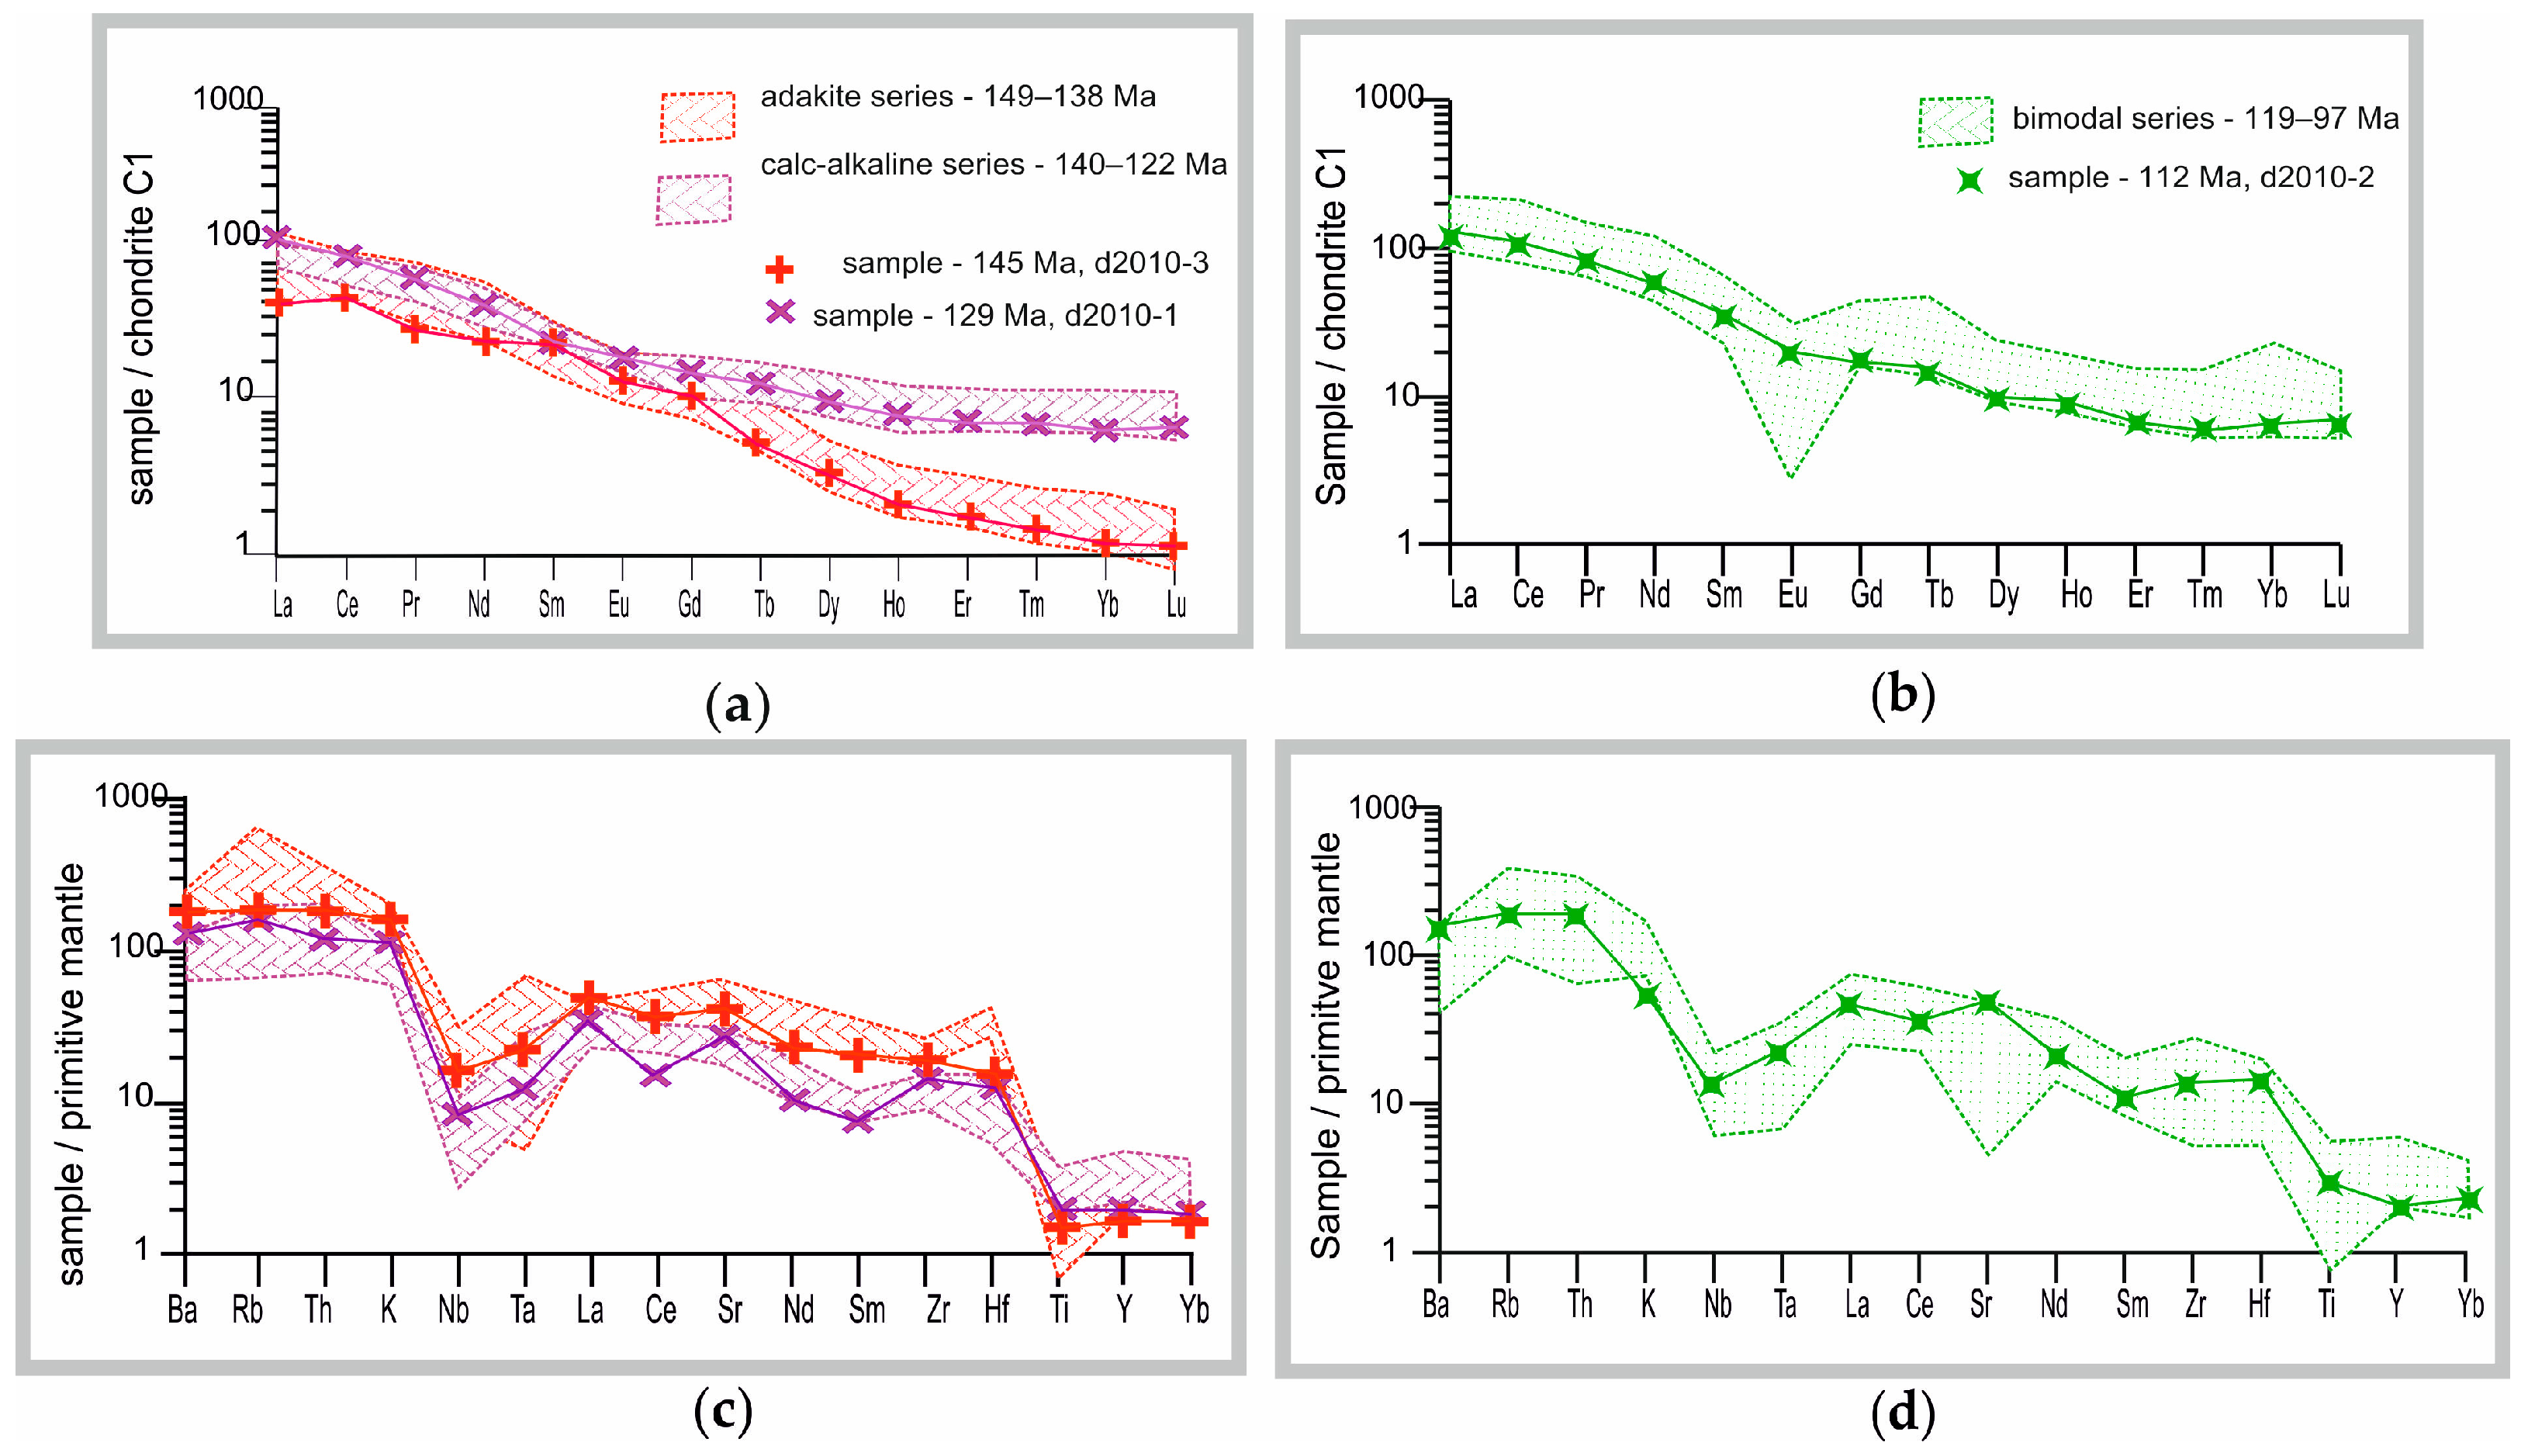
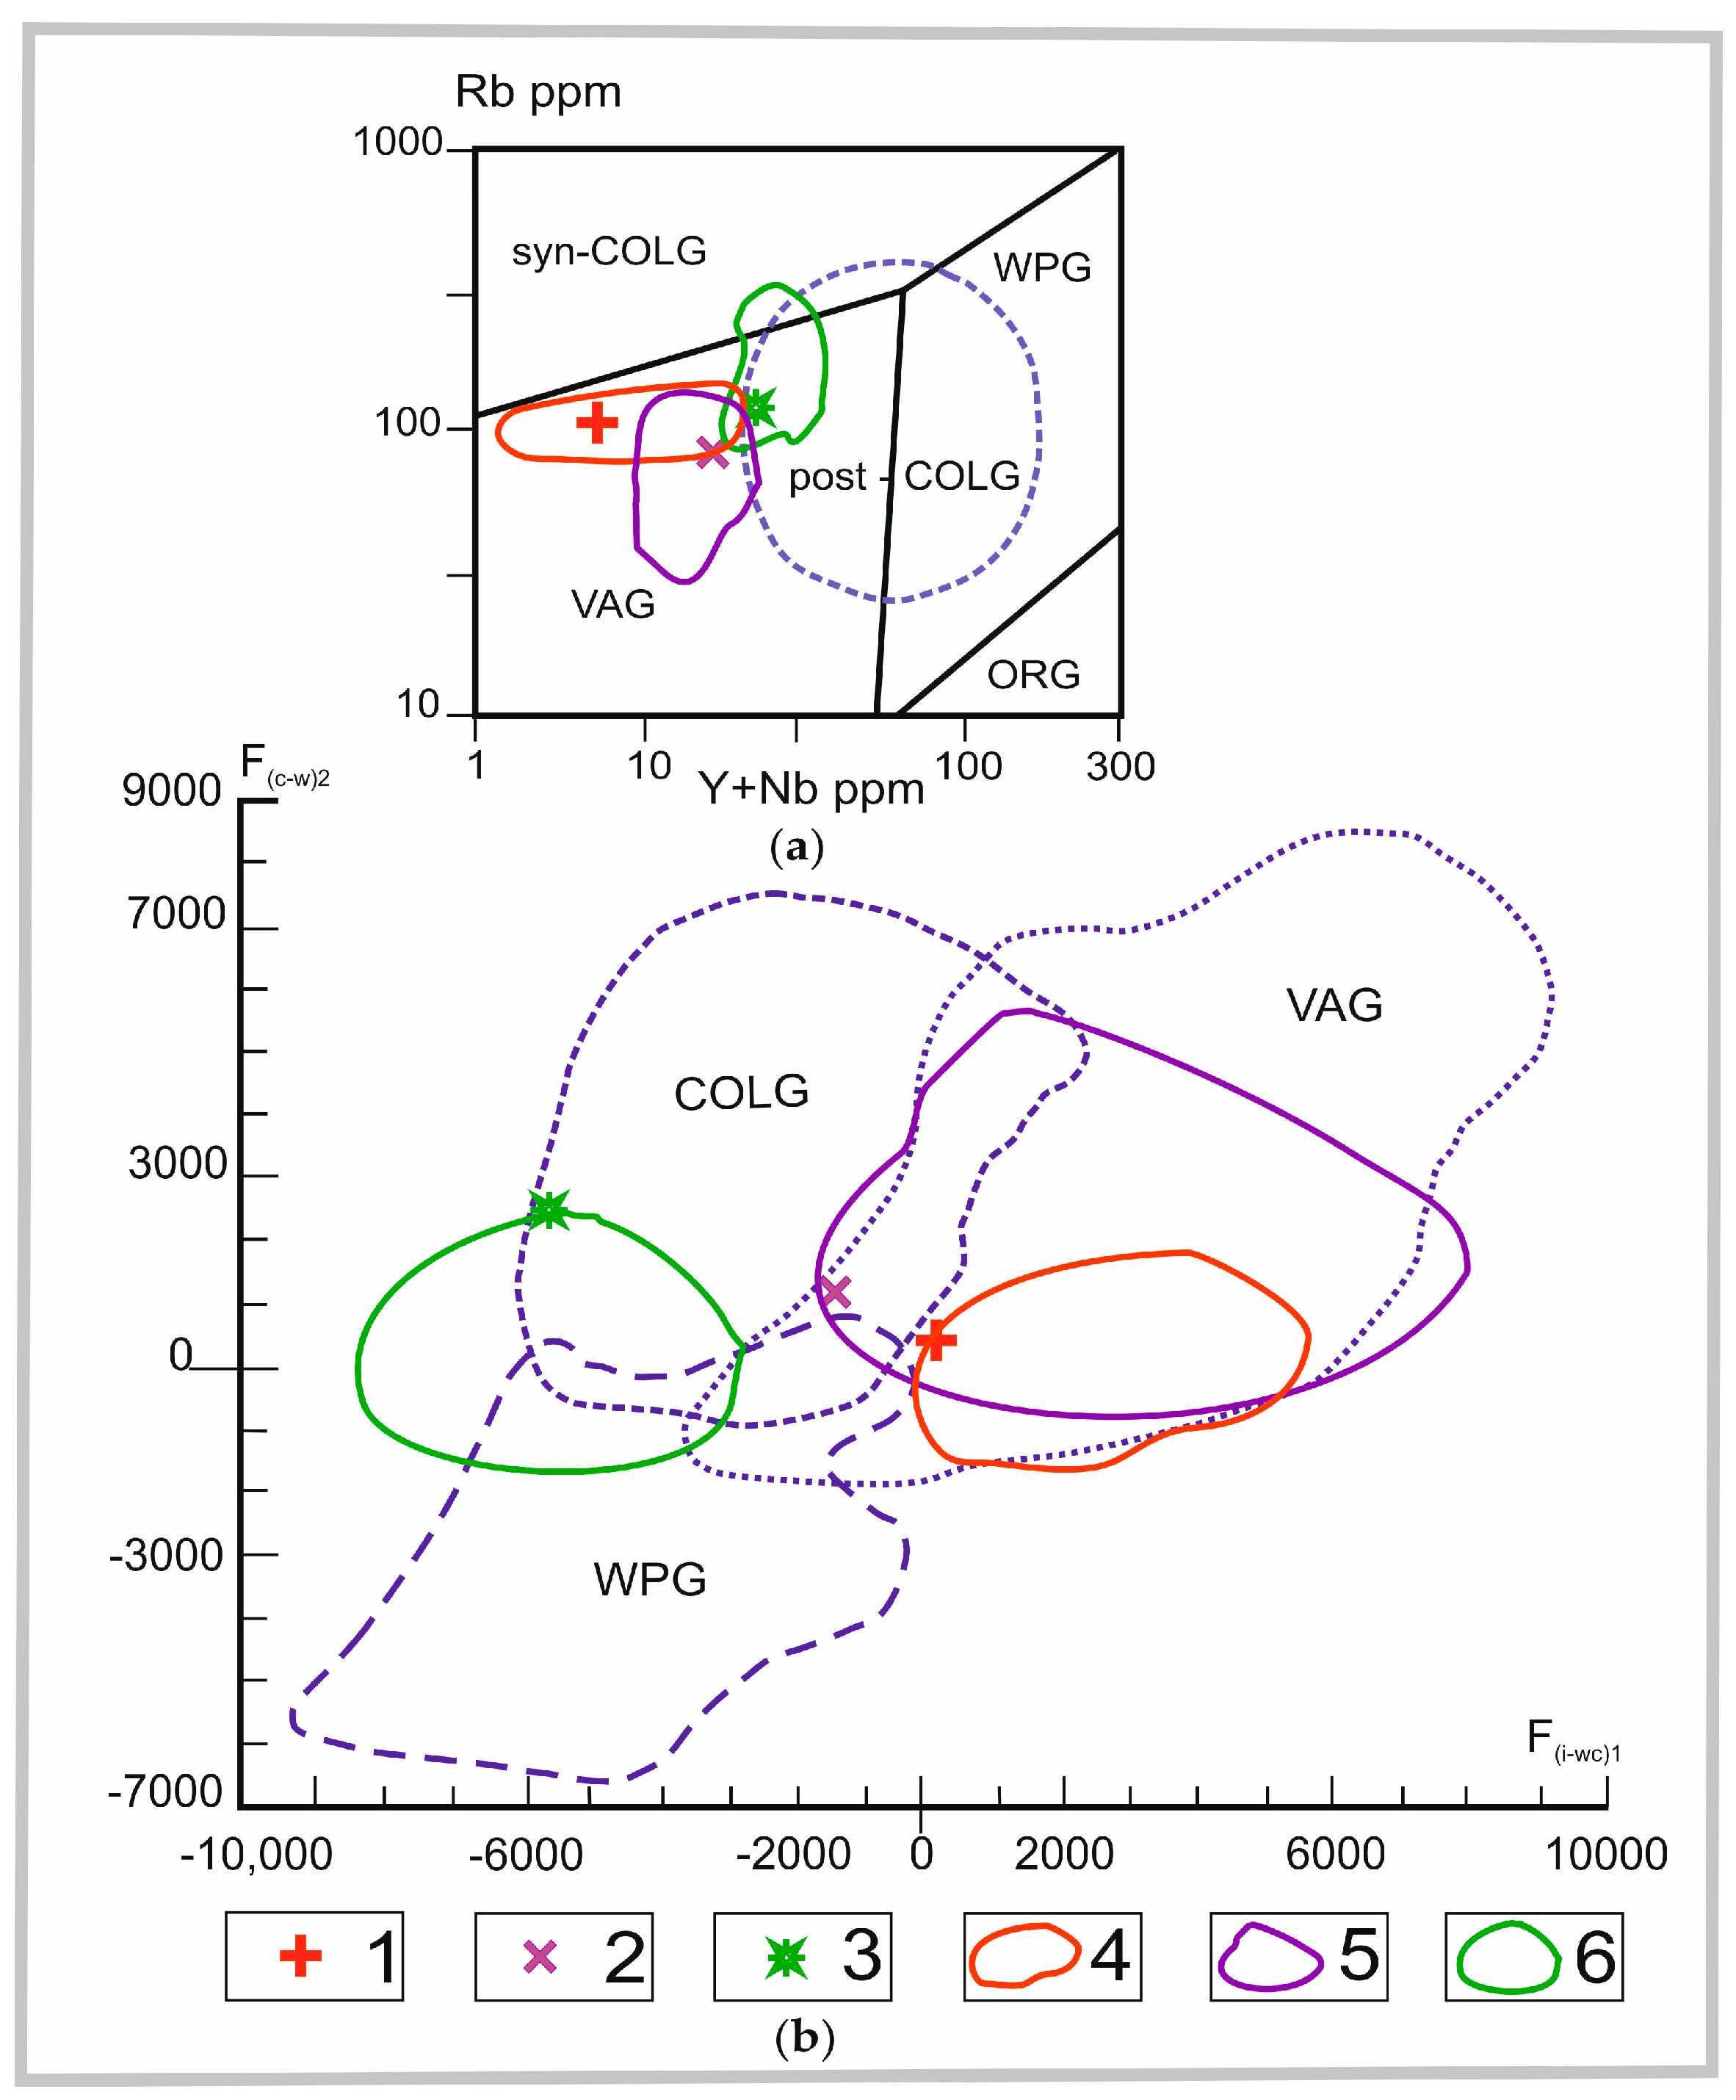
3.3. Geochemical Characteristics of Granitoids of the Uskalin Massif

The description of the geochemical characteristics of rocks of igneous complexes of the Late Mesozoic in the framing of the EF MOOB has already been given in the literature [9,17,18,19]. The authors have shown that the main criterion for belonging of granitoids to any complex, in addition to age, are geochemical characteristics. Geochemical characteristics of rocks of the Uskalin massif were studied using data [21,22] and the author’s data. In this work, a comparison of the geochemical characteristics of the formations of the Uskalin massif with such characteristics of the Late Cretaceous granitoids of this territory is carried out.
It is known that igneous formations of the adakite series of the southern framing of the EF MOOB belong to the normal or subalkaline series. These are high-K products (Na2O + K2O = 7.86–10.92 wt.%) with the Na2O/K2O ratio of 1.25–1.81, magnesian, with the aluminum saturation index = 1.06–0.86, and belong to the I-type formations. Comparable characteristics have been established for the granitoids of the Uskalin massif, where Na2O + K2O = 7.96–9.54, and the Na2O/K2O ratio = 1.08–1.60. The peculiarities of the geochemical composition of these rocks (the characteristics of the Uskalin massif rocks are given in double brackets) include increased concentrations of Sr (670–1110 (762) ppm), Ba (510–1290 (1000) ppm); partially elevated Rb (82–160 (104) ppm), Th (8.4–13.1 (10) ppm) with reduced contents of Nb (4.0–11.0 (5.7) ppm), Ta (0.4–0.6 (0.56) ppm) and with abnormally low concentrations of HREE (in ppm): Tb (0.18–0.22 (0.19)), Dy (0.66–1.45 (0.85)), Ho (0.10–0.22 (0.12)), Er (0.25–0.55 (0.27)), Tm (0.03–0.07 (0.036)), Lu (0.02–0.05 (0.03)), as well as Y (3–7 (2.17)) and Yb (0.17–0.42 (0.20)). These characteristics of the material composition are illustrated in (Figure 6a), where they are clearly distinguished from the rocks of the differentiated calk–alkaline complex by their HREE content.
These granitoids are also characterized by high Sr/Y and (La/Yb)n ratios, which is confirmed by the location of these values on the classification diagrams (Figure 7).

4. Discussion

The main subduction stage lasted for almost 20 Ma (Figure 2). It was accompanied by the formation of a differentiated calk–alkaline complex [19]. This complex is represented by plutonic (140–128 Ma), hypabyssal (130–124 Ma), and volcanic (128–122 Ma) formations. Granitoids of the Uskalin massif with an age of 129 Ma correspond to the transitional stage between the formation of plutonic and hypabyssal formations, which are partially combined in time. This is reflected in the composition of the granites of the studied massif: a relatively high Sr content and low Y content are preserved (Figure 7). Subalkaline granites of the massif belong to the high-K calk–alkaline series with a total alkali content of 7.76 wt.% and the ratio Na2O/K2O = 1.1 (in the rocks of the differentiated calk–alkaline complex, it is 0.9–2.2), and are moderately magnesian. The content of Al2O3 = 15.3 wt.%, which fits into the range of Al2O3 concentrations (15.1–16.1 wt.%) in hypabyssal formations. On the chondrite-normalized graph (Figure 6a), the curve of the Uskalin massif granites is located in the lower part of the field for the rocks of the differentiated complex. Furthermore, according to the ratio with the generalized graph of the recalculation of the compositions of the rocks of the differentiated complex to the primitive mantle (Figure 6b), the curve is close to, and for some elements, coincides with, such characteristics of adakites. The predominance of LREE over HREE is clearly expressed ((La/Yb)n = 17.4), but these values are closer to the plutonic granitoids of the differentiated complex ((La/Yb)n = 10.4–19.2). Granitoids of the Uskalin massif are significantly depleted in Nb, Ta, Ti, Y, and Yb and enriched in Ba, Rb, Th, and K (Figure 6b), which is typical for all formations of the differentiated calk–alkaline series. The subduction stage ended at 122 Ma. Then, almost immediately (119 Ma), bimodal complexes began to form in the framing of the EF MOOB, which accompanied the collision process (Figure 2). The age of quartz diorite porphyrites is 112 Ma. This is comparable with the age of the stage of collisional events in the region under consideration, which existed in the region for almost 20 Ma.
The bimodal volcano plutonic complex in the southern frame is determined by two ranges of SiO2 content, namely 47–64 and 72–78 wt.% [9]. Within the Uskalin massif, they are represented by rocks an with SiO2 content = 61.55–61.69 wt.%, i.e., quartz diorite porphyrites with an age of 112 Ma. These are moderately low-Mg, low-Ti (0.57 wt.%) formations with an Al2O3 content = 14.77 wt.%. They belong to the low-K calk–alkaline series with a total alkali content of 5.96 wt.% and a Na2O/K2O ratio of 3.08. It was found that the rocks of the complex under consideration are enriched in light rare earth elements ((La/Yb)n = 5.5–33.0 (the values of 10–20 prevail)). In the diorite porphyrites of the massif ((La/Yb)n = 20.3), the Eu minimum is almost not expressed (Figure 6a), which corresponds to all formations of the complex of average composition (Eu/Eu * = 0.70–0.86). Multielement spectra are characterized by stable positive anomalies of Ba, Rb, and Th and negative anomalies of Nb, Ta, and Ti. The behavior of Y in these rocks is noteworthy. According to [17], the Y content in the supra-subduction granitoids of this region ranges from 2 to 15 ppm. The Y content in diorite porphyrites is 9.1 ppm, which is comparable to the concentration of this element in supra-subduction formations. Its content is close to such values in supra-subduction formations. Most likely, the period of formation of the first mode corresponds to the transition of subduction settings to collisional ones, which at the end of the Early Cretaceous (119–97 Ma) produced active orogenesis of the EF MOOB. This is confirmed by classical diagrams of tectonic settings (Figure 8a,b). In them, the figurative points of the diorite porphyrites of the Uskalin massif fall into the field of post- or collisional formation conditions. The rocks of the adakitic and calk–alkaline series are located in the field of island arcs or supra-subduction rocks.
Our studies have shown that the formation of the Uskalin massif involved igneous complexes of all geodynamic stages of the late Mesozoic, accompanying the evolution of the EF MOOB, starting with the adakitic series, followed by differentiated calk–alkaline, and bimodal stages. The bimodal complex is represented by rocks of similar composition. At the same time, it has been proven [17] that the rocks of the adakitic series were formed at a depth of 33–50 km and at a pressure of no more than 13 kbar in a subduction setting at a temperature of up to 1300 °C. The melting of the oceanic crust occurred during subduction at an orthogonal angle during its interaction with the mantle and continental crust. The heat sources, respectively, were the hot asthenosphere and mechanical characteristics during the subduction of formations of the Mongol–Okhotsk basin. Thus, the steep subsidence of the oceanic plate under the northern rim of the North China Craton probably contributed to the concentration of magmatic sources, which replaced each other in time in accordance with the change in the geodynamic situation, but their areal distribution remained practically unchanged (Figure 9).
Subduction processes in the region were caused by the convergence of the Siberian and North Chinese cratons. They were accompanied by magmatic activity for almost 30 Ma (Figure 2). The subduction scenario changed to the scenario of collisional compression around 120 Ma (119 Ma). It is possible that this stage began with the breakaway of the subducting plate (Figure 9c). Considering the proximity of the ages of the described magmatic complexes, it can be assumed that the intrusion of the rocks of the bimodal complex occurred in the continental crust heated by subduction processes. This could have caused partial mixing and inheritance of the characteristics of subduction rocks during the formation of the bimodal complex. This is observed in the diorite porphyrites of the bimodal complex of the Uskalin massif. They have elevated Sr/Y values (Figure 7a). The high content of magmatic water formed during subduction contributed to the formation of fluid-rich melts. Upon entering the magmatic chamber, they enriched the magmatic material. Fluid enrichment probably occurred unevenly. This is reflected in the distribution of rocks with the “adakite signature” and, accordingly, in the distribution of minerals. A direct relationship is actually established between them. Intrusive bodies are widespread within the territory under consideration, in the structure of which magmatic complexes of different ages are mapped. Gold ore objects have been established mainly where magmatic formations with “adakite signatures” are combined. An example of this is the Burinda massif, located to the east of the Uskalin massif (Figure 1c). According to the results of Ar–Ar isotope dating of granitoids of this massif, its composition is represented by rocks with the following ages: 142 Ma, 127–122 Ma, and 117 Ma (Rb-Sr method) (summary in [22]). Rocks of the bimodal complex (117 Ma) are characterized by increased values of Sr/Y. An industrial gold deposit has been discovered within the Burinda massif [34].
The Pokrovka industrial gold deposit, as discussed in the literature, is localized in the Late Cretaceous rocks of the Sergeev massif. The massif is composed of granitoids of the adakite series (30%) with an age of 139 Ma [34] and rocks of a differentiated complex with an age of 129 Ma [35], which are penetrated by dikes and small bodies of a bimodal complex with an age of 117 [34], 119, and 116 Ma [35].
Directly at the deposit, the formations of the bimodal complex are characterized by Sr/Y ratios of 30–125 with a Y content of 2 to 15 ppm. In quartz diorite porphyrites, similar in composition to the rocks of the Uskalin massif, Sr/Y = 64 with Y = 11 ppm (unpublished data of the author). It should be emphasized that in the rocks of the bimodal complex, mapped outside the gold ore occurrences, the Sr/Y and (La/Yb)n ratios are significantly lower (Figure 7a,b).
The inheritance of “adakite signatures” by rocks can serve as one of the search criteria for gold prospecting in the region. However, it should be noted that some characteristics of adakites are not reflected in these formations, such as HREE depletion. If in the adakites of the Uskalin massif the sum of HREE = 3.82 ppm, then in the rocks of the differentiated complex, HREE = 14.04 ppm, and in the bimodal ones, HREE = 14.67 ppm.
The watercourses of the Amur Region are characterized by general contamination with placer gold. As a rule, their concentration is noted in the area of the described objects. The identified geochemical anomalies of gold are localized in the fields of development of terrigenous formations intruded by bodies and dikes of rocks of igneous complexes of supra-subduction origin, which, in turn, are intruded by rocks of the collisional stage of the territory’s development (Figure 1c). Such a sequence of magmatic events corresponds to the process of magmatic telescoping (Figure 9).
The role of magmatic telescoping in the formation of mineral deposits was noted in the last century. According to the definition of A.E. Fersman [36], “Telescoping is the convergence of geological phases, which is characteristic of surface processes associated with the rapid cooling of melts and solutions. It is especially characteristic of the Pacific regions”. Initially, these processes explained the formation of ore deposits. In modern concepts, the telescoping of ore formations is a product of magmatic telescoping. The modern literature describes deposits of various minerals that are the result of this process [37,38,39,40,41,42]. It has been established that magmatic melts rising to the earth’s surface contribute to the transfer of minerals to the upper horizons of the Earth’s crust. Here, slow cooling of magma and its differentiation into various silicate rocks occurs. Heavy metals present in magma (usually in very low concentrations) are transported by volatile components (fluids) to the upper horizons of the magma chamber as it crystallizes or penetrates through tectonically weakened zones into the roof above the magma chamber. Here, they are deposited, forming ore occurrences. Such deposits are characterized by the stability of the spatial position of mantle sources and the temporal sequence of magmatic activity.
The Uskalin massif was formed at shallow depths, in the upper parts of the earth’s crust, where magmatic material produced predominantly acidic rocks. It should be assumed that gold, a heavy element whose content in magma is very low, moved with hydrothermal solutions both into the rocks enclosing the massif and into its roof. And the superposition of some magmatic processes on others in spatial and temporal representation contributed to the redistribution and concentration of gold.
The results of studying the rocks that make up the Uskalin massif and the terrigenous formations that contain it, and analyzing data on the gold content in these rocks, allowed researchers in the region to predict the allocation of the Uskalin industrial ore field [22].
The fact that the formation of gold ore objects is associated with the subduction stage of evolution has been mentioned since the middle of the twentieth century. A.H.G. Mitchell and M.S. Garson [43,44] described the concentration of gold-bearing ores in the upper parts of volcanic strata sections in subduction zones on the continental margin. They identified the “Chilean type”, i.e., subduction. Currently, other works [45] confirm the connection of gold ore mineralization with subduction scenarios for the evolution of the east coast of China. In the work [46], it was shown that hydrothermal activity, productive for gold, is mainly associated with calk–alkaline magmatism, i.e., with rocks of supra-subduction magmatism. The works of E.B. Yeap [47] studied and described gold ore deposits in the subduction zones of Peninsular Malaysia. Similar gold ore objects were established in the Tethys Himalayan belt. The authors [48] believe that gold is associated with subduction processes, which were replaced by collisional ones. The same opinion is shared by [49].
A similar situation is observed in the evolution of ore formation within the Uskalin massif. Hydrothermal activity productive for gold is associated mainly with supra-subduction magmatism. It has been established that the gold content in granitoids of the adakite series exceeds the Clarke value by 2.25 times, as summarized in [25]. Furthermore, its redistribution and concentration occurred during the intrusion of rocks of a later bimodal complex in a collisional setting. Such a scenario has been repeatedly described for various deposits around the world [37,38,48,49].
The results of studying the rocks of the Uskalin massif, the terrigenous formations that contain it, and the analysis of data on the gold content in these rocks, allowed researchers in the region to predict the Uskalin industrial gold ore field [22].
Analysis of the geological situation of the southern framing of the EF MOOB showed that areas where gold mineralization is widely manifested are characterized by the presence of telescoped magmatism. At the same time, increased productivity for gold is associated with rocks that are marked by “adakite signatures”. This fact can be considered one of the signs for the discovery of epithermal gold ore objects.

5. Conclusions

  • The structure of the Uskalin massif includes rocks that accompany all geodynamic stages of the evolution of the EF MOOB, namely the initial stage of subduction, the main stage of subduction, and the collisional stage. The massif is a product of telescoped magmatic events that occurred in the framing of the EF MOOB in the Late Mesozoic.
  • Analysis of the distribution of geochemical gold fields within the EF MOOB framework indicates an increased concentration of this element within the areas of telescoping of the rocks of complexes formed in supra-subduction and collisional settings.
  • The intrusion of rocks of the bimodal complex at the end of the Early Cretaceous (119–97 Ma) in a collisional setting contributed to the redistribution of metals that were present in a dispersed or diffuse state in supra-subduction formations. This contributed to their further increased concentration.
  • Such a sequence is noted within those objects where the rocks of the bimodal complex are marked by the “adakite signature”. This fact can be considered one of the search criteria for the discovery of epithermal gold ore objects.

Funding

The study was carried out in accordance with the research plan of the Institute of Geology and Nature Management of the Far Eastern Branch of the Russian Academy of Sciences and with partial financial support from the Russian Foundation for Basic Research (grant No. 13-05-12043-ofi-m). The main part of the study was carried out without attracting external funding.

Data Availability Statement

The original contributions presented in this study are included in the article. Further inquiries can be directed to the corresponding author.

Acknowledgments

The author expresses gratitude to the staff of the Center for Collective Use “Geospectrum” of the Geological Institute of the Siberian Branch of the Russian Academy of Sciences under the leadership of V.B. Khubanov (Ulan-Ude, Russia) for conducting analytical studies and to the geologists of Amurgeologiya LLC for assistance in conducting field work. The author also thanks the reviewers for their insightful comments, which undoubtedly improved the understanding of the article.

Conflicts of Interest

The authors declare no conflicts of interest.

References

  1. Bouysse, P. Geological Map of the World, Scale 1:50,000,000. 2009. Available online: http://www.ccgm.org (accessed on 16 April 2025).
  2. Sokolov, S.V. Structures of Anomalous Geochemical Fields and Mineralization Forecast; Nauka: St. Petersburg, Russia, 1998; p. 131. [Google Scholar]
  3. Derbeko, I.M.; Vyunov, D.L. Distribution of gold and silver mineralization in the territory of the Amur region (Russia) according to geochemical prospecting data and its role in geodynamic reconstructions. In Book Gold of Siberia and the Far East; Buryat Scientific Center SB RAS: Ulan-Ude, Russia, 2004; pp. 69–71. [Google Scholar]
  4. Derbeko, I.M.; Vyunov, D.L.; Bortnikov, N.S. The role of interaction of plume and plate tectonics mechanisms in the formation of gold-silver mineralization of the Upper Amur region (Russia) in the Late Mesozoic. Geol. Miner. Resour. Sib. 2014, 3, 14–17. [Google Scholar]
  5. Poletika, I.A. General properties of gold deposits. Min. J. 1866, 1–10. (In Russian) [Google Scholar]
  6. Kravchinsky, V.A.; Cogné, J.-P.; Harbert, W.P.; Kuzmin, M.I. Evolution of the Mongol-Okhotsk Ocean as constrained by new palaeomagnetic data from the Mongol-Okhotsk suture zone, Siberia. Geophys. J. Inter. 2002, 148, 34–57. [Google Scholar] [CrossRef]
  7. Xiao, W.J.; Kusky, T. Geodynamic processes and metallogenesis of the Central Asian and related orogenic belts: Introduction. Gondwana Res. 2009, 16, 167–169. [Google Scholar] [CrossRef]
  8. Metelkin, D.V.; Vernikovsky, V.A.; Kazansky, A.Y.; Wingate, M.T.D. Late Mesozoic tectonics of Central Asia based on paleomagnetic evidence. Gondwana Res. 2010, 18, 400–419. [Google Scholar] [CrossRef]
  9. Derbeko, I.M. Bimodal volcano-plutonic complexes in the frames of Eastern member of Mongol-Okhotsk orogenic belt, as a proof of the time of final closure of Mongol-Okhotsk basin. In Book Up-Dates in Volcanology—A Comprehensive Approach to Volcanological Problems, Francesco Stoppa; InTech: Rijeka, Croatia, 2012; Chapter 5; pp. 99–124. [Google Scholar]
  10. Shevchenko, B.F.; Popeko, L.I.; Didenko, A.N. Tectonics and evolution of the lithosphere of the eastern fragment of the MongolOkhotsk orogenic belt. Geodyn. End Tectonoph. 2014, 5, 667–682. [Google Scholar] [CrossRef]
  11. Van der Voo, R.; van Hinsbergen, D.J.J.; Domeier, M.; Spakman, W.; Torsvik, T.H. Latest Jurassic–earliest Cretaceous closure of the Mongol-Okhotsk Ocean: A paleomagnetic and seismological-tomographic analysis. Geol. Soc. Am. Spec. Pap. 2015, 513, 589–606. [Google Scholar] [CrossRef]
  12. Ren, Q.; Wu, H.; Zhao, H. Further paleomagnetic results from the ~155 Ma Tiaojishan Formation, Yanshan Belt, North China, and their implications for the tectonic evolution of the Mongol-Okhotsk suture. Gondwana Res. 2016, 35, 180–191. [Google Scholar] [CrossRef]
  13. Ren, Q.; Zhang, S.; Wu, Y.; Yang, T.; Gao, Y.; Turbold, S.; Zhao, H.; Wu, H.; Li, H.; Fu, H.; et al. New late Jurassic to early Cretaceous paleomagnetic results from North China and southern Mongolia and their implications for the evolution of the Mongol-Okhotsk suture. J. Geophys. Res. Solid Earth 2018, 123, 10370–10398. [Google Scholar] [CrossRef]
  14. Derbeko, I.; Kichanova, V. Post-Mesozoic Evolution of the Eastern Flank of the Mongol–Okhotsk Orogenic Belt. In Advances in Geophysics, Tectonics and Petroleum Geosciences; CAJG 2019; Springer: Cham, Switzerland, 2021; Volume 4, pp. 577–581. [Google Scholar] [CrossRef]
  15. Melnikov, V.D.; Melnikov, A.V.; Kovtanyuk, G.P. Gold Placers of the Amur Region; Dementienko, A.I., Ed.; Pabl. Hause Amur State Univer: Blagoveshchensk, Russia, 2006; p. 295. [Google Scholar]
  16. Vetluzhskikh, V.G. Regularities of Placement, Conditions of Formation and Prospects for Discovery of Gold Placers in the South of the Aldan Shield and in the Stanovoy Folded Region. Ph.D. Thesis, Far Eastern Scientific Center of the USSR Academy of Sciences, Vladivostok, Russia, 1972. [Google Scholar]
  17. Derbeko, I.M.; Chugaev, A.V. Late Mesozoic adakite granites of the southern frame of the eastern flank of the Mongol-Okhotsk orogenic belt: Material composition and geodynamic conditions of formation. Geodyn. End Tectonoph. 2020, 11, 474–490. [Google Scholar] [CrossRef]
  18. Derbeko, I.M. Late Mesozoic Granitoid Magmatism in the Evolution of the Eastern Flank of the Mongol-Okhotsk Orogenic Belt (Russia). Minerals 2022, 12, 1374. [Google Scholar] [CrossRef]
  19. Derbeko, I.M.; Vyunov, D.L.; Kozyrev, S.K.; Ponomarchuk, V.A. Conditions for the formation of a bimodal volcano-plutonic complex, within the southern margin on the eastern flank of the Mongol-Okhotsk orogenic belt. In Large Igneous Provinces of Asia, Mantle Plumes and Metallogeny; Siberian Research Institute of Geology, Geophysics and Mineral Resources: Novosibirsk, Russia, 2009; pp. 73–75. [Google Scholar]
  20. Zhang, K.-J.; Yan, L.-L.; Ji, C. Switch of NE Asia from extension to contraction at the mid-Cretaceous: A tale of the Okhotsk oceanic plateau from initiation by the Perm Anomaly to extrusion in the Mongol–Okhotsk ocean? Earth-Sci. Rev. 2019, 198, 102941. [Google Scholar] [CrossRef]
  21. Stricha, V.E. U-PB isotope age (shrimp-ii) of granitoids of a magdagachinsky complex of the Umlekano-Ogodzhinsky vulkano-plutonic zone. Bull. Amur State Univer. Russ. 2016, 75, 73–74. [Google Scholar]
  22. Kozyrev, S.K.; Volkova, Y.R.; Ignatenko, N.N. State Map of the Russian Federation-Scale 1:200,000; Chepygin, V.E., Ed.; Series Zeya; Sheet N-51-XXIII; Explanatory Note; Moscow Branch of FSBI “VSEGEI”: Moscow, Russia, 2016. [Google Scholar]
  23. Khubanov, V.B.; Buyantuev, M.D.; Tsygankov, A.A. U-Pb isotope dating of zircons from PZ-MZ igneous complexes of Transbaikalia by magnetic sector mass spectrometry with laser sampling: Procedure for determination and comparison with SHRIMP data. Geol. Geoph. 2016, 57, 241–258. [Google Scholar]
  24. Griffin, W.L.; Powell, W.J.; Pearson, N.J.; O’Reilly, S.Y. GLITTER: Data reduction software for laser ablation ICP-MS. In Laser ablation ICP-MS in the Earth Sciences: Current Practices and Outstanding Issues; Mineralogical Association of Canada short course series; Sylvester, P.J., Ed.; Mineralogical Association of Canada: Quebec, QC, Canada, 2008; Volume 40, pp. 204–207. [Google Scholar]
  25. Ludwig, K.R. Isoplot 3.6: Berkeley Geochronology Center. Spec. Publ. 2008, 4, 77. [Google Scholar]
  26. Sun, S.-S.; McDonough, W.F. Chemical and isotopic systematics of oceanic basalts: Implications for mantle composition and processes. Geol. Soc. Spec. Public. Lond. Engl. 1989, 42, 313–345. [Google Scholar] [CrossRef]
  27. Defant, M.J.; Drummond, M.S. Derivations of some modern are magmas by melting of young subducted lithosphere. Nature 1990, 347, 662–665. [Google Scholar] [CrossRef]
  28. Ma, Q.; Zheng, J.P.; Xu, Y.G.; Griffin, W.L.; Zhang, R.S. Are continental “adakites” derived from thickened or foundered lower crust? Earth. Planet. Sci. Lett. 2015, 419, 125–133. [Google Scholar] [CrossRef]
  29. Martin, H. The mechanisms of petrogenesis of the Archaean continental crust—Comparison with modern processes. Lithos 1993, 46, 373–388. [Google Scholar] [CrossRef]
  30. Martin, H. Adakitic magmas: Modern analogues of Archaean granitoids. Lithos 1999, 46, 411–429. [Google Scholar] [CrossRef]
  31. Barbarian, B. Granitoids: Main petrogenetic classifications in relation to origin and tectonic setting. Geol. J. 1990, 25, 227–238. [Google Scholar] [CrossRef]
  32. Pearce, J. Sources and settings of granitic rocks. Episodes 1996, 24, 956–983. [Google Scholar] [CrossRef]
  33. Velicoslavinsky, S.D. Geochemical typification of acid magmatic rocks of leading geodynamical situations. Petrology 2003, 26, 363–380. [Google Scholar]
  34. Eirish, I.V. Metallogeny of Golg of Priamurye (Amur Region, Russia); Stepanov, V.A., Ed.; Dalnauka: Vladiostok, Russia, 2002; pp. 97–121. [Google Scholar]
  35. Sorokin, A.A.; Kadashnikova, A.Y.; Ponomarchuk, A.V.; Travin, A.V.; Ponomarchuk, V.A. Age and genesis of the Pokrovskoye gold-silver deposit (Russian Far East). Geol. Geoph. 2021, 62, 165–176. [Google Scholar]
  36. Fersman, A.E. Izbrannye—Trudy; Publ. House of the USSR Academy of Sciences: Moscow, Russia, 1959; Volume 5, p. 858. [Google Scholar]
  37. Shpount, B.R. Tectonic settings of magmatism occurrence in the east of the Siberian platform in the Neogene. Geotectonics 1992, 3, 45–63. [Google Scholar]
  38. Arevalo, A.; Charles, R.S.; Skewes, M.A.; Zuhiga, P.H.; Floody, R. The El Teniente Megabreccia Deposit, the World’s Largest Cop-Per Deposit; Super popularly Copper and Gold Deposits. A Global Perspectives; PGS Publishing: Burnside, Australia, 2005; Volume 1, pp. 83–113. [Google Scholar]
  39. Vila`a, M.; Pin, T.C.; Enriquec, P.; Liesac, M. Telescoping of three distinct magmatic suites in an orogenic setting: Generation of Hercynian igneous rocks of the Albera Massif (Eastern Pyrenees). Lithos 2005, 83, 97–127. [Google Scholar] [CrossRef]
  40. Charles, R.; Stern, M.; Skewes, A.; Arévalo, A. Magmatic Evolution of the Giant El Teniente Cu–Mo Deposit, Central Chile Get ac-cess Arrow. J. Petrol. 2011, 52, 1591–1617. [Google Scholar] [CrossRef]
  41. Vezzoni, S.; Dini, A.; Rocchi, S. Reverse telescoping in a distal skarn system (Campiglia Marittima, Italy). Ore Geol. Rev. 2016, 77, 176–193. [Google Scholar] [CrossRef]
  42. Scaillet, B. The role of gas flushing on magma reservoir crystallization and its consequences for the growth of planetary crust. Lithos 2022, 428–429, 106811. [Google Scholar] [CrossRef]
  43. Mitchell, A.H.G.; Garson, M.S. Mineralization of plate boundaries. Minerals. Sci. Engng. 1976, 8, 129–169. [Google Scholar]
  44. Mitchell, A.H.G.; Garson, M.S. Mineral Deposits and Global Tectonic Settings (Academic Press Geology Series); Academic Press Inc.: London, UK, 1981. [Google Scholar]
  45. Browne, P.R.L.; Hedenquist, J.W.; Allis, R.G. Epitherminal Gold Mineralization; Belousov, V.I., Ed.; Geothermal Research Centre: Wellington, New Zealand, 1988; p. 169. [Google Scholar]
  46. Qiu, K.-F.; Deng, J.; Laflamme, C.; Long, Z.-Y.; Wana, R.-Q.; Moynier, F.; Yu, H.-C.; Zhang, J.-Y.; Ding, Z.-J.; Goldfarb, R. Giant Mesozoic gold ores derived from subducted oceanic slab and overlying sediments. Geoch. Cosmoch. Acta 2023, 343, 133–141. [Google Scholar] [CrossRef]
  47. Yeap, E.B. Tin and gold mineralizations in Peninsular Malaysia and their relationships to the tectonic development. J. Southeast. Asian Earth Scienc. 1993, 8, 329–348. [Google Scholar] [CrossRef]
  48. Zheng, W.; Liu, B.; McKinley, J.M.; Cooper, M.R.; Wang, L. Geology and geochemistry-based metallogenic exploration model for the eastern Tethys Himalayan metallogenic belt, Tibet. J. Geoch. Explor. 2021, 224, 106743. [Google Scholar] [CrossRef]
  49. Zheng, Y.; Mao, J.; Chen, Y.; Sun, W.N.P.; Yang, X. Hydrothermal ore deposits in collisional orogens. Sci. Bull. 2019, 64, 205–212. Available online: https://www.elsevier.com/locate//scib (accessed on 16 April 2025). [CrossRef] [PubMed]
Figure 1. Scheme of the spatial position of the EF MOOB and magmatic complexes in its frame. (a) The position of the MOOB among the regional structures of eastern Asia on the Geological 54 map of the world scale 1:50,000,000 [1]. (b) Spatial distribution of igneous complexes in the southern frame of the EF MOOB: combined bodies of Late Cretaceous granitoids (1); Early Cretaceous volcanic fields of differentiated (2) and bimodal (3) complexes; Cenozoic basalts (4); southern boundary of the EF MOOB (5); regional tectonic boundaries (6); position of the Uskaly massif (7). BJS—Bureya-Jiamusi superterrane. (c) Geochemical gold halos based on lithochemical surveys of dispersion flows at a scale of 1:200,000 [2,3,4]. Scale of intensity of geochemical gold fields (in g/t) (1). Tectonic elements based on satellite imagery interpretation (2). Granitoids (3) and volcanic fields (4) of the Late Cretaceous. Regional tectonic boundaries (5). Position of the Uskalin massif (6a) and industrial gold ore deposits (6b): Burinda—B, Pokrovka—P.
Minerals 15 00592 g001
Figure 2. Comparison of paleomagnetic data and the time of formation of igneous complexes within the framework of the EF MOOB. The paleolatitude–time relationship for the reference point 52° N–117° E (MOOB). Average poles averaged within 10-million-year time windows: SC (1)—Siberian craton; MNCC—Mongolian–Chinese Composite Continent. According to [20].
Minerals 15 00592 g002
Figure 3. Scheme of the geological structure of the Uskalin massif according to data from [21,22] (the author). Terrigenous formations of the Middle–Late Jurassic (1); granitoids of the adakite series (2); differentiated calcareous–alkaline (3); bimodal (4); sampling sites (5). Sample numbers: s [21], k [22], d [author’s details] (numerator), age of rock (denominator) (6). Tectonic contacts (7).
Minerals 15 00592 g003
Figure 4. Photomacrographs and photomicrographs (cross-polarized light) for rocks of the Uskalin massif. (a) Granosienite (Sample d2010–3); (b) subalkaline granite (Sample d2010–1); (c) quartz diorite porphyrite (Sample d2010–2). Q—quartz, Pl—plagioclase, Amp—amphibole, Bi—biotite, Kfs—K feldspar, Zrk—zircon, Ap—apatite, Sph—sphienel, Omr—ore mineral.
Minerals 15 00592 g004
Figure 5. Concordia diagrams and weighted average age calculation for a young zircon population from quartz diorite porphyrites (sample d2010-2) (a,b) and subalkaline granites (sample d2010–1) (c,d) of the Uskalin massif.
Minerals 15 00592 g005
Figure 6. Concentrations of the rare elements in the granitoids of the EF MOOB framing standardized to the composition of chondrite (a,b) and primitive mantle (c,d). Compositions of chondrite C1 and primitive mantel are in accordance with the data from [26]. The diagrams were constructed using data from [9,17].
Minerals 15 00592 g006
Figure 7. The position of the Uskalin massif granitoids in comparison with the granitoids of the southern framing of the EF MOOB on the diagrams: (a) Sr/Y—Y ratios [27]. Partial melting curves were calculated for periodic melting of mafic rocks of the lower crust of the North China Craton from [28]; (b) (La/Yb)n—Ybn ratios [27,29,30] with the extracted melting trends of the sources according to [31]: I—quartz eclogites; II—garnet amphibolites; III—amphibolites; IV—garnet-bearing mantle, with a garnet content of 10%; V—garnet-bearing mantle, with a garnet content of 5%; VI—garnet-bearing mantle, with garnet content of 3%; UM—upper mantle; UCC—upper continental crust. Values are normalized to primitive mantle according to [26]. Legend: granosyenites (1), subalkaline granites (2), and quartz diorite porphyrites (3) of the Uskalin massif; granitoids of the adakite series (4), calk–alkaline series (5), bimodal series (6) outside the ore bodies. The diagrams are constructed using data from [9,17].
Minerals 15 00592 g007
Figure 8. Discrimination diagrams for the formation of the tectonic situations: (a) Rb—(Y + Nb) [32]; (b) F(c-w)2/F(i-wc)1 [33]; F(c-w)2 = −752.3 * SiO2—6537.06 * TiO2—25.6 * Al2O3—928.96 * Fe2O3 * + 1928.07 * MgO—464.21 * CaO—1808.19 * Na2O—272.16 * K2O + 8675.33 * P2O5 + 71,073.5; F(i-wc)1 = 2432.42 * SiO2 + 7900.33 * TiO2 + 2512.12 * Al2O3 + 1380.23 * FeOt + 2616.55 * MgO + 3480.51 * CaO + 3045.39 * Na2O + 645.91 * K2O—241,285.5. (*)—the sign denotes the multiplication function]. Abbreviations for granitoids: COLG—collisional, syn-COLG—syncollisional, post-COLG—post-collisional, WPG—within-plate, VAG—volcanic arc, ORG—ocean ridge. Legend: granosyenites (1), subalkaline granites (2), quartz diorite porphyrites (3) of the Uskalin massif; granitoids of the adakite series (4), calk–alkaline series (5), bimodal series (6) outside the ore bodies.
Minerals 15 00592 g008
Figure 9. Scheme of the sequence of late Mesozoic igneous complexes formation in the southern framing of the EF MOOB. Oceanic crust (1); continental crust (2); marine sediments (3); adakite melts, plutonic (4) and volcanic (5); calk–alkaline melts, plutonic (6) and volcanic (7); contrasting magmatic melt (8); direction of movement of oceanic crust (9). Stages of igneous complexes’ formation: (a) 149–138 Ma, the beginning of subduction—intrusion of adakite series rocks; (b) 140–122 Ma, the main stage of subduction—intrusion of calk–alkaline series rocks; (c) 119–97 Ma, collisional stage—intrusion of bimodal complex rocks.
Minerals 15 00592 g009
Table 1. Results of U-Th-Pb (LA-ICP-MS) dating of zircon grains from granitoids of the Uskalin massif. Isotope ratio.

Grains
PbThUTh/U238U/
206Pb

abs
207Pb/
206Pb

abs
Rho2207Pb/
235U

abs
207Pb/
238U

abs
Rho1208Pb/
232Th

abs
in ppm
Sample 2010-2
1234567891011121314151617
04101775300.3057.50.66130.04750.00150.30.11390.00340.01740.00020.10.00490.0001
15153138030.3657.60.66440.04800.00130.30.11480.00310.01740.00020.20.00550.0001
10111685780.2756.10.65980.04820.00160.20.11850.00370.01780.00020.10.00510.0002
12166788430.7456.50.63910.04830.00130.30.11770.00320.01770.00020.10.00550.0001
1481594580.3256.50.76610.04960.00220.20.12100.00510.01770.00020.10.00530.0002
16101785570.2957.70.69920.04970.00160.30.11860.00370.01730.00020.10.00570.0002
09101665390.2856.80.67640.04980.00160.30.12090.00370.01760.00020.10.00520.0002
33133227210.4156.80.74080.04980.00170.20.12080.00410.01760.00020.10.00600.0002
1183194540.6557.00.71510.04990.00180.20.12060.00430.01750.00020.10.00560.0001
1391354550.2756.00.68970.05030.00170.30.12370.00400.01790.00020.10.00510.0002
23111796160.2656.30.69830.05030.00160.30.12300.00380.01780.00020.10.00600.0002
34122986650.4256.60.76780.05050.00200.20.12300.00480.01770.00020.10.00600.0002
296983250.2858.00.80840.05120.00230.20.12140.00520.01720.00020.10.00560.0002
17112166090.3256.50.70220.05180.00180.30.12620.00430.01770.00020.10.00590.0002
2691414970.2656.70.73910.05190.00180.30.12610.00430.01760.00020.10.00590.0002
27101615840.2559.50.77950.05190.00200.20.12000.00450.01680.00020.10.00580.0002
0592105020.3856.50.67030.05250.00160.30.12800.00370.01770.00020.10.00560.0001
18101575280.2756.40.66880.05270.00160.30.12860.00390.01770.00020.10.00650.0002
Sampl 2010-1
1234567891011121314151617
30131094910.2038.90.52910.23540.00650.30.83400.02210.02570.00040.20.06250.0017
3191004460.2150.50.66190.05190.00180.20.14180.00480.01980.00030.20.00660.0002
13171427300.1845.60.62320.12840.00380.30.38810.01090.02190.00030.10.03010.0008
328613430.1646.90.63920.10020.00330.30.29400.00930.02130.00030.20.02110.0007
292729512820.2150.10.62630.04870.00140.20.13420.00390.02000.00030.20.00610.0002
33182608620.2849.80.64420.05280.00170.20.14610.00460.02010.00030.20.00620.0002
197763180.2249.60.61570.05100.00230.20.14160.00630.02020.00030.10.00640.0003
282728812930.2049.10.62780.05620.00170.30.15750.00480.02040.00030.20.00690.0002
252832113130.2248.80.57160.06050.00150.30.17080.00410.02050.00020.20.00910.0002
02162497520.3049.40.53650.04830.00130.30.13480.00360.02030.00020.10.00610.0001
268913630.2348.80.64180.05360.00190.20.15140.00540.02050.00030.10.00690.0003
05141476600.2048.90.54940.05110.00130.30.14400.00350.02050.00020.20.00730.0002
07121385520.2348.60.59030.05470.00170.30.15520.00480.02060.00030.10.00710.0002
242738012230.2847.60.56740.06240.00170.30.18050.00490.02100.00030.20.00870.0002
08162307320.2948.30.53570.04810.00120.30.13740.00340.02070.00020.20.00660.0002
22141376170.2047.70.59240.05240.00170.20.15130.00490.02100.00030.10.00740.0003
Rho2: Error correlation of 207Pb/206Pb and 238U/206Pb ratios. Rho1: Error correlation of 207Pb/235U and. 206Pb/238U Rho2 ratios.
Table 2. Results of U-Th-Pb (LA-ICP-MS) dating of zircon grains from granitoids of the Uskalin massif. Age (Ma).

Grains
207Pb/
206Pb
206Pb/
238U
207Pb/
235U
208Pb/
232Th
D1D2207Pb
Corr
Sample 2010-2
04757211111103993−1−32111.21.3
159865111111031113−1−11110.91.3
10110741141114310230−4114.01.4
12110741141114310230−4114.01.4
14112641131113311120−1113.01.3
1617798113211651084356112.91.6
0917972111111431153362110.61.3
3318572113111631063365112.41.3
1118579113111641204364112.41.5
1319183112111641123370111.91.4
2320776114111841043481113.81.4
3420972113111831214485113.11.4
2922090113211841204494112.71.5
17248981102116511456125109.71.6
26275791131121411847143112.61.4
27280781131121411847149112.21.5
05280851071115411647161106.91.4
18307661131122311338171112.51.3
Sample 2010-1
303089431642616121225322761787125.72.2
33282761272135413356123126.01.7
1320765114023338599151381384126.01.8
321628591362262742314931098127.11.8
291366812821283123406127.51.6
23320721282138412448150127.61.7
19241100129213561295588128.21.6
284596713021494138414253128.61.7
256225213121604182422375128.81.5
0211464129112831223−1−12129.31.4
26354791312143513959170130.11.7
0524456131113731474587130.21.5
074006913121474143412205130.31.6
246895813421694176526415131.61.6
0824,10559132113131343−1−20132.31.5
22304741342143414857127133.01.7
D1: Discordance between 207Pb/235U and 206Pb/238U ages. D2: Discordance between 207Pb/206Pb and 206Pb/238U ages.
Disclaimer/Publisher’s Note: The statements, opinions and data contained in all publications are solely those of the individual author(s) and contributor(s) and not of MDPI and/or the editor(s). MDPI and/or the editor(s) disclaim responsibility for any injury to people or property resulting from any ideas, methods, instructions or products referred to in the content.

