Article

Delineating Geochemical Anomalies Based on the Methods of Principal Component Analysis, Multifractal Model, and Singularity Model: A Case Study of Soil Geochemical Survey in the Hongyahuo Area, Qinghai Province

1
School of Earth Sciences, Guilin University of Technology, Guilin 541004, China
2
Gansu Nonferrous Engineering Exploration & Research Institute, Tianshui 741024, China
3
The First Geological Eeploration Institute of Henan Limited Company, Zhengzhou 450000, China
4
Institute of Mineral Resources, Chinese Academy of Geological Sciences, Beijing 100037, China
*
Authors to whom correspondence should be addressed.
Minerals 2025, 15(6), 585; https://doi.org/10.3390/min15060585
Submission received: 18 April 2025 / Revised: 22 May 2025 / Accepted: 24 May 2025 / Published: 30 May 2025
(This article belongs to the Special Issue Novel Methods and Applications for Mineral Exploration, Volume III)

Abstract

:
To efficiently delineate mineral-induced geochemical anomalies within the Hongyahuo area, principal component analysis (PCA), S-A multifractal modeling, and singularity modeling were employed to examine multi-element datasets derived from 641 soil samples collected from natural gully systems. The isometric log-ratio (ilr) transformation was implemented in conjunction with histogram and quantile-quantile plot analysis to assess and compare the multivariate statistical properties of elemental data across three formats—original, logarithmic, and ilr-transformed. The findings demonstrate the following: (1) following ilr transformation, the issue of data closure was resolved, resulting in elemental distributions more closely approximating normality; (2) PCA revealed two distinguishable elemental associations: PC1 corresponds to the Cu-Fe-Mn-Ni-Pb-Zn group, indicative of a medium- to high-temperature hydrothermal mineralization assemblage associated with Cu-Pb-Zn polymetallic mineralization linked to magmatic intrusion and fracture systems, signifying overprinted copper polymetallic mineralization events; PC2 reflects the Au-As-Sb elemental combination, associated with low-temperature hydrothermal processes indicative of Au-Sb mineralization; (3) the decomposition of the S-A model indicated that low-background and high-anomaly zones for PC1 are primarily situated within andesitic units, where nearby intermediate to felsic intrusions and structural fracture zones have likely served as sources for Cu-polymetallic mineralization; (4) the spatial distribution of the singularity index suggested that anomalous regions characterized by a PC1 singularity index α < 2 were relatively confined, offering strategic implications for mineral exploration targeting; and (5) when integrated with regional metallogenic background, three prospecting targets were identified, leading to the subsequent discovery of two copper ore bodies through anomaly validation. Therefore, this integrative analytical framework is demonstrated to be a robust approach for delineating geochemical anomalies.

1. Introduction

Since the 1970s, China has carried out regional geochemical surveys and has obtained a wide range of multi-element geochemical data, which have provided important data support for mineral resource exploration and environmental evaluation [1,2]. Geochemical techniques have emerged as a pivotal means in mineral exploration, having been extensively utilized for identifying diverse ore deposits and evaluating mineral resources, with their methodologies exhibiting a high degree of maturity [3,4]. Nonetheless, the essence of geochemical exploration resides in the delineation and interpretation of anomalies. Under complex geological conditions, the precise identification of geochemical anomalies characterized by both concentration and compositional zonation, along with the provision of more scientifically grounded interpretations and assessments of such anomalies to support geological prospecting activities, has become the fundamental pursuit within exploration geochemistry and remains a significant area of inquiry in the domain of geological exploration [5,6]. Consequently, the challenge of data processing and the extraction of meaningful information has evolved into a primary research focus [7,8].
Research on geochemical data processing has become a hot spot in the field of applied geochemistry. Although geochemical datasets may superficially appear as simple numerical values, they inherently represent complex and high-dimensional compositional data structures [9]. The closure effect, a defining feature of such data, typically arises from the internal dependency among components, whereby the total of variables within a given dimension is constrained to approximate a fixed sum across the dataset. This constant-sum constraint frequently leads to both scale and constraint effects in statistical interpretation and visualization processes [10,11]. In an effort to mitigate these analytical limitations, foundational contributions were made by Aitchison [12,13] in 1986, who introduced log-ratio transformation techniques—specifically additive log-ratio (alr) and centered log-ratio (clr)-aimed at preserving the inherent structure and correlation characteristics of the data. Subsequently, in 2003, Egozcue et al. [14] developed the isometric log-ratio (ilr) transformation, which unified the three log-ratio approaches within the framework of Euclidean geometry, thereby enhancing the capacity to describe inter-variable correlations. Moreover, an ilr transformation method grounded in partition function theory was later proposed by Pawlowsky-Glahn [15,16], enabling the conversion of compositional data into a multivariate normal distribution and thereby rendering subsequent statistical analysis and visualization more robust and consistent.
Geochemical data frequently manifest properties such as self-similarity, dispersion, and inherent uncertainty [17,18,19]. Analyses of large-scale geochemical data have verified that fractal characteristics are commonly exhibited by most geochemical anomalies [20,21,22]. As conventional statistical methodologies necessitate the assumption that geochemical variables follow either normal or logarithmic distributions, various techniques have been devised to quantify anisotropic behavior within the data [23,24]. A notable advancement in this domain was the introduction of the concentration-area (C-A) fractal model by Cheng et al. [25], which has since been utilized in approaches for simulating geochemical anomalies [26,27]. Building upon this, the spectrum-area (S-A) fractal model was later proposed by Cheng et al. [28], offering a framework for the application of multiple threshold values to distinguish anomalous signals from background variation in the frequency domain. Additionally, local singularity analysis [29] has emerged as a widely adopted technique in geochemical pattern recognition [30,31]. This analytical strategy accounts for both the spatial configuration of elements and their directional variation while also incorporating frequency distribution patterns and spatial self-similarity, thereby enhancing the detection of weak anomalies obscured by complex geochemical backgrounds [32]. Empirical evidence suggests that this model serves as an effective tool for decomposing intricate geochemical anomalies, with delineated zones having led to notable mineral exploration outcomes [33,34,35,36,37].
Qinghai Province is located in the northeastern part of the Qinghai-Tibetan Plateau, with a complex geological structure and rich mineral resources, especially in the Qilian Mountains, East Kunlun, Qaidam Basin, and other metallogenic belts. Hongyahuo exempted area is located in the Qingbei Qilian orogenic belt of the Tolai Mountain area, where the regional tectonic-magmatic activity is strong, rich in mineral resources. Geological exploration in the area has been conducted at a number of copper, iron, zinc, antimony, ferrochrome, alluvial gold, and other ore points. For example, in the northern part of the study area, there are Xiaodongsuo medium-sized iron ore deposits, Yeniugou alluvial gold mines, and in the southern part of the area, there are Guomisi copper-lead-zinc mines and Dashalong chromite mineralization sites, which fully show that the area has a large potential for finding minerals. It is worth noting that few mineralization clues have been found in recent years during the mineral search exploration due to the grassland coverage of the study area, where most geological phenomena cannot be directly observed, and rock sampling is difficult. In order to better identify the elemental combinations related to copper mineralization, this paper mainly combines the research results of the previous researchers, uses the soil geochemical measurements of the ditch system, performs ilr (logarithmic ratio) data transformation on the data, and extracts the elemental combinations of copper polymetallic ores by using the method of combining the principal component and the multifractal model (S-A), circles the comprehensive geochemical anomalies, and performs the engineering validation of anomalies, which indicates the direction of the geological ore searching work to be carried out in the area in the next step.
Therefore, a systematic soil geochemical survey was carried out in the Hongyahuo region of Qinghai Province. Furthermore, an integrated methodology incorporating the S-A model and singularity theory was employed to distinguish background values from anomalies in the Hongyahuo area and delineate target mineralization zones.

2. Geological Setting

2.1. Regional Geological Background

The study area is positioned along the northeastern boundary of the Qinghai-Tibet Plateau, bounded by the Tarim Plate, North China Plate, and Qaidam Plate (Figure 1a,b). From a tectonic perspective, it lies within the Qin-Qi-Kun Late Caledonian orogenic belt, which is structurally segmented into three distinct tectonic zones extending from north to south: North Qilian, Central Qilian, and South Qilian [38,39,40]. The region is characterized by the widespread distribution of magmatic rocks, with significant magmatic events predominantly occurring during the Caledonian period. The endogenic metal deposits in this region are closely associated with intermediate-felsic magmatic activity. It is believed that the intrusion of magmatic rocks provided thermal energy, fluids, and partial metallogenic materials for mineralization [41]. Structurally, the area is mainly influenced by thrust faults trending northwest to southeast. Ore deposits and mineralization sites are distributed throughout these northwest-oriented fault zones (Figure 1a), with denser concentrations observed in proximity to major fault structures and sparser occurrences at greater distances, thereby illustrating the ore-guiding and ore-hosting capacities of the regional fault system [42].

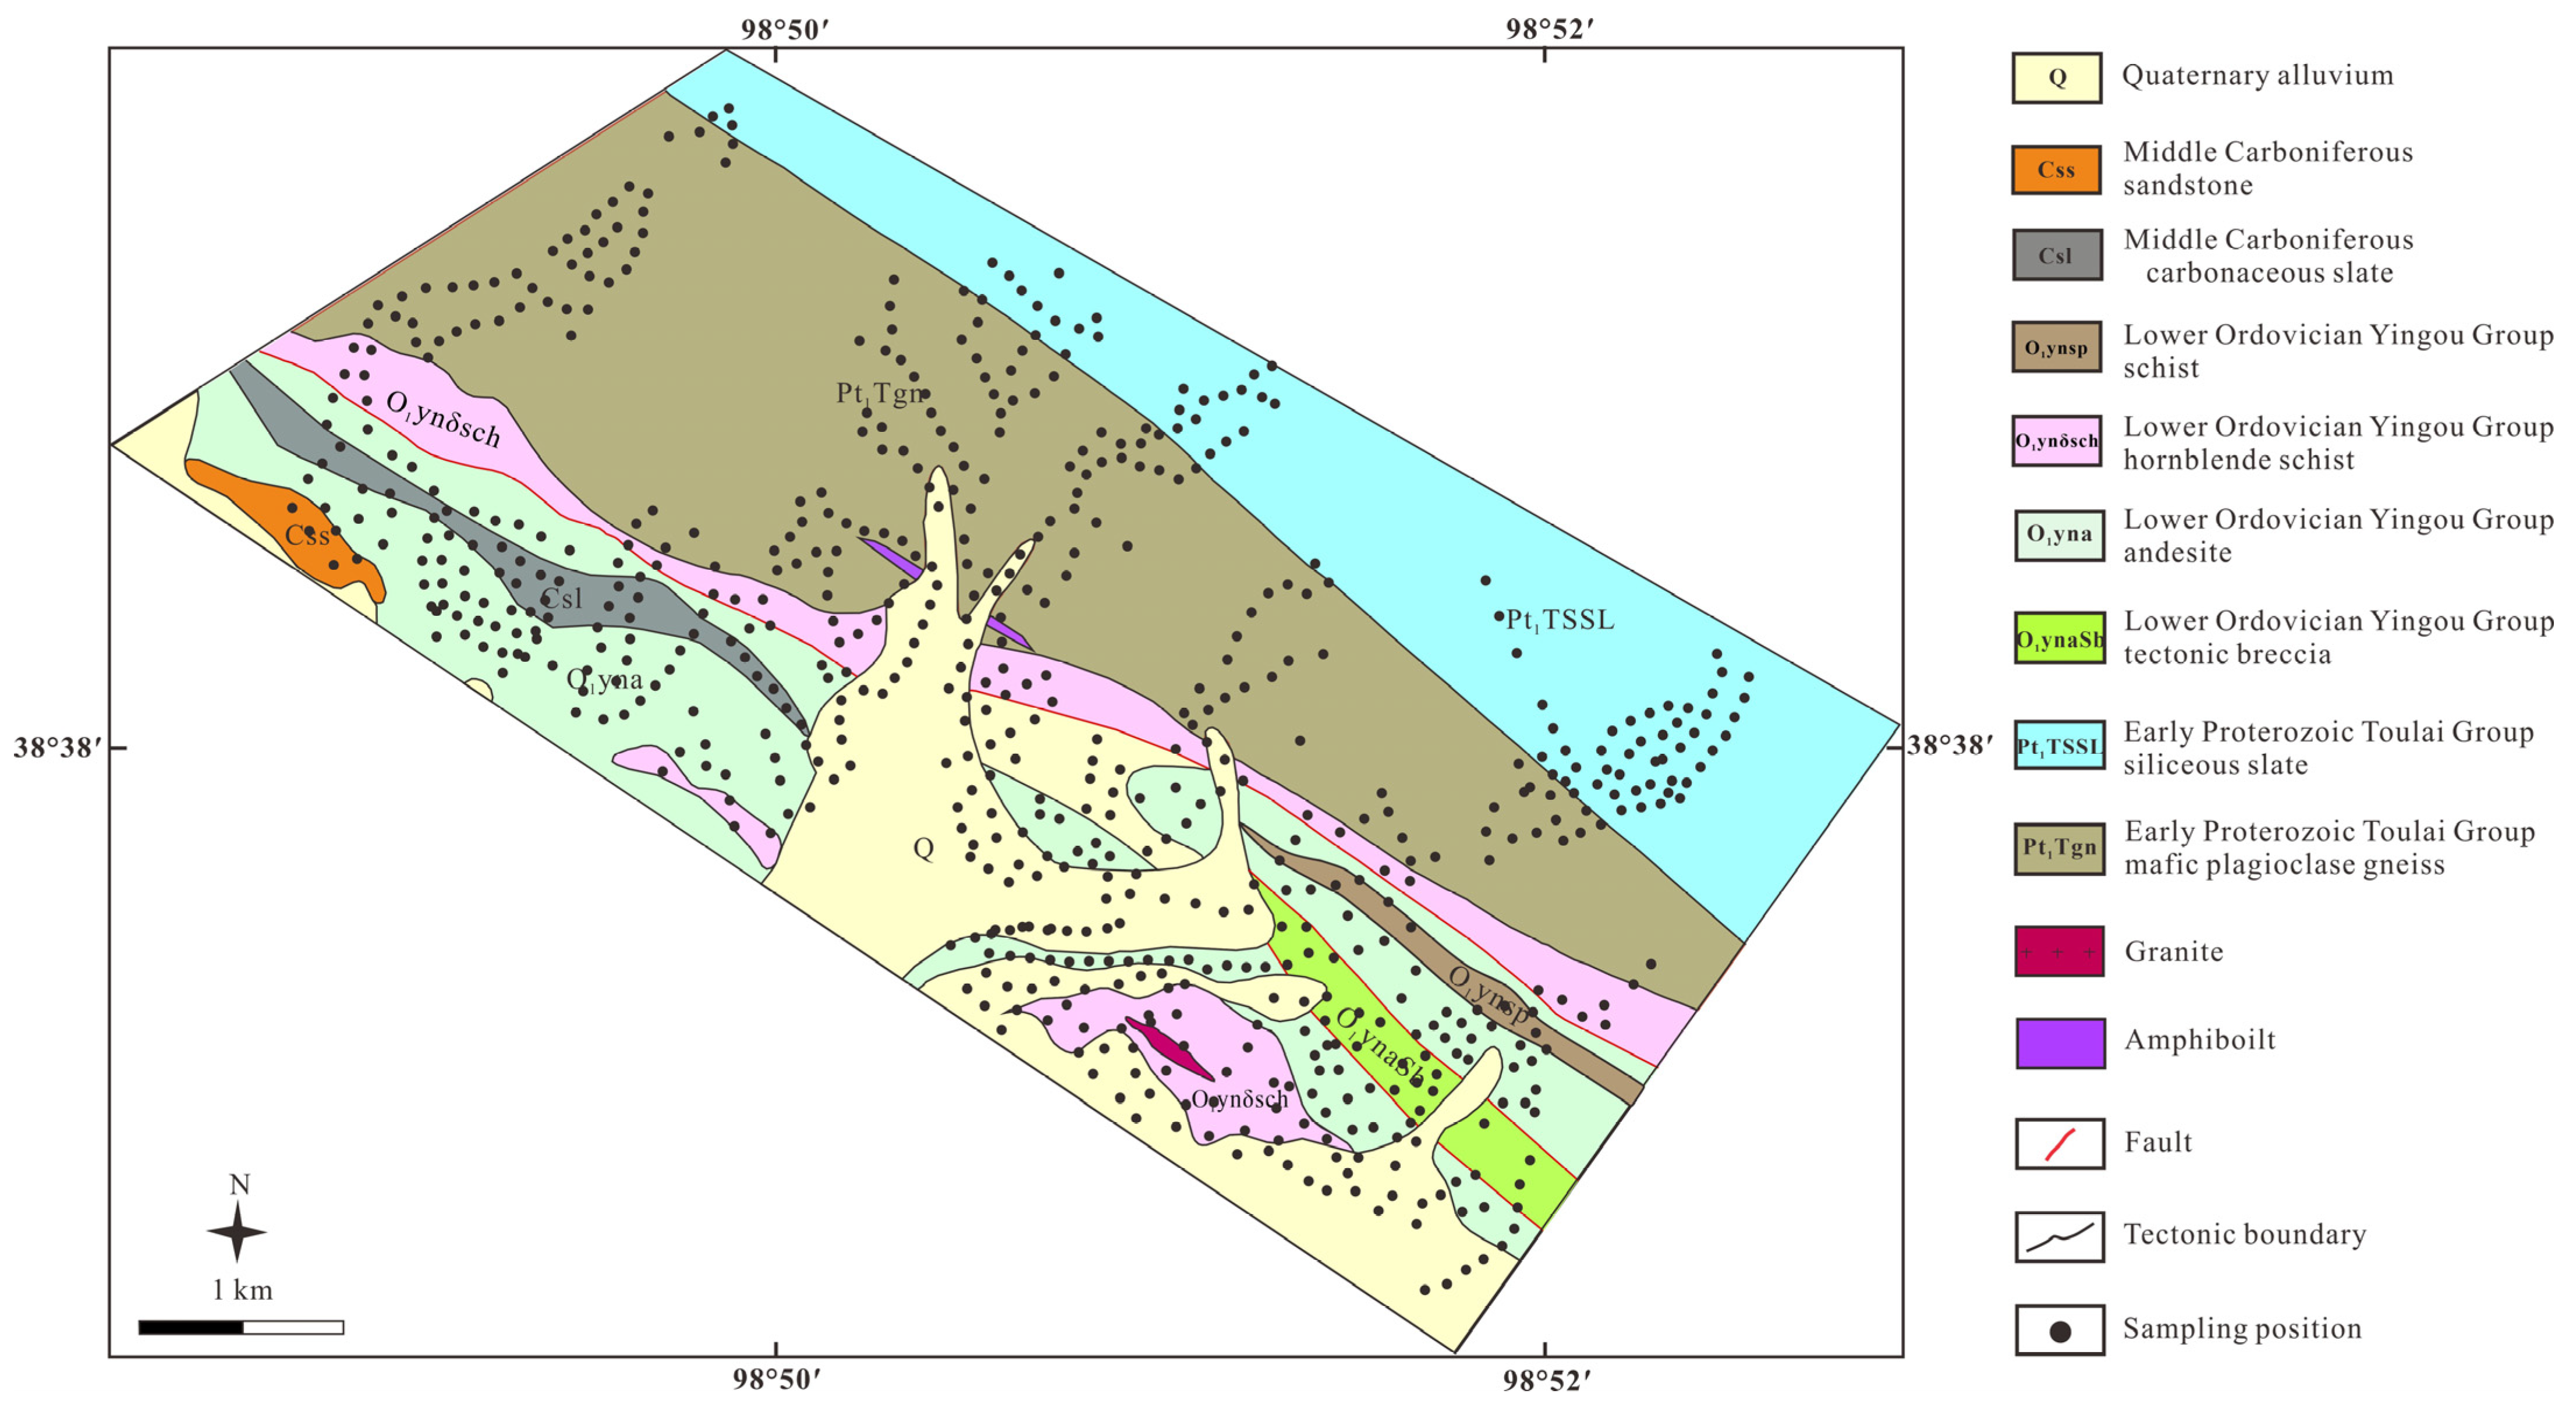
2.2. Geological Characteristics of the Study Area

The Early Proterozoic Tuolai Group (Pt1T), Lower Ordovician Yingou Group (O1yn), Middle Carboniferous (C2), and Quaternary (Q) strata are predominantly exposed within the Hongyahuo area [43,44] (Figure 2). The Tuolai Group is chiefly distributed in the northern and southern sectors of the study region and is composed of a suite of middle-high metamorphic rock, predominantly biotite plagioclase gneiss and siliceous slate. The Yingou Group extends through the central portion of the study area, trending approximately east-west. Its lithological composition typically includes gray to gray-green intermediate-mafic volcanic rocks, intercalated with crystalline limestone, hornblende schist, and biotite schist. This unit is tectonically juxtaposed against the Paleoproterozoic (Pt1T) strata via fault contact and lies unconformably over Middle Carboniferous formations. It serves as one of the principal ore-bearing horizons for iron and polymetallic mineralization in the Qilian region [45]. The Middle Carboniferous is distributed in the southeastern part of the area and consists of a clastic-carbonate assemblage, primarily comprising sandstone and carbonaceous slate. The Quaternary system is relatively well-developed, occupying the southern portion of the area, and is mainly composed of deposits associated with modern riverbeds and terraces.
Fold structures are generally not prominently developed within the study area, which is primarily characterized by northeast-oriented monoclinal strata. Nonetheless, relatively well-developed small-scale interlayer folds are observed, typically appearing as chevron-type folds whose axes run parallel to the prevailing strike of the strata. A significant regional fault, designated as F1, has been identified in the area, forming a tectonic fracture zone ranging from 30 to 80 m in width. This structure is classified as a reverse fault with a northwest-southeast orientation, aligning closely with the overall attitude of the surrounding strata.
Magmatic intrusive rocks are not well developed in the study area and only occur as dykes (or dikes) in the central and western parts.
In recent years, with the continuous exploration, geochemical anomalies of copper, iron, zinc, antimony, and gold have been discovered successively in this area. Many mineralization points, such as the medium-sized copper mine in the concave groove, the large iron mine in the small salon, and the chromite ore point in the large salon, have been found successively in the study area, fully demonstrating that this area has great potential for mineral exploration.

3. Materials and Methods

3.1. Sampling and Chemical Analysis

A total of 641 soil samples were collected through a geochemical soil survey (Figure 2). The sampling medium comprised residual-slope soil deposits, with material collected specifically from the C horizon. The sampling depth was typically maintained below 30 cm. At each designated sampling site, three individual soil samples were collected within a 3–5 m radius and subsequently combined into a composite analysis sample. Each composite sample weighed no less than 1000 g. Drawing on prior research experience from the current study area and its adjacent regions, soil particles finer than 60 mesh were selected, and subsamples weighing 150–200 g were prepared for chemical analysis. Detailed documentation of both sampling locations and the associated geological context was preserved, thereby ensuring uniformity in sampling media and minimizing contamination from rock fragments.
Chemical analysis was conducted at the Gansu Nonferrous Engineering Exploration Research Institute Tianshui, China. Quantitative analyses were performed for nine elements, namely Au, Cu, Fe, Mn, Ni, Pb, Zn, As, and Sb. Au concentrations were measured using graphite furnace atomic absorption spectroscopy, while As and Sb were quantified through atomic fluorescence spectrometry. The elements Cu, Pb, and Ni were analyzed via inductively coupled plasma atomic emission mass spectrometry, and Fe, Mn, and Zn were assessed using inductively coupled plasma atomic emission spectroscopy. The detection qualification rates for all analyzed elements ranged from 98% to 100%, satisfying the established regulatory standards.

3.2. Data Analysis

3.2.1. Principal Component Analysis (PCA) of Compositional Data

Compositional data, often associated with the concepts of “constant sum constraint” or “closure effect”, refers to the quantities or proportions of different components within a unified whole or mixture. This category of data comprises multiple parts whose cumulative total equals a fixed value [46]. Such data are characterized as high-dimensional and discretely structured, conveying information embedded within combinations of multivariate variables. It constitutes a form of multivariate data in which all positive values collectively sum to a constant, typically normalized to 1. The mathematical formulation of compositional data is provided as follows [47]:
SD = { x = ( x 1 , x 2 , , x D ) ; x i > 0 , i = 1 D x i = 1 }
where x is referred to as compositional vector data, and the simplex sample space is a D-1 dimensional set of RD.
PCA integrates multiple correlated variables into a single principal component, thereby reducing dimensionality by transforming original variables based on their covariance or correlation structure. These components reflect underlying relationships among multidimensional variables [48]. Geochemical datasets are representative of compositional data exhibiting closure effects. The inherent closure issue may introduce artificial correlations among elemental variables [49], complicating the interpretation of complex associations involving the same variable across different components. Direct statistical analysis of raw data may consequently result in misleading outcomes [50,51]. Given the constant-sum constraint characteristic of compositional data, both scale and constraint effects frequently arise during statistical computation and graphical representation [10]. This issue was first identified by Pearson [52], who noted that compositional variables tend to produce spurious correlations, and that their structure is significantly more complex than simply being restricted by unit or variable limitations. Therefore, to mitigate the closure effect, appropriate data transformation must be applied prior to conducting multivariate statistical analysis. At present, three prevalent transformation approaches are employed: alr, clr, and ilr. These are collectively classified as log-ratio transformations, as each method utilizes the logarithmic ratio of variables. The alr transformation employs a selected variable as the denominator, which tends to yield relatively objective outputs, though it does not completely resolve the closure issue. In contrast, the clr transformation uses the geometric mean as the common denominator, thereby preserving consistency among variables before and after transformation. However, due to the inherent constraint (y1 + y2 + y3…+ yD = 0), the clr-transformed variables are collinear, and the compositional structure remains partially closed.
clr ( x ) = { ln x 1 g ( x ) , ln x 2 g ( x ) , , ln x D g ( x ) }
g(x) is defined as the geometric mean of the samples, where
g ( x ) = K 1 D x k D
The ilr transformation effectively addresses the collinearity issue inherent in the clr transformation and accurately represents compositional data within Euclidean space. However, the number of variables is reduced by one following transformation when compared to the original dataset [53,54], which complicates the interpretability of the transformed variables, whereas the clr transformation preserves consistency between pre- and post-transformation variables. In response to this limitation, Filzmoser et al. [55] proposed a method utilizing a standard orthogonal basis to reconvert the loadings and factors derived from ilr transformation back into clr space via the corresponding conversion equation between the two representations, thereby enhancing the interpretability of compositional factor results. When the clr transformation is applied to geochemical data, it involves mapping from single-sample space into a D-dimensional space, where a compositional random vector x = (x1……xD)T is defined as the following:
y = ( y 1 , , y D ) T = ( log x 1 i = 1 D x i D , , log x D i = 1 D x i D )
z = ilr ( x ) = ( z 1 , , z D 1 ) T , zi = i i + 1 ln j = 1 i x j i x i + 1
where i = 1, 2, , D − 1.

3.2.2. Multifractal Analysis

The S-A multifractal model [28], introduced by Cheng Qiuming, characterizes the power-law distribution governing the frequency of spectral density. This model is constructed through the integration of conventional statistical frequency distribution techniques with spatial correlation analysis to distinguish anomalous background signals. It operates as a fractal-filtering framework, enabling the decomposition of multicomponent mixtures into distinct patterns according to varying anisotropic proportion exponents. The approach is grounded in power-law functional relationships, and the general form of the model is presented as follows [32]:
A (≥S)∝S−β
In Equation (6), S denotes the energy spectral density as a function of the wave number vector, A (≥S) refers to the unit area exceeding a specified threshold (S), and β represents the anisotropic multifractal index. The fractal dimension, which can be derived from a double-logarithmic plot, is indicated, while the symbol ∝ denotes proportionality. As the value of S increases, the corresponding area A decreases, with this inverse relationship being predominantly governed by the fractal dimension β.
Supported by Geographic Information System technology, the software applied in this study was executed via the China University of Geosciences (Wuhan, China) Arcfractal plugin [56].

3.2.3. Local Singularities

Cheng Qiuming [57,58] has described ore deposit formation as a singular process, as it reflects a highly efficient mechanism of elemental enrichment. Singular geological phenomena such as earthquakes and mineralization are typically associated with abrupt energy release or localized mass accumulation, which often occur within constrained spatiotemporal intervals [59]. As a prominent advancement in geochemical data analysis, singularity-based techniques have been adopted in both fractal and multifractal modeling frameworks [19] and have been employed to interpret anomalous physical mechanisms within geochemical systems. These processes are generally manifested as anomalous patterns of energy discharge or material concentration confined to narrow spatial and temporal scales [30,59]. Singularity is considered an inherent attribute of such complex phenomena and is frequently modeled using multifractal distributions. Local singularity indices are computed from geochemical maps at varying scales to quantify the degree of elemental enrichment or depletion at different spatial resolutions [28]. Within a multifractal context, geochemical singularities can be quantitatively described through the following power-law expression [29]:
μ i ( ε ) ε i
where ∝ denotes “proportional”, μ i (ε) represents the total amount of material of size ε in the i-th unit, and αi is referred to as the singularity index of the i-th unit. μ i (ε) can also be expressed in terms of density as follows:
μ i ( ε ) ρ i ε d
where ρ i represents the material density of the i-th small area with size ε, and d denotes the Euclidean dimension. According to Equations (7) and (8), ρ i ( ε ) can be expressed as follows:
ρ i ( ε ) ε α i d
As indicated by Equation (9), when α i = d and ρ remain constant, mineral elements are spatially distributed in a uniform manner. In cases where α < d, a localized enrichment of elements occurs, with smaller α values corresponding to more pronounced local enrichment effects. Conversely, when α > d, the presence of localized elemental depletion is implied. Accordingly, based on the power-law relationship, Equation (7) is formulated as the total amount model, whereas Equation (8) represents the density model.
X = c · ε a E
X represents the element concentration, c is a constant value, a denotes the singularity point, e is the normalized distance measure, and E represents the Euclidean dimension [60].
Window-based techniques may be employed to estimate the singularity index a [29], using either raw geochemical point data or grid-based geochemical maps. The procedure typically involves the following steps: (1) a series of sliding windows (or other geometric shapes) of varying sizes are defined, denoted as window A(r), where rmin = r1 < r2 < … < rn = rmax. At each designated location on the map, the average concentration C[A(ri)] is computed for each window size, where C[A(ri)] refers to the total sum of concentration values within the window divided by the number of values contained in that window. (2) By plotting C[A(ri)] (i = 1, …, n) against ri on a log–log scale, a linear relationship can be derived as follows:
log C [ A ( r i ) ] = c + ( 2 α ) log ( r )
The value of α is estimated based on the slope of the fitted line, and the same procedure is subsequently applied to all other positions on the geochemical map by employing Equation (9). Within the geochemical map, most regions are characterized by singularity values of approximating 2, which suggests a normal distribution pattern. In contrast, zones where a > 2 or a < 2 correspond to elemental depletion and enrichment, respectively [60,61].

4. Results and Discussion

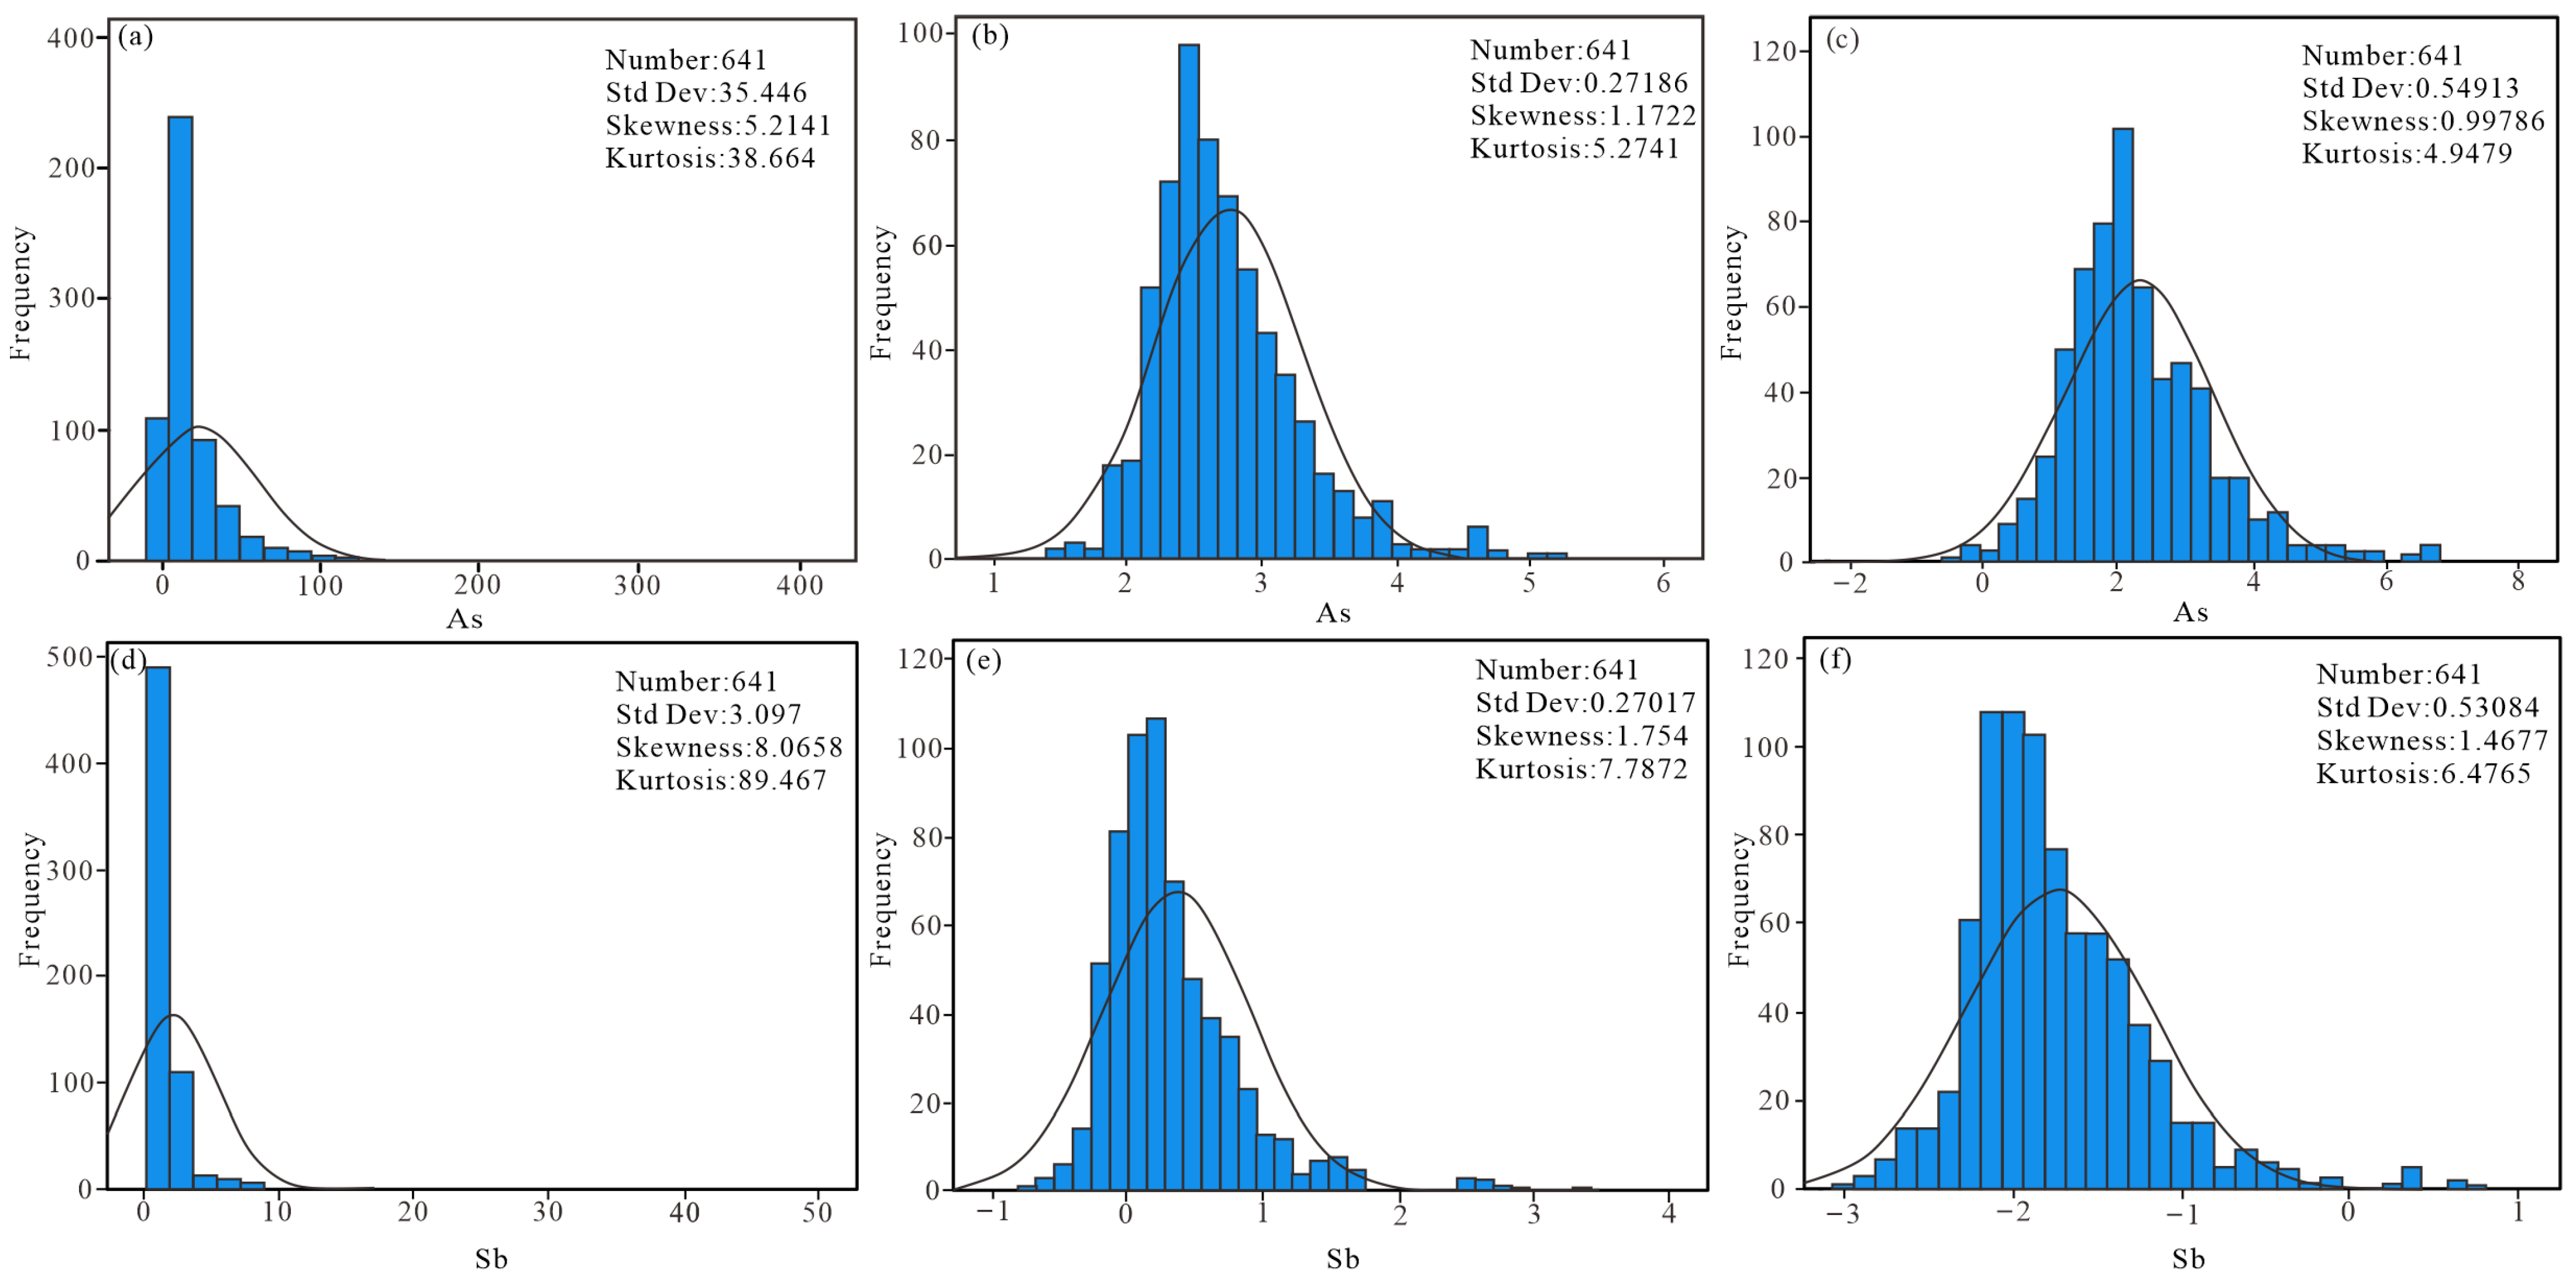
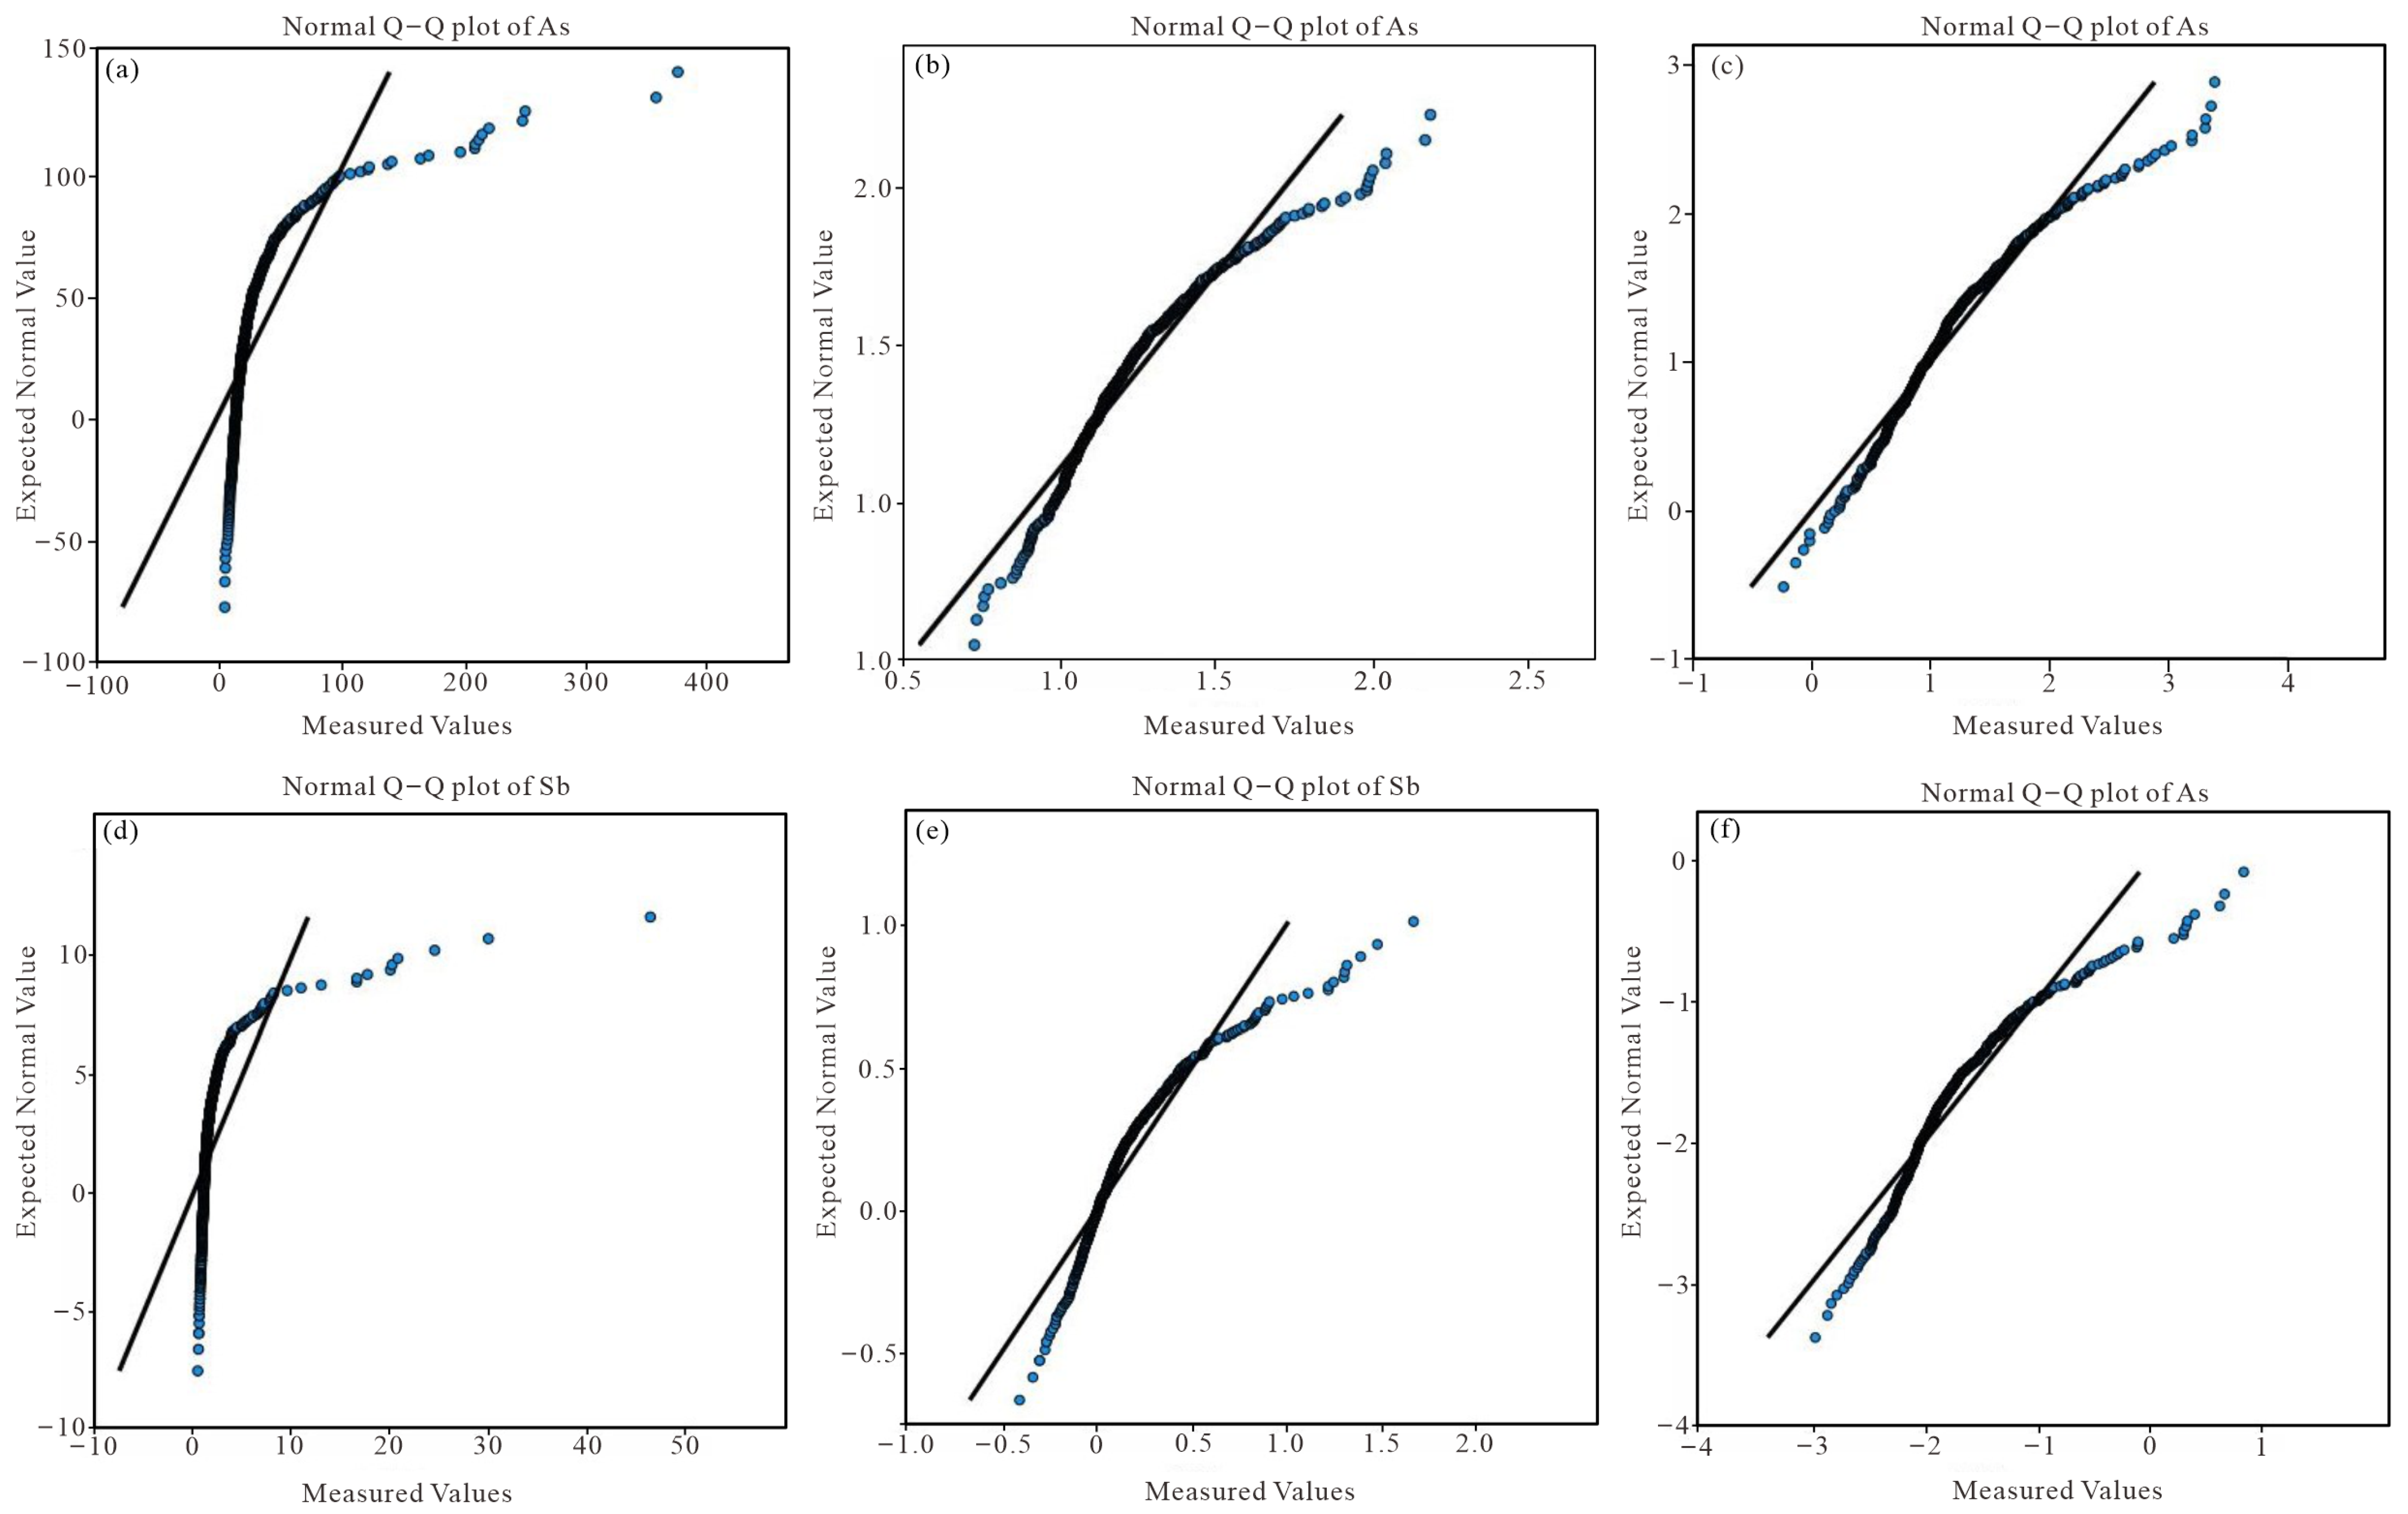
4.1. Statistical Characteristics of Geochemical Data
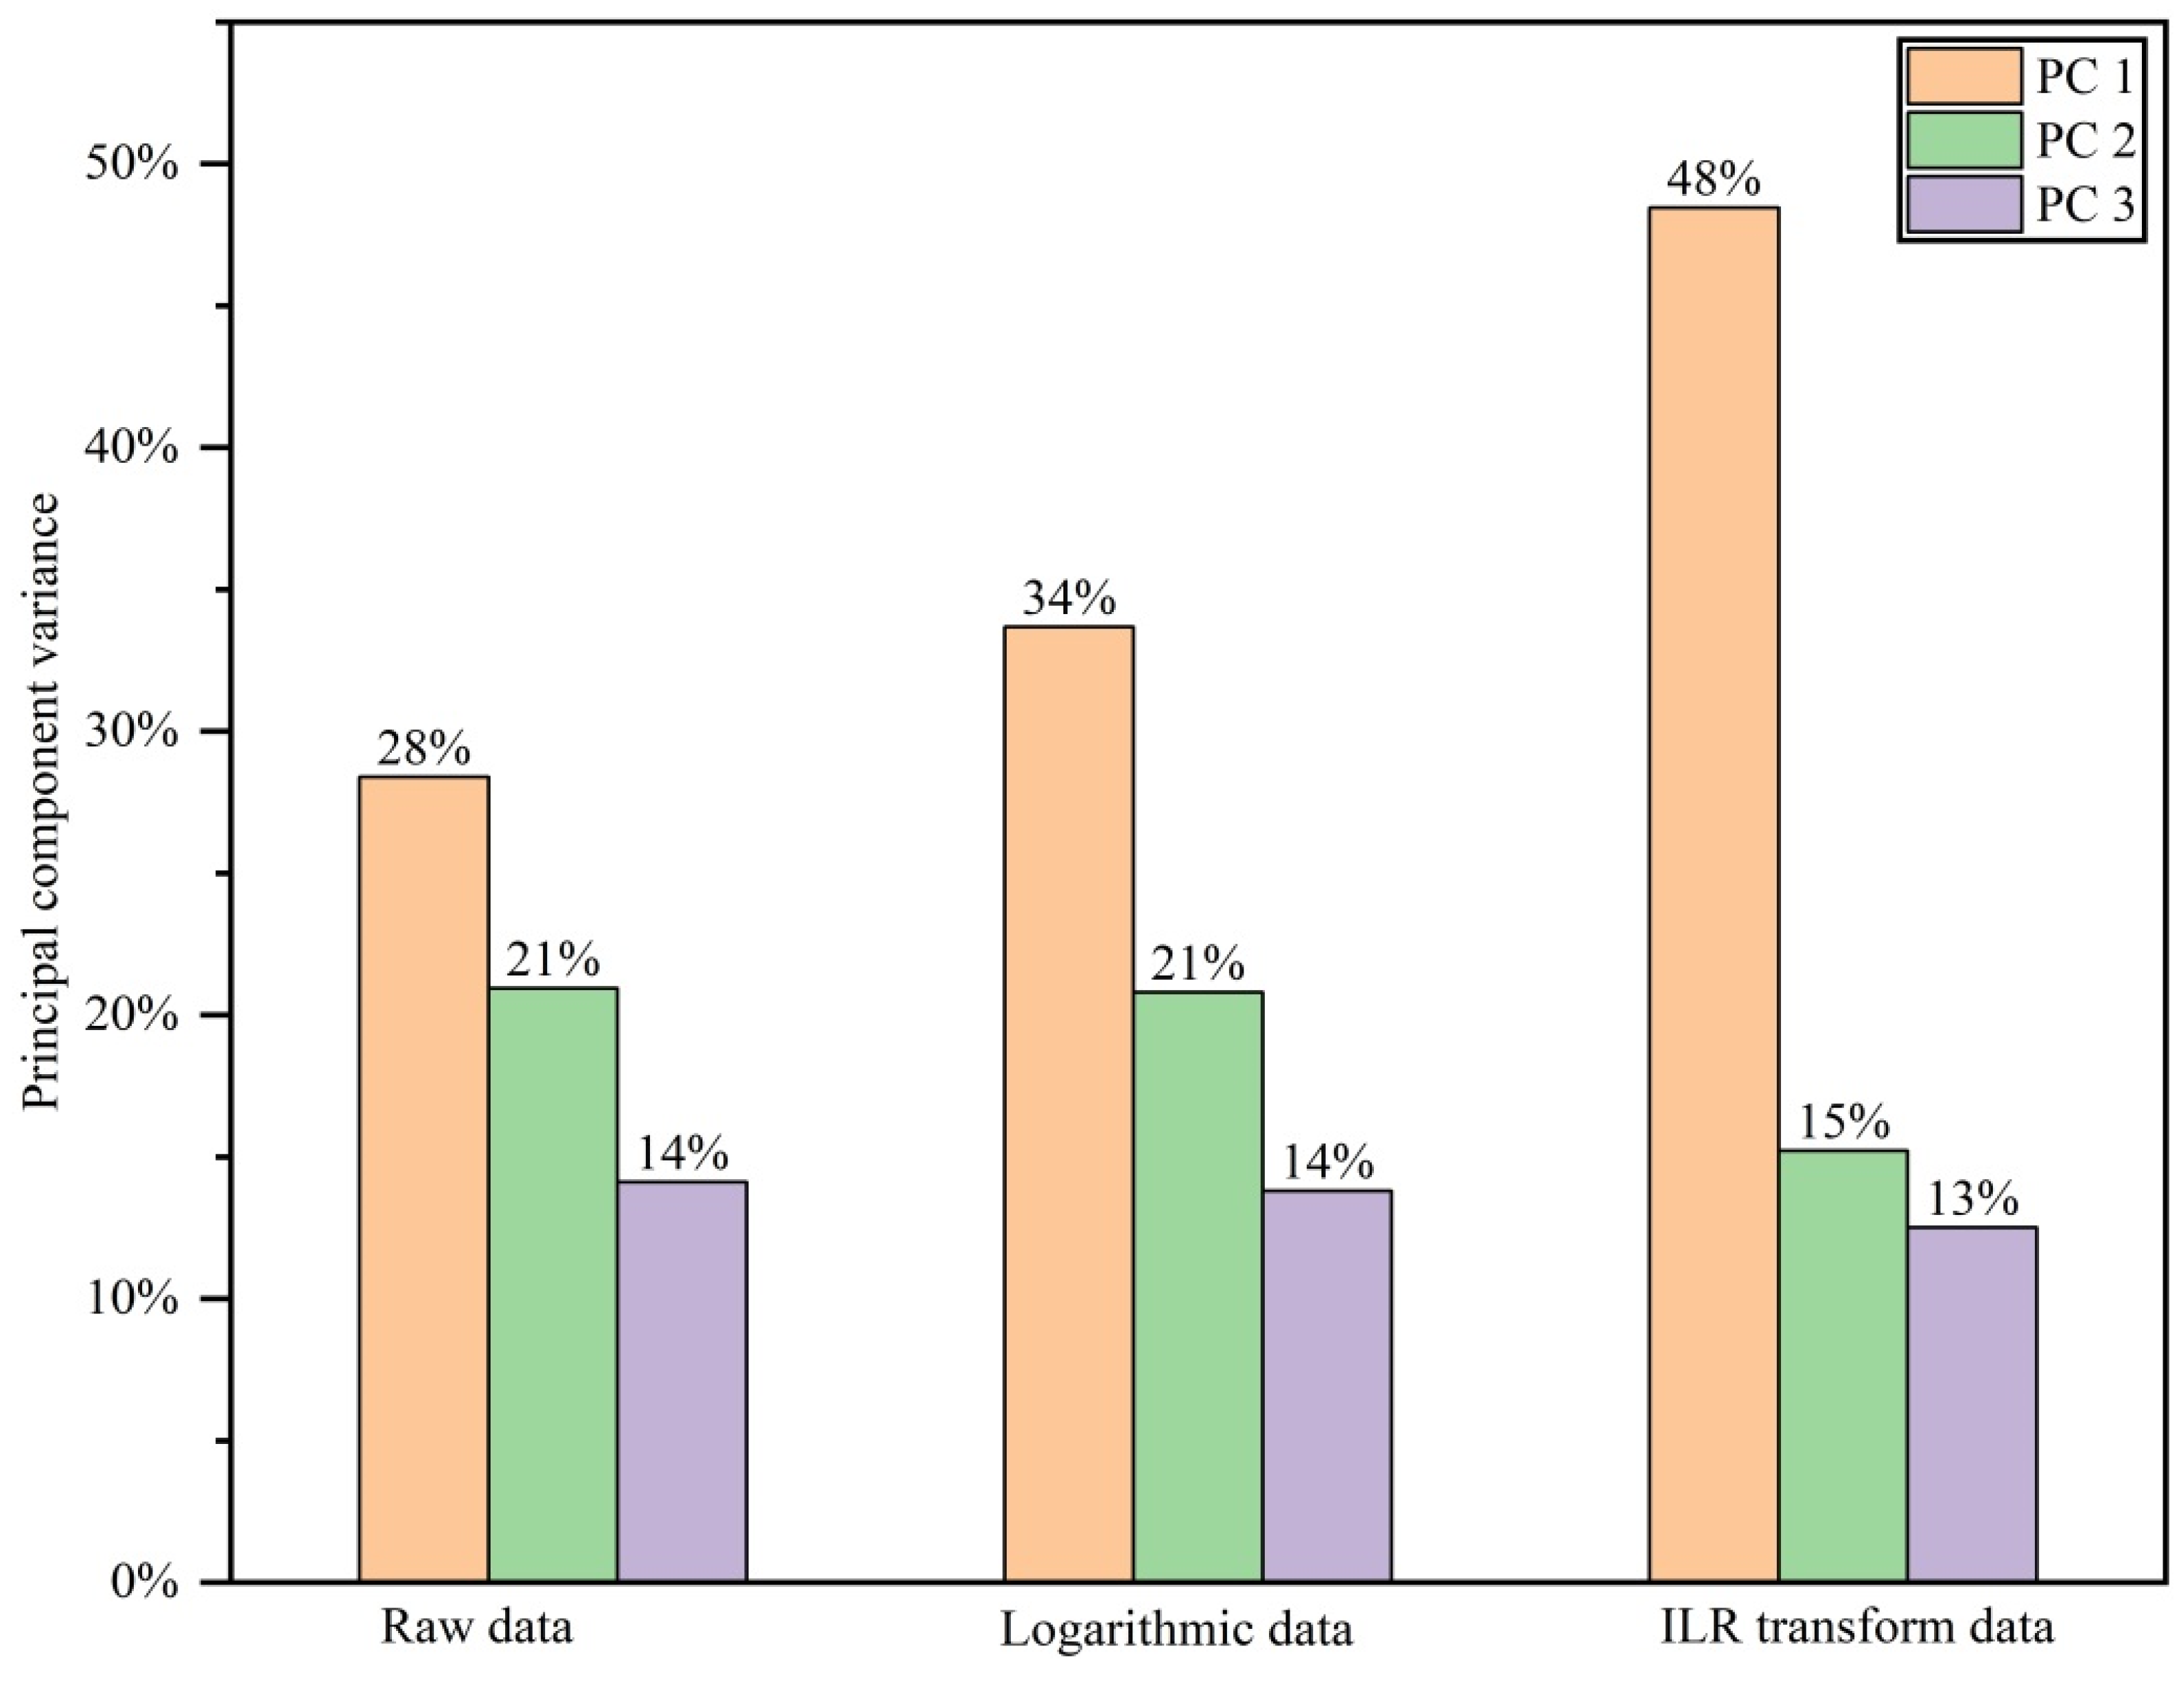
To obtain a more comprehensive understanding of the interrelationships among the nine elements within the study area, statistical analyses were conducted on the characteristic parameters of element concentrations derived from the original dataset, the logarithmically transformed data, and the ilr-transformed data (Table 1). Comparative analysis was also performed on the spatial distribution features of these elements. As shown in Table 1, the coefficient of variation for Sb exceeds 1.5, indicating a high degree of dispersion and a strong capacity for differentiation. The coefficients of variation for Au and As surpass 1.0, implying substantial migration and dispersion behaviors. Elemental enrichment associated with mineralization refers to the process by which specific geochemical elements become concentrated in particular regions of the Earth’s crust, resulting in ore formation. This phenomenon is typically driven by geological mechanisms that facilitate the accumulation of target elements. The formation and localization of ore deposits are determined by the interplay between geochemical element distribution and geological setting evolution. Analytical results reveal that the enrichment factors for As, Sb, Cu, Au, Ni, Fe, Mn, and Zn are all above 1, with As, Sb, Cu, and Au exhibiting enrichment factors greater than 1.5, suggesting highly uneven spatial distribution and pronounced enrichment patterns.
Therefore, in this paper, Cu, Au, As, and Sb elements with uneven distribution, high coefficient of variation, and high enrichment coefficient are selected for further research. Histograms presented in Figure 3a and Figure 4a reveal that the original values of these elements are characterized by elevated skewness and kurtosis, indicating clear deviations from normal distribution. Correspondingly, the quantile–quantile (Q–Q) plots illustrate substantial departures from linearity due to extreme values (Figure 5a and Figure 6a). Following logarithmic transformation (Figure 3b and Figure 4b) and ilr transformation (Figure 3c and Figure 4c), the distributions of Cu, Au, As, and Sb demonstrate improved symmetry and reduced variation in spatial distribution, thereby diminishing the influence of outliers and promoting a closer approximation to a symmetric pattern. Consequently, ilr transformation is effective in mitigating structural heterogeneity and minimizing the closure effect in compositional data, thus enhancing statistical normality. The Q–Q plots of both logarithmically and ilr-transformed datasets for Cu, Au, As, and Sb (Figure 5b,c and Figure 6b,c) indicate the presence of multiple populations within individual datasets, reflecting the impacts of distinct geological processes or events, as well as the overlapping behavior of multi-element associations.

4.2. PCA

To enhance the clarity of how data closure affects multivariate analysis, PCA was applied to three data types in order to extract the most representative components from geochemical elements, thereby aiding in the characterization of geochemical behavior under varying geological conditions within the study area. Principal component variance contribution plots (Figure 7) and the plots of PCA (Figure 8) were generated for the original, logarithmic, and ilr-transformed datasets. As illustrated in Figure 7, the cumulative variance contributions of PC1, PC2, and PC3 accounted for 63%, 69%, and 76% in the original, logarithmic, and ilr datasets. Notably, PC1 alone explained 28%, 34%, and 48% of the total variance in the original, logarithmic, and ilr-transformed data, respectively. It is not difficult to see that after the ilr data transformation, its variance value is much larger than the values of the first two types of data, and PC1 is greater than PC2 and PC3. This indicates that the data has been opened, eliminating the interference of outliers, and can better interpret the spatio-temporal heterogeneity of elements. Therefore, the principal component of PC1 contains the most comprehensive information and is more representative. Moreover, the pattern PC1 > PC2 > PC3 was maintained, with PC1 exhibiting a much higher contribution than PC3, suggesting that the ilr transformation effectively minimized the influence of outliers and more accurately reflected the spatial and temporal heterogeneity of elemental distributions.
The scatter plots presented in Figure 8 indicate that the PC1 results derived from the original dataset (Figure 8a) and the logarithmically transformed dataset (Figure 8b) exhibit substantial similarity, with all nine elements showing positive loadings on PC1 and being distributed across the first and fourth quadrants. The majority of sample points are positioned near the origin, which can be attributed to the closure effect inherent in compositional data. In both datasets, weak inter-element correlations are observed, making it difficult to discern clear relationships among elemental groups. Compared to the original data, the sample points in the logarithmic dataset appear more dispersed, and a positive correlation between Au and Sb is observed. However, overall correlation differences among elements remain minimal, thereby limiting the visibility of distinct elemental associations. Similarly, the PC2 outcomes in both datasets are nearly identical. In contrast, the PC1 configuration derived from ilr-transformed data (Figure 8c) displays marked divergence from the previous two, with elements distributed across all four quadrants, signifying a more effective resolution of the closure effect. This transformation more accurately captures the spatial structure and geochemical characteristics of ore-forming elements. Notably, two distinct elemental associations emerge: PC1 is defined by positive loadings of Cu, Fe, Mn, Ni, Pb, and Zn, representing a medium- to high-temperature hydrothermal assemblage, which may reflect Cu-Pb-Zn polymetallic mineralization related to magmatic intrusion and structural fracturing. This elemental association closely corresponds to that observed in the adjacent negative groove mining area, where the known deposit comprises Cu-Pb-Zn elements. Conversely, negative loadings consist of Au, As, and Sb, which are indicative of low-temperature hydrothermal processes related to gold-antimony mineralization, commonly associated with structurally controlled fissures and magmatic hydrothermal systems.
Based on the variance contributions, eigenvalues, and scatter plot characteristics derived from the three types of datasets, the results suggest that PC1 obtained through ilr transformation provides a more accurate explanation of the favorable ore-forming element associations within the study area. A principal component score distribution map was constructed using PC1 derived from the ilr-transformed data (Figure 9). This map reveals that high PC1 scores are predominantly concentrated in the northern and eastern portions of the study area, and the spatial pattern of these anomalies differs markedly from those observed in the other two data types. Low PC1 scores are primarily associated with the Lower Ordovician Yingou Group strata, which are indicative of structural fracture zones and intermediate-felsic intrusive rocks, implying the possible presence of a volcanic exhalative sedimentary mineralization system. Consequently, PC1 reflects the cumulative outcome of multiple geological processes. Under the influence of the regional metallogenic framework in the Hongyahuo area, PC1 serves as a representation of the spatial distribution characteristics of ore-forming element assemblages.

4.3. S-A Multifractal Extraction of Geochemical Anomalies

The tectonic-magmatic activities in the study area are frequent, and the regional geochemical characteristics are affected by geological tectonic movements at different times, making it difficult to distinguish the abnormal field and background field characteristics. At the same time, due to the influence of surface geology, many mineral-induced anomalies are manifested very slowly or are even invisible. The S-A multifractal extraction of geochemical anomalies can effectively separate weak anomalies from complex geochemical fields. Following the ilr transformation, inverse distance weighting interpolation was applied to the PC1 principal component data, which was subsequently converted into the frequency domain upon generation of the gridded dataset. The Fourier transform was then utilized to convert the data from the frequency domain back to the spatial domain, producing a double logarithmic (base-10) plot of spectral density S values exceeding a predefined threshold (Figure 10). Through least squares fitting, three linear segments separated by two inflection points were identified. These slope segments characterize the spatial self-similarity and fractal behavior of elemental distributions. As shown in Figure 11, the first regression equation, y = −0.423x + 5.644 (R2 = 0.969), corresponds to noise; the second, y = −0.667x + 6.726 (R2 = 0.996), represents geochemical anomalies; and the third, y = −3.191x + 27.88 (R2 = 1.000), reflects the geochemical background. The intersections of these lines yield cut-off thresholds defining three spectral filters. Specifically, the cut-off values between the right and middle segments and between the middle and left segments of PC1 are 4.949 and 8.413 (log10), respectively. For PC1, values of logS ≤ 4.949 are classified as noise; values within 4.949 < logS ≤ 8.413 correspond to anomalous regions; and logS > 8.413 is indicative of background signals. Based on these fitted threshold values, the complex geochemical structure was decomposed into PC1 background and anomalies (Figure 11) through the application of the inverse Fourier transformation.
As observed in the decomposition diagram, the PC1 chemical anomaly distribution (Figure 11a) is predominantly situated in the northern, central, and southeastern sectors of the study area. These regions are characterized by medium- to middle-high metamorphic rock systems that have experienced multiple orogenic episodes, exhibiting evidence of polyphase tectonic activity [62]. The delineated anomalous zones spatially align with ore-bearing strata and structurally altered belts, thereby validating the effectiveness of the model in anomaly detection. In relation to adjacent regions and the previously identified Cu-Pb-Zn ore deposit in the negative groove area [39,45], the ore-hosting stratum is associated with the Lower Ordovician Yingou Group, which is known to contain Cu-Pb-Zn polymetallic mineralization. Consequently, the PC1 element association is interpreted to reflect Cu-Pb-Zn polymetallic mineralization linked to intrusive processes and fault structures within marine volcanic-sedimentary environments.
In the PC1 high background map (Figure 11b), regions of elevated and reduced background values are distributed along two north–south trending zones. The elevated background values in the northern section are predominantly associated with exposures of the Paleoproterozoic Tuolai Group strata. Conversely, in the southern portion of the study area, lower background values extend in both eastward and westward orientations. The lithological units corresponding to low background values are primarily composed of andesite and intermediate-felsic intrusive rocks interbedded with slate and sandstone, where well-developed fracture zones are present. Based on these spatial and lithological patterns, it can be inferred that the Paleoproterozoic Tuolai Group exhibits pronounced iron–nickel enrichment, potentially acting as a metal source contributing to the formation of medium-to-low-temperature ore-forming elements.

4.4. Delineation and Verification of Prospecting Target Areas

4.4.1. Delineation of Prospecting Target Areas

The study area exhibits a topographic configuration characterized by steeper slopes in the north and gentler slopes in the south. Regionally known mineral deposits demonstrate strong spatial correlations with specific stratigraphic units, intermediate-felsic intrusive rocks, and NW and ES-trending structural systems. The PC1 chemical anomaly map reveals prominent anomalies concentrated in the northern, central-western, and southeastern sectors of the study area, with particularly intensified anomalies at the intersection zones of NW-NE trending faults. This spatial pattern highlights the critical role of stratigraphic sequences and structural intersections in controlling polymetallic mineralization. Through integrated analysis of geochemical element associations identified by the PC1 and S-A model, combined with metallogenic constraints from known deposits, ore-hosting strata characteristics, and structural fracture zone features, three prospective exploration target areas have been delineated in the Hongyahuo sector (Figure 12). These targets represent high-potential zones where favorable lithological assemblages intersect with multi-stage structural superimposition, creating optimal conditions for metal enrichment.
Target Area I: Primarily located in the western part of the study area, covering an area of 0.44 km2. This target area exposes strata of the Early Proterozoic Tuolai Group. The anomalies exhibit banded, elliptical, and scattered distributions, with their long axes aligned with the stratigraphic strike and roughly parallel to the orientation of fault fracture zones. The lithology comprises a medium-to-high-grade metamorphic rock series enriched in high-temperature elements such as Fe and Ni through multistage orogenic superimposition, reflecting its polycyclic tectonic activity.
Target Area II: Situated in the central part of the study area, spanning 0.73 km2. Exposed strata include the Early Proterozoic Tuolai Group, Lower Ordovician Yingou Formation, and Quaternary residual-slope deposits. The region has undergone multiple phases of orogenic superimposition, resulting in large-scale, irregularly shaped anomalies whose long axes broadly align with the dip direction of the strata. The topography features higher elevations in the north and lower elevations in the south, likely influenced by fluvial sedimentation and transport under supergene conditions, which facilitate the migration and precipitation of metallogenic elements along drainage systems.
Target Area III: Located in the eastern part of the study area, covering 0.792 km2. The exposed strata belong to the Lower Ordovician Yingou Formation. Anomalies display irregular to sub-elliptical morphologies with distinct compositional and concentration zonation. The long axes of anomalies align with the stratigraphic strike and approximate the orientation of fault fracture zones. Intermediate-acid intrusive rocks are well-developed in this area, and a prominent PC1 chemical anomaly is observed at the intersection of NW- and NE-trending faults, indicating favorable metallogenic space and pathways for mineralization.

4.4.2. Anomaly Verification

Based on the prevailing mineralization conditions and the identified geochemical element assemblages, anomaly verification was conducted within the No. III predicted target zone (Figure 12). During field reconnaissance, a structurally altered zone approximately 10 cm wide and trending northwest was observed. Trench TC02 was excavated perpendicular to the orientation of this alteration zone, following the strike of the surrounding rock formations (Figure 13a). Upon exposure through trenching activities (Figure 13), an industrial-grade copper ore body was uncovered (Figure 13b), yielding an average Cu-grade of 1.74 × 10⁻². Analytical results of the collected samples are listed in Table 2. The ore body is mainly hosted in andesite, displaying prominent malachite mineralization on the rock surface, accompanied by disseminated chalcopyrite and locally occurring azurite mineralization.

5. Conclusions

(1)
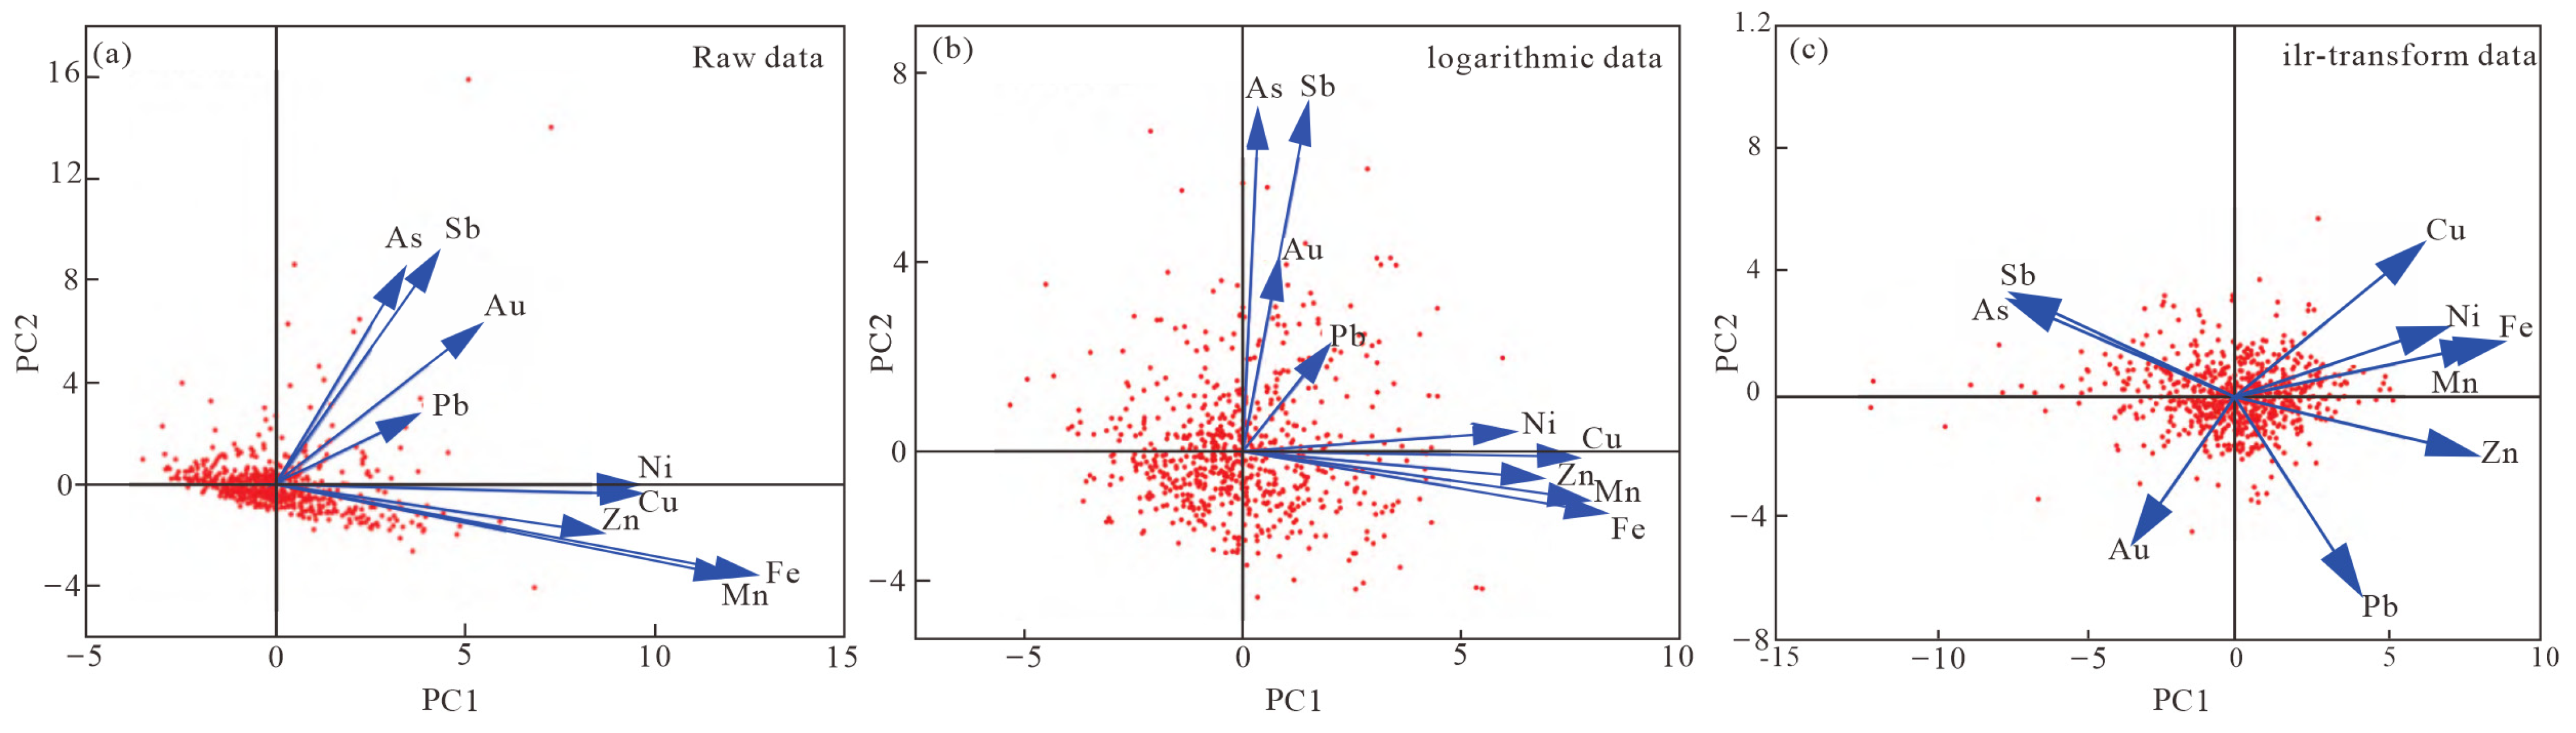
Comparative analysis using histograms and Q-Q plots was conducted on three data types (raw, logarithmic, and ilr). Among them, only the ilr-transformed dataset successfully addressed the closure issue inherent in raw data and exhibited a symmetrical distribution of elemental values. This outcome suggests that ilr transformation provides a more accurate depiction of the spatial structural features of geochemical elements.
(2)
PCA was applied to the compositional dataset to extract principal component eigenvalues and cumulative variance contribution rates for all three data types. Biplot representations demonstrated that, following ilr transformation, the positive loadings of PC1 revealed a Cu-Fe-Mn-Ni-Pb-Zn association, indicative of medium- to high-temperature hydrothermal mineralization processes. This component accounted for the highest variance and eigenvalue among all components, illustrating the superimposed influences of multiple geochemical processes in the copper polymetallic mineralization system. This association reflects the integrated signature of key ore-forming elements within the study region.
(3)
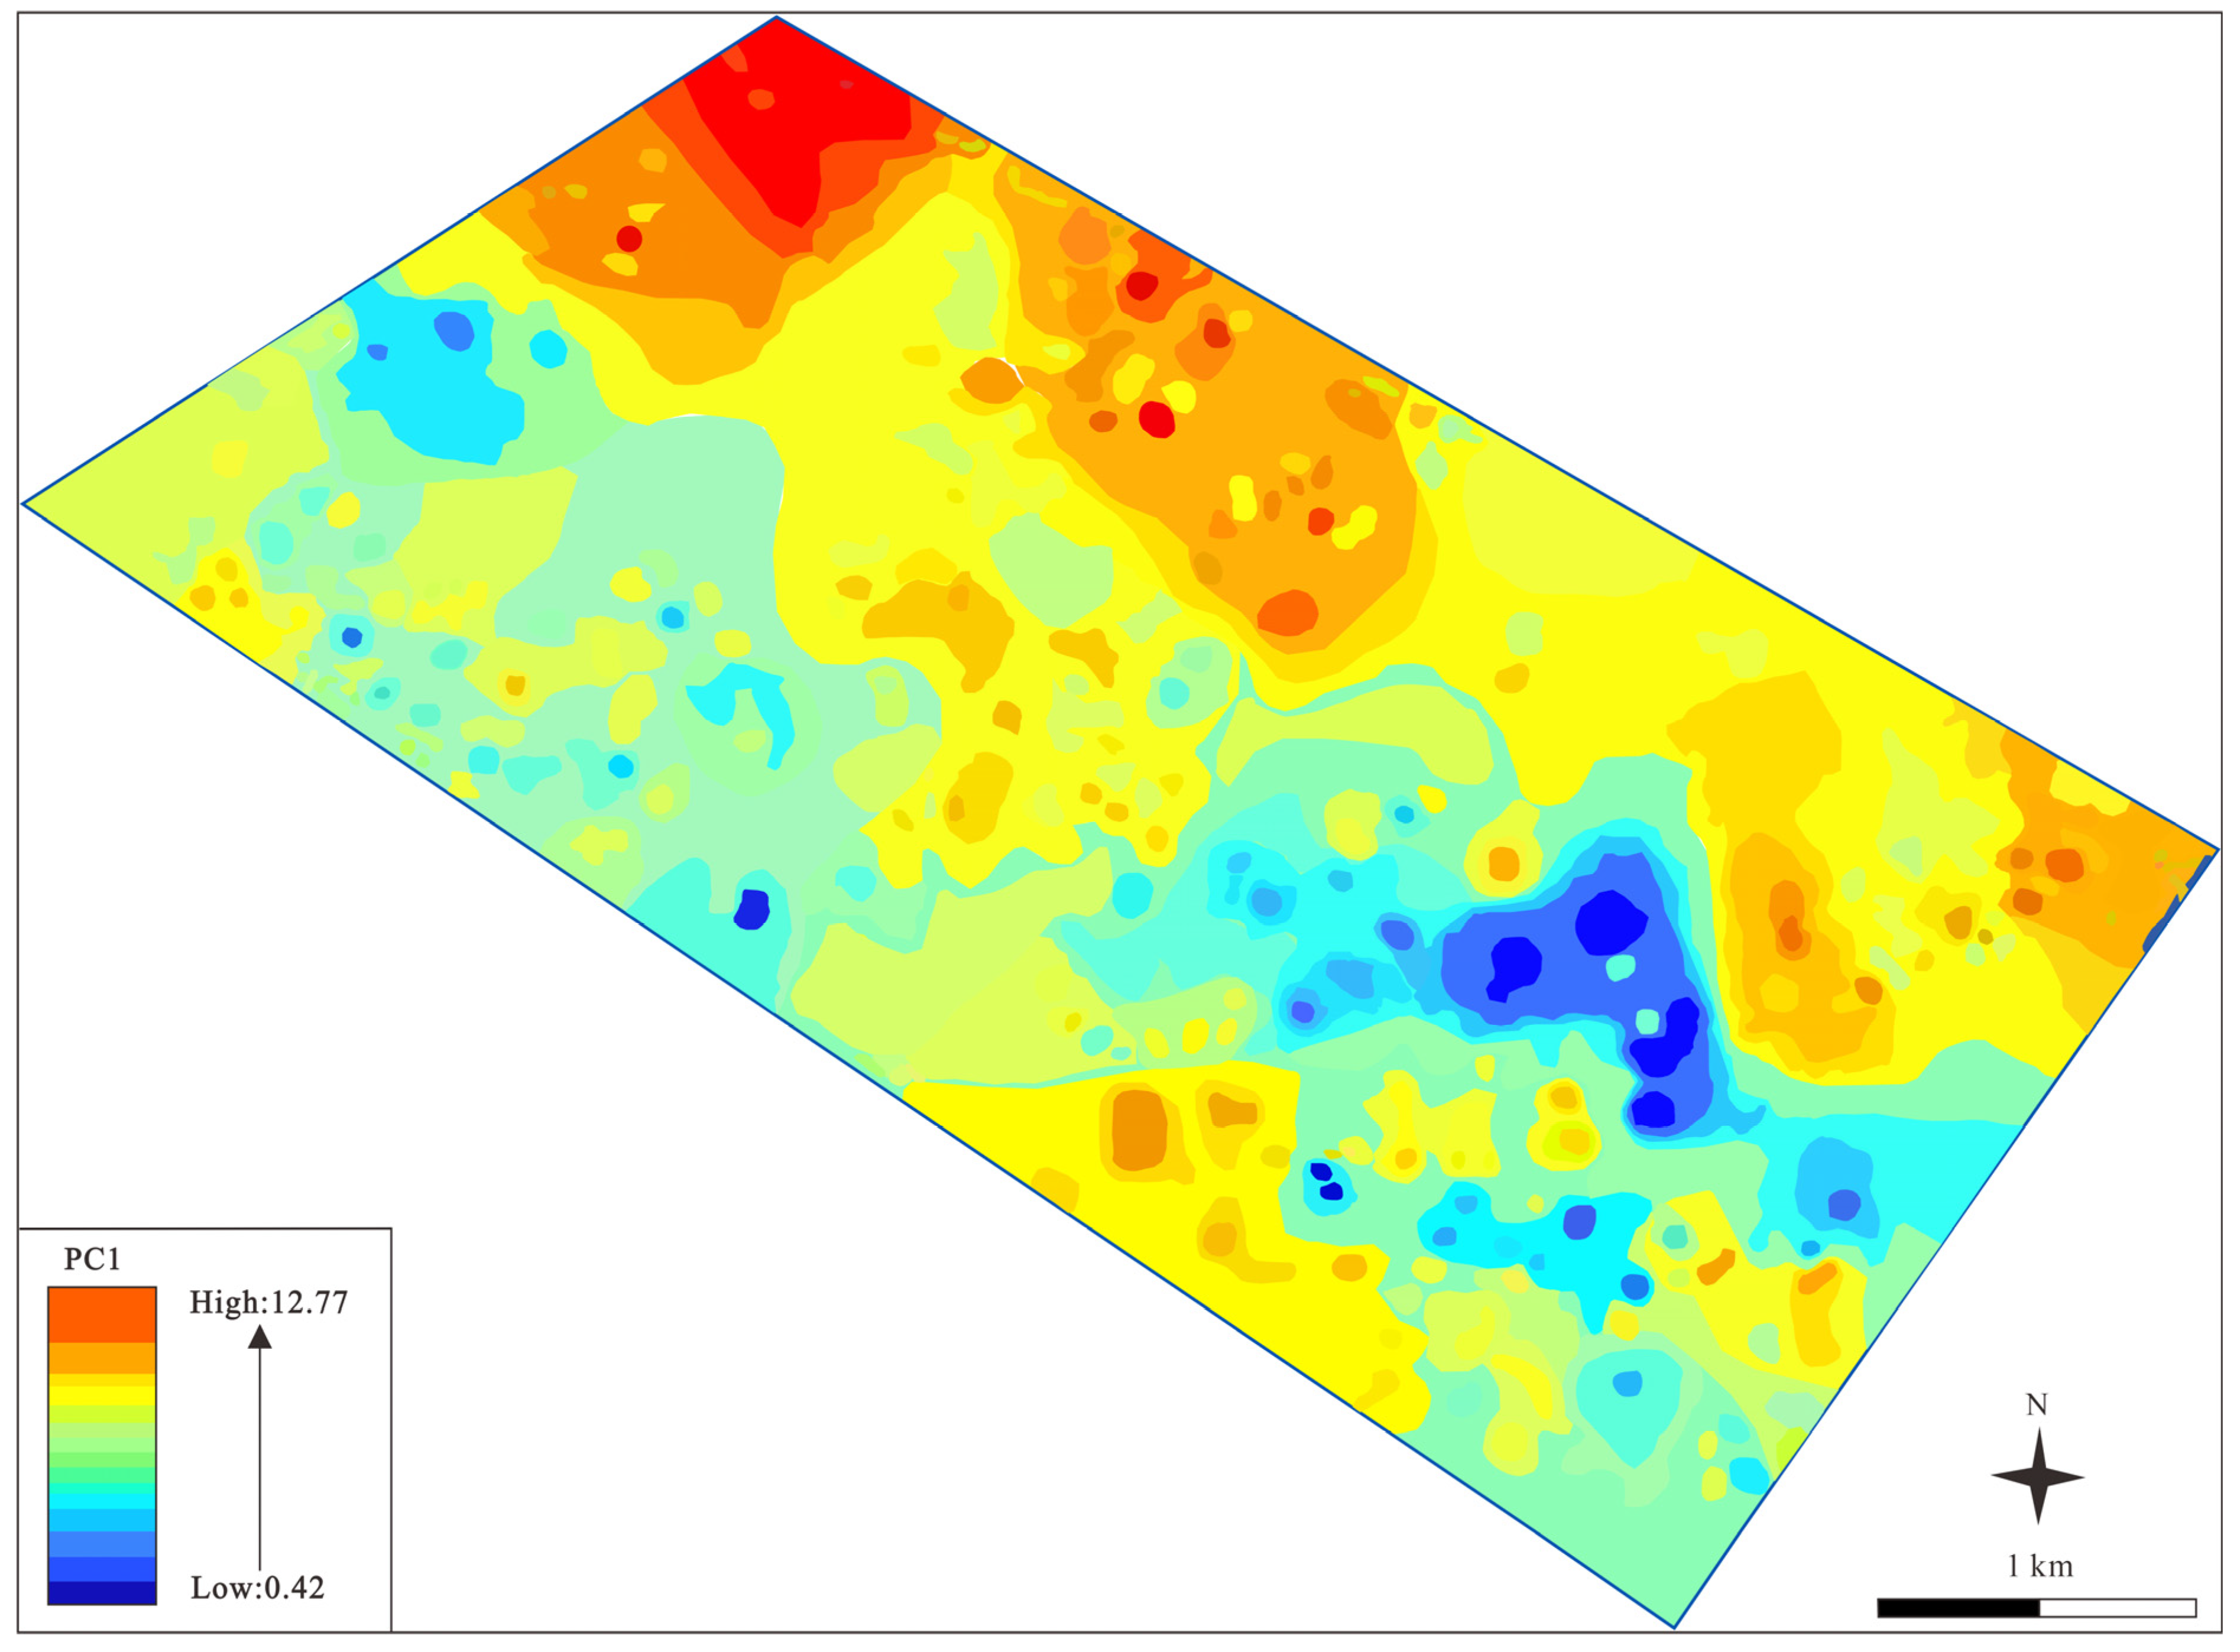
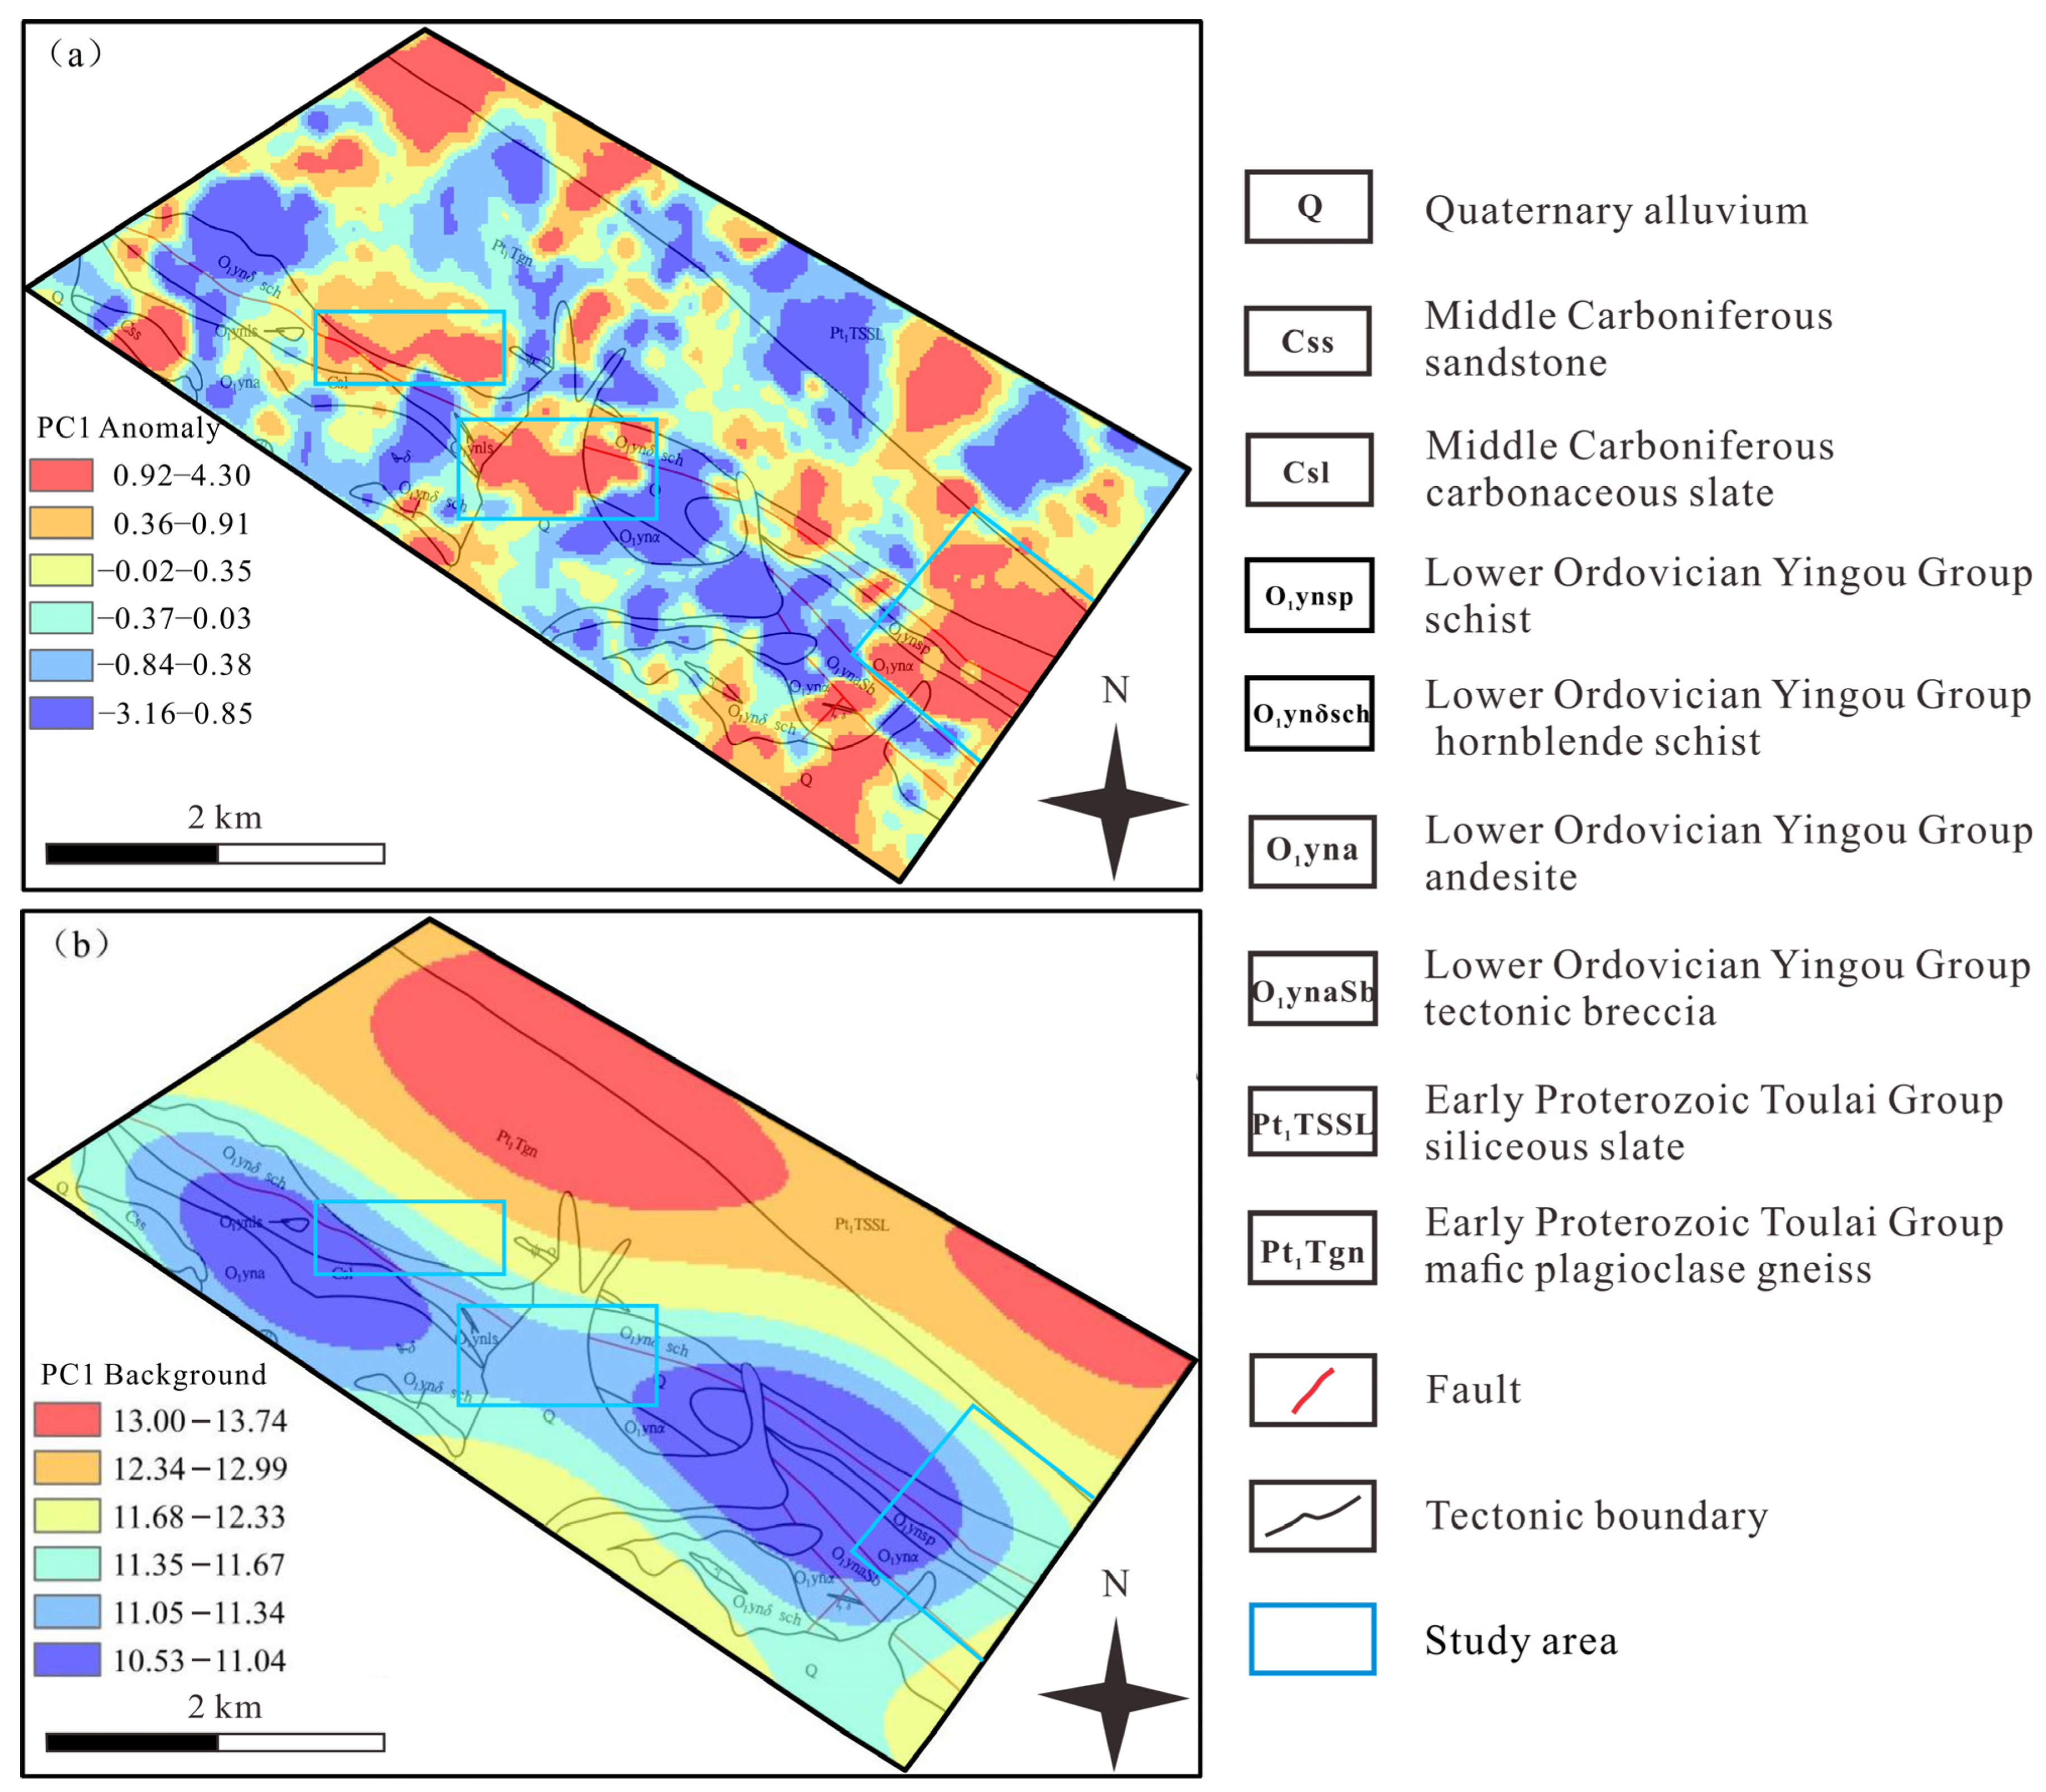
The S-A model was utilized to differentiate geochemical anomalies and background values in the study area, generating maps of PC1 anomaly and background distributions. The spatial patterns of the delineated anomalies corresponded well with regional geological features. Additionally, the singularity model was employed to identify subtle anomalies arising from complex geological processes. The resulting singularity index distribution map revealed that areas where the PC1 element assemblage displayed a singularity index α < 2 were associated with relatively constrained anomaly zones, offering valuable insight for guiding mineral exploration efforts.
(4)
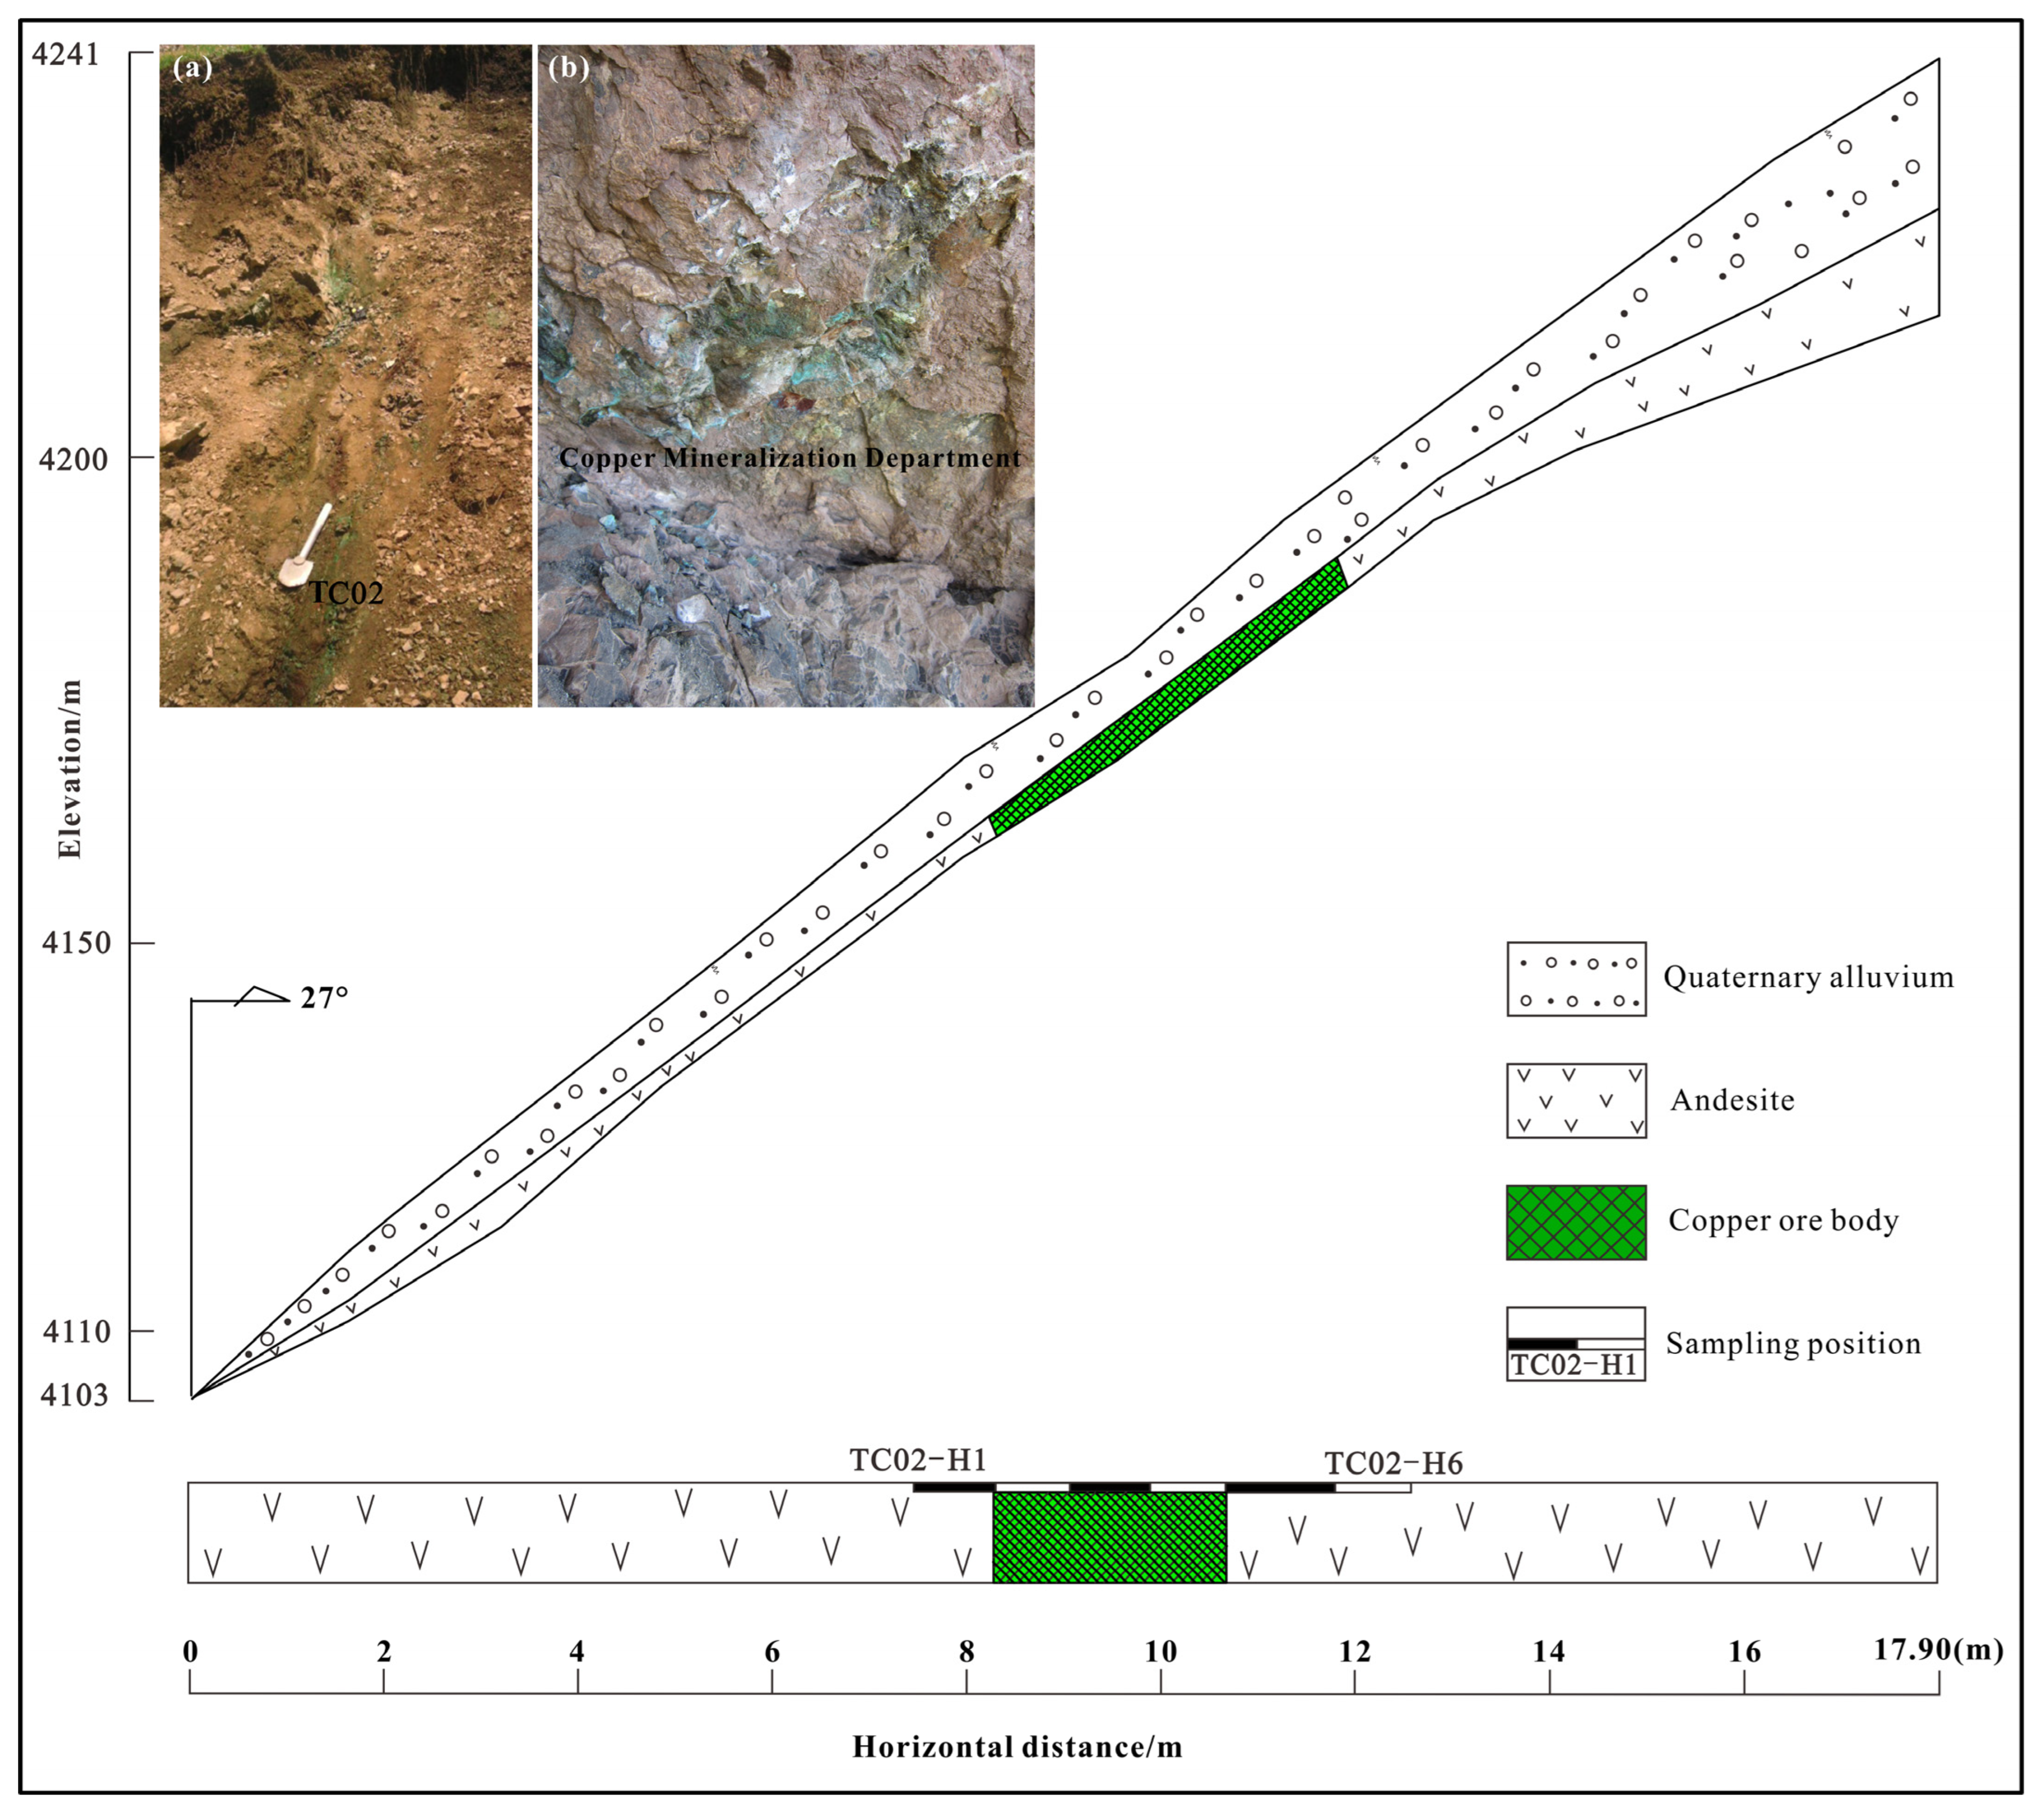
Drawing upon the geological context of the region, combined with the PC1 element associations derived from both the S-A and singularity models, three target zones for exploration prediction were defined. Validation work conducted within these areas led to the discovery of two copper ore bodies in the No. III target area, with Cu content reaching industrial-grade levels. The integrated use of the S-A model and singularity analysis has thus been demonstrated to be an effective methodological framework for the identification of geochemical anomalies.

Author Contributions

Conceptualization, Y.C., Z.H., and Y.L.; methodology, P.G.; software, S.C.; validation, Y.C., S.C., and P.G.; formal analysis, Y.C.; investigation, Y.C.; resources, Y.L.; data curation, Y.C.; writing—original draft preparation, Y.C.; writing—review and editing, Z.H. and Y.C.; visualization, Y.C.; supervision, Z.H.; project administration, Y.L.; funding acquisition, Y.L. All authors have read and agreed to the published version of the manuscript.

Funding

This study was funded by Gansu Provincial Science and Technology Program—Basic Research Program Project (No. 25JRRE012) and Key Laboratory of Upper Yellow River Strategic Mineral Resources, Ministry of Natural Resources (No. YSMRKF202412).

Data Availability Statement

The original contributions presented in this study are included in the article. Further inquiries can be directed to the corresponding author.

Acknowledgments

We thank the editors and reviewers for their critical and constructive comments and suggestions on this article. We thank Jianli Chen and Rongjun Si for their help in field sampling.

Conflicts of Interest

Author Peng Guo was employed by the company The First Geological Eeploration Institute of Henan Limited Company. The remaining authors declare that the research was conducted in the absence of any commercial or financial relationships that could be construed as a potential conflict of interest.

References

  1. Xie, X.; Mu, X.; Ren, T. Geochemical mapping in China. J. Geochem. Explor. 1997, 60, 99–113. [Google Scholar]
  2. Wu, S.Y. Analysis of the tension and mode of action of United States regional strategies: A case study of the impact of the Middle East strategy on the “Indo-Pacific strategy”. Northeast. Asia Forum 2024, 33, 61–77. [Google Scholar]
  3. Zuo, R.G. Identification of geochemical anomalies associated with mineralization in the Fanshan district, Fujian, China. J. Geochem. Explor. 2014, 139, 170–176. [Google Scholar] [CrossRef]
  4. Zhao, J.N.; Chen, S.Y.; Zuo, R.G. Identifying geochemical anomalies associated with Au-Cu mineralization using multifractal and artificial neural network models in the Ningqiang district, Shaanxi, China. J. Geochem. Explor. 2016, 164, 54–64. [Google Scholar] [CrossRef]
  5. Cheng, Q.M. Ideas and methods for Mineral resources integrated prediction in coverage areas. Earth Sci. J. China Univ. Geosci. 2012, 37, 1109–1125, (In Chinese with English Abstract). [Google Scholar]
  6. Zuo, R.G.; Xiong, Y.H. Geodata science and geochemical mapping. J. Geochem. Explor. 2020, 209, 106431. [Google Scholar] [CrossRef]
  7. Xie, X.J.; Wang, X.Q.; Zhang, Q.; Zhou, G.H.; Cheng, H.X.; Liu, D.W.; Cheng, Z.Z.; Xu, S.F. Multi-scale geochemical mapping in China. Geochem. Explor. Environ. Anal. 2008, 8, 333–341. [Google Scholar] [CrossRef]
  8. Cheng, Q.M. Modeling local scaling properties for multiscale mapping. Vadose Zone J. 2007, 7, 525–532. [Google Scholar] [CrossRef]
  9. Zuo, R.G. Identifying geochemical anomalies associated with Cu and Pb-Zn skarn mineralization using principal component analysis and spectrum–area fractal modeling in the Gangdese Belt, Tibet (China). J. Geochem. Explor. 2011, 111, 13–22. [Google Scholar] [CrossRef]
  10. Pérez-Fernández, R.; Gagolewski, M.; De-Baets, B. On the aggregation of compositional data. Inf. Fusion 2021, 73, 103–110. [Google Scholar] [CrossRef]
  11. Wei, Y.; Wang, H.; Wang, S.; Saporta, G. Incremental modelling for compositional data streams. Commun. Stat.-Simul. Comput. 2019, 48, 2229–2243. [Google Scholar] [CrossRef]
  12. Aitchison, J. The statistical analysis of compositional data. J. R. Stat. Soc. B (Stat. Methodol.) 1982, 44, 139–177. [Google Scholar] [CrossRef]
  13. Aitchison, J. The Statistical Analysis of Compositional Data; Chapman and Hall: London, UK, 1986; pp. 1–416. [Google Scholar]
  14. Egozcue, J.J.; Pawlowsky-Glahn, V.; Gloor, G.B. Linear association in compositional data analysis. Austrian J. Stat. 2018, 47, 3–31. [Google Scholar] [CrossRef]
  15. Pawlowsky-Glahn, V.; Egozcue, J.J. Compositional data and their analysis: An introduction. Geol. Soc. Lond. Spec. Publ. 2006, 264, 1–10. [Google Scholar] [CrossRef]
  16. Pawlowsky-Glahn, V.; Egozcue, J.J. The closure problem: One hundred years of debate. In Proceedings of the Mining Príbram Symposium. Section: Mathematical Methods in Geology, Prague, Czech Republic, 10–14 October 2011; pp. 10–14. [Google Scholar]
  17. Cheng, Q.M. Multifractal theory and geochemical element distribution pattern. Earth Sci. J. China Univ. Geosci. 2000, 3, 311–318, (In Chinese with English Abstract). [Google Scholar]
  18. Xiao, F.; Chen, J.G.; Zhang, Z.Y.; Wang, C.B.; Wu, G.M.; Agterberg, F.P. Singularity mapping and spatially weighted principal component analysis to identify geochemical anomalies associated with Ag and Pb-Zn polymetallic mineralization in Northwest Zhejiang, China. J. Geochem. Explor. 2012, 122, 90–100. [Google Scholar] [CrossRef]
  19. Zuo, R.G.; Carranza, E.J.M.; Wang, J. Spatial analysis and visualization of exploration geochemical data. Earth-Sci. Rev. 2016, 158, 9–18. [Google Scholar] [CrossRef]
  20. Zuo, R.G. Exploring the effects of cell size in geochemical mapping. J. Geochem. Explor. 2012, 112, 357–367. [Google Scholar] [CrossRef]
  21. Wang, J.; Zhou, Y.Z.; Xiao, F. Identification of multi-element geochemical anomalies using unsupervised machine learning algorithms: A case study from Ag-Pb-Zn deposits in north-western Zhejiang, China. Appl. Geochem. 2020, 120, 104679. [Google Scholar] [CrossRef]
  22. Xie, S.Y.; Bao, Z.Y. Fractal and multifractal properties of geochemical fields. Math. Geol. 2004, 36, 847–864. [Google Scholar] [CrossRef]
  23. Wang, W.L.; Zhao, J.; Cheng, Q.M. Mapping of Fe mineralization associated geochemical signatures using logratio transformed stream sediment geochemical data in eastern Tianshan, China. J. Geochem. Explor. 2014, 141, 6–14. [Google Scholar] [CrossRef]
  24. Wang, J.; Zuo, R.G. A MATLAB-based program for processing geochemical data using fractal/multifractal modeling. Earth Sci. India 2015, 8, 937–947. [Google Scholar] [CrossRef]
  25. Cheng, Q.M.; Agterberg, F.P.; Ballantyne, S.B. The separation of geochemical anomalies from background by fractal methods. J. Geochem. Explor. 1994, 51, 109–130. [Google Scholar] [CrossRef]
  26. Carranza, E.J.M. Mapping of anomalies in continuous and discrete fields of stream sediment geochemical landscapes. Geochem. Explor. Environ. Anal. 2010, 10, 171–187. [Google Scholar] [CrossRef]
  27. Carranza, E.J.M. Analysis and mapping of geochemical anomalies using logratio-transformed stream sediment data with censored values. J. Geochem. Explor. 2011, 110, 167–185. [Google Scholar] [CrossRef]
  28. Cheng, Q.M. Spatial and scaling modelling for geochemical anomaly separation. J. Geochem. Explor. 1999, 65, 175–194. [Google Scholar] [CrossRef]
  29. Cheng, Q.M. Mapping singularities with stream sediment geochemical data for prediction of undiscovered mineral deposits in Gejiu, Yunnan Province, China. Ore Geol. Rev. 2007, 32, 314–324. [Google Scholar] [CrossRef]
  30. Cheng, Q.M. Singularity theory and methods for mapping geochemical anomalies caused by buried sources and for predicting undiscovered mineral deposits in covered areas. J. Geochem. Explor. 2012, 122, 55–70. [Google Scholar] [CrossRef]
  31. Xie, S.Y.; Cheng, Q.M.; Chen, G.; Chen, Z.J.; Bao, Z.Y. Application of local singularity in prospecting potential oil/gas targets. Nonlinear Process. Geophys. 2007, 14, 285–292. [Google Scholar]
  32. Cheng, Q.M. A new model for quantifying anisotropic scale invariance and for decomposition of mixing patterns. Math. Geol. 2004, 36, 345–360. [Google Scholar] [CrossRef]
  33. Cheng, Q.M. Measurement of the singularity of geological anomalies and identification of mineral-causing anomalies from hidden sources. Earth Sci. J. China Univ. Geosci. 2011, 36, 307–316, (In Chinese with English Abstract). [Google Scholar]
  34. Jiang, X.J.; Chen, X.; Gao, S.B.; Zheng, Y.Y.; Ren, H.; Han, D.H.; Yan, C.C.; Jiang, J.S. A new discovery of Ag-Pb-Zn mineralization via modern portable analytical technology and stream sediment data processing methods in Dajiacuo Area, Western Tibet (China). J. Earth Sci. 2020, 31, 668–682. [Google Scholar] [CrossRef]
  35. Chen, X.; Xu, R.K.; Zheng, Y.Y.; Jiang, X.J.; Du, W.Y. Identifying potential Au-Pb-Ag mineralization in SE Shuangkoushan, North Qaidam, Western China: Combined log-ratio approach and singularity mapping. J. Geochem. Explor. 2018, 189, 109–121. [Google Scholar] [CrossRef]
  36. Liu, Y.; Cheng, Q.M.; Carranza, E.J.M.; Zhou, K.F. Assessment of Geochemical Anomaly Uncertainty Through Geostatistical Simulation and Singularity Analysis. Nat. Resour. Res. 2019, 8, 199–212. [Google Scholar] [CrossRef]
  37. Xu, S.; Hu, X.Y.; Carranza, E.J.M.; Wang, G.W. Multi-parameter Analysis of Local Singularity Mapping and Its Application to Identify Geochemical Anomalies in the Xishan Gold Deposit, North China. Nat. Resour. Res. 2020, 29, 3425–3442. [Google Scholar] [CrossRef]
  38. Zhang, Z.C.; Mao, J.W.; Yang, J.M.; Wu, M.B.; Zuo, G.C. Geology and Geochemistry of Volcanic Rocks of the Early Ordovician Yingou Group in the Western Part of North Qilian Mountain and Their Tectonic Setting. J. Petromineral. 1997, 16, 2–10, (In Chinese with English Abstract). [Google Scholar]
  39. Huang, X.F. Study on Crustal-Scale Deformation in Tectonic the Tectonic Transition Zone in Qilian Shan, the Northern Margin of the Qinghai-Tibetan Plateau. Ph.D. Thesis, Beijing Chinese Academy of Geological Sciences, Beijing, China, 2017. (In Chinese with English Abstract). [Google Scholar]
  40. Fu, D.; Kusky, T.; Wilde, S.A.; Polat, A.; Huang, B.; Zhou, Z. Early Paleozoic collision-related magmatism in the eastern North Qilian orogen, northern Tibet: A linkage between accretionary and collisional orogenesis. Bulletin 2019, 131, 1031–1056. [Google Scholar] [CrossRef]
  41. Song, S.G.; Niu, Y.L.; Su, L.; Xia, X.H. Tectonics of the north Qilian orogen, NW China. Gondwana Res. 2013, 23, 1378–1401. [Google Scholar] [CrossRef]
  42. Fu, D. Early Paleozoic Accretionary Orogenesis and Crustal Evolution of the Eastern North Qilian Orogenic Belt. Ph.D. Thesis, Wuhan China University of Geosciences, Wuhan, China, 2020. (In Chinese with English Abstract). [Google Scholar]
  43. Cong, Z.C. Study on the Metallogenic Law of Copper Polymetallic Deposits in North Qilian, Qinghai. Ph.D. Thesis, Jilin University, Changchun, China, 2017. (In Chinese with English Abstract). [Google Scholar]
  44. Gao, Y.L.; Long, X.P.; Luo, J.; Dong, Y.P.; Lan, C.Y.; Huang, Z.Y.; Zhao, J. Provenance and Hf isotopic variation of Precambrian detrital zircons from the Qilian Orogenic Belt, NW China: Evidence to the transition from breakup of Columbia to the assembly of Rodinia. Precambrian Res. 2021, 357, 106153. [Google Scholar] [CrossRef]
  45. Chen, S.; Niu, Y.L.; Xue, Q.Q. Syn-collisional felsic magmatism and continental crust growth: A case study from the North Qilian Orogenic Belt at the northern margin of the Tibetan Plateau. Lithos 2018, 308, 53–64. [Google Scholar] [CrossRef]
  46. Filzmoser, P.; Hron, K.; Templ, M. Applied Compositional Data Analysis; Springer International Publishing: Cham, Switzerland, 2018; pp. 1–5. [Google Scholar]
  47. Egozcue, J.J.; Lovell, D.; Pawlowsky-Glahn, V. Testing compositional association. In Proceedings of the 5th International Workshop on Compositional Data Analysis, Vorau, Austria, 3–7 June 2013; pp. 28–36. [Google Scholar]
  48. Zuo, R.G.; Xia, Q.L.; Wang, H.C. Compositional data analysis in the study of integrated geochemical anomalies associated with mineralization. Appl. Geochem. 2013, 28, 202–211. [Google Scholar] [CrossRef]
  49. Zuo, R.G. Identification of weak geochemical anomalies using robust neighborhood statistics coupled with GIS in covered areas. J. Geochem. Explor. 2014, 136, 93–101. [Google Scholar] [CrossRef]
  50. Liu, Y.; Cheng, Q.M.; Xia, Q.L.; Wang, X.Q. Application of singularity analysis for mineral potential identification using geochemical data—A case study: Nanling W-Sn-Mo polymetallic metallogenic belt, South China. J. Geochem. Explor. 2013, 134, 61–72. [Google Scholar] [CrossRef]
  51. Zuo, R.G.; Xia, Q.L.; Zhang, D.J. A comparison study of the C–A and S–A models with singularity analysis to identify geochemical anomalies in covered areas. Appl. Geochem. 2013, 33, 165–172. [Google Scholar] [CrossRef]
  52. Pesenson, M.Z.; Suram, S.K.; Gregoire, J.M. Statistical Analysis and Interpolation of Compositional Data in Materials Science. Acs Comb. Sci. 2015, 17, 130–136. [Google Scholar] [CrossRef]
  53. Egozcue, J.J.; Pawlowsky-Glahn, V.; Mateu-Figureas, G.; Barcelo-Vidal, C. Isometric logratio transformations for compositional data analysis. Math. Geol. 2003, 35, 279–300. [Google Scholar] [CrossRef]
  54. Tang, R.; Sun, L.; Ouyang, F.; Xiao, K.; Li, C.; Kong, Y.; Xie, M.; Wu, Y.; Gao, Y. CoDA-Based Geo-Electrochemical Prospecting Prediction of Uranium Orebodies in Changjiang Area, Guangdong Province, China. Minerals 2024, 14, 15. [Google Scholar] [CrossRef]
  55. Filzmoser, P.; Hron, K.; Reimann, C.; Garrett, R. Robust factor analysis for compositional data. Comput. Geosci. 2009, 35, 1854–1861. [Google Scholar] [CrossRef]
  56. Zuo, R.G.; Wang, J.L. ArcFractal: An ArcGIS add-in for processing geoscience data using fractal/multifractal models. Nat. Resour. Res. 2020, 29, 3–12. [Google Scholar] [CrossRef]
  57. Cheng, Q.M. Multifractal imaging filtering and decomposition methods in space, Fourier frequency, and eigen domains. Nonlinear Process. Geophys. 2007, 14, 293–303. [Google Scholar] [CrossRef]
  58. Cheng, Q.M. Non-linear theory and power-law models for information integration and mineral resources quantitative assessments. Math. Geosci. 2008, 40, 503–532. [Google Scholar] [CrossRef]
  59. Zuo, R.G.; Agterberg, F.P.; Cheng, Q.M.; Yao, L.Q. Fractal characterization of the spatial distribution of geological point processes. Int. J. Appl. Earth Obs. Geoinf. 2009, 11, 394–402. [Google Scholar] [CrossRef]
  60. Agterberg, F.P. Multifractals and geostatistics. J. Geochem. Explor. 2012, 122, 113–122. [Google Scholar] [CrossRef]
  61. Wu, D.; Luo, X. Robust Latent Factor Analysis for Precise Representation of High-Dimensional and Sparse Data. IEEE/CAA J. Autom. Sin. 2021, 8, 796–805. [Google Scholar] [CrossRef]
  62. Li, C.; Zhou, K.F.; Gao, W.; Luo, X.R.; Tao, Z.H.; Liu, P.F.; Qiu, W. Geochemical prospectivity mapping using compositional balance analysis and multifractal modeling: A case study in the Jinshuikou area, Qinghai, China. J. Geochem. Explor. 2004, 257, 107361. [Google Scholar] [CrossRef]
Figure 1. (a) Tectonic map with location of the study area and (b) regional geological and metallogenic map around the study area.
Minerals 15 00585 g001
Figure 2. Geological sketch map of the study area and map of soil geochemical sampling points in the natural gully system.
Minerals 15 00585 g002
Figure 3. Histograms of Cu (ac) and Au (df) raw data, logarithm, and ilr data transformation.
Minerals 15 00585 g003
Figure 4. Histograms of As and Sb raw data (ac), logarithm (df), and ilr data transformation (c).
Minerals 15 00585 g004
Figure 5. Q-Q plots of Cu (ac) and Au (df) raw data, logarithm and ilr data.
Minerals 15 00585 g005
Figure 6. Histograms of As (ac) and Sb (df) raw data, logarithm, and ilr data transformation.
Minerals 15 00585 g006
Figure 7. Cumulative contribution of PCA variance to the three types of data.
Minerals 15 00585 g007
Figure 8. PCA plots of raw data (a), logarithm (b), and ilr data (c).
Minerals 15 00585 g008
Figure 9. Score plot of PC1 for ilr transformation data.
Minerals 15 00585 g009
Figure 10. Double-logarithmic plot of S-A spectral density of PC1 transformed by ilr data.
Minerals 15 00585 g010
Figure 11. S-A decomposition PC1 anomaly (a) and PC1 background (b).
Minerals 15 00585 g011
Figure 12. Prospecting prediction target, and anomaly verification diagram in the study area.
Minerals 15 00585 g012
Figure 13. Trench TC02 engineering sketch map. Trench TC02 construction photos (a) and photos of the copper mine body (b).
Minerals 15 00585 g013
Table 1. Statistics of elemental parameters of geochemical data.
ParameterAuCuFeMnNiPbZnAsSb
Raw dataMaximum52.9603.19.421922123.8103.6387.3378.246.39
Minimum0.519.32.874479.52.543.15.80.4
Average value2.343.44.68763919.989.331.42.01
Lower quartile1.233.84.17578634.617.678.4161.01
Median1.838.84.46785537.419.385.421.81.29
Upper quartile2.546.74.93293641.22194.832.91.92
Coefficient1.220.610.150.170.230.290.281.131.54
Standard deviation2.826.340.7152.899.015.7125.1435.453.1
Enrichment 1.641.811.351.461.50.871.313.142.51
Kurtosis181.21319.684.426.7127.6493.8852.2235.9387.15
Skewness11.3615.391.281.564.027.615.895.238.08
Log-dataStandard deviation0.260.130.060.070.080.090.090.270.27
Kurtosis2.3310.411.352.4210.9224.0711.932.34.83
Skewness0.661.780.50.41.020.132.21.171.76
ilr-dataStandard deviation0.560.30.190.210.210.230.230.550.53
Kurtosis1.226.33.836.067.9614.698.811.973.51
Skewness0.370.930.941.070.090.890.3911.47
Note: Au content (×10−9) and other element content (×10−6) are mass fractions; coefficient of variation = standard deviation/mean.
Table 2. Analysis results of trench samples in the study area.
Project NumberSample NumberSample Length/mAnalyze the Results
Cu/%
TC1TC1-H911.26
TC2TC2-H211.63
TC2-H312.30
TC2-H411.30
Disclaimer/Publisher’s Note: The statements, opinions and data contained in all publications are solely those of the individual author(s) and contributor(s) and not of MDPI and/or the editor(s). MDPI and/or the editor(s) disclaim responsibility for any injury to people or property resulting from any ideas, methods, instructions or products referred to in the content.

