
Gemological Characteristics and Coloration Mechanism of Vanadium-Bearing Beryl from Nigeria


Abstract
1. Introduction
2. Materials and Methods
2.1. Materials
2.2. Methods
3. Results
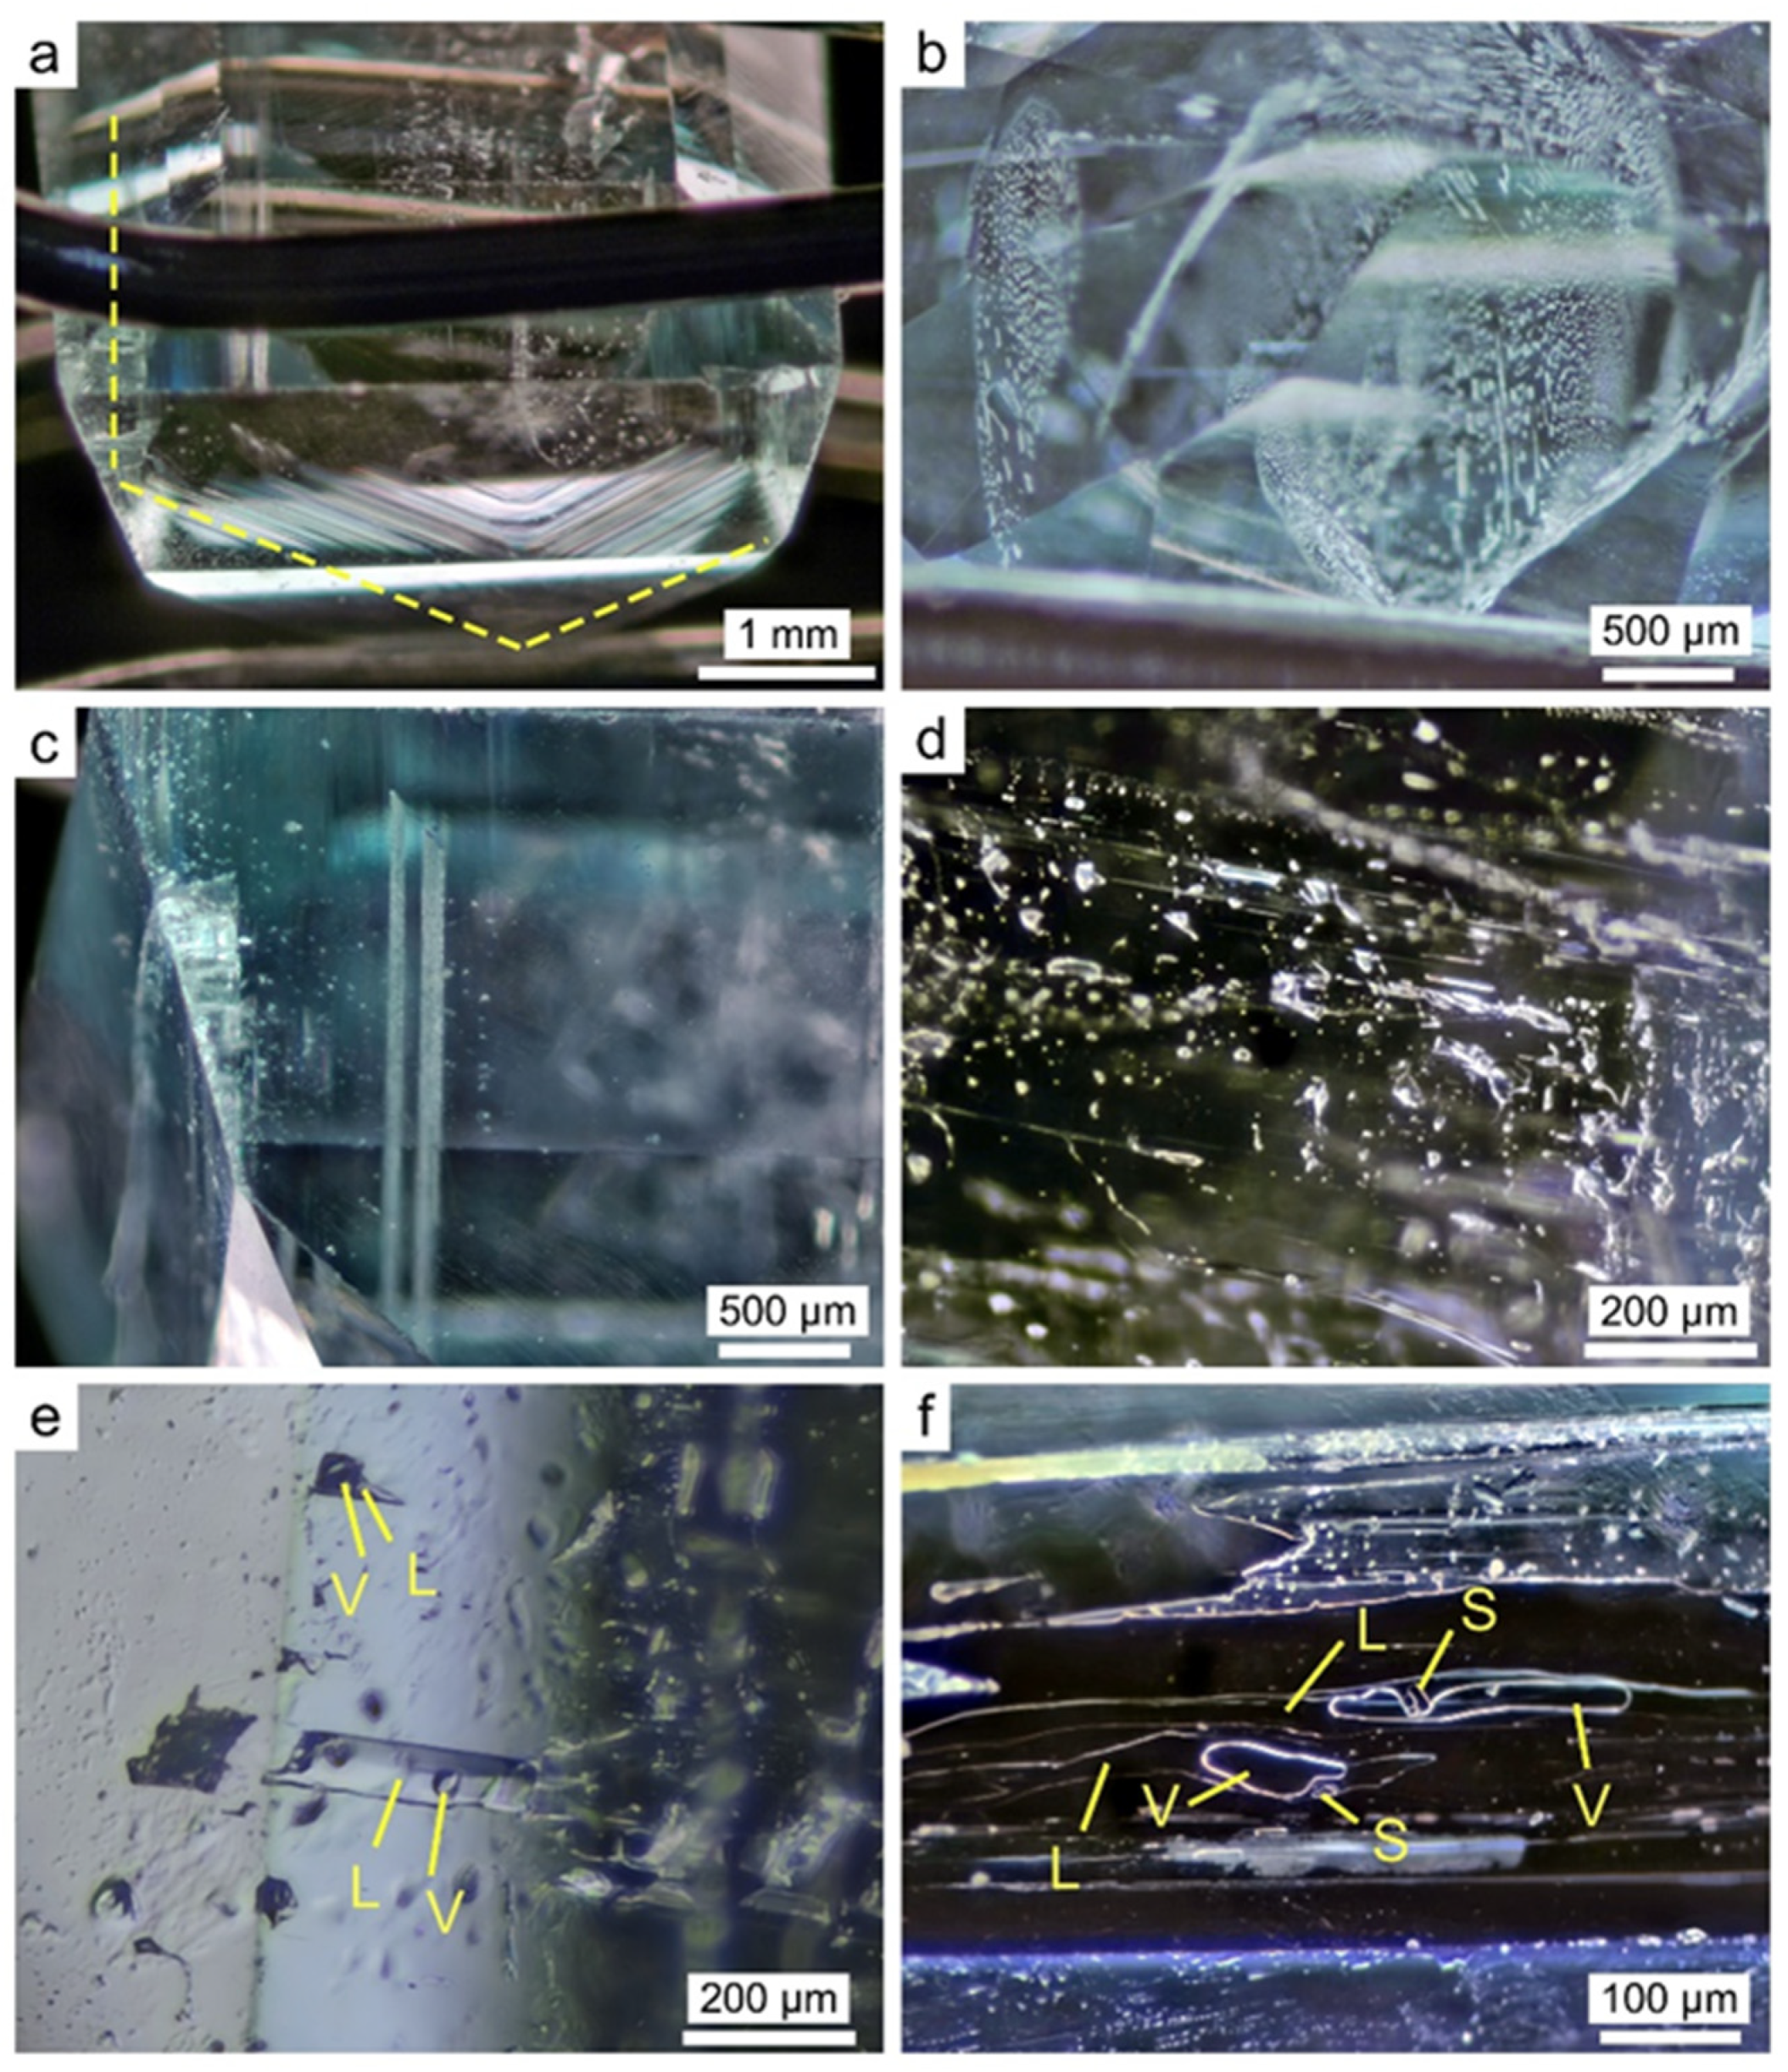
3.1. Standard Gemological Methods
3.2. X-Ray Fluorescence Spectroscopy
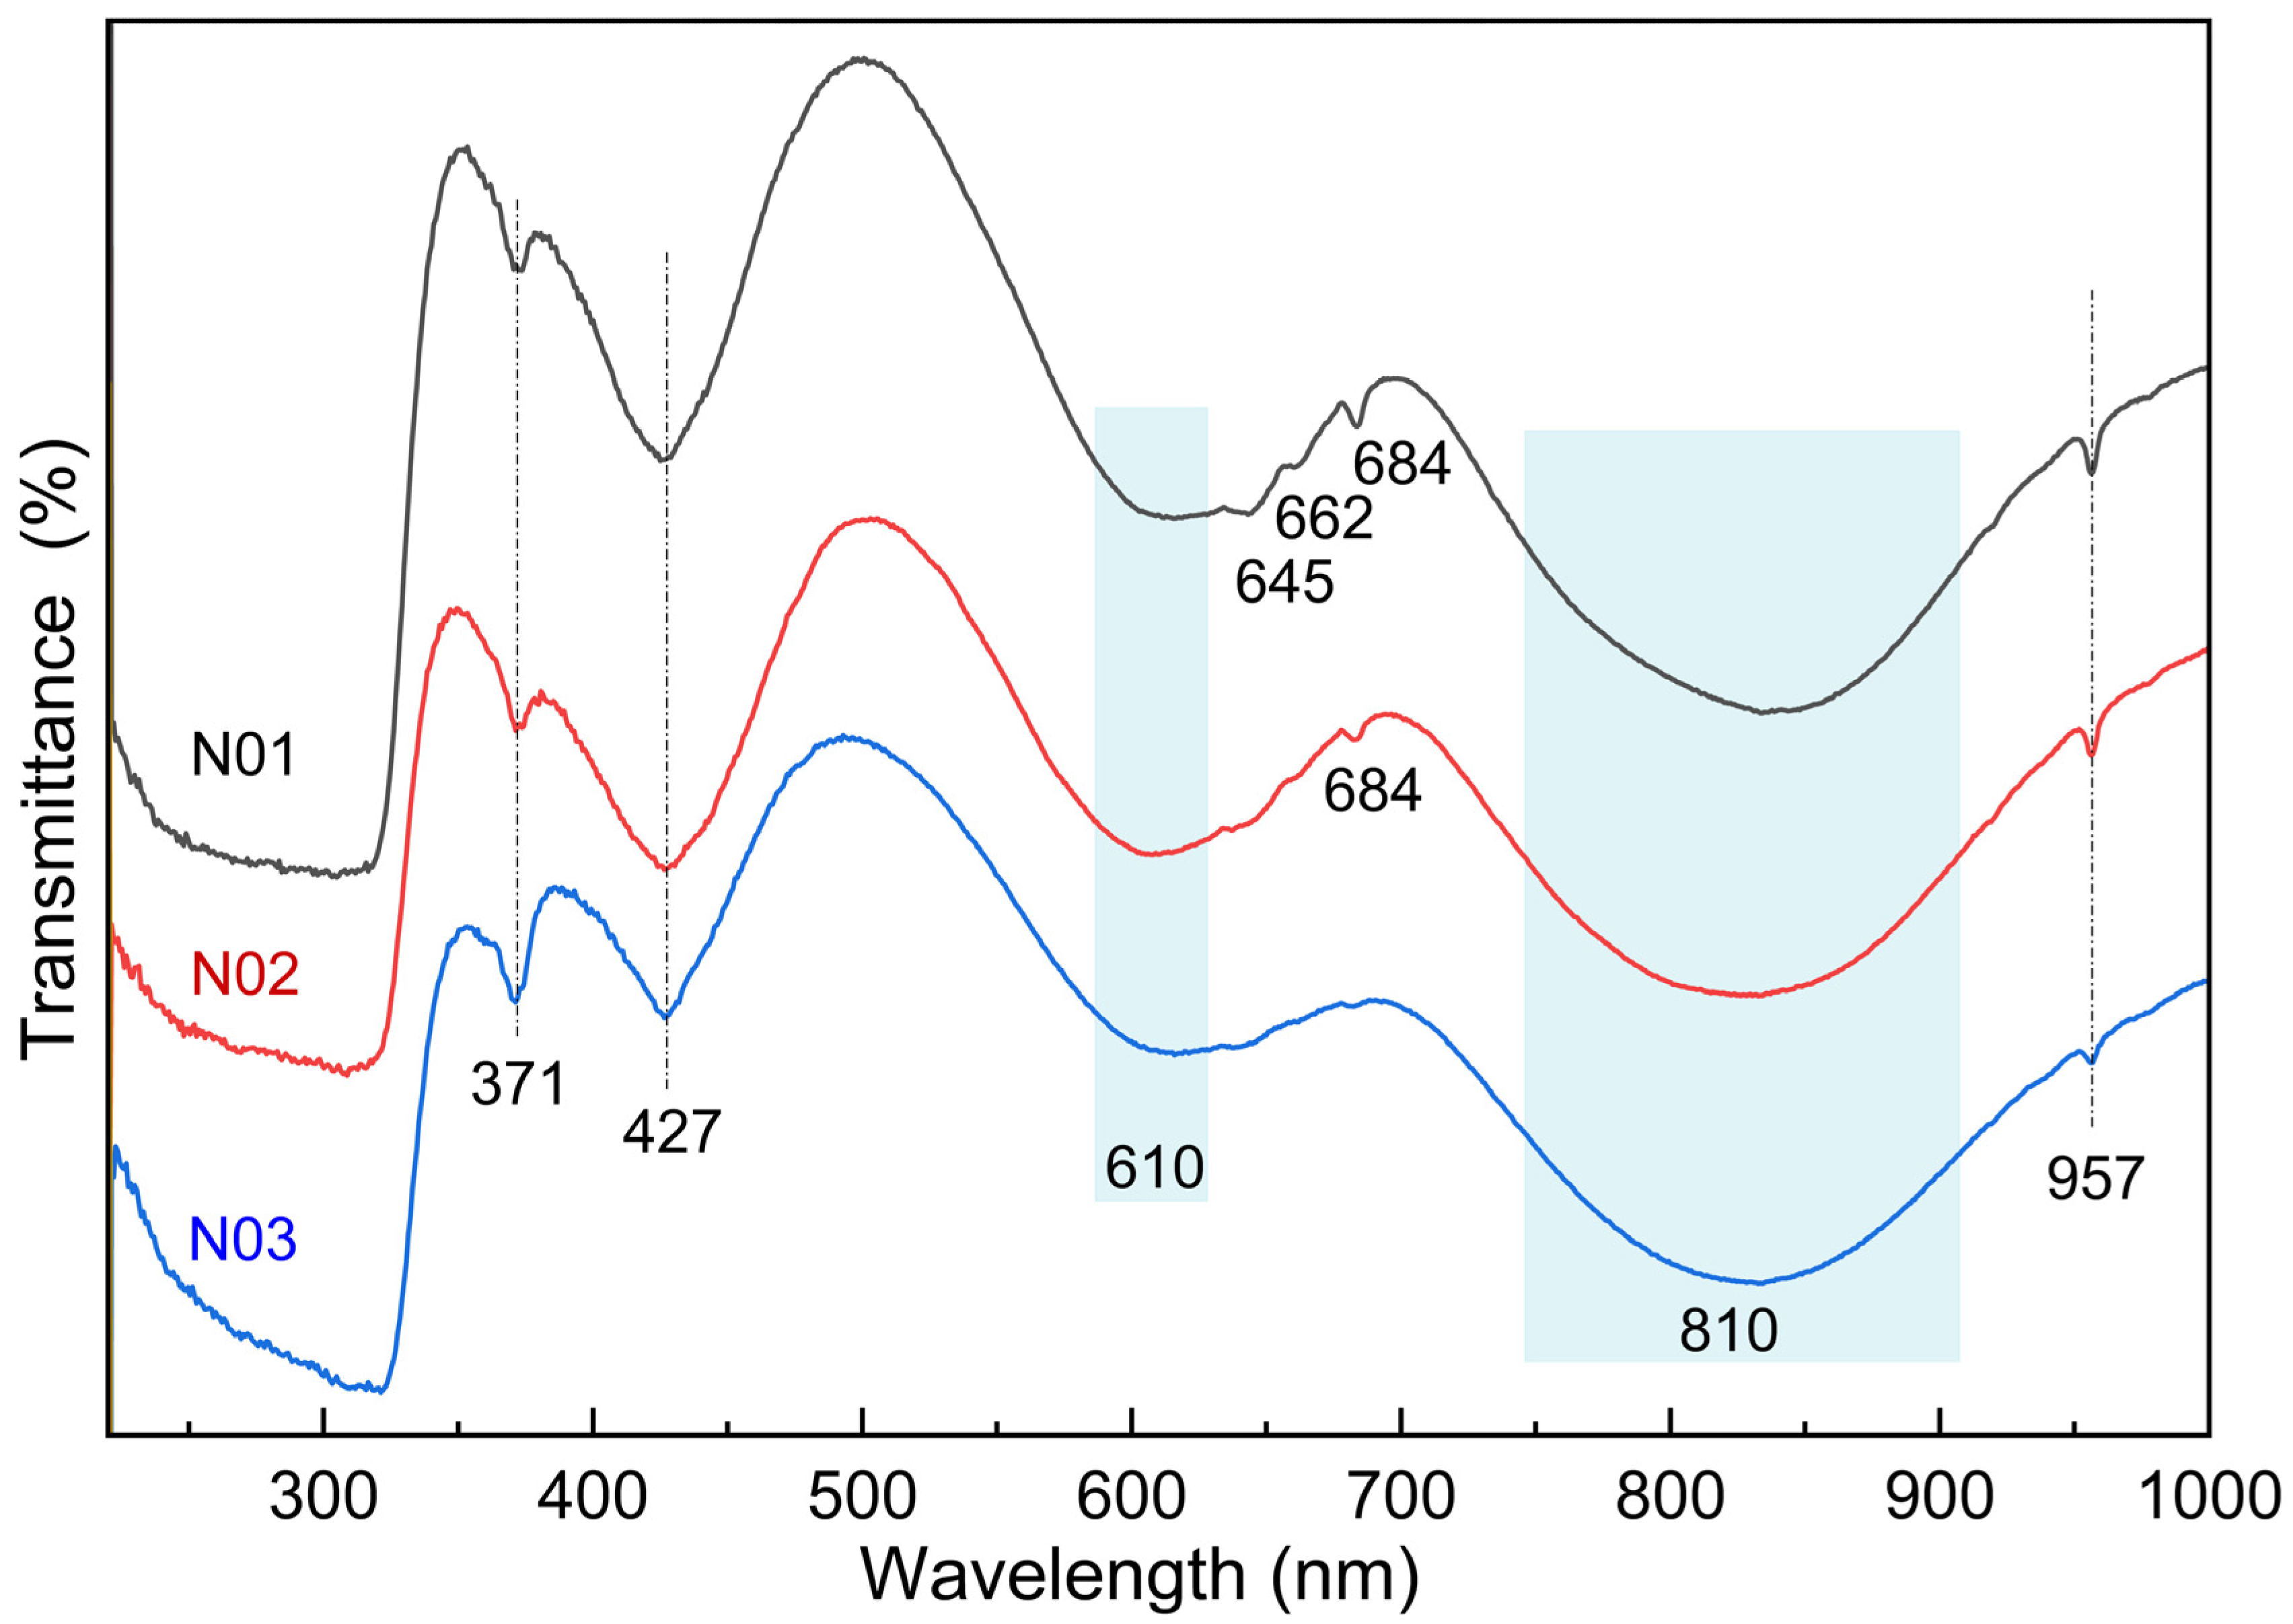
3.3. UV-Vis-NIR Spectra
3.4. IR Spectral Characteristics
3.4.1. IR Spectra Measured by the Reflection Method
3.4.2. IR Spectra Measured by the Transmission Method
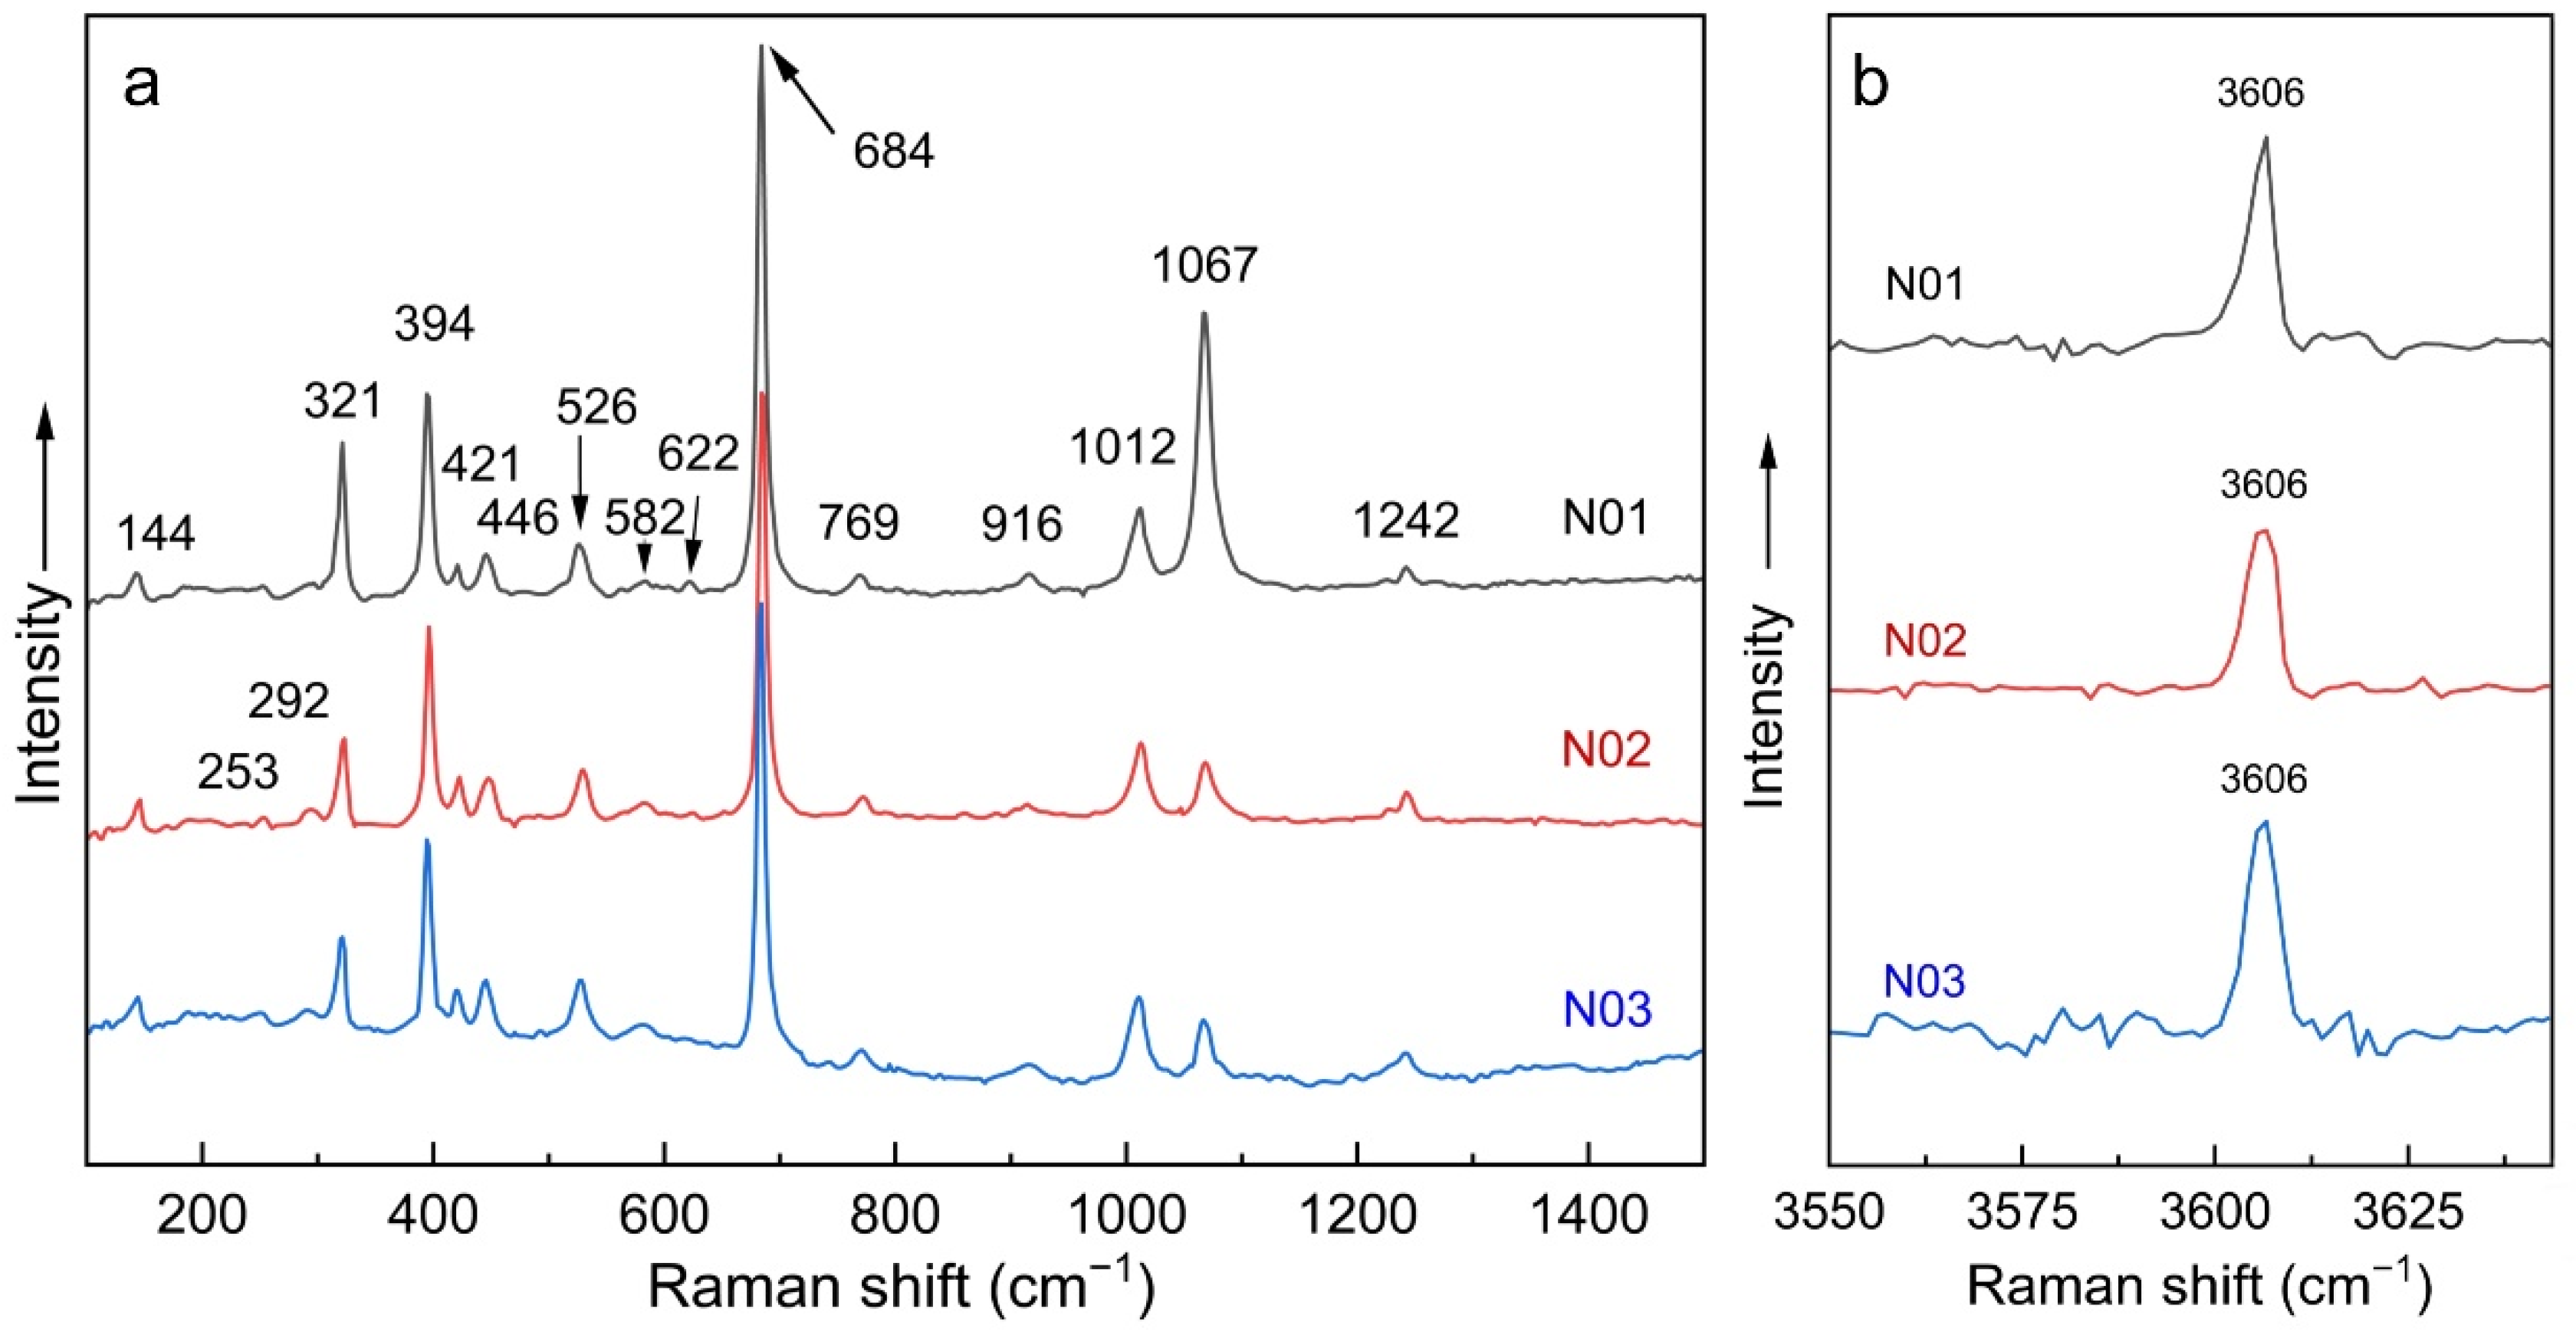
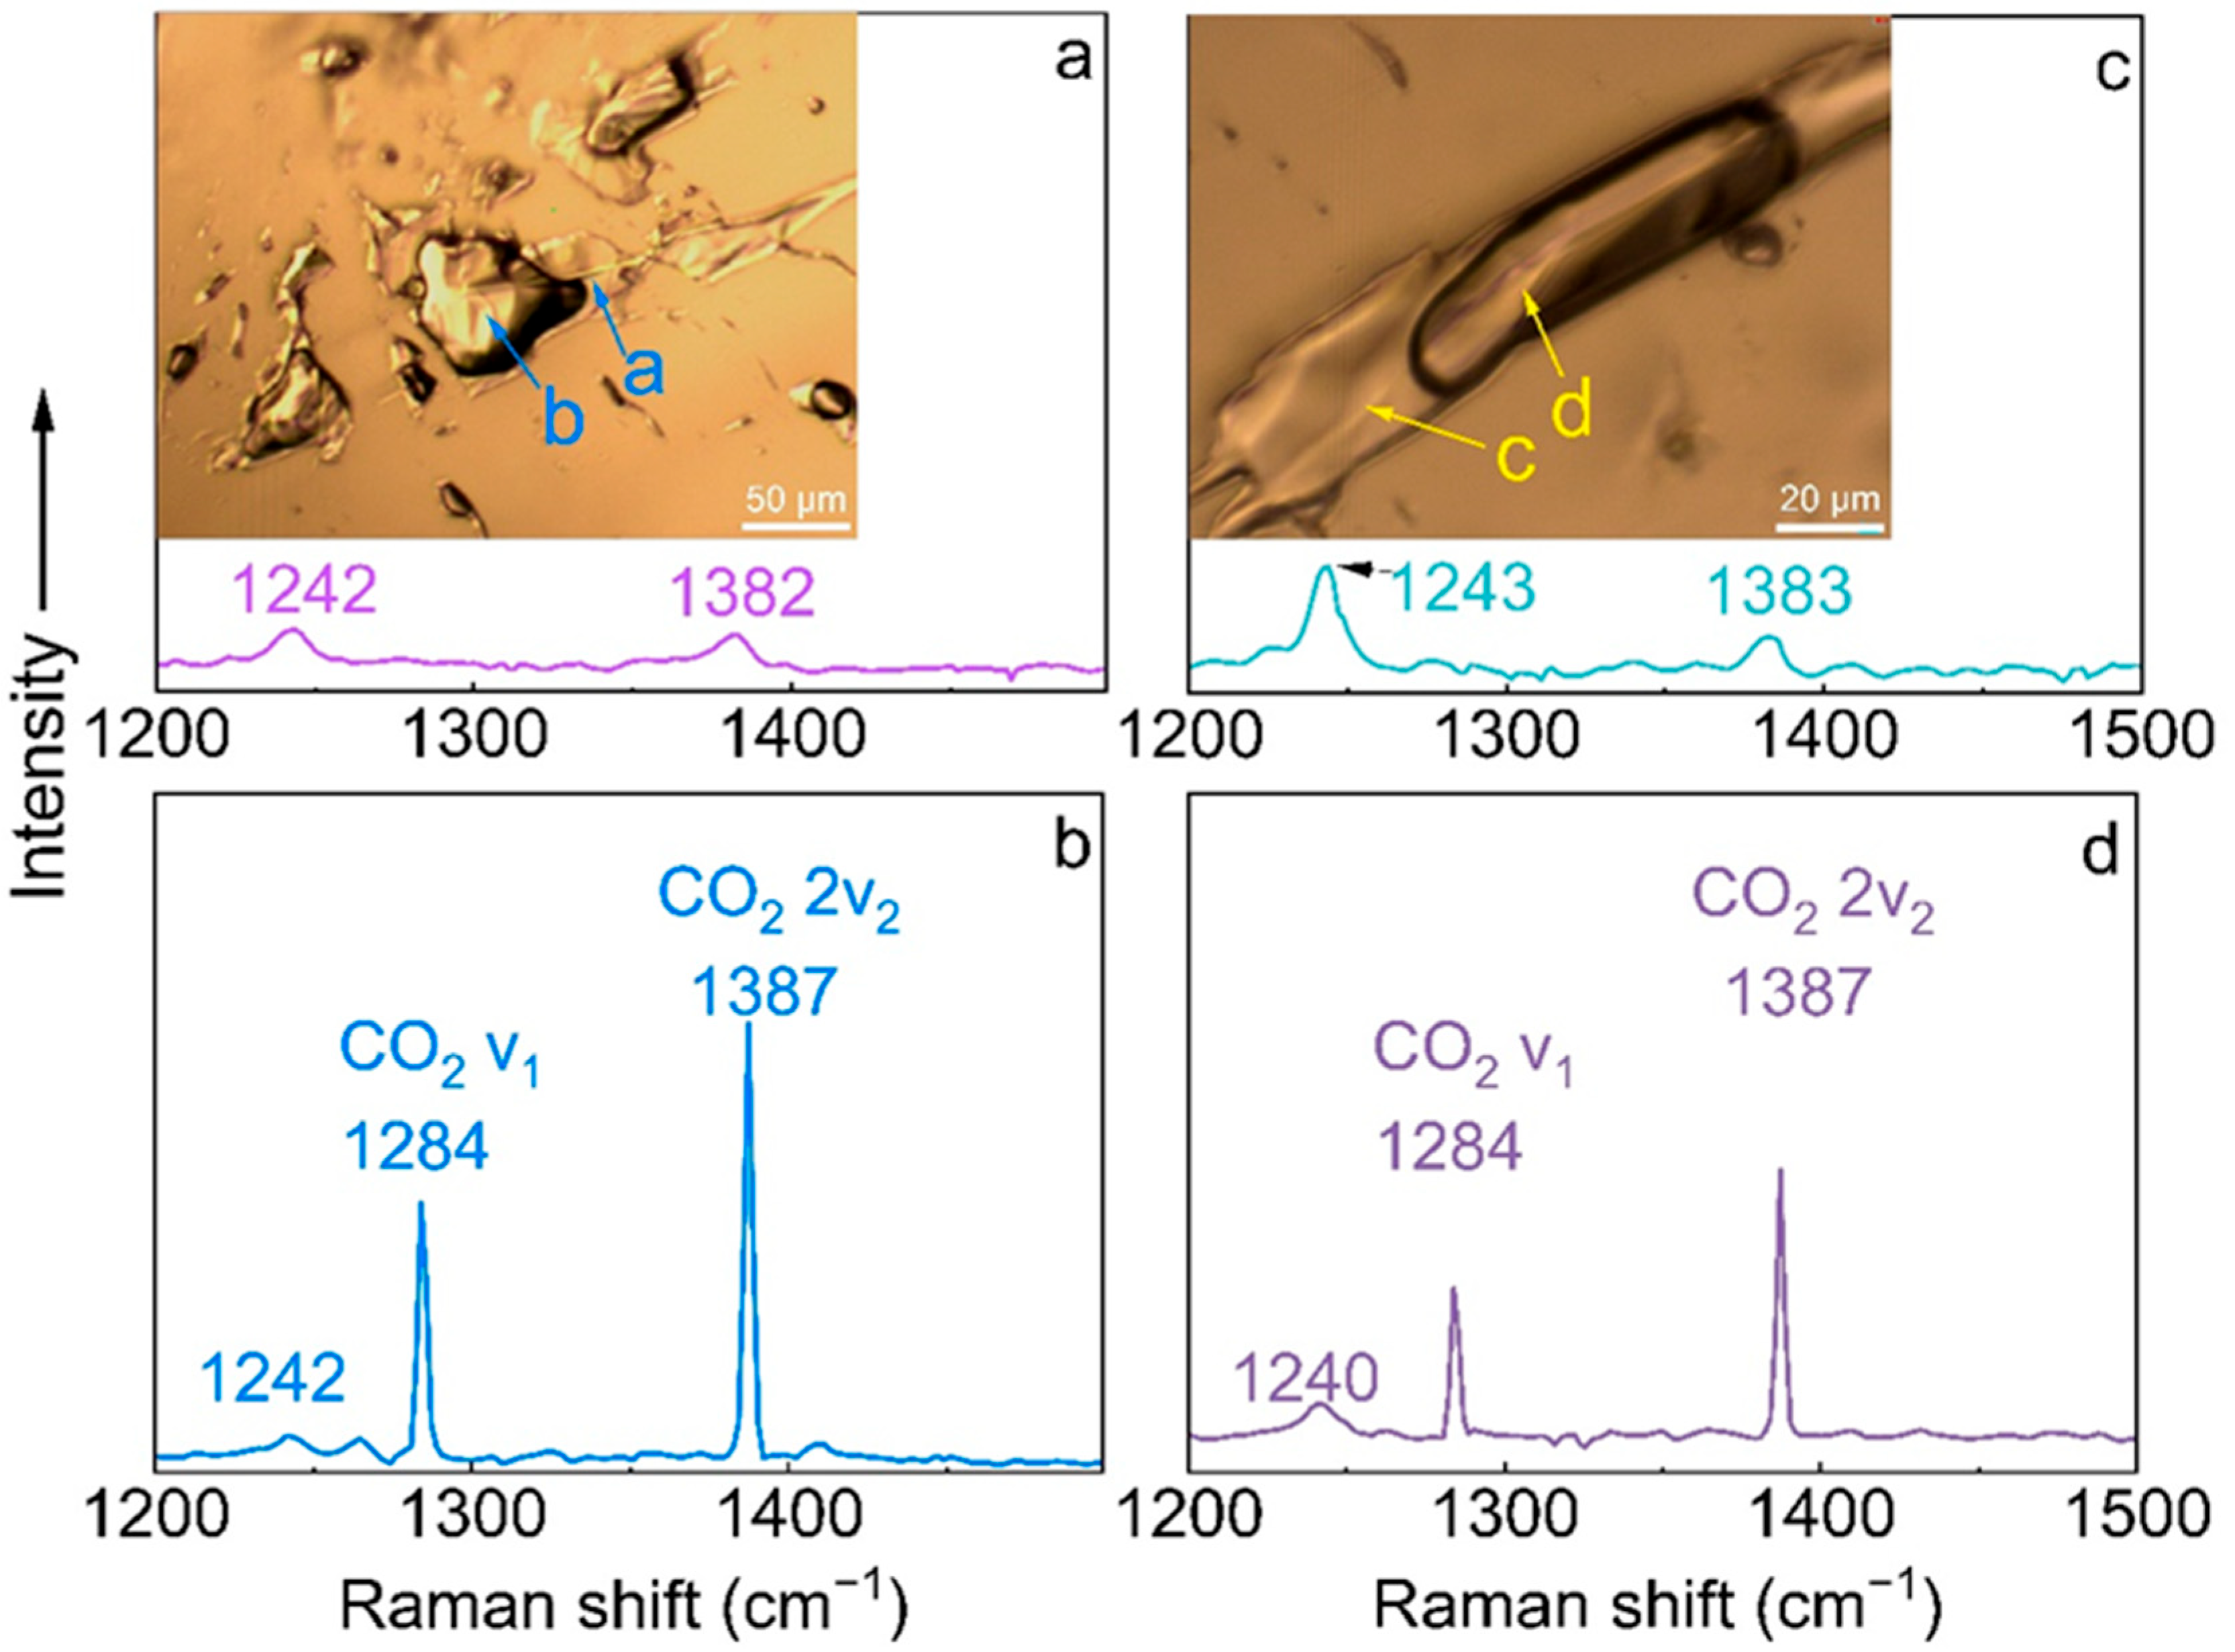
3.5. Raman Spectroscopy
4. Discussion
4.1. Compositional Characterization of Vanadium-Bearing Beryl from Nigeria
4.2. Gemological Characteristics
4.3. Unique “Electro-Optical” Green Mechanism
5. Conclusions
Author Contributions
Funding
Data Availability Statement
Acknowledgments
Conflicts of Interest
References
- Aurisicchio, C.; Fioravanti, G.; Grubessi, O.; Zanazzi, P. Reappraisal of the crystal chemistry of beryl. Am. Mineral. 1988, 73, 826–837. [Google Scholar]
- Artioli, G.; Rinaldi, R.; Stahl, K.; Zanazzi, P.F. Structure refinements of beryl by single-crystal neutron and X-ray diffraction. Am. Mineral. 1993, 78, 762–768. [Google Scholar]
- Charoy, B.; Donato, P.D.; Barres, O.; Pinto-Coelho, C. Channel occupancy in an alkali-poor beryl from Serra Branca (Goias, Brazil): Spectroscopic characterization. Am. Mineral. 1996, 81, 395–403. [Google Scholar] [CrossRef]
- Deer, W.A.; Howie, R.A.; Zussman, J. Rock-Forming Minerals, Vol. 1B. Disilicates and Ring Silicates; Longman Scientific and Technical: Harlow, UK, 1986. [Google Scholar]
- Aurisicchio, C.; Grubessi, O.; Zecchini, P. Infrared spectroscopy and crystal chemistry of the beryl group. Can. Mineral. 1994, 32, 55–68. [Google Scholar]
- Bunnag, N.; Kasri, B.; Setwong, W.; Sirisurawong, E.; Chotsawat, M.; Chirawatkul, P.; Saiyasombat, C. Study of Fe ions in aquamarine and the effect of dichroism as seen using UV–Vis, NIR and x-ray. Radiat. Phys. Chem. 2020, 177, 109107. [Google Scholar] [CrossRef]
- Hanser, C.S.; Häger, T.; Botcharnikov, R. Incorporation and substitution of ions and H2O in the structure of beryl. Eur. J. Mineral. 2024, 36, 449–472. [Google Scholar] [CrossRef]
- Zhang, Y.; Shi, G.; Hao, Y. Non-destructive and quick differentiation between loupe-clean low-alkali natural and hydrothermal synthetic aquamarines: Constraints of infrared spectroscopy. J. Solid State Chem. 2024, 340, 125044. [Google Scholar] [CrossRef]
- Idina, A.; Argazzi, R.; Frau, F.; Fantauzzi, M.; Angeli, C. Unravelling the luminescence spectrum of garnet grossular var. tsavorite: The role of chromium (III), manganese (II) and misattribution of vanadium (II). J. Lumin. 2025, 277, 120936. [Google Scholar] [CrossRef]
- Idini, A.; Angeli, C.; Frau, F.; Ennas, G.; Naitza, S.; De Giudici, G.B.; Argazzi, R. Mineralogical characterization of fluorescent grossular garnet var. tsavorite from Merelani Hills, Tanzania. Phys. Chem. Miner. 2023, 50, 9. [Google Scholar] [CrossRef]
- Schmetzer, K.; Krzemnicki, M.S.; Hainschwang, T. Natural and synthetic vanadium-bearing chrysoberyl. J. Gemmol. 2013, 33, 223–238. [Google Scholar] [CrossRef]
- Hu, Y.; Lu, R. Unique Vanadium-Rich Emerald from Malipo, China. Gems Gemol. 2019, 55, 338–352. [Google Scholar] [CrossRef]
- Zhen, Y.; Yu, X.; Xu, B.; Guo, H.; Yan, Y.; Zhang, Y.; Tang, J.; Zhao, S. A review of research on the emerald origin determination. Acta Petrol. Mineral. 2024, 43, 525–561, (In Chinese with English abstract). [Google Scholar]
- Taran, M.N.; Vyshnevskyi, O.A. Be, Fe2+-substitution in natural beryl: An optical absorption spectroscopy study. Phys. Chem. Miner. 2019, 46, 795–806. [Google Scholar] [CrossRef]
- Wood, D.L.; Nassau, K. The characterization of beryl and emerald by visible and infrared absorption spectroscopy. Am. Mineral. 1968, 53, 777–800. [Google Scholar]
- Don Goldman, S.; Rossman, G.R.; Parkin, K.M. Channel constituents in beryl. Phys. Chem. Miner. 1978, 3, 225–235. [Google Scholar] [CrossRef]
- Taran, M.N.; Dyar, M.D.; Khomenko, V.M. Spectroscopic study of synthetic hydrothermal Fe 3+-bearing beryl. Phys. Chem. Miner. 2018, 45, 489–496. [Google Scholar] [CrossRef]
- Fridrichová, J.; Bačík, P.; Rusinová, P.; Antal, P.; Škoda, R.; Bizovská, V.; Miglierini, M. Optical and crystal-chemical changes in aquamarines and yellow beryls from Thanh Hoa province, Vietnam induced by heat treatment. Phys. Chem. Miner. 2015, 42, 287–302. [Google Scholar] [CrossRef]
- Schmetzer, K.; Schwarz, D.; Bernhardt, H.-J. A new type of Tairus hydrothermally grown synthetic emerald, coloured by vanadium and copper. J. Gemmol. 2006, 30, 59–74. [Google Scholar] [CrossRef]
- Wang, Q.; Guo, Q.; Li, N.; Cui, L.; Liao, L. Study of the mechanism of color change of prehnite after heat treatment. RSC Adv. 2022, 12, 3044–3054. [Google Scholar] [CrossRef]
- Andersson, L.O. Comments on Beryl Colors and on Other Observations Regarding Iron-containing Beryls. Can. Mineral. 2019, 57, 551–566. [Google Scholar] [CrossRef]
- Gervais, F.; Piriou, B.; Cabannes, F. Anharmonicity of infrared vibration modes in beryl. Phys. Status Solidi B 1972, 51, 701–712. [Google Scholar] [CrossRef]
- Hofmeister, A.; Hoering, T.; Virgo, D. Vibrational spectroscopy of beryllium aluminosilicates: Heat capacity calculations from band assignments. Phys. Chem. Miner. 1987, 14, 205–224. [Google Scholar] [CrossRef]
- Łodziński, M.; Sitarz, M.; Stec, K.; Kozanecki, M.; Fojud, Z.; Jurga, S. ICP, IR, Raman, NMR investigations of beryls from pegmatites of the Sudety Mts. J. Mol. Struct. 2005, 744–747, 1005–1015. [Google Scholar] [CrossRef]
- Wood, D.; Nassau, K. Infrared spectra of foreign molecules in beryl. J. Chem. Phys. 1967, 47, 2220–2228. [Google Scholar] [CrossRef]
- Mashkovtsev, R.I.; Smirnov, S.Z. The nature of channel constituents in hydrothermal synthetic emerald. J. Gemmol. 2004, 29, 215–227. [Google Scholar] [CrossRef]
- Mashkovtsev, R.I.; Thomas, V.G.; Fursenko, D.A.; Zhukova, E.S.; Uskov, V.V.; Gorshunov, B.P. FTIR spectroscopy of D2O and HDO molecules in the c-axis channels of synthetic beryl. Am. Mineral. 2016, 101, 175–180. [Google Scholar] [CrossRef]
- Prencipe, M.; Noel, Y.; Civalleri, B.; Roetti, C.; Dovesi, R. Quantum-mechanical calculation of the vibrational spectrum of beryl (Al4Be6Si12O36) at the Γ point. Phys. Chem. Miner. 2006, 33, 519–532. [Google Scholar] [CrossRef]
- Beckwith, P.; Troup, G. The optical and infrared absorption of V3+ in beryl (Be3Al2Si6O18). Phys. Status Solidi A 1973, 16, 181–186. [Google Scholar] [CrossRef]
- Zhang, H.; Liu, C.; Ma, Y. Advances in the study of mineralogy and hydrogen isotope composition of H2O in the structural channel in pegmatitic beryl. Kuangwu Xuebao 1999, 19, 370–379. [Google Scholar]
- Fridrichová, J.; Bačík, P.; Bizovská, V.; Libowitzky, E.; Škoda, R.; Uher, P.; Ozdín, D.; Števko, M. Spectroscopic and bond-topological investigation of interstitial volatiles in beryl from Slovakia. Phys. Chem. Miner. 2016, 43, 419–437. [Google Scholar] [CrossRef]
- Farmer, V. Recent advances in analytical infrared spectroscopy. Philos. Trans. R. Soc. Lond. Ser. A Math. Phys. Sci. 1982, 305, 609–619. [Google Scholar]
- Aines, R.D.; Rossman, G.R. The high temperature behavior of water and carbon dioxide in cordierite and beryl. Am. Mineral. 1984, 69, 319–327. [Google Scholar]
- Jehlička, J.; Culka, A.; Bersani, D.; Vandenabeele, P. Comparison of seven portable Raman spectrometers: Beryl as a case study. J. Raman Spectrosc. 2017, 48, 1289–1299. [Google Scholar] [CrossRef]
- Adamo, I.; Pavese, A.; Prosperi, L.; Diella, V.; Ajò, D.; Gatta, G.; Smith, C.P. Aquamarine, Maxixe-type beryl, and hydrothermal synthetic blue beryl: Analysis and identification. Gems Gemol. 2008, 44, 214–226. [Google Scholar] [CrossRef]
- Huong, L. Microscopic, chemical and spectroscopic investigations on emeralds of various origins. In Fachberich Chemie, Pharmazie und Geowissenschaften; Johannes Gutenberg University: Mainz, Germany, 2008. [Google Scholar]
- Huong, L.T.-T.; Hofmeister, W.; Häger, T.; Khoi, N.N.; Nhung, N.T.; Atichat, W.; Pisutha-Arnond, V. Aquamarine from The thuong Xuan district, Thanh Hoa province, Vietnam. Gems Gemol. 2011, 47, 42–48. [Google Scholar] [CrossRef]
- Karampelas, S.; Al-Shaybani, B.; Mohamed, F.; Sangsawong, S.; Al-Alawi, A. Emeralds from the Most Important Occurrences: Chemical and Spectroscopic Data. Minerals 2019, 9, 561. [Google Scholar] [CrossRef]
- Suo, Q.; Shen, P.; Luo, Y.; Li, C.; Feng, H.; Cao, C.; Pan, H.; Bai, Y. Beryl Mineralogy and Fluid Inclusion Constraints on the Be Enrichment in the Dakalasu No.1 Pegmatite, Altai, NW China. Minerals 2022, 12, 450. [Google Scholar] [CrossRef]
- Fridrichová, J.; Bačík, P.; Ertl, A.; Wildner, M.; Dekan, J.; Miglierini, M. Jahn-Teller distortion of Mn3+-occupied octahedra in red beryl from Utah indicated by optical spectroscopy. J. Mol. Struct. 2018, 1152, 79–86. [Google Scholar] [CrossRef]
- Fukuda, J.; Shinoda, K. Coordination of water molecules with Na+ cations in a beryl channel as determined by polarized IR spectroscopy. Phys. Chem. Miner. 2008, 35, 347–357. [Google Scholar] [CrossRef]
- Blak, A.R.; Isotani, S.; Watanabe, S. Optical absorption and electron spin resonance in blue and green natural beryl. Phys. Chem. Miner. 1982, 8, 161–166. [Google Scholar] [CrossRef]
- Viana, R.R.; Jordt-Evangelista, H.; da Costa, G.M.; Stern, W.B. Characterization of beryl (aquamarine variety) from pegmatites of Minas Gerais, Brazil. Phys. Chem. Miner. 2002, 29, 668–679. [Google Scholar] [CrossRef]
- Lind, T.; Schmetzer, K.; Bank, H. Blue and green beryls (aquamarines and emeralds) of gem quality from Nigeria. J. Gemmol. 1986, 20, 40–48. [Google Scholar] [CrossRef]
- Schwarz, D.; Kanis, J.; Kinnaird, J. Emerald and green beryl from Central Nigeria. J. Gemmol. 1996, 25, 117–141. [Google Scholar] [CrossRef]
- Schmetzer, K. Characterization of Russian hydrothermally-grown synthetic emeralds. J. Gemmol. 1988, 21, 145–164. [Google Scholar] [CrossRef]
- Saeseaw, S.; Renfro, N.D.; Palke, A.C.; Ziyin, S.; McClure, S.F. Geographic origin determination of emerald. Gems Gemol. 2019, 55, 614–646. [Google Scholar] [CrossRef]
- Krzemnicki, M.S.; Wang, H.A.O.; Büche, S. A New Type of Emerald from Afghanistan’s Panjshir Valley. J. Gemmol. 2021, 37, 474–495. [Google Scholar] [CrossRef]
- Saeseaw, S.; Pardieu, V.; Sangsawong, S. Three-Phase Inclusions in Emerald and Their Impact on Origin Determination. Gems Gemol. 2014, 50, 114–132. [Google Scholar] [CrossRef]
- Cui, D.; Liao, Z.; Qi, L.; Zhong, Q.; Zhou, Z. A Study of Emeralds from Davdar, North-Western China. J. Gemmol. 2020, 37, 374–392. [Google Scholar] [CrossRef]
- Shannon, R.D. Revised effective ionic radii and systematic studies of interatomic distances in halides and chalcogenides. Acta Crystallogr. Sect. A 1976, 32, 751–767. [Google Scholar] [CrossRef]


| Property | N01 | N02 | N03 |
|---|---|---|---|
| Image |  | 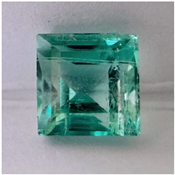 | 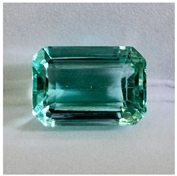 |
| Color | “electro-optical” green | “electro-optical” green | “electro-optical” blue-green |
| Size (mm) | 5.88 × 4.06 × 3.33 | 4.57 × 4.55 × 4.00 | 6.15 × 4.28 × 3.46 |
| Weight (ct) | 0.47 | 0.62 | 0.74 |
| Refractive index (RI) | 1.565–1.573 | 1.567–1.573 | 1.567–1.573 |
| Double refractive index (DR) | 0.008 | 0.006 | 0.006 |
| Dichroism | Weak, yellowish green/blueish-green | Weak, yellowish green/blueish-green | Weak, yellowish green/blueish-green |
| Specific gravity (SG) | 2.67 | 2.69 | 2.66 |
| UV fluorescence (LW) | Inert | Inert | Inert |
| UV fluorescence (SW) | Inert | Inert | Inert |
| Chelsea color filter (CCF) | green | green | green |
| Microscopic features | Two-phase gas–liquid parallel tubes with rain-like appearance (rain-like inclusions) | Two-phase gas–liquid parallel tubes with rain-like appearance (rain-like inclusions), irregular, jagged multiphase inclusions, hexagonal growth lines, and parallel bands. | Two-phase gas–liquid parallel tubes with rain-like appearance (rain-like inclusions), veil-like fluid inclusions. |
| Sample | N01 | N02 | N03 | |||
|---|---|---|---|---|---|---|
| wt.% | Std. Dev. | wt.% | Std. Dev. | wt.% | Std. Dev. | |
| SiO2 | 76.48 | 0.917 | 76.48 | 0.92 | 76.21 | 0.944 |
| Al2O3 | 22.36 | 0.814 | 22.51 | 0.819 | 22.66 | 0.85 |
| TFeO | 0.79 | 0.008 | 0.63 | 0.007 | 0.98 | 0.011 |
| V2O3 | 0.07 | 0.001 | 0.06 | 0.001 | 0.1 | 0.002 |
| Cr2O3 | 0.04 | 0.001 | 0.02 | 0.001 | 0.01 | 0.001 |
| BaO | 0.15 | 0.012 | ndl. | ndl. | ||
| CaO | 0.06 | 0.001 | 0.04 | 0.001 | 0.03 | 0.001 |
| CuO | 0.01 | 0.001 | 0.02 | 0.001 | ndl. | |
| ZnO | ndl. | 0.06 | 0.001 | ndl. | ||
| K2O | ndl. | 0.17 | ndl. | |||
| Total | 99.96 | 99.98 | 99.95 | |||
| V2O3av | 0.08 | |||||
| Cr2O3av | 0.02 | |||||
| TFeOav | 0.8 | |||||
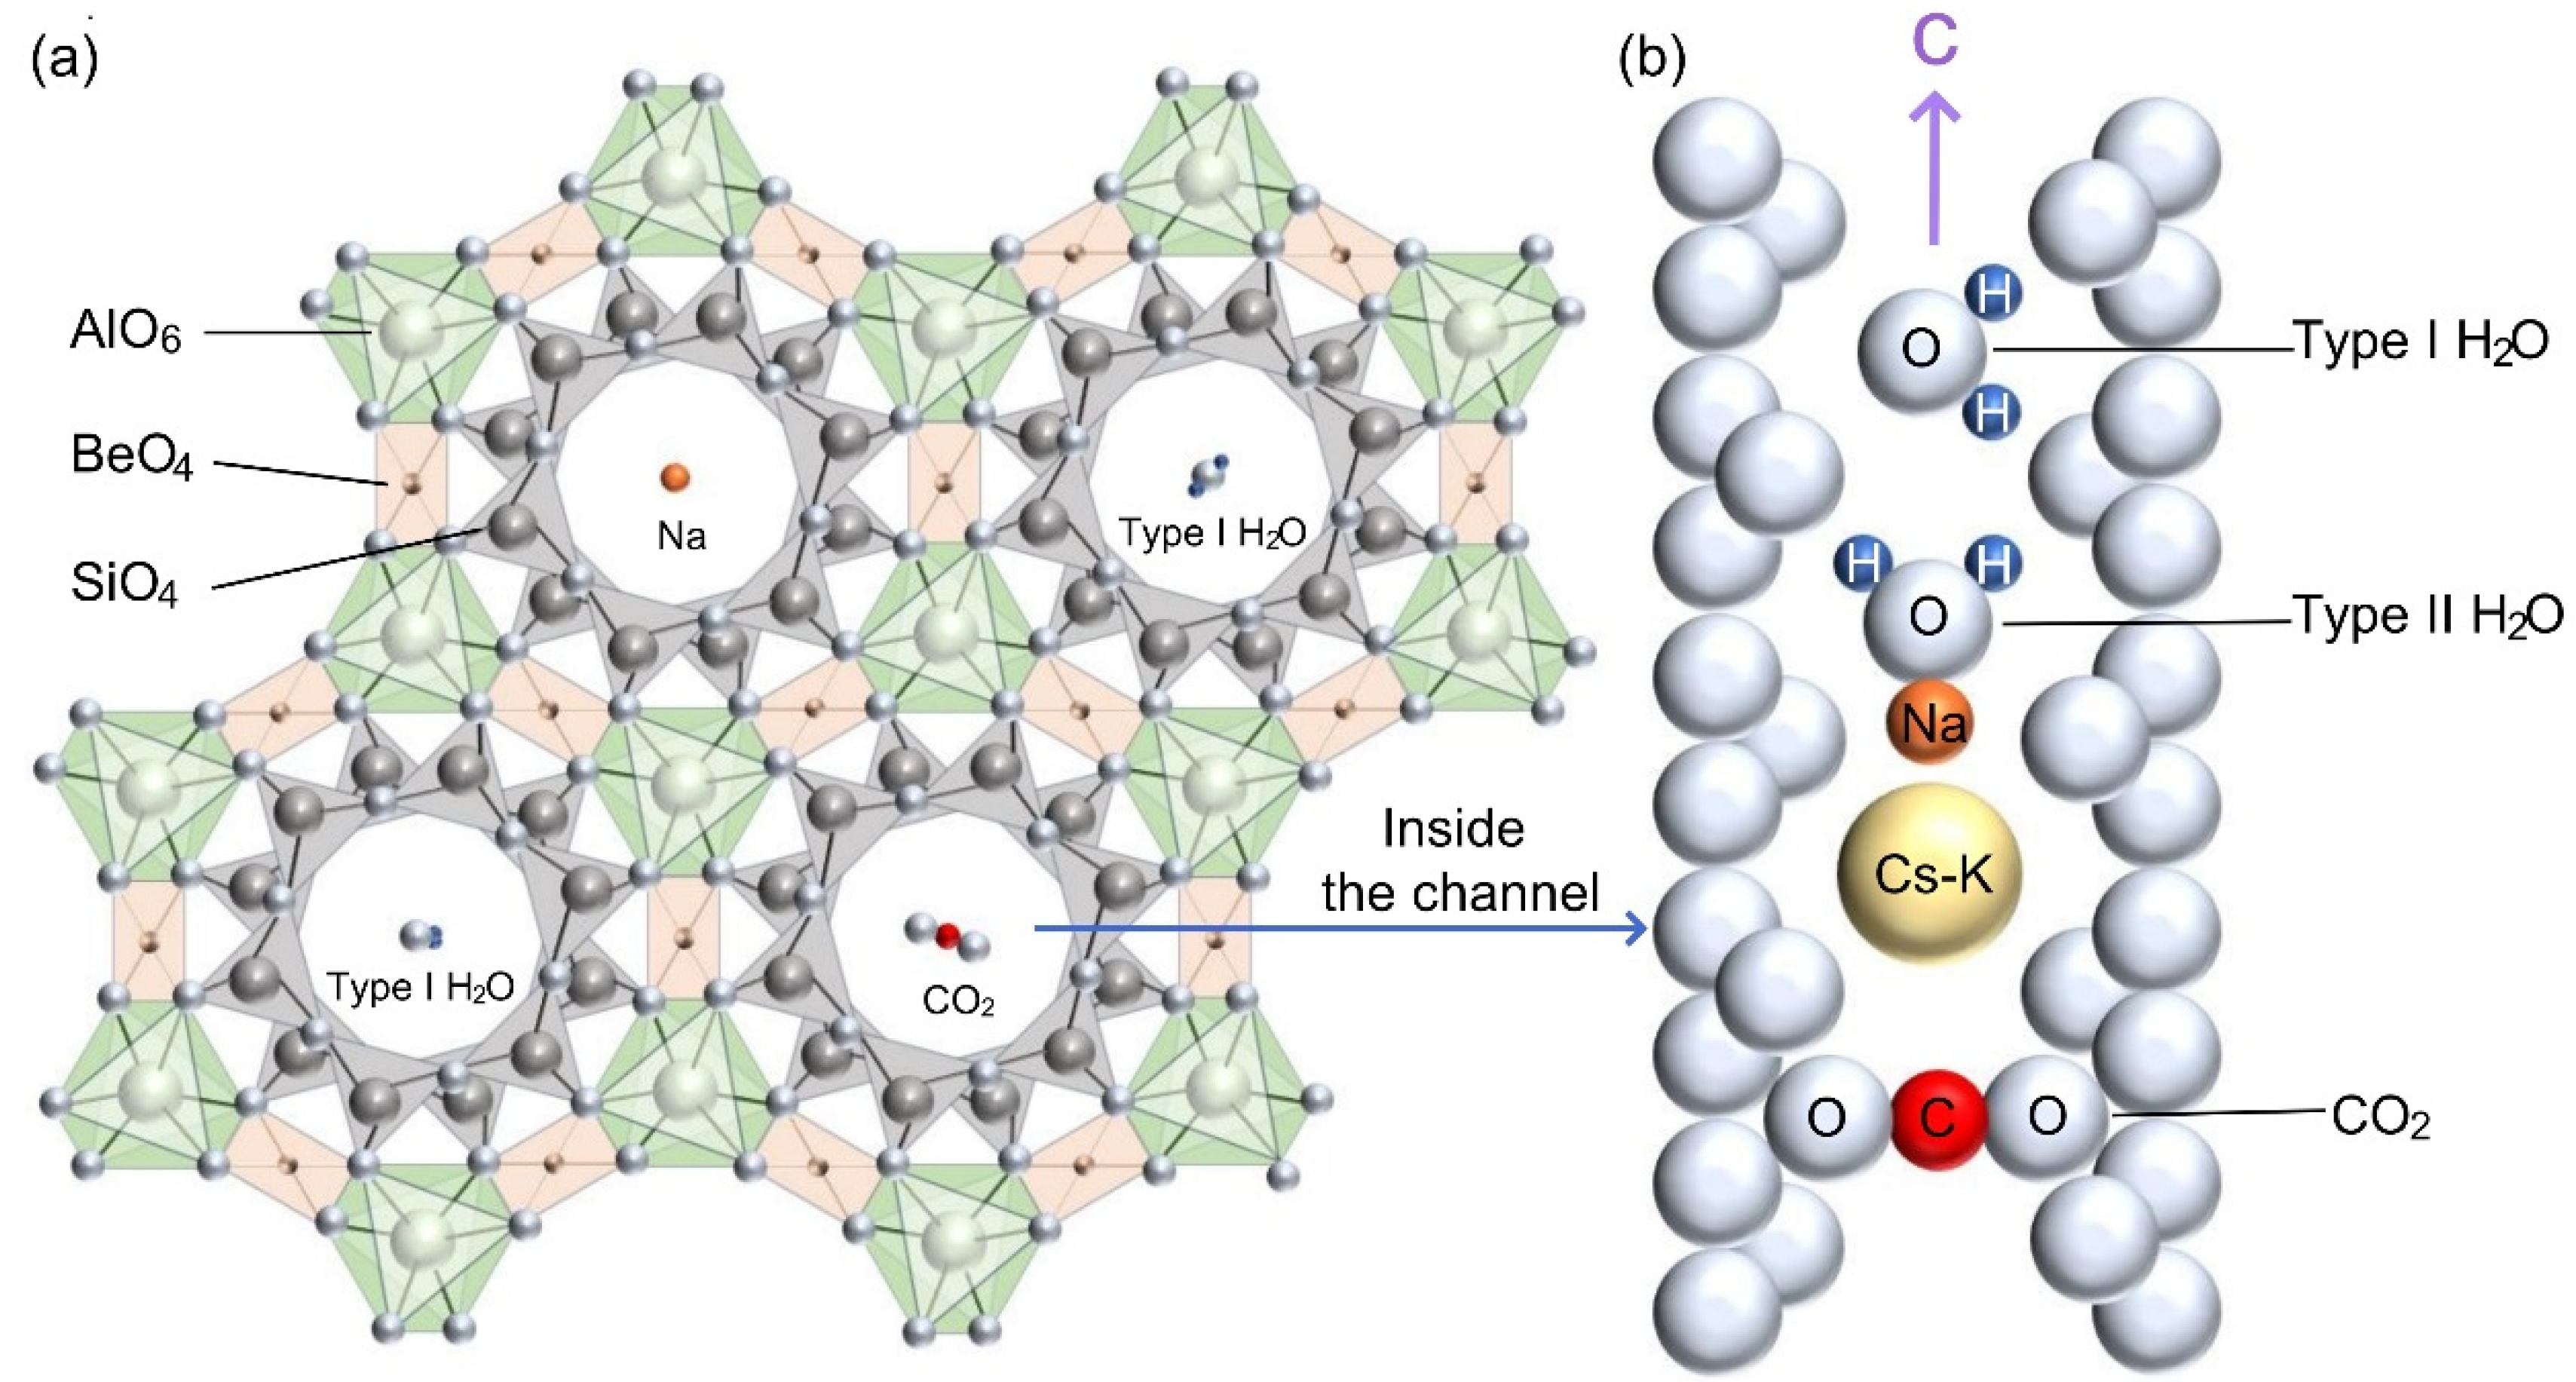
| Band Assignments [1,5,15,22,23,25,26,27,28,29,30,31] | Nigerian Vanadium-Bearing Beryls | ||
|---|---|---|---|
| N01 (cm−1) | N02 (cm−1) | N03 (cm−1) | |
| ν3 H2O typeI | 7142 | 7140 | 7140 |
| ν H2O typeII | 7070 | 7055 | n.d. |
| ν H2O typeI | 6816 | 6816 | 6814 |
| H2O typeI | 5448 | 5448 | 5444 |
| ν2+ν3 H2O typeI/II | 5271 | 5270 | 5270 |
| ν H2O typeI | 5105 | 5101 | 5109 |
| 4881 | 4877 | 4875 | |
| 4804 | 4804 | 4804 | |
| 4546 | 4546 | 4546 | |
| 4197 | 4197 | 4197 | |
| [Fe2(OH)4]2+ | 3233 | 3233 | 3233 |
| Na-H | 3160 | 3160 | 3159 |
| M-OH | 3111 | 3111 | 3111 |
| 2816 | 2816 | 2816 | |
| Cl− | 2735 | 2736 | 2735 |
| HDO | 2687 | 2687 | 2687 |
| D2O | 2640 | 2640 | 2642 |
| Cl− | 2445 | 2441 | 2445 |
| νCO2 | 2360 | 2358 | 2362 |
| νCO2 | 2324 | 2320 | 2324 |
| ν3(Si-O-Si) | 1273 | 1275 | 1275 |
| ν3(Si-O-Si) | 1242 | 1244 | 1252 |
| ν3(Si-O-Si) | 1074 | 1068 | 1074 |
| ν3(O-Si-O) | 1020 | 1018 | 1020 |
| ν1(O-Si-O) | 964 | 974 | 965 |
| ν1(Si-O-Si) | 810 | 808 | 810 |
| ν1(Si-O-Si) | 745 | 752 | 746 |
| ν1(Si-O-Si) | 687 | 689 | 687 |
| ν1(Be-O) | 650 | 650 | 650 |
| ν2(Si-O), ν(M-O) | 596 | 598 | 596 |
| ν2(Si-O), ν(M-O) | 530 | 532 | 532 |
| ν2(Si-O), ν(M-O) | 492 | 494 | 494 |
| ν2(Si-O), ν(M-O) | 447 | 445 | 453 |
| ν2(Si-O), ν(M-O) | 430 | 435 | 430 |
| Band Assignments [3,23,24,25,34,35,36,37] | Nigerian Vanadium-Bearing Beryl | ||
|---|---|---|---|
| N01 (cm−1) | N02 (cm−1) | N03 (cm−1) | |
| 144 | 146 | 144 | |
| 253 | 253 | 253 | |
| E1g+E2g overlap | n.d. | 292 | 294 |
| A1g+E2g overlap | 321 | 323 | 321 |
| A1g+E2g overlap | 394 | 396 | 396 |
| E2g | 421 | 423 | 421 |
| E1g+E2g overlap | 446 | 449 | 446 |
| ν(Al-O), E1g | 526 | 530 | 528 |
| E2g | 582 | 582 | 584 |
| A1g | 622 | 622 | n.d. |
| ν(Be-O), A1g+E2g | 684 | 684 | 684 |
| ν(Al-O), E1g+E2g overlap | 769 | 772 | 771 |
| ν(Si-O), E1g+E2g | 916 | 914 | 916 |
| ν(Si-O), E1g+E2g | 1012 | 1012 | 1010 |
| ν(Si-O), A1g | 1067 | 1068 | 1067 |
| ν1 CO2, E2g | 1242 | 1242 | 1242 |
| ν1 H2O type I | 3606 | 3606 | 3606 |
Disclaimer/Publisher’s Note: The statements, opinions and data contained in all publications are solely those of the individual author(s) and contributor(s) and not of MDPI and/or the editor(s). MDPI and/or the editor(s) disclaim responsibility for any injury to people or property resulting from any ideas, methods, instructions or products referred to in the content. |
© 2025 by the authors. Licensee MDPI, Basel, Switzerland. This article is an open access article distributed under the terms and conditions of the Creative Commons Attribution (CC BY) license (https://creativecommons.org/licenses/by/4.0/).
Share and Cite
Hong, Y.; Zhang, Y.; Shao, X.; Mu, Y.; Yu, Y. Gemological Characteristics and Coloration Mechanism of Vanadium-Bearing Beryl from Nigeria. Minerals 2025, 15, 557. https://doi.org/10.3390/min15060557
Hong Y, Zhang Y, Shao X, Mu Y, Yu Y. Gemological Characteristics and Coloration Mechanism of Vanadium-Bearing Beryl from Nigeria. Minerals. 2025; 15(6):557. https://doi.org/10.3390/min15060557
Chicago/Turabian StyleHong, Yunlong, Yu Zhang, Xinyi Shao, Yanyi Mu, and Yuemiao Yu. 2025. "Gemological Characteristics and Coloration Mechanism of Vanadium-Bearing Beryl from Nigeria" Minerals 15, no. 6: 557. https://doi.org/10.3390/min15060557
APA StyleHong, Y., Zhang, Y., Shao, X., Mu, Y., & Yu, Y. (2025). Gemological Characteristics and Coloration Mechanism of Vanadium-Bearing Beryl from Nigeria. Minerals, 15(6), 557. https://doi.org/10.3390/min15060557