Article

Characteristics of Controlling Factors of Shale Oil Enrichment in Lucaogou Formation, Jimusar Sag

1
School of Petroleum, China University of Petroleum-Beijing at Karamay, Karamay 834000, China
2
Exploration and Development Research Institute, Jianghan Oilfield Branch Company, Sinopec, Wuhan 430073, China
*
Author to whom correspondence should be addressed.
Minerals 2025, 15(5), 469; https://doi.org/10.3390/min15050469
Submission received: 15 March 2025 / Revised: 11 April 2025 / Accepted: 21 April 2025 / Published: 30 April 2025
(This article belongs to the Section Mineral Exploration Methods and Applications)

Abstract

:
Taking the Lucaogou Formation in the Junggar Basin as the research object, this study draws on core mineral data, thin-section observations, and geochemical test results to systematically investigate the enrichment mechanism and migration characteristics of shale oil. The findings show that the Lucaogou Formation is primarily composed of Type I and Type II kerogen, with high hydrocarbon-generation potential; its organic matter mainly originates from lacustrine algae, rich in low-carbon alkanes and tricyclic terpanes, and is well-preserved under reducing conditions. The upper and lower “sweet spots” of the Lucaogou Formation each form an independent source–reservoir–seal system. Shale oil in the upper sweet spot is characterized by low density, low viscosity, high wax content, and a relatively high pour point. Reservoir space is dominated by intergranular pores, dissolution pores, and intercrystalline pores, which are well-developed and exhibit relatively high permeability. By contrast, shale oil in the lower sweet spot is marked by high density, high viscosity, low wax content, and a relatively low pour point. Its reservoir space is dominated by dissolution pores and intercrystalline pores, which are unevenly developed and result in poorer permeability. Overall, shale oil enrichment in the Lucaogou Formation is jointly controlled by organic matter source, diagenesis, and sedimentary environment. This study further clarifies the controlling factors for shale oil enrichment in the Lucaogou Formation and provides a scientific basis for the exploration and development of unconventional oil and gas resources.

1. Introduction

Shale oil, as an important unconventional hydrocarbon resource, has attracted widespread global attention in recent years [1,2,3]. Its development and utilization play a crucial role in alleviating energy shortages and ensuring energy security [4,5]. In China, the Junggar Basin is recognized as one of the most promising regions for shale oil resources, with the Lucaogou Formation in the Jimusar Sag becoming a primary focus for research and exploration due to its abundant organic matter and unique geological characteristics [6,7,8,9]. Its unique depositional setting, marked by periodic fluctuations in lake levels and distinct redox conditions, has resulted in the development of source rocks with heterogeneous organic properties [10].
The Lucaogou Formation was formed during the Middle Permian, with a depositional environment dominated by high-salinity lakes, providing favorable conditions for hydrocarbon generation [7,11,12,13,14]. Previous studies have shown that the enrichment of shale oil in the Lucaogou Formation is controlled by multiple factors, including the type and abundance of organic matter and the mineral composition of the rocks [15,16,17,18,19,20,21]. However, systematic research on the differential characteristics of the upper and lower sweet spots and their impact on oil and gas enrichment is still lacking.
In terms of factors controlling the enrichment of shale oil, it has been demonstrated that changes in primary sedimentary conditions (changes in lake level and sedimentation rates) directly affect the quality and distribution of organic matter [22,23,24]. Furthermore, there is evidence that organic inputs into this system are not solely from traditional algal sources; rather, salt-tolerant planktonic green algae may also contribute significantly to biomarker signatures, sometimes mimicking traditional terrestrial indicators [25,26,27,28]. Simultaneously, sedimentary cycles and associated diagenetic processes (e.g., dolomitization and fracturing) have been shown to be important in enhancing secondary porosity, thereby influencing hydrocarbon transport and accumulation [29,30,31,32].
Based on source–reservoir characteristics, the upper and lower sections of the Lucaogou Formation each developed two sets of well-preserved reservoirs, namely the upper sweet spot and the lower sweet spot, separated by a mudstone section. Practical exploration has revealed an inversion phenomenon in the physical properties of crude oil between the upper and lower sweet spots: oil in the upper sweet spot has low density and viscosity, whereas oil in the lower sweet spot has high density and viscosity [7]. Therefore, a systematic comparison of the vertical shale oil characteristics and an analysis of the controlling factors for oil and gas enrichment in the Lucaogou Formation are of significant importance for the exploration of sweet spot zones.
In light of this, the present study focuses on the Lucaogou Formation in the Jimusar Sag, collecting source rock and oil-bearing sandstone samples from both the upper and lower sweet spots. A comprehensive approach integrating geological, geochemical, and rock physics methods was employed, including total organic carbon (TOC) measurements, programmed temperature pyrolysis, and saturated hydrocarbon gas chromatography–mass spectrometry (GC-MS) analyses. Through a comparative study of the upper and lower sweet spots, the controlling factors of shale oil enrichment and its migration characteristics were systematically analyzed, exploring the influence mechanisms of organic matter characteristics, reservoir properties, and sedimentary microfacies on shale oil enrichment. The research findings will provide a scientific basis for the exploration and development of shale oil in the region and offer valuable insights for unconventional hydrocarbon studies in similar basins.

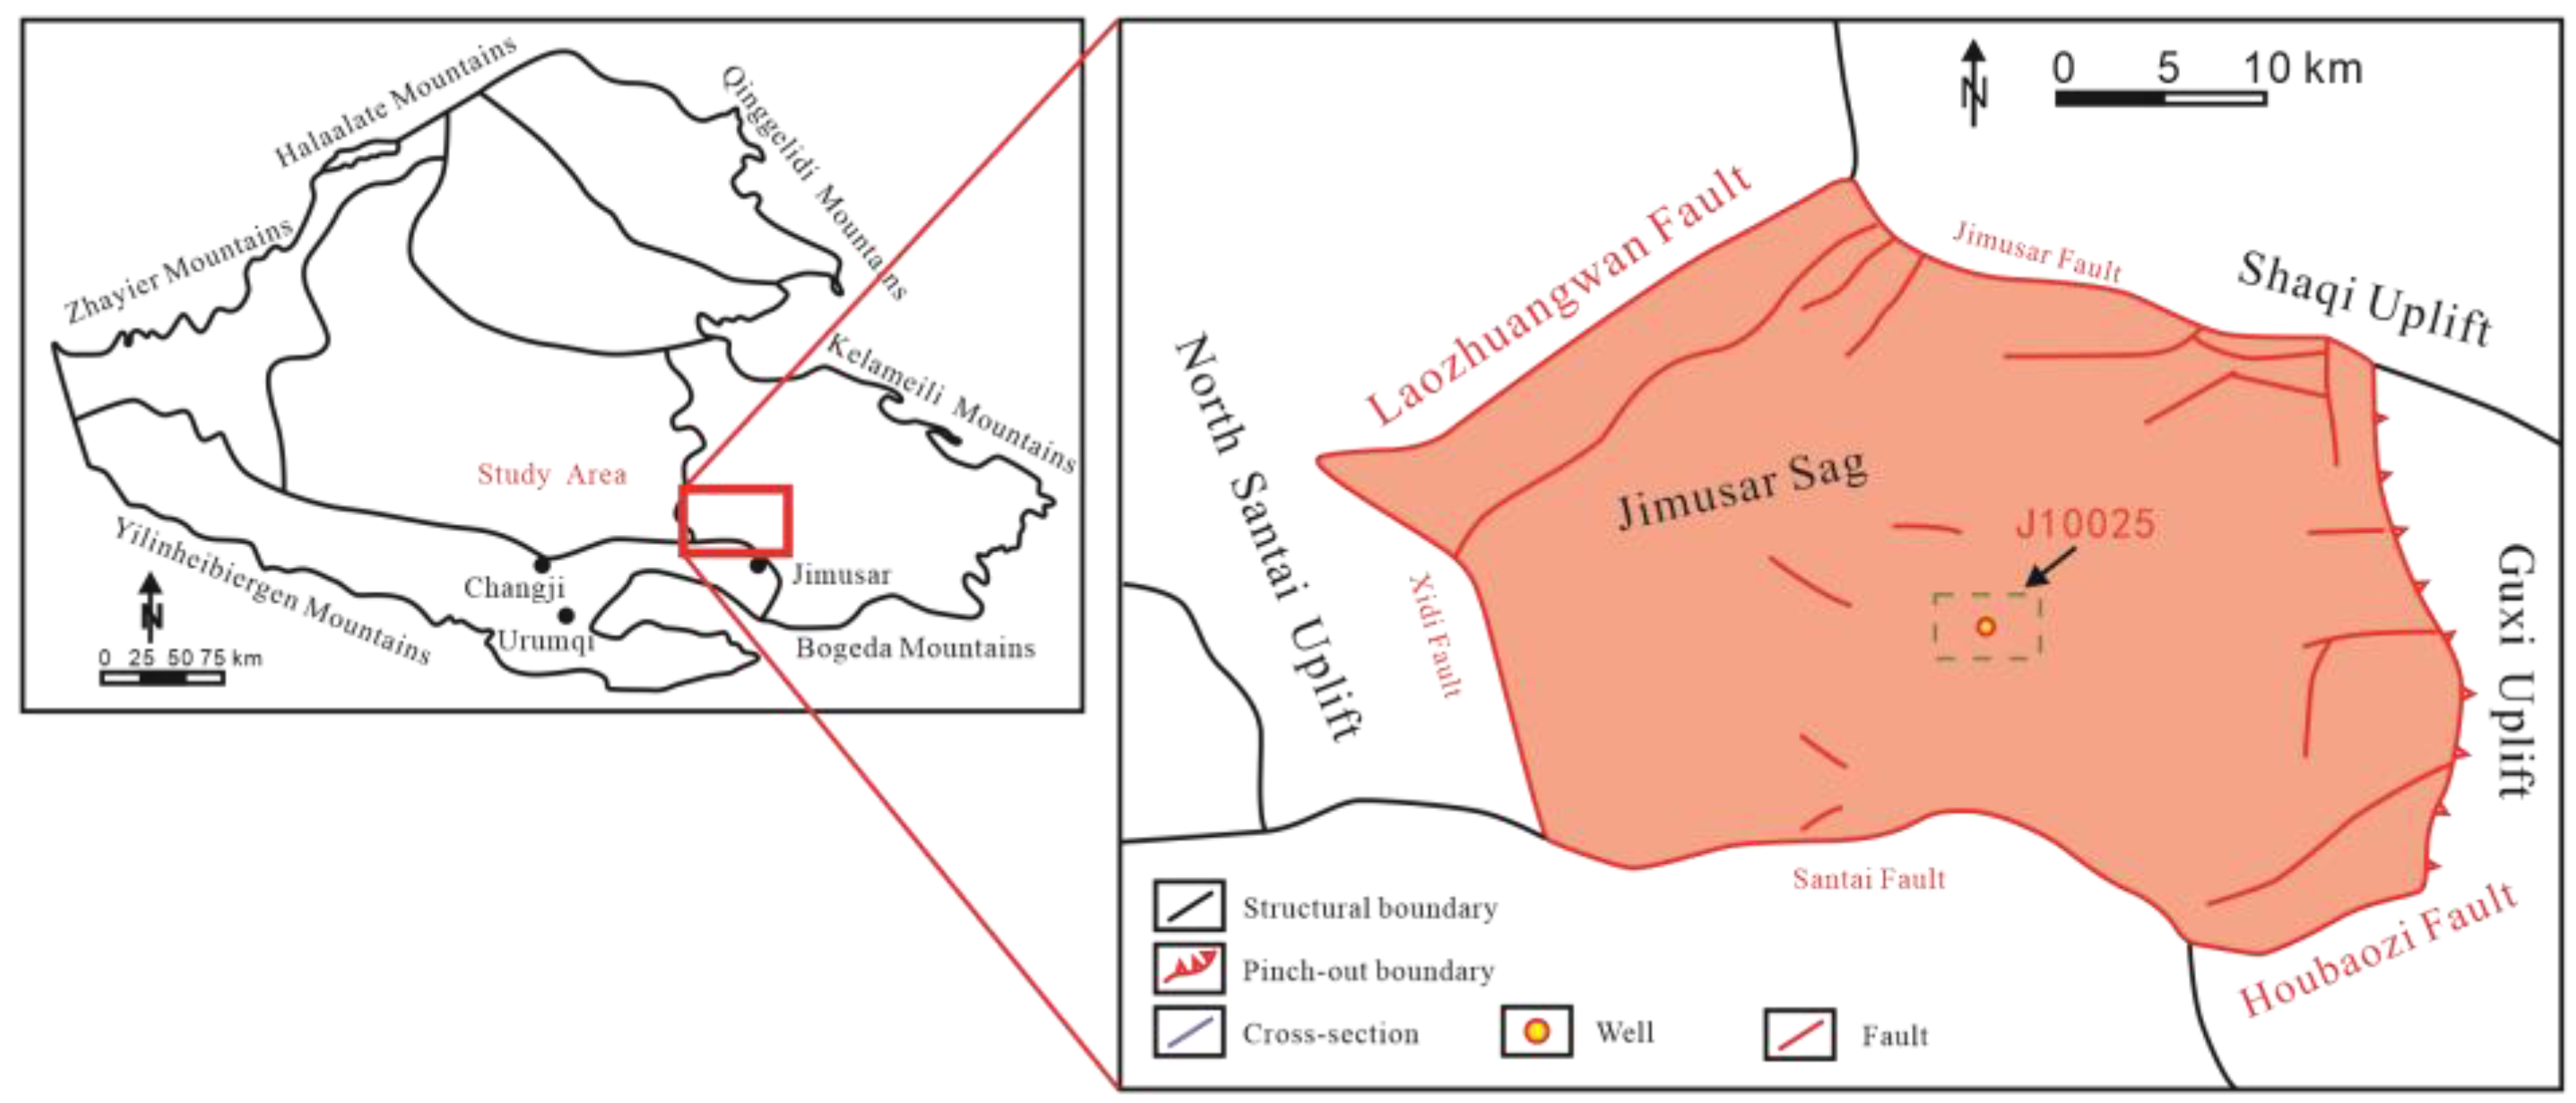
2. Geological Background

The Jimusar Sag is located in the eastern part of the Junggar Basin in northwestern China. It is a significant oil- and gas-bearing sedimentary depression with a complex structural evolution history [33,34]. Its structural evolution has been primarily influenced by tectonic movements from the late Paleozoic to the early Mesozoic, especially the tectonic activities triggered by the collision between the Siberian Plate and the Tarim Plate [2]. During the late Permian to Early Triassic periods, large-scale extensional tectonics occurred in the region, leading to the formation of a series of rift basins and depressions [11]. Under this extensional tectonic setting, numerous normal faults and synsedimentary faults developed, controlling the morphology of the sedimentary basin and its sedimentary fill [35,36,37]. These faults not only affected the spatial distribution of sediments but also provided favorable pathways for the generation, migration, and accumulation of oil and gas in later stages [1,38,39,40]. From the Mesozoic to the Cenozoic, the Jimusar Sag experienced multiple phases of compressional and strike–slip tectonic movements, resulting in a complex structural pattern [6] (Figure 1). These tectonic activities caused deformation such as folding and faulting within the strata of the depression, affecting the burial depth and thermal maturation of organic matter, thereby influencing the maturity of source rocks and the migration pathways of hydrocarbons [41].
The Lucaogou Formation is an important stratigraphic unit of the middle Permian within the Jimusar Sag, widely distributed in the depression area [11,12]. The depositional environment of this formation is primarily saline to hypersaline lacustrine facies, characterized by high salinity and strong reducing conditions [9,13,14]. Within the study area, from bottom to top, the Lucaogou Formation can be divided into the lower section (P2l1) and the upper section (P2l2). Each section, based on lithofacies and depositional facies boundaries, can be further subdivided into two layers (P2l11, P2l12 and P2l21, P2l22). P2l12 and P2l22 are referred to as the lower sweet spot and the upper sweet spot, respectively, due to the development of relatively high-quality siltstone reservoirs. The middle part of the upper and lower sweet spots is a thick mudstone section (Figure 2).

3. Samples and Methods

3.1. Samples

In this study, 149 source rock samples and 18 crude oil samples were collected from well J10025 in the Jimusar Depression. Among these, 62 samples were from P2l1 and 87 samples were from P2l1. Of the 18 crude oil samples, 6 represent oil from the upper sweet spot interval and 12 represent oil from the lower sweet spot interval. In addition, porosity, permeability, mineralogical, and pore size distribution data for this well were also collected from our oil field partner.

3.2. Organic Carbon Content Determination and Programmed Temperature Pyrolysis Analysis

Core and crude oil samples from J10025 in the Jimusar Depression were analyzed. A total of 109 representative samples were selected for total organic carbon determination and analysis, including 31 samples from the upper sweet spot, 30 samples from the middle mudstone, and 48 samples from the lower sweet spot. After crushing and sieving the solid samples, they were soaked in a 1:7 (volume ratio) hydrochloric acid solution at 60–80 °C for more than two hours to fully remove inorganic carbon. Once the reaction was complete, the samples were rinsed thoroughly with distilled water. They were then dried in a constant-temperature oven at 60–80 °C prior to measurement. A carbon–sulfur analyzer was used to determine the TOC content of the samples. The total organic carbon (TOC) in the samples was determined using a LECO CS-230 carbon–sulfur analyzer. The LECO CS-230 carbon–sulfur analyzer is built by LECO Corporation (St. Joseph, MI, USA). The experimental operation was strictly carried out in accordance with GB/T 19145-2022 [42].
For the core samples, after crushing to a grain size of 0.07–0.15 mm, The programmed temperature pyrolysis analysis was carried out on an OGE-II instrument, The OGE-II instrument is produced by the Exploration and Development Research Institute of China National Petroleum Corporation (Beijing, China). and the heating program was as follows: S0 was measured at 90 °C under isothermal conditions for 2 min; S1 was measured at 300 °C under isothermal conditions for 3 min. Beginning at an initial temperature of 300 °C, the temperature was raised at 25 °C/min to 600 °C, then held for 1 min to measure S2. The temperature corresponding to the highest point on the S2 peak is defined as Tmax. The experimental operation was carried out strictly in accordance with GB/T 18062-2012 [43].

3.3. Separation of Family Components

A total of 101 representative samples were selected from the core samples, including 22 samples from the upper sweet spot section, 33 samples from the middle mudstone section, and 46 samples from the lower sweet spot section. Approximately 60 g of rock powder sample and about 500 mL of analytical-grade pure dichloromethane were taken. The extractable organic matter in the rock was obtained using the Soxhlet extraction method according to the standard SY/T 5118-2021 [44]. Next, 50 mL of petroleum ether was used to precipitate the asphaltenes from the extractable organic matter, and the precipitate was filtered. The resulting filtrate was then subjected to column chromatography on a silica gel/alumina column (volume ratio 2:1) and sequentially eluted with 60 mL of petroleum ether, 40 mL of a dichloromethane/petroleum ether mixed solvent (volume ratio 2:1), and a dichloromethane/methanol mixed solvent (volume ratio 2:1) to elute the saturate hydrocarbons, aromatic hydrocarbons, and non-hydrocarbon fractions. This experimental procedure strictly followed the industry standard SY/T 5119-2016 [45].

3.4. Saturated Hydrocarbons Gas Chromatography–Mass Spectrometry

The saturated hydrocarbon components of the 101 samples separated in Section 3.3 were analyzed by GC-MS using an Agilent 5975i mass spectrometer detector (MSD) and an Agilent 6890 GC system equipped with an HP-5MS fused silica capillary column (30 m × 250 μm × 0.25 μm film thickness) (manufactured by Agilent Technologies Inc., Wilmington, DE, USA). The gas chromatography conditions were as follows: initial temperature 50 °C (held for 1 min), then the temperature was raised to 120 °C at a rate of 20 °C/min. ramped to 310 °C at a rate of 3 °C/min, then held at 300 °C for 20 min. Helium (purity > 99.999%) served as the carrier gas. Electron ionization was employed for mass spectrometry at 70 eV, with a scan range of 50–600 Da. The experimental process strictly complies with GB/T 18606-2017 standard [46].

4. Result

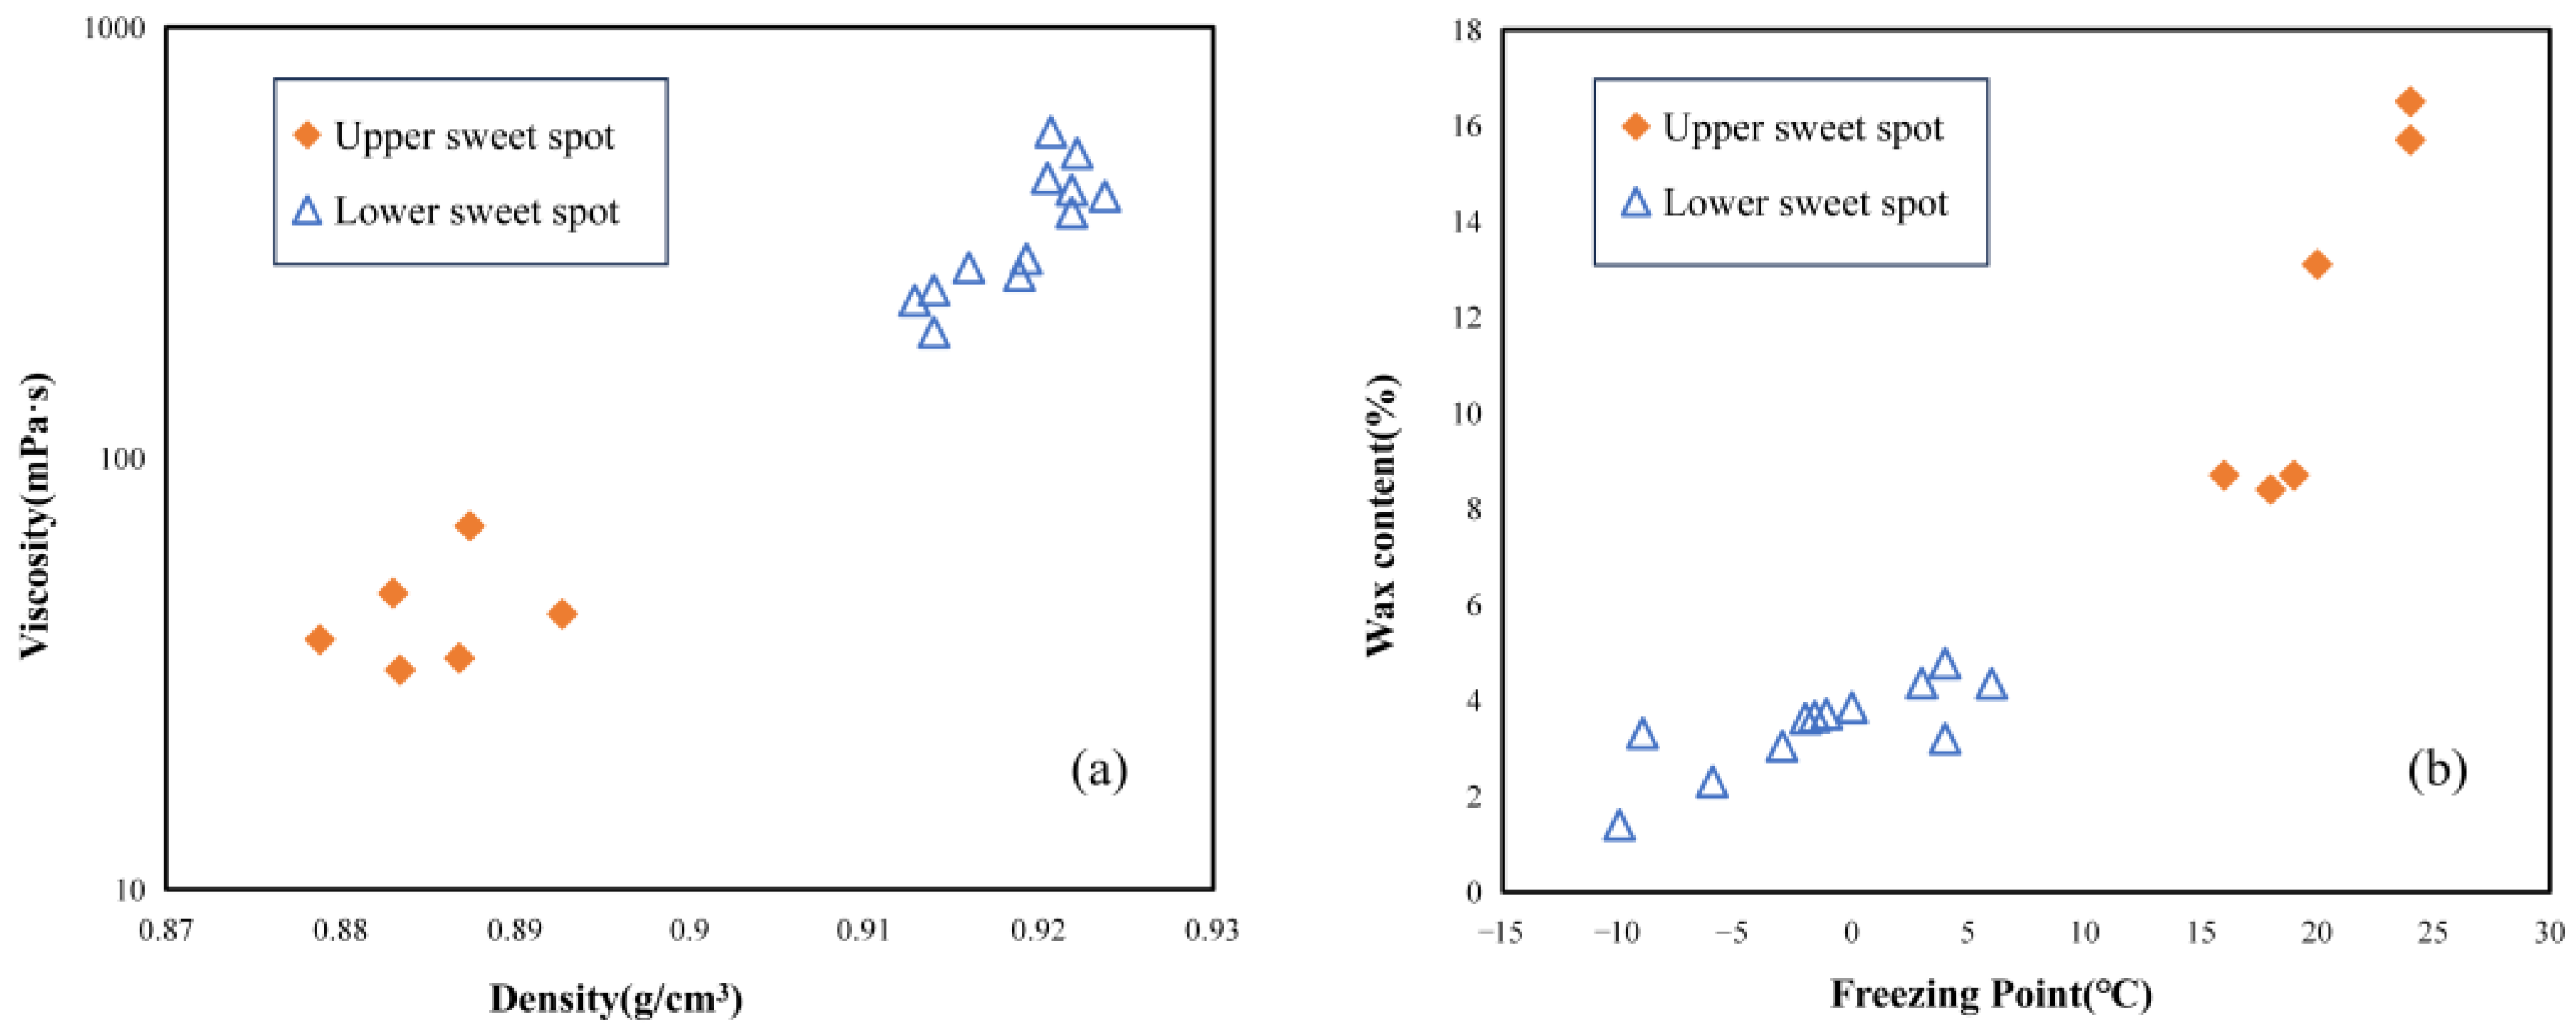
4.1. Physical Properties of Shale Oil

The physical properties of shale oil have a significant impact on its mobility, determining its permeability within the reservoir, its migration pathways, and ultimately its zones of accumulation [7]. All viscosity values refer to dynamic viscosity, and the dynamic viscosity in Table 1 was measured at a standard temperature of 50 °C.
In the upper “sweet spot” interval, the crude oil density ranges from 0.883 to 0.8927 g/cm3, with an average of 0.8854 g/cm3. Its viscosity ranges from 32.32 to 69.70 mPa·s, averaging 44.46 mPa·s. The average wax content is 11.85%, and the average solidification point is 20.17 °C. This places it in the category of a medium, light oil with a relatively high solidification point and high wax content. In the lower “sweet spot” interval, the crude oil density ranges from 0.914 to 0.9238 g/cm3, averaging 0.9188 g/cm3. Its viscosity is between 196.2 and 572.21 mPa·s, with an average of 352.82 mPa·s. The average wax content is 3.46%, and the average solidification point is −1.30 °C. This classifies it as a medium heavy oil, characterized by higher density, higher viscosity, lower wax content, and a lower solidification point. Compared to the lower sweet spot interval, the crude oil in the upper sweet spot interval has a lower density and viscosity, yet higher wax content and solidification point (Figure 3).

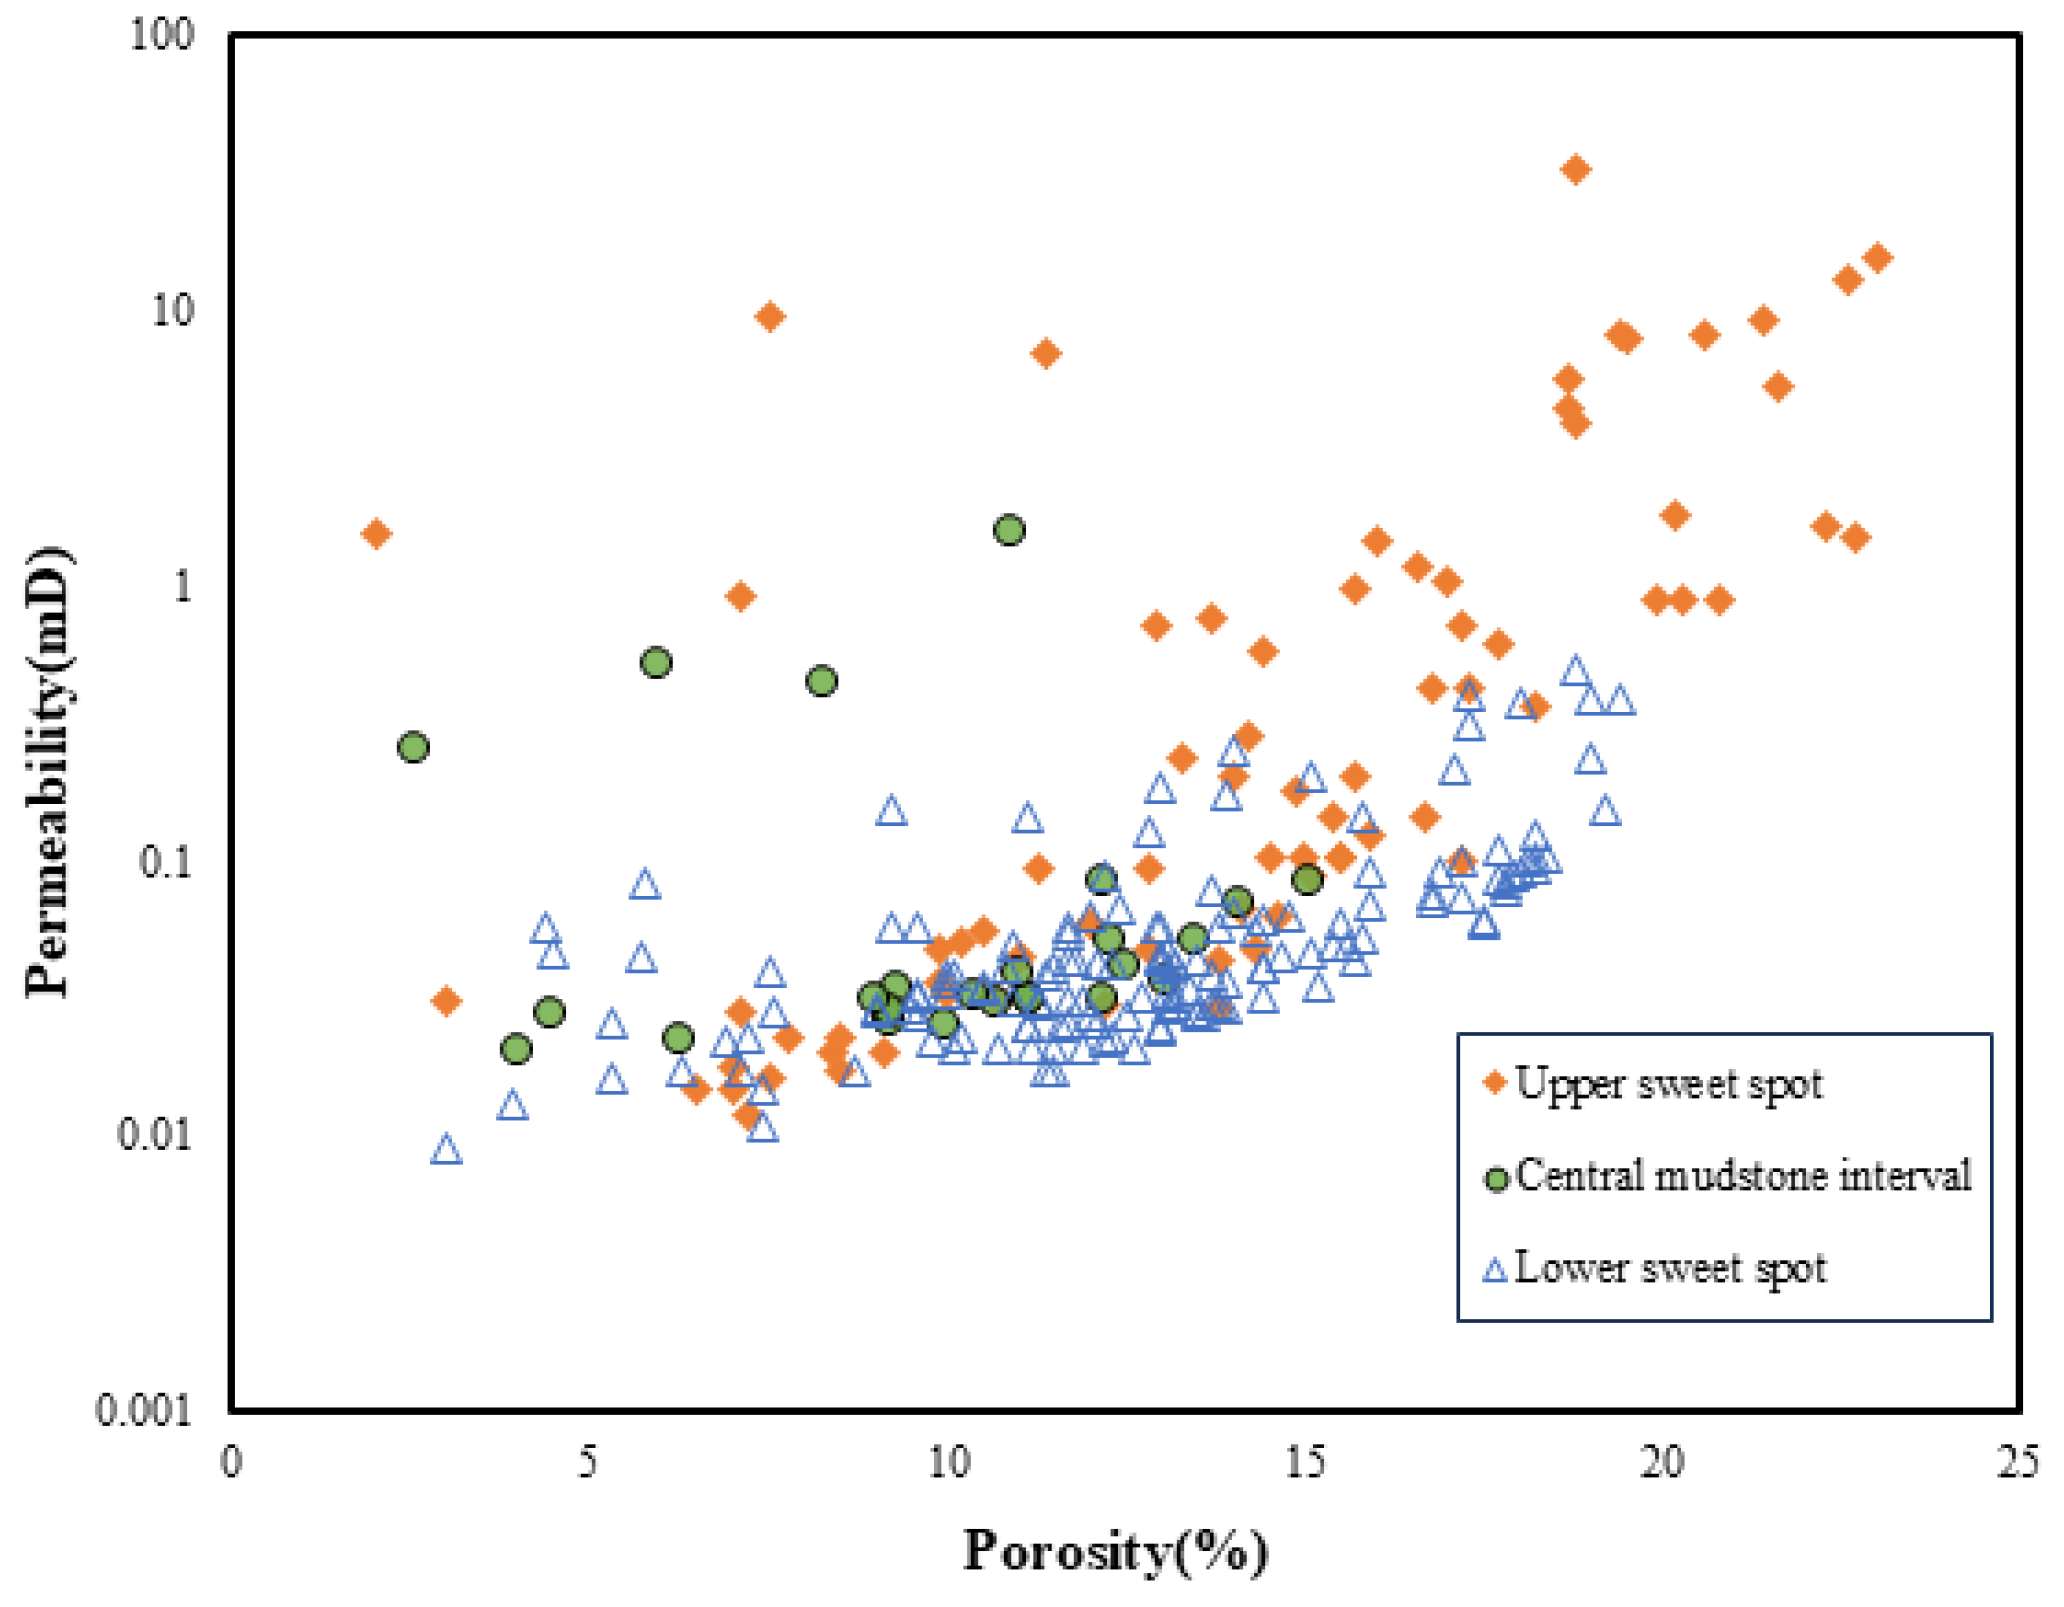
4.2. Physical Characteristics of Reservoir

4.2.1. Rock Mineral Composition

Different minerals have their own unique physical and chemical properties, which affect the formation, evolution, and preservation of rock pores during sedimentation, diagenesis, and tectonic evolution. At the same time, the mineral composition directly affects the mechanical properties, brittleness, and fracturability of rocks. These factors jointly determine the formation and development of fractures. Rocks containing more brittle minerals are more likely to form fractures under geological stress, while rocks rich in ductile minerals have poor crack-development ability. Calcite provides the most intergranular pores, intercrystalline, pores and dissolution pores for the accumulation of shale oil [9,16]. The sweet spot section of the Lucaogou Formation is mainly composed of fine sandstone, mudstone, and carbonate rock, and the sweet spot of the Lucaogou Formation is closely related to the mineral composition of reservoirs of different lithologies. The mineral composition of the Lucaogou Formation is shown in Table 2.
In the upper sweet spot interval, the clay mineral content is relatively low (5.5%) (Table 2), with a quartz content of 19.9% and relatively high contents of potassium feldspar and plagioclase (14.1% and 30.9%, respectively), indicating abundant feldspar minerals. The calcite content is 8.8%, while ferrodolomite (ankerite) accounts for 21.2%. Carbonate minerals present in the reservoir can enhance both permeability and porosity. In the middle mudstone interval, the clay mineral (7.1%) and quartz (23.5%) contents are the highest overall, and the potassium feldspar and plagioclase contents are 12.8% and 28.6%, respectively, similar to those of the upper sweet spot interval. Calcite and ferrodolomite (ankerite) contents are also relatively high, at 11.9% and 18.9%, respectively. In the lower sweet spot interval, the clay mineral content is 5.35% and the quartz content is 17.4%, which is relatively low. Potassium feldspar and plagioclase account for 9.6% and 22.7%, respectively, while calcite and ferrodolomite (ankerite) levels are the highest, at 18% and 27.8%.
Overall, the upper sweet spot interval has higher quartz and feldspar contents and less clay mineral content, which is more conducive to forming effective pores and provides good reservoir potential. The middle mudstone interval has relatively high clay and carbonate mineral contents, with high quartz as well, but is more compact. The lower sweet spot interval has the lowest clay mineral content, comparatively lower quartz and feldspar contents, but more abundant carbonate minerals, offering some potential for dissolution pores; its reservoir conditions lie between those of the upper sweet spot interval and the middle mudstone interval.

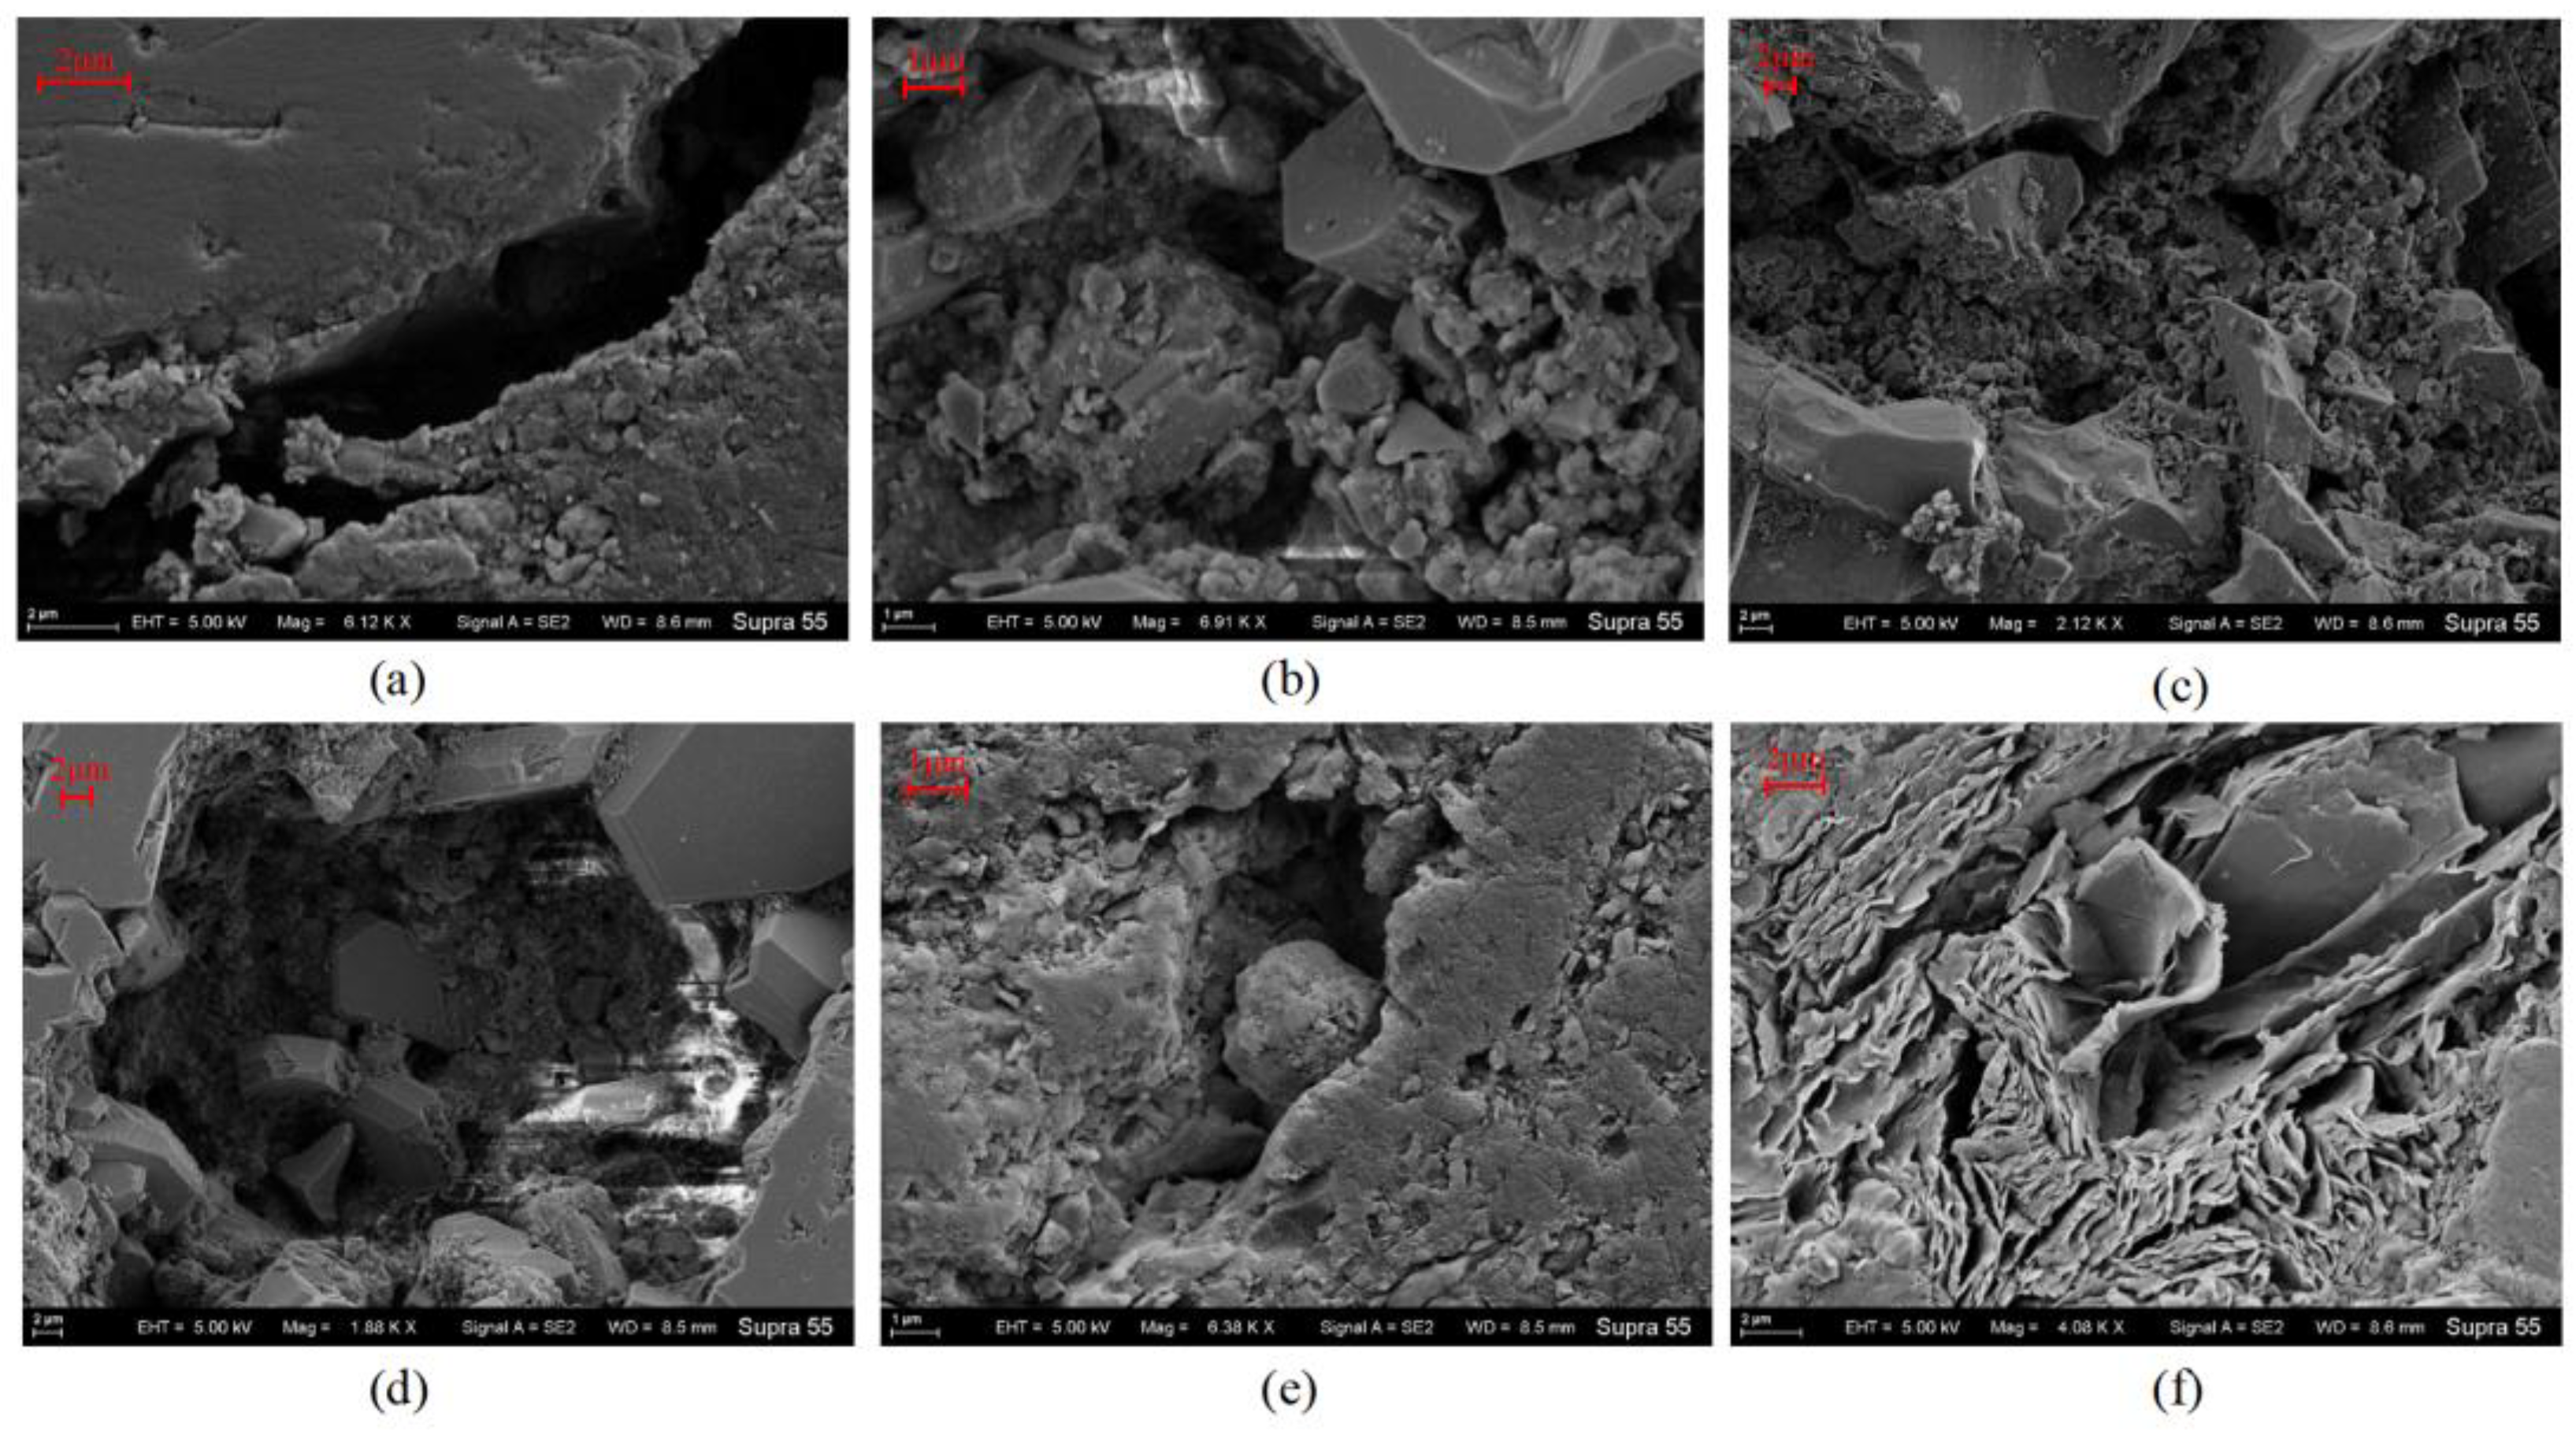
4.2.2. Pore Characteristics

The pore structure of shale plays a critical role in shaping the migration pathways of oil and gas. Shale oil reservoir pores can generally be divided into intercrystalline mineral pores, intracrystalline mineral pores, and organic pores. The first two types include intergranular pores among different mineral grains, dissolution pores, interlayer pores within clay minerals, and so forth. Intergranular pores are the voids between particles in shale; they are generally larger and exhibit better connectivity. Dissolution pores result from the dissolution of soluble minerals (e.g., calcite or feldspar) within the rock, and they are usually larger. Intercrystalline pores lie between mineral crystals, tend to be small, and have relatively poor connectivity. Meanwhile, shale oil reservoirs often contain numerous microfractures, which can enhance both the migration pathways and storage space for shale oil in low-porosity, low-permeability reservoirs [39,40].
Field Emission Scanning Electron Microscopy (FE-SEM) observations reveal diverse hydrocarbon pore spaces, predominantly consisting of dissolution pores, which are widely developed across different lithologies (Figure 4). In the upper sweet spot interval, the rock is primarily composed of clastic particles, followed by dolomite crystals. Authigenic minerals such as albite crystals are present, along with evidence of dissolution of clastic particles. Pores are well-developed, including dissolution pores and intercrystalline pores (Figure 4a–d). The middle mudstone interval exhibits intergranular pores, dissolution pores, and authigenic mineral nodules (Figure 4e). In the lower mudstone interval, the composition includes clastic particles and irregularly shaped illite–smectite mixed-layer minerals, with intercrystalline pores observed among clay minerals (Figure 4f). Moreover, because smectite possesses higher plasticity and ductility, it can absorb and relieve stress through plastic deformation, thus reducing fracture formation. In addition, oil-filling phenomena were observed in some samples.
Porosity and permeability measurements were conducted on the sweet spot reservoir of the Lucaogou Formation in Well J10025 (Figure 5). In the upper sweet spot interval, porosity is relatively higher, ranging from 7% to 23% (with an average of 12.56%); 45% of the samples have porosity above 15%. Permeability spans a wide range, from 0.01 to 32.9 × 10 −3 μm2, with 85% of the samples showing permeability below 5 × 10 −3 μm2 and an average permeability of 1.988 × 10 −3 μm2. Some samples exhibit relatively high permeability values above 10 × 10 −3 μm2, indicating low-porosity and low-permeability characteristics with a degree of heterogeneity. Permeability increases markedly with increasing porosity, presenting a strong positive correlation. This suggests that pore connectivity in the upper sweet spot interval is relatively well-developed, resulting in favorable pore and permeability characteristics.
In the middle mudstone interval, porosity is relatively lower, ranging from 2.6% to 15.1%. About 53.8% of the samples have porosity between 10% and 15%, with an average of 9.92%. Permeability is generally very low, varying from 0.02 to 1.56 × 10 −3 μm2; 92.3% of the samples exhibit permeability below 0.5 × 10 −3 μm2. From a lithological perspective, the middle mudstone interval mostly consists of mudstones and shales, which are highly compact and offer limited storage space. The correlation between porosity and permeability is weak, indicating that even if some samples possess higher porosity, the interval’s overall permeability remains low due to poor pore connectivity and the compact nature of the rock.
In the lower sweet spot interval, porosity ranges from 3.00% to 19.40%, averaging 12.72%; 55% of the samples fall between 10% and 15%. Permeability varies from 0.009 to 0.496 × 10 −3 μm2, with an average of 0.069 × 10 −3 μm2. Although there is some positive correlation between porosity and permeability, it is relatively weak. This indicates that despite relatively high porosity in certain areas, insufficient fracture development or poor pore connectivity constrains overall fluid flow.
Overall, the upper sweet spot interval exhibits a stronger positive correlation between porosity and permeability, largely attributable to better rock connectivity and the presence of brittle minerals, which favor fracture formation and provide effective fluid flow pathways. In contrast, the middle mudstone interval, characterized by higher clay content and compactness, maintains low permeability even when porosity is relatively high, reflecting poor pore connectivity and functioning mainly as a sealing layer. The lower sweet spot interval does show some degree of pore development, yet its permeability remains limited.

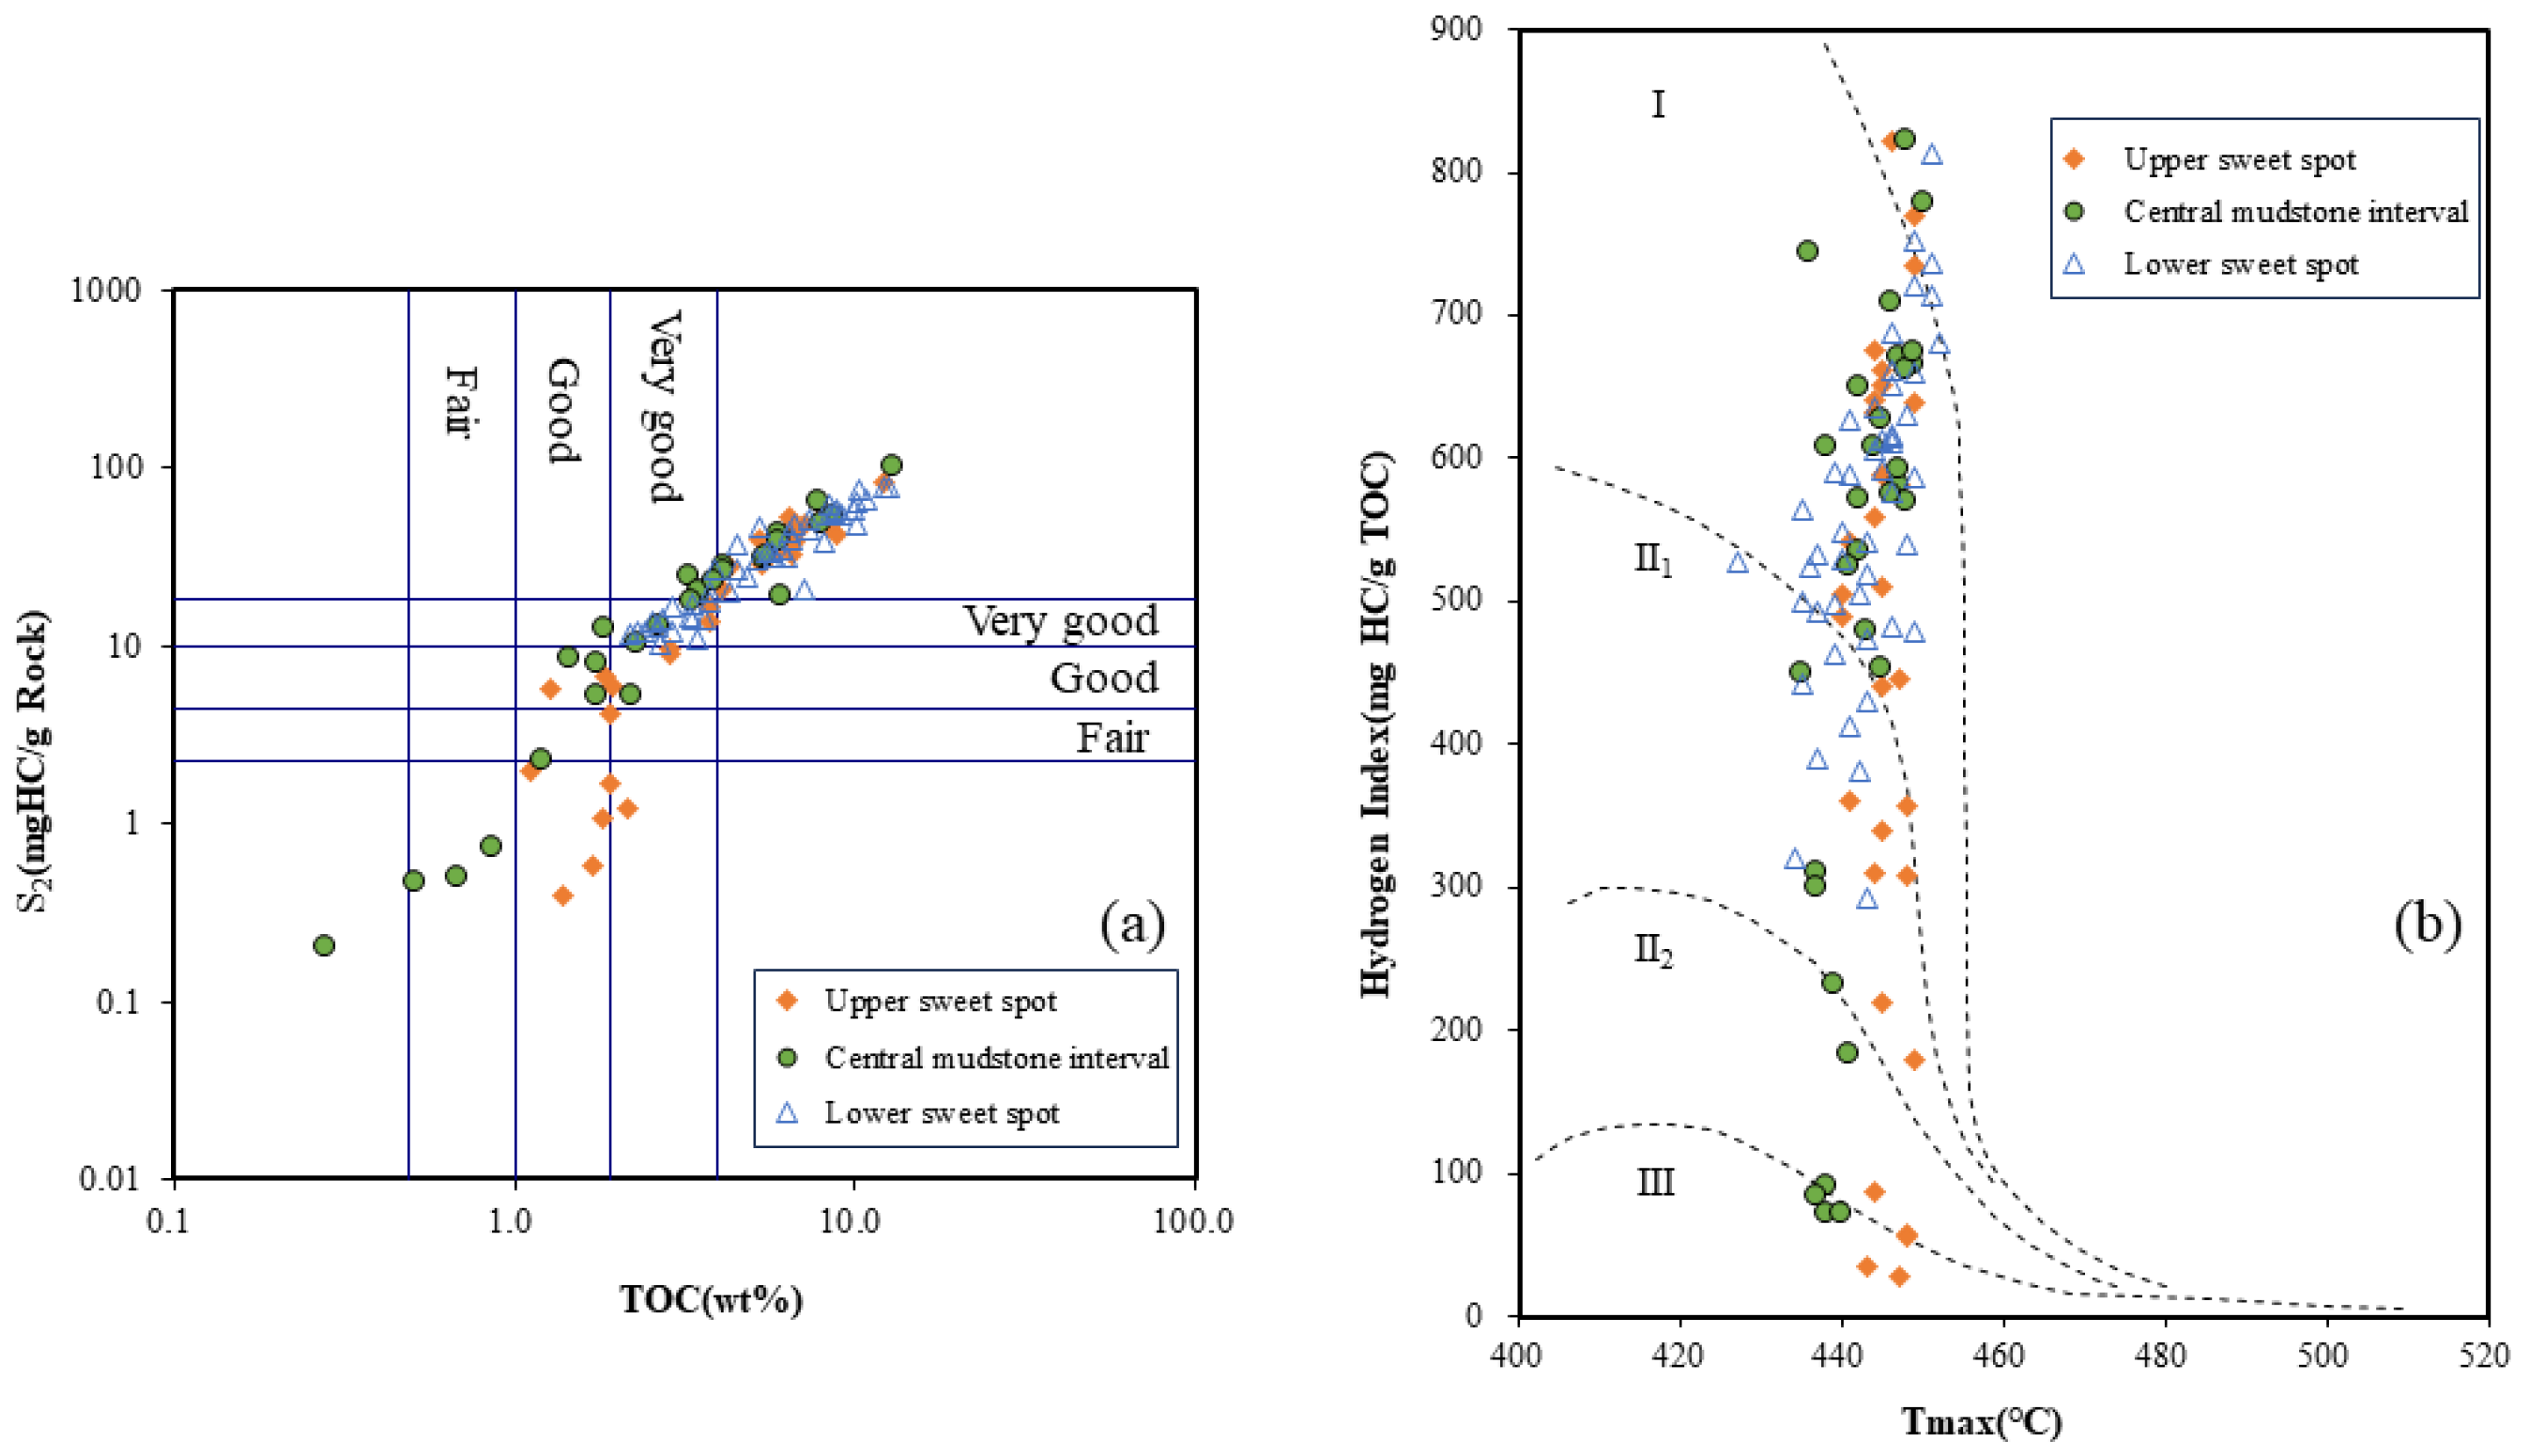
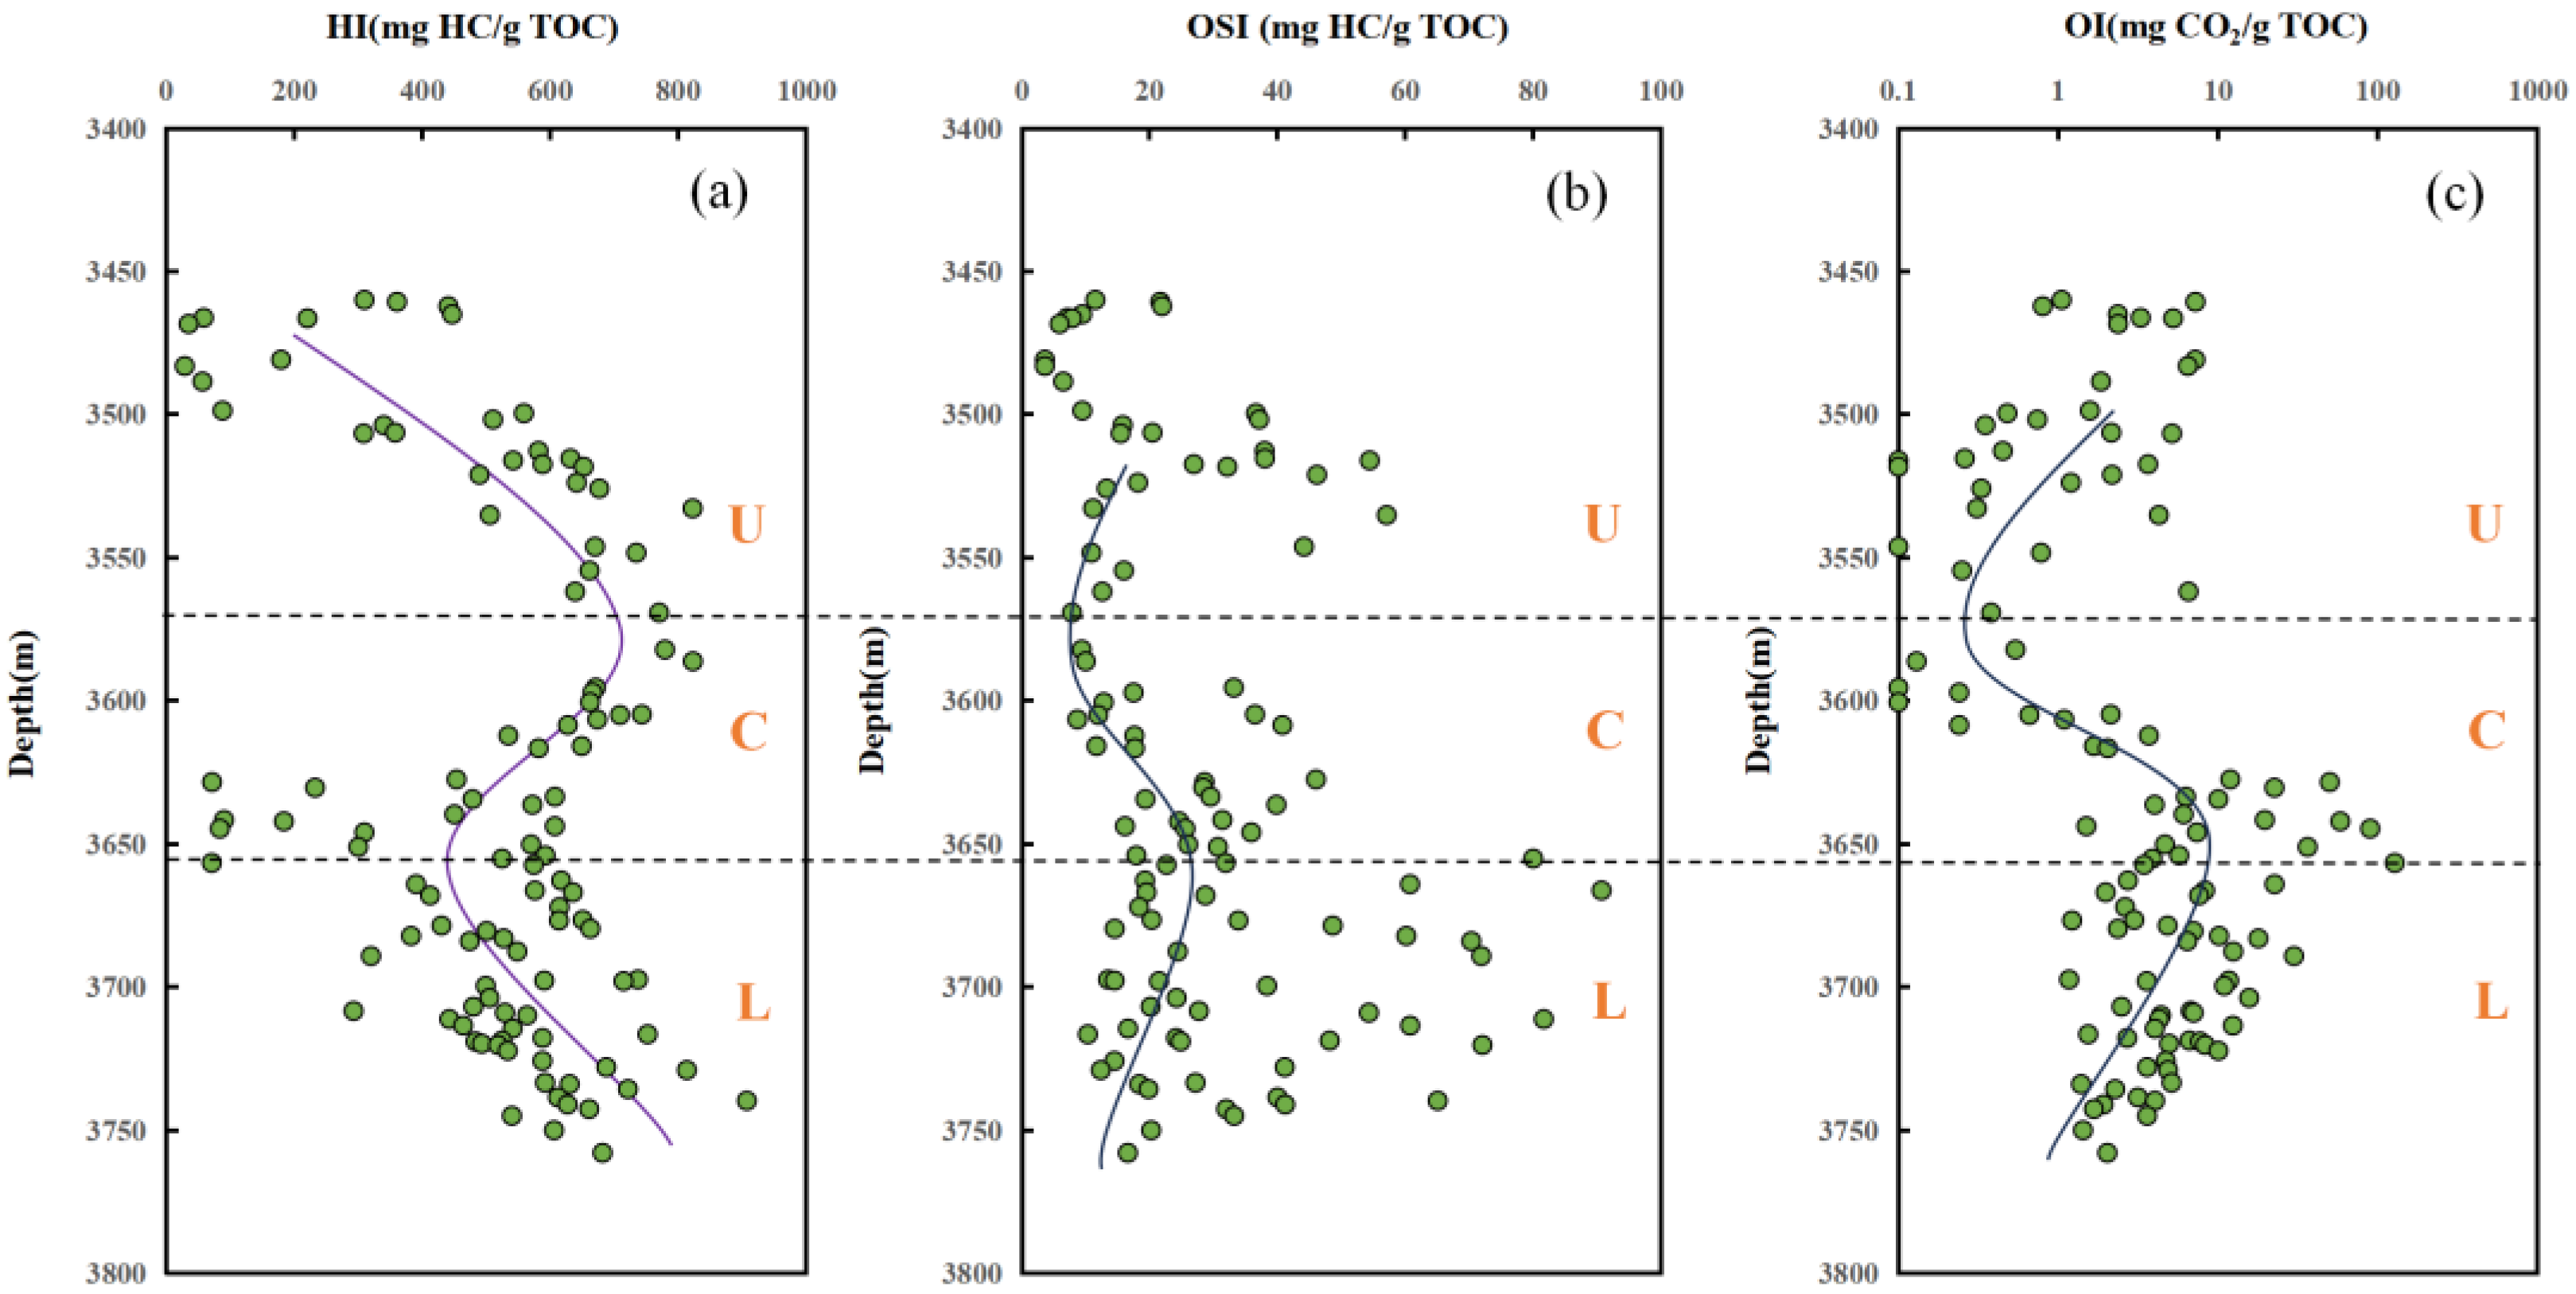
4.3. Hydrocarbon Generation Potential of Source Rocks

In order to ascertain the hydrocarbon generation potential of mudstone-type source rocks in the Lucaogou Formation, TOC and pyrolysis parameters were employed to analyze the abundance, type, and maturity of the organic matter. Table 3 presents the TOC content and pyrolysis parameters of the source rocks from the upper sweet spot interval, middle mudstone interval, and lower sweet spot interval of the Lucaogou Formation in Well J10025.
The TOC of the upper sweet spot section of the Lucaogou Formation is distributed in the range of 1.11~12.20 wt%, with an average value of 4.58 wt%. The average TOC values of the samples of the lower sweet spot section and the middle mudstone section are 4.06 wt% and 5.92 wt%, respectively. The hydrocarbon generation potential (S1 + S2) also shows different distributions, with the average values of the upper, middle, and lower sections (S1 + S2) being 26.32 mg HC/g, 25.50 mg HC/g, and 37.21 mg HC/g, respectively. The organic matter abundance and hydrocarbon generation capacity of the lower sweet spot section are relatively high, while the hydrocarbon generation potential (S1 + S2) of the middle mudstone section is relatively low despite the high TOC, indicating poor hydrocarbon generation conditions. The organic matter abundance and hydrocarbon generation potential of the upper sweet spot section are intermediate between the lower and middle units. From the TOC~S2 relationship diagram (Figure 6a), it can be further seen that all the samples of the lower sweet spot section are high-quality source rocks, while the upper sweet spot section and the middle mudstone section are good–high-quality source rocks as a whole.
According to the Tmax~HI cross-plot (Figure 6b), the organic matter types of the sweet spot section of the Lucaogou Formation span from type I to type II to type III, but the relative content of type III organic matter is likely very small [12,47]. The organic matter types of the lower sweet spot section are mainly type I-II1, while in addition to type I-II1 kerogens, some samples of the upper and lower sweet spots have type II organic matter types, indicating that the lower sweet spot section has better hydrocarbon generation potential than the upper sweet spot section and the middle mudstone section. Considering that the crude oil in the upper sweet spot layer has a good affinity with the source rock of the upper section, the lower sweet spot has a good affinity with the source rock of the lower section, and the extract biomarkers of the source rock of the adjacent layers are consistent [48], the difference in oil quality between the upper and lower sweet spots of the Lucaogou Formation is closely related to the kerogen type of the hydrocarbon-generating parent material.
The Tmax of the upper sweet spot section is between 440–450 °C, with an average of 445 °C, while the Tmax of the middle mudstone section and the lower sweet spot section is 442 °C and 443 °C, respectively. The change in Tmax also shows (Figure 7c) that the organic matter in the Lucaogou Formation may be in a mature stage, and the organic matter maturity in the upper sweet spot is higher than that in the other two sections. The organic matter of the middle mudstone section and the lower sweet spot section ranges from low maturity to over maturity. Generally speaking, the hydrocarbon generation sequence is from bottom to top, and light hydrocarbons are generated at the depth of the initial oil generation window. As the oil generation window moves upward, heavier hydrocarbons are generated. It is speculated that the upper sweet spot section may enter the main oil generation window or the slightly later oil and gas generation stage. The Tmax of the middle mudstone section and the lower sweet spot section varies widely, and some samples (Tmax > 450 °C) may have passed the main oil generation window stage.
In general, about 84% of the samples have a TOC content greater than 2.00 wt%, with an average of 5.03%. More than 86% of the samples have a hydrocarbon generation potential (S1 + S2) greater than 6.00 mg HC/g rock, with an average of 30.89 mg/g, which are good source rocks. According to the Tmax~HI intersection diagram (Figure 6b), the organic matter types in the sweet spot section of the Lucaogou Formation span type I–type II–type III kerogen, but type III organic matter accounts for a small proportion. The highest pyrolysis peak temperature Tmax of the source rock is distributed in the range of 427 °C~452 °C. Almost all samples have a Tmax value of more than 435 °C, with an average of 444 °C, which is in the low-maturity–mature stage.
By using the oil saturation index (OSI = S1 × 100/TOC), hydrogen index (HI), and oxygen index (OI), the hydrocarbon generation potential, organic matter type, and redox environment of the source rock can be analyzed in more detail (Figure 8).
In the upper sweet spot section, TOC and hydrocarbon generation potential (S1 + S2) show an upward trend with increasing burial depth (Figure 7), and the numerical distribution is relatively concentrated, which is a good source rock section, despite a corresponding rise in Tmax, which suggests that these trends are primarily controlled by depositional factors rather than thermal maturity. This pattern likely reflects lake level fluctuations during deposition, where deeper intervals correspond to transgressive highstand systems with enhanced organic matter preservation under anoxic conditions. The parallel enrichment in both TOC and generative potential indicates a higher primary organic input, rather than hydrocarbon retention or post-generative alteration [14,17,49]. In the middle mudstone section, this trend has an inflection point, and the content gradually decreases, which may indicate that the source potential of shale oil in this depth range is relatively small. In the lower sweet spot section, as the burial depth increases further, the content begins to rise again, which may contain a higher organic matter content, showing a certain source rock potential, but the overall distribution is uneven. The distribution range of HI values in the upper sweet spot section is 28.78–822.29 mg HC/g TOC, which is wider than that in the middle mudstone section and the lower sweet spot section, indicating that there is more variability in organic matter composition. The average hydrogen index (HI) of the lower sweet spot section is 568.04 mg HC/g TOC, which is higher than that in the upper sweet spot section and the middle mudstone section. It is mainly hydrogen-rich organic matter, and the organic matter type is mostly type I (Figure 6b). This type of organic matter is mainly composed of algae in the lake environment, and the OI value is relatively low (6.40 mg CO2/g TOC). It is in a reducing environment and has good oil generation potential. At the same time, the hydrogen index (HI) of the upper and lower sweet spots increases with increasing burial depth, indicating that the organic matter type is gradually evolving towards a higher quality hydrocarbon source. With increasing depth, the degree of thermal evolution deepens, and the organic matter releases more hydrogen and forms more hydrocarbon molecules. The decrease in the oxygen index (OI) indicates that the preservation conditions of organic matter in the reducing environment are better and it has experienced less oxidation. In the middle mudstone section, the hydrogen index (HI) decreases with increasing burial depth, while the oxygen index (OI) and oil saturation index (OSI) increase with increasing burial depth. As the burial depth increases, the temperature and pressure in the source rock also increase, causing the thermal cracking of organic matter, releasing hydrocarbon gas and liquid hydrocarbons, and releasing oxygen-containing compounds during thermal degradation, resulting in a relative increase in the oxygen content in the residue. This indicates that the organic matter has undergone significant pyrolysis and oxidation, and type I or type II organic matter has gradually transformed into type III. The source rock is in a mature to over-mature stage, and the hydrocarbon generation potential has decreased.

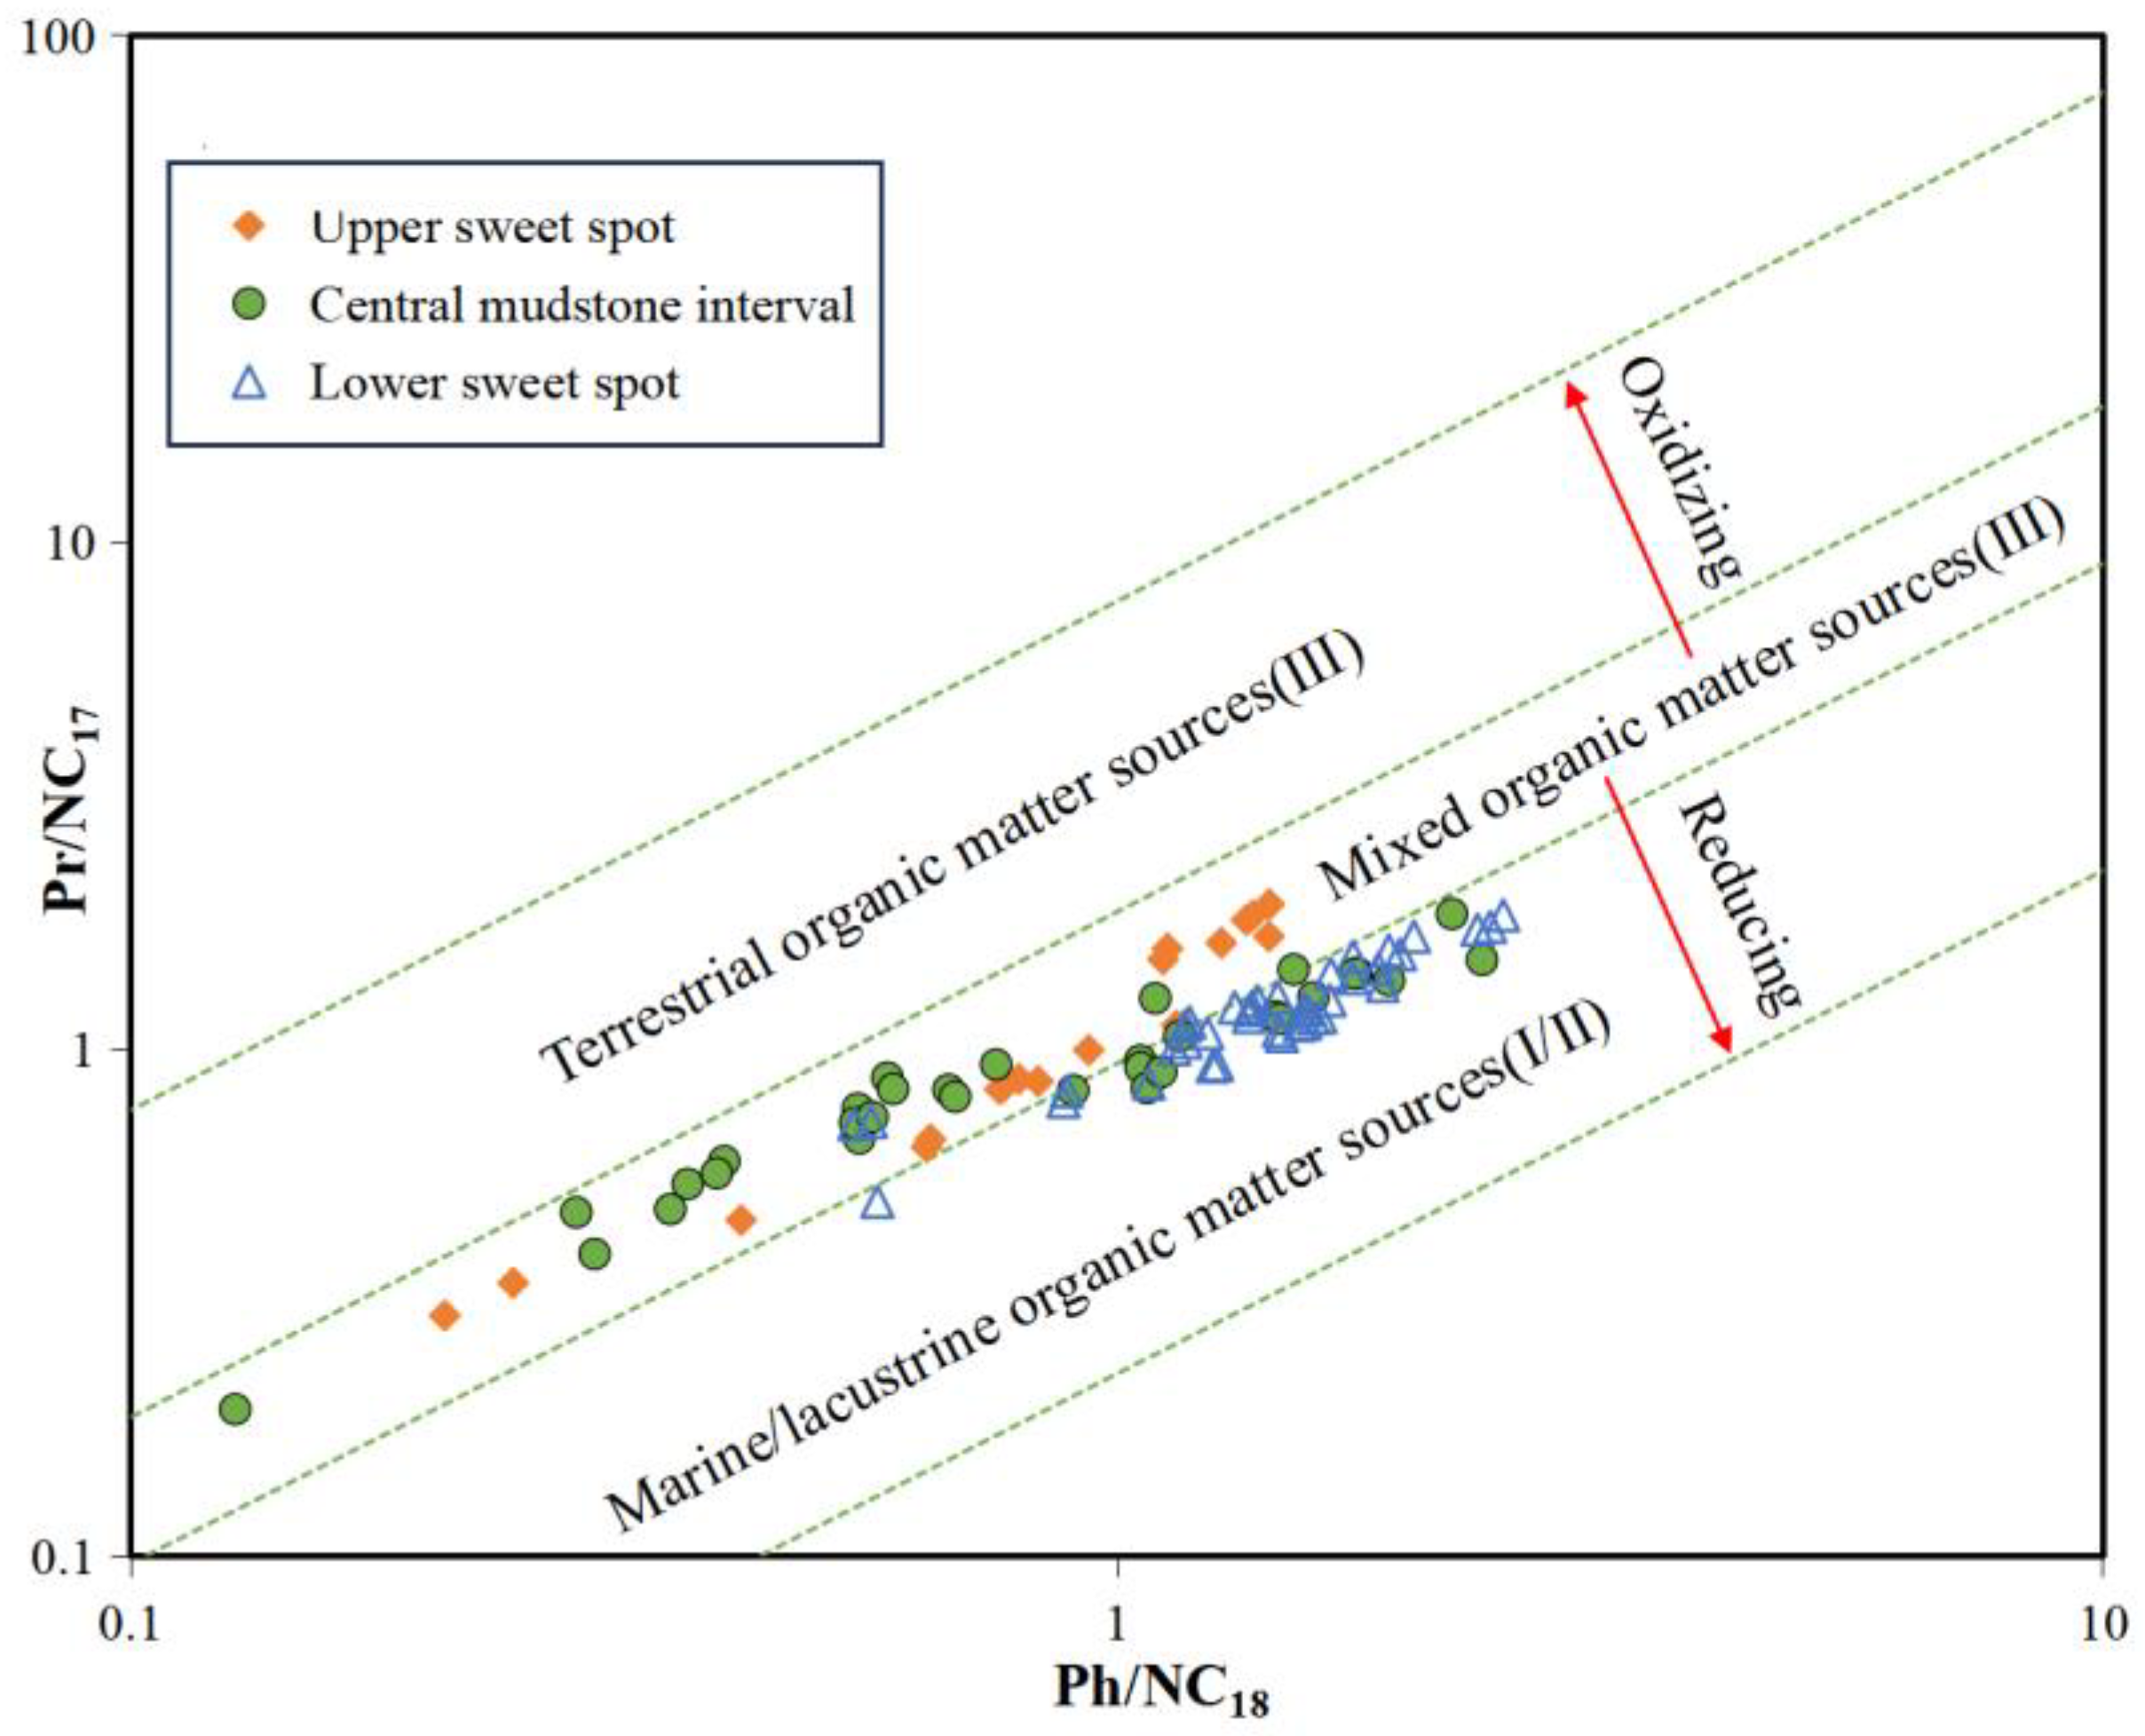
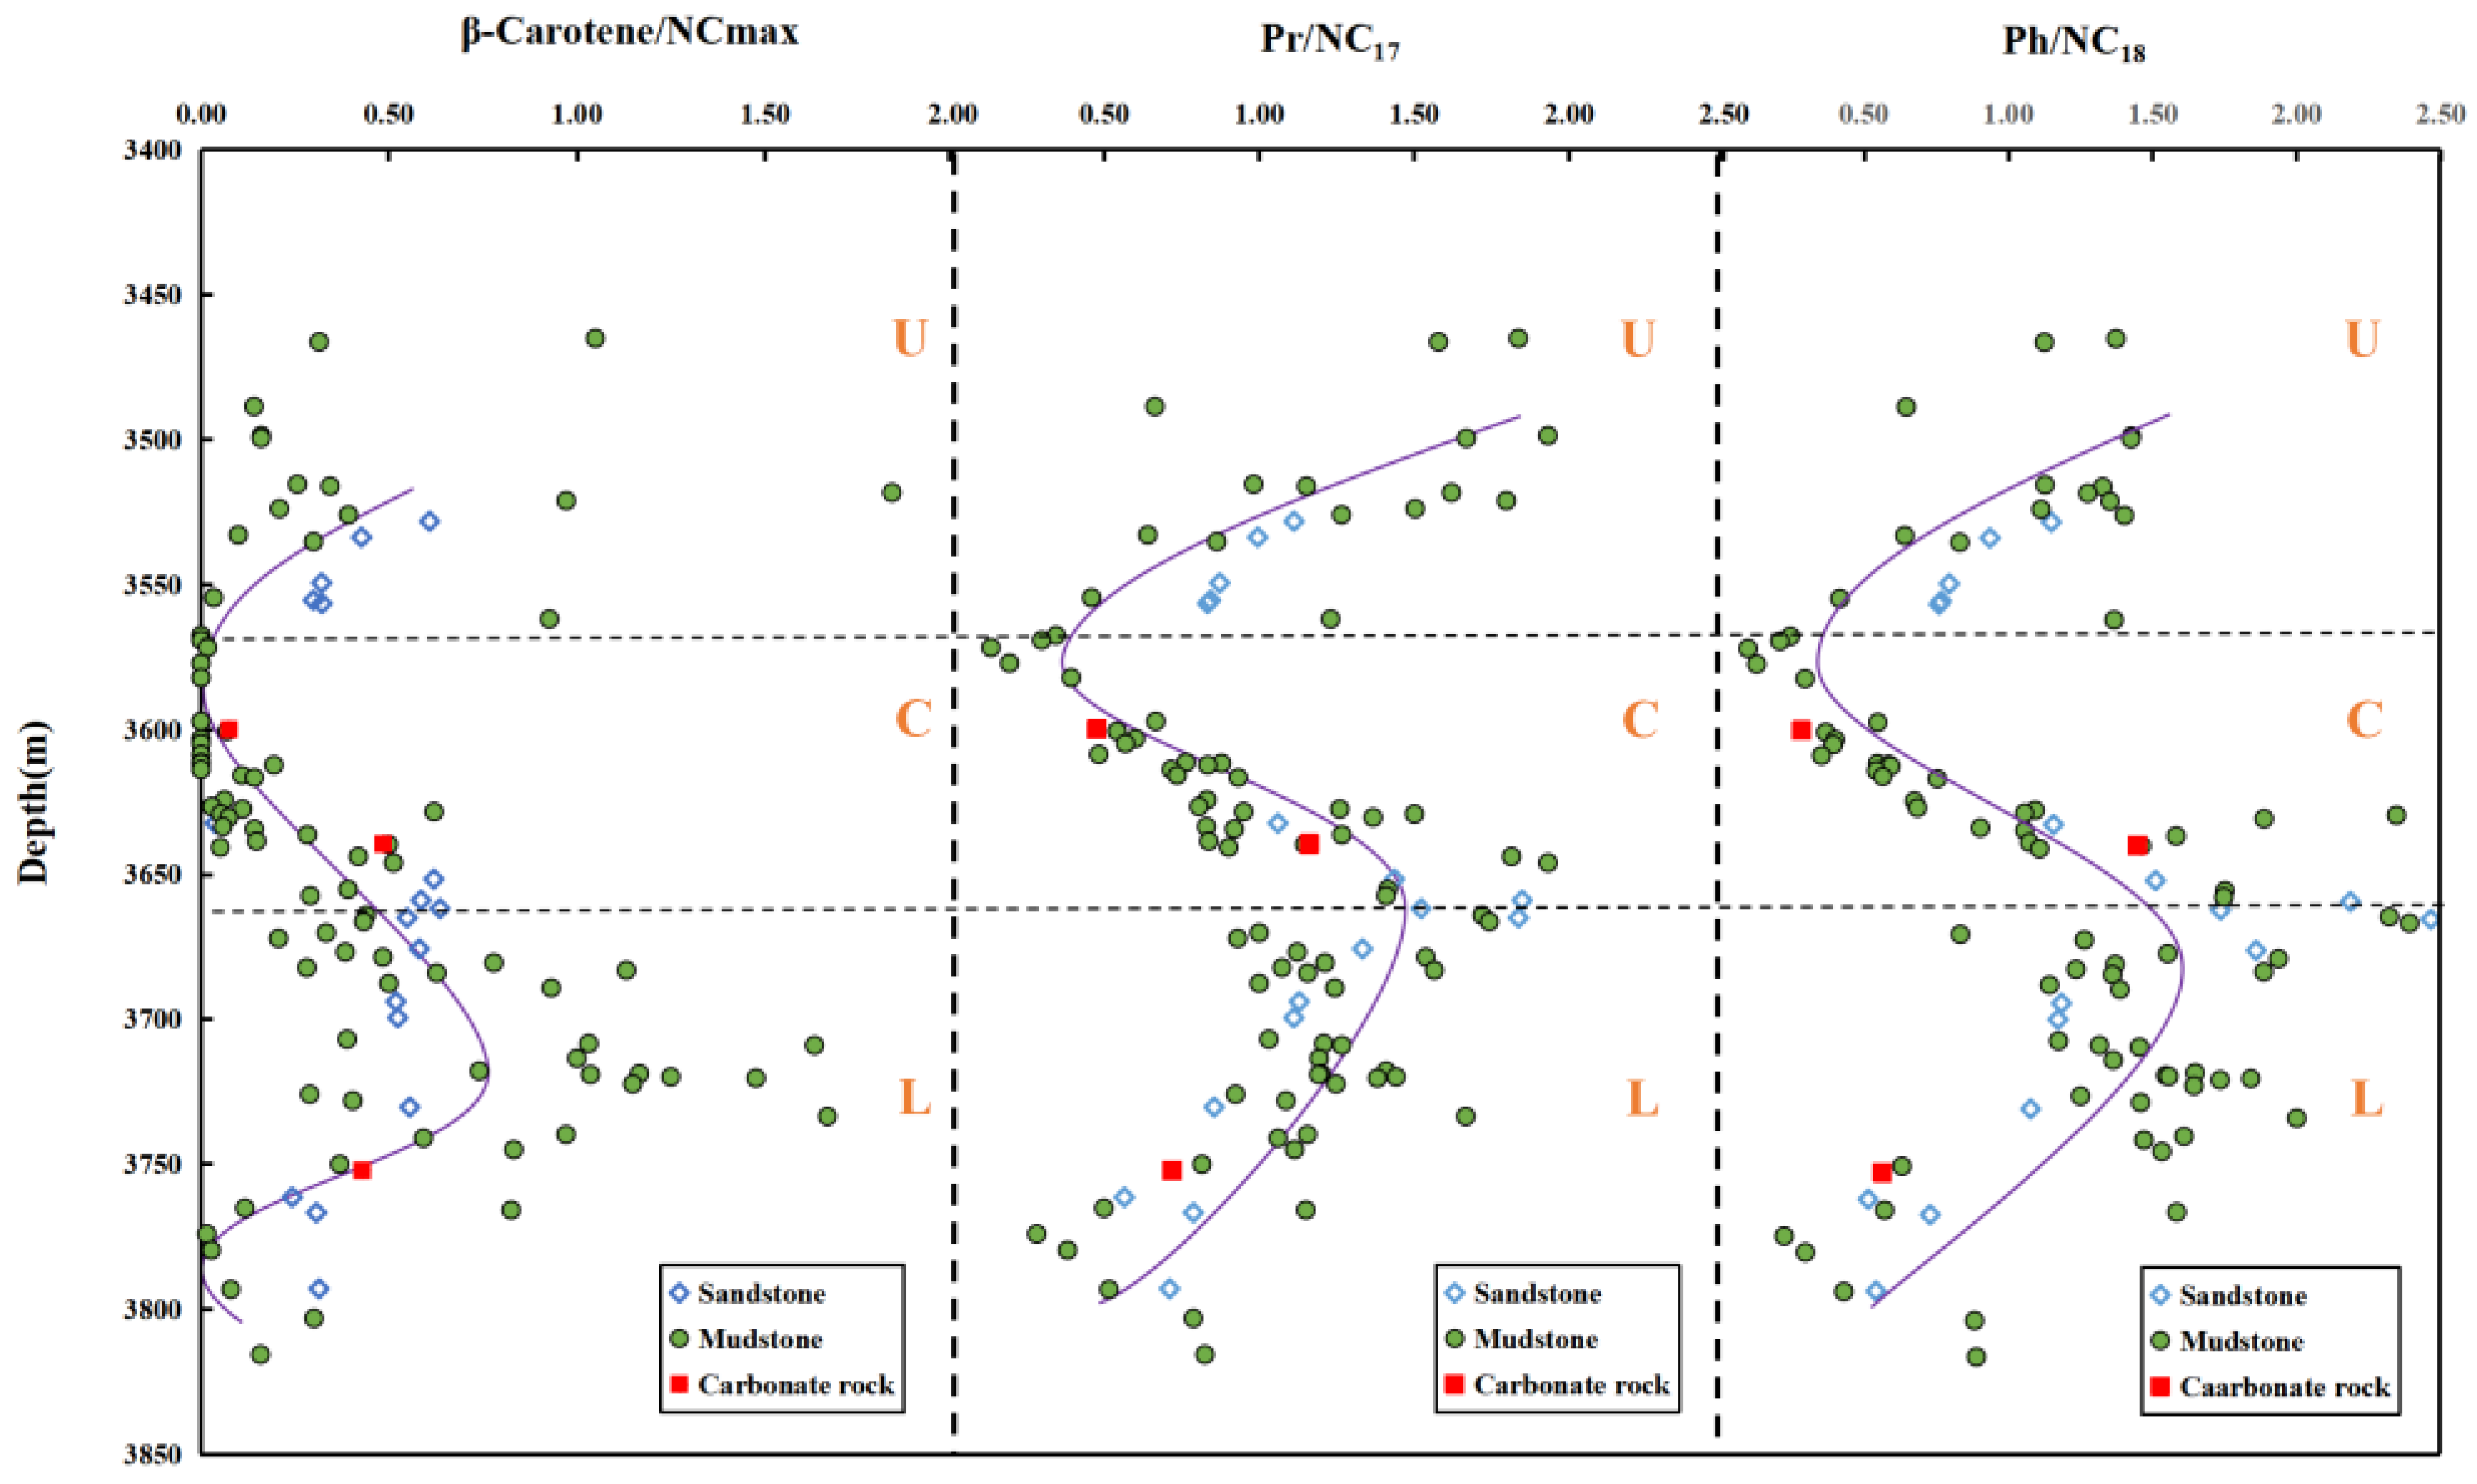
4.4. Biomarker Compound Characteristics

To determine the source of the organic matter in the Lucaogou Formation, biomarker compounds were employed to identify different biological precursors (e.g., algae, terrestrial plants, bacteria, etc.). A cross-plot of Pr/NC17 versus Ph/NC18 indicates that the Lucaogou Formation overall represents a weakly oxidizing to weakly reducing depositional environment (Figure 9). Nearly all samples from the lower sweet spot interval fall within the saline-lake domain, reflecting a more reducing environment. Samples from the upper sweet spot interval lie within the mixed domain. The middle mudstone interval exhibits a more complex organic matter origin: the lower portion, adjoining the lower sweet spot interval, plots in the saline-lake domain, whereas samples closer to the upper sweet spot interval fall in the mixed domain.
Based on the variation trends of β-carotene/NCmax, Pr/NC17, and Ph/NC18 (Figure 10), there are clear differences in organic matter sources and depositional environments at different depths. At greater depths, the environment becomes more reducing, especially from the lower part of the middle mudstone interval down to the lower sweet spot interval, where the sources of organic matter are more complex, with greater input from algae or higher plants. This variation also reflects differences in organic sources among the strata. The figure shows that the Ph/NC18 and Pr/NC17 values exhibit similar fluctuations, suggesting a transition from a weakly oxidizing to a more reducing depositional environment.
From the relationship between OEP and depth and the intersection diagram of TAR and CPI (Figure 11), we can find that the odd–even predominance (OEP) data indicate moderate to high maturity or a dominant algal source, while the terrigenous–aquatic ratio (TAR) and carbon preference index (CPI) trends suggest that the organic matter is predominantly of lacustrine (likely algal) origin with only minor terrestrial input. the data imply that the upper sweet spot is characterized by slightly lower OEP and CPI values, consistent with increased maturity and enhanced algal contribution, whereas the middle mudstone interval displays more heterogeneous signatures, and the lower sweet spot shows a mixed but predominantly lacustrine signal.
From the shallow to deeper sections of the Lucaogou Formation, the C27, C28, and C29 steranes exhibit patterns that transition from “/” to an inverted “V”, and then back to “/” (Figure 12). The marked differences in these parameters between the upper and lower sweet spot intervals confirm the existence of a separating layer between them, further indicating that the upper and lower sweet spots comprise two independent, self-generating and self-storing hydrocarbon systems [50,51].
From a biomarker geochemistry perspective, the observed shift in C28, C28, and C29 sterane distributions from shallow to deeper intervals in the Lucaogou Formation suggests that the upper and lower sweet spots were deposited under distinct conditions and have evolved largely independently. Specifically, the “/–plant–inverted V–/” shape variation in the sterane profiles implies changing organic inputs—ranging from more algal/bacterial (C27-rich) to mixed (C28-dominated) to higher-plant (C29) influences—across stratigraphic boundaries.

5. Discussion

5.1. Sources and Storage Conditions of Organic Matter

The upper sweet spot interval is primarily characterized by a mixed depositional environment and exhibits low β-carotene. Its source rocks mainly correspond to Type I and II kerogens, with high organic matter abundance and hydrocarbon generation potential (average TOC of 4.58 wt% and a hydrocarbon generation potential of 26.32 mg HC/g). The lower sweet spot interval also has relatively high organic matter abundance (average TOC of 4.06 wt%) and hydrocarbon generation potential (37.21 mg HC/g). Although its hydrocarbon generation potential is quite high, it does not surpass that of the upper sweet spot interval. The elevated abundance of C29 steranes in both the upper and lower sweet spot intervals can be attributed to green algae rather than terrestrial plants [52], indicating that both sweet spot intervals contain organic-rich, algal-derived source rocks. The total organic carbon (TOC) and hydrogen index (HI) of the Lucaogou source rocks are higher than those of most other lacustrine systems. In contrast, in Brazil, the Irati Formation (Paraná Basin) is a carbonate- and organic-rich mixed shale sequence with TOC contents ranging from 0.59% to 3.18% and S1 and S2 yields of 0.03–5.49 mg HC/g rock and 0.03–12.45 mg HC/g rock, respectively [53].
The preservation of organic matter in the Lucaogou Formation was favored by anoxic and stratified lake conditions. During deposition, the basin was an oxygen-depleted lacustrine setting—evidence suggests that an anoxic photic zone existed in both upper and lower sweet spot periods [49,54,55]. This means oxygen was severely limited not just at the lake bottom, but possibly up into the sunlit zone, creating euxinic conditions that are highly conducive to OM preservation. In the lower Permian stage, the climate was hotter and more arid, leading to high evaporation and a shallow, hypersaline lake [47,56]. The alternation of deep, anoxic, organic-rich deposition with shallower, reservoir-prone deposition is a “golden combination” for shale oil: it creates a source (shale) + reservoir (siltstone) couplet repeated in the stratigraphy. In Lucaogou, the upper and lower sweet spots are essentially two such couplets produced by two lake cycles. Paleoenvironmental analysis shows that oil enrichment is highest where primary productivity was maximized and dilution minimized. For instance, the nutrient-fueled algal blooms ensured a bounty of organic matter, while the anoxic, stratified waters preserved it—leading to richly petroliferous source rocks. Immediately following, a regressive phase laid down permeable fabrics to store that oil. If any of these factors were lacking (say the lake was fully oxic, or no sand layers were deposited), the sweet spots would be far less productive [17,21].

5.2. Reservoir Properties of Shale

The rock properties and lithology govern how and where that oil is stored and producible. The interbedded nature of organic-rich shale and tighter or porous layers creates a self-contained source–reservoir system. Oil is generated in the organic mudstones and immediately imbibed or expelled into adjacent siltstone/dolomite layers which act as reservoirs. The lower sweet spot is characterized by carbonate-rich mudstones with minor clastics, whereas the upper sweet spot contains a greater fraction of terrigenous silt-sand interbedded with mudstone. Both intervals are “hybrid” reservoirs made of interlaminated shale and tight sand/carbonate, which leads to marked heterogeneity in rock properties [40,57,58] The upper sweet spot interval has excellent reservoir properties, with relatively high porosity (average 12.56%) and permeability (average 1.988 × 10 −3 μm2), and a fairly well-connected pore structure. This interval is mainly characterized by intergranular pores, dissolution pores, and intercrystalline pores. These pores are well developed and exhibit good connectivity. In addition, numerous microfractures in the upper sweet spot interval enhance the lateral migration of hydrocarbons. The presence of these interconnected pores and fractures allows hydrocarbons to accumulate in close proximity to the organic-rich source rock, thereby increasing the potential for effective storage and subsequent production [59,60,61].
By contrast, although the lower sweet spot interval has a similar average porosity (12.72%), its permeability is much lower (average 0.069 × 10 −3 μm2). Although the lower sweet spot interval also contains dissolution pores and intercrystalline pores, their development is uneven, and pore connectivity is poor, limiting effective hydrocarbon migration. As a result, hydrocarbons mainly accumulate in place. The central mudstone interval acts as a barrier due to its low permeability and high density, restricting hydrocarbon migration and providing an important sealing function in the process of hydrocarbon migration and accumulation.

6. Conclusions

The upper and lower sweet spots of the Lucaogou Formation are products of a fortunate convergence of geological factors. High-quality source rocks (Type I/II kerogen, high TOC) provide ample hydrocarbon generation; mixed lithologies supply built-in reservoir intervals and brittle mechanical properties; and favorable paleoenvironmental conditions (anoxic, stratified lacustrine settings with periodic algal blooms) enabled both the creation and preservation of these shale oil resources. The slight differences between the upper and lower sweet spots—in organic facies, lithology, and depositional setting—yield some variations in hydrocarbon distribution. However, both sweet spots are fundamentally rich in oil and demonstrate how depositional processes control shale oil “sweetness”. As research continues (integrating core data, geochemistry, and production tests), the research of our Lucaogou is becoming more and more expansive—but clearly, it is the interplay of organic-rich source quality, rock reservoir attributes, and the paleo-lake environment that governs the hydrocarbon supply and enrichment in this formation. The lessons from Lucaogou may serve as a reference for analogous lacustrine shale oil plays worldwide, where recognizing the “fingerprints” of past environments is key to finding the next sweet spot.

Author Contributions

Conceptualization, X.Z.; methodology, C.J.; formal analysis, W.L.; writing—original draft, S.C.; writing—review and editing, S.C. All authors have read and agreed to the published version of the manuscript.

Funding

This work received financial support from the Natural Science Foundation of Xinjiang Uygur Autonomous Region of China (grant no. 2023D01A20) and Xinjiang Uygur Autonomous Region Key R&D Special Project: Development of Hydrocarbon Accumulation Evaluation Technology for Ultra-Deep Complex Fault Zones in Basins (2024B01015-3).

Data Availability Statement

The original contributions presented in the study are included in the article; further inquiries can be directed to the corresponding author.

Conflicts of Interest

Author Chenggang Jiang was employed by the company Jianghan Oilfield Branch Company, Sinopec. The remaining authors declare that the research was conducted in the absence of any commercial or financial relationships that could be construed as a potential conflict of interest.

References

  1. Katz, B.; Gao, L.; Little, J.; Zhao, Y.R. Geology still matters—Unconventional petroleum system disappointments and failures. Unconv. Resour. 2021, 1, 18–38. [Google Scholar] [CrossRef]
  2. Blaizot, M. Worldwide shale-oil reserves: Towards a global approach based on the principles of Petroleum System and the Petroleum System Yield. Bull. Société Géologique Fr. 2017, 188. [Google Scholar] [CrossRef]
  3. Jia, C.; Zheng, M.; Zhang, Y. Unconventional hydrocarbon resources in China and the prospect of exploration and development. Pet. Explor. Dev. 2012, 39, 139–146. [Google Scholar] [CrossRef]
  4. Du, J.; He, H.; Li, J.; Yang, T.; Huang, F.; Guo, B.; Yan, W. Progress in China’s tight oil exploration and challenges. China Pet. Explor. 2014, 19, 1. [Google Scholar]
  5. Jarvie, D.M. Shale resource systems for oil and gas: Part 2—Shale-oil resource systems. In Shale Reservoirs—Giant Resources for the 21st Century; Breyer, J.A., Ed.; AAPG Memoir; American Association of Petroleum Geologists: Tulsa, OK, USA, 2012; Volume 97, pp. 89–119. [Google Scholar] [CrossRef]
  6. Fang, S.; Song, Y.; Xu, H.; Fan, R.; Liu, L.; Xu, X. Relationship between tectonic evolution and petroleum system formation—Taking the Jimsar Sag of eastern Junggar Basin as an example. Pet. Explor. Dev. 2007, 29, 149–153. [Google Scholar] [CrossRef]
  7. Cao, Z.; Liu, G.; Kong, Y.; Wang, C.; Niu, Z.; Zhang, J.; Geng, C.; Shan, X.; Wei, Z. Lacustrine tight oil accumulation characteristics: Permian Lucaogou Formation in Jimusaer Sag, Junggar Basin. Int. J. Coal Geol. 2016, 153, 37–51. [Google Scholar] [CrossRef]
  8. Qiu, Z.; Zou, C.; Dong, D.; Lu, B.; Shi, Z.; Tao, H.; Zhou, J.; Lei, D.; Zhang, C. Petroleum system assessment of conventional-unconventional oil in the Jimusar sag, Junggar basin, Northwest China. J. Unconv. Oil Gas Resour. 2016, 16, 53–61. [Google Scholar] [CrossRef]
  9. Liu, B.; Bechtel, A.; Gross, D.; Fu, X.; Li, X.; Sachsenhofer, R.F. Middle Permian environmental changes and shale oil potential evidenced by high-resolution organic petrology, geochemistry and mineral composition of the sediments in the Santanghu Basin, Northwest China. Int. J. Coal Geol. 2018, 185, 119–137. [Google Scholar] [CrossRef]
  10. Wei, Y.; Wu, J.; Liu, S.; Wang, Z.; Luo, Y.; Liu, W. The Characteristics of Microscopic Heterogeneity and Its Influence on Imbibition in Shale Oil Reservoirs in Permian Lucaogou Formation, Jimsar Sag, Junggar Basinjin. In 2023 International Conference on Energy Engineering; Chen, Z., Yang, W., Chen, H., Eds.; Lecture Notes in Electrical Engineering; Springer: Singapore, 2024; Volume 1257, pp. 364–377. [Google Scholar] [CrossRef]
  11. Carroll, A.R. Upper Permian lacustrine organic facies evolution, southern Junggar basin, NW China. Org. Geochem. 1998, 28, 649–667. [Google Scholar] [CrossRef]
  12. Gao, G.; Zhang, W.; Xiang, B.; Liu, G.; Ren, J. Geochemistry characteristics and hydrocarbon-generating potential of lacustrine source rock in Lucaogou Formation of the Jimusaer Sag, Junggar Basin. J. Pet. Sci. Eng. 2016, 145, 168–182. [Google Scholar] [CrossRef]
  13. Liu, B.; Bechtel, A.; Sachsenhofer, R.F.; Gross, D.; Gratzer, R.; Chen, X. Depositional environment of oil shale within the second member of Permian Lucaogou Formation in the Santanghu Basin, Northwest China. Int. J. Coal Geol. 2017, 175, 10–25. [Google Scholar] [CrossRef]
  14. Yang, Y.; Qiu, L.; Wan, M.; Jia, X.; Cao, Y.; Lei, D.; Qu, C. Depositional model for a salinized lacustrine basin: The Permian Lucaogou Formation, Jimsar Sag, Junggar Basin, NW China. J. Asian Earth Sci. 2019, 178, 81–95. [Google Scholar] [CrossRef]
  15. Pang, H.; Pang, X.-q.; Dong, L.; Zhao, X. Factors impacting on oil retention in lacustrine shale: Permian Lucaogou Formation in Jimusaer Depression, Junggar Basin. J. Pet. Sci. Eng. 2018, 163, 79–90. [Google Scholar] [CrossRef]
  16. Su, S.; Jiang, Z.; Shan, X.; Zhang, C.; Zou, Q.; Li, Z.; Zhu, R. The effects of shale pore structure and mineral components on shale oil accumulation in the Zhanhua Sag, Jiyang Depression, Bohai Bay Basin, China. J. Pet. Sci. Eng. 2018, 165, 365–374. [Google Scholar] [CrossRef]
  17. Qu, C.-S.; Qiu, L.-W.; Cao, Y.-C.; Yang, Y.-Q.; Yu, K.-H. Sedimentary environment and the controlling factors of organic-rich rocks in the Lucaogou Formation of the Jimusar Sag, Junggar Basin, NW China. Pet. Sci. 2019, 16, 763–775. [Google Scholar] [CrossRef]
  18. Jiang, Y.; Hou, D.; Li, H.; Zhang, Z.; Guo, R. Impact of the Paleoclimate, Paleoenvironment, and Algae Bloom: Organic Matter Accumulation in the Lacustrine Lucaogou Formation of Jimsar Sag, Junggar Basin, NW China. Energies 2020, 13, 1488. [Google Scholar] [CrossRef]
  19. Wang, Y.; Cao, J.; Tao, K.; Li, E.; Ma, C.; Shi, C. Reevaluating the source and accumulation of tight oil in the middle Permian Lucaogou Formation of the Junggar Basin, China. Mar. Pet. Geol. 2020, 117, 104384. [Google Scholar] [CrossRef]
  20. Fu, X.; Su, X.; Gong, L.; Wang, Q.; Gao, S.; Xie, Z. Control of faults and fractures on shale oil enrichment. Geoenergy Sci. Eng. 2023, 228, 212080. [Google Scholar] [CrossRef]
  21. Wang, Y.; Cao, J.; Tao, K.; Zhang, C.; Xiang, B.; Li, E.; Yu, S.; Pan, C. Origin of heavy shale oil in saline lacustrine basins: Insights from the Permian Lucaogou Formation, Junggar Basin. AAPG Bull. 2023, 107, 1553–1579. [Google Scholar] [CrossRef]
  22. Lathbl, M.A.; Haque, A.E.; Hakimi, M.H.; Lashin, A.; Qadri, S.M.T. Organic geochemical characteristics of the Late Cretaceous coal and carbonaceous shale succession from the Taranaki Basin, New Zealand: Implications for sedimentary environmental setting and petroleum generation potential. Geol. J. 2024, 59, 1703–1723. [Google Scholar] [CrossRef]
  23. Li, M.Y.; Wu, S.T.; Zhu, R.K.; Hu, S.Y.; Wang, P.W.; Cai, Y.; Zhang, S.R. Heterogeneity and Sedimentary Characteristics of Shale Laminae of Fine-Grained Sediments in Alkaline Lacustrine Strata in the Permian Fengcheng Formation, Mahu Sag, NW China. Energies 2024, 17, 962. [Google Scholar] [CrossRef]
  24. Wei, L.; Jiangyan, L.; Jihong, L.; Jin, D.; Yang, G.; Yan, Z.; Tingting, L.; Shilong, C. Heterogeneous characteristics and genesis of shale in Chang 7 3 sub member Ordos Basin. Chin. J. Geol. 2025, 60, 484–496. [Google Scholar] [CrossRef]
  25. Ali, F.; Abbas, S.; Hanif, M.; Zhang, S.; Ahmad, R.; Zhang, Y.; Khan, D.; Lee, E.Y.; Ahmed, M.S.; Fathy, D. Biomarker and Geochemical Evaluation of Source Rock and Crude Oil Extract for Correlation, Depositional Setting and Source Rock Potential in the Indus Basin, Pakistan. J. Geol. Soc. India 2025, 101, 508–521. [Google Scholar] [CrossRef]
  26. Ari, M.A.I.; Nton, M.E.; Harouna, M. Biomarker geochemistry and oil-oil correlation from reservoir unit oils of the Sokor-1 Formation, Fana low uplift, Termit Basin, southeastern Niger. J. Afr. Earth Sci. 2025, 223, 105522. [Google Scholar] [CrossRef]
  27. Bagheri, S.; Pourbagher, M.; Shourab, M. Geochemical evaluation of Sarvak oil reservoir using biomarkers, carbon isotope and trace element: A case study from Southwest Iran. J. Nat. Gas Geosci. 2024, 9, 281–302. [Google Scholar] [CrossRef]
  28. Mohialdeen, I.M.J.; Hakimi, M.H.; Fatah, S.S.; Abdula, R.A.; Khanaqa, P.A.; Lathbl, M.A.; Naseem, W. Organic Geochemistry and 1-D Basin Modeling of the Late Triassic Baluti Formation: Implication of Shale Oil Potential in the Kurdistan Region of Iraq. ACS Omega 2024, 9, 7085–7107. [Google Scholar] [CrossRef] [PubMed]
  29. AlSaif, M.; Atwah, I.; Becker, M.; Moldowan, J.M.; Zumberge, A.; Marcantonio, F. Diamondoids, biomarkers, and chemofacies: Uniting insights on hydrocarbon maturation and migration in the Cline Shale, Midland Basin. Org. Geochem. 2025, 203, 104953. [Google Scholar] [CrossRef]
  30. Hu, T.; Liu, Y.; Jiang, F.J.; Pang, X.Q.; Wang, Q.F.; Zhou, K.; Wu, G.Y.; Jiang, Z.X.; Huang, L.L.; Jiang, S.; et al. A novel method for quantifying hydrocarbon micromigration in heterogeneous shale and the controlling mechanism. Energy 2024, 288, 129712. [Google Scholar] [CrossRef]
  31. Wang, J.P.; Li, B.H.; Shao, H.M.; Zhang, Y.H.; Zhang, C.J.; Gao, B.; Jiang, Z.X.; Qiu, H.Y.; Li, X.H. Geochemical and Reservoir Characteristics of the Middle-High-Mature Shale of the Jurassic Lianggaoshan Formation in Northeast Sichuan Basin and Their Influence on Shale Oil Enrichment. ACS Omega 2025, 10, 14094–14114. [Google Scholar] [CrossRef]
  32. Zhu, Z.W.; Fu, Q.; Hu, Z.Q.; Duan, H.L.; Yang, B.L.; Xing, L.L.; Chen, G. Pore Structure and Heterogeneity in the Lacustrine Shale of the Second Member of the Paleogene Funing Formation, Subei Basin, China. Minerals 2024, 14, 1248. [Google Scholar] [CrossRef]
  33. Allen, M.; ªengör, A.M.C.; Natal’In, B. Junggar, Turfan and Alakol basins as Late Permian to? Early Triassic extensional structures in a sinistral shear zone in the Altaid orogenic collage, Central Asia. J. Geol. Soc. 1995, 152, 327–338. [Google Scholar] [CrossRef]
  34. Xiao, W.; Han, C.; Yuan, C.; Sun, M.; Lin, S.; Chen, H.; Li, Z.; Li, J.; Sun, S. Middle Cambrian to Permian subduction-related accretionary orogenesis of Northern Xinjiang, NW China: Implications for the tectonic evolution of central Asia. J. Asian Earth Sci. 2008, 32, 102–117. [Google Scholar] [CrossRef]
  35. Boles, J.R.; Eichhubl, P.; Garven, G.; Chen, J. Evolution of a hydrocarbon migration pathway along basin-bounding faults: Evidence from fault cement. AAPG Bull. 2004, 88, 947–970. [Google Scholar] [CrossRef]
  36. Kuang, L.; Gao, G.; Xiang, B.; Wang, X.; Wang, C.; Liu, G. Lowest limit of organic carbon content in effective source rocks from Lucaogou Formation in Jimusar Sag. Pet. Geol. Exp. 2014, 36, 224–229. [Google Scholar] [CrossRef]
  37. Li, K.; Xi, K.; Cao, Y.; Wang, Y.; Lin, M. Genesis of granular calcite in lacustrine fine-grained sedimentary rocks and its indication to volcanic-hydrothermal events: A case study of Permian Lucaogou Formation in Jimusar Sag, Junggar Basin, NW China. Pet. Explor. Dev. 2023, 50, 541–552. [Google Scholar] [CrossRef]
  38. Carr, A.D. Suppression and retardation of vitrinite reflectance, part 1. Formation and significance for hydrocarbon generation. J. Pet. Geol. 2000, 23, 313–343. [Google Scholar] [CrossRef]
  39. Gale, J.F.W.; Laubach, S.E.; Olson, J.E.; Eichhubl, P.; Fall, A. Natural fractures in shale: A review and new observations. AAPG Bull. 2014, 98, 2165–2216. [Google Scholar] [CrossRef]
  40. Zhang, Y.; Zeng, L.; Luo, Q.; Zhu, R.; Pan, S.; Dai, Q.; Shi, J.; Qin, J.; Xu, X. Effects of diagenesis on natural fractures in tight oil reservoirs: A case study of the Permian Lucaogou Formation in Jimusar Sag, Junggar Basin, NW China. Geol. J. 2020, 55, 6562–6579. [Google Scholar] [CrossRef]
  41. Liu, C.; Liu, K.; Wang, X.; Zhu, R.; Wu, L.; Xu, X. Chemo-sedimentary facies analysis of fine-grained sediment formations: An example from the Lucaogou Fm in the Jimusaer sag, Junggar Basin, NW China. Mar. Pet. Geol. 2019, 110, 388–402. [Google Scholar] [CrossRef]
  42. Standardization Administration of China. GB/T 19145-2022—Determination for Total Organic Carbon in Sedimentary Rock; China Standard Press: Beijing, China, 2022. [Google Scholar]
  43. Standardization Administration of China. GB/T 18062-2012—Rock Pyrolysis Analysis; China Standard Press: Beijing, China, 2012. [Google Scholar]
  44. National Energy Administration. SY/T 5118-2021—Determination of Extractive Content in Rocks; Petroleum Industry Press: Beijing, China, 2022. [Google Scholar]
  45. National Energy Administration. SY/T 5119-2016—Analysis of Soluble Organic Matter and Crude Oil Components in Rocks; Petroleum Industry Press: Beijing, China, 2016. [Google Scholar]
  46. Standardization Administration of China. GB/T 18606-2017—The Test Method for Biomarkers in Sediment and Crude Oil by GC–MS; China Standard Press: Beijing, China, 2017. [Google Scholar]
  47. Tang, Y.; Wang, X.; Wang, T.; Hei, C.; Liang, S.; Cheng, H. Reconstruction of sedimentary paleoenvironment of Permian Lucaogou Formation and its implications for the organic matter enrichment in south-eastern Junggar Basin, China. Front. Earth Sci. 2024, 18, 526–537. [Google Scholar] [CrossRef]
  48. Dow, W.G. Kerogen studies and geological interpretations. J. Geochem. Explor. 1977, 7, 79–99. [Google Scholar] [CrossRef]
  49. Qiao, J.; Luo, Q.; Zhang, K.; Zhang, G.; Duan, J.; Wang, D.; Yu, H.; Wang, S.; Qu, Y.; Kopaevich, L. Geochemistry and organic petrography of the Middle Permian Lucaogou alkaline lacustrine oil shale in the southern Junggar Basin, China: Implications for formation conditions and organic matter accumulation. Int. J. Coal Geol. 2023, 268, 104198. [Google Scholar] [CrossRef]
  50. Moldowan, J.M.; Sundararaman, P.; Schoell, M. Sensitivity of biomarker properties to depositional environment and/or source input in the Lower Toarcian of SW-Germany. Org. Geochem. 1986, 10, 915–926. [Google Scholar] [CrossRef]
  51. Liu, S.; Gao, G.; Jin, J.; Gang, W.; Xiang, B. Source rock with high abundance of C28 regular sterane in typical brackish-saline lacustrine sediments: Biogenic source, depositional environment and hydrocarbon generation potential in Junggar Basin, China. J. Pet. Sci. Eng. 2022, 208, 109670. [Google Scholar] [CrossRef]
  52. Kodner, R.B.; Pearson, A.; Summons, R.E.; Knoll, A.H. Sterols in red and green algae: Quantification, phylogeny, and relevance for the interpretation of geologic steranes. Geobiology 2008, 6, 411–420. [Google Scholar] [CrossRef]
  53. De Almeida, L.T.G.; Brito, A.S.; Cioccari, G.M.; De Souza, A.A.; Mizusaki, A.M.P.; De Lima, S.G. Lipid biomarker profile of the Permian organic-rich shales (Irati Formation) in the northernmost of Parana Basin, Brazil. An. Acad. Bras. Ciências 2024, 96, e20230970. [Google Scholar] [CrossRef] [PubMed]
  54. Pan, Y.; Huang, Z.; Guo, X.; Li, T.; Zhao, J.; Li, Z.; Qu, T.; Wang, B.; Fan, T.; Xu, X. Lithofacies types, reservoir characteristics, and hydrocarbon potential of the lacustrine organic-rich fine-grained rocks affected by tephra of the permian Lucaogou formation, Santanghu basin, western China. J. Pet. Sci. Eng. 2022, 208, 109631. [Google Scholar] [CrossRef]
  55. Meng, Z.; Liu, Y.; Jiao, X.; Ma, L.; Zhou, D.; Li, H.; Cao, Q.; Zhao, M.; Yang, Y. Petrological and organic geochemical characteristics of the Permian Lucaogou Formation in the Jimsar Sag, Junggar Basin, NW China: Implications on the relationship between hydrocarbon accumulation and volcanic-hydrothermal activities. J. Pet. Sci. Eng. 2022, 210, 110078. [Google Scholar] [CrossRef]
  56. Cao, J.; Xia, L.; Wang, T.; Zhi, D.; Tang, Y.; Li, W. An alkaline lake in the Late Paleozoic Ice Age (LPIA): A review and new insights into paleoenvironment and petroleum geology. Earth-Sci. Rev. 2020, 202, 103091. [Google Scholar] [CrossRef]
  57. Yang, Y.; Qiu, L.; Cao, Y.; Chen, C.; Lei, D.; Wan, M. Reservoir quality and diagenesis of the Permian Lucaogou Formation tight carbonates in Jimsar Sag, Junggar Basin, West China. J. Earth Sci. 2017, 28, 1032–1046. [Google Scholar] [CrossRef]
  58. Naseem, W.; Jan, I.U.; Mustahpa, K.A.; Hakimi, M.H.; Ahmed, S.; Kahal, A.Y. The Early Cretaceous Sembar Formation, Southern Indus Basin, Pakistan: Biomarkers and Trace Element Distributions to Investigate the Sedimentary Palaeoenvironment and Organic Matter Input. ACS Omega 2024, 9, 39430–39451. [Google Scholar] [CrossRef] [PubMed]
  59. Xie, W.; Wang, M.; Wang, H.; Ma, R.; Duan, H. Diagenesis of shale and its control on pore structure, a case study from typical marine, transitional and continental shales. Front. Earth Sci. 2021, 15, 378–394. [Google Scholar] [CrossRef]
  60. Liu, H.; Zhang, S.; Song, G.; Xuejun, W.; Teng, J.; Wang, M.; Bao, Y.; Yao, S.; Wang, W.; Zhang, S. Effect of shale diagenesis on pores and storage capacity in the Paleogene Shahejie Formation, Dongying Depression, Bohai Bay Basin, east China. Mar. Pet. Geol. 2019, 103, 738–752. [Google Scholar] [CrossRef]
  61. Xu, W.; Yang, D.; Yu, D.; Xin, Z.; Zhao, D.; Wang, H.; Gu, X.; Zhao, X.; Wu, J.; Wu, F. Characterizing the vertical heterogeneity and optimizing the horizontal well landing window in shale oil reservoirs: Case Studies in the Jiyang Depression. In Proceedings of the Unconventional Resources Technology Conference, Houston, TX, USA, 17–19 June 2024; pp. 1146–1162. [Google Scholar]
Figure 1. Geological background of the study area.
Minerals 15 00469 g001
Figure 2. The stratigraphic columns of the study area and the Lucaogou Formation in well J10025.
Minerals 15 00469 g002
Figure 3. Relationship between physical properties of shale oil in the upper and lower sweet spots of the Lucaogou Formation in the Jimusar Sag: (a) Relationship between density and viscosity. (b) Relationship between solidification point and wax content.
Minerals 15 00469 g003
Figure 4. Scanning electron microscope (SEM) photograph of the Lucaogou Formation core: (a) J10025, 3520.7 m, dolomitic mudstone. (b) J10025, 3538.5 m, dolomites. (c) J10025, 3543.8 m, dolomitic mudstone. (d) J10025, 3549.43 m, silty mudstone. (e) J10025, 3567.6 m, mud shale. (f) J10025, 3680.2 m, mud shale.
Minerals 15 00469 g004
Figure 5. Relationship between porosity and permeability of sweet spot reservoirs in the Lucaogou Formation.
Minerals 15 00469 g005
Figure 6. Abundance and types of organic matter in the sweet spot of the Lucaogou Formation in the Jimusar Sag: (a) Distribution of organic matter abundance. (b) Distribution of organic matter types.
Minerals 15 00469 g006
Figure 7. Distribution of TOC, S1 + S2, and Tmax in the sweet spot of the Lucaogou Formation in the Jimusar Sag: (a) TOC vertical distribution. (b) S1 + S2 vertical distribution. (c) Tmax vertical distribution.
Minerals 15 00469 g007
Figure 8. Distribution of HI, OSI, and OI in the sweet spot of the Lucaogou Formation in the Jimusar Sag: (a) HI vertical distribution. (b) OSI vertical distribution. (c) OI vertical distribution.
Minerals 15 00469 g008
Figure 9. Distribution of sedimentary environments of the Lucaogou Formation in the Jimusar Sag.
Minerals 15 00469 g009
Figure 10. Distribution of β-carotene/NCmax, Pr/NC17, and Ph/NC18 in the sweet spot of the Lucaogou Formation in the Jimusar Sag.
Minerals 15 00469 g010
Figure 11. Relationship between OEP and burial depth and the cross plot of TAR and CPI in the sweet spot section of Lucaogou Formation in Jimsar Sag: (a) vertical distribution of OEP. (b) cross plot of TAR and CPI.
Minerals 15 00469 g011
Figure 12. Distribution characteristics of steranes in the Lucaogou Formation of the Jimusar Sag: (a,b) are the characteristic graphs of steranes in the upper sweet spot. (c,d) are the characteristic graphs of steranes in the upper sweet spot. (e,f) are the characteristic graphs of steranes in the upper sweet spot.
Minerals 15 00469 g012
Table 1. Physical properties of shale oil in the upper and lower sweet spots of the Lucaogou Formation in the Jimusar Sag.
WellStrataDensity
(g/cm 3)
Solidification Point (°C)Viscosity (mPa·s)Wax Content
(%)
J10025P2l20.88681834.448.4
0.89271943.588.7
0.88341632.328.7
0.8788203813.1
0.8832448.715.7
0.88742469.716.5
J10025P2l10.9189−1.6265.73.66
0.9193−1.1290.33.71
0.914−10245.51.4
0.91294232.53.2
0.914−9196.23.31
0.916−6276.82.3
0.9205−24473.62
0.92076572.214.35
0.9219−3371.853.04
0.92190419.473.85
0.92224510.354.77
0.92383405.964.36
Table 2. Mineral composition and content distribution of the Lucaogou Formation in the Jimusar Sag.
Clay
Minerals
QuartzPotash
Feldspar
PlagioclaseCalciteAnkerite
Upper sweet spot 2 ~ 9 5.5   ( 28 ) 9 ~ 37 19.9   ( 28 ) 6 ~ 22 14.1   ( 16 ) 12 ~ 55 30.9   ( 28 ) 4 ~ 13 8.8   ( 6 ) 2 ~ 57 21.2   ( 27 )
Central mudstone
interval
3 ~ 14 7.1   ( 29 ) 11 ~ 43 23.5   ( 29 ) 4 ~ 25 12.8   ( 16 ) 7 ~ 48 28.6   ( 29 ) 1 ~ 36 11.9   ( 8 ) 4 ~ 63 18.9   ( 28 )
Lower sweet spot 3 ~ 11 5.4   ( 37 ) 9 ~ 43 17.4   ( 37 ) 3 ~ 25 9.6   ( 27 ) 9 ~ 40 22.7   ( 37 ) 1 ~ 53 18.0   ( 20 ) 3 ~ 58 27.8   ( 36 )
data = range a v e r a g e   ( t o t a l ) .
Table 3. TOC and programmed temperature pyrolysis parameters of the Lucaogou Formation.
Upper Sweet SpotCentral Mudstone IntervalLower Sweet Spot
MaxMeanMinMaxMeanMinMaxMeanMin
TOC (wt %)12.204.581.1112.904.060.2812.505.922.19
Tmax (°C)449445440450442435452443427
S1 (mgHC/g Rock)4.041.200.044.251.070.088.892.230.56
S2 (mgHC/g Rock)82.5425.120.40100.4924.430.2078.3634.9810.17
S3 (mgCO2/g Rock)0.280.0700.880.2301.170.310.09
S1 + S2 (mgHC/g Rock)84.1626.320.45101.7025.500.2883.5137.2111.77
OSI (mgHC/g TOC)57.0821.403.6080.0026.288.7090.6935.2510.33
HI (mgHC/g TOC)822.29448.4128.78822.69496.2671.01906.91568.04292.55
OI (mgCO2/g TOC)7.222.220127.5416.04029.866.401.17
Disclaimer/Publisher’s Note: The statements, opinions and data contained in all publications are solely those of the individual author(s) and contributor(s) and not of MDPI and/or the editor(s). MDPI and/or the editor(s) disclaim responsibility for any injury to people or property resulting from any ideas, methods, instructions or products referred to in the content.

