Article

Experimental Study on Rock Dissolution and Scale Formation by Strong/Weak Alkali During the Alkali–Surfactant–Polymer Flooding in an Oilfield in China

1
Beijing Key Laboratory of Mineral Environmental Function, School of Earth and Space Sciences, Peking University, Beijing 100871, China
2
Key Laboratory of Orogenic Belts and Crustal Evolution, School of Earth and Space Sciences, Peking University, Beijing 100871, China
*
Authors to whom correspondence should be addressed.
These authors contributed equally to this work.
Minerals 2025, 15(5), 451; https://doi.org/10.3390/min15050451
Submission received: 25 February 2025 / Revised: 18 April 2025 / Accepted: 24 April 2025 / Published: 27 April 2025
(This article belongs to the Section Clays and Engineered Mineral Materials)

Abstract

:
This study utilizes the temperature–pressure reactor to simulate the real conditions of the reservoir to study rock dissolution and scale formation caused by strong and weak alkali during the ASP flooding in an oilfield in China. Mercury injection experiments showed that the porosity and permeability of rock increased by 10.3% and 15.3% under the action of strong alkali, while they increased by 7.2% and 10.1% under the action of weak alkali, indicating that both strong and weak alkali can cause rock dissolution. The structural morphology of the rock demonstrated that the clay content between the grains decreased significantly. The semi-quantitative analysis of XRD indicated that the content of kaolinite decreased from the initial 7% to 0%. The recrystallized carbonate was found, and the carbonate content increased from the initial 0% to 12%. According to the SEM, EDS, and Raman analyses of the scale, the scale formation was complex in the strong alkaline system, including silicate scale, carbonate scale, and hydroxide scale. In contrast, only carbonate scale was found in the weak alkaline system. The ICP-AES test for the liquid system revealed that the rock dissolution releases substantial Ca2+, Mg2+, Fe2+, SiO32− and AlO2 ions, among which Si concentration can reach around 560 ppm. The chemical mechanism of rock dissolution and scale formation by strong and weak alkali includes the exchange of mineral cations by Na+ and the destruction of Si-O and Al-O bonds by OH. These released ions migrate with the composite fluid, then recrystallize under the saturation state to form the scale. The dissolution of rock by strong alkali is more intense, while the dissolution of weak alkali is relatively mild. Moreover, the scale type in the weak alkaline system is simpler, which would be convenient to develop inhibitors.

1. Introduction

With the energy crisis becoming serious, enhanced oil recovery (EOR) technology has been paid more attention [1,2]. Alkali–surfactant–polymer (ASP) flooding is the most promising method among the chemical EOR technologies [3]. Pilot-scale field trials of ASP flooding have been implemented in certain oilfields, demonstrating the potential to enhance oil recovery rates by more than 20% relative to conventional water flooding [4,5]. This technique increases the viscosity of the injected solution, improves the sweep efficiency, and reduces the interfacial tension by the synergy of alkali, surfactant, and polymer [6,7,8]. Furthermore, it reduces the difficulty of oil migration in low-permeability formations, improves the displacement efficiency, and ultimately enhances oil recovery. Among them, the main effect of alkali is to prevent the adsorption of surfactant on the grain surfaces, and other effects, including emulsification, oil entrainment, bubble entrapment, and wettability reversal, are also significant [9,10].
However, in the process of production, it is found that the injected alkaline solution was consumed, and scale formation has been observed at the production well [11]. With the increase in injection time, it brings problems such as jammed pumps and reduced recovery ratio [12,13,14]. Previous studies found that strong alkali (NaOH) is prone to interact with the reservoir rocks and cause formation damage [15,16,17,18,19]. In order to mitigate the damage of reservoirs by alkaline solutions, some scholars have tried to use a weaker alkali (Na2CO3) for the oil displacement test, but scale formation was still observed [20,21]. The variations in rocks after flooding require elaborate characterization. The scales formed by different alkalis lack contrast and classification. Moreover, the mechanism of rock dissolution and scale formation remains unclear. Consequently, it is crucial to study the reactions between rock and strong/weak alkalis.
In this study, we designed a temperature–pressure reactor to simulate the real temperature and pressure conditions of the reservoir, and dynamic agitation experiments were carried out to (i) investigate the characteristics of rock after the reaction with different alkaline agents; (ii) research the mineralogical characterization of the recrystallized scales; (iii) and study the variation patterns of the element in the fluid and explore the mechanisms of the reaction. This study will benefit the deep understanding of the reaction of rock and alkali in the reservoir environment, and provide a theoretical basis for perfecting the enhanced oil recovery technology.

2. Materials and Methods

2.1. Preparation of Rock and Solution

The simulation experiments were carried out on natural cores of tan columnar blocks obtained from a test area in an oilfield in China. In order to minimize the effect of different cores on parallel tests, they were cut into samples with a length of 100 mm and a diameter of 25 mm from the same core section. The cores were cleaned with a 1:4 alcohol-benzene solution to remove the crude oil and then prepared by initial drying overnight at 120 °C in a vacuum oven with a pressure of 0.08 MPa and then returned to room temperature while the vacuum was maintained.
In these experiments, the ASP flooding was prepared to mimic actual field conditions in the laboratory. The polymer used was polyacrylamide with a concentration of 1.8%, while the surfactant was sodium alkyl benzoate at a concentration of 0.3% [22]. During the test, the strong alkali was sodium hydroxide and the weak alkali was sodium carbonate, both with a concentration of 1.2% [23]. The solution system was prepared using the actual formation water in the oilfield, and total salinity was 7578 ppm, which contained a large amount of HCO3 [24]. All chemicals used in these experiments were analytically pure and purchased from Sigma-Aldrich, Shanghai, China.

2.2. Experimental Process

The treated rock samples were cut into cores of 20 mm in length and put into a 100 mL temperature–pressure reaction kettle. The reaction temperature was set to 45 °C, the pressure was set to 10 MPa, and the stirring rate was set to 100 r/min. The flooding system with NaOH, Na2CO3, and non-alkali was added into the kettle for reaction. The original core samples and the reacted core samples were labeled S-initial, S-strong, S-weak, and S-blank. The initial pH values of the S-strong, S-weak, and S-blank experimental groups were measured, with the pH of S-strong being 13.48, the pH of S-weak being 11.25, and the pH of S-blank being 8.64. Liquid samples were collected daily to centrifuge for 5 min, and the supernatant was analyzed for the concentration of Si, Al, Ca, Mg, and Fe [25]. After each sampling, the reaction solvent was supplemented to maintain the pH value of the reaction system. The pH values of reaction systems were monitored by the built-in pH probe. After 30 days, the core samples were taken out and washed with deionized water three times for physical properties and mineralogical analysis. These tests were conducted in triplicate.

2.3. Analysis Methods

Core porosity and permeability tests were completed on the YG-97A mercury injection porosimetry (MIP) at Peking University. X-ray diffraction (XRD) analysis of the cores was performed on the DMAX-2400 X-ray diffractometer (Rigaku, Tokyo, Japan). Polarizing microscope (PM) observation of cores was completed on a DXM1200F polarizing microscope. The surface morphology test of cores was observed on the FEI Quanta 200FEG field emission environmental scanning electron microscopy (ESEM, FEI, Hillsboro, OR, USA), and the elemental composition analysis was completed on the accompanying energy dispersive spectrometer (EDS, FEI, Hillsboro, OR, USA). Laser-Raman micro-spectroscopy analysis of cores was performed on inVia Reflex (Renishaw, London, UK). The ion concentration test was carried out by inductively coupled plasma atomic emission spectrometer (ICP-AES, Leeman, Hudson, NY, USA). The ICP-AES instrument has a wavelength range of 165–1100 nm, a resolution of <0.005 nm, a detection limit of 1–7 μg/L, a stability of ≤1.0% and a repeatability of ≤1.0%.

3. Results and Discussion

3.1. Variation in the Poroperm Characteristics of Rock

The temperature–pressure reactor is used to set the reaction conditions at 45 °C and 10 MPa to simulate the real environment of the reservoir. After 30 days of reaction, core samples were washed with deionized water three times and then dried at 50 °C. Mercury porosimetry was conducted to investigate the variation in physical properties of the core samples. The permeability, porosity, average pore radius, and sorting coefficient of samples are shown in Table 1. Compared with the initial sample, the permeability of S-strong increases by 15.3%, the porosity increases by 10.3%, the average pore radius increases by 13.1%, and the sorting coefficient decreases by 26.2%. Meanwhile, the permeability of S-weak increases by 10.1%, the core porosity increases by 7.2%, the average pore radius increases by 4.7%, and the sorting coefficient decreases by 22.4%. This indicates that for the cores, the distribution of pore throat radius between skeleton particles becomes more uniform, and the permeability increases after the treatment with alkali. Although there are a small number of changes in the physical properties of S-blank, these may be caused by fluid movement during the dynamic agitation experiment, so the changes were very low and can be negligible. In the actual application process, the increase in rock porosity is conducive to the recovery of oil in the formation. At the initial stage of application, the oil recovery can be significantly improved, but with the passage of time, the impact of scaling gradually appears, accompanied by the decline of oil recovery. On the whole, the porosity and permeability characteristics of rock become more favorable for oil production after the action of alkali, but this change also indicates that rocks are subjected to dissolution, and it is more obvious under the action of strong alkali. As the amount of alkali injected increases during the actual production in the field, the dissolved rock will release a large number of ions, which will most likely recrystallize at the supersaturated concentrations, and that will produce the harmful scale. The newly formed scale was also found in our tests, and for the variation in the poroperm characteristics, a reasonable explanation was proposed by the change in mineral composition and microstructure of rock.

3.2. Variation in Petrological Characteristics of Rock

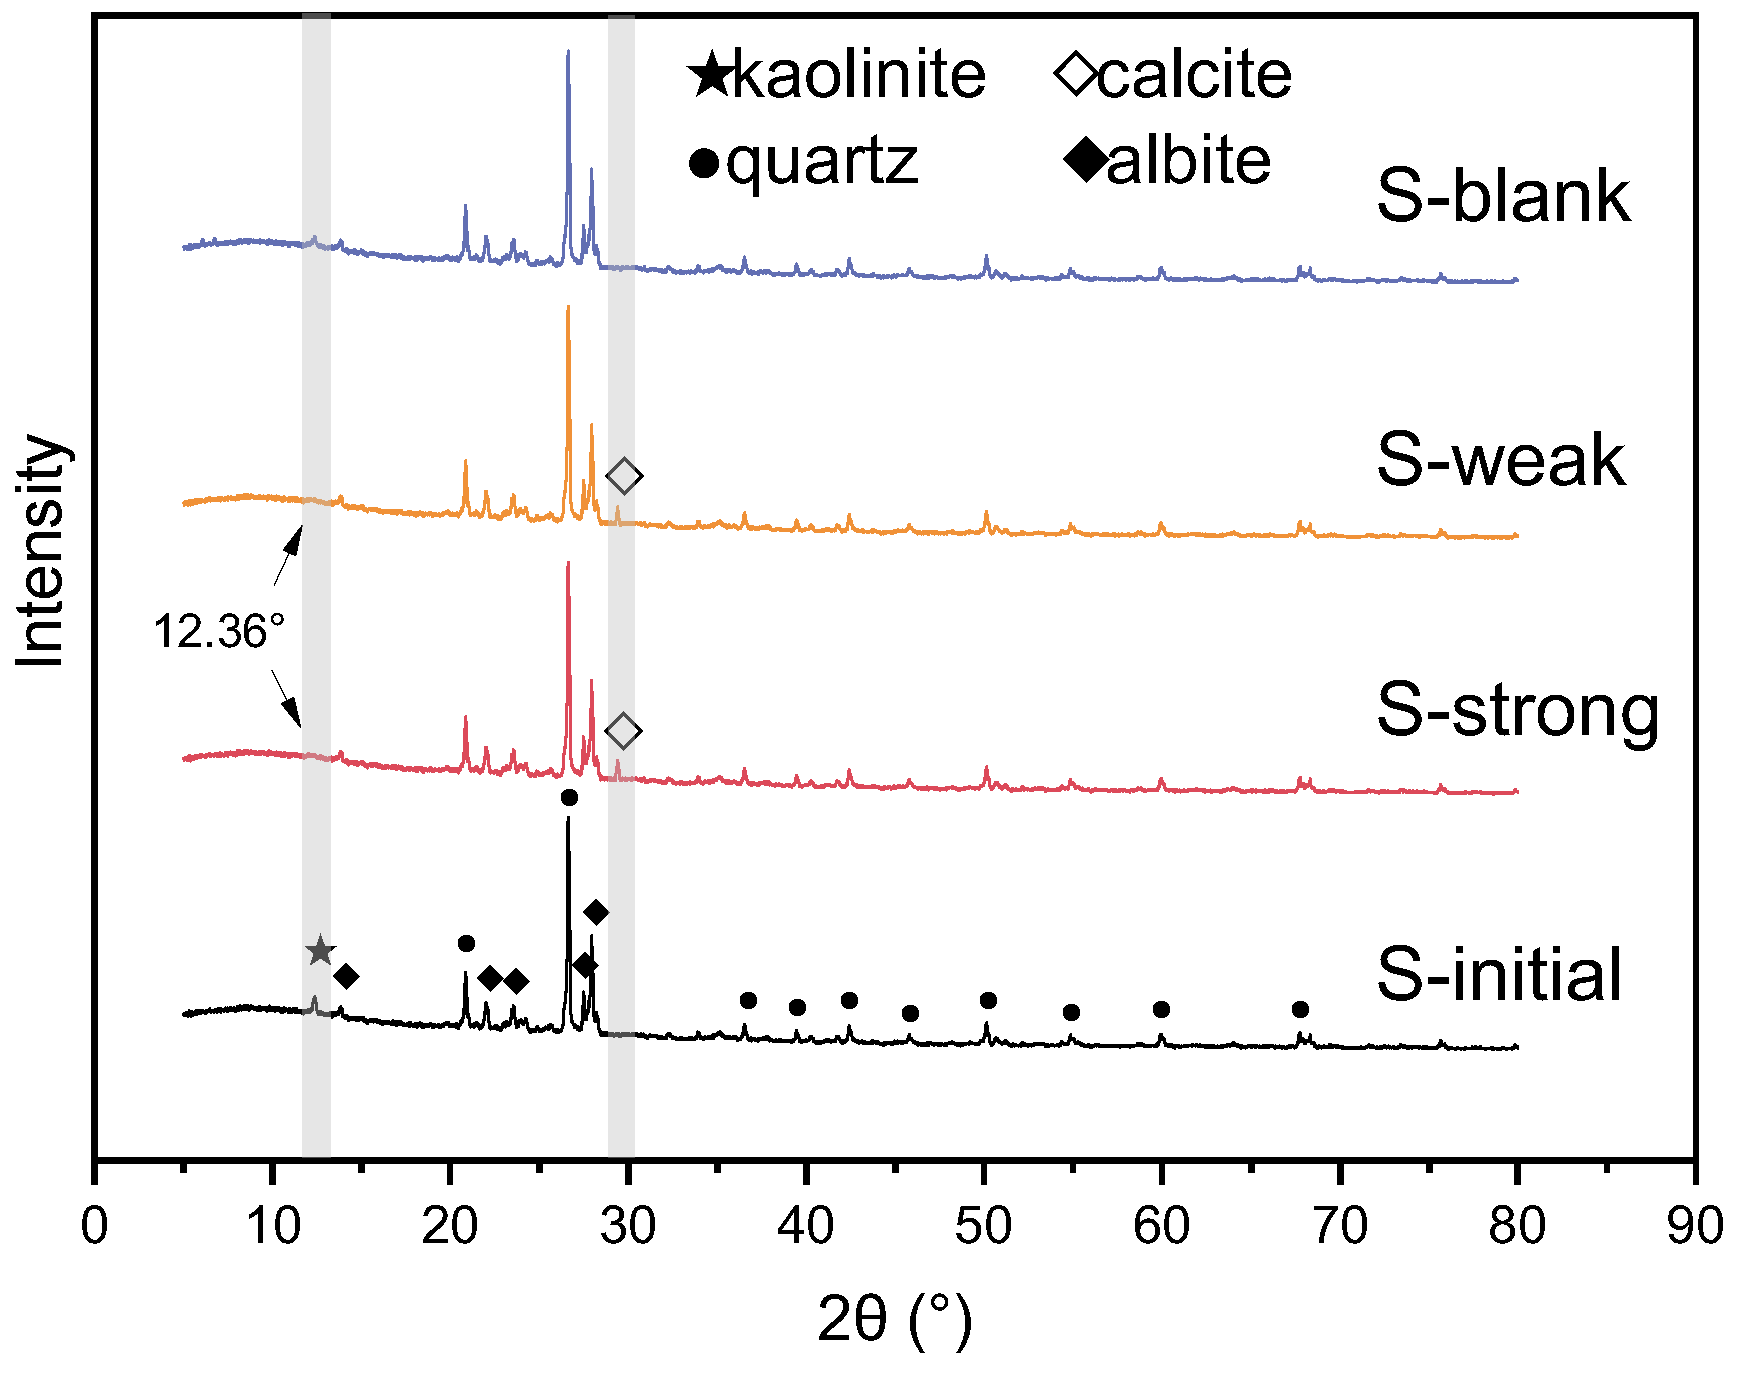
3.2.1. Changes in Mineral Components

The XRD patterns of rock samples are shown in Figure 1. The main phases of the initial sample are quartz and albite, and the characteristic peaks are located at 20.8°, 26.6°, and 50.1° for quartz, and 22.1°, 27.7°, and 27.9° for albite. Meanwhile, XRD data indicates that the core contains a small amount of clay minerals, mainly kaolinite, and the characteristic peak is located at 12.3°. Due to the limitation of XRD detection, other mineral phases with lower content are not shown.
After 30 days of the reaction with strong alkali, the mineral composition of S-strong changed significantly. The characteristic peak of kaolinite at 12.36° was obviously eliminated, indicating that kaolinite disappeared due to the dissolution by strong alkali. Meanwhile, a new characteristic peak appeared at 29.4°. According to the research on scale in the following part, it is found that the phase indicated by this characteristic peak is calcite. Through the semi-quantitative analysis of RIR value, the mineral content changes in s-initial, s-strong, s-weak, and s-blank are shown in Table 2. It can be seen that the content of kaolinite decreased significantly after alkali dissolution, while calcite was formed. Notably, the content of quartz did not change significantly. Based on crystallinity equations [26], the crystallinity was calculated by the strongest characteristic peaks of quartz and albite. It is found that the crystallinity of quartz in the S-initial, S-strong, S-weak, and S-blank was 41.2%, 38.3%, 39.6%, and 40.8%, respectively. The crystallinity of albite was 45.5%, 42.1%, 43.8%, and 45.2%, respectively. It indicates that both quartz and albite were affected by alkali, and the corrosion was more intense under the strong alkaline solution. Therefore, compared with S-strong, S-weak has the same trend of component variation, but the difference is that the new characteristic peak strength at 29.4° is relatively weak. Under the reaction of weak alkali, according to the changes in crystallinity, the dissolution of quartz and albite is relatively low; thus, the content change shown in the XRD patterns is not obvious, and the recrystallized calcite has a relatively weak peak. There is no significant change in components in S-blank, indicating that the alkali in ASP flooding was the main factor leading to mineral dissolution.

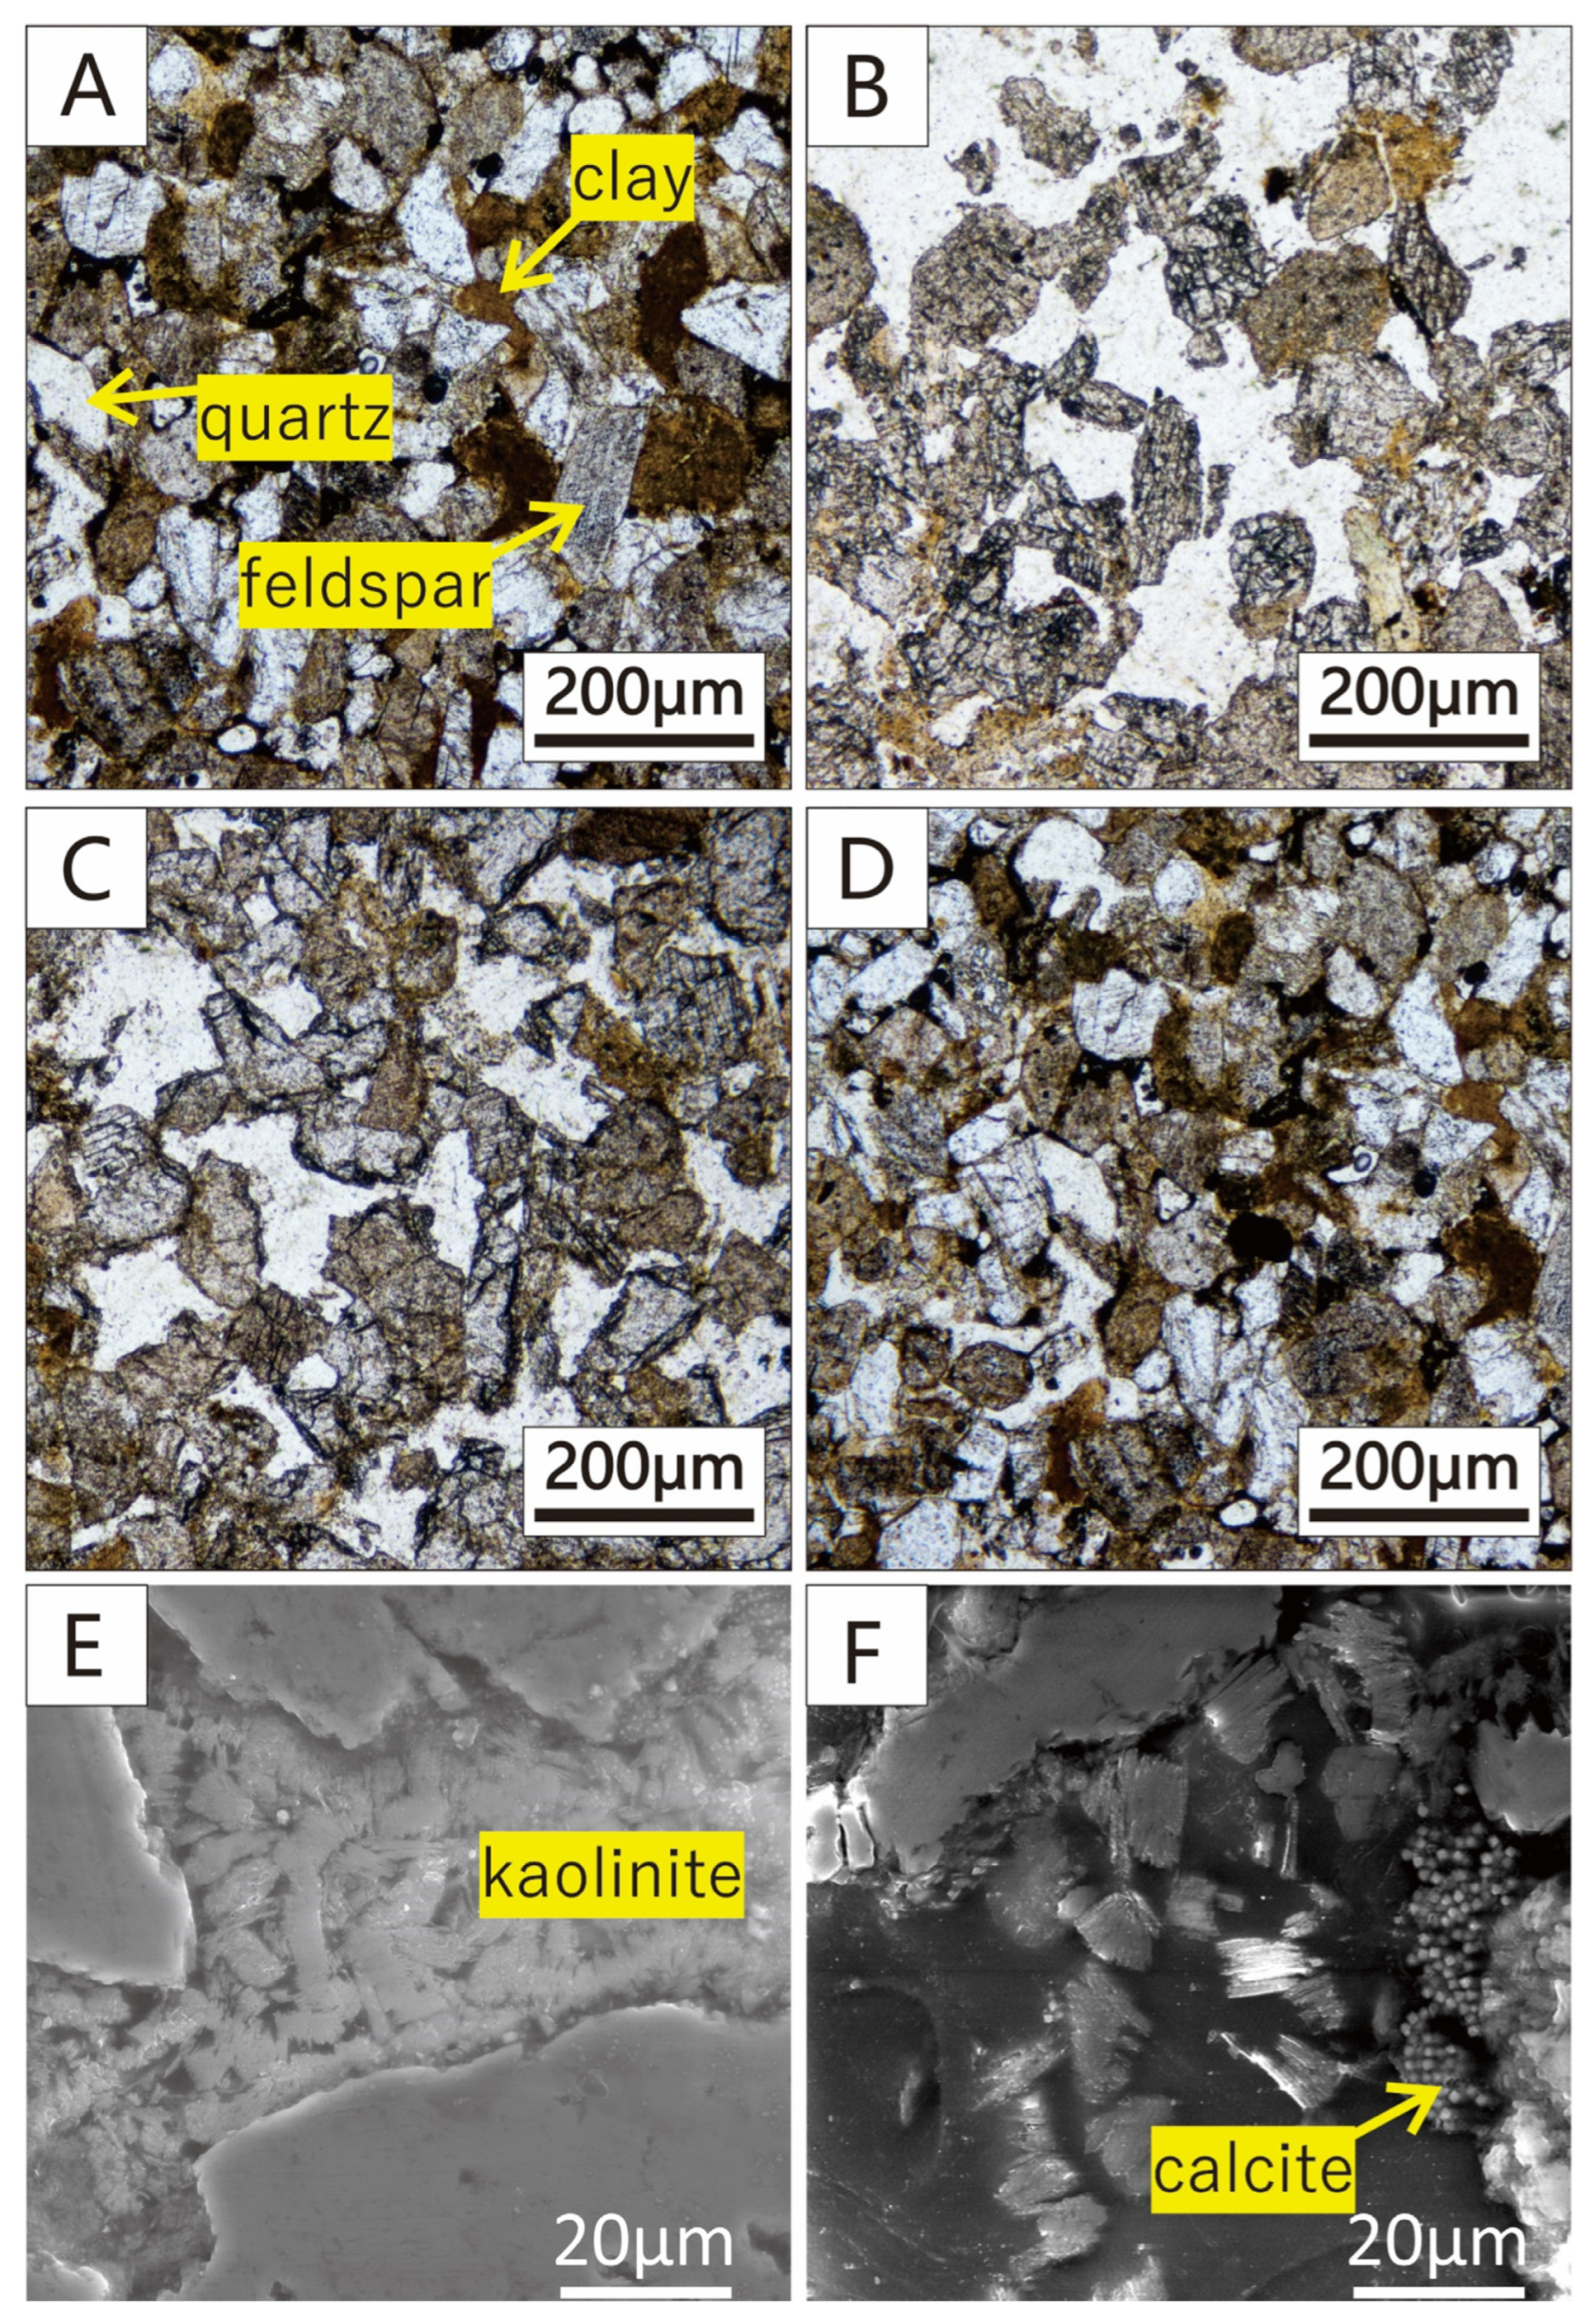
3.2.2. Changes in Structural Morphology

The PM photomicrograph (single polarized mode) of the initial core sample is shown in Figure 2A. Quartz and feldspar are skeleton minerals, and the surface of the quartz is smooth, but the surface of feldspar shows obvious stripes. Clay minerals such as kaolinite are filled in intergranular pores. After the reaction of strong alkali (Figure 2B), it can be seen that clay minerals disappeared significantly; at the same time, the edges of quartz and feldspar became smooth, which means that the core sample has dissolved. Compared with S-strong, the PM photomicrograph of S-weak (Figure 2C) shows that the clay in the intergranular pores also disappeared after the reaction of weak alkali, but the changes in quartz and feldspar are not obvious. As shown in Figure 2D, the core sample of the non-alkali blank group hardly changed, which indicates that the variation in microstructure of the core is mainly caused by alkalis in the ASP flooding.
Figure 2E,F show the secondary electron images of the core samples before and after the reaction of the strong alkali. We can find that kaolinite filled between the particles of quartz and feldspar before the reaction and dissolved after the reaction. In addition, corrosion pits and dissolution holes appear at the edge of the skeleton minerals, and recrystallized mineral calcite can also be found. The result is consistent with the XRD data (Figure 1), confirming that the rock reacts with alkali and can be dissolved. This can provide an explanation for the change in rock poroperm characteristics. The skeleton minerals of rock are mainly quartz and feldspar, and the clay minerals are filled between the grains. Clay minerals have a much larger specific surface area, which can adsorb a large amount of OH ions. Therefore, clay minerals filling in the pore will be the first subject to alkali corrosion. In addition, the variation degree of S-weak is lower than that of S-strong due to the lower concentration of OH of Na2CO3 solutions compared with NaOH solutions. In this experiment, the dissolved ions disperse evenly with the liquid, and the amount is small; thus, the recrystallization will have a low effect on the distribution of pore throats. However, with the increase in reaction time and ion concentration, the scale formation is bound to damage the reservoir, so it is important to study and classify the scale formation under strong/weak alkali. There is a possibility that this alkali dissolution has a long-term effect on the reservoir, with dissolution leading to a reduction in the degree of cementation between mineral particles in the formation, loosening of the particles, and weakening of the structure, which may lead to sand production during the actual process.

3.3. Mineralogical Characteristics of the Scale

Through variation in characteristics of cores before and after the reaction, we find that the rocks have different degrees of dissolution by different alkaline flooding. The scale formation is found in both core samples treated by strong and weak alkali. The morphology (Figure 3) and composition (Figure 4) of the scale can be characterized by SEM and EDS. At the same time, the microscopic Raman can be used for in situ detection to determine the scale phase accurately, and the spectra are shown in Figure 5. By the different anion types, the scale can be divided into carbonate mineral, silicate mineral, and hydroxide mineral.
The XRD patterns show that the carbonate mineral is present in both S-strong and S-weak, which indicates that carbonate is the main mineral formed by recrystallization; it is related to the large amounts of CO32− and HCO3 in the solution. The secondary electron image observed by SEM also shows that a large number of rhomboidal crystals appeared. Figure 3A,B correspond to S-weak and S-strong, respectively. Meanwhile, the corresponding EDS data shows that in the carbonate scale of S-weak, the cations are mainly Ca2+ and Mg2+, the weight percentages of the elements are 18.24% and 6.67%. But in the carbonate scale of S-strong, there is almost no Mg2+, and the weight percentage of calcium is 19.81%. Almost no iron is detected in either sample. Figure 5A,B correspond to the Raman spectra of the recrystallized carbonate in S-weak and S-strong. In a previous study [27], the C-O symmetric stretching vibration of calcite is generally located at 1082~1092 cm−1. The two lower Raman shifts, 155 and 279 cm−1, observed from Figure 5A arise from the external vibrations of the CO3 groups, and the symmetric deformation vibration gives rise to a Raman band at 711 cm−1 [28]. We can find that in Figure 5B, the Raman vibration frequency of the carbonate mineral is shifted to the lower wave number as a whole, which is caused by the vibrations of the CO3 groups affected by the substitution of Mg2+ for Ca2+ in S-weak [29].
A large amount of silicate scale is found in S-strong, which is not apparent in S-weak. Figure 3C,D show their secondary electron images. Compared with the element content in Figure 4, we find that they are silicon dioxide and sodium silicate. The Raman shifts 123, 190, and 459 cm−1 in Figure 5C indicate the phase was quartz (SiO2) [30], and the Raman shifts 160, 442, 532, and 1037 cm−1 in Figure 5D correspond to natrolite (Na2(Si3Al2)O10·2H2O) [31]. The quartz is amorphous and exhibits low crystallinity. The natrolite belongs to zeolite minerals, with a low content after recrystallization. Consequently, they are not manifested in the XRD patterns. Similarly, the hydroxide scale can be found only in S-strong; as shown in Figure 3E,F, most of them are flocculated. The cations of the hydroxide mineral in Figure 3E are mainly iron and magnesium, and the weight percentages of the elements were 47.32% and 5.96%. In contrast, the weight percentages of Fe and Mg in the hydroxide mineral in Figure 3F were 53.23% and 1.26%. The different contents of Mg will lead to the different degrees of substitution of Fe in the lattice, which will cause the deviation of Raman peaks shown in Figure 5E,F. Previous studies also found that the scale phase is mainly carbonate, while other scholars found barite scale, and the mechanism of these scale formations has not been discussed in depth [32,33].
The scale found in this experiment indicates that large amounts of Si, Al, Ca, Mg, and Fe are necessary for recrystallization and that these elements are not contained in either the ASP fluid or the formation water. Therefore, it is proved that the rock minerals will be dissolved and release a large number of ions during the reaction with both strong and weak alkalis, and in order to study this release pattern, ICP-AES was carried out for the liquid system.

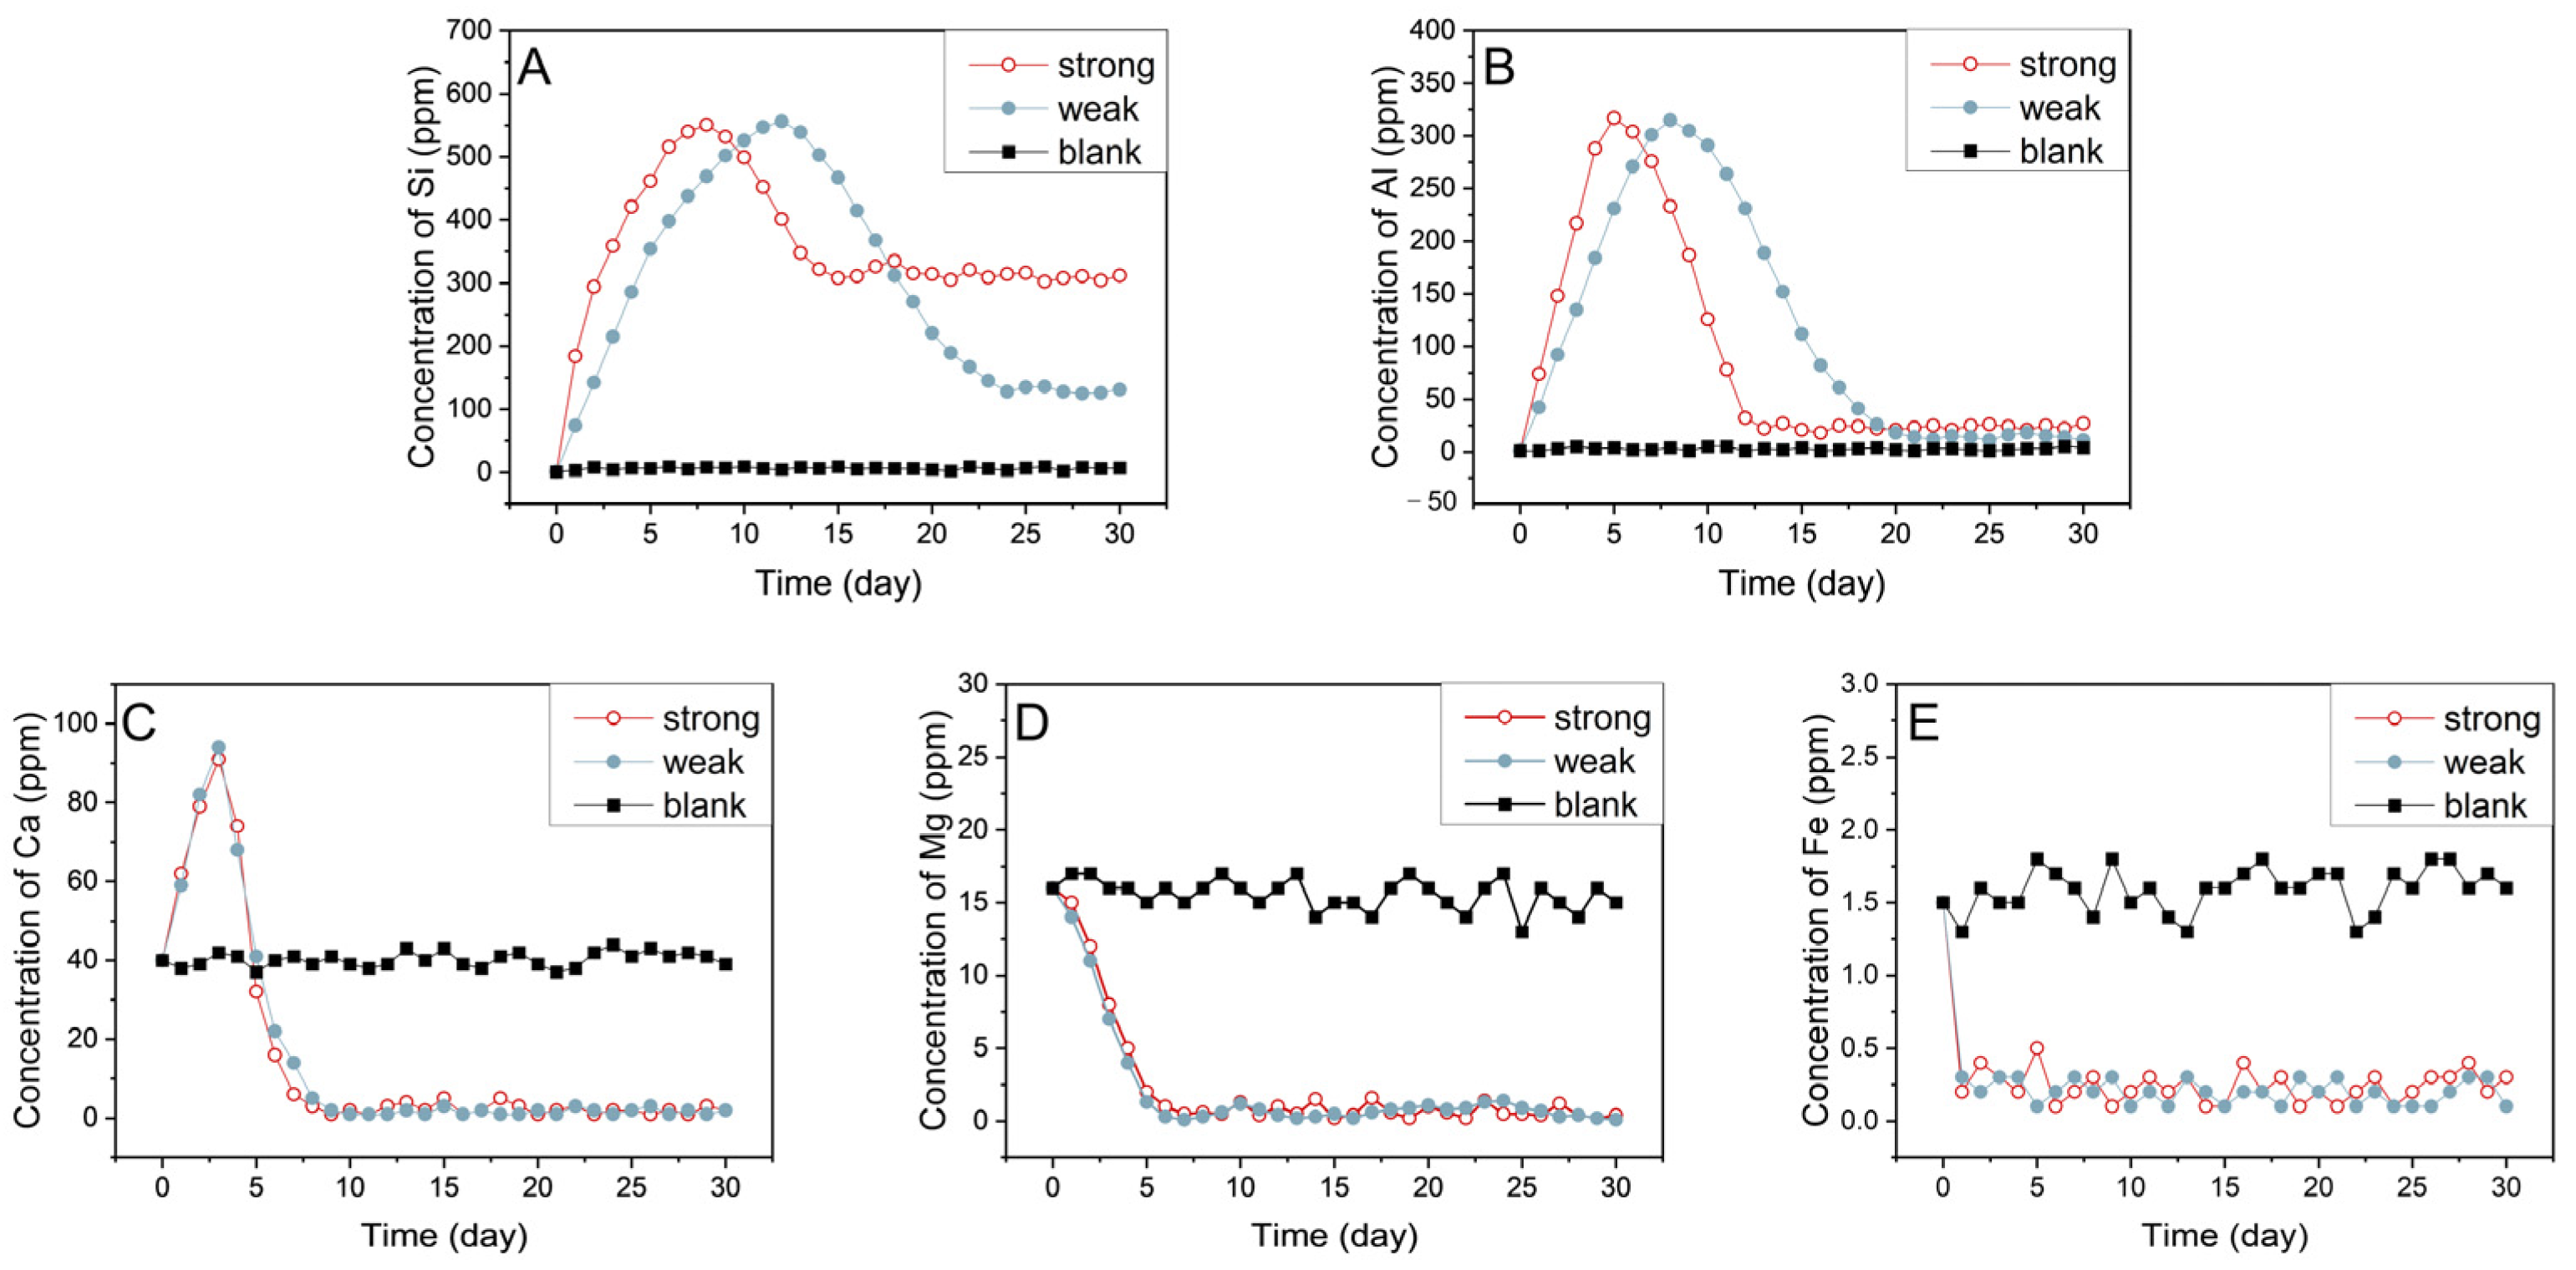
3.4. Variation Patterns of Element in the Liquid System

Within 30 days of the reaction, solution samples were collected for the ICP-AES test to study the variation patterns of the element Si, Al, Ca, Mg, and Fe in the fluid. In the process of rock–alkali interaction, when the dissolution rate is greater than the crystallization rate, the concentration of elements in the fluids will increase, and vice versa. When the two rates are consistent, the reaction is balanced and the element concentration will be stable. The concentration profiles of the five elements are depicted in Figure 6.
The concentrations of these five elements in solution change in different ways, among which Si has the largest dissolution amount, and the peak value is close to 560 ppm, as shown in Figure 6A. In both systems, the concentration of Si in the fluids decreases after reaching the peak, indicating that the crystallization rate begins to exceed the dissolution rate. Notably, in the strong alkaline system, the concentration peak of Si emerges after 7 days of reaction. In contrast, this peak occurs after 11 days of reaction in the weak alkaline system. This indicates that a higher OH- concentration in the composite system leads to a higher dissolution rate of the rock. Also, the time for the reaction to reach equilibrium under the two systems is different. It takes about 14 days for the strong alkaline system to reach equilibrium, and at this time, the Si concentration is still maintained above 260 ppm, indicating that the strong dissolution still occurred. In the weak alkaline system, it takes almost 25 days to reach equilibrium, and during the equilibrium, the Si concentration is close to 100 ppm, which proves once again that weak alkali has a weaker dissolution on rock than strong alkali. Based on the changes in rock characteristics above, it is speculated that clay minerals such as kaolinite in the core will be the first subjected to severe alkali dissolution. When the clay is dissolved, quartz and feldspar will continue to undergo dissolution, which is the main reason for the peaks of Si in the two systems. Due to the timely addition of a reaction solvent after sampling, the pH value of the reaction system in this study is basically stable. When Si ions are dissolved and crystallized, the recrystallized silicate minerals may be re-dissolved. Therefore, after a period of reaction, the dissolution and crystallization gradually balance, and the detectable concentration of Si ions in the solution tends to be stable.
The profile of Al is similar to that of Si, exhibiting a peak and then a decrease to a steady value. The difference is that under the two systems, for Al, the peak value and the reaction equilibrium appears earlier, and the maximum concentration of Al is close to 320 ppm, and smaller than 50 ppm when the equilibrium is reached. This may be due to the higher content of silicate minerals in the rock, and on the other hand, there is a large amount of OH and CO32− in solution which reduce the Al concentration. Compared with Si and Al, the dissolution amounts of Ca, Mg and Fe are lower. However, the Ca element shows a trend of a significant increase within 3 days, reaching a peak value of 95 ppm, which may be caused by an ion exchange between Na+ in the solution and Ca2+ in the interlayer of montmorillonite [34]. When the reaction was balanced, the contents of Ca, Mg, and Fe in the strong alkaline system and the weak alkaline system are significantly lower than those in the blank group, which is caused by the large amount of OH and CO32− in the liquid system. A summary of peak values and equilibrium times is illustrated in Table 3.

3.5. Chemical Mechanism of Rock Dissolution and Scale Formation

For the strong alkaline system, weak alkaline system, and deionized water system, it was found that alkali in the ASP flooding will react with rock minerals, during which dissolution occurs, with the release of a large number of ions into the solution. When the concentration reaches a supersaturated state, precipitation occurs, leading to scale formation. Therefore, the reaction between rock and alkali should include dissolution and recrystallization.
According to the change rule of the element concentration in the solution, we found that when the rock minerals are eroded by the two different alkalis, there are some similarities and differences. When strong alkali in the ASP flooding is mixed with the formation water, it will release Na+ and OH by ionization, and there are large amounts of HCO3 in the formation water, which will be converted to CO32−. When weak alkali in the flooding is mixed with the formation water, it will release Na+ and CO32− by ionization, and then CO32− hydrolyzes to release OH. On the one hand, the Na+ dissociates from NaOH or Na2CO3 in the composite flooding and can be exchanged with cations (Ca, Mg, and Fe) in minerals, such as montmorillonite. This process occurs in both alkaline solutions and is the main reason for the increase in Ca concentration in the solution shown in Figure 5C. On the other hand, the OH in alkaline solution will react with the rock minerals and break Si-O and Al-O bonds, so that the fluid would contain soluble SiO32− and AlO2 ions. In addition, from the changes in the characteristic of cores after the reaction, we can see that the dissolution of cores by the strong alkali is more intense than by the weak alkali. This discrepancy arises because the concentration of OH ions generated by hydrolysis in Na2CO3 system is lower than that ionized by NaOH. Consequently, a significant difference exists between these two systems in this process. Since the weak alkali has a low destructive effect on the Si–O bond, the SiO32− content in the solution is not high, which is also the reason why silicate scale is not common in the weak alkaline system. Meanwhile, it can be found that different minerals in the core have the different dissolution degrees. Because of the higher specific surface area of clay minerals, such as kaolinite, chlorite, and montmorillonite, which fill in the intergranular pores, they will dissolve first, and when dissolved, the skeleton minerals such as quartz and feldspar will continue to be dissolved by OH. The order of dissolution among different minerals can also explain the changes in the concentration of the elements released to the solution.
After the reaction with alkali, the rock will release a large amount of Ca2+, Mg2+, Fe3+, SiO32−, and AlO2 by ion exchange and dissolution. These ions migrate with the composite fluid, and when they pass through the complex pore throat structure of the cores, the ionic chemical and thermodynamic conditions of the microenvironment will change. Therefore, the equilibrium state will be broken, resulting in the chemical precipitation. Especially in the actual production process, the temperature and pressure at the production well are much lower than the reservoir environment; consequently, the scale formation will be more obvious. The scale types observed in this paper can be divided into carbonate, silicate, and hydroxide. Among them, carbonate scale is abundant in both systems due to the high concentration of CO32⁻ in the solutions. However, silicate and hydroxide scales are commonly found in the S-strong system but are rare in the S-weak system, primarily because Na2CO3 exhibits a weaker corrosive effect on minerals. Through the study of characteristics of the scale, there are more CO32− in the solution for the weak alkali system; thus, Ca, Mg, and Fe are enriched in carbonate minerals only. However, it can be found that in the NaOH system, Ca is mainly enriched in carbonate minerals, while Mg and Fe are mainly enriched in hydroxide minerals. This may be determined by the KspMinerals 15 00451 i001 of these precipitates, as shown in Table 4. According to the amount of HCO3 in the original formation water [24] and alkali injected, the ion concentration released in this experiment can reach the supersaturated state to generate precipitation. The recrystallization process of minerals in the formation dissolved by alkaline solution has begun to occur in situ with the increase in ion concentration. When the produced liquid gradually approaches the surface, the change in temperature and pressure conditions [35] aggravates the recrystallization process.
Based on the discussion of the chemical mechanism of reaction between rock and alkali, we found that under the strong alkaline system, rocks are dissolved more, and the scale types are more complex, while in the weak alkaline system, the rocks suffer less damage [36], and the single type of scale will make the research on the inhibitor for scale simpler.

4. Conclusions

This study indicates that a rock will dissolve in both the strong and weak alkaline systems, and the porosity and permeability will increase after the reaction. The changes in mineral composition and structural morphology of rock reveal that in the dissolution process, intergranular clay, such as kaolinite, will be first dissolved, and then the skeleton minerals will be dissolved. The dissolution process mainly involves the exchange of mineral cations by Na+ and the destruction of Si-O and Al-O bonds by OH. Additionally, a large amount of Ca2+, Mg2+, Fe2+, SiO32−, and AlO2 would be released into the liquid system. These ions migrate with the composite fluid, combine with each other, and recrystallize under certain conditions to form the scale. The dissolution of rock by strong alkali is more intense, and the types of scale produced are more complex, including carbonate scale, silicate scale, and hydroxide scale. In contrast, the dissolution of weak alkali is relatively limited, and the scale type is simple. Due to the low degree of silicate dissolution under weak alkaline conditions, scale is mainly dominated by carbonate; thus, some organic acids may effectively inhibit the occurrence of carbonate under weak alkaline conditions.

Author Contributions

Conceptualization, X.J. and H.D.; methodology, C.Z.; validation, X.G., C.Z. and F.C.; investigation, C.F. and H.Z.; resources, H.D. and C.W.; writing—original draft preparation, F.C. and X.J.; writing—review and editing, Y.L. and C.Z.; visualization, X.J.; supervision, A.L.; funding acquisition, H.D. All authors have read and agreed to the published version of the manuscript.

Funding

This research was funded by National Natural Science Foundation of China, grant number 42192502.

Data Availability Statement

The data used to support the findings of this study are included within the article.

Conflicts of Interest

The authors declare no conflicts of interest.

References

  1. Sheng, J. Modern Chemical Enhanced Oil Recovery: Theory and Practice; Gulf Professional: Amsterdam, The Netherlands, 2011. [Google Scholar]
  2. Deng, R.; Dong, J.; Dang, L. Numerical simulation and evaluation of residual oil saturation in waterflooded reservoirs. Fuel 2025, 384, 134018. [Google Scholar] [CrossRef]
  3. Sheng, J.J. A comprehensive review of alkaline-surfactant-polymer (ASP) flooding. Asia-Pac. J. Chem. Eng. 2014, 9, 471–489. [Google Scholar] [CrossRef]
  4. Wang, F.; Wu, X.; Chen, G.; Li, H.; Guo, Z. Technical progress of Alkaline-Surfactant-Polymer flooding (ASP) in Daqing Oilfield. Pet. Geol. Oilfield Dev. Daqing 2009, 28, 154–162. [Google Scholar]
  5. Wang, D.; Zhang, Z.; Cheng, J.; Yang, J.; Gao, S.; Li, L. Pilot Test of Alkaline Surfactant Polymer Flooding in Daqing Oil Field. SPE Reserv. Eng. 1997, 12, 229–233. [Google Scholar] [CrossRef]
  6. Wang, W.; Liu, Y.; Gu, Y. Application of a Novel Polymer System in Chemical Enhanced Oil Recovery (EOR). Colloid Polym. Sci. 2003, 281, 1046–1054. [Google Scholar] [CrossRef]
  7. Guo, D.; Li, S.; Yuan, J. Flooding mechanism and application of surfactant flooding. Adv. Fine Petrochem. 2002, 3, 36–41. [Google Scholar]
  8. Hou, J.; Liu, Z.; Zhang, S.; Yue, X.A.; Yang, J. The role of viscoelasticity of alkali/surfactant/polymer solutions in enhanced oil recovery. J. Pet. Sci. Eng. 2005, 47, 219–235. [Google Scholar] [CrossRef]
  9. Yang, Q.; Gong, W.; Jia, Z. Mechanism of ASP flooding in Daqing Oilfield. Pet. Geol. Oilfield Dev. Daqing 1999, 18, 24–26. [Google Scholar]
  10. Samanta, A.; Bera, A.; Ojha, K.; Mandal, A. Comparative studies on enhanced oil recovery by alkali–surfactant and polymer flooding. J. Pet. Explor. Prod. Technol. 2012, 2, 67–74. [Google Scholar] [CrossRef]
  11. Li, D.; Xu, Z.; Zheng, F. A laboratory study on ASP flooding in the low permeable oilfield of north Putaohua. Pet. Geol. Oilfield Dev. Daqing 2000, 19, 37–39+53. [Google Scholar]
  12. Wu, X.; Ying, Y.; Wu, G.; Lu, A.; Hou, Z.; Ding, H.; Wang, H.; Yang, X. Study on the reaction of alkali/surfactant/polymer and reservoir cores in Daqing Oilfield. Chem. Eng. Oil Gas 2015, 44, 66–72. [Google Scholar]
  13. Chen, S.; Liu, A.; Sun, X.; Liu, M.; Lin, T. Analysis of scale and research on scale control technique for weak base asp flood. Pet. Geol. Oilfield Dev. Daqing 2006, S1, 97–99. [Google Scholar]
  14. Chen, J. Study on the Scale Mechanism and the Scale Inhibitor in the ASP Flooding in Daqing Oilfield. Ph.D. Thesis, China University of Geosciences, Beijing, China, 2013. [Google Scholar]
  15. Oddo, J.E.; Tomson, M.B. Why scale forms and how to predict it. SPE Prod. Facil. 1994, 9, 47–54. [Google Scholar] [CrossRef]
  16. Yin, Y.; Lu, A.; Li, Y.; Ding, H.; Wang, H.; Yang, X. A study of the reaction of alkali/surfactant/polymer and reservoir minerals in the Daqing oilfield. ACTA Petrol. Et Mineral. 2015, 34, 811–820. [Google Scholar]
  17. Ge, Z.; Liu, W.; Huang, Y. A study on formation damage caused by alkali in ASP flooding system. Oilfield Chem. 2006, 23, 362–364+368. [Google Scholar]
  18. Sun, W. Scaling mechanism and control measures of ASP flooding oil wells. Pet. Knowl. 2015, 2, 20–21. [Google Scholar]
  19. Han, W.; Chen, P.; Wang, S.; Zhang, W. An experimental study on formation damage due to alkali in asp flooding. Oilfield Chem. 1996, 13, 57–61. [Google Scholar]
  20. Chen, G.; Lu, X.; Zhao, L.; Gao, E.; Liu, X. Field performance of industrial alkalescent alkaline/surfactant/polymer flood in Daqing and related scaling problems. Oilfield Chem. 2009, 26, 320–324. [Google Scholar]
  21. Zhao, N.; Liu, Z.; Lu, X.; Tang, Z.; Tu, J. Research progress of weak alkali and alkali-free flooding technology. J. Oil Gas Technol. 2010, 32, 341–344. [Google Scholar]
  22. Deng, S.; Yu, G.; Jiang, Z.; Ting, Y.P. Destabilization of oil droplets in produced water from ASP flooding. Colloids Surf. A Physicochem. Eng. Asp. 2005, 252, 113–119. [Google Scholar] [CrossRef]
  23. Zhang, R.; Liang, C.; Wu, D.; Deng, S. Characterization and demulsification of produced liquid from weak base ASP flooding. Colloids Surf. A Physicochem. Eng. Asp. 2006, 290, 164–171. [Google Scholar] [CrossRef]
  24. Zhao, Y. Tests and Studies of ASP Displacement for Second Category Oil Layers in Northeast Area of Daqing Lamadian Oilfield. Master’s Thesis, China University of Geosciences, Beijing, China, 2009. [Google Scholar]
  25. Lin, P.; Zeng, L.; He, D.; Ding, Y. Reaction and its kinetics of montmorillonite and quartz with alkaline solution. Chem. Eng. Oil Gas 2002, 31, 144–145. [Google Scholar]
  26. Murthy, N.S.; Minor, H. General Procedure for evaluating amorphous scattering and crystallinity from X-ray diffraction scans of semi crystalline polymers. Polymer 1990, 31, 996–1002. [Google Scholar] [CrossRef]
  27. Gunasekaran, S.; Anbalagan, G.; Pandi, S. Raman and infrared spectra of carbonates of calcite structure. J. Raman Spectrosc. 2006, 37, 892–899. [Google Scholar] [CrossRef]
  28. Merrill, L.; Bassett, W.A. The crystal structure of CaCO3 (II), a high-pressure metastable phase of calcium carbonate. Struct. Sci. 1975, 31, 343–349. [Google Scholar] [CrossRef]
  29. Wang, D.; Hamm, L.M.; Bodnar, R.J.; Dove, P.M. Raman spectroscopic characterization of the magnesium content in amorphous calcium carbonates. J. Raman Spectrosc. 2012, 43, 543–548. [Google Scholar] [CrossRef]
  30. Drits, V.A.; Skibsted, J.R.; Dorzhieva, O.V.; Fallick, A.E.; Lindgreen, H. Structural characterization of marine nano-quartz in chalk and flint from North Sea Tertiary chalk reservoirs for oil and gas. Am. Mineral. 2017, 102, 1402–1417. [Google Scholar] [CrossRef]
  31. Kang, W.; Wang, T.; Zhang, H.; Hou, X.; Zhang, X.; Zhu, T.; Yang, H. A dynamic scale location monitor method to predict oilfield blockage during water flooding. J. Pet. Sci. Eng. 2020, 191, 107168. [Google Scholar] [CrossRef]
  32. Liu, C.; Hu, C.; Yu, Z.; He, L. Study on influencing factors of wellbore scaling during ASP flooding. Geoenergy Sci. Eng. 2024, 237, 212678. [Google Scholar] [CrossRef]
  33. Liu, D.; Liu, Z.; Lee, Y.; Seoung, D.; Lee, Y. Spectroscopic characterization of alkali-metal exchanged natrolites. Am. Mineral. 2012, 97, 419–424. [Google Scholar] [CrossRef]
  34. Zhu, Y.; Cao, W.Z.; Lu, A.H.; Wang, Q.H.; Li, Y.; Zhang, X.L.; Wang, C.Q. An experimental study on phase transformation of montmorillonite in reservoirs by using alkaline treatment. Acta Mineral. Sin. 2011, 31, 88–94. [Google Scholar]
  35. Xia, B.; Zheng, X. Approximately-Balanced Drilling in Daqing Oilfield. J. China Univ. Geosci. 2004, 15, 129–133. [Google Scholar]
  36. Zhu, N.; Cao, Y.; Xi, K.; Wu, S.; Zhu, R.; Yan, M.; Ning, S. Multisourced CO2 injection in fan delta conglomerates and its influence on reservoir quality: Evidence from carbonate cements of the Baikouquan formation of Mahu Sag, junggar basin, northwestern China. J. Earth Sci. 2021, 32, 901–918. [Google Scholar] [CrossRef]
Figure 1. XRD patterns of the rock samples.
Minerals 15 00451 g001
Figure 2. Morphology of the microstructure before and after the reactions. (AD) The PM graphic of S-initial, S-strong, S-weak and S-blank; (E) kaolinite was filled in the pore of S-initial; (F) dissolved kaolinite and recrystallized calcite in S-strong.
Minerals 15 00451 g002
Figure 3. Secondary electron image of the scale. (A,B) The carbonate scale in S-weak and S-strong; (C,D) the silicate scale in S-strong; (E,F) the hydroxide scale in S-strong.
Minerals 15 00451 g003
Figure 4. Element composition of the scale (wt %).
Minerals 15 00451 g004
Figure 5. Raman spectroscopy of the scale. (A,B) The carbonate scale in S-weak and S-strong; (C) the recrystallized quartz in S-strong; (D) the recrystallized natrolite in S-strong; (E,F) the hydroxide scale in S-strong.
Minerals 15 00451 g005
Figure 6. The variations in the concentrations of Si (A), Al (B), Ca (C), Mg (D), and Fe (E) under different systems. The standard deviations of Si, Al, Ca, Mg, and Fe were 6.51, 3.26, 1.89, 0.72, and 0.37, respectively.
Minerals 15 00451 g006
Table 1. The poroperm characteristics of the rock samples.
SamplesPermeability
(10−3 μm2)
Porosity
(%)
Average Pore Radius (μm)Sorting Coefficient
S-initial976.00029.1007.8403.582
S-strong1126.00032.1008.8602.645
S-weak1075.00031.2008.2102.778
S-blank987.00029.4007.9903.539
Table 2. The semi-quantitative phase analysis.
Quartz (%)Albite (%)Kaolinite (%)Calcite (%)
S-initial603370
S-strong6030012
S-weak6030010
S-blank603460
Table 3. Peak concentrations and equilibrium times for Si, Al, Ca, Mg, and Fe.
ElementSystemPeak Concentration (ppm)Equilibrium Time (d)
SiS-strong55114
S-weak55625
AlS-strong31713
S-weak31520
CaS-strong918
S-weak949
MgS-strongN/A6
S-weakN/A7
FeS-strongN/A1
S-weakN/A1
Table 4. The KspMinerals 15 00451 i002 of several common precipitates.
Chemical FormulaKspMinerals 15 00451 i003
Ca(OH)24.6 × 10⁻⁶
CaCO34.9 × 10−9
Mg(OH)25.1 × 10⁻¹²
MgCO36.8 × 10−6
Fe(OH)32.8 × 10−39
FeCO33.1 × 10−11
KspMinerals 15 00451 i004: The equilibrium constant for a solid substance dissolving in an aqueous solution. The data refer to “Lange’s Handbook of Chemistry”.
Disclaimer/Publisher’s Note: The statements, opinions and data contained in all publications are solely those of the individual author(s) and contributor(s) and not of MDPI and/or the editor(s). MDPI and/or the editor(s) disclaim responsibility for any injury to people or property resulting from any ideas, methods, instructions or products referred to in the content.

