Article

Geochemical Characteristics of Organic-Enriched Shales in the Upper Ordovician–Lower Silurian in Southeast Chongqing

1
College of Geology and Environment, Xi’an University of Science & Technology, Xi’an 710054, China
2
National and Local Joint Engineering Research Center for Carbon Capture Utilization and Sequestration, Department of Geology, Northwest University, Xi’an 710069, China
*
Authors to whom correspondence should be addressed.
Minerals 2025, 15(5), 447; https://doi.org/10.3390/min15050447
Submission received: 12 February 2025 / Revised: 10 April 2025 / Accepted: 21 April 2025 / Published: 26 April 2025
(This article belongs to the Section Mineral Geochemistry and Geochronology)

Abstract

A variety of variables, such as organic matter input, redox conditions, depositional rates, and terrigenous input, affect the deposition of black shale. Furthermore, because of the significant regional variations in paleodepositional environments, these factors have a complex role in organic matter enrichment. Global geological events influenced sedimentary conditions, organic enrichment, and the development of organic-enriched shales during the Late Ordovician to Early Silurian. The Wufeng–Longmaxi Formation black shales in Southeastern Chongqing were analyzed for X-ray diffraction (XRD), major and trace element geochemistry, and total organic carbon (TOC) data; this led to further analysis of the relationship between the depositional environment and organic matter aggregation and rock type evolution. The primary minerals found in the Wufeng–Longmaxi shale are quartz, feldspar, carbonatite (calcite and dolomite), and clay. The high index of compositional variability (ICV) values (>1) and the comparatively low chemical index of alteration (CIA) values (52.6–72.8) suggest that the sediment source rocks are juvenile and are probably experiencing weak to moderate chemical weathering. The selected samples all show negative Eu anomalies, flat heavy rare earth elements, and mildly enriched light rare earth elements. The ratios of La/Th, La/Sc, Th/Sc, ΣREE-La/Yb, TiO2-Ni, and La/Th-Hf suggest that acidic igneous rocks were the main source of sediment, with minor inputs from ancient sedimentary rocks. The correlations of paleoclimate proxies (Sr/Cu, CIA), redox proxies (V/Cr, V/Ni, V/(V + Ni), Ni/Co, U/Th), paleoproductivity proxies (Baxs, CuEF, NiEF), and water mass restriction proxies (Mo/TOC, UEF, MoEF) suggest a humid–semiarid, anoxic, moderate–high paleoproductivity, and moderate–strongly restricted environment. On the basis of the aforementioned interpretations, the paleoenvironment of the Wufeng–Longmaxi Formations was established, with paleoredox conditions and restricted water masses likely being the primary factors contributing to organic matter enrichment.

1. Introduction

Shale gas refers to natural gas occurring in dark organic-enriched shale systems with very low porosity and permeability [1]. As an increasingly prominent problem of global energy demand, shale gas has received increasing attention because of its high resource potential and long production life [2,3,4,5,6]. Organic-rich shales are significant hydrocarbon source rocks in sedimentary basins and are a target for shale gas exploration globally [3,4,7,8,9]. Although shale gas started late in China, the theoretical research and exploration of shale gas has greatly accelerated in recent years with increasing attention and input. China’s evaluations indicate that onshore shale gas resources amount to approximately 110 × 1012 m3, making it the world’s second largest shale gas producer [3,4,10,11,12].
China has identified 35 significant organic-enriched shale stratigraphic units in Mesoproterozoic to Cenozoic layers [4]. Notably, as an important rich layer of unconventional gas and oil resources, the Ordovician Upper Wufeng Formation (O3w) and Silurian Lower Longmaxi Formation (S1l) marine organic-rich shale developed in Southern China has become an effective source rock for unconventional shale gas and shale oil and a major exploration target. During an era of rising sea levels, the Wufeng–Longmaxi Formations’ organic-rich black shales were extensively laid down on the middle–upper Yangtze Platform ([13] and references therein), and it is an essential stratum for South China’s discovery and utilization of shale gas [13,14]. The Wufeng–Longmaxi shales feature high brittle mineral content, maturity, gas content, and organic carbon content [15]. In addition, during the late Ordovician-early Silurian transition, a significant era in Earth’s evolutionary history, several unusual geological phenomena have been identified, including plate movements, glaciation, volcanic gas eruptions, the Late Ordovician Mass Extinction (LOME), and Oceanic Anoxic Events (OAEs) [16,17]. The extensive Late Ordovician and Early Silurian black shales document key interactions between unique geological events and organic matter deposition [16]. Many studies have focused on the depositional facies and paleogeographic setting [18], sequence stratigraphy [19,20], reservoir characteristics [21,22], massive geochemical characteristic [23,24], microscopic pore structure characteristics, mineralogy, paleontology, and organic petrology of Wufeng–Longmaxi shales, along with a comprehensive framework for shale gas exploration and exploitation [14].
The elements affecting the enrichment and retention of organic materials in the black shales of the Wufeng–Longmaxi Formation have gained significant attention in recent years. However, various researchers have suggested distinct mechanisms for organic matter enrichment [16,25]: Li et al. suggested that the main factors affecting organic matter enrichment are paleoproductivity and redox environment, while terrestrial inputs are secondary [16]; Wei et al. suggested that the fluctuation of the sea level has a strong influence on the paleoenvironmental conditions, which in turn, affects the enrichment of organic matter in the lower part of the Wufeng Formation–Longmaxi Formation [24]; Shang et al. suggested that the organic matter accumulation in the Wufeng Formation–Longmaxi Formation was mainly controlled by the preservation conditions, and also affected by the marine primary productivity and detrital input [26]; Xu et al. suggested that the factors affecting the organic matter enrichment varied vertically, and that terrestrial inputs were the main factors affecting the organic matter enrichment in the Wufeng Formation, whereas in the Longmaxi Formation, the combination of the redox conditions and the production capacity became the main controlling factor for organic matter enrichment due to the impacts of the marine intrusion [13,27].
Except for the various research perspectives, the influence of spatial–temporal differences in the paleoenvironment and paleogeographic settings of local areas may be more important. As one of the national shale gas strategy pilot experimental areas, to gain fresh perspectives for shale gas exploration, it is crucial to conduct pertinent research that investigates the key elements affecting the buildup of organic matter in the southeastern region of Chongqing.
This research investigated the TOC, major and trace element abundances, and X-ray diffraction mineralogical composition of four sections in Southeast Chongqing, and discussed the vertical variations in the paleoenvironment, paleoproductivity, and terrigenous input during the shale deposition of the Wufeng–Longmaxi Formations.

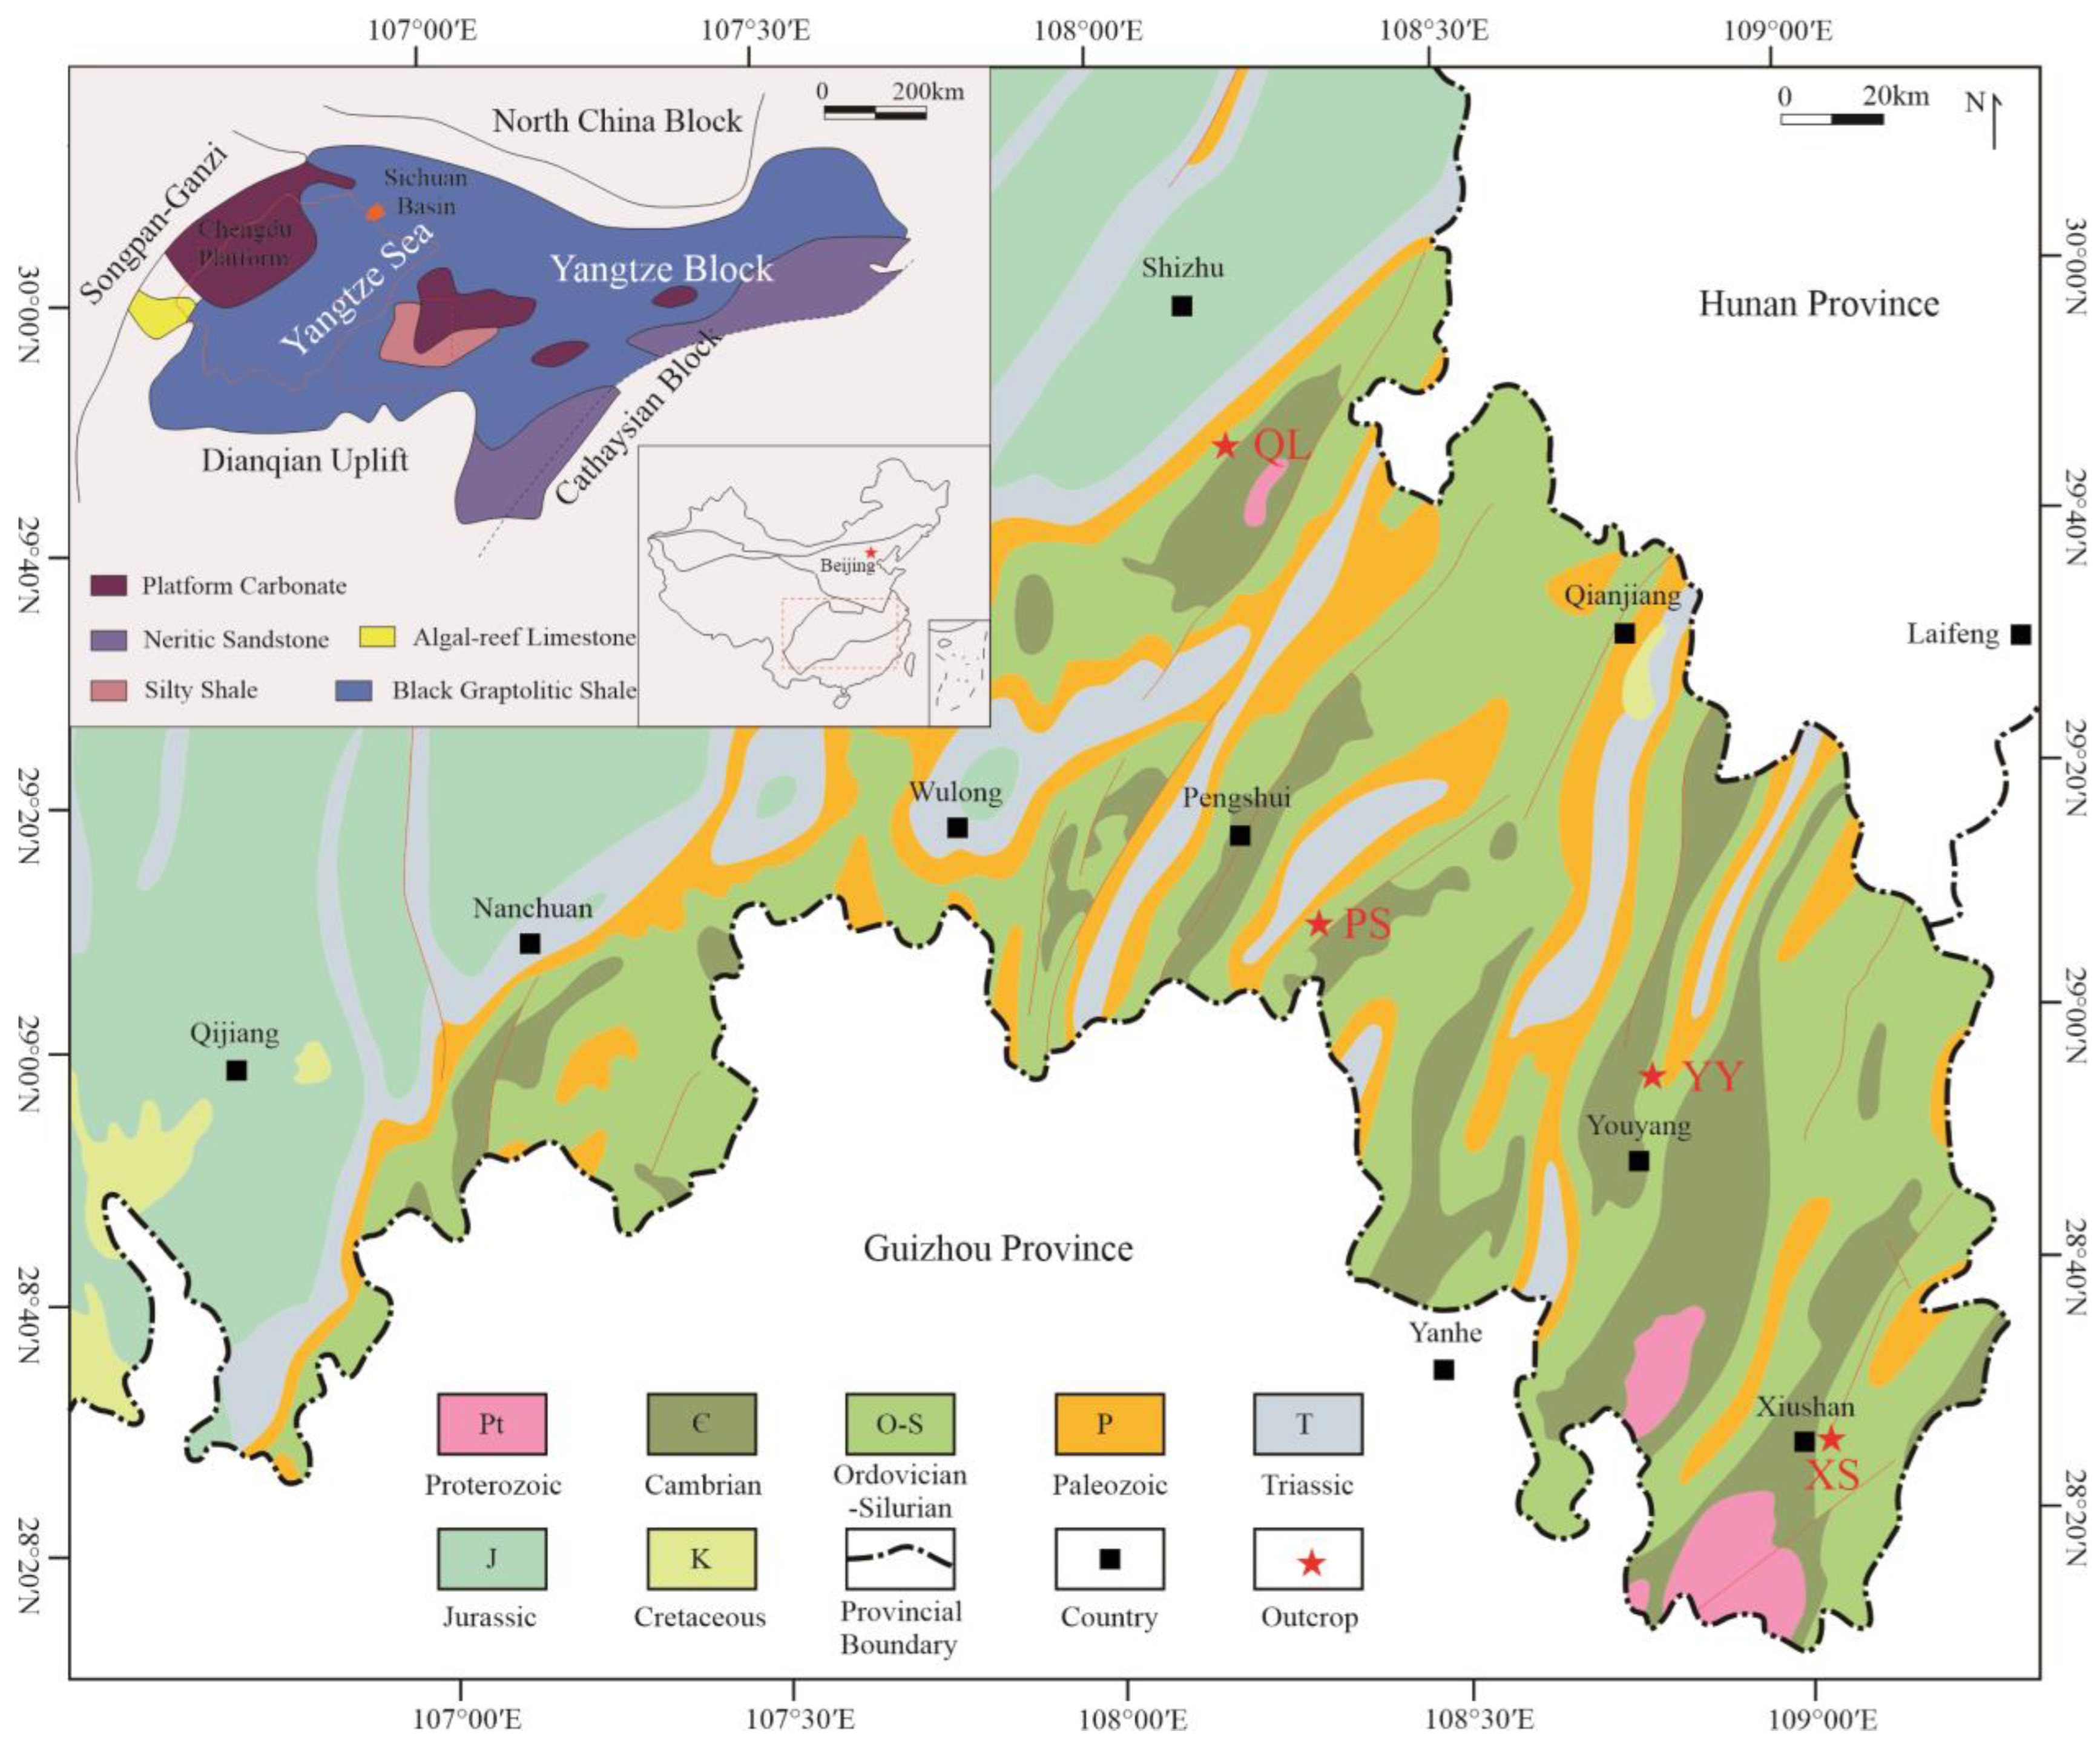
2. Regional Geological Conditions

The southeastern region of Chongqing is situated in the eastern section of the Sichuan Basin, adjacent to Northern Guizhou in Southern China and Xiangxi in Eastern China. This region is situated between the Sichuan and Guizhou central uplifts, constituting a significant component of the upper Yangtze plate. This region has experienced intense tectonic activity and substantial stratigraphic denudation during its geological history. It gradually transitions from a barrier fold to a trough fold when moving from the northwest to the southeast, representing a progressive shift from the cap rock detachment zone to the thrust fold zone (Figure 1). The Upper Ordovician–Lower Silurian strata within Southeastern Chongqing remain largely intact. To investigate source rock characteristics, sediment provenance, geotectonic background, and dynamic mechanisms, field surveys were conducted on four fresh outcrop sections: Datianba in Xiushan County (28.4640° N, 108.9359° E) (XS), Heishui in Youyang County (29.6753° N, 108.7827° E) (YY), Lujiao in Pengshui County (29.1450° N, 108.2935° E) (PS), and Qiliaodafengao (29.8793° N, 108.2926° E) (QL).
The Tianba profile in Xiushan County has a total length of approximately 100 m. It is situated in the southeastern wing of the Pingyanggai syncline, with an overall inclination in the northwest direction. The Heishui section in Youyang County spans approximately 221 m and is situated on the northwest wing of the Xianfeng anticline and the southeast wing of the Tongxi syncline. In Pengshui County, the Lujiao profile is approximately 235.4 m long and can be found in the southeastern wing of the Sangtuoping syncline and northwestern wing of the Tongmayuan anticline. Lastly, the Qiliao section has a total length of approximately 245 m and is positioned in the southeastern wing of the Northern Qiyueshan fault zone as well as the northwestern wing of the Laochangping anticline. By considering division marks indicating top and bottom boundaries for each section within the Wufeng and Longmaxi Formation, along with stratigraphic lithology characteristics, specific paleontological distributions, and combination rules observed across the Shizhuqiliao, Pengshuilujiao, Youyangheishui, and Xiushantianba sections, the lithology and lithofacies pertaining to the Wufeng Formation–Longmaxi Formation can be described below (Figure 2).
① The Wufeng Formation exhibits a stable lateral spread despite its overall limited thickness. On the basis of lithology and paleontological indicators, the Wufeng Formation is classified into two lithologic segments. The lower section primarily consists of gray–black carbonaceous graptolite shale, which contains graptolites and radiolarians. Local layers may exhibit speckled rock bands or thin layers, often comprising siliceous shale layers with well-developed horizontal bedding. In contrast, the upper section comprises carbonaceous calcareous mudstone containing bioclasts and brachiopod fossils. This layer remains relatively consistent in the study area and serves as a regional marker for distinguishing between the Ordovician and Silurian periods. This section is referred to as the Guanyinqiao section within this research area.
② The Longmaxi Formation is vertically classified into two segments: the lower section represents the initial segment of the formation, whereas the upper section comprises the second and third segments. Black carbonaceous penstock shale, black penstock carbonaceous shale, and black–gray carbonaceous silty mudstone make up the majority of the bottom section’s lithology. Shale bedding is well developed, with various types of pyrite (fine bands, dispersed, or discoid) observed, indicating the rich presence of graptolite fossils. Further subdivision into three subsegments is based on the graptolite content, rock color, lithology characteristics, and their combination:
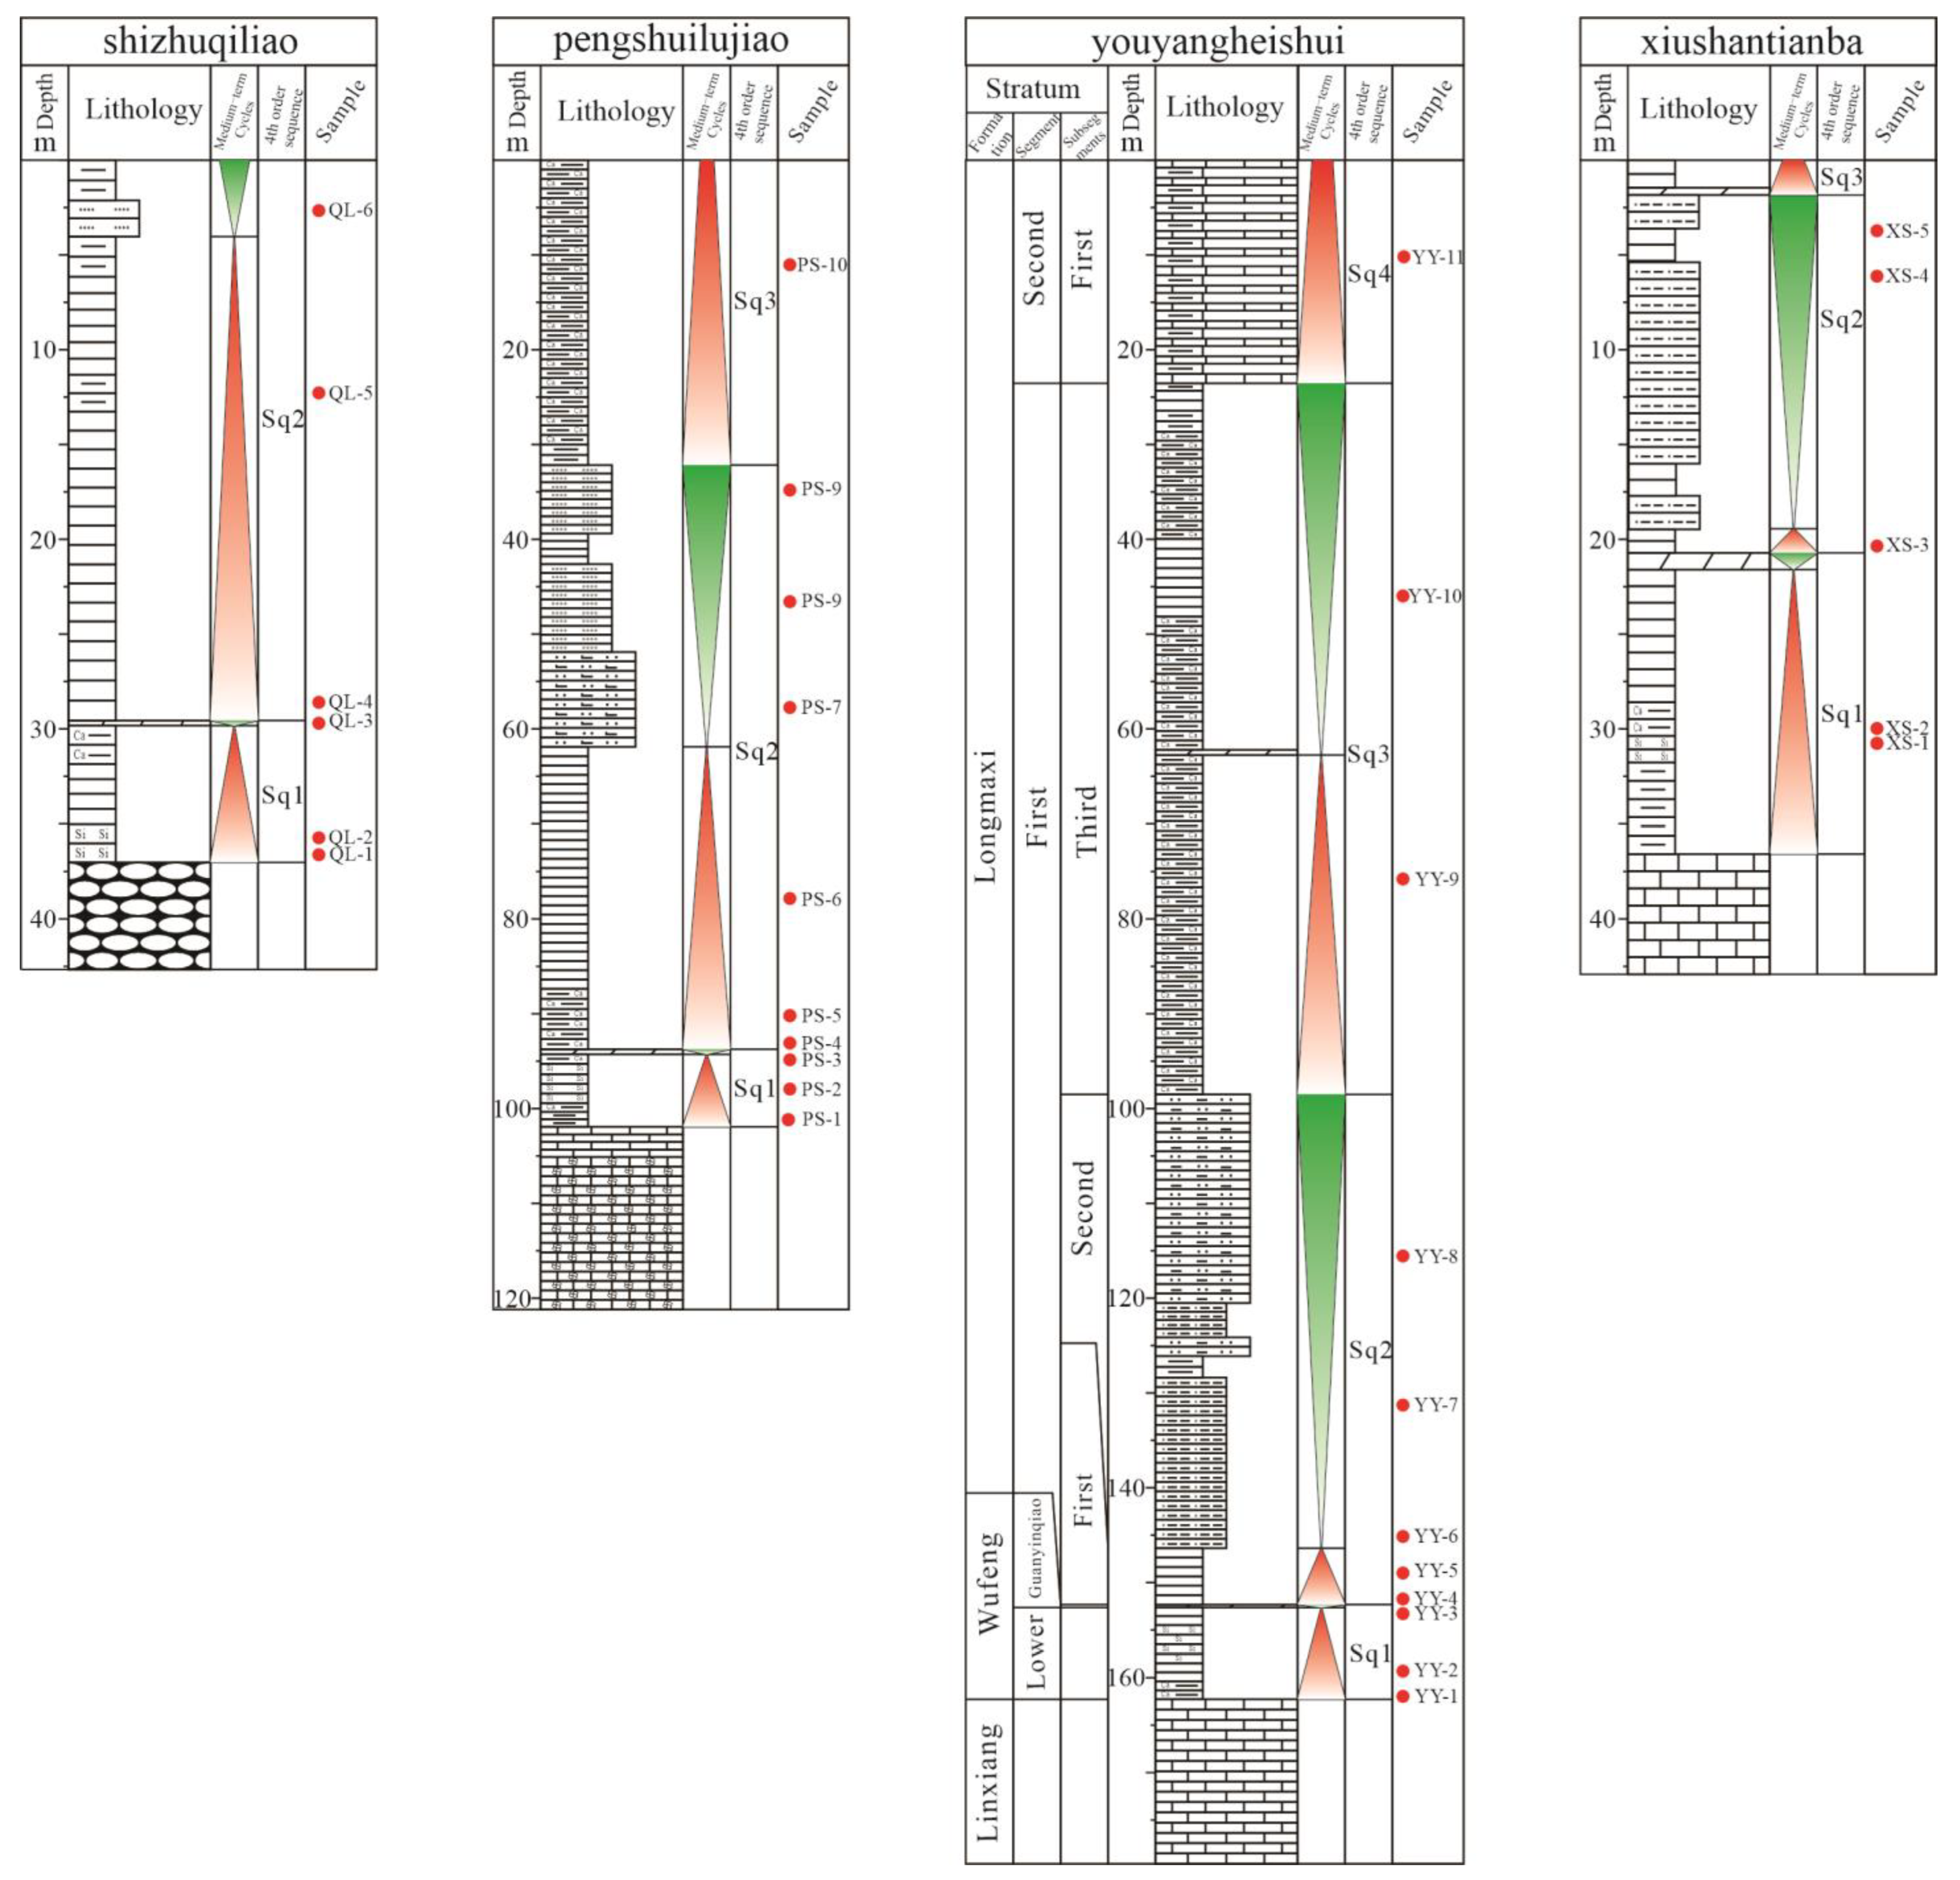
  • First subsegment: Predominantly gray–black carbonaceous graptolite shale exhibiting an abundant distribution of graptolite fossils along layers. From bottom to top, the graptolite content progressively declines. Occasional radiolarians and a small amount of sponge bone needle fossils are visible alongside various types of pyrite. Horizontal bedding in shale is prominent.
  • Second subsection: This section is composed mainly of black–gray carbon-containing silty mudstone with tiny areas of dark-gray carbon-containing argillaceous siltstone. Silty and argillaceous stripes are distributed within the shale matrix. This subsection contains a certain amount of graptolites and a smaller quantity than the first subsegment. Pyrite mainly occurs in laminae.
  • Third subsection: The lower lithology consists primarily of gray–black graptolite carbonaceous shale that transitions to the upper part, which is characterized by black–gray silt-bearing mudstone with a less developed horizontal bedding structure. Graptolites are present throughout this section along with a small amount of radiolarians; however, powdery pyrite only exists in the lower portion.
Upper section: This section is dominated by dark gray siltstone that is occasionally interbedded with silty mudstone and mudstone layers and displays massive structures featuring ripple bedding of medium thickness.

3. Samples and Test Methods

Samples were collected from four outcrop sections, and those with minimal diagenetic influence were selected for microscopic observations of thin sections and elemental geochemical analysis. In conjunction with previous research findings on organic matter peculiarity and sedimentary environments, for main and trace elements, 36 typical samples were selected: four from Guanyinqiao Formation, 11 from Wufeng Formation, and 21 from Longmaxi Formation. The sampling locations are shown in Figure 2. Each sample is crushed prior to analysis, and only fresh rock fragments devoid of secondary dikes were selected. The samples were subsequently subjected to multiple washes with deionized water and then ultrasonically cleaned. In order to prepare the samples for chemical analysis, they were dried and then ground with an agate mortar to a size of <200 mesh. The elemental analysis was conducted at the State Key Laboratory of Isotopic Geochemistry, Guangzhou Institute of Geochemistry, Chinese Academy of Sciences. The main elements were determined via the alkali fusion glass method. The samples were heated to 920 °C in a high-temperature kiln to eliminate organic content. Then, 0.5 g of the calcined sample was measured and mixed well with eight times the quantity of Li2B4O7. One drop of a cosolvent consisting of 2% LiBr and 1% NH4I was subsequently filled with the XRF special platinum crucible containing the mixed sample. Subsequently, a glass sheet was created by melting the combination at 1150 °C, and it was analyzed with a Rigaku 100e wavelength dispersive X-ray fluorescence spectrometer (XRF). Based on the DZG 93 standard methodology [28], trace and rare earth element contents were determined via the acid dissolution method. To wipe out the organic matter, the sample powder with loss on ignition ranging from 0.37 to 0.45 mg was calcined for three hours at 700 °C in a high-temperature furnace prior to weighing and dissolving in a clean PTFE closed dissolving bottle using HNO3, HF, and HClO4 as solvents for subsequent analysis on a PE Elan6000 inductively coupled plasma mass spectrometer (ICP-MS), according to the DZ/T0223-2001 standard [29] procedure with detection limits below < 0.5 × 10⁻⁶. The detection limits of Li, Be, Sc, V, Cr, Co, Ni, Cu, Zn, Ga, Rb, Sr, Zr, Mo, Cs, Ba, and Pb range from 0.01 to 0.2 μg/L, whereas the detection limits of Y, Nb, Hf, Ta, and REEs range from 0.001 to 0.005 μg/L. Moreover, B was analyzed via a plasma spectrometer (IRIS) in accordance with the JY/T 015-1996 test method [30].
Additionally, on the basis of the original main trace test, 45 rock samples were carefully picked from the Longmaxi Formation, Guanyinqiao Formation, and Wufeng Formation for mineral content determination. The samples underwent analysis using a D8 DISCOVER X-ray diffractometer at the Shale Gas Key Laboratory, part of the Jiangsu Mineral Design and Research Institute. The quantitative analysis was conducted following the K value method specified in GB5225-86.

4. Results

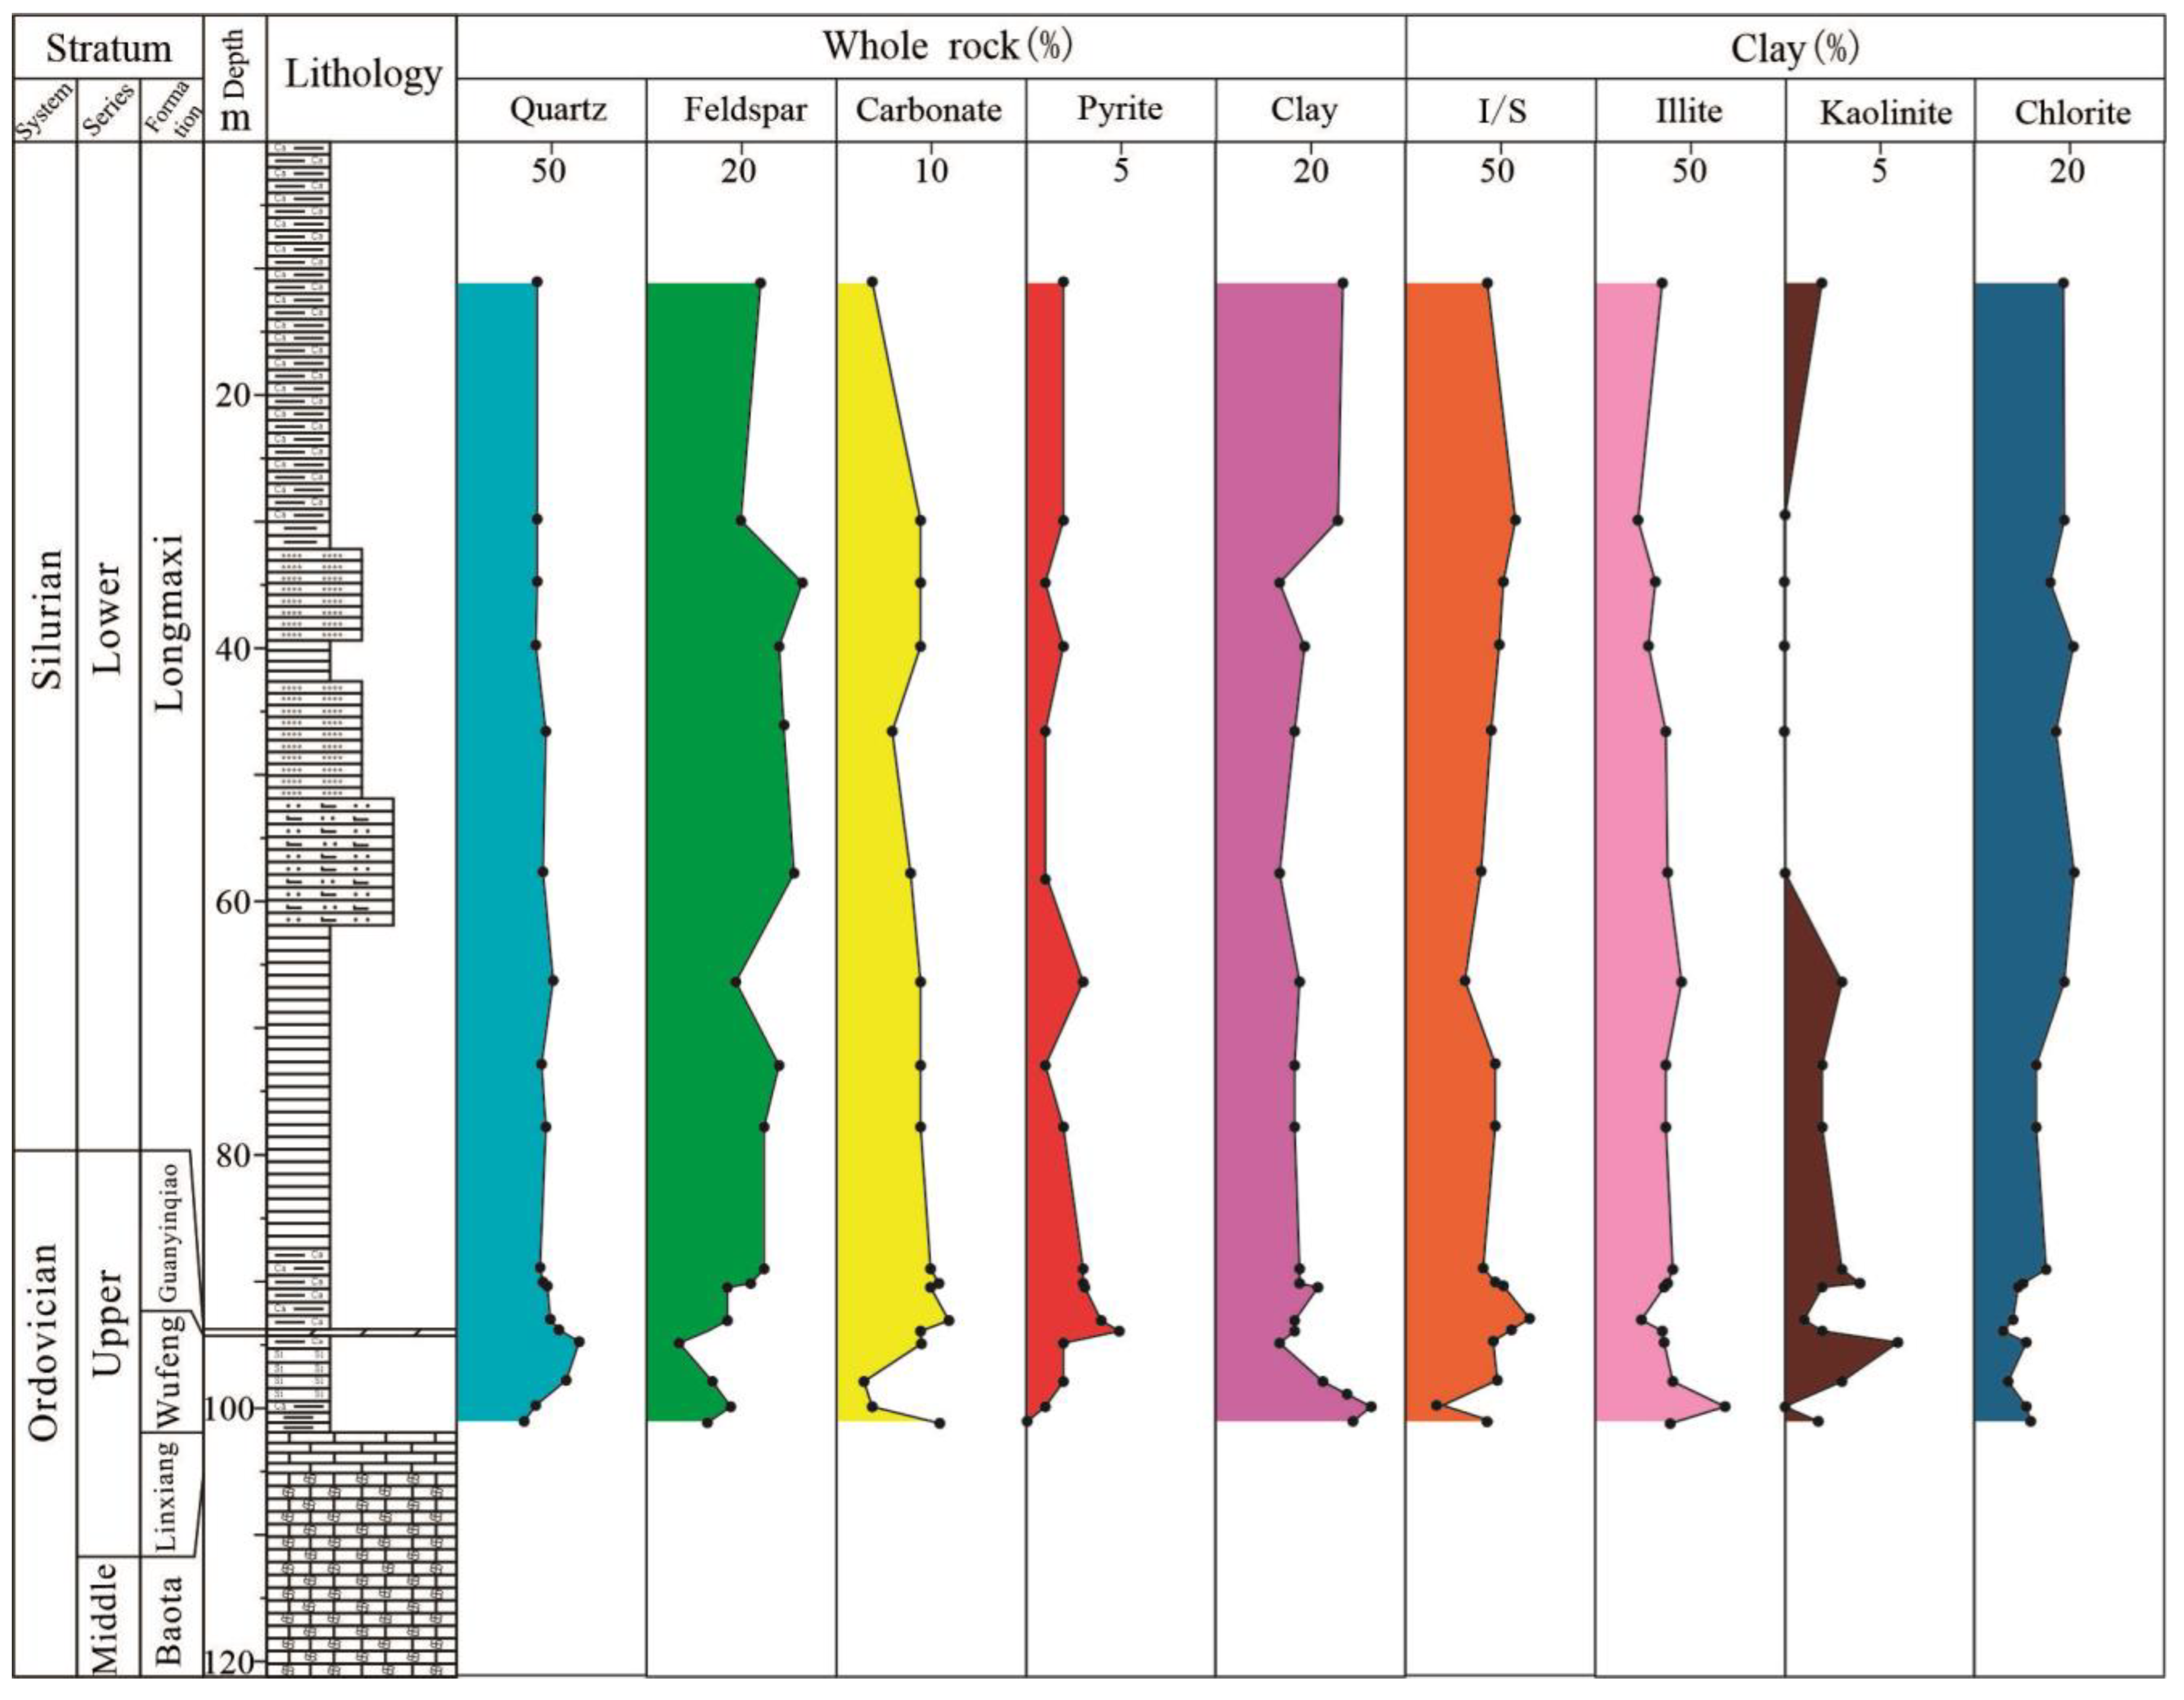
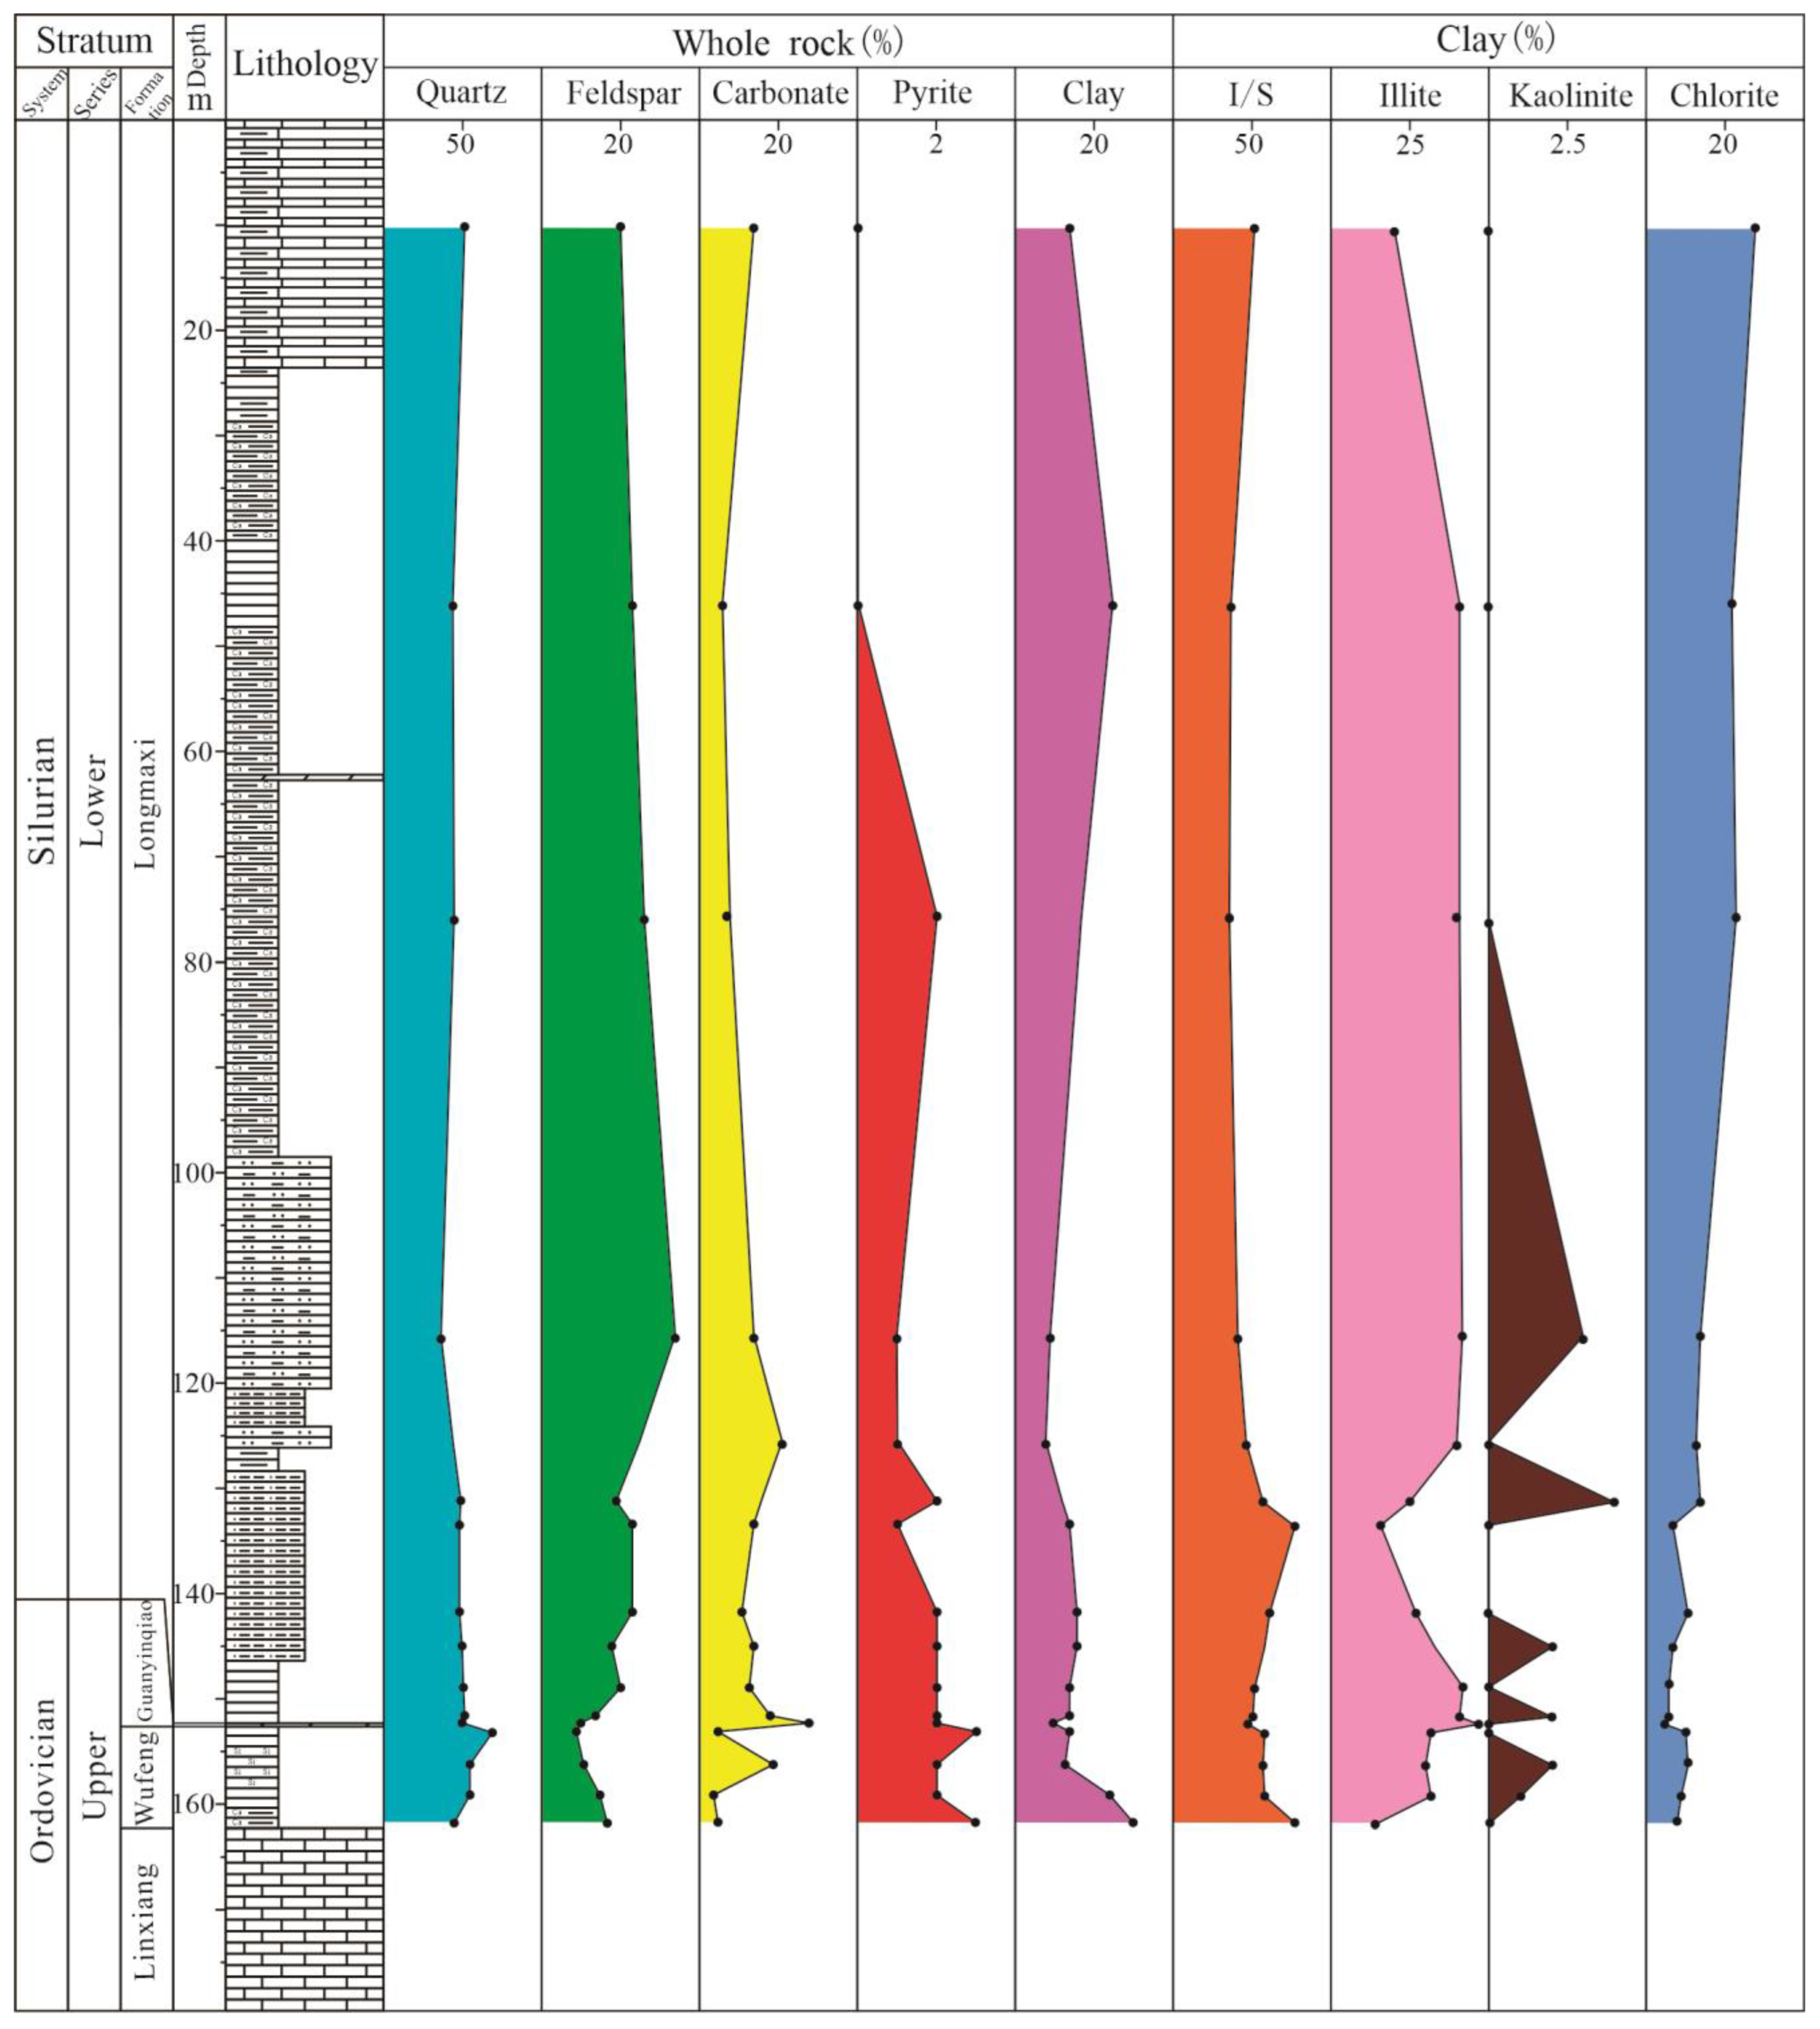
4.1. Characteristics of the Mineral Content

The mineral composition of the Wufeng–Longmaxi shale is complex and diverse and mainly includes quartz, feldspar (potassium feldspar and plagioclase), carbonates (calcite and dolomite), pyrite, and clay minerals. Some samples contain siderite and gypsum, and their contents are relatively low (Table 1).
The quartz content of the Wufeng Formation was between 36% and 71%, with a mean of 55.27%. The content of feldspar varies between 7% and 20%, averaging out at 13.91%. Carbonate minerals show a spread from 3% to 19%, with a mean value of 7.45%. Clay minerals make up anywhere from 11% to 33%, clocking in at a mean of 20.45%. Meanwhile, pyrite is present in trace amounts, ranging from 0% to 3%, with a mean of 1.45%. The quartz content of the Guanyinqiao section ranges from 39% to 54%, with a mean of 47.25%, the feldspar content ranges from 5% to 13%, with a mean of 9.50%, the carbonate mineral content ranges from 9% to 48%, with a mean of 29%, the clay mineral content ranges from 7% to 17%, with a mean of 11.50%, and the pyrite content ranges from 1% to 5%, with a mean of 2.25%. The quartz content of the Longmaxi shale ranges from 37% to 52%, with a mean of 46.77%. The feldspar content ranges between 10% and 34%, with a mean of 23.27%. The average carbonate mineral content is 11.53%, with a range of 3% to 30%. The clay mineral content ranges between 8% and 27%, with a mean of 16.40%. The pyrite content ranges from 0% to 4%, with a mean of 1.63%.
The Pengshui Lujiao profile and Youyang Heishui profile were selected for the study of mineral content and its vertical changes (Figure 3 and Figure 4). The overall distributions of the two sections are generally similar. Starting at the Wufeng Formation’s base, quartz levels are low, while carbonate rock and clay concentrations are elevated, suggesting deep-water sedimentation. Subsequently, quartz content rises steadily while clay content declines. The sedimentary Wufeng Formation consists of siliceous rocks with high quartz contents, followed by the gradual shallowing of the water body where deposition occurred at the Guanyinqiao section. Owing to different structural positions, the lithology and mineral composition significantly differ in the Guanyinqiao section. As the water body further deepens, organic-rich mud shale deposits with high quartz level and pyrite presence are found in the bottom portion of the Longmaxi Formation. With continued deposition, lithological shifts emerge in the upper portion of the Longmaxi Formation, marked by declining quartz levels and rising clay mineral content; certain local areas exhibit characteristics of both high quartz and high carbonate rock.
Further measuring the clay mineral composition within the shale revealed that the primary constituents are a combined layer of illite and montmorillonite, along with illite, kaolinite, and chlorite, all of which do not contain montmorillonite. In the clay minerals of the Wufeng Formation, mixed layers of illite–orthopyroxene range from 20% to 78%, with a mean of 54.55%. The illite content between 14% and 69%, with a mean value of 34.36%. The kaolinite content ranges from 0% to 6%, with a mean value of 1.27%, and the chlorite content between 1% and 19%, with a mean value of 9.82%. The illite–montmorillonite mixed layer in the Guanyinqiao section ranges from 48% to 74%, with a mean of 59.25%. The illite content ranges from 19% to 47%, with a mean value of 35.25%. The kaolinite content ranges from 0% to 2%, with a mean of 0.50%. The chlorite content ranges from 2% to 7%, with an average value of 5%. The illite–montmorillonite mixed layer of the Longmaxi Formation shale ranges from 32% to 77%, with a mean value of 50.37%. The illite content ranges from 16% to 48%, with a mean value of 35.93%. The kaolinite content between 0% and 4%, with a mean of 1.00%. The chlorite content between 0% and 28%, with a mean of 12.70%.
With regard to the vertical distribution of clay minerals (Figure 3 and Figure 4), the Wufeng Formation to the lower portion of the Longmaxi Formation showed a notable increase in illite–smectite mixed layers and illite concentrations, reflecting a complementary trend. The absence of montmorillonite suggests that the existence of an illite–montmorillonite mixed layer and illite may result from transformation processes involving montmorillonite. Furthermore, there is also evidence indicating a transition from kaolinite to chlorite, as evidenced by their shifting tendencies.

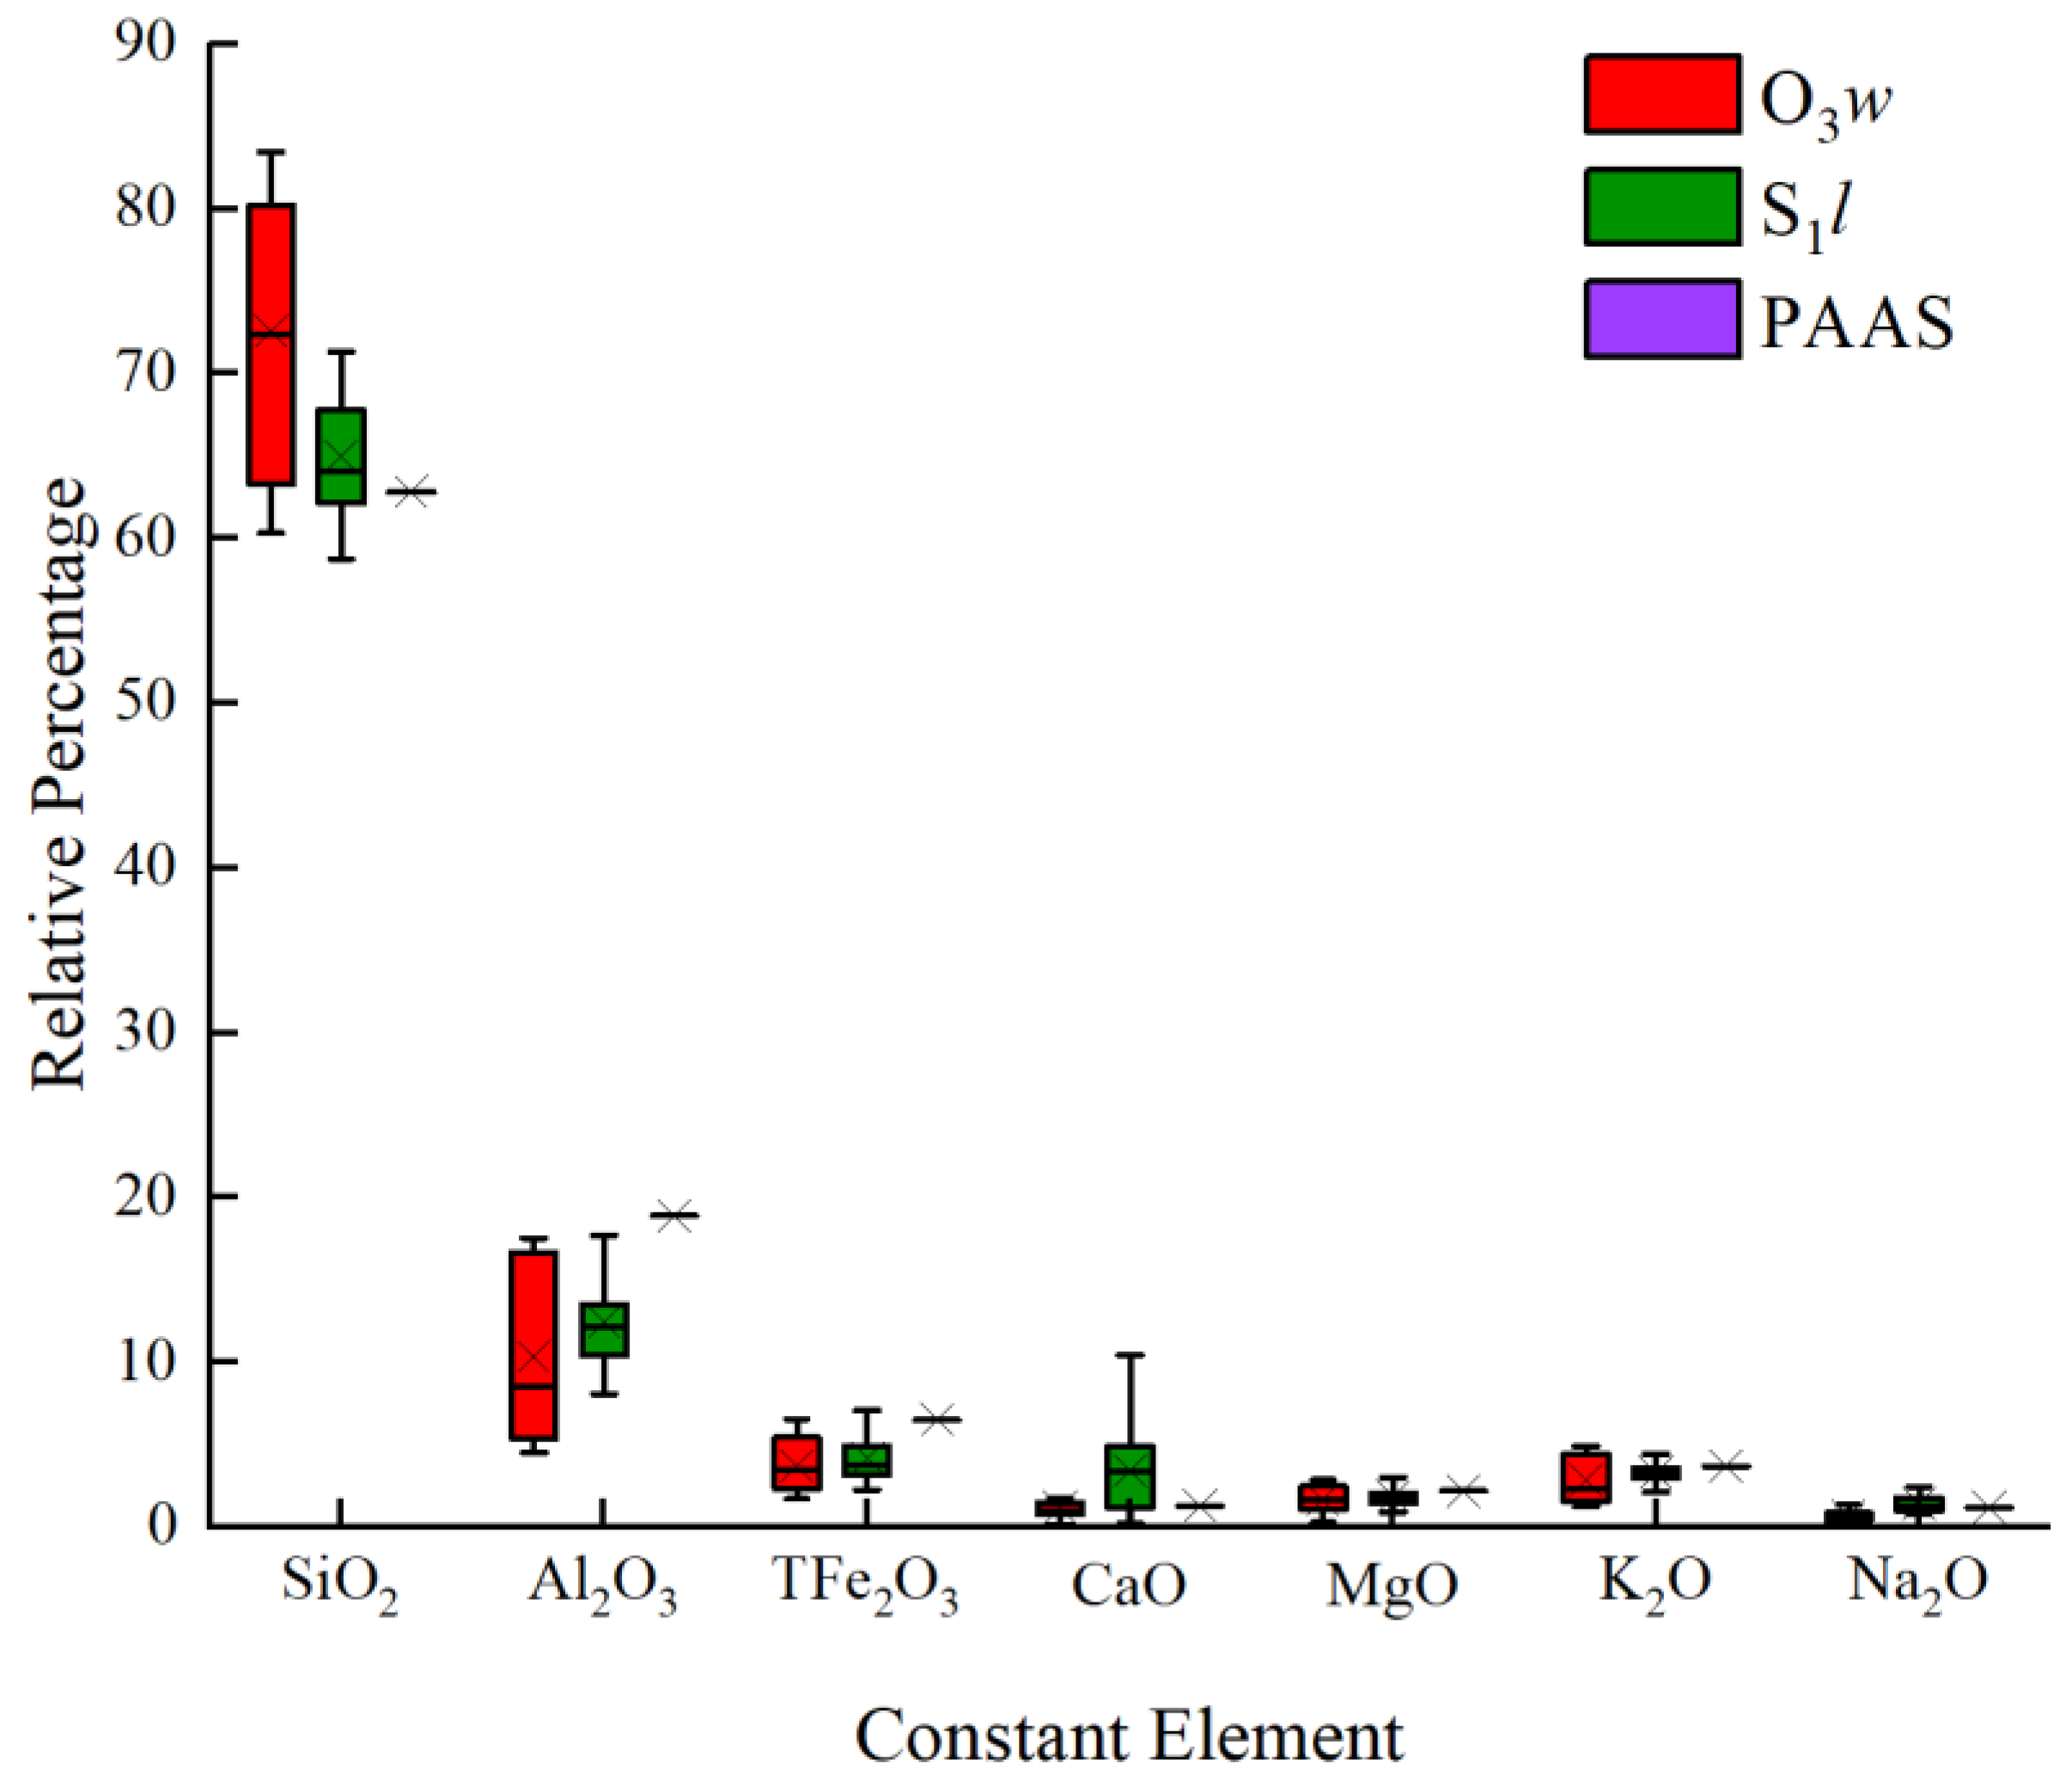
4.2. Major Element Geochemistry

In the southeastern part of Chongqing, the levels of key elements within the rocks of the Wufeng–Longmaxi Formation were between 58.76% and 83.44%, with an overall average settling at 67.55%. The Al2O3 content ranges from 4.53% to 17.71%, with an average value of 11.72%. TFe2O3 is 1.69%–7.07%, with an average value of 4.01%. CaO is 0.16%–10.43%, with a mean of 2.66%; MgO is 0.30%–3.04%, with an average of 1.78%; K2O is 1.26–4.90%, with a mean of 3.13%; and Na2O is 0.33%–2.47%, averaging 1.18%. The content of SiO2 is low (24.58%–56.09%), that of Al2O3 is 2.15%–11.24%, that of TFe2O3 is 2.06%–5.65%, that of CaO is 4.65%–20.27%, that of MgO is 1.67%–12.56%, that of K2O is 0.60%–3.14%, and that of Na2O is 0.46%–1.00%. The major elements in each group of rocks have high SiO2 and Al2O3 contents. At a mean of 72.54%, the greatest siliceous concentration is found in the Wufeng Formation. The TFe2O3 concentration in the Longmaxi Formation averaged 4.17%, exceeding that in the Wufeng Formation. The levels of other key elements remain comparatively minimal, but there are still some differences between the groups. For example, for MnO, MgO, and P2O5 (Figure 5), compared with those of the PAAS standard sample [31], the levels of MgO, K2O, and Na2O are largely comparable, while the amounts of Al2O3 and TFe2O3 fall short of the standard sample. In contrast, the concentrations of SiO2 and CaO exceed those found in the standard reference.

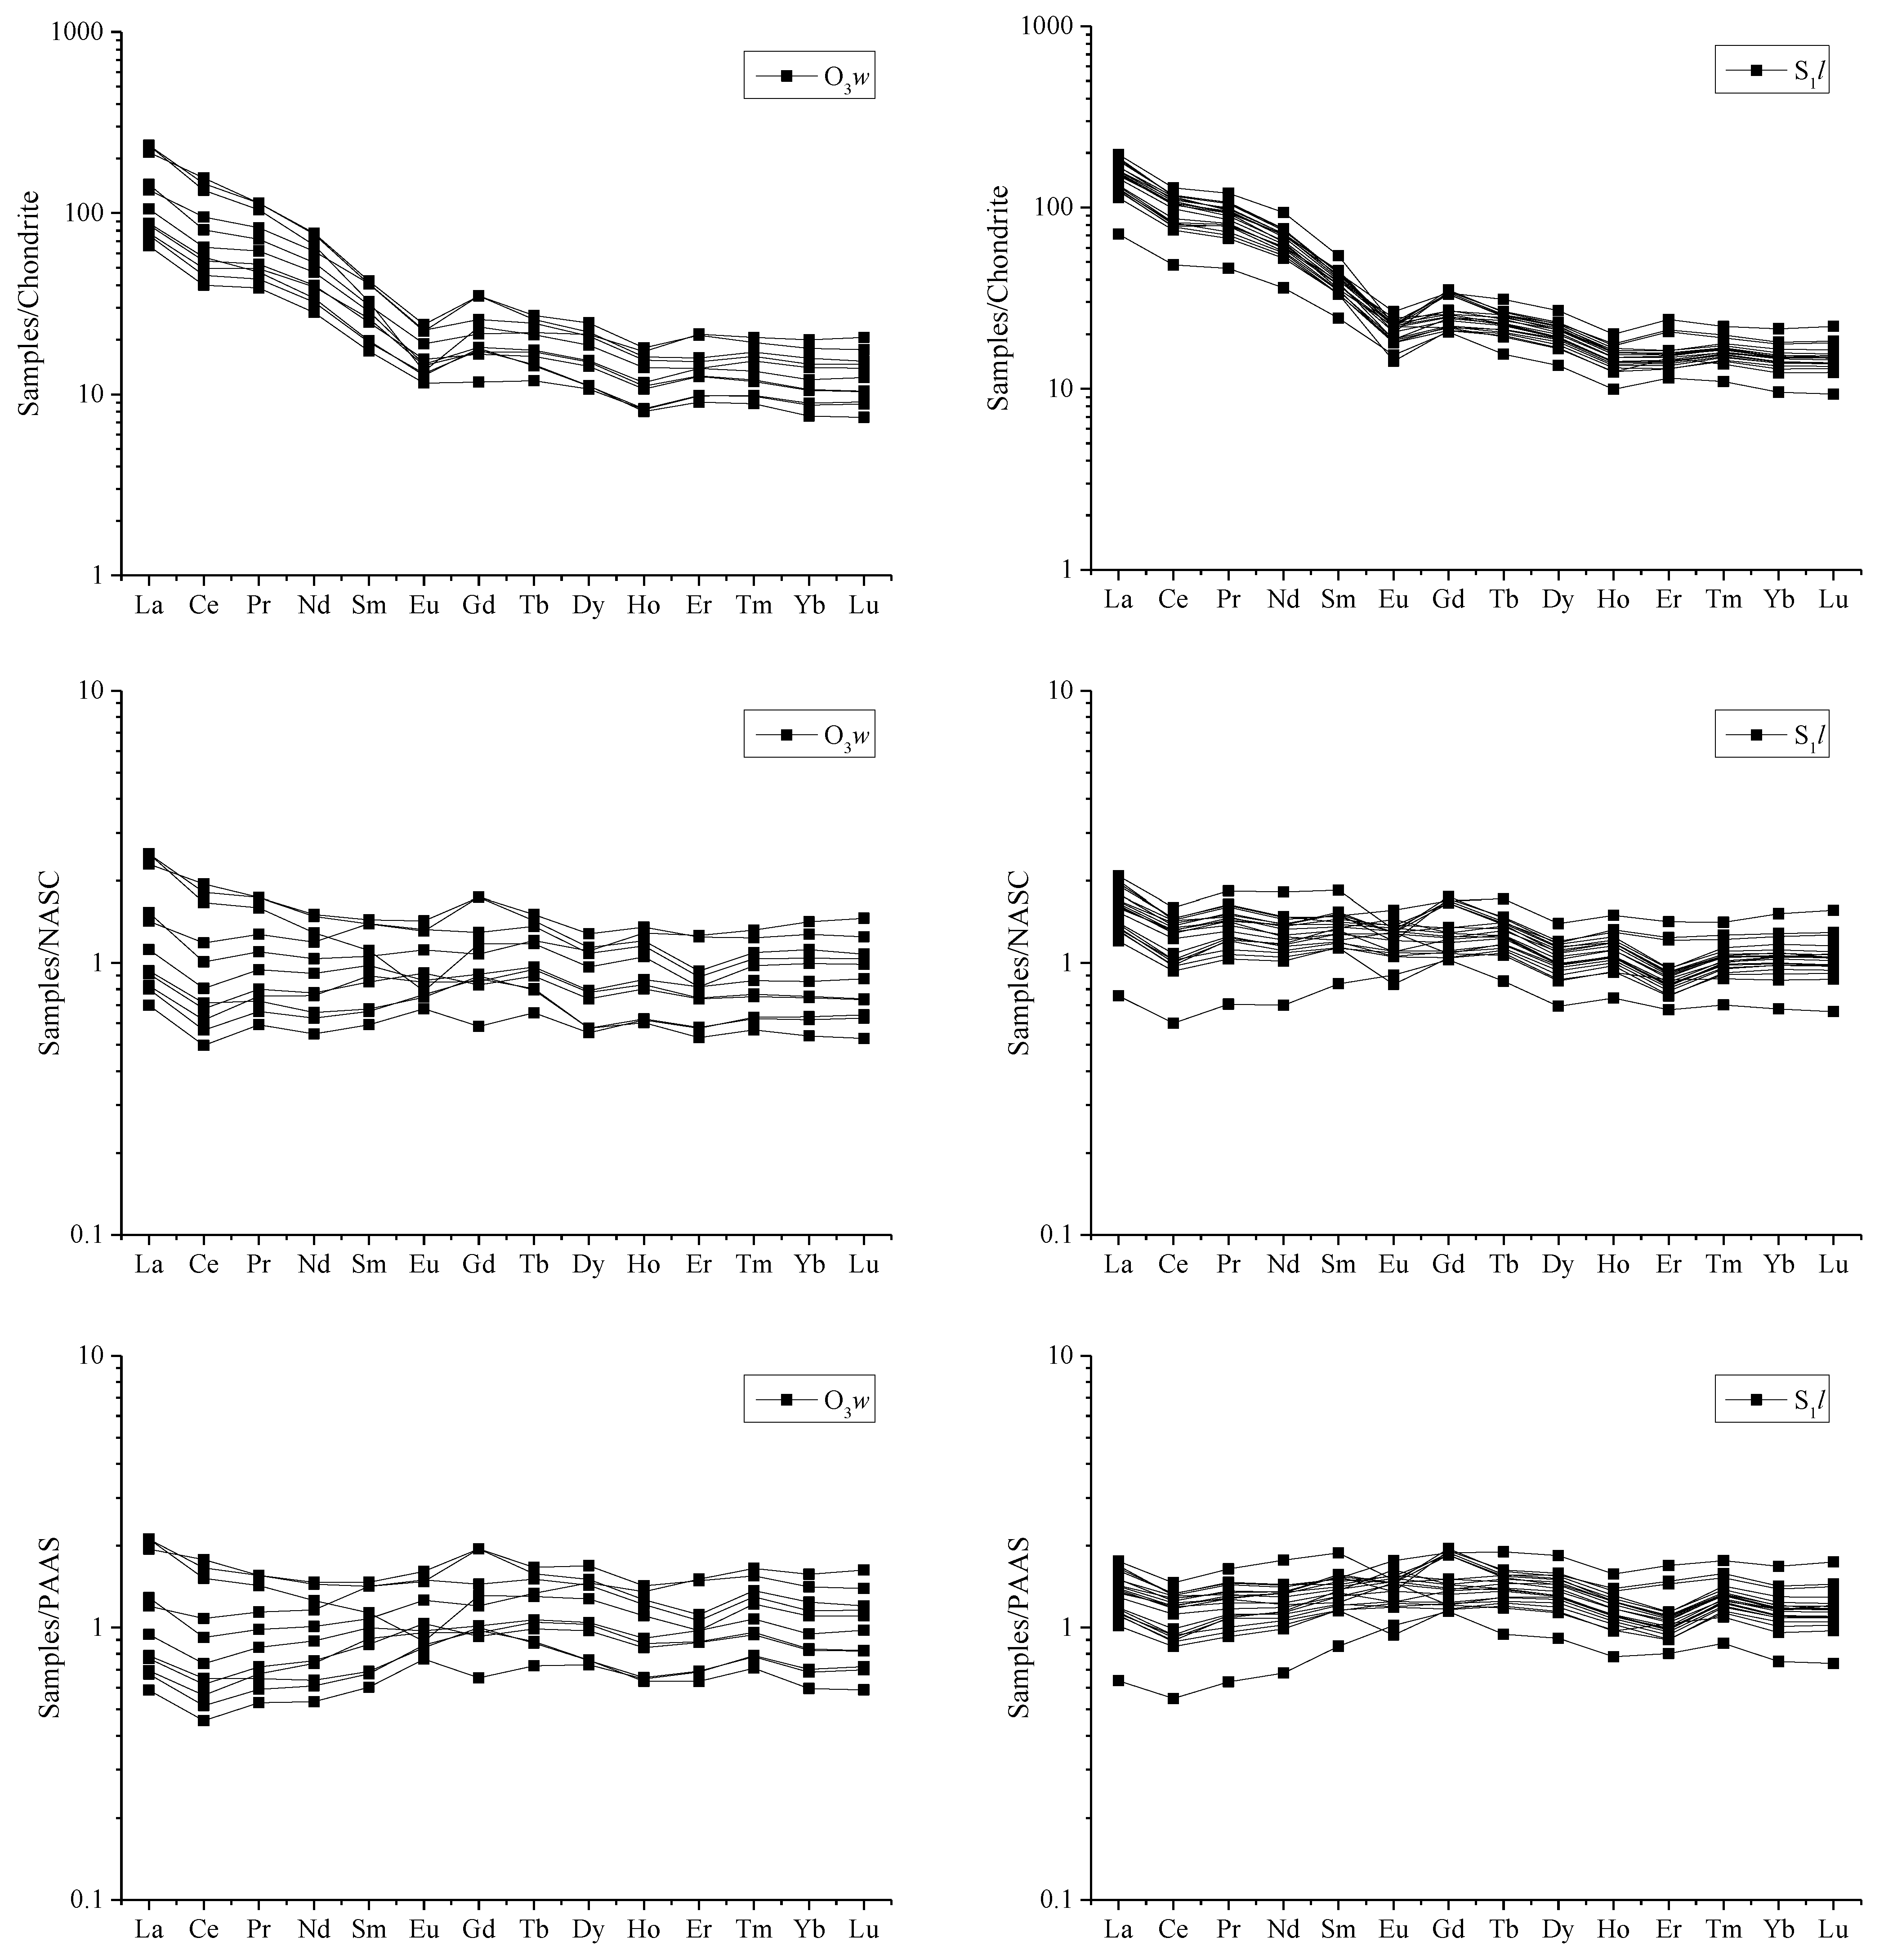
4.3. Trace Element Geochemical Data

The Wufeng and Longmaxi Formations’ rare earth elements typically exhibit high ΣREE levels, light rare earth element enrichment, and Eu depletion. The total rare earth ΣREE content is 97.70 × 10⁻⁶–315.21 × 10⁻⁶, the ratio of LREEs/HREEs is between 2.65 and 4.94, and the δEu value is 0.74–1.23. The average value of ΣREE is 157.29 × 10⁻⁶, the average value of LREEs/HREEs is 2.74, and the mean value of δEu is 1.16. The Longmaxi Formation has a total rare earth concentration of 118.54 × 10⁻⁶–301.02 × 10⁻⁶, the LREE/HREE ratio is 2.69–4.62, and the δEu value is 0.50–1.21. There are significant parallels between the REE characteristics of a large number of samples taken from the Wufeng–Longmaxi Formations in the area under investigation. The REE characteristics indicate that the provenances of the Wufeng–Longmaxi Formations are not very different.
In the normalized distribution pattern diagram of rare earth element chondrites (Figure 6), the light rare earth distribution curves in each group exhibit steep slopes, indicating significant deviations and implying high levels of fractionation among the light rare earth elements. Conversely, from Gd to Lu, the distribution patterns of heavy rare earth elements show a small slope with no noticeable leftward skew, indicating a discernible degree of fractionation among these elements. The lack of factors that lead to the fractionation of heavy rare earth elements in the upper crust leads to stable concentrations and an enrichment of light rare earth elements. Elemental differentiation leads to the enrichment of Eu in the lower crust but its scarcity in the upper crust [32,33]. In the standardized diagrams of post-REE Archean Australian shale (PAAS) and North American shale (NASC), the distribution curves are predominantly horizontal, indicating that the rare earth element compositions are close to those of the PAAS and NASC. This implies that the upper crust is the primary source of sediment source rocks. Consequently, it is obvious that the sediments of the Longmaxi and Wufeng Formations mainly originate from the upper crust. Furthermore, the REE distribution pattern of the Wufeng Formation is parallel to the Longmaxi Formation, and the Longmaxi Formation has a more consistent REE allocation model than the Wufeng Formation. These observations imply long-term stability in a sedimentary basin during deposition periods associated with the Longmaxi Formation, accompanied by prolonged uplift and denudation processes providing a stable source for this region. However, relative to this period, slight instability is observed in terms of sedimentary basin stability during depositional periods related to the Wufeng Formation.

5. Discussion

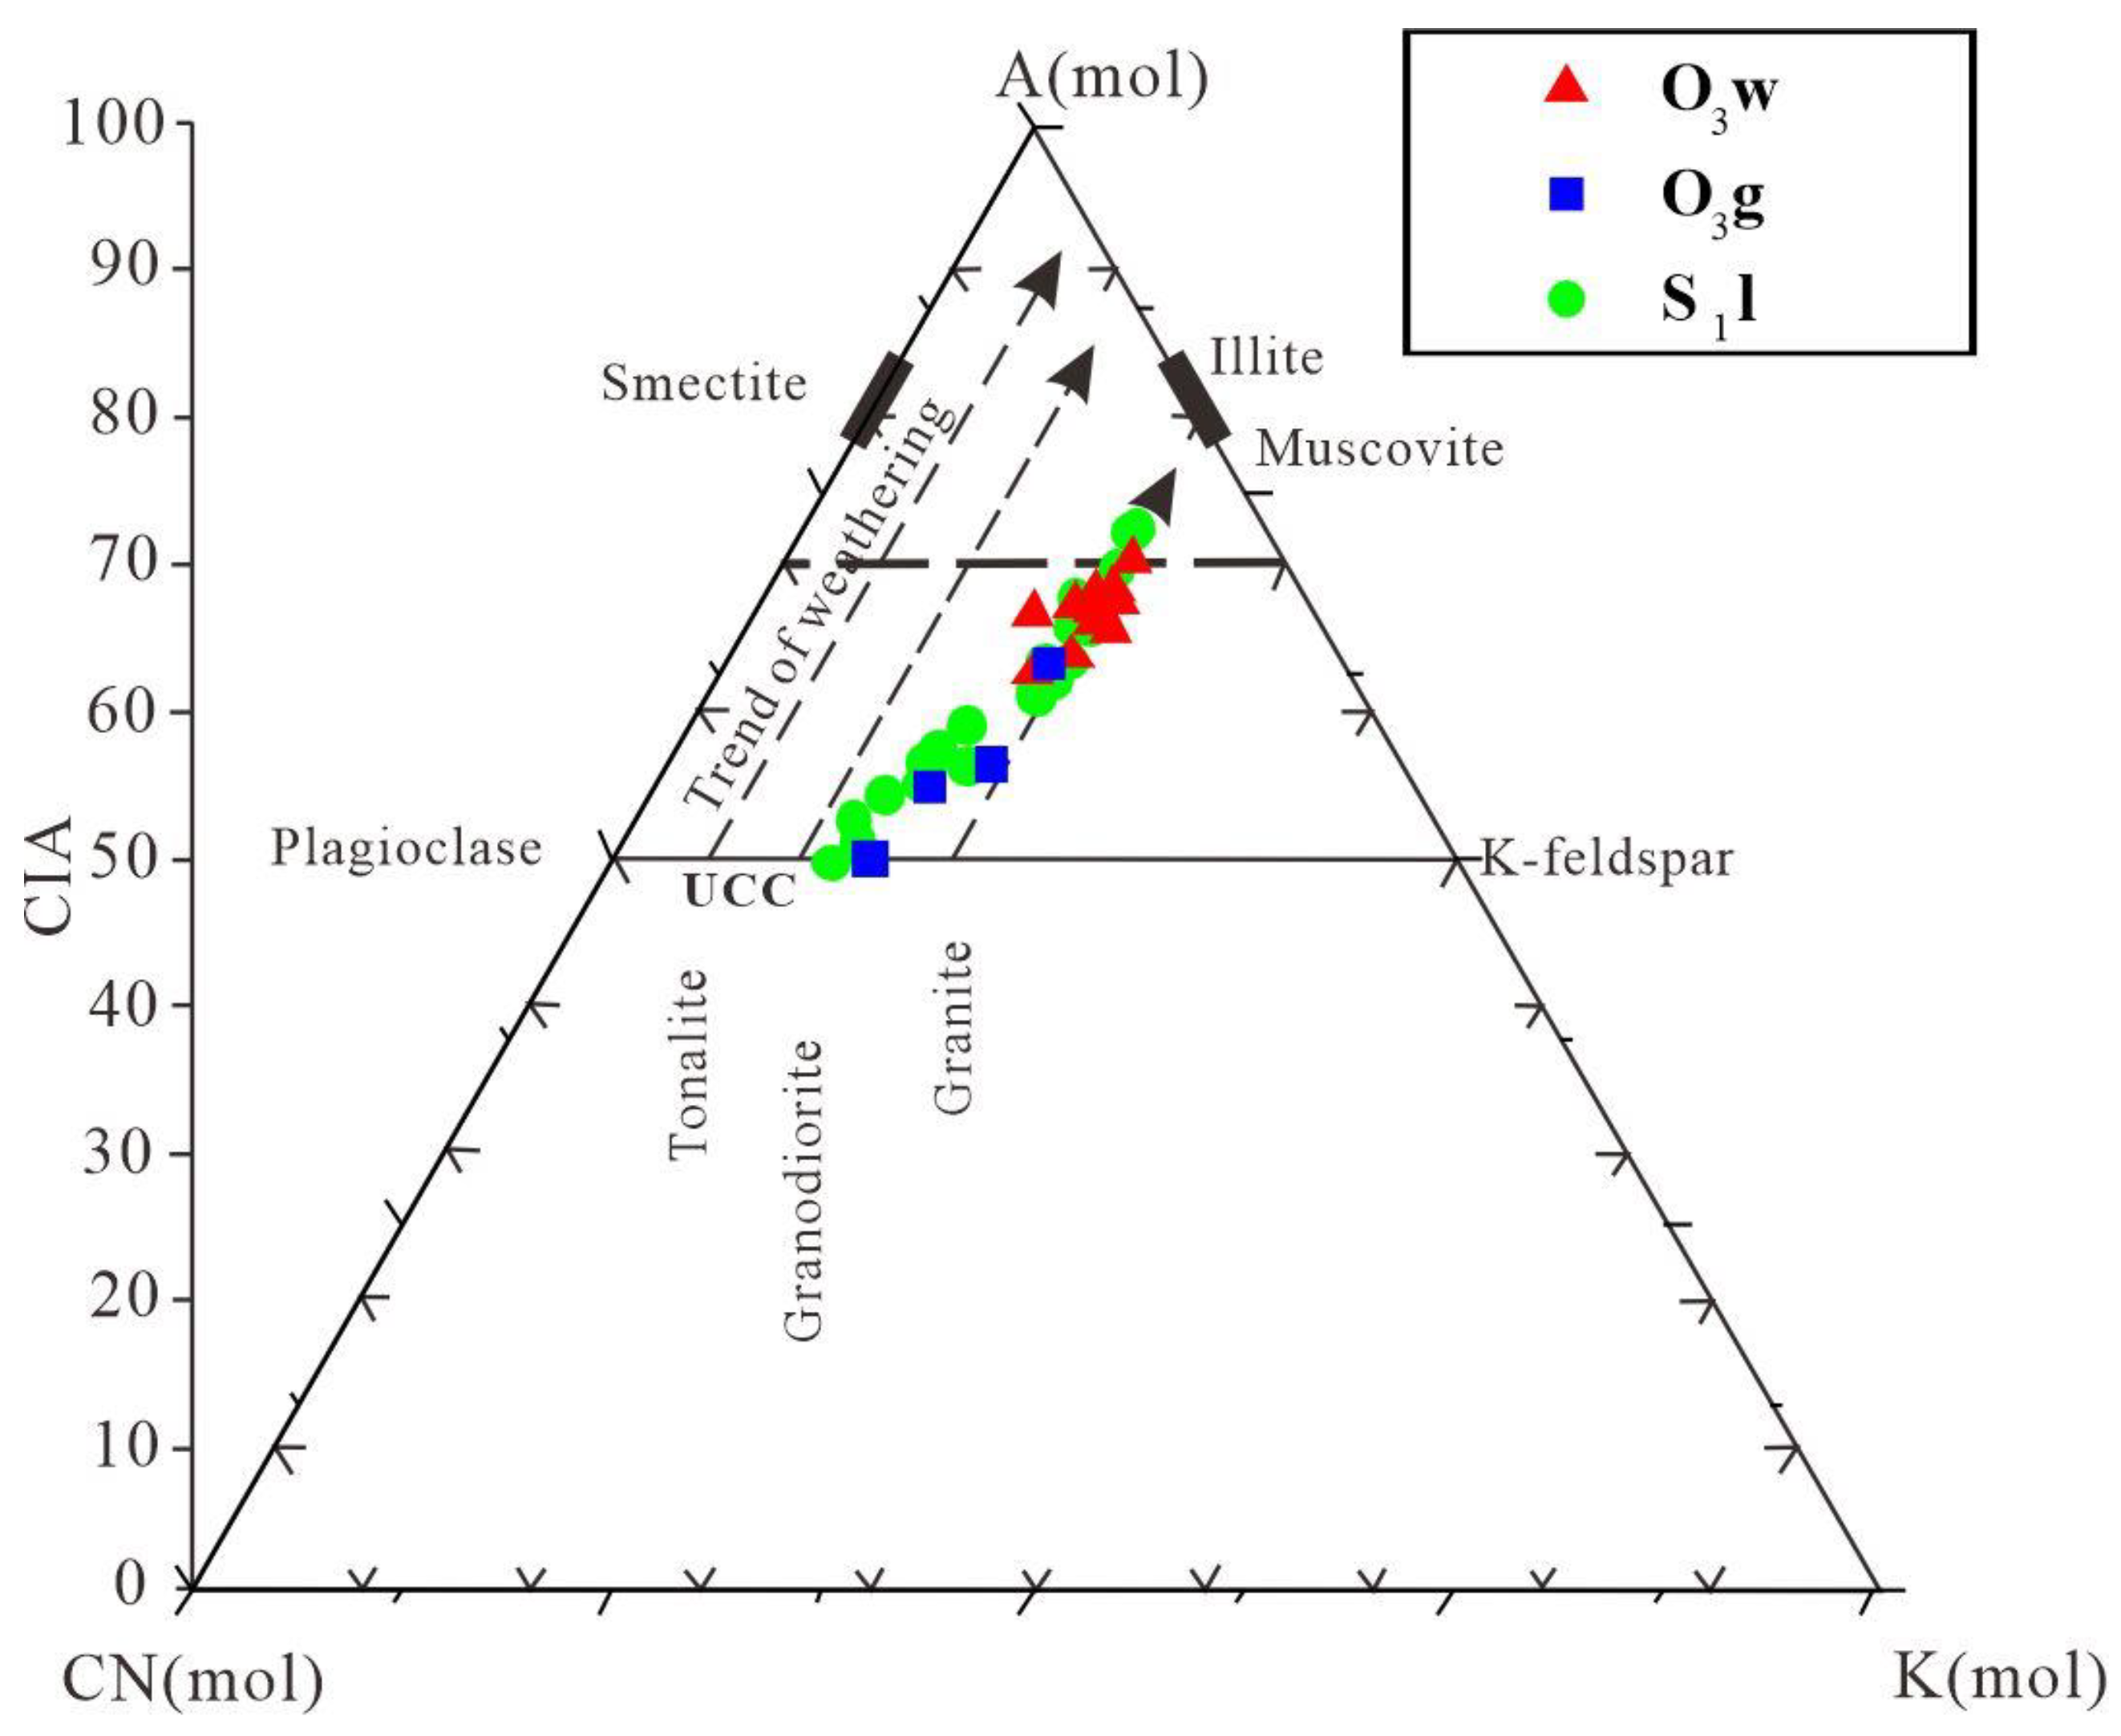
5.1. Provenance Analysis

5.1.1. Ancient Weathering and Sedimentary Recycling

The level of chemical weathering and the strength of sedimentary recirculation have an enormous effect on the composition of clastic rocks. Previously, various chemical weathering indicators were used to evaluate weathering conditions and the degree of sedimentary recycling in the source location [36]. The common weathering index CIA and ICV calculation formula is the molar ratio:
CIA = [Al2O3/(Al2O3 + Na2O + CaO* + K2O)] × 100
ICV = (TFe2O3 + K2O + Na2O + CaO + TiO2)/Al2O3
where the CaO* value is the CaO content in silicate. If the CaO* content is lower than the Na2O content, CaO* = (CaO − P2O5* 10/3) mol; otherwise, the Na2O content takes the place of the CaO* value [37].
Previously, the weathering degree was divided into three sections according to the CIA value. CIA values of 50–65 indicate weak weathering, 65–85 suggest moderate weathering, and 85–100 denote strong weathering [36]. In this work, the CIA values of the Wufeng Formation samples were between 62.6 and 70.3, with a mean of 66.6, reflecting moderate weathering conditions. The average CIA value of the Guanyinqiao section is only 56.2, and the CIA value of the Longmaxi Formation is 52.6–72.8, with a mean of 61.0, reflecting that it is under weak weathering conditions. The three-component A-CN-K ternary diagram, which depends on the molar ratios of Na2O, K2O, Al2O3, and CaO, serves as a go-to method for assessing both the weathering degree and the variety of the source rock in the source area [38]. According to Figure 7, the samples from the Wufeng Formation–Longmaxi Formation were primarily exposed to medium-weak weathering conditions, and the A-CN line was almost parallel to their weathering trend lines, suggesting that their CIA values were basically not affected by potassium metasomatism during the later diagenesis process. The Index of Component Variation (ICV) is widely utilized to assess the compositional maturity and recycling levels of sediments [39]. In general, an ICV lower than 0.84 indicates that the compositional maturity is high and experiences multiple sedimentary cycles, and the degree of recycling is high, whereas an ICV higher than one demonstrates that it is the product of the first cycle and that the compositional maturity is low [39]. In this study, the ICVs of the test samples were greater than one (the mean values were 1.4, 13.1, and 1.7, respectively), which was significantly greater than the PAAS standard value (0.80). These values suggest minimal sedimentary recycling and low compositional maturity in the Wufeng–Longmaxi Formations. Moreover, a lower ICV value indicates more intensive weathering. The single peak change in the ICV values of the three groups of rock samples from low high to low corresponds to the change in weathering degree revealed by the CIA.

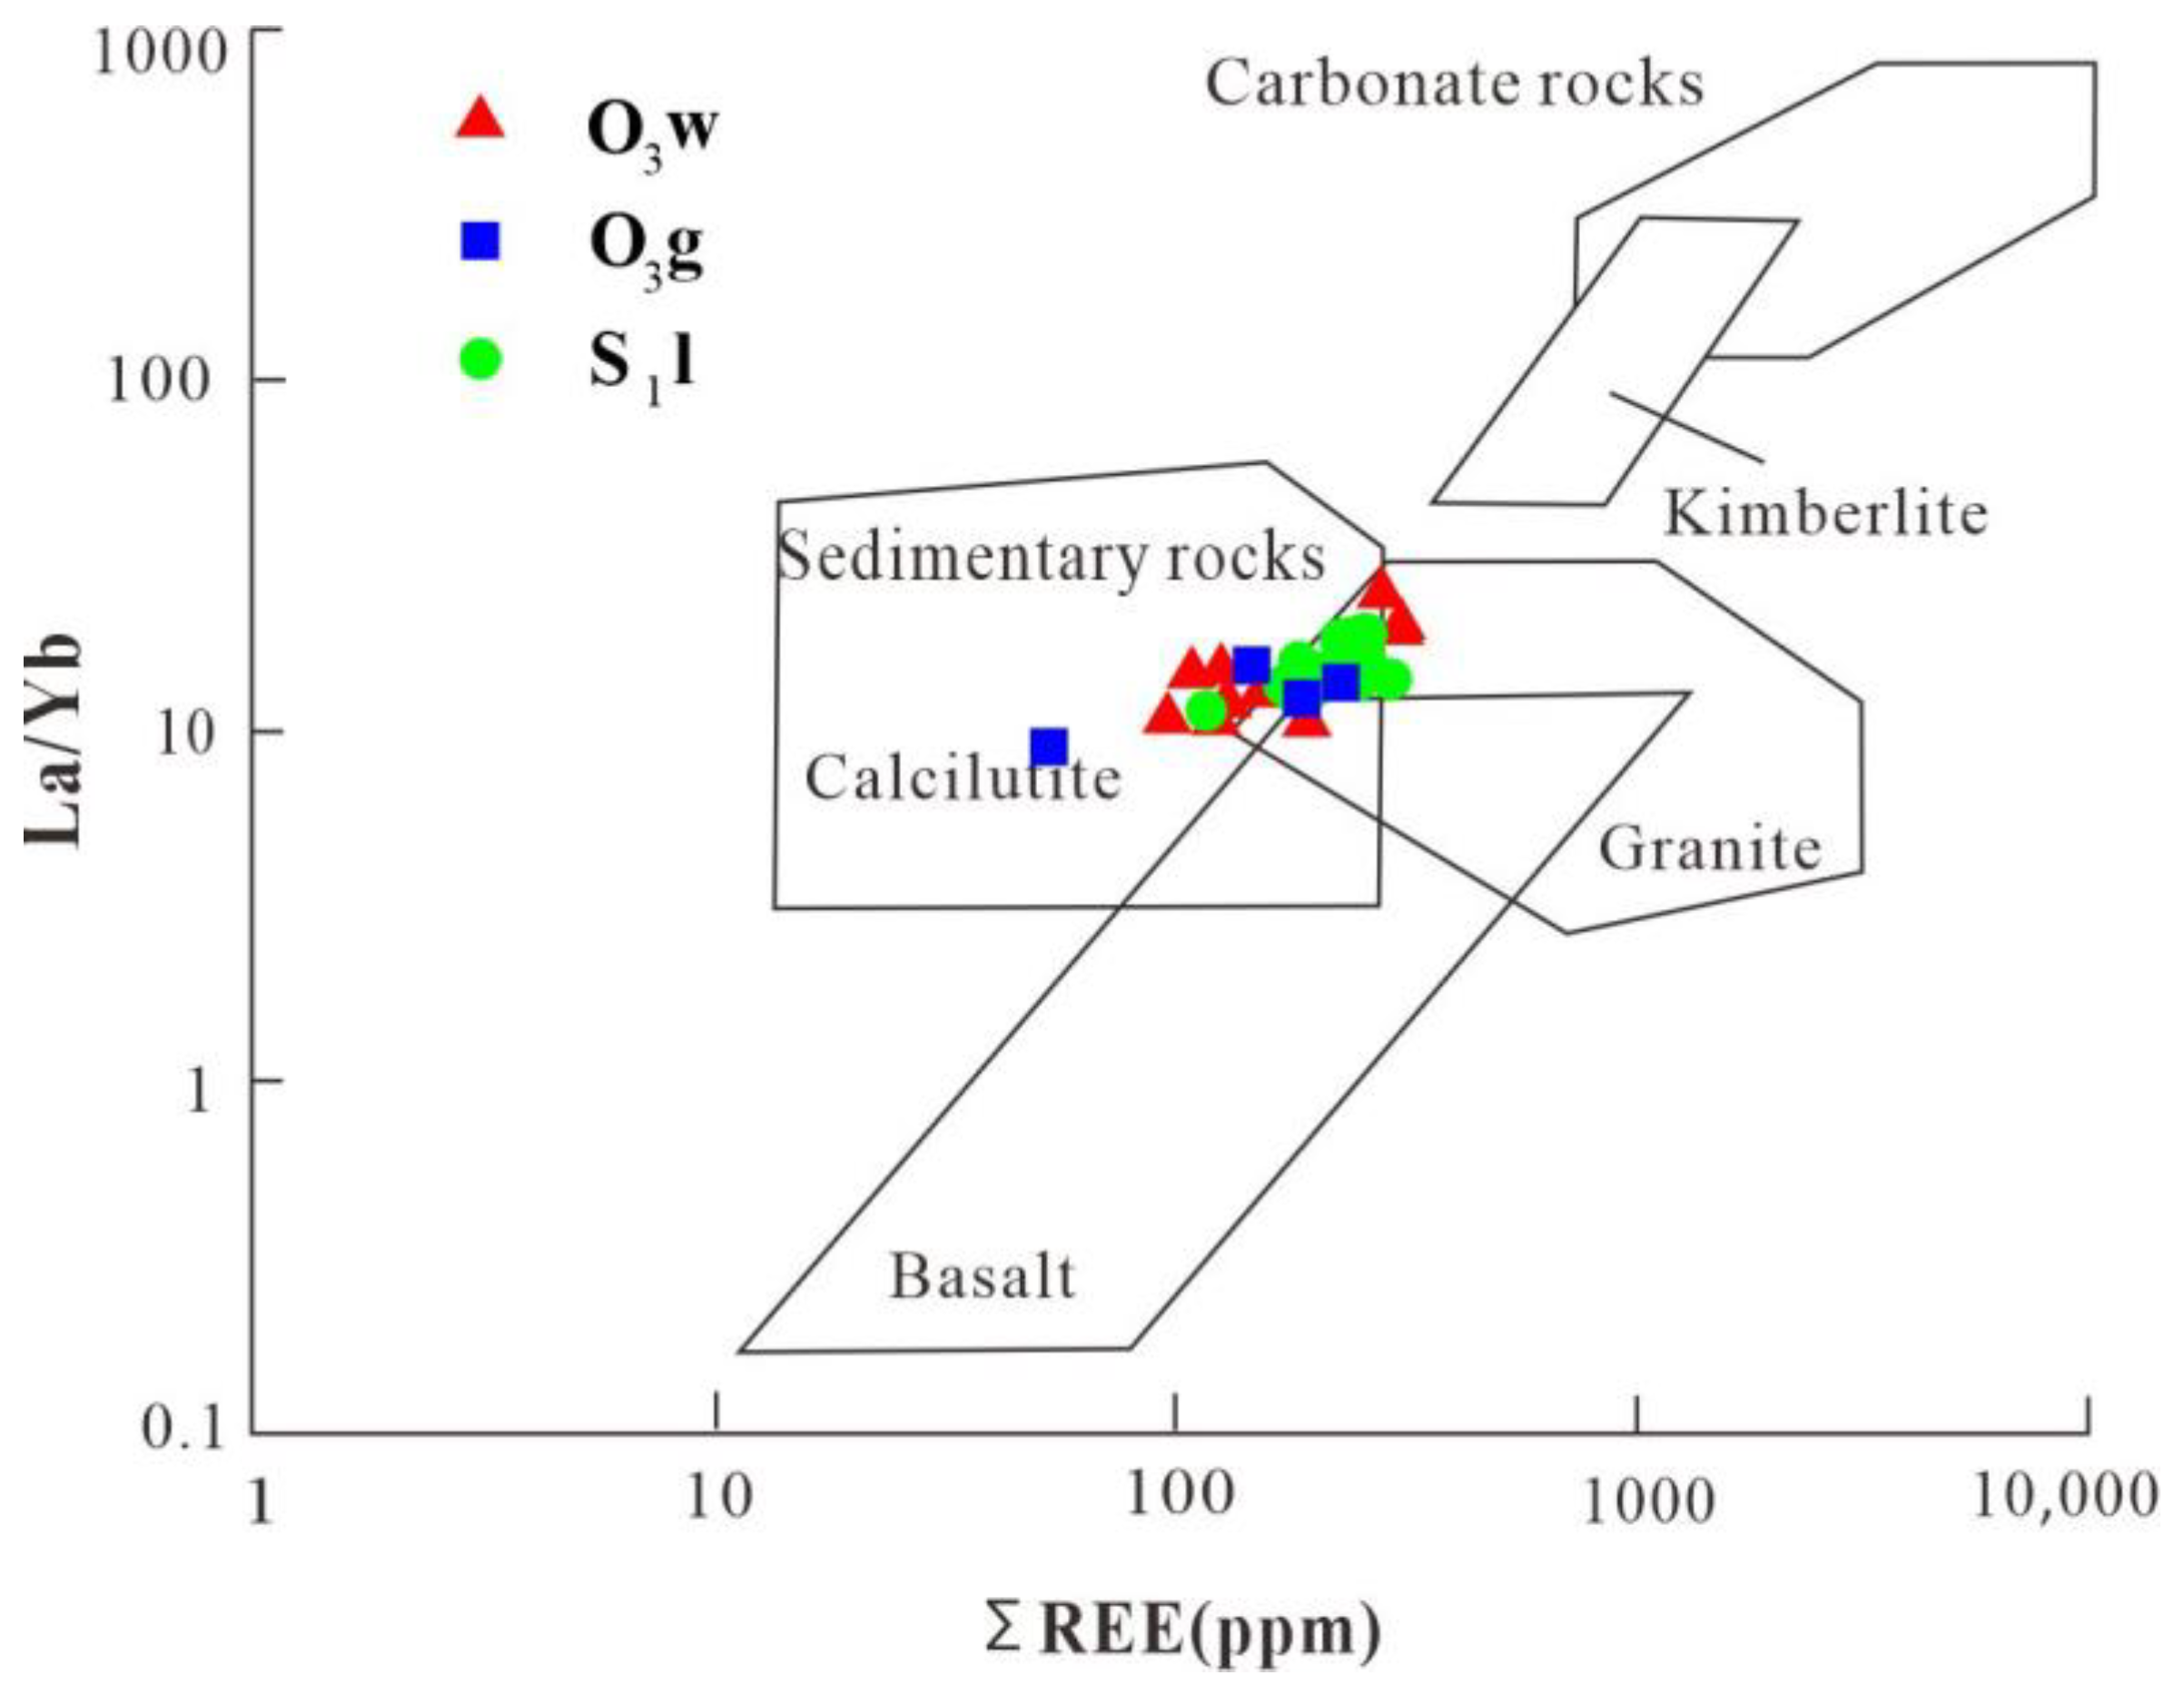
5.1.2. Type of Source Rock

Rare earth elements (REEs) are typically viewed as non-migratory. The concentration of REEs in sediments is primarily dictated by their availability in the parent rocks and the environmental conditions that lead to weathering in the source region. However, the processes of transport, sediment deposition, and diagenesis appear to exert minimal influence on the REE levels in sediments, and the distribution pattern of these elements remains relatively stable from the source to the sedimentary zone [31]. Therefore, REEs in sediments can accurately indicate the properties of source area rocks, and many scholars regard the characteristics of REEs in sandstone as effective markers for source discrimination [40]. Therefore, the REE characteristics are used to further judge the nature of the Upper Ordovician–Lower Silurian provenance in Southeastern Chongqing. The discrimination diagram of ΣREE-La/Yb source rocks reveals that most of the samples cluster predominantly within the overlapping zones characteristic of granite and granite–sedimentary rock compositions, with very few samples in the calcareous mudstone area (Figure 8). The source rocks of the Wufeng Formation and Longmaxi Formation in Southeastern Chongqing are basically the same and include mainly granites and ancient sedimentary rocks.
Based on the geochemical examinations of sandstone and mudstone samples from established tectonic settings, Taylor and Mclennan [31] and other scholars believe that trace and rare earth elements persist briefly in water and can still maintain their properties during weathering, leaching, transportation, and sedimentary diagenesis. Stabilities, especially elements like Th, La, Ce, Zr, and Sc, are characterized by non-migration and stronger stability and can retain information on the source of diagenetic materials well. Therefore, trace elements and the ratios of some trace elements, like La/Th, La/Sc, and Th/Sc, can be utilized as ideal objects for provenance discrimination [31]. The above characteristic element diagrams reveal that the samples from the Wufeng, Longmaxi, and Guanyinqiao Formation are dominated by felsic igneous rock sources (Figure 9a–d). The TiO2 and Ni diagrams also indicate that the provenance traits are dominated by felsic rocks. Additionally, the rare earth characteristics of all the samples include LREE enrichment, HREE loss, and distinct negative Eu anomalies (Figure 6), which further indicate the characteristics of their felsic material sources. However, the ΣREE-La/Yb and La/Th-Hf diagrams (Figure 8 and Figure 9c) also suggest that there is a certain recycled provenance input of ancient sedimentary rocks in the Longmaxi Formation.

5.2. Paleoenvironment
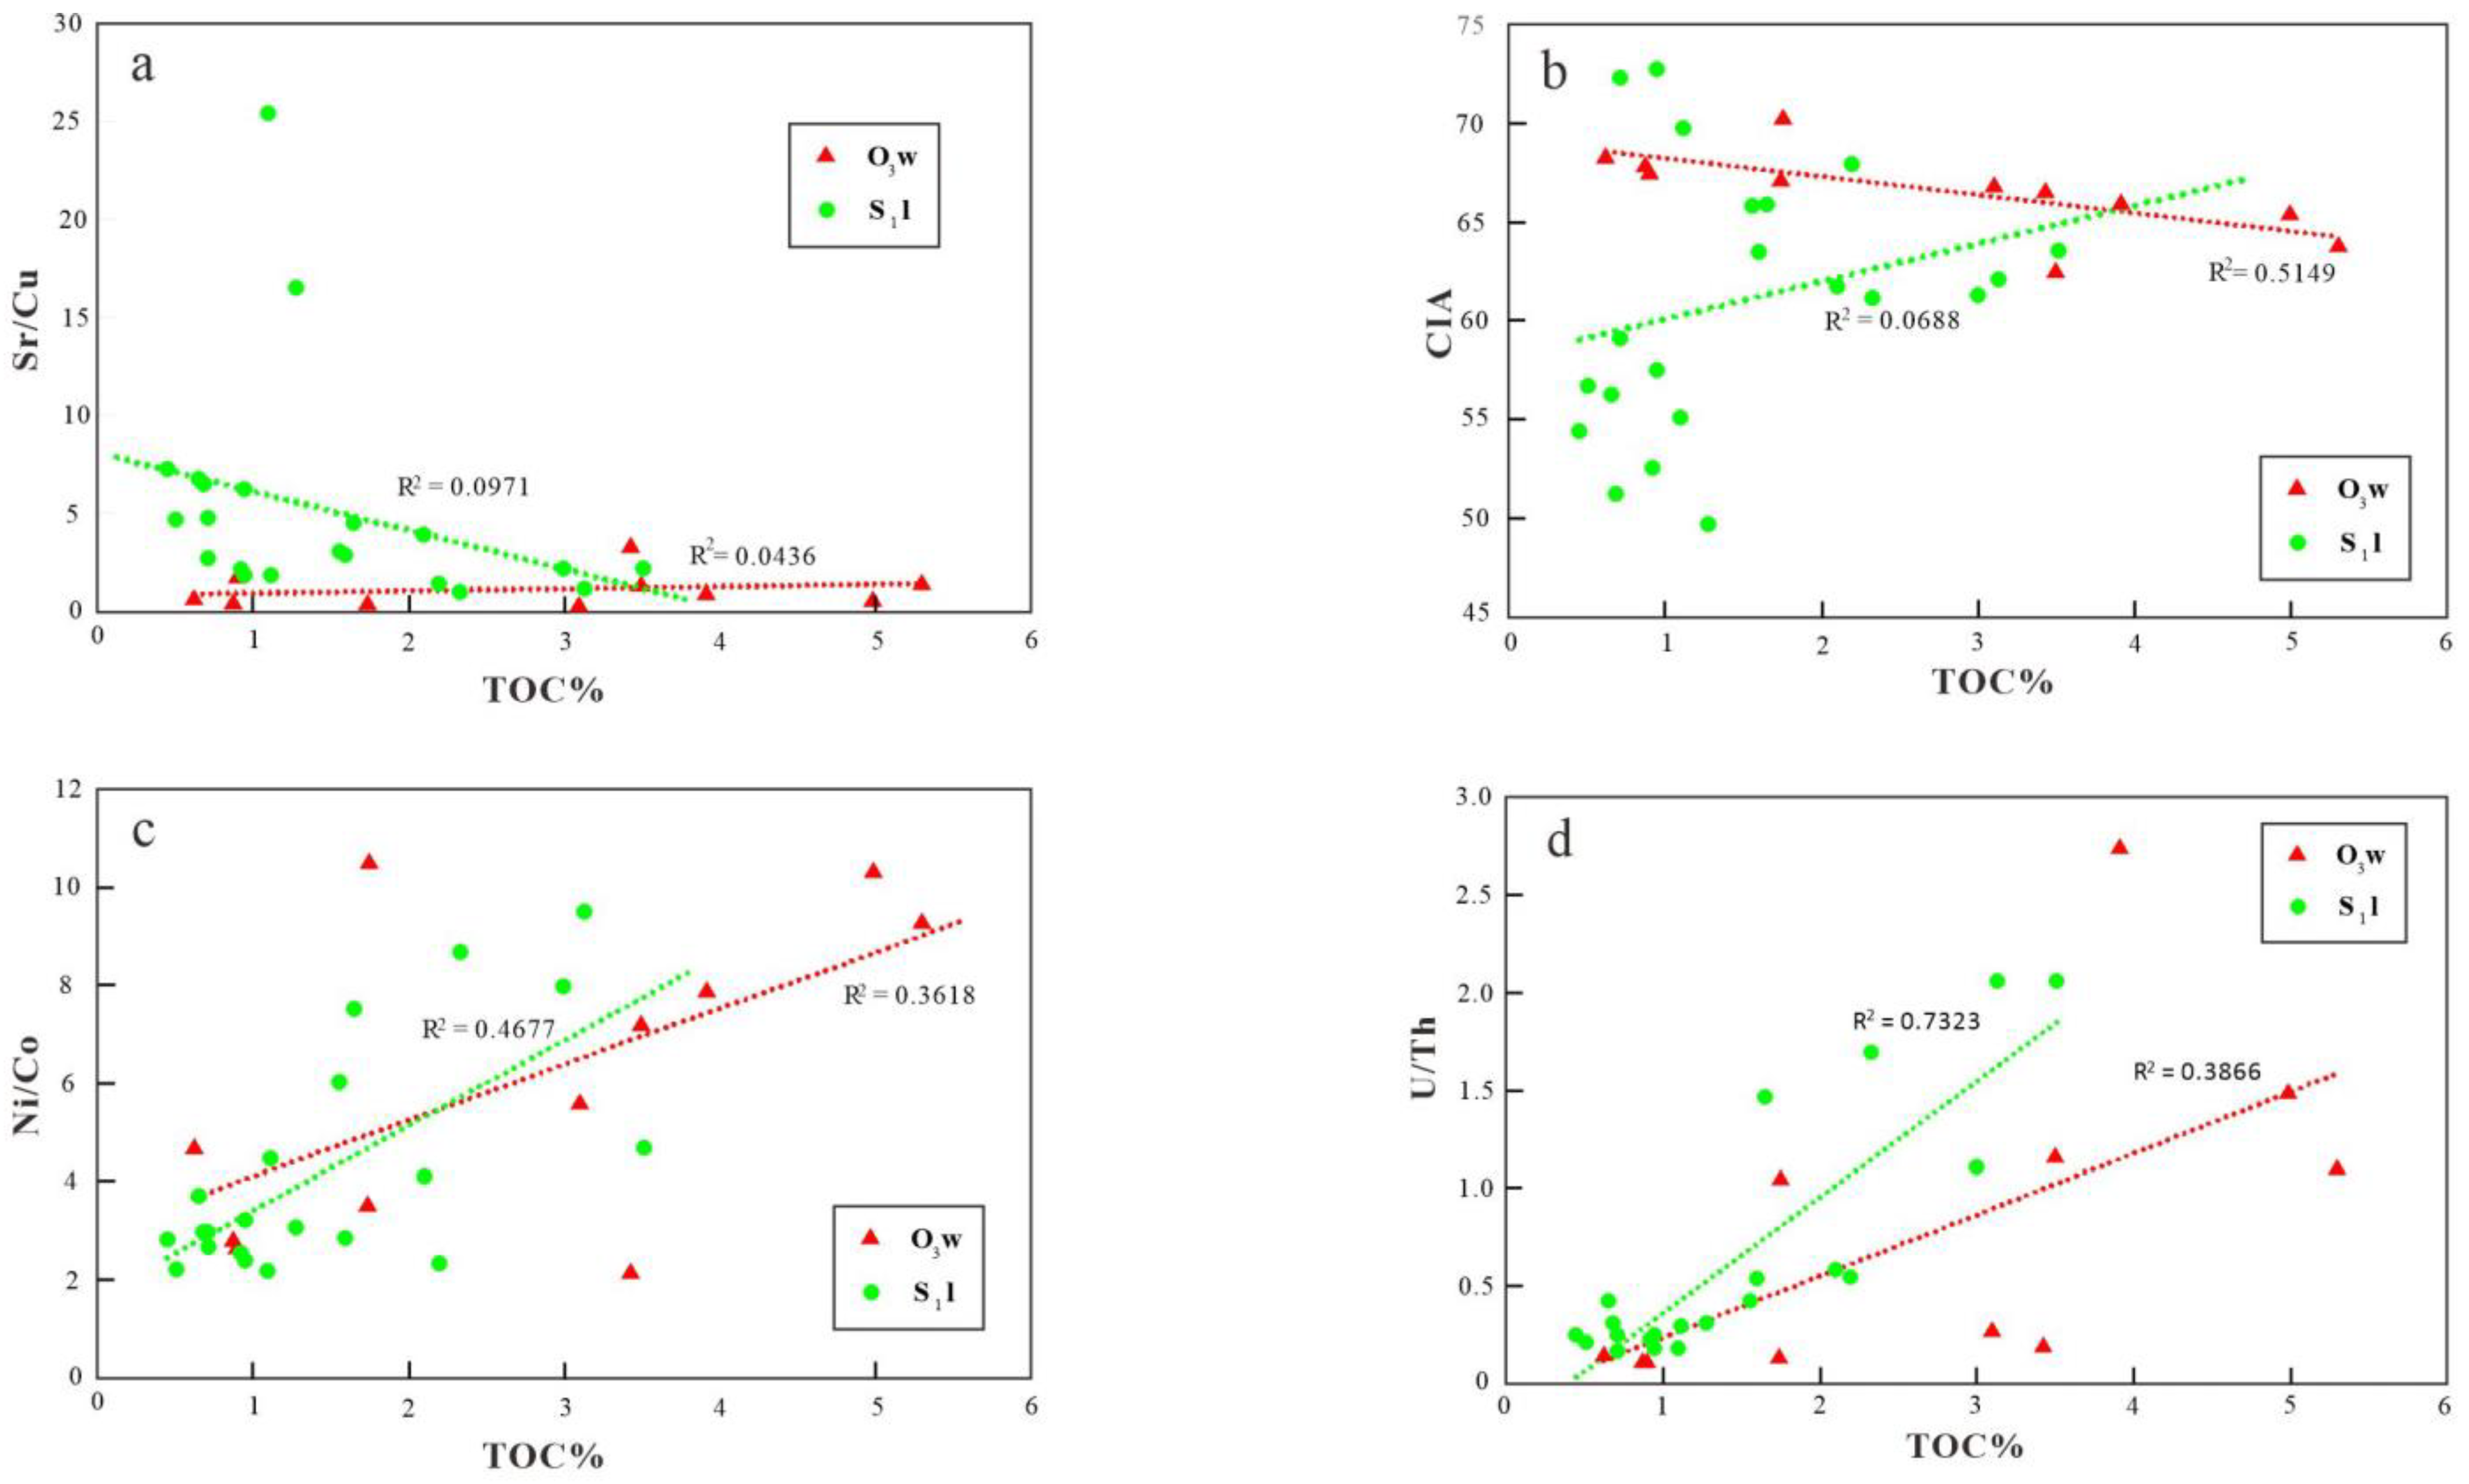
5.2.1. Paleoclimate

The Sr concentration and the ratio of Sr/Cu are extensively utilized to reveal paleoclimate, and many achievements have been made in this area [41]. Climate change has a greater impact on the element Sr. The low Sr content indicates a mild, humid environment in the research area, and the phenomenon of water concentration caused by the arid climate is often accompanied by high Sr content. A Sr/Cu ratio between 1.3 and 5.0 indicates a warm and humid climate, and a value greater than 5.0 indicates an arid climate [42]. In the samples used in this research, the average Sr content (ppm) of the Wufeng Formation samples was 62.8, the average Sr content (ppm) of the Guanyinqiao section samples was 342.0, and the average Sr content (ppm) of the Longmaxi Formation samples was 140.8. The Sr/Cu ratio of the Wufeng Formation is 1.19, the Sr/Cu ratio of the Guanyinqiao section is 18.20, and the Sr/Cu ratio of the Longmaxi Formation is 5.23. The climate change revealed is basically consistent with the results expressed by the changes in Sr, both of which reveal that the humid environment has changed into a semiarid environment and that the degree of drought in the Guanyinqiao section is the most severe (Figure 10).
Furthermore, the Chemical Index of Alteration (CIA) and select trace element features were employed to assess paleoclimatic conditions. In general, high CIA values indicate a relatively moist and warm paleoclimate, while low CIAs suggest a cooler and drier paleoclimate [38]. The A-CN-K ternary diagram (Figure 7) clearly shows that the CIA value of the Wufeng and Longmaxi Formation generally tends to weaken, which means that the climate is gradually becoming drier than the humid climate of the original Wufeng Formation. In addition, owing to the different occurrence conditions and migration conditions of Rb and Sr, the contents of these two elements are significantly linked to the extent of weathering. A high Rb/Sr suggests a warm and wet climate with intensely weathered; otherwise, the climate is dry and hot [37]. The values Rb/Sr of the Wufeng Formation (ranging from 0.84 to 4.52, mean of 2.28) are greater than those of the Guanyinqiao Formation (ranging from 0.14 to 1.13, mean of 0.39) and the Longmaxi Formation (ranging from 0.29 to 3.99, mean of 1.54), revealing the strong weathering and humid climatic conditions of the Wufeng Formation, which is roughly the same as the chemical weathering index (CIA).

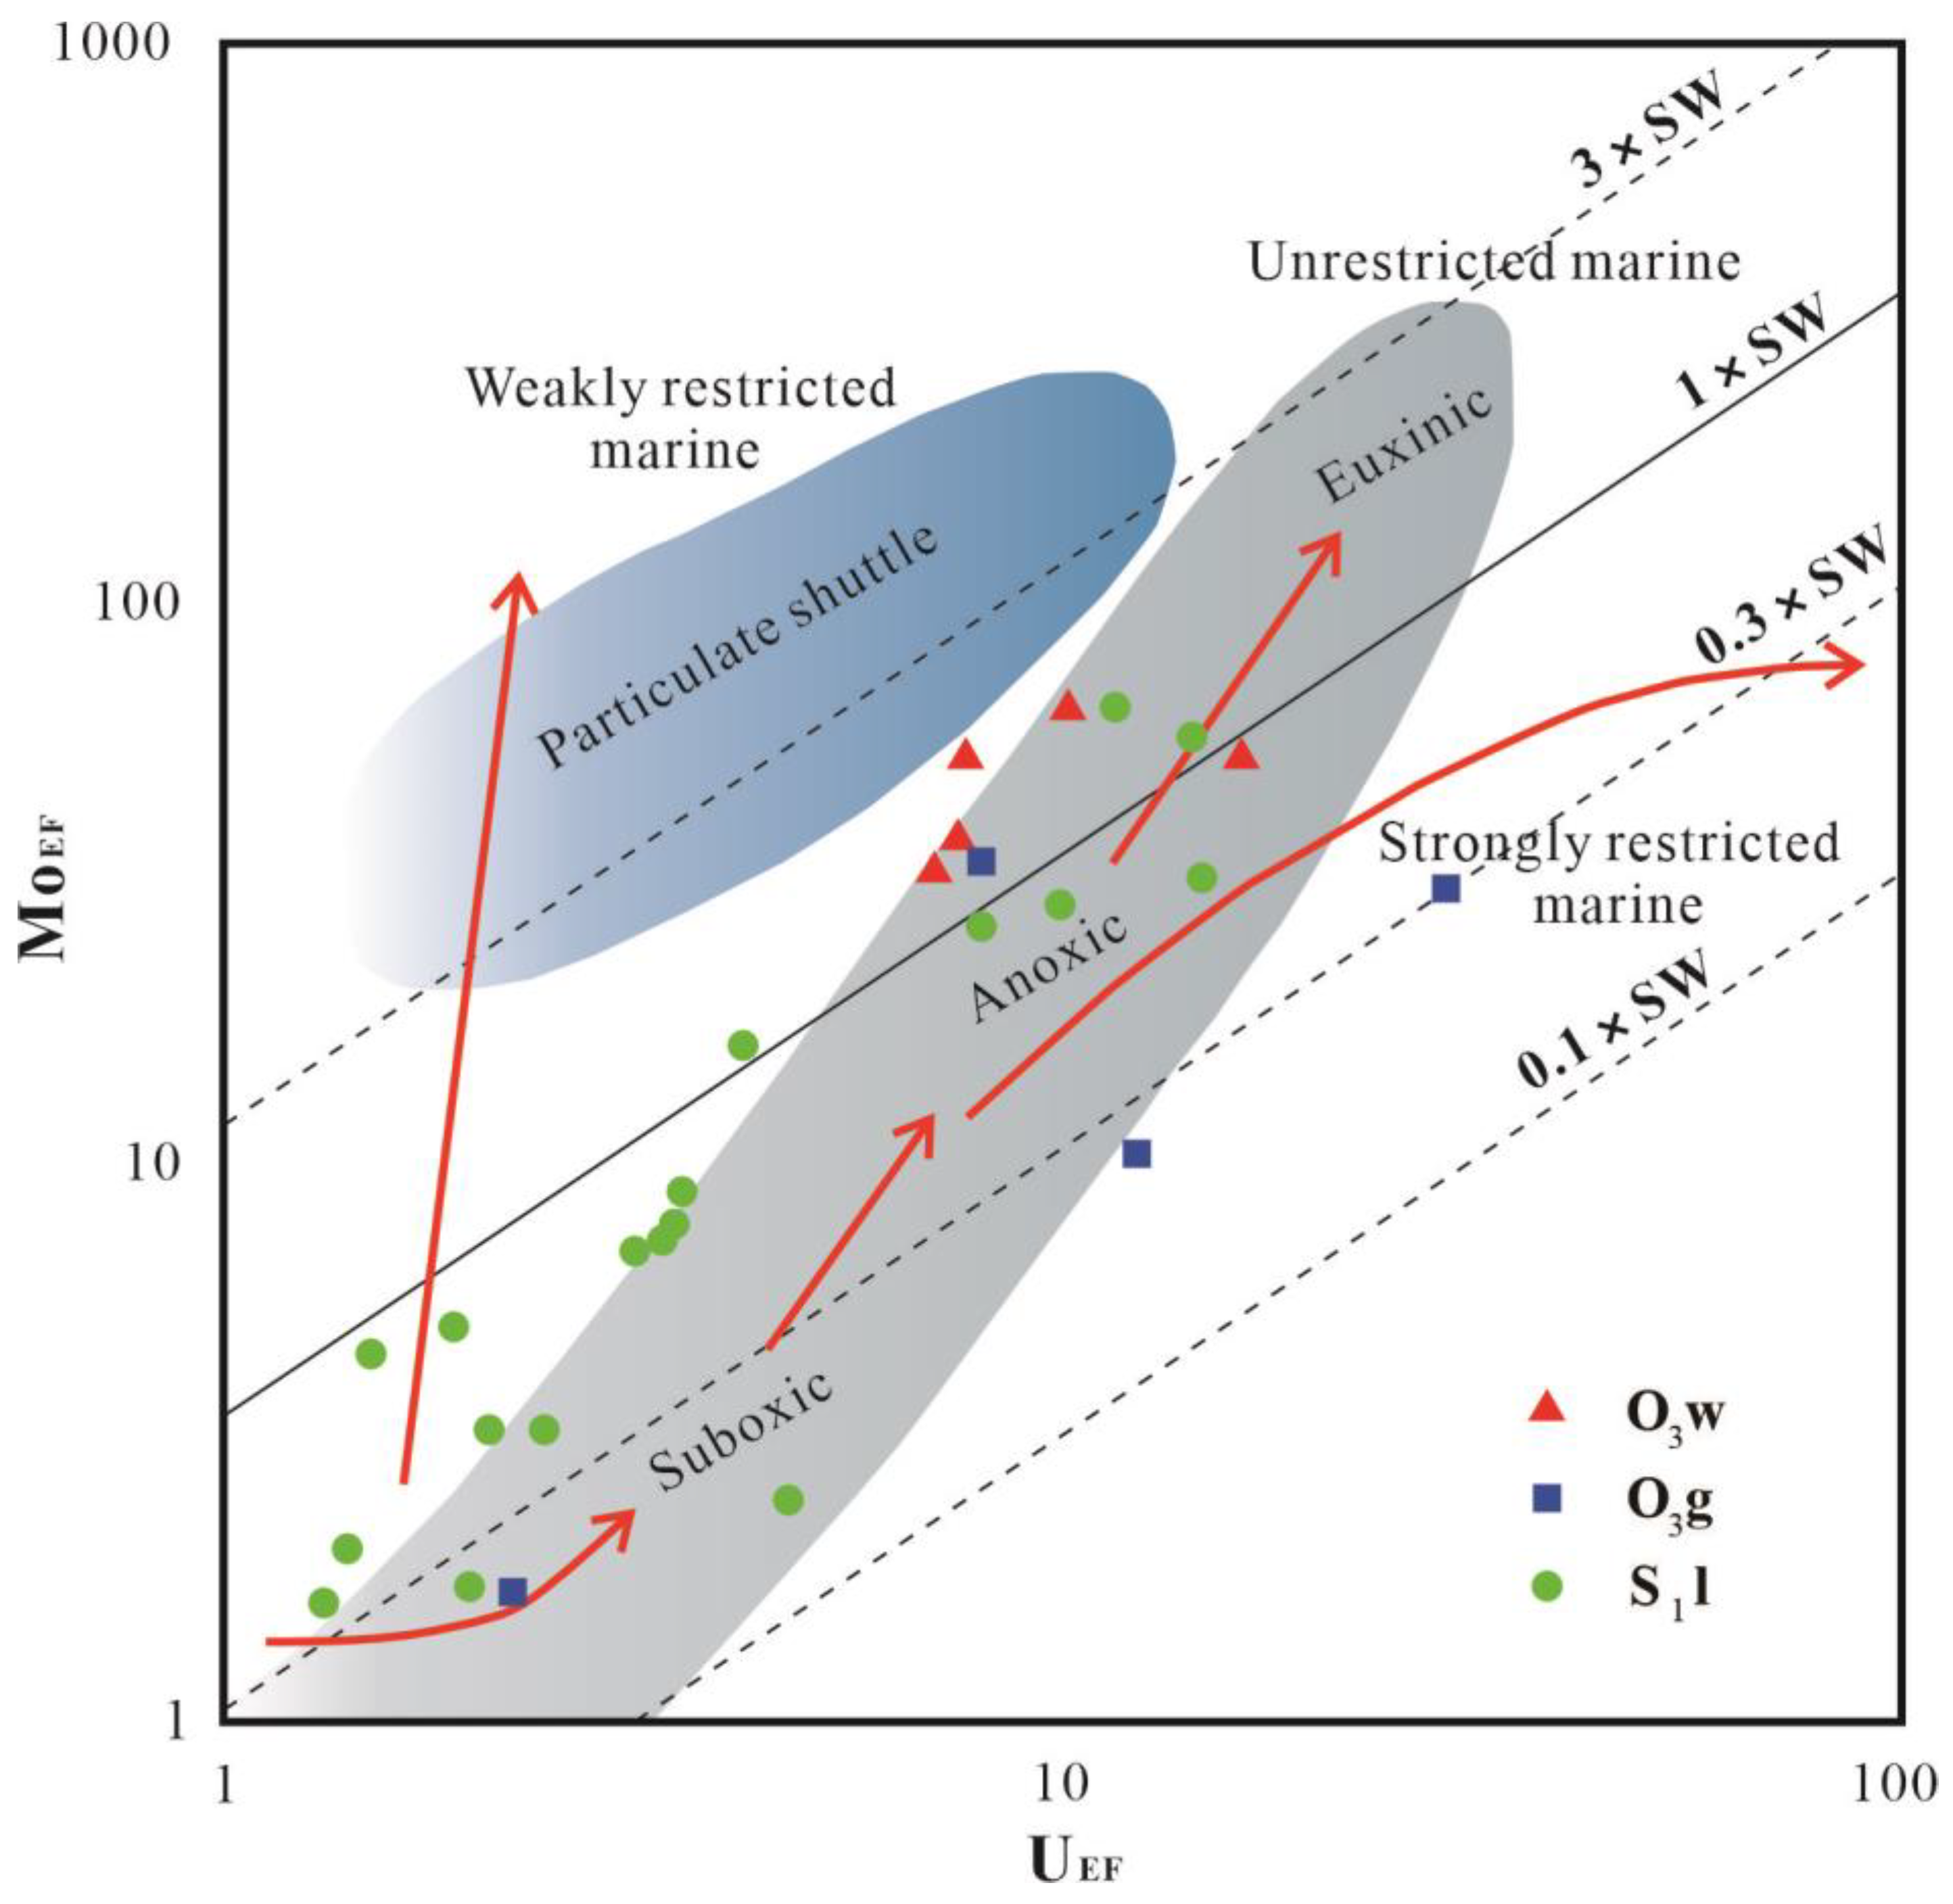
5.2.2. Paleo–Redox Conditions

During the diagenesis of sedimentary rocks, certain trace elements like U, V, and Ni tend to migrate around due to their own activity, and the enrichment level, such as U, V, and Ni, is significantly different under different redox conditions; however, some elements, such as inert elements, are often easily adsorbed in sediments because of their weak migration ability [43,44]. Therefore, ancient redox conditions can be restored using U, V, Ni, Th, and other elements [43]. Generally, V/Cr > 4.25 denotes an anaerobic environment, V/Cr > 2 denotes an environment poor in oxygen, and V/Cr < 2 denotes an oxygen-enriched environment [45]. A V/Ni ratio exceeding one signifies a reducing environment, whereas a ratio under one implies an oxidizing environment [46]. The ratio V/(V + Ni) serves to both distinguish the redox conditions and signify stratification. V/(V + Ni) values above 0.84 indicate strongly stratified anaerobic environments, 0.54–0.82 indicate moderately stratified anaerobic environments, and 0.46–0.60 signify mildly stratified oxygen-poor environments [43,44,47]. The Wufeng Formation in the research area has mean V/Cr, V/Ni, and V/(V + Ni) ratios of 3.59, 2.46, and 0.67, correspondingly. The mean of V/Cr, V/Ni, and V/(V + Ni) in the Guanyin bridge section are 3.86, 1.93, and 0.65, respectively. The mean values of V/Cr, V/Ni, and V/(V + Ni) in the Longmaxi Formation are 3.10, 2.74, and 0.71, respectively. The three ratios of the three groups of samples indicate a moderately stratified oxygen-poor reducing environment (Figure 10).
In addition, the ratios of trace elements such as Ni/Co and U/Th can also reflect ancient redox information. It is generally believed that Ni/Co < 5 and U/Th < 0.75 in an oxygen-enriched environment; ni/Co > 7 and U/Th > 1.25 reveal anaerobic reduction, while those between these values represent poor oxygen conditions [44]. An analysis of 36 samples reveals that the Wufeng Formation has an average Ni/Co ratio of 6.09, while the Guanyin Bridge displays a lower average of 5.24. In comparison, the Longmaxi Formation has an even lesser average Ni/Co value of 4.24. Regarding U/Th ratios, the Wufeng group shows a mean of 0.78, the Guanyin Bridge section stands at 1.60, and the Longmaxi group has a mean value of 0.64. Both datasets suggest the study area’s primary sedimentary setting is an oxygen-poor environment, but there are local fluctuations to oxygen-rich conditions (Figure 10).

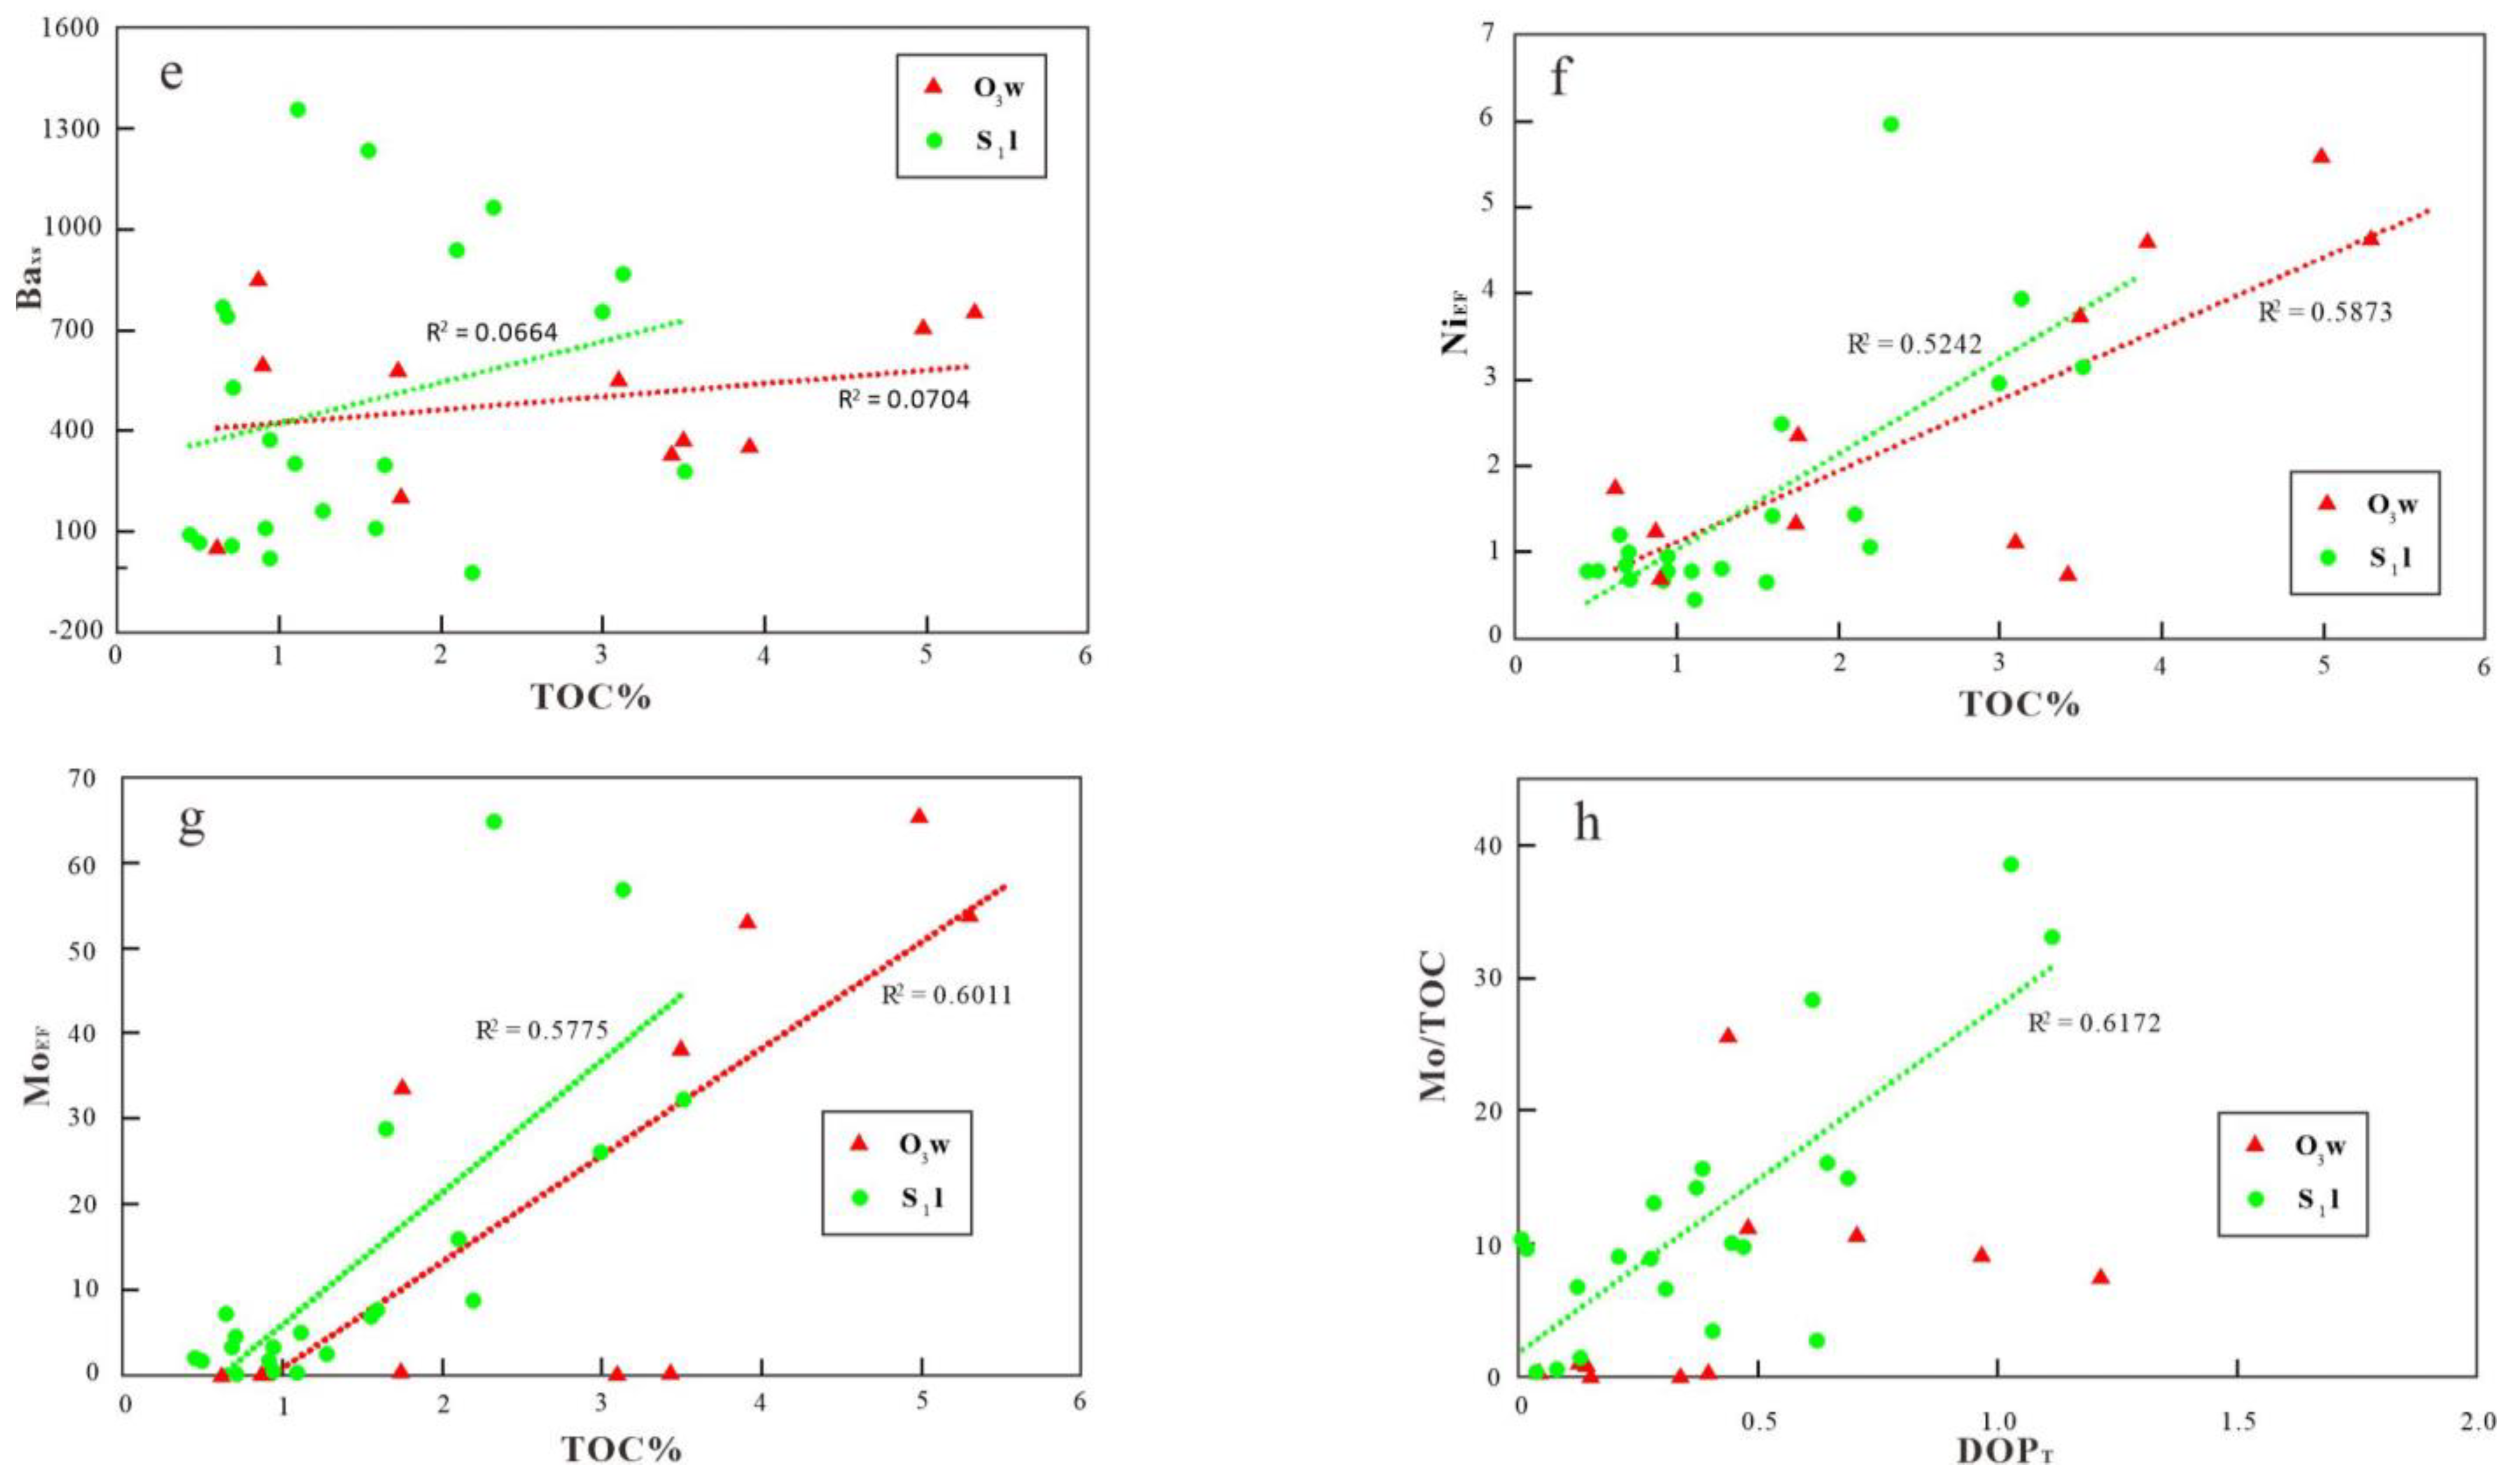
5.2.3. Ancient Productivity Level

The past research suggests that the accumulation of organic material is heavily influenced by two key biological factors: the productivity of surface water ecosystems and the biochemical degradation of organic matter by microorganisms [48,49]. The alteration in initial productivity is crucial for organic matter enrichment. Ba is a prominent indicator for assessing the productivity of ancient oceans [50]. The enrichment of Ba is related to biological deposition. High levels of SO42− ions are oxidized by H2S on decaying organic surfaces, which precipitates with Ba2+ in seawater and results in BaSO4 precipitation. The decomposition of organic matter requires significant oxygen consumption, leading to markedly reduction conditions; consequently, paleo-ocean productivity and TOC are positively connected with Ba content [51]. The formula for calculating Baxs is usually as follows:
Baxs = Basa − Alsa*(Ba/Al)paas
where Basa, Alsa represents the sample test value and Ba/Al represents the ratio of two elements in the post-Archean Australian shale, with a value of 0.0077 [52,53].
Baxs are generally considered to be highly productive in depositional environments when their concentration is 1000–5000 μg/g [54]. In Southeastern Chongqing, the Baxs values found in samples from the Wufeng and Longmaxi Formation varied from −20 to 1355 μg/g, with a mean of 308 μg/g, revealing a medium level of productivity. However, some studies have shown that sulfate ions in BaSO4 are easily reduced to hydrogen sulfide by sulfur-reducing bacteria in anoxic environments and that a significant quantity of BaSO4 is dissolved to decrease the amount of biogenic barium, resulting in a low Baxs value [55]. Therefore, for the Wufeng and Longmaxi Formations, whose main body is under anoxic conditions, the paleoproductivity level should be greater than that estimated from the Baxs values. Therefore, the Baxs value here does not uniquely limit the level of paleoproductivity but also uses other parameters as a reference. Some element enrichment indices are often used as effective indicators to determine the level of paleoproductivity. Here, the elemental enrichment factors (EFs) assess the level of elemental enrichment. When an element’s enrichment coefficient surpasses one, it is significantly enriched [56]. The formula is XEF = [(X/Al) sample/(X/Al) average shale], where X/Al represents the ratio of X element to Al element concentration, and the sample is normalized by average shale [57]. As important nutrients, Cu and Ni are indispensable elements in the process of biological life. They are often buried with organic matter and to some extent, can reflect organic matter input fluxes. Therefore, the extent of Cu and Ni enrichment correlates with productivity levels, where greater Cu enrichment suggests higher paleoproductivity [58,59]. The Cu enrichment factor (CuEF) of the samples ranged from 0.55 to 4.48, with a mean of 1.79. The Ni enrichment factor (NiEF) between 0.45 and 5.96, with a mean value of 2.06 (Figure 10). The mean values of CuEF and NiEF are greater than one, displaying that the Wufeng–Longmaxi Formation is at a medium-high paleoproductivity level. The vertical distribution map clearly shows that all the ancient productivity discriminant indices have similar variation rules. The discriminant indices of the Wufeng–Guanyinqiao Formation are substantially greater than the Longmaxi Formation’s, reflecting that the ancient productivity level is significantly lower in the Longmaxi Formation, which is basically fit for the change rule of the Baxs value (Figure 11).

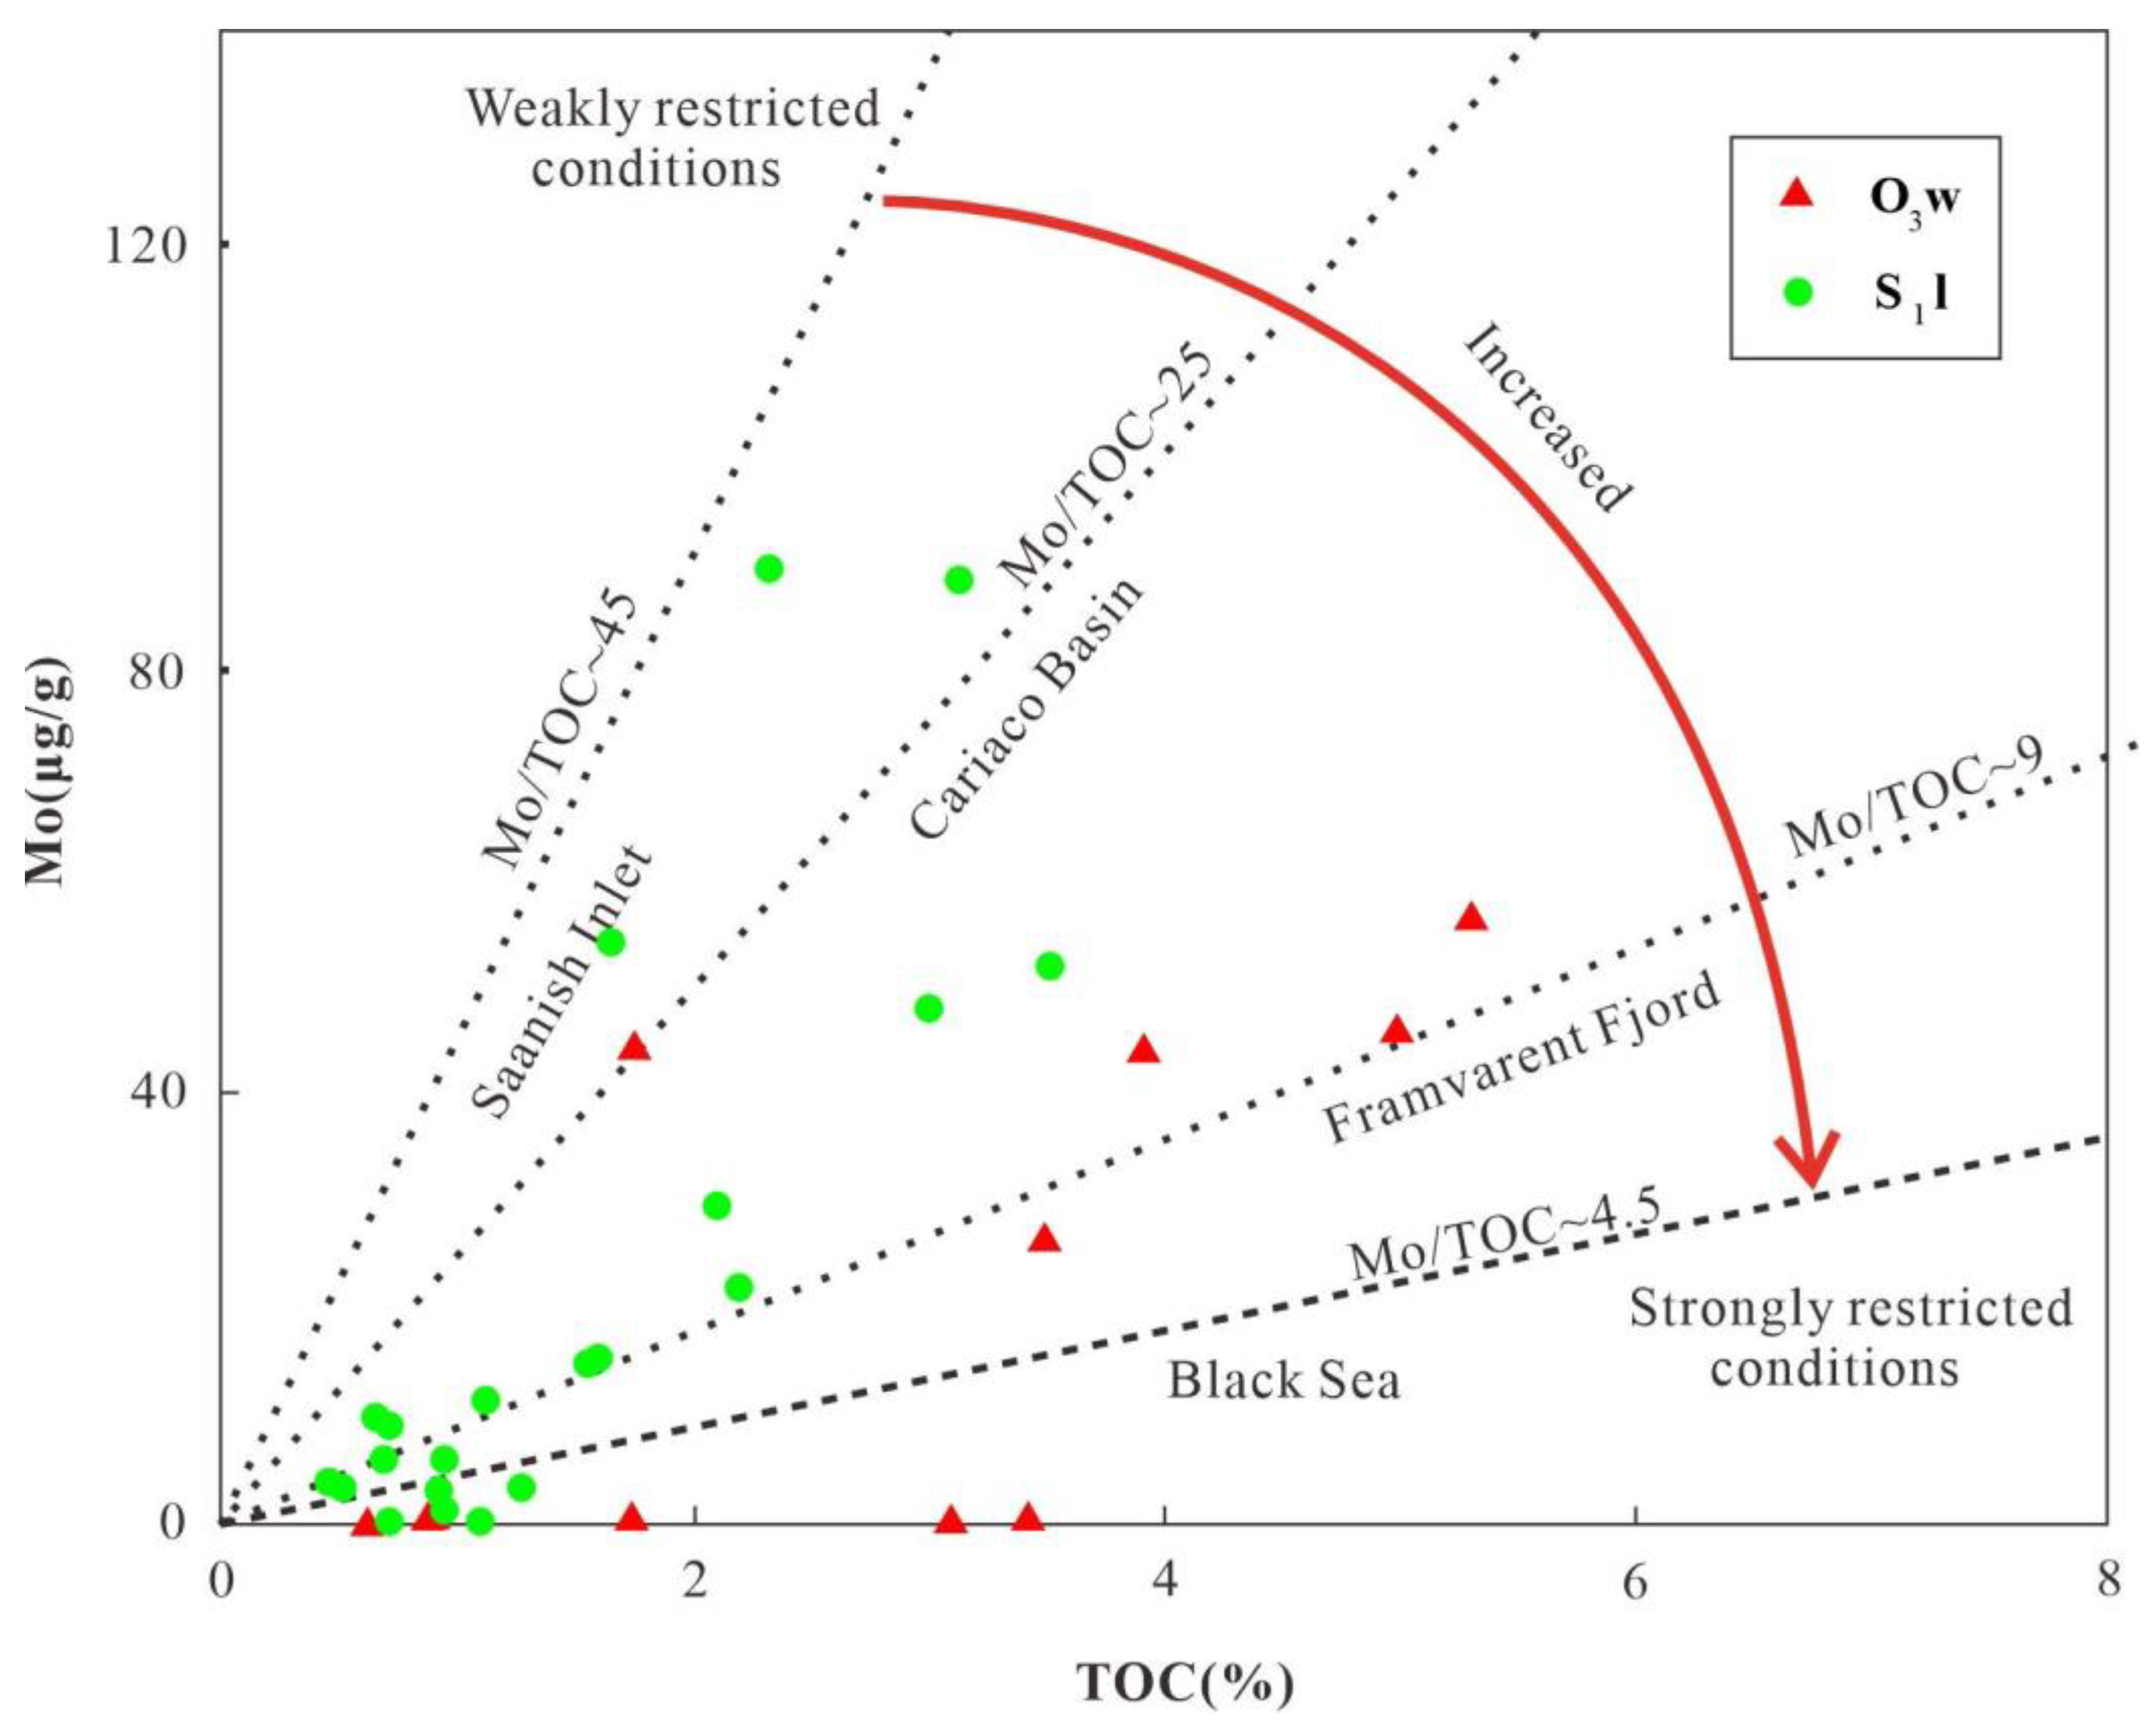
5.2.4. Water Retention Environment

In general, Mo under oxygen-containing conditions often exists in seawater with a relatively high concentration of molybdenum oxygen ions, whereas Mo is more readily enriched in sediments under anoxic conditions [60,61]. The paleoredox index revealed that the bulk of the Wufeng–Longmaxi Formation was in an anaerobic environment and that the Mo enrichment in the same anaerobic environment was less affected by redox conditions. Thus, the Mo levels in sediments are primarily influenced by the organic carbon content and the concentration of Mo in the sea. Studies have shown that if a basin is in a retention environment with poor circulation, the provision of Mo is slow, so the Mo/TOC ratio in the sediment decreases. In contrast, in relatively open waters, the Mo/TOC ratio increases [61]. The Mo/TOC variation range is large (0.20–38.51). The Mo-TOC correlation diagram reveals that the Wufeng Formation–Longmaxi Formation was in a semi-retained–retained water environment. In addition, the same conclusion is also reflected in the covariant pattern diagram of the enrichment coefficients UEF and MoEF (Figure 12).

5.3. Enrichment Mechanism of Organic Matter

Generally, organic matter accumulates more readily in anoxic and reducing environments due to its slower decomposition rate under such conditions, and the biological community does not have time to decompose and then deposit as organic matter. Moreover, factors, such as the extent of water retention, paleoproductivity, and paleoclimate all affect organic enrichment. The TOC index is regularly used to evaluate the abundance of organic matter [15]. The TOC content in the vertical direction of the four sections was observed. The TOC content ranged from 0.45% to 5.30%. The TOC content of the Wufeng Formation is between 0.87% and 5.30%, with an average of 2.73%. The percentage of the Longmaxi Formation was 0.45%–3.13%, with an average of 1.48%, which was lower than that of the Wufeng Formation. In a single section, the TOC content shows a rising trend starting at the bottom of the Wufeng Formation, reaching its apex in the upper layers before experiencing a decline in the subsequent Longmaxi Formation. Overall, the TOC content initially rises before falling, with a single peak distribution.
To further explore the influences of organic matter enrichment, the paleoclimate index, paleoredox index, paleoproductivity index, and retention environment index were fitted with the TOC value, and a correlation diagram between the corresponding index and TOC was obtained. A higher R2 value indicates a stronger correlation (Figure 13). The water retention environmental indicators and the redox indicators Ni/Co and U/Th have comparatively high R2 values, indicating a good correlation, whereas the paleoclimate and paleoproductivity indicators are relatively poorly correlated with the TOC. However, whether the organic enrichment in the Wufeng–Longmaxi Formation in Southeastern Chongqing is affected by redox conditions or water retention is still a problem. Therefore, further exploration of the reasons for the enrichment of organic material is necessary. Prior research demonstrated that the Mo/TOC-DOPT diagram can be used to analyze which redox and water retention processes play a leading role in element enrichment [63]. The degree of pyrite mineralization (DOPT) was calculated according to the following formula [64]:
DOPT = w(S) × (55.85/64.16)/w(Fe).
In general, the lower the DOPT is, the greater the water body’s oxygen concentration. When the DOPT experiences changes while the Mo/TOC ratio is basically unchanged, the element enrichment is controlled mainly by the retention conditions of the water body. According to Figure 13h, the Wufeng Formation is affected mainly by the degree of retention, whereas the Longmaxi Formation’s Mo/TOC ratio is significantly positively correlated with DOPT and is strongly affected by redox reactions. Combined with prior research on diverse indicators, the primary causes of organic shale gathering in the Wufeng–Longmaxi Formations are distinctly varied. The Wufeng Formation experienced significant organic matter accumulation under anaerobic conditions owing to the robust retention environment of the water body. The relevancy between the redox degree of the Longmaxi Formation and TOC further proves that as the retention degree of the Longmaxi Formation water body weakens the control degree of organic material enrichment, the redox environment steadily governs the persistent accumulation of organic material throughout this phase.

6. Conclusions

The present study conducted comprehensive mineralogical and geochemical investigations on the Upper Ordovician–Lower Silurian strata (Wufeng, Guanyinqiao, Longmaxi formations) in the southeastern region of Chongqing. The findings revealed the following:
(1)
Geochemical indicators revealed a weak degree of weathering and negligible sedimentary recycling. The provenance of the Wufeng–Longmaxi Formations primarily consisted of felsic acidic rocks, with minor contributions from ancient sedimentary rocks.
(2)
A suite of paleoclimate proxies, including Sr, Sr/Cu, and CIA, clarified the transition from a moist to a dry climate in the Wufeng–Longmaxi phase. Moreover, the geochemical characteristics imply that the deposition of the Wufeng–Longmaxi Formations occurred in an oxygen-deprived paleoenvironment with moderate–high ancient productivity and a moderately–strongly restricted setting.
(3)
The organic enrichment mechanism of the Wufeng–Longmaxi Formation is different. In the case of the Wufeng Formation, the accumulation of organic matter is attributed primarily to strongly restricted conditions, resulting in significant anoxic environments. Furthermore, the correlation between paleoredox conditions and TOC further reinforces the idea that these conditions are the crucial factor influencing the organic accumulation in the Longmaxi Formation.

Author Contributions

Conceptualization and methodology, C.F.; investigation, data curation, and writing—original draft preparation: C.F.; date processing: Z.F. and C.X.; writing—review and editing: C.F., X.Z. and Y.D.; supervision and funding acquisition: Y.D. All authors have read and agreed to the published version of the manuscript.

Funding

The authors thank the National Natural Science Foundation of China (No. 42102224; No. 42372188; No. 41902168), the Young Elite Scientists Sponsorship Program by CAST (2023QNRC001), the Natural Science Foundation of Shaanxi Provincial Department of Education (20JK0761), and the Natural Science Basic Research Program of Shaanxi (2021JQ-560).

Data Availability Statement

Data will be made available on request.

Acknowledgments

The authors thank Xi’an University of Science & Technology and Northwest University for providing access to their facilities for material characterization.

Conflicts of Interest

The authors declare no conflicts of interest.

References

  1. Feng, Z.Q.; Hao, F.; Tian, J.Q.; Zhou, S.W.; Dong, D.Z. Shale gas geochemistry in the Sichuan Basin, China. Earth Sci. Rev. 2022, 232, 104141. [Google Scholar] [CrossRef]
  2. Curtis, J. Fractured shale gas system. AAPG Bull. 2002, 86, 1921–1938. [Google Scholar]
  3. Zou, C.N.; Dong, D.Z.; Wang, Y.M.; Li, X.J.; Huang, J.L.; Wang, S.F.; Guan, Q.Z.; Zhang, C.C.; Wang, H.Y.; Liu, H.L.; et al. Shale gas in China: Characteristics, challenges and prospects (II). Pet. Explor. Dev. 2016, 43, 166–178. [Google Scholar] [CrossRef]
  4. Zou, C.N.; Zhu, R.K.; Chen, Z.Q.; James, O.; Tao, S.Z.; Dong, D.Z.; Qiu, Z.; Wang, Y.M.; Wang, L.; Lu, S.H.; et al. Organic-matter-rich shales of China. Earth Sci. Rev. 2019, 189, 51–78. [Google Scholar] [CrossRef]
  5. Milkov, A.V. New approaches to distinguish shale-sourced and coal-sourced gases in petroleum systems. Org. Geochem. 2021, 158, 104271. [Google Scholar] [CrossRef]
  6. Fu, C.Q.; Du, Y.; Song, W.L.; Sang, S.X.; Pan, Z.J.; Wang, N. Application of automated mineralogy in petroleum geology and development and CO2 sequestration: A review. Mar. Pet. Geol. 2023, 151, 106206. [Google Scholar] [CrossRef]
  7. Gordon, D.; Sautin, Y.; Tao, W. China’s Oil Future; Carnegie Energy and Climate Program; Carnegie Endowment for International Peace: Washington, DC, USA, 2014; p. 11. Available online: https://carnegieendowment.org/research/2014/05/chinas-oil-future?lang=en (accessed on 11 February 2025).
  8. Lazar, R.; Bohacs, K.M.; Schieber, J.; Macquaker, J.; Demko, T. Mudstone Primer: Lithofacies Variations, Diagnostic Criteria, and Sedimentologic/Stratigraphic Implications at Lamina to Bedset Scales. SEPM Concepts Sedimentol. Paleontol. 2015, 12, 1–128. [Google Scholar]
  9. Zou, C.N.; Dong, D.Z.; Wang, Y.M.; Li, X.J.; Huang, J.L.; Wang, S.F.; Guan, Q.Z.; Zhang, C.C.; Wang, H.Y.; Liu, H.L.; et al. Shale gas in China: Characteristics, challenges and prospects (I). Petrol. Explor. Dev. 2015, 42, 689–701. [Google Scholar] [CrossRef]
  10. Dai, J.; Zou, C.; Dong, D.; Ni, Y.; Wu, W.; Gong, D.; Wang, Y.; Huang, S.; Huang, J.; Fang, C.; et al. Geochemical characteristics of marine and terrestrial shale gas in China. Mar. Pet. Geol. 2016, 76, 44–463. [Google Scholar] [CrossRef]
  11. Liu, Q.Y.; Jin, Z.J.; Wang, X.F.; Yi, J.Z.; Meng, Q.Q.; Wu, X.Q.; Gao, B.; Nie, H.K.; Zhu, D.Y. Distinguishing kerogen and oil cracked shale gas using H, C-isotopic fractionation of alkane gases. Mar. Pet. Geol. 2018, 91, 350–362. [Google Scholar] [CrossRef]
  12. Liu, Q.Y.; Wu, X.Q.; Wang, X.F.; Jin, Z.J.; Zhu, D.Y.; Meng, Q.Q.; Huang, S.P.; Fu, Q. Carbon and hydrogen isotopes of methane, ethane, and propane: A review of genetic identification of natural gas. Earth Sci. Rev. 2019, 190, 247–272. [Google Scholar] [CrossRef]
  13. Xu, L.L.; Huang, S.P.; Wang, Y.; Zhou, X.H.; Liu, Z.X.; Wen, Y.R.; Zhang, Y.L.; Sun, M.D. Palaeoenvironment evolution and organic matter enrichment mechanisms of the Wufeng-Longmaxi shales of Yuanan block in western Hubei, middle Yangtze: Implications for shale gas accumulation potential. Mar. Pet. Geol. 2023, 152, 106242. [Google Scholar] [CrossRef]
  14. Wu, B. The Sedimentary Geochemical Characteristics and Geological Significance of the Wufeng-Longmaxi Formation Accumulation of Organic Matter Black Shale on the Southeastern Sichuan Basin, China. Geofluids 2022, 2022, 1900158. [Google Scholar] [CrossRef]
  15. Li, J.; Li, H.; Yang, C.; Wu, Y.; Gao, Z.; Jiang, S. Geological characteristics and controlling factors of deep shale gas enrichment of the Wufeng-Longmaxi Formation in the southern Sichuan Basin, China. Lithosphere 2022, 22, 4737801. [Google Scholar] [CrossRef]
  16. Li, S.Z.; Zhou, Z.; Nie, H.K.; Liu, M.; Meng, F.Y.; Shen, B.; Zhang, X.T.; Wei, S.Y.; Xi, Z.D.; Zhang, S.S. Organic matter accumulation mechanisms in the Wufeng-Longmaxi shales in western Hubei Province, China and paleogeographic implications for the uplift of the Hunan-Hubei Submarine high. Int. J. Coal Geol. 2023, 270, 104223. [Google Scholar] [CrossRef]
  17. Shi, Z.S.; Zhao, S.X.; Zhuo, T.Q.; Ding, L.H.; Sun, S.S.; Cheng, F. Mineralogy and Geochemistry of the Upper Ordovician andLower Silurian Wufeng-Longmaxi Shale on the Yangtze Platform, South China: Implications for Provenance Analysis and Shale Gas Sweet-Spot Interval. Minerals 2022, 12, 1190. [Google Scholar] [CrossRef]
  18. Chen, C.; Wu, Z.H.; Zhao, W.Y.; Wang, L.; Ji, C.J.; Zhao, Z.; Zhang, H.; Gong, Z. Formation environment and organic matter enrichment mechanism of high-quality source rocks in the Buqu Formation in the Shenglihe area, northern Qiangtang basin. Acta Geol. Sin-Engl. 2024, 98, 530–543, (In Chinese with English Abstract). [Google Scholar]
  19. Xiao, B.; Xiong, L.; Zhao, Z.; Fu, X. Sedimentary tectonic pattern of Wufeng and Longmaxi Formations in the northern margin of Sichuan Basin, South China. Int. Geol. Rev. 2022, 64, 2166–2185. [Google Scholar] [CrossRef]
  20. Chen, L.; Jiang, S.; Chen, P.; Chen, X.H.; Zhang, B.M.; Zhang, G.T.; Lin, W.B.; Lu, Y.C. Relative Sea-level changes and organic matter enrichment in the Upper Ordovician-lower Silurian Wufeng-Longmaxi Formations in the Central Yangtze area. China. Mar. Petrol. Geol. 2021, 124, 104809. [Google Scholar] [CrossRef]
  21. Dong, T.; He, S.; Chen, M.F.; Hou, Y.G.; Guo, X.W.; Wei, C.; Han, Y.J.; Yang, R. Quartz types and origins in the paleozoic Wufeng-Longmaxi Formations, Eastern Sichuan Basin, China: Implications for porosity preservation in shale reservoirs. Mar. Pet. Geol. 2019, 106, 62–73. [Google Scholar] [CrossRef]
  22. Wang, H.Y.; Shi, Z.S.; Sun, S.S. Biostratigraphy and reservoir characteristics of the Ordovician Wufeng Formation—Silurian Longmaxi Formation shale in the Sichuan Basin and its surrounding areas, China. Pet. Explor. Dev. 2021, 48, 1019–1032. [Google Scholar] [CrossRef]
  23. Xiao, B.; Liu, S.G.; Li, Z.W.; Ran, B.; Ye, Y.H.; Yang, D.; Li, J.X. Geochemical characteristics of marine shale in the Wufeng Formation–Longmaxi Formation in the northern Sichuan Basin, South China and its implications for depositional controls on organic matter. J. Pet. Sci. Eng. 2021, 203, 108618. [Google Scholar] [CrossRef]
  24. Wei, C.; Dong, T.; He, Z.L.; He, S.; He, Q.; Yang, R.; Guo, X.W.; Hou, Y.G. Major, trace-elemental and sedimentological characterization of the upper Ordovician Wufeng-lower Silurian Longmaxi formations, Sichuan Basin, South China: Insights into the effect of relative sea-level fluctuations on organic matter accumulation in shales. Mar. Pet. Geol. 2021, 126, 104905. [Google Scholar] [CrossRef]
  25. Zan, B.; Mou, C.; Lash, G.G.; Ge, X.; Wang, X.; Wang, Q.; Yan, J.; Chen, F.; Jin, B. An integrated study of the petrographic and geochemical characteristics of organic rich deposits of the Wufeng and Longmaxi formations, western Hubei Province, South China: Insights into the co-evolution of paleoenvironment and organic matter accumulation. Mar. Pet. Geol. 2021, 132, 105193. [Google Scholar] [CrossRef]
  26. Shang, F.; Zhu, Y.; Hu, Q.; Wang, Y.; Li, Y.; Li, W.; Liu, R.; Gao, H. Factors controlling organic-matter accumulation in the Upper Ordovician-Lower Silurian organic-rich shale on the northeast margin of the Upper Yangtze platform: Evidence from petrographic and geochemical proxies. Mar. Pet. Geol. 2020, 121, 104597. [Google Scholar] [CrossRef]
  27. Xu, L.; Huang, S.; Sun, M.; Wen, Y.; Chen, W.; Zhang, Y.; Luo, F.; Zhang, H. Palaeoenvironmental Evolution Based on Elemental Geochemistry of the Wufeng-Longmaxi Shales in Western Hubei, Middle Yangtze, China. Minerals 2023, 13, 502. [Google Scholar] [CrossRef]
  28. DZG 93; Geology Mineral Industry Standard of China: Rock and Mineral Analysis. Shaanxi Science and Technology Press: Shanxi, China, 1993. (In Chinese)
  29. DZ/T 0223-2001; Geology Mineral Industry Standard of China: The General Analysis Rules for Inductively Coupled Plasma Mass Spectrometry. China Land Press, Ministry of Land and Resources: Beijing, China, 2001. (In Chinese)
  30. JY/T 015-1996; General Rules for Inductivety Coupled Plasma-Atomic Emission Spectromety. Science and Technology Literature Publishing House: Beijing, China, 1996.
  31. Taylor, S.R.; McLennan, S.M. The Continental Crust: Its Composition and Evolution; Blackwell Scientific Pub.: Oxford, UK, 1985. [Google Scholar]
  32. McLennan, S.M. Rare earth elements in sedimentary rocksinfluence of provenance and sedimentary processes. Rev. Mineral. 1989, 21, 169–200. [Google Scholar]
  33. Bhatia, M.R.; Crook, K.A.W. Trace element characteristics ofgraywackes and tectonic setting discrimination of sedimentary basins. Contrib Miner. Pet. 1986, 92, 181–193. [Google Scholar] [CrossRef]
  34. Sun, S.S.; McDonough, W.F. Chemical and isotopic systematic of oceanic basalts: Implications for mantle composition and process. Geol. Soc. Spec. Publ. 1989, 42, 313–345. [Google Scholar] [CrossRef]
  35. Haskin, L.A.; Paster, T.P. Geochemistry and mineralogy of the rare earths. In Handbook on Physics and Chemistry of Rare Earths; Schneider, K.A., Jr., Eyring, L., Eds.; North-Holland Publ. Co.: Amsterdam, The Netherlands, 1979; Volume 3, Chapter 21; pp. 1–80. [Google Scholar]
  36. Nesbitt, H.W.; Young, G.M. Early Proterozoic climates and plate motions inferred from major element chemistry of lutites. Nature 1982, 299, 715–717. [Google Scholar] [CrossRef]
  37. McLennan, S.M.; Hemming, S.; McDaniel, D.K.; Hanson, G.N. Geochemical approaches to sedimentation, provenance, and tectonics. Geol. Soc. Am. Spec. Pap. 1993, 284, 21–40. [Google Scholar]
  38. Fedo, C.M.; Wayne Nesbitt, H.; Young, G.M. Unraveling the effects of potassium metasomatism in sedimentary rocks and paleosols, with implications for paleoweathering conditions and provenance. Geology 1995, 23, 921–924. [Google Scholar] [CrossRef]
  39. Cox, R.; Lowe, D.R.; Cullers, R.L. The influence of sediment recycling and basement composition on evolution of mudrock chemistry in the southwestern United States. Geochem. Cosmochim. Acta 1995, 59, 2919–2940. [Google Scholar] [CrossRef]
  40. Bhatia, M.R. Composition and classification of Paleozoic flysch mudrocks of eastern Australia: Implications in provenance and tectonic setting interpretation. Sediment. Geol. 1985, 41, 249–268. [Google Scholar] [CrossRef]
  41. Wang, Z.W.; Wang, J.; Fu, X.G.; Zhang, W.Z.; Armstrong-Altrin, J.S.; Yu, F.; Feng, X.L.; Song, C.Y.; Zeng, S.Q. Geochemistry of the Upper Triassic black mudstones in the Qiangtang Basin, Tibet: Implications for paleoenvironment, provenance, and tectonic setting. J. Asian Earth Sci. 2018, 106, 118–135. [Google Scholar] [CrossRef]
  42. Lermanm, A. Lakes: Chemistry, Geology, Physics; Springer: Berlin, Germany, 1978. [Google Scholar]
  43. Hatch, J.R.; Leventhal, J.S. Relationship between inferred redox potential of the depositional environment and geochemistry of the Upper Pennsylvanian (Missourian) Stark Shale Member of the Dennis limestone, Wabaunsee County, kansas, USA. Chem. Geol. 1992, 99, 65–82. [Google Scholar] [CrossRef]
  44. Jones, B.; Manning, D.A.C. Comparison of geological indices used for the interpretation of palaeoredox conditions in ancient mudstones. Chem. Geol. 1994, 111, 111–129. [Google Scholar] [CrossRef]
  45. Scheffler, K.; Buehmann, D.; Schwark, L. Analysis of Late Palaeozoic glacial to postglacial sedimentary successions in South Africa by geochemical proxies-Response to climate evolution and sedimentary environment. Palaeogeogr. Palaeoclimatol. Palaeoecol. 2006, 240, 184–203. [Google Scholar] [CrossRef]
  46. Adegoke, A.K.; Abdullah, W.H.; Hakimi, M.H.; Yandoka, B.M.S.; Mustapha, K.A.; Aturamu, A.O. Trace elements geochemistry of kerogen in Upper Cretaceous sediments, Chad (Bornu) Basin, northeastern Nigeria: Origin and paleo-redox conditions. J. Afr. Earth Sci. 2014, 100, 675–683. [Google Scholar] [CrossRef]
  47. Finkelman, R.B. Trace element in coal. Biol. Trace Elem. Res. 1999, 67, 197–204. [Google Scholar] [CrossRef]
  48. Pedersen, T.F.; Calver, S.E. Anoxia vs. productivity: What controls the formation of organic-carbon-rich sediments and sedimentary rocks? AAPG Bull. 1990, 74, 454–466. [Google Scholar]
  49. Sahrawat, K.L. Organic matter accumulation in submerged soils. Adv. Agron. 2004, 81, 169–201. [Google Scholar]
  50. Xiong, Z.F.; Li, T.G.; Algeo, T.; Nan, Q.Y.; Zhai, B.; Lu, B. Paleoproductivity and paleoredox conditions during late Pleistocene accumulation of laminated diatom mats in the tropical West Pacific. Chem. Geol. 2012, 334, 77–91. [Google Scholar] [CrossRef]
  51. Algeo, T.J.; Kuwahara, K.; Sano, H.; Bates, S.; Lyons, T.; Elswick, E.; Hinnov, L.; Ellwood, B.; Moser, J.; Maynard, J.B. Spatial variation in sediment fluxes, redox conditions, and productivity in the Permian–Triassic Panthalassic Ocean. Palaeoecology 2011, 308, 65–83. [Google Scholar] [CrossRef]
  52. Moradi, A.V.; Sarı, A.; Akkaya, P. Geochemistry of the Miocene oil shale (Hançili Formation) in the Çankırı-Çorum Basin, Central Turkey: Implications for Paleoclimate conditions, source–area weathering, provenance and tectonic setting. Sediment. Geol. 2016, 341, 289–303. [Google Scholar] [CrossRef]
  53. Wang, X.; Tian, J.C.; Lin, X.B.; Chen, Z.W.; Yi, D.X. Sedimentary Environment and Controlling Factors of Organic Matter Accumulation in Wufeng Formation-Longmaxi Formation: A case study of Jielong section in eastern Chongqing. Acta Sedimentol. Sin. 2024, 42, 309–323, (In Chinese with English Abstract). [Google Scholar]
  54. Pi, D.H.; Liu, C.Q.; Shields-Zhou, G.A.; Jiang, S.Y. Trace and rare earth element geochemistry of black shale and kerogen in the early Cambrian Niutitang Formation in Guizhou province, South China: Constraints for redox environments and origin of metal enrichments. Precambrian Res. 2013, 225, 218–229. [Google Scholar] [CrossRef]
  55. McManus, J.; Berelson, W.M.; Klinkhammer, G.P.; Johnson, K.S.; Coale, K.H.; Anderson, R.F.; Kumar, N.; Burdige, D.J.; Hammond, D.E.; Brumsack, H.J.; et al. Geochemistry of barium in marine sediments: Implications for its use as a paleoproxy. Geochim. Cosmochim. Acta 1998, 62, 3453–3473. [Google Scholar] [CrossRef]
  56. Bourennane, H.; Douay, F.; Sterckeman, T.; Villanneau, E.; Ciesielski, H.; King, D.; Baize, D. Mapping of anthropogenic trace elements inputs in agricultural topsoil from Northern France using enrichment factors. Geoderma 2010, 157, 165–174. [Google Scholar] [CrossRef]
  57. Wedepohl, K.H. Chemical composition and fractionation of the continental crust. Geol. Rundsch. 1991, 80, 207–223. [Google Scholar] [CrossRef]
  58. Tribovillard, N.; Algeo, T.J.; Lyons, T.; Riboulleau, A. Trace metals as paleoredox and paleoproductivity proxies: An update. Chem. Geol. 2006, 232, 12–32. [Google Scholar] [CrossRef]
  59. Tribovillard, N. Re-assessing copper and nickel enrichments as paleo-productivity proxies. BSGF-Earth Sci. Bull. 2021, 192, 54. [Google Scholar] [CrossRef]
  60. Cutter, G.A. Metalloids and oxyanions. In Marine Chemistry and Geochemistry; Elsevier: Amsterdam, The Netherlands, 2001; pp. 64–71. [Google Scholar]
  61. Algeo, T.J.; Lyons, T.W. Mo–total organic carbon covariation in modern anoxic marine environments: Implications for analysis of paleoredox and paleohydrographic conditions. Paleoceanography 2006, 21, PA1016. [Google Scholar] [CrossRef]
  62. Algeo, T.J.; Tribovillard, N. Environmental analysis of paleoceanographic systems based on molybdenum–uranium covariation. Chem. Geol. 2009, 268, 211–225. [Google Scholar] [CrossRef]
  63. Algeo, T.J.; Rowe, H. Paleoceanographic applications of trace-metal concentration data. Chem. Geol. 2012, 324–325, 6–18. [Google Scholar] [CrossRef]
  64. Rimmer, S.M. Geochemical paleoredox indicators in Devonian-Mississippian black shales, Central Appalachian Basin. Chem. Geol. 2004, 206, 373–391. [Google Scholar] [CrossRef]
Figure 1. Geological thumbnail and measured section position in Southeastern Chongqing.
Minerals 15 00447 g001
Figure 2. The measured section histogram and sampling position.
Minerals 15 00447 g002
Figure 3. Vertical variation in whole rock and clay minerals in the Pengshui Lujiao profile.
Minerals 15 00447 g003
Figure 4. Vertical variation in whole rock and clay minerals in the Youyang Heishui section.
Minerals 15 00447 g004
Figure 5. Box diagram of the distribution of constant elements of the Wufeng–Longmaxi Formations in Southeastern Chongqing.
Minerals 15 00447 g005
Figure 6. Chondrite-normalized REE patterns of the Wufeng–Longmaxi Formations in Southeastern Chongqing (normalized REE chondrite [34], post-Archean Australian shale (PAAS) [31] and North American shale (NASC) [35] curves of samples from Southeastern Chongqing).
Minerals 15 00447 g006
Figure 7. A-CN-K ternary diagram.
Minerals 15 00447 g007
Figure 8. Discrimination diagram of the Wufeng–Longmaxi Formations in Southeastern Chongqing.
Minerals 15 00447 g008
Figure 9. Source rock type discrimination diagram of the Wufeng–Longmaxi Formations in Southeastern Chongqing. (a) Al2O3 versus TiO2; (b) Zr versus TiO2; (c) Hf versus La/Th; (d) La/Sc versus Co/Th; (e) Ni versus TiO2; (f) Zr/Sc versus Th/Sc.
Minerals 15 00447 g009
Figure 10. Longitudinal comparison of various indicators of the Wufeng–Longmaxi Formations in Southeastern Chongqing.
Minerals 15 00447 g010
Figure 11. Comparison of the Mo/TOC relationships between the Wufeng–Longmaxi Formations and the modern anaerobic basin in Southeastern Chongqing (O3w indicates the Upper Ordovician Wufeng Formation; S1l denotes the Lower Silurian Longmaxi Formation).
Minerals 15 00447 g011
Figure 12. MoEF-UEF covariant diagram of samples from the Wufeng Formation–Longmaxi Formation in Southeastern Chongqing (modified according to [62]) (O3w indicates the Upper Ordovician Wufeng Formation; O3g indicates the Upper Ordovician Guanyinqiao Formation; S1l denotes the Lower Silurian Longmaxi Formation. The gray field represents the “unrestricted marine” (UM) trend whereas the blue field represents the “particulate shuttle” (PS) trend).
Minerals 15 00447 g012
Figure 13. Correlation diagram between various indicators and TOC ((a,b) correlation diagram of the paleoclimate index and TOC content. (c,d) Correlation diagram of the redox index and TOC levels. (e,f) Correlation chart of paleoproductivity index versus TOC levels. (g) Correlation diagram of the retention environment and TOC levels. (h) Mo/TOC-DOPT diagram.)
Minerals 15 00447 g013aMinerals 15 00447 g013b
Table 1. Test results of mineral content in samples.
PositionSample NumberMineral Contents (w,%)
QuartzK-Feldspar PlagioclaseCalciteDolomiteSideritePyriteGypsumTCCM
O3wYY-145983203030
YY-255870402024
YY-369450503014
O3gYY-4504623502010
S1lYY-5526813502014
YY-6518128502014
YY-7507118602016
YY-84981111502212
YY-937925950159
YY-10456205302217
YY-11448154200225
YY-125271310400014
O3wPS-1366783110029
PS-258680302023
PS-365344502314
O3gPS-454676305217
S1lPS-550896604017
PS-6468146503018
PS-7478175402017
PS-84610215301014
PS-9478214201017
PS-104310236301014
PS-11437174002027
O3wXS-2556140400021
O3gXS-346010201101012
S1lXS-44661512502014
XS-54411219401010
XS-64610221030009
O3wQL-2575148300013
QL-371285201011
O3gQL-439050480107
S1lQL-549370300308
QL-6514180600021
QL-7520180300027
Disclaimer/Publisher’s Note: The statements, opinions and data contained in all publications are solely those of the individual author(s) and contributor(s) and not of MDPI and/or the editor(s). MDPI and/or the editor(s) disclaim responsibility for any injury to people or property resulting from any ideas, methods, instructions or products referred to in the content.

